disasters implied by equity index...
TRANSCRIPT
Disasters Implied by Equity Index Options
David Backus (NYU), Mikhail Chernov (LSE & LBS),and Ian Martin (Stanford)
Boston University | February 11, 2011
This version: February 10, 2011
Backus, Chernov, & Martin (NYU) Disasters in options 1 / 34
Summary
The idea
I Problem: disasters infrequent ⇒ hard to estimate their distributionI Solution: infer from option prices
What we find
I Disasters apparent in options dataI More modest than disasters in macro data
Why this is harder than we thought
I Barro data gives us “true” distribution of consumption growthI Option prices give us “risk-neutral” distribution of returns
Backus, Chernov, & Martin (NYU) Disasters in options 1 / 34
Outline
Preliminaries: entropy, cumulants, plan
Disasters in macroeconomic models
Digression: risk-neutral probabilities
Disasters in option models
Comparing models
Backus, Chernov, & Martin (NYU) Disasters in options 2 / 34
Preliminaries
Entropy
Hans-Otto Georgii (quoted by Hansen and Sargent):
When Shannon had invented his quantity and consultedvon Neumann on what to call it, von Neumann replied:“Call it entropy. It is already in use under that name and,besides, it will give you a great edge in debates becausenobody knows what entropy is anyway.”
Backus, Chernov, & Martin (NYU) Disasters in options 3 / 34
Preliminaries
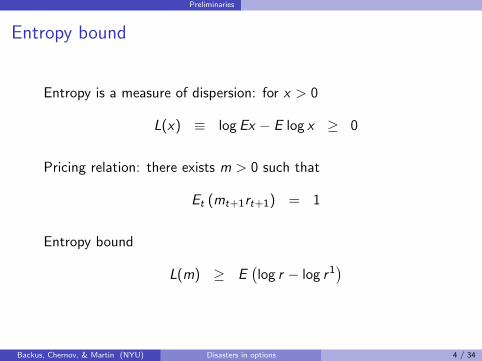
Entropy bound
Entropy is a measure of dispersion: for x > 0
L(x) ≡ log Ex − E log x ≥ 0
Pricing relation: there exists m > 0 such that
Et (mt+1rt+1) = 1
Entropy bound
L(m) ≥ E(log r − log r1
)
Backus, Chernov, & Martin (NYU) Disasters in options 4 / 34
Preliminaries
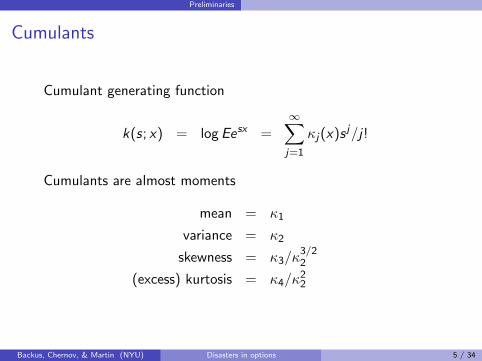
Cumulants
Cumulant generating function
k(s; x) = log Eesx =∞∑j=1
κj(x)sj/j!
Cumulants are almost moments
mean = κ1
variance = κ2
skewness = κ3/κ3/22
(excess) kurtosis = κ4/κ22
Backus, Chernov, & Martin (NYU) Disasters in options 5 / 34
Preliminaries
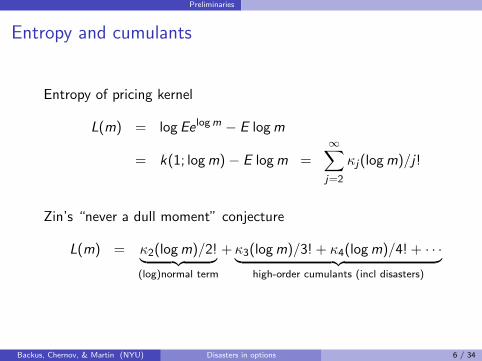
Entropy and cumulants
Entropy of pricing kernel
L(m) = log Ee logm − E logm
= k(1; logm)− E logm =∞∑j=2
κj(logm)/j!
Zin’s “never a dull moment” conjecture
L(m) = κ2(logm)/2!︸ ︷︷ ︸(log)normal term
+κ3(logm)/3! + κ4(logm)/4! + · · ·︸ ︷︷ ︸high-order cumulants (incl disasters)
Backus, Chernov, & Martin (NYU) Disasters in options 6 / 34
Preliminaries
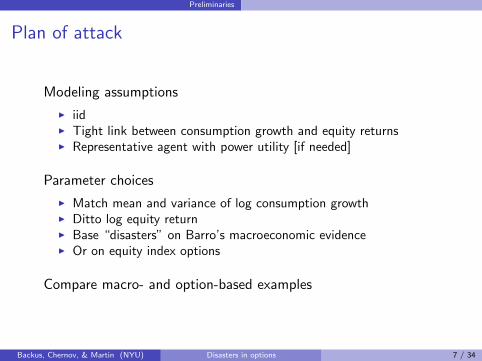
Plan of attack
Modeling assumptions
I iidI Tight link between consumption growth and equity returnsI Representative agent with power utility [if needed]
Parameter choices
I Match mean and variance of log consumption growthI Ditto log equity returnI Base “disasters” on Barro’s macroeconomic evidenceI Or on equity index options
Compare macro- and option-based examples
Backus, Chernov, & Martin (NYU) Disasters in options 7 / 34
Macro disasters
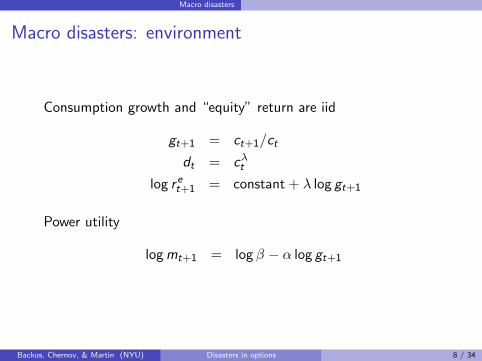
Macro disasters: environment
Consumption growth and “equity” return are iid
gt+1 = ct+1/ct
dt = cλt
log r et+1 = constant + λ log gt+1
Power utility
logmt+1 = log β − α log gt+1
Backus, Chernov, & Martin (NYU) Disasters in options 8 / 34
Macro disasters
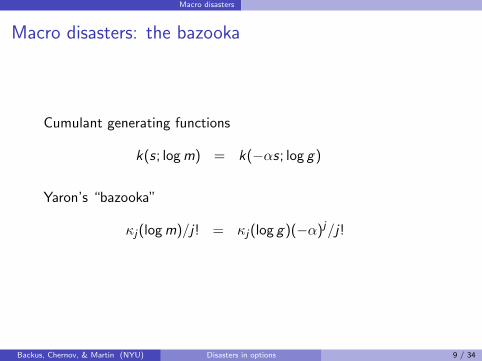
Macro disasters: the bazooka
Cumulant generating functions
k(s; logm) = k(−αs; log g)
Yaron’s “bazooka”
κj(logm)/j! = κj(log g)(−α)j/j!
Backus, Chernov, & Martin (NYU) Disasters in options 9 / 34
Macro disasters
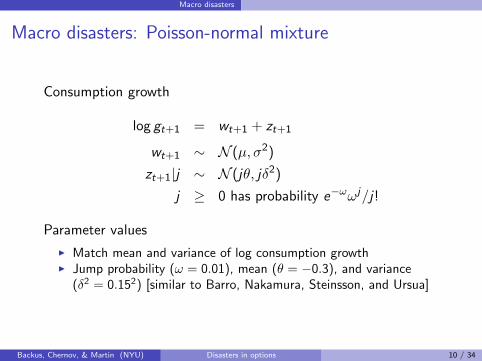
Macro disasters: Poisson-normal mixture
Consumption growth
log gt+1 = wt+1 + zt+1
wt+1 ∼ N (µ, σ2)
zt+1|j ∼ N (jθ, jδ2)
j ≥ 0 has probability e−ωωj/j!
Parameter values
I Match mean and variance of log consumption growthI Jump probability (ω = 0.01), mean (θ = −0.3), and variance
(δ2 = 0.152) [similar to Barro, Nakamura, Steinsson, and Ursua]
Backus, Chernov, & Martin (NYU) Disasters in options 10 / 34
Macro disasters
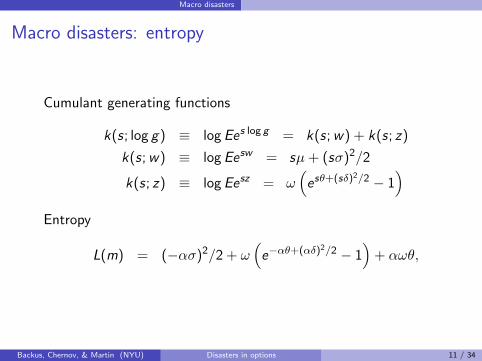
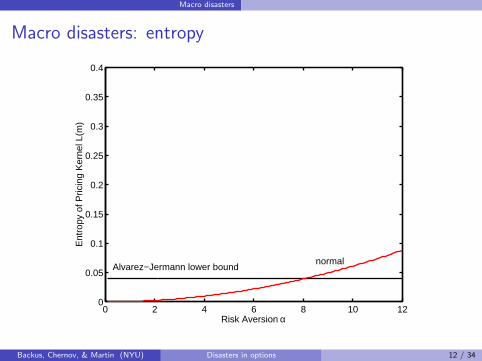
Macro disasters: entropy
Cumulant generating functions
k(s; log g) ≡ log Ees log g = k(s;w) + k(s; z)
k(s;w) ≡ log Eesw = sµ+ (sσ)2/2
k(s; z) ≡ log Eesz = ω(esθ+(sδ)2/2 − 1
)Entropy
L(m) = (−ασ)2/2 + ω(e−αθ+(αδ)2/2 − 1
)+ αωθ,
Backus, Chernov, & Martin (NYU) Disasters in options 11 / 34
Macro disasters
Macro disasters: entropy
0 2 4 6 8 10 120
0.05
0.1
0.15
0.2
0.25
0.3
0.35
0.4
Risk Aversion α
Ent
ropy
of P
ricin
g K
erne
l L(m
)
Alvarez−Jermann lower boundnormal
Backus, Chernov, & Martin (NYU) Disasters in options 12 / 34
Macro disasters
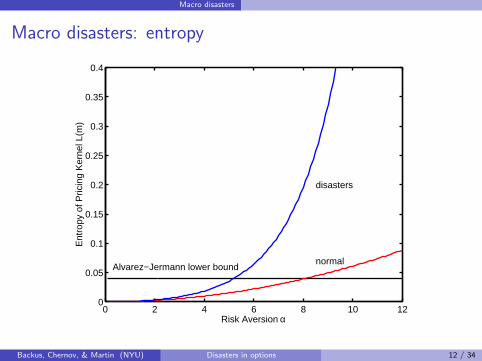
Macro disasters: entropy
0 2 4 6 8 10 120
0.05
0.1
0.15
0.2
0.25
0.3
0.35
0.4
Risk Aversion α
Ent
ropy
of P
ricin
g K
erne
l L(m
)
Alvarez−Jermann lower boundnormal
disasters
Backus, Chernov, & Martin (NYU) Disasters in options 12 / 34
Macro disasters
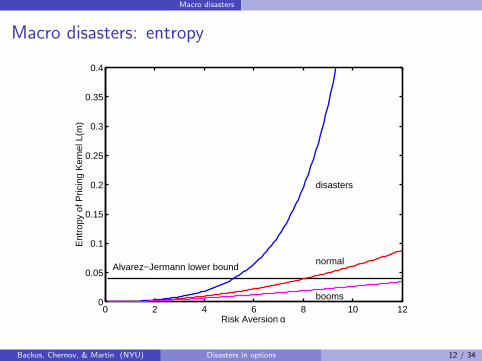
Macro disasters: entropy
0 2 4 6 8 10 120
0.05
0.1
0.15
0.2
0.25
0.3
0.35
0.4
Risk Aversion α
Ent
ropy
of P
ricin
g K
erne
l L(m
)
Alvarez−Jermann lower boundnormal
disasters
booms
Backus, Chernov, & Martin (NYU) Disasters in options 12 / 34
Macro disasters
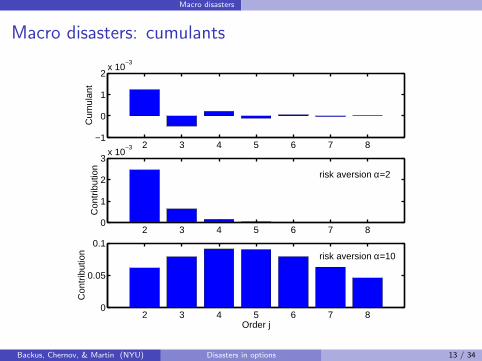
Macro disasters: cumulants
2 3 4 5 6 7 8−1
0
1
2x 10
−3
Cum
ulan
t
2 3 4 5 6 7 80
1
2
3x 10
−3
Con
trib
utio
n
risk aversion α=2
2 3 4 5 6 7 80
0.05
0.1
Con
trib
utio
n
Order j
risk aversion α=10
Backus, Chernov, & Martin (NYU) Disasters in options 13 / 34
Macro disasters
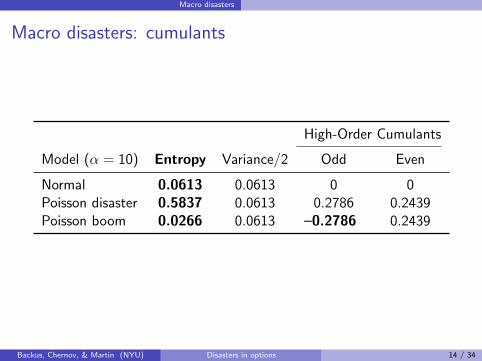
Macro disasters: cumulants
High-Order Cumulants
Model (α = 10) Entropy Variance/2 Odd Even
Normal 0.0613 0.0613 0 0Poisson disaster 0.5837 0.0613 0.2786 0.2439Poisson boom 0.0266 0.0613 –0.2786 0.2439
Backus, Chernov, & Martin (NYU) Disasters in options 14 / 34
Macro disasters
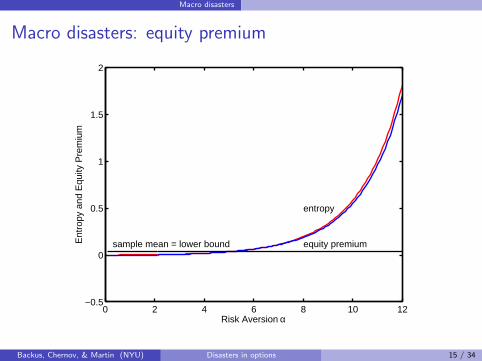
Macro disasters: equity premium
0 2 4 6 8 10 12−0.5
0
0.5
1
1.5
2
Risk Aversion α
Ent
ropy
and
Equ
ity P
rem
ium
sample mean = lower bound equity premium
entropy
Backus, Chernov, & Martin (NYU) Disasters in options 15 / 34
Risk-neutral probabilities
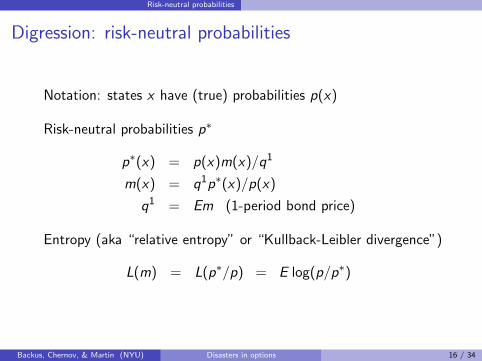
Digression: risk-neutral probabilities
Notation: states x have (true) probabilities p(x)
Risk-neutral probabilities p∗
p∗(x) = p(x)m(x)/q1
m(x) = q1p∗(x)/p(x)
q1 = Em (1-period bond price)
Entropy (aka “relative entropy” or “Kullback-Leibler divergence”)
L(m) = L(p∗/p) = E log(p/p∗)
Backus, Chernov, & Martin (NYU) Disasters in options 16 / 34
Risk-neutral probabilities
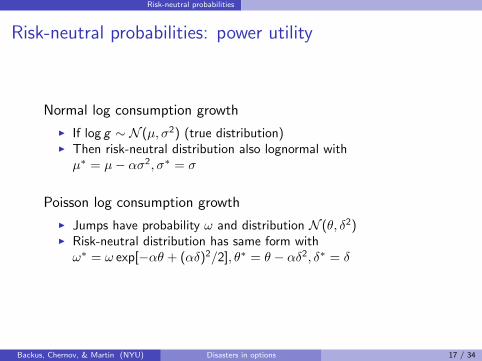
Risk-neutral probabilities: power utility
Normal log consumption growth
I If log g ∼ N (µ, σ2) (true distribution)I Then risk-neutral distribution also lognormal with
µ∗ = µ− ασ2, σ∗ = σ
Poisson log consumption growth
I Jumps have probability ω and distribution N (θ, δ2)I Risk-neutral distribution has same form with
ω∗ = ω exp[−αθ + (αδ)2/2], θ∗ = θ − αδ2, δ∗ = δ
Backus, Chernov, & Martin (NYU) Disasters in options 17 / 34
Option disasters
Option disasters: overview
Options an obvious source of information ...
I ... about risk-neutral distribution of equity returns
Critical ingredients
I Option pricesI Merton modelI Estimated parametersI Implied volatilities
Backus, Chernov, & Martin (NYU) Disasters in options 18 / 34
Option disasters
Option disasters: information in option prices
Put option (bet on low returns)
qpt = q1t E∗t (b − r et+1)
+
Strategy
I Estimate p∗ by varying strike price b (cross section)
Black-Scholes-Merton benchmark
I Quote prices as implied volatilities (high price ⇔ high vol)I Horizontal line if lognormalI “Skew” suggests disasters
Backus, Chernov, & Martin (NYU) Disasters in options 19 / 34
Option disasters
Option disasters: Merton model
Equity returns iid
log r et+1 = log r1 + wt+1 + zt+1
wt+1 ∼ N (µ, σ2)
zt+1|j ∼ N (jθ, jδ2)
j ≥ 0 has probability e−ωωj/j!
Risk-neutral distribution: ditto with *s
Backus, Chernov, & Martin (NYU) Disasters in options 20 / 34
Option disasters
Option disasters: parameter values
Set (ω∗, θ∗, δ∗) to match option prices
I Jumps: ω∗ = ω, θ∗ = −0.0482, δ∗ = 0.0981I Set σ∗ = σI Set µ∗ to satisfy pricing relation (q1E∗r e = 1)
Later: choose (µ, σ, ω, θ, δ) to match distribution of equity returns
I Jumps: ω = 1.512, θ = −0.0259, δ = 0.0229I Equity premium: µ+ ωθI Variance of equity returns: σ2 + ω(θ2 + δ2)
All from Broadie, Chernov, and Johannes (JF, 2007)
Backus, Chernov, & Martin (NYU) Disasters in options 21 / 34
Option disasters
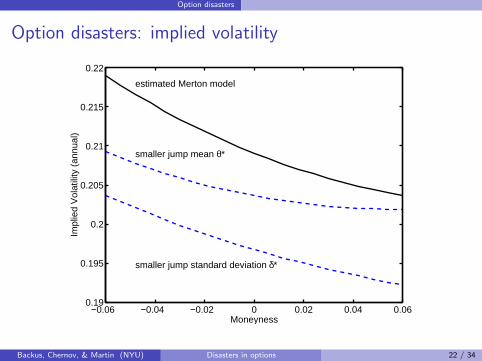
Option disasters: implied volatility
−0.06 −0.04 −0.02 0 0.02 0.04 0.060.19
0.195
0.2
0.205
0.21
0.215
0.22
Moneyness
Impl
ied
Vol
atili
ty (
annu
al)
estimated Merton model
smaller jump mean θ*
smaller jump standard deviation δ*
Backus, Chernov, & Martin (NYU) Disasters in options 22 / 34
Comparing models
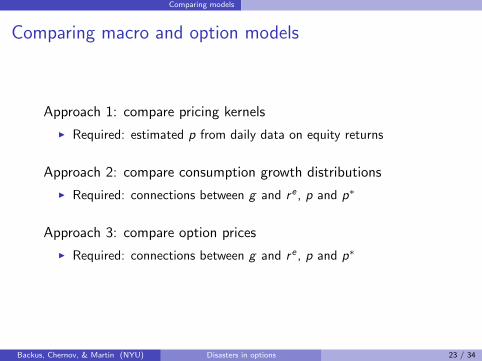
Comparing macro and option models
Approach 1: compare pricing kernels
I Required: estimated p from daily data on equity returns
Approach 2: compare consumption growth distributions
I Required: connections between g and r e , p and p∗
Approach 3: compare option prices
I Required: connections between g and r e , p and p∗
Backus, Chernov, & Martin (NYU) Disasters in options 23 / 34
Comparing models
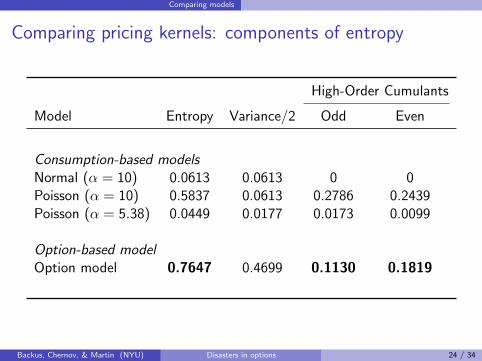
Comparing pricing kernels: components of entropy
High-Order Cumulants
Model Entropy Variance/2 Odd Even
Consumption-based modelsNormal (α = 10) 0.0613 0.0613 0 0Poisson (α = 10) 0.5837 0.0613 0.2786 0.2439Poisson (α = 5.38) 0.0449 0.0177 0.0173 0.0099
Option-based modelOption model 0.7647 0.4699 0.1130 0.1819
Backus, Chernov, & Martin (NYU) Disasters in options 24 / 34
Comparing models
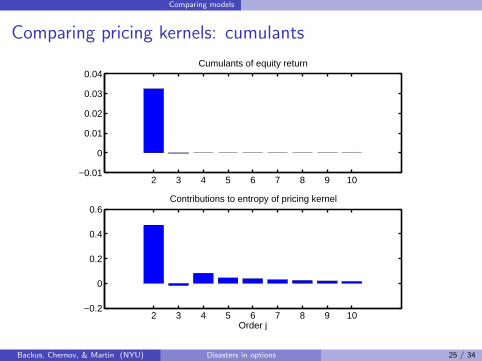
Comparing pricing kernels: cumulants
2 3 4 5 6 7 8 9 10−0.01
0
0.01
0.02
0.03
0.04Cumulants of equity return
2 3 4 5 6 7 8 9 10−0.2
0
0.2
0.4
0.6Contributions to entropy of pricing kernel
Order j
Backus, Chernov, & Martin (NYU) Disasters in options 25 / 34
Comparing models
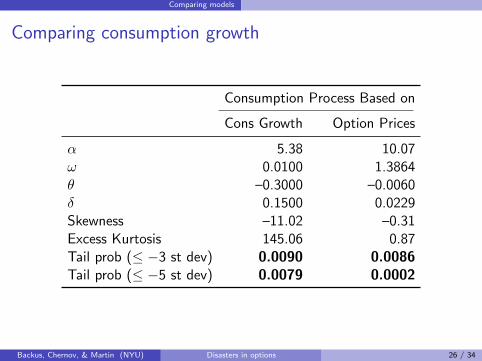
Comparing consumption growth
Consumption Process Based on
Cons Growth Option Prices
α 5.38 10.07ω 0.0100 1.3864θ –0.3000 –0.0060δ 0.1500 0.0229Skewness –11.02 –0.31Excess Kurtosis 145.06 0.87Tail prob (≤ −3 st dev) 0.0090 0.0086Tail prob (≤ −5 st dev) 0.0079 0.0002
Backus, Chernov, & Martin (NYU) Disasters in options 26 / 34
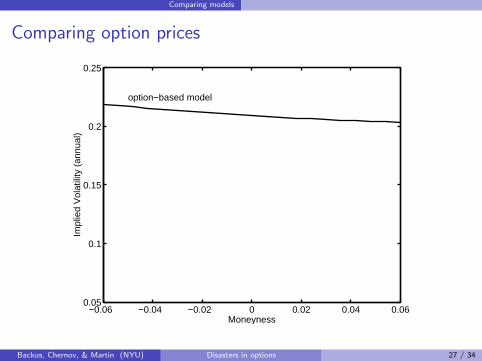
Comparing models
Comparing option prices
−0.06 −0.04 −0.02 0 0.02 0.04 0.060.05
0.1
0.15
0.2
0.25
option−based model
Impl
ied
Vol
atili
ty (
annu
al)
Moneyness
Backus, Chernov, & Martin (NYU) Disasters in options 27 / 34
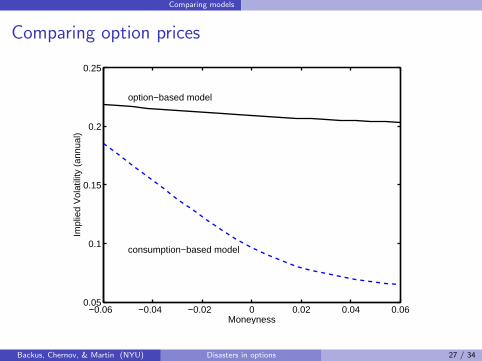
Comparing models
Comparing option prices
−0.06 −0.04 −0.02 0 0.02 0.04 0.060.05
0.1
0.15
0.2
0.25
option−based model
Impl
ied
Vol
atili
ty (
annu
al)
Moneyness
consumption−based model
Backus, Chernov, & Martin (NYU) Disasters in options 27 / 34
Comparing models
Comparing models
All of these comparisons point in the same direction
I Macro disasters more pronounced than option disasters
Backus, Chernov, & Martin (NYU) Disasters in options 28 / 34
Reconsidering
Reconsidering ...
Our models are based on
I iidI Tight link between consumption growth and equity returnsI Representative agent with power utility
Let’s take a closer look at the last two
Backus, Chernov, & Martin (NYU) Disasters in options 29 / 34
Reconsidering
Reconsidering power utility
“Risk aversion” implied by arbitrary pricing kernel
RA ≡ −∂ logm
∂ log g= −∂ log(p∗/p)
∂ log r e· ∂ log r e
∂ log g
Backus, Chernov, & Martin (NYU) Disasters in options 30 / 34
Reconsidering
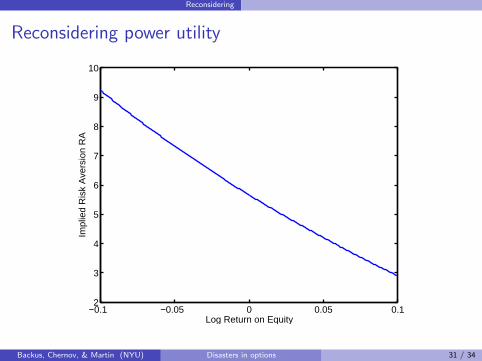
Reconsidering power utility
−0.1 −0.05 0 0.05 0.12
3
4
5
6
7
8
9
10
Log Return on Equity
Impl
ied
Ris
k A
vers
ion
RA
Backus, Chernov, & Martin (NYU) Disasters in options 31 / 34
Reconsidering
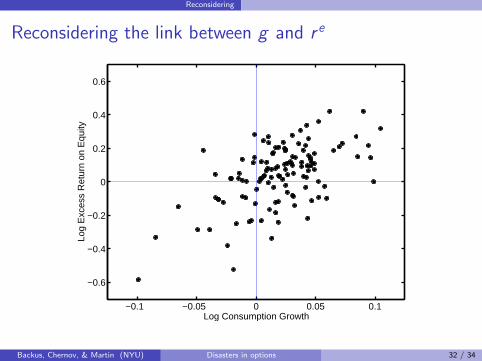
Reconsidering the link between g and r e
−0.1 −0.05 0 0.05 0.1
−0.6
−0.4
−0.2
0
0.2
0.4
0.6
Log Consumption Growth
Log
Exc
ess
Ret
urn
on E
quity
Backus, Chernov, & Martin (NYU) Disasters in options 32 / 34
Reconsidering
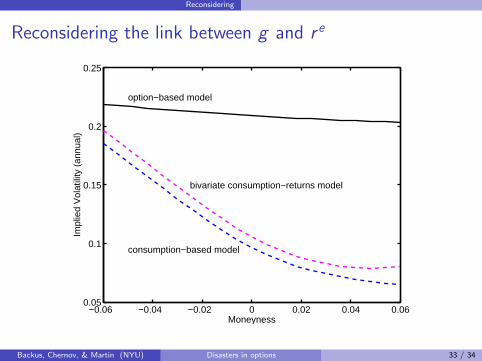
Reconsidering the link between g and r e
−0.06 −0.04 −0.02 0 0.02 0.04 0.060.05
0.1
0.15
0.2
0.25
option−based model
Impl
ied
Vol
atili
ty (
annu
al)
Moneyness
consumption−based model
bivariate consumption−returns model
Backus, Chernov, & Martin (NYU) Disasters in options 33 / 34
Recapitulation
Barro, Longstaff & Piazzesi, Rietz
I Disasters contribute to equity premium [entropy]I Evident in macro dataI Range of opinion on magnitude
We look at options
I Smile/smirk suggests something like disastersI Prices available even for outcomes that don’t occur in sampleI Implied disasters less severe than macro dataI High entropy from options suggests it’s not enough to match equity
premium
Backus, Chernov, & Martin (NYU) Disasters in options 34 / 34