discharge and evaporation some of the precipitation evaporates or is transpired. some of the...
TRANSCRIPT

Discharge and Evaporation
Some of the Precipitation evaporates or is transpired. Some of the infiltration, the interflow, stays above the Groundwater Table and resurfaces in the stream valley as return flow. The overland and return flow become runoff. They reach the stream, and eventually become outflow = discharge
DischargeDischarge
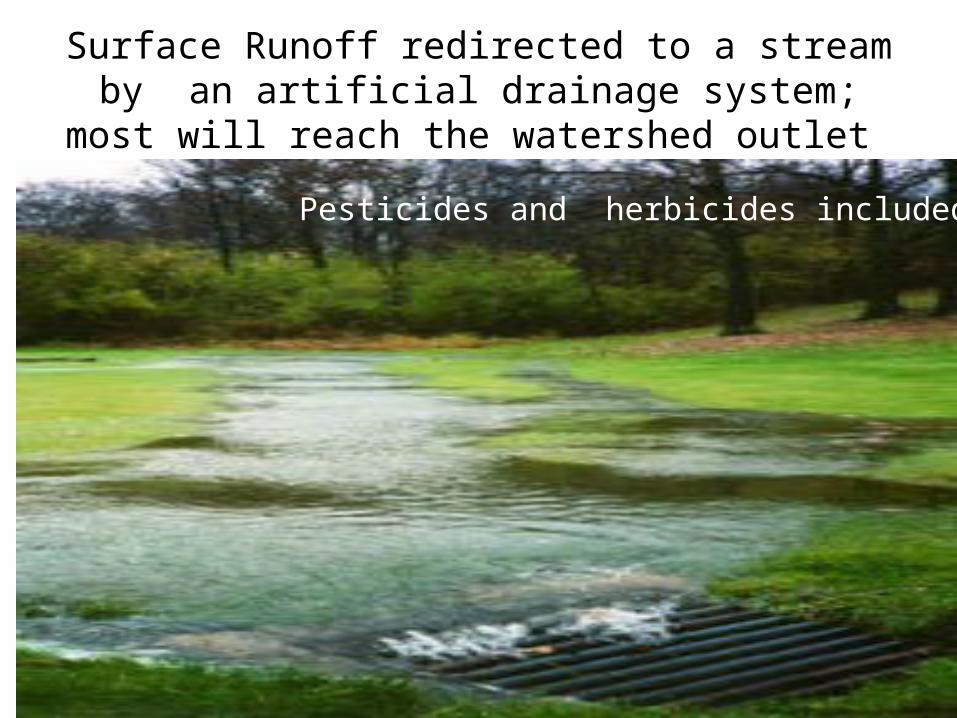
Surface Runoff redirected to a stream by an artificial drainage system; most will reach the watershed outlet
Pesticides and herbicides included
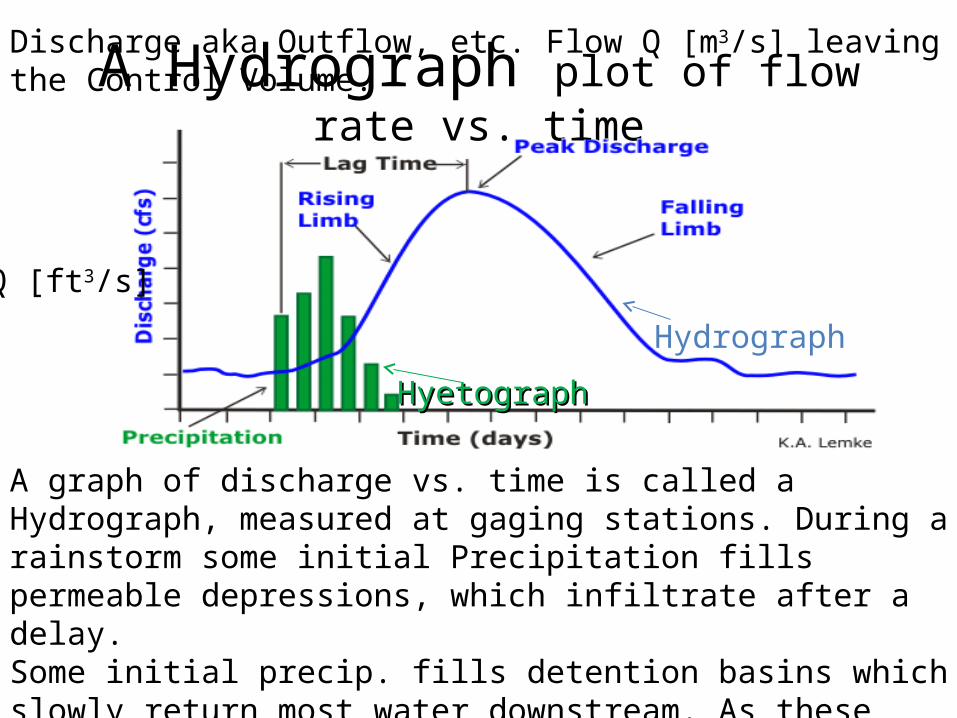
A Hydrograph plot of flow rate vs. time
A graph of discharge vs. time is called a Hydrograph, measured at gaging stations. During a rainstorm some initial Precipitation fills permeable depressions, which infiltrate after a delay.Some initial precip. fills detention basins which slowly return most water downstream. As these fill, the streams receive increasing amounts of direct runoff flow. Once the precip stops all the runoff is from storage.
Discharge aka Outflow, etc. Flow Q [m3/s] leaving the Control Volume.
Q [ft3/s]
HyetographHyetograph
Hydrograph
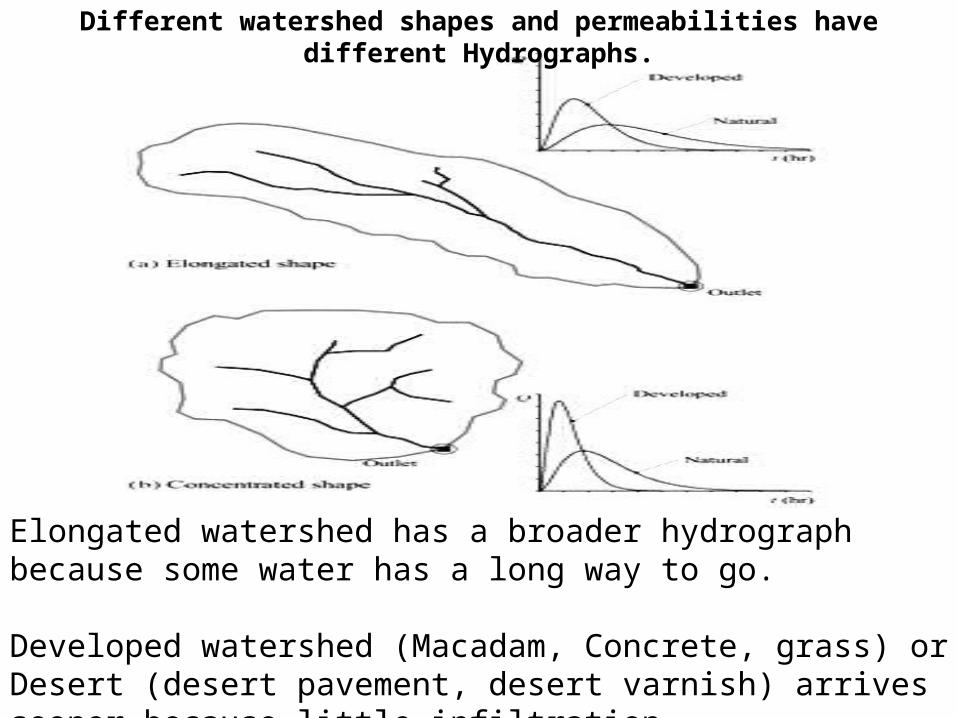
Different watershed shapes and permeabilities have different Hydrographs.
Elongated watershed has a broader hydrograph because some water has a long way to go.
Developed watershed (Macadam, Concrete, grass) or Desert (desert pavement, desert varnish) arrives sooner because little infiltration

• To obtain the hydrograph data for your project, you will rely on online data taken from the flow gage at the outlet of your watershed.
For discharge flow rates, you will rely on automated USGS gages
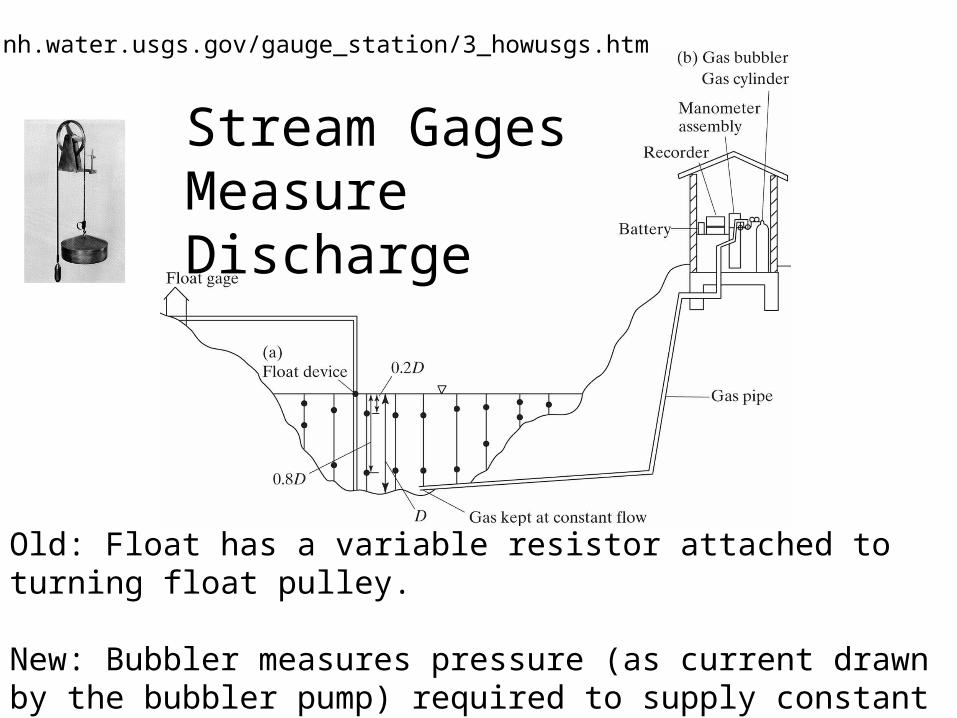
http://nh.water.usgs.gov/gauge_station/3_howusgs.htm
Old: Float has a variable resistor attached to turning float pulley.
New: Bubbler measures pressure (as current drawn by the bubbler pump) required to supply constant gas flow.
Stream GagesMeasure Discharge

At each gauging station, the cross-section is well known and frequently checked, so the flow rate, and wetted area, with each depth of water is known precisely.
Stage• Flood stage is the water level of a stream as read
by a gauge for a particular location, measured from the level at which a flowing body of water threatens lives, property, or commerce. The term "at flood stage" is commonly used to describe the point at which this occurs.
• "Stream stage" (also referred to as "gage height" or simply "stage") is the level of the water surface above an established zero level at a given location.
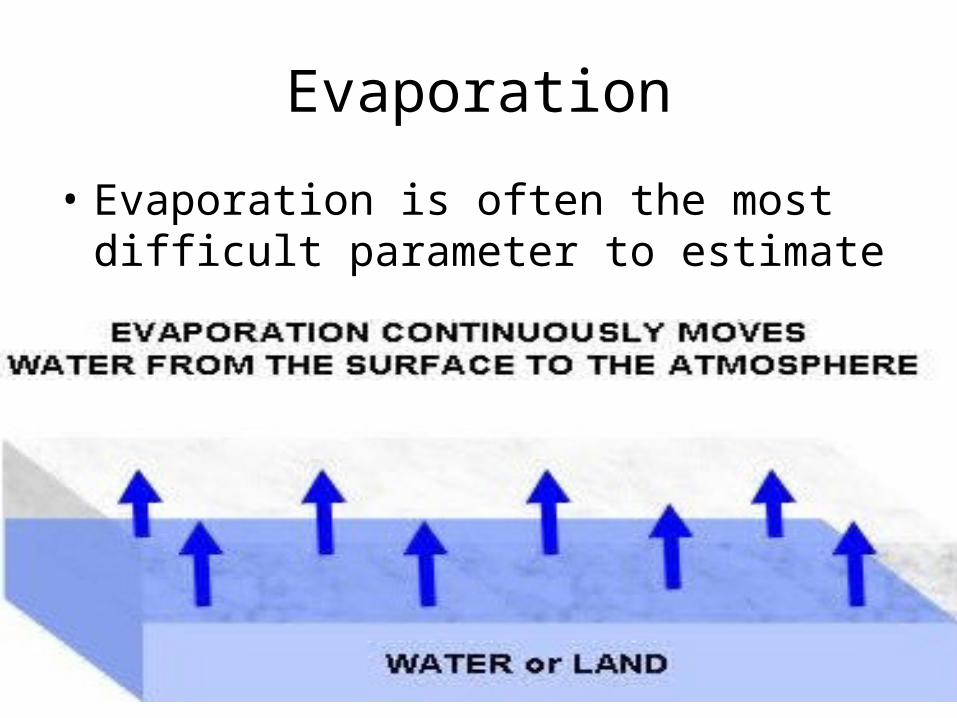
Evaporation
• Evaporation is often the most difficult parameter to estimate
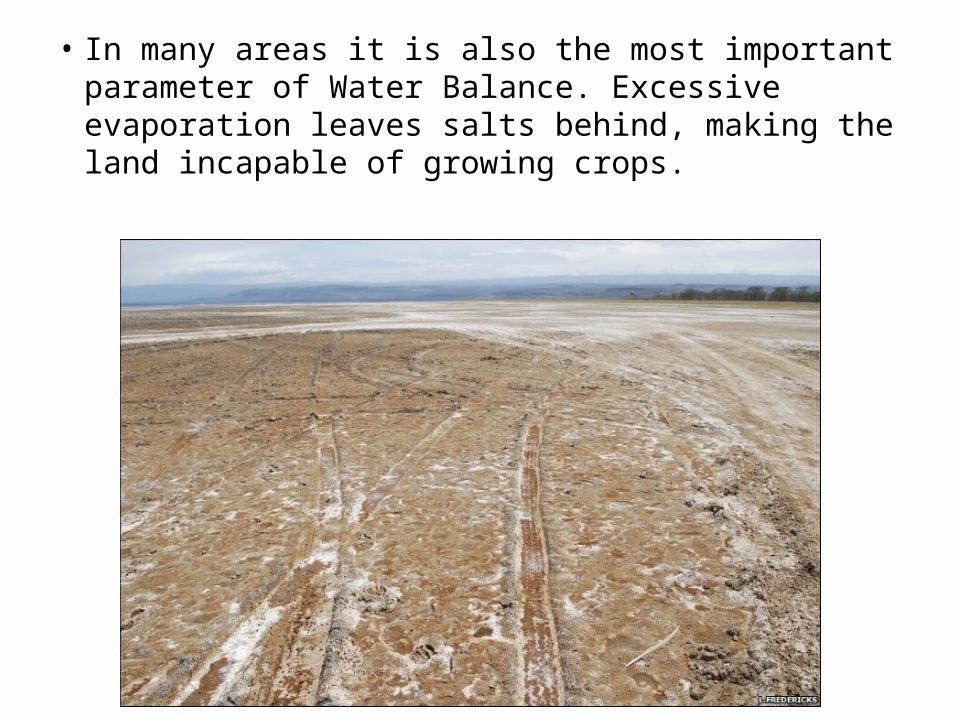
• In many areas it is also the most important parameter of Water Balance. Excessive evaporation leaves salts behind, making the land incapable of growing crops.

Heat of Vaporization
• There are two basic mechanisms by which moisture gets into the atmosphere; evaporation and transpiration.
• Evaporation is just a phase change in water (from liquid to vapor) induced by the addition
of enough energy• Water has a high heat of vaporization—it takes
about 580 calories to vaporize 1 gram of liquid water at standard surface conditions.
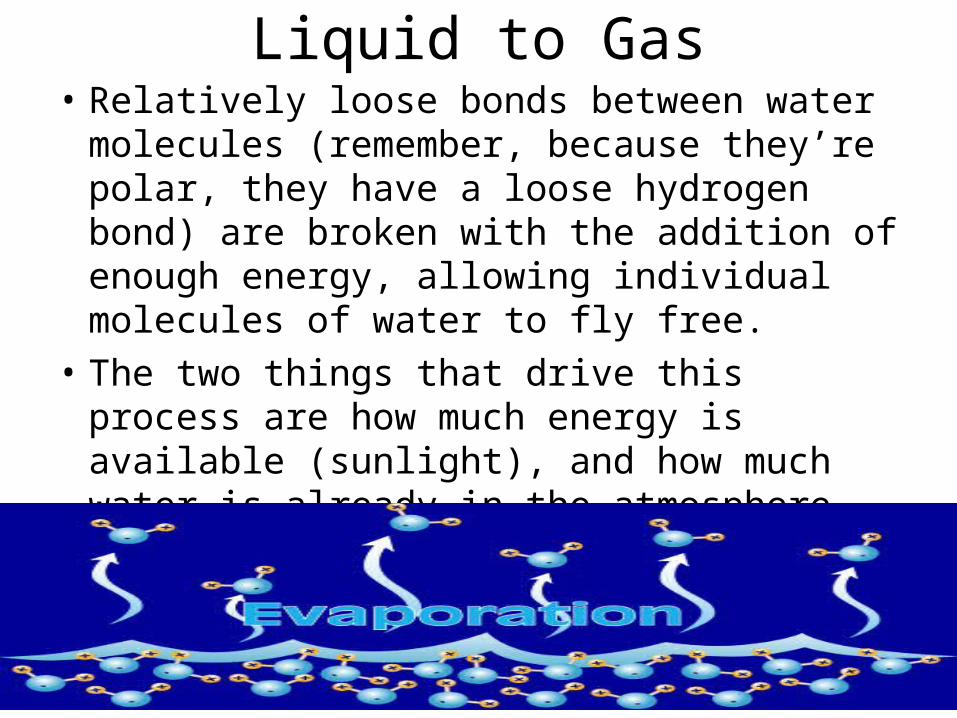
Liquid to Gas• Relatively loose bonds between water
molecules (remember, because they’re polar, they have a loose hydrogen bond) are broken with the addition of enough energy, allowing individual molecules of water to fly free.
• The two things that drive this process are how much energy is available (sunlight), and how much water is already in the atmosphere.
Saturation
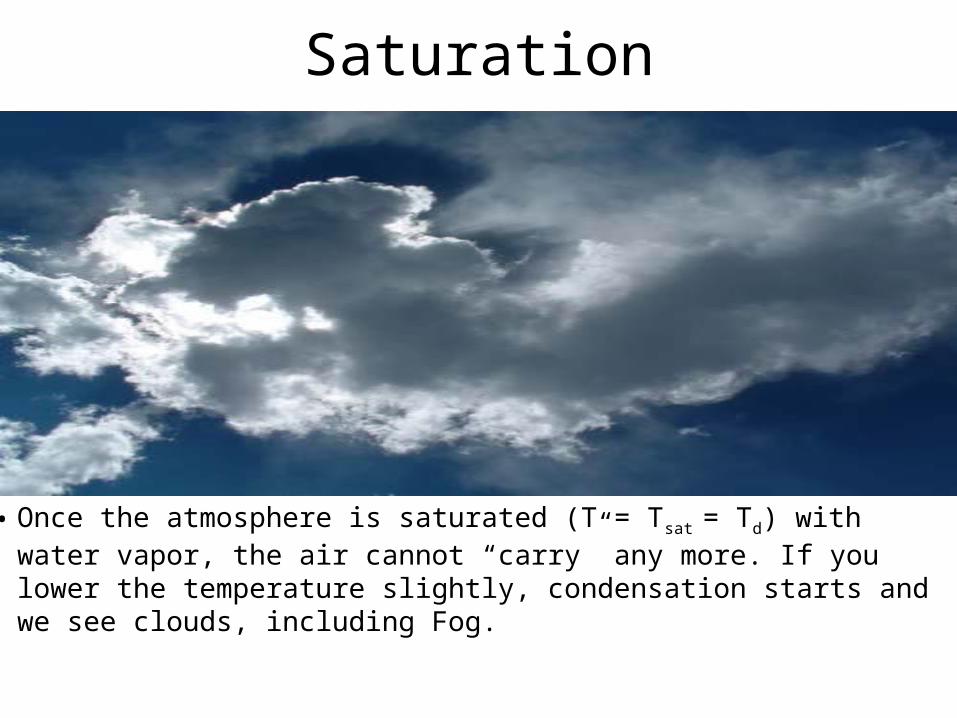
• Once the atmosphere is saturated (T = Tsat = Td) with water vapor, the air cannot “carry” any more. If you lower the temperature slightly, condensation starts and we see clouds, including Fog.
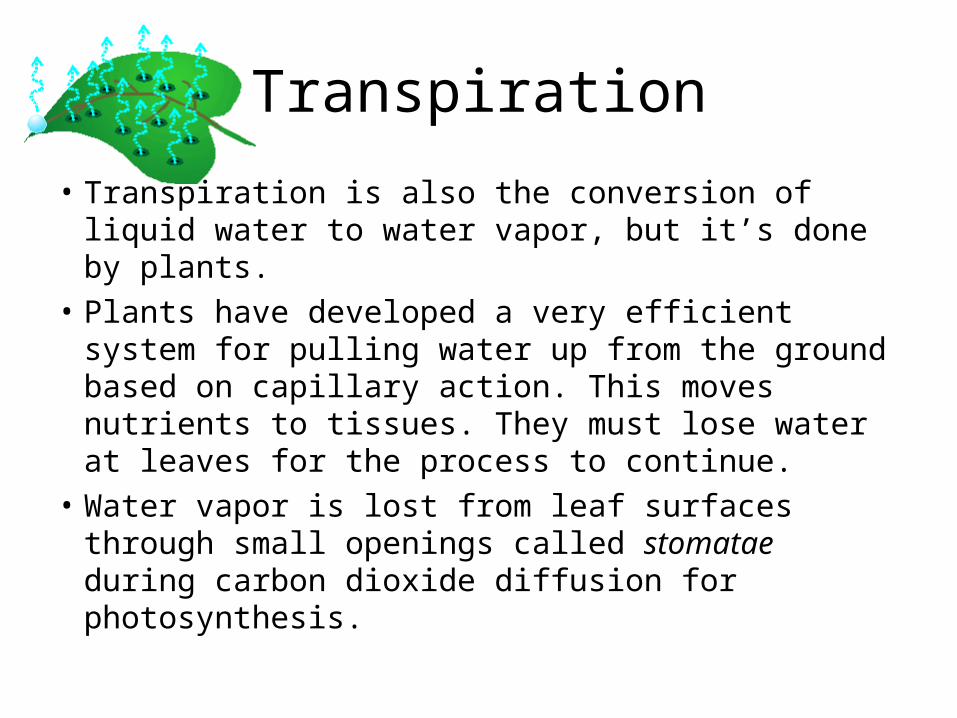
Transpiration
• Transpiration is also the conversion of liquid water to water vapor, but it’s done by plants.
• Plants have developed a very efficient system for pulling water up from the ground based on capillary action. This moves nutrients to tissues. They must lose water at leaves for the process to continue.
• Water vapor is lost from leaf surfaces through small openings called stomatae during carbon dioxide diffusion for photosynthesis.
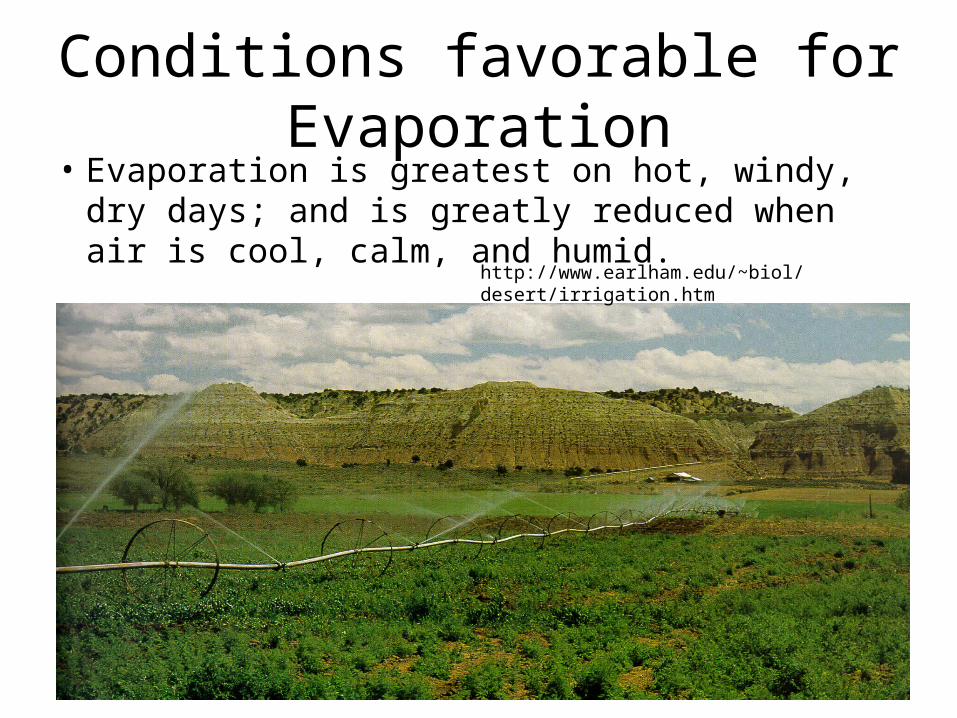
Conditions favorable for Evaporation• Evaporation is greatest on hot, windy, dry
days; and is greatly reduced when air is cool, calm, and humid. http://www.earlham.edu/~biol/desert/irrigation.htm

Class A Evaporation Pan
Estimating EvaporationFilled to 8 inches and observed daily.Plus a rain gage, thermometer for water temp, and a psychrometer for air temperature and wet bulb temperature (calculations reveal dewpoint Td)
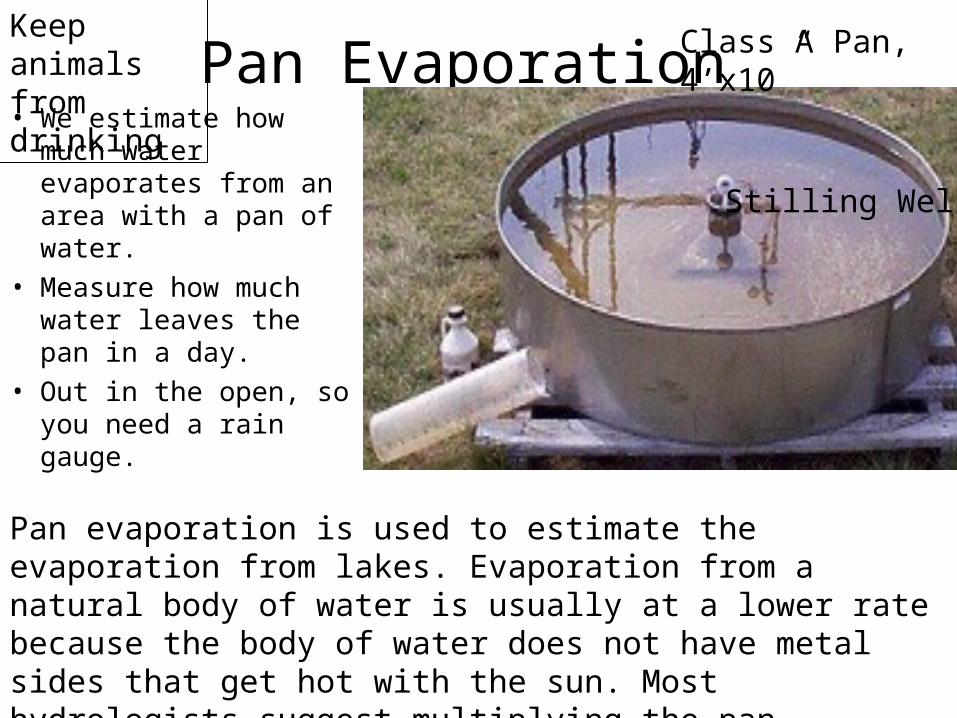
Pan Evaporation• We estimate how much
water evaporates from an area with a pan of water.
• Measure how much water leaves the pan in a day.
• Out in the open, so you need a rain gauge.
Class A Pan, 4’x10”
Stilling Well
Keep animals from drinking
Pan evaporation is used to estimate the evaporation from lakes. Evaporation from a natural body of water is usually at a lower rate because the body of water does not have metal sides that get hot with the sun. Most hydrologists suggest multiplying the pan evaporation by 0.75 to correct for lakes.

Evapotranspiration E + T• The pan actually measures evaporation, not evapo-
transpiration. • You have to multiply the pan evaporation by a different
pan coefficient to estimate the E+T over plants
http://www.eijkelkamp.com/Portals/2/Eijkelkamp/Files/Manuals/M4-1689e%20Evaporation%20pan.pdf
Notice some vegetation has high transpiration, pan coefficient. > 1
golf course
pasturecoastal plain
pasture

Estimates of Pan Coefficient The K pan is high if: the pan is placed in a fallow (plowed but unseeded) area, the humidity is high (i.e. humid), the wind speed is lowThe K pan is low if: the pan is placed in a cropped area, the humidity is low (i.e. dry), the wind speed is highIf the pan factor is not known the average value .7 - .75 could be used. If more accuracy is required, the pan factors can be taken from the table above( for class A pan only).

An Example• Type of pan: Class A evaporation pan• Water depth in pan on day 1 = 150 mm• Rainfall (during 24 hours) = 1 mm• Water depth in pan on day 2 = 144 mm (after 24
hours)• Formula: E = K pan × E pan
• K pan = 0.75, E pan = start + rain - finish
• Calculation: E pan = (150 + 1 – 144) = 7 mm/day
• E = 0.75 × 7 =5.2 mm/day
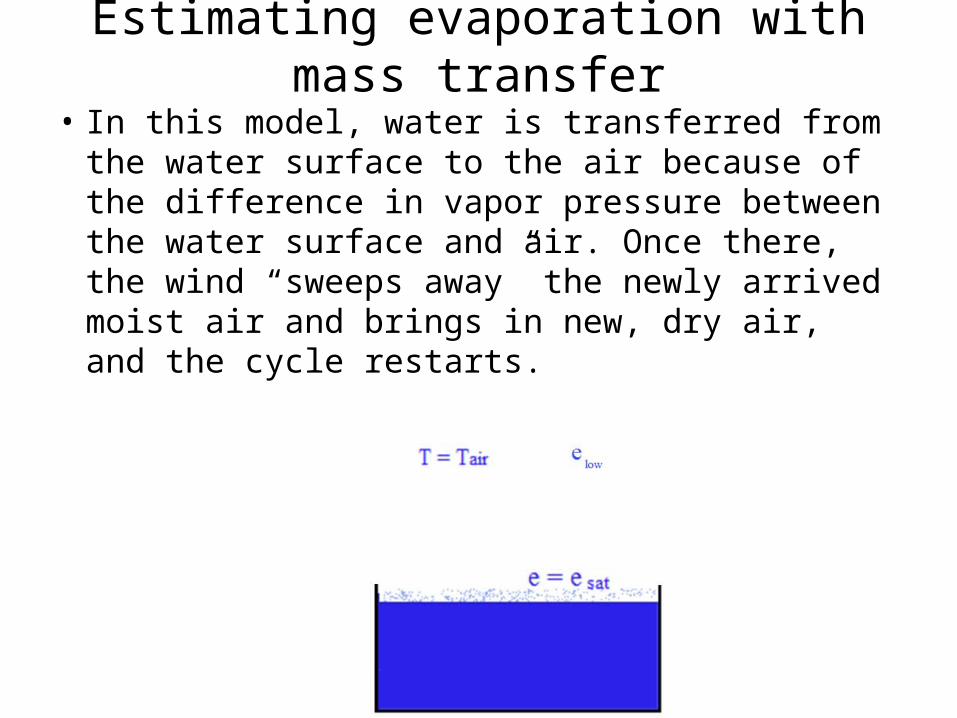
Estimating evaporation with mass transfer
• In this model, water is transferred from the water surface to the air because of the difference in vapor pressure between the water surface and air. Once there, the wind “sweeps away” the newly arrived moist air and brings in new, dry air, and the cycle restarts.
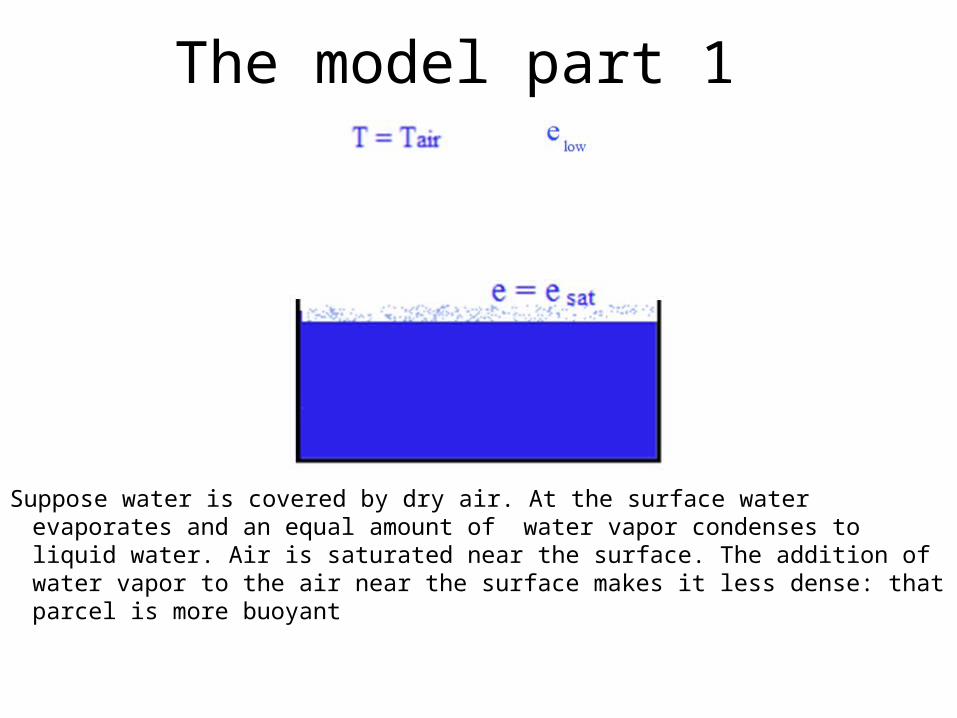
The model part 1
Suppose water is covered by dry air. At the surface water evaporates and an equal amount of water vapor condenses to liquid water. Air is saturated near the surface. The addition of water vapor to the air near the surface makes it less dense: that parcel is more buoyant

The model part 2
The parcel lifts. The vapor pressure difference between the surface, e ~ esat , and dry air 2 meters above the surface where e is low, is a pressure gradient, the moist air also diffuses (spreads out) toward the low pressure altitude

The model part 3
When the expanding parcel arrives at the 2 meter elevation, it has the lower vapor pressure e. We know how to calculate this from RH and esat

The model part 4
Then the wind sweeps away the moisture
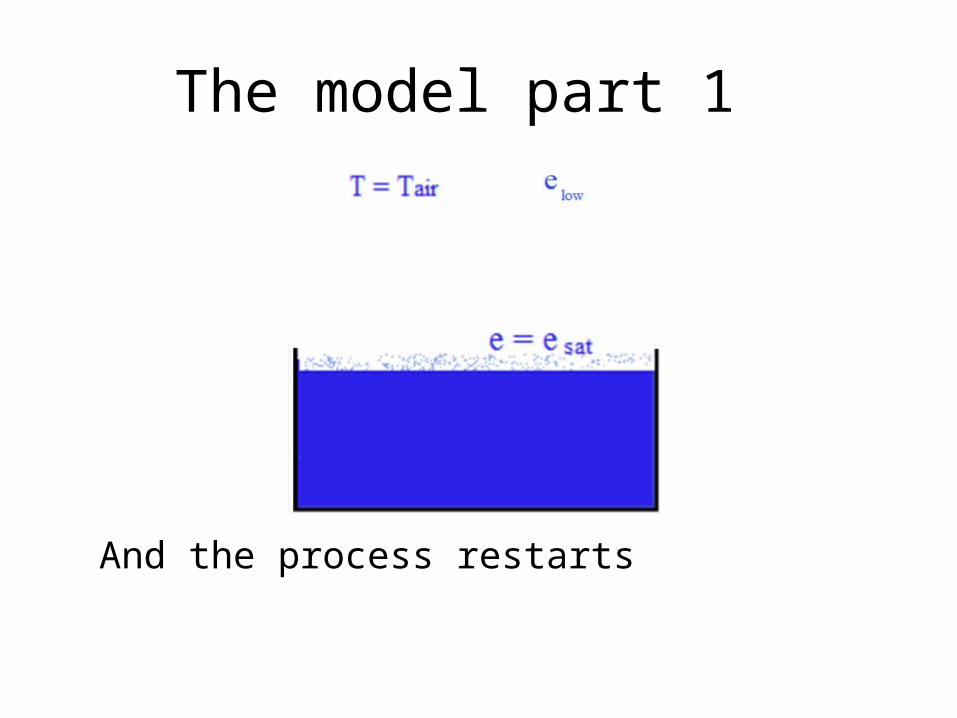
The model part 1
And the process restarts
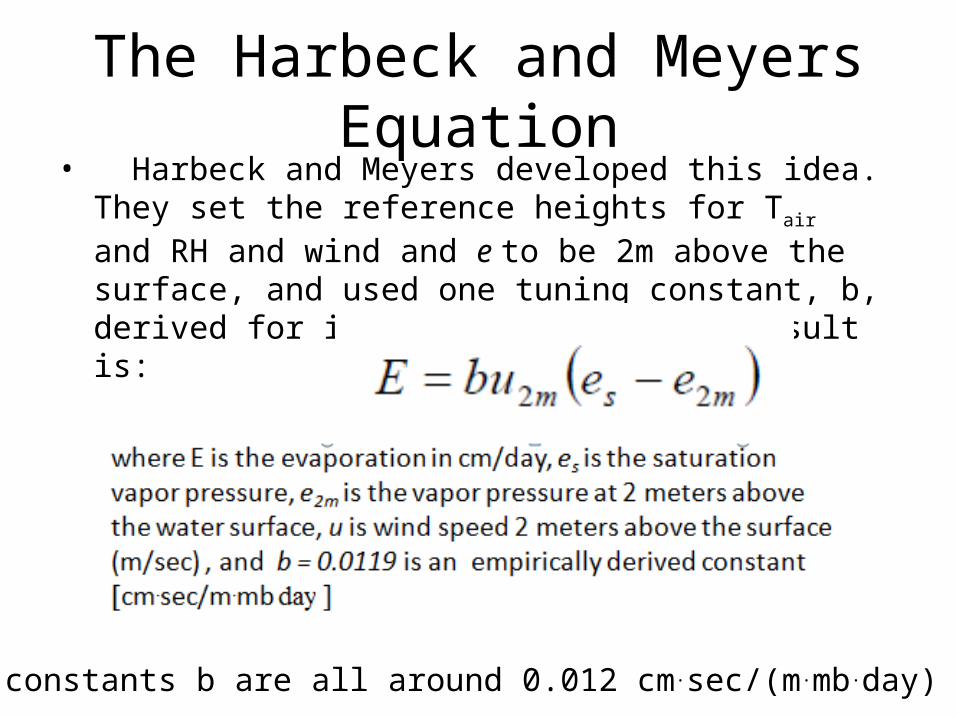
The Harbeck and Meyers Equation• Harbeck and Meyers developed this idea. They set the
reference heights for Tair and RH and wind and e to be 2m above the surface, and used one tuning constant, b, derived for individual areas. The result is:
Tuning constants b are all around 0.012 cm.sec/(m.mb.day) for lakes

Estimating Evaporation (continued)• Remember that you can use tables, such
as Appendix C, to get the saturation partial pressure esat for water at a particular temperature. You can get the Relative Humidity at the 2 meter level above the surface from a sling psychrometer, and then calculate
• e2m = (es x RH)/100
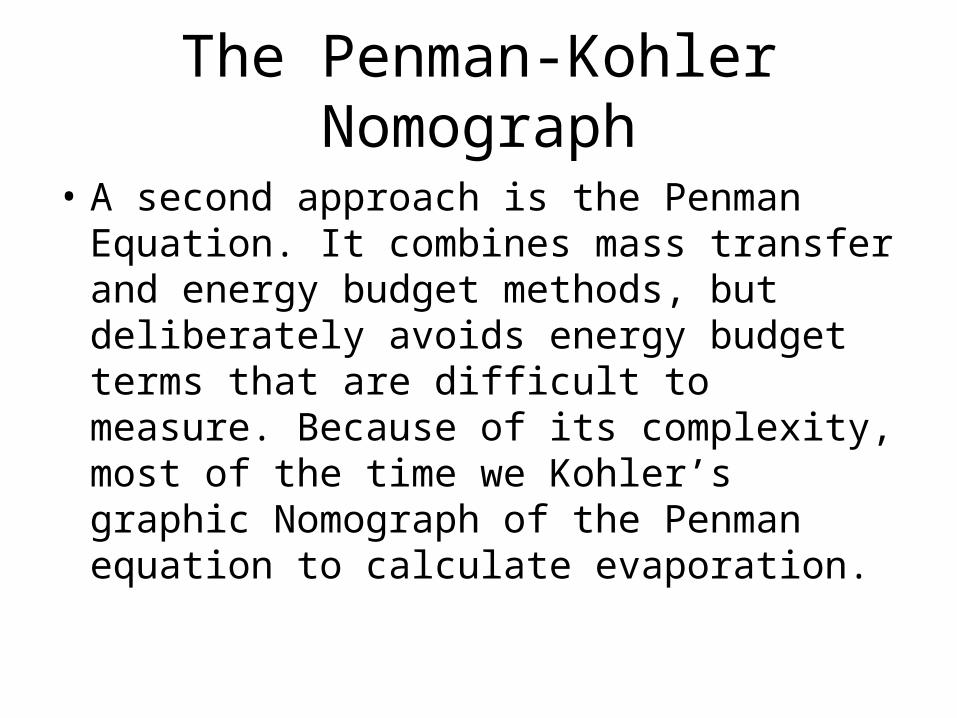
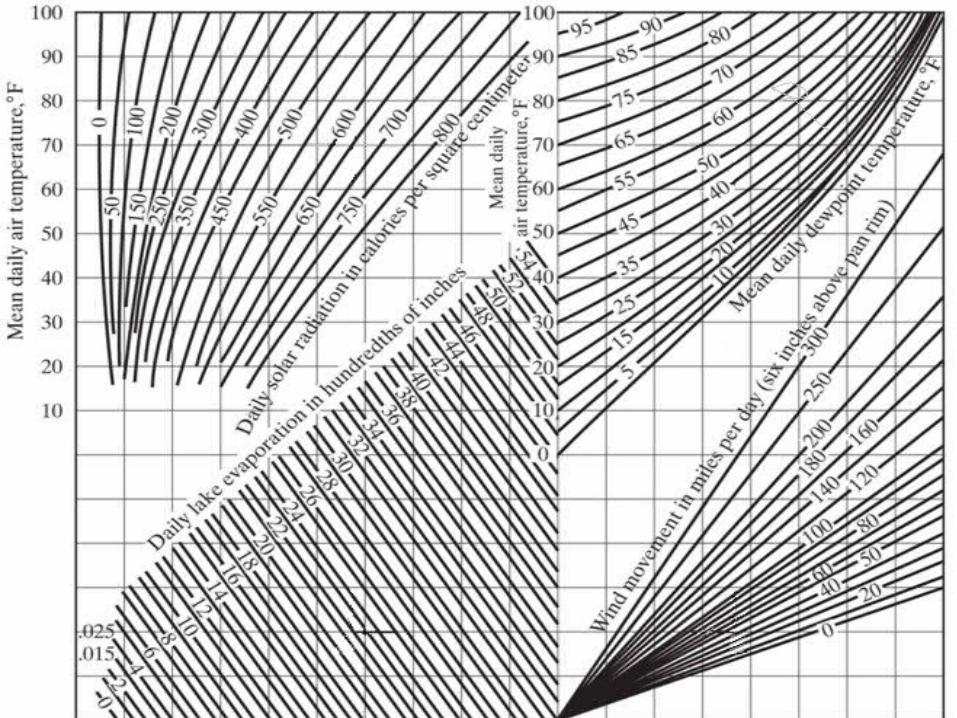
The Penman-Kohler Nomograph
• A second approach is the Penman Equation. It combines mass transfer and energy budget methods, but deliberately avoids energy budget terms that are difficult to measure. Because of its complexity, most of the time we Kohler’s graphic Nomograph of the Penman equation to calculate evaporation.

Use this to estimate shallow lake evaporation. For vegetation, use the tables included in this lecture and your book to estimate E+T
Upper left T air = 70F and daily radiation 650 ly /day langleys /day, 1 langley = 1 calorie/cm2
Upper right, the dew point Td = 50oF and Tair = 70oFLower right, Td = 50F and avg wind speed = 40 miles/day measured 6 inches above pan rimLower left, intersection of vertical from upper left and horizontal from lower rightEstimates daily pan evaporation in hundreds of inches = 0.22 inches.

Examples
• As usual I’ll do a couple of examples, and then you’ll do similar problems for homework
• The last slide is a full page Penman-Kohler Nomograph if you need it for your project.