discharge modelling experiments with the tigge archive
TRANSCRIPT

Discharge modelling experiments
with the TIGGE archive
Ervin Zsótér
ECMWF
Application Group
Evaluation Section
Slide 1CAHMDA-VI, Austin, 8-10 September 2014

GEOWOW project
GEOWOW: “GEOSS interoperability for Weather, Ocean and Water” a 3-year EU-funded FP7 project finished in August 2014
GEOWOW’s main (weather) objectives: to improve access to TIGGE ensemble forecast archive, document TIGGE quality, develop and demonstrate (multi-disciplinary) forecast products using TIGGE data in collaboration with users in developing countries
CAHMDA-VI, Austin, 8-10 September 2014 Slide 2
Multi-disciplinary use case:Modelling of river discharge using TIGGE weather forecasts and GRDC observations, and demonstrating interoperable use with WaterML/SOS/GEO-DAB in GEOSS
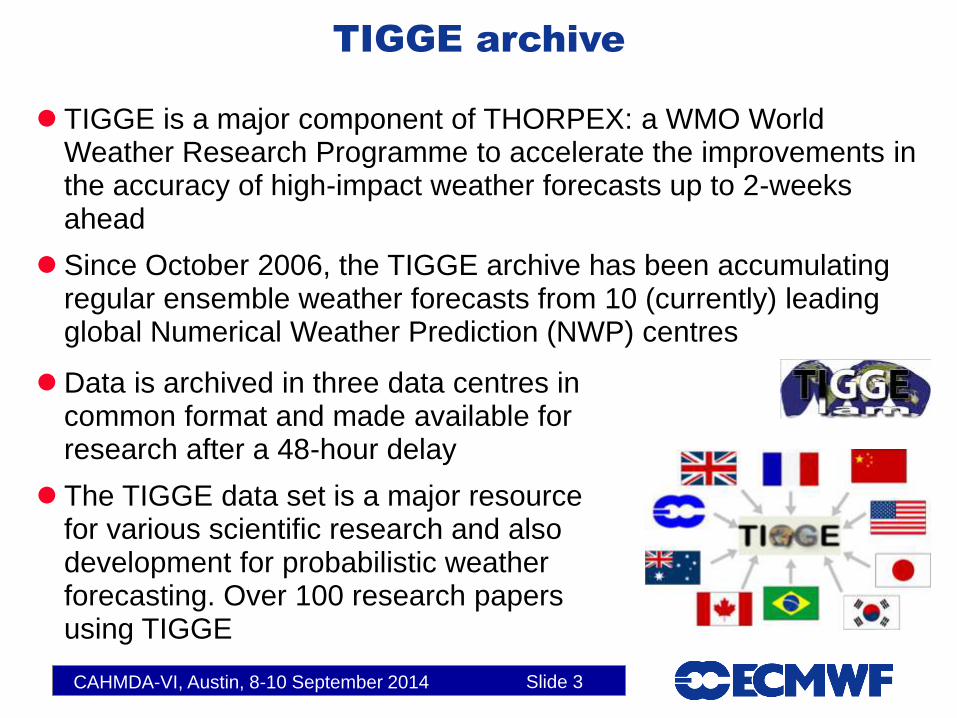
TIGGE archive
TIGGE is a major component of THORPEX: a WMO World Weather Research Programme to accelerate the improvements in the accuracy of high-impact weather forecasts up to 2-weeks ahead
Since October 2006, the TIGGE archive has been accumulating regular ensemble weather forecasts from 10 (currently) leading global Numerical Weather Prediction (NWP) centres
CAHMDA-VI, Austin, 8-10 September 2014 Slide 3
Data is archived in three data centres in common format and made available for research after a 48-hour delay
The TIGGE data set is a major resource for various scientific research and also development for probabilistic weather forecasting. Over 100 research papers using TIGGE

TIGGE/HTESSEL discharge modelling
River runoff ensemble forecasts are produced with the HTESSEL land-
surface model (operational at ECMWF)
CaMa-Flood river routing is coupled to integrate runoff over global river
catchments. For detailed description of CaMa-Flood go to:
http://hydro.iis.u-tokyo.ac.jp/~yamadai/cama-flood/
Discharge forecasts for ECMWF(50), UKMO(23), NCEP(20) and CMA(14)
CAHMDA-VI, Austin, 8-10 September 2014 Slide 4
Two multi-model combinations also
produced, an equal weight
combination (MMA) and the
Bayesian Model Averaging (BMA)
Forecasts for 2008-2013 at 00 UTC
runs for up to 240h
The discharge forecasts are validated
and verified with GRDC (Global
Runoff Data Centre) stations

GRDC stations in CaMa-Flood
Some blank areas globally
About 400 stations used
CAHMDA-VI, Austin, 8-10 September 2014
All GRDC stations
Slide 5

TIGGE/HTESSEL discharge modelling
Offline surface model is further developed for forecasts including ensembles
Initial conditions and climate for land-surface runs come from ECMWF operations and reanalysis
CAHMDA-VI, Austin, 8-10 September 2014 Slide 6
Surface (2m/10m) TIGGE model forcing is used instead of the default lowest model level (no model levels in TIGGE)
Some parameters for HTESSEL are missing in TIGGE (global radiations)
Available TIGGE parameters were used and radiation was replaced (e.g. ERA Interim or ECMWF ensemble mean)
The impact of the different replacement options is generally limited

CAHMDA-VI, Austin, 8-10 September 2014
ERA Interim discharge
Slide 7
ERA Interim offline run is used to
provide initialisation to the CaMa-Flood
routing for each TIGGE forecast
Two versions:
ERA Interim (EI)
ERA Interim improved (EI+GPCP2)
with GPCP2 corrected precipitation
Generally good simulation of the
variability and overall pattern
However, large deviations from the
actual GRDC observations
EI+GPCP2 is noticeably better
Global average
EI 1507
EI+GPCP2 1417
Errors for 2009 (m3/s)

HTESSEL sensitivity to forcing
HTESSEL input forcing parameters replaced
with ERA Interim to analyse sensitivity
Forcing parameter groups of wind, radiation,
temp/hum/pressure and precipitation
Temperature and humidity kept together due
to the very sensitive balance
Different model/interpolation provide an
imbalanced state which can result in artificial
due deposition (mostly in Northern
Hemispheric winter season)
T+240h ensemble control forecast runs
CAHMDA-VI, Austin, 8-10 September 2014 Slide 8
SIM-SFC
OPER-LM.LEV
Once a week in 2008-2012 (5 years, about 260 runs)
On the global CaMa-Flood river network (with around 400 stations)
Statistics as average of the absolute discharge increments (differences
divided by original value) over the 5-year period

HTESSEL sensitivity to forcing
Precipitation the largest (10-15%
by T+240h)
The other forcing parameters
integrated impact remains low
(below ~3%)
Temperature and humidity have
much bigger influence than wind
or radiation
Impact of Surface (2m/10m) vrs.
Lowest model level is very small
In NH summer precipitation is
very dominant (0.9% vrs. 13%)
In NH winter relative impact of
other parameters is lot bigger
(snow melting, etc.)
CAHMDA-VI, Austin, 8-10 September 2014 Slide 9
Average difference
(%)
Rad Wind TempHum
Rad+Wind+
TempHum
All
Global 1 0.6 2.4 2.9 15.6
NH.ET JJA 0.5 0.2 0.6 0.9 13
NH.ET DJF 1.1 0.7 2.9 3.6 9.5
Tropics JJA 0.9 0.4 0.9 1.5 15
Tropics DJF 1.2 0.6 1.3 2.1 18.7

CAHMDA-VI, Austin, 8-10 September 2014 Slide 10
EPS comparison - CRPS - 2009
Skill of the forcing TIGGE models including the equal weight multi-model
combination is compared for 2009 (00 UTC runs)
2m temperature (00 UTC) and 24-hour (00-00 UTC) precipitation
Verified by SYNOPs which were near the CaMa-Flood GRDC stations
ECMWF stands out with further benefits of MMA (multi-model) especially
at short range
2m Temperature 24h Precipitation

23/01/1900 23/05/190050
150
250
350
450
ECMWF
UKMO
NCEP
CMA
MMA
BMA
Hours
CAHMDA-VI, Austin, 8-10 September 2014 Slide 11
Discharge comparison - CRPS - 2009
Diff (%) T+24 T+48 T+72 T+96 T+120 T+144 T+168 T+192 T+216 T+240
ECMWF 0.6 -0.5 -1.4 -2.2 -2.9 -3.6 -4.2 -4.6 -5.0 -5.5
EI + GPSP2 ECMWF, UKMO, NCEP and
JMA compared with an
equal weight combination
(MMA) and Bayesian Model
Averaging (BMA)
Global (about 400 GRDC
stations) with 00 UTC
forecast runs up to 240h for
2009
Lot smaller differences
between TIGGE models
(then in EPS performance)
MMA already improves but
BMA shows the real
potential for post processing
EI+GPCP2 impact on the CRPS
0 24 48 72 96 120 144 168 192 216 240
m3/s

CAHMDA-VI, Austin, 8-10 September 2014 Slide 12
Extreme Forecast Index (EFI)
The EPS system provides HUGE amount of information. The EFI helps
to highlight potentially extreme situations in the EPS (EFI range -1 to +1)
It is defined as an integral (area) between forecast and climate CDFs
As the definition of extreme weather is strongly climate dependent, the
EFI actually provides a way of calibration as it connects the model world
to the observed by giving a generic “alarm bell” for extreme situations
For more details please see: Zsoter, 2006: Recent developments in
extreme weather forecasting. ECMWF Newsletter, 107, 8-17.

CAHMDA-VI, Austin, 8-10 September 2014 Slide 13
EFI time series example
T+240h - 2009
VICKSBURG, MS
MISSISSIPPI RIVER
Area: 2964255 km2

CAHMDA-VI, Austin, 8-10 September 2014 Slide 14
EFI model comparison
2008-2011
ROC area ROC area of the
forcing TIGGE
models and the equal
weight combination
compared
EFI for discharge is
verified
00 UTC runs
Observed event is 95
percentile of the
observed discharge
climate
ECMWF/MMA are the best
Here quite large differences between models
Summary
CAHMDA-VI, Austin, 8-10 September 2014 Slide 15
Discharge forecasts were produced for TIGGE models in the
GEOWOW project
HTESSEL land-surface model and CaMa-Flood routing were
used
Demonstrating interoperability by providing discharge forecasts
and observations through WaterML/SOS/GEO-DAB into
GEOSS
Comparison of four TIGGE models with two multi-model
combinations highlighting the potential benefit of model
combinations and post processing
The interoperability and discharge modelling work done in
GEOWOW continues in the future at ECMWF in different
hydrological applications

CAHMDA-VI, Austin, 8-10 September 2014 Slide 16
Thanks for your attention!
Any questions?