disclosure, corporate governance, and the cost of … · disclosure, corporate governance, ......
TRANSCRIPT

Disclosure, Corporate Governance, and the Cost of Equity Capital: Evidence from Asia’s Emerging Markets
Kevin C.W. Chen Department of Accounting
Hong Kong University of Science & Technology Clear Water Bay, Kowloon, Hong Kong
Tel: (852)-2358-7585, Fax: (852)-2358-1693 Email: [email protected]
Zhihong Chen Department of Accounting
Hong Kong University of Science & Technology Clear Water Bay, Kowloon, Hong Kong
Tel: (852)-2358-7578, Fax: (852)-2358-1693 Email: [email protected]
K.C. John Wei Department of Finance
Hong Kong University of Science and Technology Clear Water Bay, Kowloon, Hong Kong
Tel: (852)-2358-7676; Fax: (852)-2358-1749 Email: [email protected]
June 2003 _______________________________ The authors appreciate helpful comments from Bernie Black, Dosung Choi, Florencio Lopez-de-Silanes, Randall Morck, Jay Ritter, James Shinn, T.J. Wong, and seminar participants at the third Asian Corporate Governance Conference held at Korea University and the Hong Kong University of Science & Technology. The authors also acknowledge financial support from the Research Grants Council of the Hong Kong Special Administration Region, China (HKUST6134/02H).

Abstract
This paper examines the effects of disclosure and other corporate governance mechanisms on the cost of equity capital in Asia’s emerging markets with newly released surveys from Credit Lyonnais Securities Asia (CLSA). We find that both disclosure and non-disclosure corporate governance mechanisms have a significantly negative effect on the cost of equity capital. In addition, the effect of non-disclosure governance mechanisms is more profound than that of disclosure on the cost of equity capital. Specifically, after controlling for beta and size, when a firm improves its aggregate non-disclosure corporate governance ranking from the 25th percentile to the 75th percentile, its cost of equity capital is reduced roughly by 1.26 percentage points, while the corresponding reduction in the cost of equity capital for the same improvement in disclosure is 0.47. Finally, we find that country-level investor protection and firm-level corporate governance are both important in reducing the cost of equity capital. Our findings suggest that, in emerging markets where infrastructural factors, such as the legal protection of investors and the overall level of corporate governance, are not well established, reducing the expropriation risk by strengthening overall corporate governance appears to be more important in reducing the cost of equity capital than adopting a more forthright disclosure policy.
JEL classification: G34; G38
Keywords: Corporate governance; Cost of equity capital; Disclosure; Investor protection

1
1. Introduction
Whether or not disclosure reduces a firm’s cost of capital is the focus of a growing body
of accounting research. The study of this issue is motivated by the economic theory that greater
disclosure lowers the information asymmetry (e.g., Glosten and Milgrom 1985; Diamond and
Verricchia 1991) and the estimation risk (e.g., Barry and Brown 1985). Lang and Lundholm
(1996) show that firms disclosing more have more accurate and less dispersed analyst earnings
forecasts. Welker (1995) and Healy, Hutton, and Palepu (1999) further document that firms
with greater disclosure have lower bid-ask spreads, a measure of the cost related to information
asymmetry. Botosan (1997) and Botosan and Plumlee (2002) provide a direct link by showing
a negative relation between the disclosure in annual reports and the cost of equity capital for
firms followed by few analysts and for firms in general, respectively. Further, Sengupta (1998)
reports that firms disclosing more pay lower costs in issuing debt. Citing this body of evidence
to support the importance of disclosure, Standard & Poor’s in 2001 launched an ambitious survey
of transparency and disclosure covering 1,600 companies around the world.
However, there are at least two dimensions that are not yet explored in this body of
research. The first issue is whether the results mentioned above can be generalized to emerging
markets. More specifically, does disclosure have the same effect in reducing the cost of equity
capital in both developed and emerging markets? The answer to this question is not so obvious.
On the one hand, if securities with low information quality are a nontrivial part of the final
portfolios chosen by investors, the estimation risk will be non-diversifiable (Clarkson et al. 1996).
Compared with developed markets, the quality of accounting income in emerging markets is
lower (e.g., Ball et al. 2003), which suggests that securities with high information risk may
account for a greater proportion of the portfolios held by investors in emerging markets than in

2
developed markets. This makes the estimation risk in emerging markets even more difficult to
diversify. Thus, the marginal benefit of disclosure in reducing the cost of equity capital might
be greater in emerging markets. On the other hand, the weak legal protection of property rights
in emerging markets discourages informed arbitragers to capitalize on firm-specific information
(Morck et al. 2000). Thus, investors might pay less attention to disclosure that sheds light on
firm-specific future prospects, making disclosure less effective in reducing the cost of equity
capital in emerging markets.
The second issue that has not yet been explored is, besides disclosure, whether other
corporate governance mechanisms can also reduce the cost of capital by reducing the risk of
expropriation by majority shareholders. This issue is important for two reasons. One is that
disclosure is typically considered as an integral part of corporate governance in research (e.g.,
Mitton 2002, Durnev and Kim 2003) and in surveys (e.g., CLSA 2001 and 2002; Standard &
Poor’s 2002). The relationship between disclosure and the cost of capital might change after
controlling for other corporate governance mechanisms. The other reason is that there is a
growing literature showing that investor protection or corporate governance enhances firm value
(e.g., Black et al. 2003; Claessens et al. 2002; Gompers et al. 2003; La Porta et al. 2002).
However, these studies typically assume that investor protection or corporate governance affects
firm valuation by reducing expropriation by majority shareholders and improving the expected
cash flows that can be distributed to shareholders. Whether or not those mechanisms also affect
the cost of equity capital, another determinant of firm value, is unknown.1 This is an important
issue, because the cost of capital is a more direct measure of a firm’s financing costs than firm
1 Studies most related to ours are Lombardo and Pagano (2000a, 2000b) and Drobetz, Schillhofer, and Zimmermann (2003). The former study the effect of country-level legal protection on the expected rate of return, and the latter investigate the effect of firm-level corporate governance on the expected rate of return using German data. None of the studies uses implied cost of equity capital.
3
valuation and financing costs affect not only a firm’s investment decisions, but also its external
financing capability.
This study adds insights along these two dimensions. Using two newly released surveys
from Credit Lyonnais Securities Asia (CLSA), we find a negative relationship between
disclosure and the cost of equity capital in Asia’s emerging markets. Thus, the same
relationship that exists in the U.S. can be extended to emerging markets. We also find a
negative relationship between the non-disclosure corporate governance mechanisms and the cost
of equity capital. This suggests that corporate governance enhances firm value by reducing the
cost of equity capital, not just by improving the expected cash flows that can be distributed to
shareholders. Moreover, we find that the effect of the non-disclosure corporate governance
mechanisms on the cost of equity capital is stronger than that of disclosure. More specifically,
after controlling for beta and size, when a firm improves its aggregate non-disclosure corporate
governance ranking from the 25th percentile to the 75th percentile, its cost of equity capital is
reduced roughly by 1.26 percentage points, while the corresponding reduction in the cost of
equity capital for the same improvement in disclosure is only 0.47 point . Finally, we show that
country-level investor protection and firm-level corporate governance are both important in
reducing the cost of equity capital, when both variables are included in a regression.
The findings in this study bolster the argument for stronger corporate governance around
the world, and especially in Asia. Three surveys conducted by McKinsey & Co. in 1999 and
2000 (Coombes and Watson 2000) show that institutional investors from around the world are
willing to pay a premium of more than 20% for shares in companies with good corporate
governance. In addition, the surveyed premium levels in Asia’s emerging markets are higher
than those in more mature markets, such as the U.S. and the U.K., which reflects the relatively

4
poorer corporate governance of companies in Asia. The results reported in this study
corroborate the findings of the McKinsey survey. That is, investors not only have the
willingness, but are also, in fact, already paying a premium for good corporate governance.
Based on our estimation, the 1.26-point reduction in the cost of capital via the improvement in
corporate governance can translate into an increase of more than 20% in firm value with some
reasonable assumptions. In other words, our empirical evidence is consistent with the McKinsey
survey that investors are willing to pay a premium of more than 20% for good corporate
governance.
Moreover, the finding that the non-disclosure corporate governance mechanisms are more
important than disclosure in reducing the cost of equity capital implies that the value of
disclosure for investors appears to be dependent on the legal protection of investors and the
overall level of corporate governance in the economy. In other words, as those factors are
lacking in Asia, although corporate disclosure is significant, it seems that strengthening the
overall level of corporate governance should be of higher priority at present to reduce a firm’s
cost of capital.
The remainder of this paper is organized as follows. Section 2 develops the hypotheses.
Section 3 describes the sample construction process and the measures of disclosure and corporate
governance provided by CLSA. Section 4 describes the method used to estimate the cost of
equity capital and tests the validity of our estimates. Section 5 provides empirical evidence of
the relationships among the cost of equity capital, disclosure, and other corporate governance.
Section 6 conducts sensitivity tests. Finally, Section 7 concludes the paper.

5
2. Hypotheses
2.1 Disclosure and the cost of equity capital in emerging markets
The literature on the relationship between disclosure and the cost of equity capital (e.g.,
Botosan and Plumlee, 2002) typically invokes two streams of analytical research to postulate a
negative relationship between disclosure and the cost of equity capital. The first is that
disclosure lowers the cost of equity capital by reducing the information asymmetry and, in turn,
enhancing the stock market liquidity (e.g., Glosten and Milgrom 1985; Diamond and Verrecchia
1991; Welker 1995; Healy, Hutton, and Palepu 1999).2 The second is that disclosure can reduce
the estimation risk, which is not diversifiable under certain conditions. For example, Clarkson
et al. (1996) show that, if investors’ portfolios consist of many securities with low information
quality, the estimation risk is non-diversifiable.3
In comparison to the market in the U.S., emerging markets are known to have more
severe information asymmetry problems. For example, Domowitz et al. (2000) find that
emerging markets have significantly higher trading costs, which are related to asymmetric
information, even after controlling for factors affecting trading costs such as market
capitalization and volatility. Therefore, disclosure might have a stronger effect in reducing
information asymmetry and the cost of equity capital in emerging markets. In addition, the
quality of accounting information in Asia’s emerging markets is also lower (Ball et al. 2003),
suggesting that securities with high information risk may account for a higher proportion of
portfolios held by investors. This makes the estimation risk in Asia’s emerging markets even
2 Core (2001) discusses the evidence that proxies for information asymmetry appear to explain cross-sectional returns (e.g., Brennan and Subrahmanyam 1996). Hence, disclosure can have a first-order effect in lowering the cost of capital through the reduction of information asymmetry. 3 In addition, Barry and Brown (1985), Handa and Linn (1993), and Coles et al. (1995) maintain that the estimation risk is not diversifiable in the presence of differential information. As indirect empirical evidence of the relationship between disclosure and the estimation risk, Lang and Lundholm (1996), and Hope (2003) show that disclosure lowers the dispersion and increases the accuracy of analysts’ earnings forecasts.
6
more difficult to diversify and increases the marginal benefit of disclosure in reducing the cost of
equity capital.
The recognition hypothesis developed by Merton (1987), to be discussed in detail below,
also supports a negative relationship between disclosure and the cost of equity capital.
According to this hypothesis, if more disclosure can attract more investors to hold the stock in
their portfolios, the importance of idiosyncratic risk can be reduced and, in turn, the cost of
capital can be lower.
Moreover, the corporate governance literature developed in recent years also points out
an additional way through which disclosure could reduce the cost of equity capital. Disclosure
is commonly regarded as one of the dimensions of corporate governance in academic research
(e.g., Mitton 2002; Durnev and Kim 2003) and in corporate governance surveys, including those
by CLSA and Standard & Poor’s. The reason is that disclosure facilitates the external
monitoring of corporate insiders and reduces the risk of being expropriated by corporate insiders.
As discussed below, corporate governance could reduce the cost of equity capital, and so could
disclosure.
Despite the various arguments supporting a negative relationship between disclosure and
the cost of equity capital, there are at least two forces pulling the relationship in the opposite
direction. For one thing, firms in emerging markets are characterized by highly concentrated
ownership and lack of legal enforcement (La Porta et al. 1998a, 1999). Because large
shareholders control the information production process and they are not constrained by strong
legal enforcement, financial reporting in emerging markets is more prone to manipulation (Leuz
et al. 2003). Accordingly, investors pay less attention to the information disclosed (Fan and
Wong 2002). For another, the weak legal protection of property rights in Asia’s emerging

7
markets discourages informed investors from capitalizing on firm-specific information, resulting
in high synchronous stock prices movement (Morck et al. 2000). This also implies that
investors might pay less attention to disclosure that sheds light on firm-specific future prospects,
making disclosure less effective in reducing the cost of equity capital in emerging markets than
in developed markets.
The combination of the factors discussed above could make the relationship between
disclosure and the cost of equity capital in emerging markets either more or less significant than
that observed in the U.S. Thus, whether disclosure is useful in reducing the cost of equity
capital in Asia’s emerging markets becomes an empirical issue, which can be tested by using the
following alternative hypothesis.
Hypothesis 1: Greater disclosure lowers the cost of equity capital.
2.2 Corporate governance and the cost of equity capital
La Porta et al. (2000) define corporate governance as a set of mechanisms through which
outside investors protect themselves against expropriation by insiders. The agency theory
suggests that corporate insiders tend to expropriate outside investors. We argue that the degree
of expropriation by corporate insiders is asymmetric and depends, among other issues, on the
investment opportunity and the cost of expropriation. The degree of expropriation by corporate
insiders is negatively correlated with their investment opportunities, because better investment
opportunities imply higher opportunity costs of the expropriated corporate resources (e.g.,
Johnson et al. 2000; Shleifer and Wolfenzon 2002; and Durnev and Kim 2003). A firm’s
specific investment opportunity has a non-diversifiable component that depends on
macroeconomic conditions. As a result, the expropriation by insiders also has a component that
is related to the market condition and is not diversifiable. In other words, insiders are expected

8
to expropriate more when the market is bad and less when market is good. This negative
correlation between expropriation and the market condition exaggerates the firm’s systematic
risk and must be compensated for by a higher expected return.
By shaping the cost function of expropriation, corporate governance affects the
correlation between the degree of expropriation and the market conditions. In particular, good
corporate governance will constrain the degree of expropriation in bad times. Research on the
1997-1998 Asian financial crisis provides plenty of evidence. For example, Johnson et al.
(2000) find that weak legal institutions for corporate governance can exacerbate the stock market
decline in the 1997 financial crisis. Mitton (2002) finds that companies with better firm-level
governance had better market performance during the Asian financial crisis, and Lemmon and
Lins (2001) find that the measure of the likelihood of being expropriated is positively correlated
with the decline of Tobin’s Q ratios and stock prices during the crisis.
From the above discussion, it is clear that corporate governance will affect the cost of
equity capital. We can formally model this argument as follows. We assume that there are two
periods, time t and time t+1. For simplicity, suppose that all firms can generate an identical
random cash flow of C~ at time t+1. We assume that the expected value of C~ is positive.
We also assume that investors receive only a portion of the cash flow generated by the firm
( Cgi~ ), depending on the strength of the firm’s corporate governance, denoted by gi, with 0 ≤ gi ≤
1. A gi value of zero represents the worst corporate governance, while a gi value of one
represents the best corporate governance. Corporate insiders of firms with poor corporate
governance expropriate more during bad times. Thus, the cash flow received by investors ( iF~ )
can be modeled as
ugCguCF iiiii~)1(~~~~ −−=−= , (1)

9
where u~ has a mean of zero and a standard deviation of σu and 0)~,~( <mRuCov . u~ can be
interpreted as the common factor of additional expropriation. ugu ii~)1(or~ − can be thought of
as additional expropriation (or subsidization) by insiders, which is negatively related to corporate
governance and is dependent on the condition of the market. Equation (1) captures the idea that
the better the corporate governance, the greater is the expected cash flow generated by the firm
available to investors. In addition, the insiders will expropriate more cash flow during a bad
market and less during a good market. That is, the expropriation is asymmetric.
For simplicity, we assume that the Capital Asset Pricing Model (CAPM) holds.4 Under
the above setting, the value of firm i at time t (Vi) can be expressed as:
.1
)~,~()1()~,~()~(
1)~,~()~(
1)~(
1)~(
f
mimii
f
mii
i
i
i
ii
RRuCovgRCCovgCEg
RRFCovFE
RCEg
RFEV
+−+−
=
+−
=+
=+
=
(2)
where Ri is the risk-adjusted discount rate for firm i, Rf is the risk-free rate, mR~ is the return on
the market portfolio, E(.) is the expectation operator, and Cov(.,.) is the covariance operator.
It is easy to show that if the zero-mean component of expropriation, u~ , is uncorrelated
with the market, corporate governance can only affect the expected cash flow, and not the cost of
equity capital:
RCEg
VgV iii +
==1
)~(, (3)
where V is the value of the firm with the best corporate governance, i.e., g=1, and R is its
risk-adjusted cost of capital. However, when the zero-mean component of expropriation, u~ , is
negatively correlated with the market, corporate governance can affect both the expected cash
4 Our conclusion reminds unchanged under other asset-pricing models.

10
flow and the cost of capital. Using equation (2), we can show that greater corporate governance
suggests a lower cost of capital.
[ ] 0)~,~()1/1()~,~()~(
/)~,~()1)(~(2
2
<−+−
+=
∂∂
mim
imf
i
i
ReCovgRCCovCE
gRuCovRCEgR . (4)
The prediction of this model is closely related to the recognition hypothesis suggested by
Merton (1987) and a model derived by Himmelberg et al. (2002). Merton (1987) derives an
asset-pricing model with incomplete information, which does not require the validity of CAPM.
In equilibrium, if investors include only stocks that they recognize in their portfolios, the
required rates of return (or the cost of equity capital) are positively related to both systematic risk
and idiosyncratic risk. In addition, less recognition by investors increases the importance of
idiosyncratic risk. If better corporate governance attracts more investors to include the stock in
their portfolios, then Merton’s recognition hypothesis also suggests a negative relation between
corporate governance and the cost of equity capital. Himmelberg et al. (2002) examine the cost
of capital in a model with an agency conflict between inside mangers and outside shareholders.
Inside ownership reflects the tradeoff between risk diversification and incentives, and the
severity of the agency costs depends on investor protection. Under this setting, they find that
the marginal cost of capital is a weighted average of terms representing both systematic risk and
idiosyncratic risk and that weaker investor protection is associated with a higher weight on
idiosyncratic risk. This prediction is consistent with Merton’s recognition hypothesis.
From the above discussion, our second hypothesis is stated as follows.
Hypothesis 2: Better corporate governance lowers the cost of equity capital.
Investors rely on both the country-level and firm-level corporate governance to alleviate
corporate insiders’ expropriation. Thus, the corporate governance variable in the above
11
hypothesis can be measured at both firm- and country-levels. The scores from CLSA’s
corporate governance surveys, to be discussed below, are used as the firm-level measures, while
the variables representing the legal protection of investors in each market (to be detailed in
Section 5.3) will be used as the country-level measure of corporate governance quality.
3. Sample Selection and Measurements of Disclosure and Corporate Governance
3.1 Sample construction
Our sample selection begins with the CLSA corporate governance surveys published in
2001 and 2002.5 The surveys cover 495 firms in 2001 and 508 firms in 2002 in 25 emerging
markets. Of them, 362 firms in 2001 and 373 firms in 2002 belong to nine economies in Asia.6
After eliminating firms without earnings forecast data from I/B/E/S and book value as well as
market value of equity data from Datastream, the final sample includes 545 firm-year
observations (270 in 2000 and 275 in 2001). The numbers for each economy are provided in
Table 1.
[Insert Table 1 here]
3.2 The measures of disclosure and corporate governance
In response to the growing demand by investors for independent assessment of corporate
governance, Credit Lyonnais Securities Asia (CLSA) Emerging Markets, a provider of brokerage
5 Some studies also use disclosure scores from Standard & Poor’s transparency and disclosure survey. The Standard & Poor’s survey intends to measure the disclosure of corporate governance instead of its strength (Standard & Poor’s 2002). Since the focus of this study is the different effects of disclosure and non-disclosure corporate governance on the cost of equity capital, the data from S&P’s survey are not used here. 6 The nine economies in our study are Hong Kong, India, Indonesia, Korea, Malaysia, the Philippines, Singapore, Taiwan, and Thailand. The Chinese firms in the survey are grouped with Hong Kong because most of them are listed on the Hong Kong Stock Exchange. Other markets are not included because CLSA covers only a small number of firms in each of them.
12
and investment banking services in the emerging markets of Asia, Latin America and Europe,
released a comprehensive report on corporate governance in April 2001 entitled “Saints &
Sinners: Who’s Got Religion?”7 and an updated survey in February 2002 entitled “Make me
holy…but not yet!” In these reports, firms’ corporate governance was assessed based on seven
key criteria.8 The reports also show that good corporate governance is associated with strong
performance in several dimensions, including share price levels, stock returns, and accounting
profitability.
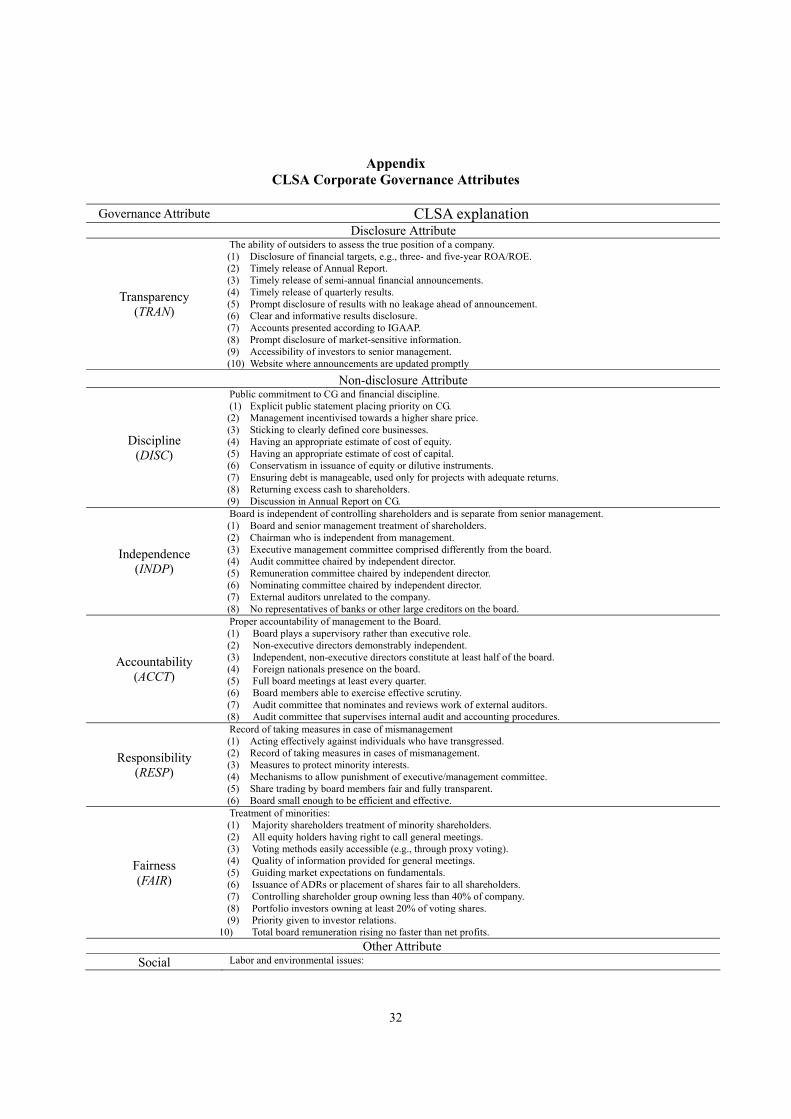
The appendix reproduces the rating criteria used in CLSA’s two surveys, which are
summarized into seven major categories: (1) transparency (TRAN), (2) management discipline
(DSPL), (3) independence (INDP), (4) accountability (ACCT), (5) responsibility (RESP), (6)
fairness (FAIR), and (7) social awareness (SOCL). The meanings of these categories are as
follows. “Transparency” refers to the ability of outsiders to assess the true position of a
company. “Discipline” refers to management’s commitment to emphasize shareholder value
and financial discipline. “Independence” refers to the board of director’s independence of
controlling shareholders and senior management. “Accountability” refers to the accountability
of management to the board of directors. “Responsibility” refers to the effectiveness of the
board to take necessary measures in case of mismanagement. “Fairness” refers to the treatment
minority shareholders receive from majority shareholders and management. The last category,
“social awareness,” refers to the company’s emphasis on ethical and socially responsible
behavior.
Each category includes from six to ten criteria, with a total of 57 criteria. Each of them
7 Earlier in October 2000, CLSA issued a much smaller-scaled corporate governance report entitled “The Tide is Out: Who’s Swimming Naked?” Because this report covers only 115 firms and uses a much less rigorous set of criteria, it is not used in this study. 8 The firms selected are larger ones or ones that receive higher investor interest in each market.

13
is stated in the form of a questionnaire; CLSA asks its analysts covering a company to give a
zero/one answer to each question. The answers to the questions in each category are summed
to form a score and then scaled by the total number of questions in the corresponding category to
convert it into a percentage.
Because the focus of this study is the different effects of disclosure and other corporate
governance mechanisms on the cost of equity capital, the seven categories are separated into
three groups, disclosure (including transparency only), non-disclosure corporate governance
mechanisms, including categories 2 through 6, and social awareness. The five measures of
non-disclosure corporate governance mechanisms are summarized into a composite measure
denoted as NDCG. We do not include social awareness as a variable, because this dimension is
not expected to affect the cost of equity capital.9
Some items in the CLSA survey depend on the results of subjective assessments based on
the analyst’s experience in covering the company. This approach has the advantage of
measuring the essence, instead of the form of disclosure and governance, but is also susceptible
to analyst’s bias (Brooker 2001). To alleviate the potential bias, CLSA designed 70% of the
questions to be based on facts, such as whether the board meets at least four times a year. In
addition, when a subjective assessment has to be made, analysts have to provide a definite yes/no
answer to reduce the degree of subjectivity. The validity of the CLSA scores has been
corroborated by other studies. For example, Khanna et al. (2002) construct a “scandal index,”
based on the media-reported incidences of expropriation, tax evasion, and price fixing, for a
group of Indian firms covered by CLSA. They find that companies with low CLSA scores are
more likely to have scandals. Similar support is reported by Durnev and Kim (2003), who
9 In addition, we do not find a significantly negative association between social awareness and the cost of equity in the regressions.

14
extend the analysis to 84 firms in 14 countries.
Panel A of Table 2 provides the descriptive statistics of the CLSA governance attributes
for the pooled sample and Panel B reports the means and medians of the attributes for each
economy. The mean (median) transparency (TRAN) score of the 545 firm-years included in the
sample is 60.23 (60.00), and the mean (median) composite non-disclosure governance (NDCG)
score is 55.67 (56.22). One general observation from Table 2 is that Asian firms in the sample
score lower in non-disclosure governance attributes than in transparency: six out of nine
economies in our sample have lower median scores in NDCG than in transparency. In addition,
the firms in Hong Kong, Malaysia, and Taiwan have the highest median scores in transparency,
while those in the Philippines have the lowest. We also observe that Singaporean firms have
the highest median score in NDCG followed by those in Hong Kong and Malaysia, while
Indonesian firms have the lowest.
[Insert Table 2 here]
Table 3 shows the Spearman correlation coefficients between the CLSA corporate
governance attributes. Although the CLSA disclosure score (TRAN) is significantly positively
correlated with other corporate governance scores, the magnitude is not high. The highest
correlation between TRAN and individual non-disclosure attributes is 0.24 ─ between TRAN and
independence (INDP) ─ and the correlation between TRAN and the composite non-disclosure
governance score (NDCG) is only 0.28. The reason could be that some companies consider
disclosure as complementary while others consider it as a substitute for other corporate
governance mechanisms. These two dimensions are thus expected to have different effects on
the cost of equity capital.

15
[Insert Table 3 here]
4. Estimation of the Cost of Equity Capital in Asia
4.1 Estimation approach
Two approaches have been used in the literature to estimate the cost of equity capital.
The first is to use average realized returns as a proxy for expected return. However, this
approach has been proven to be very imprecise (Fama and French, 1997), due to the difficulties
of the choice of an asset-pricing model and the imprecise estimates of risk loadings and factor
risk premiums. Elton (1999) also points out that realized returns are a poor proxy for expected
returns.
In this study we adopt the second approach, which estimates the ex ante cost of equity
capital from the residual income valuation model (Ohlson 1995). This method is algebraically
equivalent to the familiar dividend discount model and has been used by Botosan (1997) and
Gebhardt, Lee, and Swaminathan (2001, GLS hereafter), among others.
We follow the methodology employed by GLS.10 Specifically, the implied cost of
equity capital, R, is the internal rate of return that equates the current stock price to the intrinsic
value of the stock, i.e., the sum of the current book value of equity and the discounted future
abnormal earnings:
( )( )∑
∞
=
−++
+−
+=1
1
1ii
ititttt R
BRROEEBP , (5)
10 Botosan and Plumlee (2002) use the dividend discount model to estimate the cost of equity capital. This approach is not used here because the dividend model requires an estimation of stock prices in the future, which is not readily available in Asia. In addition, Botosan and Plumlee (2001) show that the costs of capital measures estimated from the residual income model are highly correlated with those estimated from a dividend discount model.

16
where Pt is the stock price at time t, Bt is the book value of equity at time t, R is the ex ante cost
of equity capital, ROEt+i is the return on equity in period t+i, and )(⋅tE represents the
expectation based on information available at time t. Because equation (5) requires the
earnings forecasts of all future periods, it is converted into the following finite-horizon version:
( )( )
( )( ) RR
BRFROER
BRFROEBP T
TtTtT
ii
itittt +
−+
+
−+= −++
=
−++∑ 111
1
1 , (6)
where FROE is the forecasted return on equity. For the first three years, FROEt+i =
FEPSt+i/Bt+i-1, where FEPSt+i is the I/B/E/S median forecasted EPS for year t+i.11 We obtain
the FROE series from the 4th year by linearly interpolating FROEt+3 to an “equilibrium” ROE by
the Tth year. The “equilibrium” ROE is proxied by the median ROE of the industry of the
country in which the firm is located over the previous five years.12 Bt in equation (6) is defined
as the book value of equity from the most recent financial statement available. We assume that
the book value of equity, earnings, and dividends satisfy the “clean surplus relationship” in
expectation, i.e., ( )ititititit poutBFROEBB +−++−++ −+= 111 , where poutt+i is the forecasted
dividend payout ratio, measured by the median payout ratio over the previous five years.13 We
estimate each firm’s cost of equity capital at the end of June of each year.14
Once the FROEt+i and Bt+ i series are constructed, R can be solved from equation (6) for a
11 If the EPS forecasts for year t+2 or t+3 are missing, we construct our own forecast by interpolating or extrapolating the I/B/E/S forecasts made for the adjacent two years. Specifically, if the EPS forecast for year t+3 is missing, we assume that EPSt+3=2EPSt+2-EPSt+1; if the EPS forecast for year t+2 is missing, we assume that EPSt+2=(EPSt+3+EPSt+1)/2; and if neither of the EPS forecasts for year t+2 and year t+3 are available, we assume that EPSt+3=EPSt+2=EPSt+1. 12 To compute the industry median ROE, we group firms into 10 industries according to the Datastream global uniform level 3 industry definition. In addition, similar to GLS, we exclude loss-making firms in calculating the industry ROE because the population of profitable firms better reflects the long-term industry equilibrium ROE. 13 To avoid the bias caused by extreme payout patterns, we eliminate payout ratios greater than 1 or less than 0. In addition, poutt+i is set to zero if FROEt+i is negative. 14 We also tried using earnings forecast and market value data in other months. These estimates of the cost of equity capital are highly correlated with each other. In addition, our conclusions are robust to the time at which the cost of equity capital is estimated.
17
given value of T.15 Since the appropriate number for T is not certain, we estimate the cost of
equity capital using different assumptions of T ranging from 4 to 12. These estimates of R are
highly correlated with each other. Therefore, in the following analysis we use the estimate
assuming T=6, and examine the sensitivity of the results to the assumption of T values in Section
6.2.16
Table 4 provides the descriptive statistics of the estimates of the cost of equity capital and
risk-related firm characteristics. Panel A shows the results of the pooled sample and Panel B
those by economy. For the full sample, the mean (median) cost of equity capital is 9.86%
(7.81%).17 The standard deviation is 7.96% and the inter-quartile range is 6.65%. We also
observe that 90% of the observations are concentrated in the range between 2.35% and 24.73%,
indicating that the distribution of the estimated cost of capital is relatively tight.
[Insert Table 4 here]
15 The solution is derived using a numerical approximation with the Quasi-Newton approach. Botosan and Plumlee (2001) argue that the objective of the cost of capital estimation is not to obtain the exact value of the cost of capital, but to capture the cross-sectional variation of the cost of capital. Thus, if the process does not converge to a solution, we constrain our final estimate to the interval of [0, 0.6]. 16 It is possible that analysts could fail to anticipate the expropriation by majority shareholders in poorly governed firms, thus creating a positive correlation between forecast errors and the level of corporate governance. But this won’t lead to a bias in our estimates of the cost of equity capital as long as the forecasts provide by the I/B/E/S are unbiased estimates of the market’s expectations of future earnings. 17 Compared with the U.S. studies, our estimates of the cost of equity capital seem to be low; but they are still reasonable. GLS (2001) report an average market risk premium of 2% to 3% over 1979 to 1995 using U.S. data. The market premium in Asian emerging markets is supposed to be on average 1% to 2% higher than that in the U.S. Consider a 5% average of the risk-free interest rate. Our cost of capital estimate produces an average premium of about 3% to 5%. Note that most firms in the sample are large firms that should have lower discount rates. Therefore the market premium should be higher than the above number. One possible reason for our low estimates of the cost of equity capital is that we include the period of the Asian financial crisis (1997-1998) in calculating the industry median ROE, when the accounting performance of firms in the Asian markets was very low. However, there is no reason to believe that the low level of industry ROE will bias the estimates of the cost of equity capital between firms with strong and weak corporate governance.

18
4.2 The validity of the cost of equity capital estimates
The CAPM suggests that a valid measure of the cost of equity capital should increase
with the systematic risk measured by the market beta. We also expect it to be negatively
correlated with firm size and positively correlated with the book-to-market ratio (Fama and
French 1992). Thus, we regress our cost of equity capital estimates against the market beta,
firm size, and the book-to-market ratio.18 Since our sample includes firm-year observations
across nine economies over two years, we use within-economy and within-year fractional ranks
of all variables in the regressions to neutralize the difference in country risk premium and the
change over time. A fractional rank is defined as the rank of a given variable divided by the
number of observations having non-missing values for the ranking variable. The results are
reported in Table 5.19
[Insert Table 5 here]
In Table 5, as expected, the cost of equity capital increases with the market beta and the
book-to-market ratio and decreases with firm size. The adjusted R2 of the regression that
includes beta and firm size is 11.89%. This is comparable to the adjusted R2 of 13.7% in the
regression that includes beta and firm size variables reported by Botosan (1997). It is not
surprising that the inclusion of the book-to-market ratio significantly increases the explanatory
power to over 50% since the cost of equity capital is derived from the market-to-book ratio.20
18 We do not examine the association of our measure of the cost of equity capital with all the firm characteristics documented by GLS (2001) that correlated with their cost of equity capital estimates, because our purpose is to investigate the relationship between the cost of equity capital and disclosure and other corporate governance mechanisms, a purpose clearly different from theirs. 19 To adjust for the bias created by heteroskedasticity, the White-adjusted t-statistics are reported in Table 5. In addition, the results using raw data are qualitatively similar. 20 If both sides of equation (6) are divided by Bt, R becomes a determinant of the market-to-book ratio.

19
5. Empirical Analysis
5.1 Univariate analysis
In this section we investigate the empirical relationships between the cost of equity
capital, disclosure, and other corporate governance attributes. The CLSA surveys in 2001 and
2002 measure the governance quality in year 2000 and 2001. Therefore the governance scores
in the 2001 (2002) survey are matched with the cost of equity capital estimated at June 2000
(June 2001). Table 6 presents the Spearman correlations between the cost of equity capital, beta,
firm size, book-to-market, and disclosure as well as corporate governance scores from the CLSA
survey. Consistent with our expectations, Table 6 shows a significant negative correlation
between the cost of equity capital and transparency (TRAN) as well as between the cost of equity
capital and the composite non-disclosure governance score (NDCG). In addition, all individual
non-disclosure governance attributes have a significantly negative correlation with the cost of
equity capital.
[Insert Table 6 here]
We also find that disclosure and corporate governance are correlated with the factors
affecting a firm’s risk. Non-disclosure governance (NDCG) is negatively correlated with Beta
(with a correlation coefficient of -0.28). In addition, larger firms tend to adopt more forthright
disclosure policies: the correlation between firm size and TRAN is 0.08 and is significant at the
5% level. Larger firms also tend to adopt better non-disclosure governance, e.g., firm size is
positively correlated with DSPL, INDP, ACCT, and NDCG. Consistent with the existing
literature (e.g., Claessen et al. 2002; La Porta et al. 2002; Durnev and Kim 2003), corporate
governance has a significant negative correlation with book-to-market ratios.

20
Given the significant correlations between risk-relevant firm characteristics and
disclosure as well as corporate governance, the inference drawn from simple correlations may be
misleading. In the next sections, we investigate the marginal effect of disclosure and other
corporate governance mechanisms by including control variables in the multivariate regressions.
5.2 Effects of firm-level disclosure and corporate governance
The effects of disclosure and other corporate governance mechanisms at firm level on the
cost of equity capital are tested by regressing the estimated cost of equity capital on disclosure
and non-disclosure corporate governance attributes, controlling for market beta and firm size.
That is:
titititititiGovernanceDisclosureMVBetaR ,,4,3,2,10,
εγγγγγ +++++= . (7)
To adjust for the potential non-comparability of the dependent and independent variables
across economies, we use within-economy and within-year fractional ranks for both the
dependent and independent variables in the regressions. Firms with higher corporate
governance or disclosure quality receive higher rankings in the variables. The White-adjusted
t-statistics are used for inferences. The results of three regressions based on equation (7) are
reported in Table 7. The first regression includes only the Disclosure variable (TRAN) and the
last two regressions include both Disclosure and Governance variable(s) as treatment variables.
The result of the first regression indicates that, in emerging markets, disclosure can
reduce the cost of equity capital. The coefficient of transparency scores in the first regression
is –0.12, which is significant at the 1% level. Our second hypothesis is supported by the second
and third regressions. The coefficient of the composite measure of non-disclosure corporate
governance (NDCG) is –0.19, which is significant at the 1% level. In addition, the coefficients

21
of three of the five non-disclosure governance attributes (DSPL, RESP, and FAIR) are negative
and significant at the 10% level or better, when they are included in the same regression. The
null hypothesis that the coefficients of the five non-disclosure governance attributes are jointly
zero is rejected at the 1% level (χ2=35.43).21
[Insert Table 7 here]
These findings suggest that investors pay a premium for firms with good corporate
governance. Specifically, the coefficient of –0.19 of NDCG in the second regression in Table 7
implies that when a firm improves its non-disclosure corporate governance ranking from the 25th
percentile to the 75th percentile, its cost of equity capital can be reduced by approximately 1.26
percentage points [i.e., 0.19 times the range of the cost of capital between the 25th percentile and
the 75th percentile in Panel A of Table 4 (11.60% – 4.95%)] after controlling for beta and size.
The 1.26-point reduction in the cost of capital is equivalent to an increase of more than 20% in
firm value with some reasonable assumptions.22 In summary, investors value better corporate
governance by discounting the expected cash flows with a lower rate. Companies with weak
corporate governance have the potential to enhance shareholder value by strengthening it. On
the other hand, companies that fail to improve their governance mechanisms will have to bear a
higher cost when they try to obtain external capital to finance their growth.
5.3 Effects of country-level legal protection
The results in the above section show the effects of firm-level disclosure and other
21 All five variables are significant when they are included in equation (8) individually with TRAN. 22 This is true when a constant growth model, with the spread between the cost of capital and the growth rate less than 6%, is assumed for the firm at top 25th percentile corporate governance ranking. To show the argument, denote V1 (R1) and V2 (R2) as the value (the cost of capital) for the good and the bad corporate governance firms, respectively. Assume that both companies have the same constant growth rate of g. From the relation of V1/V2 = (R2 – g)/(R1 – g), V1/V2 is larger than 1.21 when R2 – R1 = 1.26% and R1 – g < 6%.

22
corporate governance variables on the cost of equity capital. In addition to firm-level corporate
governance, investors can also rely on country-level legal protection to reduce the risk of being
expropriated by corporate insiders. Previous studies (La Porta et al. 2002) also find that
country-level legal environment variables are positively correlated with firm value measured by
Tobin’s Q. As a result, a country-level legal enforcement variable is added to the regression to
explain the cost of equity capital:23
.,,5,4
,3,210,
tititi
titiiti
GovernanceDisclosure
MVBetaLEGALR
εγγ
γγγγ
+++
+++= (8)
In equation (8) LEGAL is measured as the aggregation of (i) the government corruption
index, (ii) the index of the risk of expropriation of private property by the government, and (iii)
the index of the risk of the government repudiating contracts, in La Porta et al. (1998b) (see
Morck et al. 2000). Since equation (8) involves the comparison of the cost of equity capital
across different economies, we use the within-year, across-economy fractional ranks of all
variables in the regression. The first regression includes TRAN and all five non-disclosure
corporate governance attributes, and the second regression includes TRAN and NDCG. The
results are presented in Table 8.
[Insert Table 8 here]
Consistent with the studies investigating firm value and country-level corporate
governance, the coefficient of LEGAL is significantly negative in both regressions, indicating
that investors pay a premium for the country-level legal protection of private property rights.
23 We considered investigating the effect of LEGAL on the slopes of TRAN and NDCG using interaction terms. However, the results would be difficult to interpret due to the multicollinearity problems: the Pearson correlation coefficient between NDCG and LEGAL*NDCG is 0.74, and that between LEGAL and LEGAL* NDCG is 0.70.

23
The firm-level corporate governance is also important in reducing the cost of equity capital.
The coefficient of NDCG is –0.17, which is still significant at the 1% level. In addition, two of
the five non-disclosure governance attributes (DSPL and INDP) are significant when the five
non-disclosure corporate governance attributes are included simultaneously, and the null
hypothesis that the coefficients on the five attributes are jointly equal to zero is rejected at the 1%
level (χ2=32.15). In contrast, the coefficient of transparency declines to around -0.05, and is
not significant in both regressions, indicating that the country-level legal protection and the
firm-level corporate governance have greater effects on the cost of equity capital than does
disclosure.
5.4 Comparison of the effects of disclosure and corporate governance on the cost of equity capital
Both Tables 7 and 8 show that in Asia’s emerging markets, although disclosure has a
negative effect on the cost of equity capital, the magnitude of the effect is less than that of the
non-disclosure corporate governance mechanisms. Specifically, the second regression in Table
7 shows that the cost of equity capital’s association with TRAN is weaker (slope coefficient
= –0.07) compared with the association with NDCG (slope coefficient = –0.19). The
significance level of TRAN also weakens from the level of 0.01 to only 0.10 when NDCG is
included in the regression model. In comparison to the reduction of 1.26 percentage points in
the cost of equity capital when a firm improves the non-disclosure corporate governance ranking
from the 25th percentile to the 75th percentile, the corresponding reduction from the same
improvement in transparency is only 0.47 point.24 Moreover, in the two regressions in Table 8,
TRAN becomes insignificant when both the LEGAL and non-disclosure corporate governance 24 We recognize that it may not be a fair comparison, since TRAN has only one dimension while NDCG has five. However, in the third regression in Table 7, the coefficient of TRAN (-0.06) is still substantially less than that of DSPL (-0.13), although it is comparable with those of RESP (-0.07) and FAIR (-0.08).

24
variables are included.
We conjecture that the relatively weaker role of disclosure is related to the corporate
governance environments in Asia’s emerging markets. Bushman and Smith (2001) point out
three channels by which financial accounting information can reduce the external financing costs,
namely, identifying good versus bad project, reducing information asymmetry, and disciplining
corporate insiders. A closer examination of how the last two channels function in Asia suggests
a weaker role of disclosure of accounting and other information. The reasons are that the
effectiveness of disclosure in reducing information asymmetry depends on the quality of the
information disclosed and the extent to which investors rely on corporate disclosure, and the
effectiveness of disclosure in disciplining corporate insiders depends on external corporate
governance mechanisms. As explained below, both information quality and external
governance mechanisms are too poor or too weak for disclosure to play an effective role in
Asia’s emerging markets.
As discussed in Section 2.1, because of less effective enforcement and highly
concentrated ownership in Asia’s emerging markets, the accounting information is of lower
quality and credibility. Besides, investors might pay less attention to firm-specific information
because poor legal protection of private property rights discourages them from capitalizing
firm-specific information. Both make disclosure less effective in reducing the estimation risk
and information asymmetry.
The corporate governance function of disclosure is also relatively weak in Asia’s
emerging markets. The strength of this function relies on external governance mechanisms
such as shareholder litigation (Kellogg 1984; Francis et al. 1994; Skinner 1994 and 1997) and
corporate control markets (Palepu 1986). Without them, investors cannot take action to protect
25
themselves even if they detect any irregularities in managerial actions from corporate disclosure.
These mechanisms typically do not function properly in emerging markets like Asia’s (Shleifer
and Vishny 1997). Thus, investors have to rely on internal corporate governance mechanisms
to protect themselves from being expropriated by corporate insiders. This suggests that
disclosure is less helpful in monitoring corporate insiders in Asia’s emerging markets. As a
result, disclosure is less effective than internal corporate governance mechanisms in reducing the
cost of equity capital in emerging markets.
6. Sensitivity Tests
6.1 Results by year and by economy
We perform further tests to determine whether or not the effect of governance on the cost
of capital clusters in time or economies. Table 9 presents the year-by-year and
economy-by-economy results of regression (7) separately. The coefficient of NDCG is
significantly negative in both 2000 and 2001. However, the coefficient of TRAN is not significant
in either year. Table 9 also shows that the coefficients of NDCG are significantly negative in
seven out of the nine economies in our sample. Interestingly, among them, the economies most
affected by the 1997 Asian financial crisis, namely Thailand, the Philippines, and Indonesia, with
the exception of Korea, have the most significant effect in reducing the cost of capital by
improving corporate governance. More specifically, Thailand has the highest negative
coefficient (-0.68) of NDCG, followed by the Philippines (-0.51) and Indonesia (-0.41). These
coefficients roughly translate into a corresponding reduction in the cost of equity capital by
4.97%, 3.00%, and 2.44%, respectively, if a firm improves its non-disclosure corporate
governance ranking within their economy from the 25th percentile to the 75th percentile. In
contrast, the coefficient of TRAN is significantly negative only in the Indian sample. The
26
conclusion to be drawn from the year-by-year and economy-by-economy results suggests that the
effects of disclosure and non-disclosure governance mechanisms are not concentrated in any
given year or economy.
[Insert Table 9 here]
6.2 Effects of book-to-market and reversal time in estimating the cost of equity capital
Prior studies (La Porta et al. 2002; Claessens et al. 2002) find that legal protection and
expropriation risk affect Tobin’s Q, which is highly correlated with book-to-market ratios. In
addition, GLS (2001) and our results in Section 4.2 also indicate that the book-to-market ratio is
positively correlated with the estimate of the cost of equity capital. It is likely that the negative
correlation between corporate governance and the cost of equity capital is induced by the
book-to-market ratio.
To address this issue, we include the book-to-market ratio in the regressions of the cost of
equity capital against disclosure and non-disclosure governance mechanisms. The results (not
reported) show that the conclusions in Section 5.3 are not qualitatively affected. That is, the
coefficient of NDCG is still significantly negative, but at a lower level, and the coefficient of
TRAN is not significant.
In estimating the cost of equity capital, we assume that the ROE declines to the industry
level by the end of the 6th year (T=6). To test whether our results are sensitive to the
assumption of T, we recalculate the cost of equity capital assuming T=4 to T=12 and use each
estimate as the dependent variable in regression (7). The results (not reported here) in these
regressions are qualitatively the same as those reported in Table 7. Specifically, the coefficient
of NDCG is significantly negative, while the coefficient of TRAN is either insignificant or

27
marginally significant.
7. Conclusions
We examine the effects of disclosure and other corporate governance mechanisms on the
cost of equity capital using two newly released surveys by CLSA on the quality of disclosure and
corporate governance. The sample covers 545 firm-year observations across nine Asia’s
emerging markets in 2000 and 2001. The regression results show that a higher score on
disclosure and a higher score on non-disclosure corporate governance mechanisms are associated
with a lower cost of equity capital, after controlling for factors such as beta and firm size.
Furthermore, we find that country-level legal protection of private property rights and firm-level
corporate governance are both important in reducing the cost of equity capital. The findings
highlight an important link between corporate governance at both the firm level and the country
level and the cost of capital. We also find that the negative association between disclosure and
the cost of equity capital is weaker when non-disclosure governance mechanisms are included in
the regressions. Our results are robust to the inclusion of book-to-market ratios and to the
duration in reverting the ROE to the industry mean in estimating the cost of equity capital.
Our study contributes to the literature on disclosure. We find that the negative
correlation between disclosure and the cost of equity capital documented in the U.S. (Botosan,
1997; Botoan and Plumlee 2002) can be extended to emerging markets. However, in emerging
markets, the negative relation between disclosure and the cost of equity capital is weaker after
controlling for other corporate governance mechanisms. Our result suggests that, in emerging
markets where the infrastructure factors, such as the legal protection of investors, are lacking, the
role of disclosure in reducing the cost of equity capital is not as important as other non-disclosure
28
corporate governance mechanisms. Hence, reducing the expropriation risk by strengthening the
overall corporate governance mechanisms appears to be more important than adopting a more
forthright disclosure policy to reduce the cost of equity capital.
Our study also contributes to the corporate governance literature. This paper suggests
that the risk of being expropriated by insiders is not diversifiable. Thus, investors not only
expect lower future cash flows for weak governance firms, as documented in prior research (La
Porta et al. 2002), they also discount the expected future cash flows at a higher rate. This
finding is important, since a firm’s cost of capital is a more direct measure of financing cost than
firm valuation. Based on our rough estimation, if a firm improves its corporate governance
ranking from the 25th percentile to the 75th percentile within its economy, its cost of capital
equity can be reduced by 1.26 percentage points. This is equivalent to an improvement of firm
value by more than 20% given some reasonable assumptions. The benefit from the
improvement in corporate governance is even more profound for economies that were affected
the most during the Asian financial crisis, namely Thailand, the Philippines, and Indonesia, with
the exception of Korea. Thus, this research provides more evidence in support of strengthening
corporate governance in Asia’s emerging markets.
29
References Ball, R., A. Robin, and J. Wu, 2003, “Incentives versus standards: properties of accounting income in four
East Asian countries,” Forthcoming, Journal of Accounting and Economics.
Barry, C., and S. Brown, 1985, “Differential information and security market equilibrium,” Journal of Financial and Quantitative Analysis 20, 407-422.
Black, B., H. Jang, and W. Kim, 2003, “Does corporate governance affect firm’s market values? Evidence from Korea,” Working paper, Stanford Law School.
Botosan, C., 1997, “Disclosure level on the cost of equity capital,” Accounting Review 72, 323-349.
Botosan, C., and M. Plumlee, 2001, “Estimating expected cost of equity capital: a theory-based approach,” Working paper, University of Utah.
Botosan, C., and M. Plumlee, 2002, “A re-examination of disclosure level and the expected cost of equity capital,” Journal of Accounting Research 40, 21-40.
Brennan, M., and A. Subrahmanyam, 1996, “Market microstructure and asset pricing: on the compensation for illiquidity in stock returns,” Journal of Financial Economics 41: 441-64.
Brooker, M., 2001, “Holy Grail still just out of reach.” South China Morning Post (April 18, 2001).
Bushman, R.M., and A.J. Smith, 2001, “Financial accounting information and corporate governance,” Journal of Accounting and Economics 32: 237-334.
Claessens, S., S. Djankov, J.P.H. Fan, and L.H.P. Lang, 2002, “Disentangling the incentive and entrenchment effects of large shareholdings,” Journal of Finance 57, 2741-2771.
Clarkson, P., J. Guedes, and R. Thompson, 1996, “On the diversification, observability, and measurement of estimation risk,” Journal of Financial and Quantitative Analysis 31, 69-84.
Coles, J., U. Loewenstein, and J. Suay, 1995, “On equilibrium pricing under parameter uncertainty,” Journal of Financial and Quantitative Analysis September, 347-364.
Coombes, P., and M. Watson, 2000, “Three surveys on corporate governance,” The McKinsey Quarterly 2000 number 4: Asia revalued.
Core, J.E., 2001, “A review of the empirical disclosure literature: discussion,” Journal of Accounting and Economics 31, 441-456.
Credit Lyonnais Securities Asia (CLSA), 2001, Saints & Sinners: Who’s Got Religion?
Credit Lyonnais Securities Asia (CLSA), 2002, Make me Holy…But Not Yet!
Diamond, D., and R. Verrecchia, 1991, “Disclosure, liquidity, and the cost of capital,” Journal of Finance 66, 1325-1355.
Domowitz, I., J. Glen, and A. Madhavan, 2000, “Liquidity, Volatility, and Equity Trading Costs Across Countries and Over Time,” Working paper, Pennsylvania State University and University of South California.
Drobetz, W., A. Schillhofer, and H. Zimmermann, 2003, “Corporate governance and expected stock returns: Evidence from Germany,” Working paper, European Corporate Governance Institute.
Durnev, A., and E.H. Kim, 2003, “To steal or not to steal: firm attributes, legal environment, and valuation,” Working paper, University of Michigan Business School.
Elton, E.J., 1999, “Expected return, realized return, and asset pricing tests,” Journal of Finance 54, 1199-1220.

30
Fama, E., and K. French, 1992, “The cross-section of expected stock returns,” Journal of Finance 47, 427-465.
Fama, E., and K. French, 1997, “Industry costs of equity,” Journal of Financial Economics 43, 153-193.
Fan, J.P.H., and T.J. Wong, 2002, “Corporate ownership structure and the informativeness of accounting earnings in East Asia,” Journal of Accounting and Economics 33, 401-425.
Francis, J., D. Philbrick, and K. Schipper, 1994, “Shareholder litigation and corporate disclosure,” Journal of Accounting Research 32: 137-64.
Gebhardt, W.R., C.M.C. Lee, and B. Swaminathan, 2001, “Toward an implied cost of capital,” Journal of Accounting Research 39, 135-176.
Glosten, L., and P. Milgrom, 1985, “Bid, ask, and transaction prices in a specialist market with heterogeneously informed traders,” Journal of Financial Economics 26, 71-100.
Gompers, P., J. Ishii, and A. Metrick, 2003, “Corporate governance and equity prices,” Quarterly Journal of Economics 118, 107-155.
Handa, P., and S. Linn, 1993, “Arbitrage pricing with estimation risk,” Journal of Financial Economics 81-100.
Healy, P., A. Hutton, and K. Palepu, 1999, “Stock performance and intermediation changes surrounding increases in disclosure,” Contemporary Accounting Research 16, 485-520.
Himmelberg, Charles, R. Glenn Hubbard, and Inessa Love, 2002, “Investor protection, ownership, and the cost of capital,” Working paper, Columbia University.
Hope, O.K, 2003, “Disclosure practices, enforcement of accounting standards, and analysts’ forecast accuracy: an international study,” Journal of Accounting Research 41: 234-72.
Johnson, S., P. Boone, A. Breach, and E. Friedman, 2000, “ Corporate governance in the Asian financial crisis,” Journal of Financial Economics 58, 141-186.
Kellog, R.L., 1984, “Accounting activities, security prices, and class action lawsuits,” Journal of Accounting and Economics 185-204.
Khanna, T., J. Kogan, and K. Palepu, 2002, “Globalization and corporate governance convergence? A cross-country analysis,” Working paper, Harvard Business School.
La Porta, R., F. Lopez-De-Silanes, and A. Shleifer, 1999, “Corporate ownership around the world,” Journal of Finance 54, 471-518.
La Porta, R., F. Lopez-de-Silanes, A. Shleifer, and R. Vishny, 1998a, “Law and finance,” Journal of Political Economy 106, 1113-1155.
__________, 1998b, “The quality of government,” Working paper, National Bureau of Economic Research.
__________, 2000, “Investor protection and corporate governance,” Journal of Financial Economics 58, 3-27.
__________, 2002, “Investor protection and corporate valuation,” Journal of Finance 57, 1147-1170.
Lang, M., and R. Lundholm, 1996, “Corporate disclosure policy and analyst behavior,” Accounting Review 71, 467-492.
Lemmon, M. and K. Lins, 2001, “Ownership structure, corporate governance, and firm value: evidence from the East Asian financial crisis,” Working paper, University of Utah.
Leuz, C., D. Nanda, and P. Wysocki, 2003, “Earnings management and investor protection: an
31
international comparison,” Forthcoming, Journal of Financial Economics.
Lombardo, D., and M. Pagano, 2000a, “Legal determinants of the return on equity,” Working paper, Stanford Law School and University of Salerno.
Lombardo, D., and M. Pagano, 2000b, “Law and equity markets: a simple model,” Working paper, Stanford Law School and University of Salerno.
Merton, R., 1987 “Presidential address: A simple model of capital market equilibrium with incomplete information,” Journal of Finance 42, 483-510
Mitton, T., 2002, “A cross-firm analysis of the impact of corporate governance on the East Asian financial crisis,” Journal of Financial Economics 64, 215-241.
Morck, R., B. Yeung, and W. Yu, 2000, “The information content of stock markets: why do emerging markets have synchronous stock price movements?” Journal of Financial Economics 58, 215-260.
Ohlson, J.A., 1995, “Earnings, Book Values, and Dividends in Equity Valuation.” Contemporary Accounting Research (Spring): 661-687.
Palepu, K., 1986, “Predicting takeover targets: a methodological and empirical analysis,” Journal of Accounting and Economics 8: 3-36.
Sengupta, P., 1998 “Corporate disclosure quality and the cost of debt,” Accounting Review 73, 459-474
Shleifer, A., and R. Vishny, 1997, “A survey of corporate governance,” Journal of Finance 52, 737-783.
Shleifer, A., and D. Wolfenzon, 2002, “Investor protection and equity markets,” Journal of Financial Economics 66, 3-27.
Skinner, D., 1994, “Why firms voluntarily disclose bad news,” Journal of Accounting Research 32: 38-61.
Skinner, D., 1997, “Earnings disclosures and stockholder lawsuits,” Journal of Accounting and Economics 23: 249-83.
Standard & Poor’s, Transparency and Disclosure: Overview of Methodology and Study Results -- United States, (October 16, 2002).
Welker, M., 1995, “Disclosure policy, information asymmetry, and liquidity in equity markets,” Contemporary Accounting Research 11, 801-827.
32
Appendix
CLSA Corporate Governance Attributes
Governance Attribute CLSA explanation Disclosure Attribute
Transparency (TRAN)
The ability of outsiders to assess the true position of a company. (1) Disclosure of financial targets, e.g., three- and five-year ROA/ROE. (2) Timely release of Annual Report. (3) Timely release of semi-annual financial announcements. (4) Timely release of quarterly results. (5) Prompt disclosure of results with no leakage ahead of announcement. (6) Clear and informative results disclosure. (7) Accounts presented according to IGAAP. (8) Prompt disclosure of market-sensitive information. (9) Accessibility of investors to senior management. (10) Website where announcements are updated promptly
Non-disclosure Attribute
Discipline (DISC)
Public commitment to CG and financial discipline. (1) Explicit public statement placing priority on CG. (2) Management incentivised towards a higher share price. (3) Sticking to clearly defined core businesses. (4) Having an appropriate estimate of cost of equity. (5) Having an appropriate estimate of cost of capital. (6) Conservatism in issuance of equity or dilutive instruments. (7) Ensuring debt is manageable, used only for projects with adequate returns. (8) Returning excess cash to shareholders. (9) Discussion in Annual Report on CG.
Independence (INDP)
Board is independent of controlling shareholders and is separate from senior management. (1) Board and senior management treatment of shareholders. (2) Chairman who is independent from management. (3) Executive management committee comprised differently from the board. (4) Audit committee chaired by independent director. (5) Remuneration committee chaired by independent director. (6) Nominating committee chaired by independent director. (7) External auditors unrelated to the company. (8) No representatives of banks or other large creditors on the board.
Accountability (ACCT)
Proper accountability of management to the Board. (1) Board plays a supervisory rather than executive role. (2) Non-executive directors demonstrably independent. (3) Independent, non-executive directors constitute at least half of the board. (4) Foreign nationals presence on the board. (5) Full board meetings at least every quarter. (6) Board members able to exercise effective scrutiny. (7) Audit committee that nominates and reviews work of external auditors. (8) Audit committee that supervises internal audit and accounting procedures.
Responsibility (RESP)
Record of taking measures in case of mismanagement (1) Acting effectively against individuals who have transgressed. (2) Record of taking measures in cases of mismanagement. (3) Measures to protect minority interests. (4) Mechanisms to allow punishment of executive/management committee. (5) Share trading by board members fair and fully transparent. (6) Board small enough to be efficient and effective.
Fairness (FAIR)
Treatment of minorities: (1) Majority shareholders treatment of minority shareholders. (2) All equity holders having right to call general meetings. (3) Voting methods easily accessible (e.g., through proxy voting). (4) Quality of information provided for general meetings. (5) Guiding market expectations on fundamentals. (6) Issuance of ADRs or placement of shares fair to all shareholders. (7) Controlling shareholder group owning less than 40% of company. (8) Portfolio investors owning at least 20% of voting shares. (9) Priority given to investor relations.
10) Total board remuneration rising no faster than net profits. Other Attribute
Social Labor and environmental issues:

33
Awareness (SOCL)
(1) Explicit policy emphasizing strict ethical behavior. (2) Not employing the under-aged. (3) Explicit equal employment policy. (4) Adherence to specified industry guidelines on sourcing of materials. (5) Explicit policy on environmental responsibility. (6) Abstaining from countries where leaders lack legitimacy (e.g., Myanmar).

34
TABLE 1 Sample Distribution
This table provides the distribution of the sample of 270 and 275 firm-year observations across nine Asian Economies in 2000 and 2001. The “2000” (“2001”) sample is derived from the CLSA survey published in 2001 (2002). Firm-year observations in the final sample are less than those in the original surveys because data necessary to construct the cost of equity capital estimates are not always available. Number of Firms in the CLSA surveys and the final sample
“2000” Sample “2001” Sample
Economy Covered in 2001 CLSA Survey
Included in sample
Included in 2002 CLSA Survey
Included in sample
Hong Kong 63 39 86 53
India 80 60 69 54
Indonesia 18 15 18 13
Korea 24 19 28 19
Malaysia 47 42 46 42
Philippines 20 19 13 12
Singapore 43 33 43 35
Thailand 20 10 21 12
Taiwan 44 33 49 35
Total 362 270 373 275

35
TABLE 2 Descriptive Statistics
This table provides the descriptive statistics for our sample. The pooled sample covers 545 firm-year observations across nine Asia’s economies in 2000 and 2001. TRAN, DSPL, INDP, ACCT, RESP, and FAIR are the firm’s governance scores for Transparency, Discipline, Independence, Accountability, Responsibility, and Fairness in the CLSA survey. NDCG is the equal-weighted average of all these individual attributes except TRAN. Panel A presents statistics for the pooled sample and Panel B presents the mean (median) values of variables for each of the nine economies. Panel A: The Pooled Sample
Percentile Variable N Mean Standard
Deviation Minimum 5% 25% 50% 75% 95%
Maximum
TRAN 545 60.23 18.45 10.00 30.00 50.00 60.00 70.00 90.00 100.00 DSPL 545 52.30 20.58 0.00 22.20 33.30 55.60 66.70 88.90 100.00 INDP 545 59.22 26.45 7.10 14.30 28.60 71.40 78.60 92.90 100.00 ACCT 545 47.91 21.41 0.00 12.50 37.50 50.00 62.50 87.50 100.00 RESP 545 50.29 20.45 0.00 16.70 33.30 50.00 66.70 83.30 100.00 FAIR 545 68.64 25.12 5.60 22.20 44.40 77.80 88.90 100.00 100.00 NDCG 545 55.67 14.76 10.12 28.50 46.30 56.22 66.08 77.92 93.32 Panel B: The Economy-by-Economy Results Variable Hong Kong India Indonesia Korea Malaysia Philippines Singapore Thailand Taiwan TRAN 63.37 49.21 56.43 65.26 67.26 47.66 63.82 65.45 65.00 (70.00) (50.00) (60.00) (60.00) (70.00) (40.00) (60.00) (60.00) (70.00) DSPL 45.89 61.81 39.25 40.92 54.77 43.01 59.65 38.12 55.24 (44.40) (66.70) (38.65) (33.30) (55.60) (44.40) (55.60) (33.30) (55.60) INDP 56.98 57.34 27.23 38.72 68.37 44.69 77.52 49.97 70.06 (64.30) (71.40) (25.00) (35.70) (78.60) (28.60) (78.60) (50.00) (75.00) ACCT 48.10 56.25 21.43 59.21 40.92 40.56 44.85 67.66 46.88 (50.00) (62.50) (25.00) (62.50) (37.50) (40.00) (37.50) (68.75) (50.00) RESP 57.97 46.05 37.49 35.96 54.97 40.64 68.63 53.77 39.47 (50.00) (50.00) (33.30) (33.30) (58.35) (33.30) (66.70) (66.60) (50.00) FAIR 76.44 73.92 55.16 53.65 72.35 41.58 78.33 75.50 59.00 (83.30) (83.30) (50.00) (44.40) (83.30) (33.30) (83.30) (80.00) (60.00) NDCG 57.08 59.07 36.11 45.69 58.28 42.10 65.80 57.00 54.13 (61.06) (57.65) (36.58) (43.88) (60.06) (40.06) (65.60) (54.43) (53.74)

36
TABLE 3 The Spearman Correlations among the CLSA Governance Attributes
This table provides the Spearman correlation coefficients of the disclosure and governance ratings provided by the CLSA. TRAN, DSPL, INDP, ACCT, RESP, FAIR are the scores for Transparency, Discipline, Independence, Accountability, Responsibility, and Fairness in the CLSA survey. NDCG is the equal-weighted average of scores of all the above attributes except for TRAN. All variables have been converted into within economy/year fractional ranks. In parentheses are the p-values for which the null hypothesis that the correlation coefficient is zero is rejected. TRAN DSPL INDP ACCT RESP FAIR DSPL 0.18 (0.00) INDP 0.24 0.37 (0.00) (0.00) ACCT 0.19 0.28 0.14 (0.00) (0.00) (0.00) RESP 0.18 0.22 0.36 0.07 (0.00) (0.00) (0.00) (0.09) FAIR 0.19 0.29 0.37 0.06 0.39 (0.00) (0.00) (0.00) (0.13) (0.00) NDCG 0.28 0.63 0.73 0.45 0.63 0.66 (0.00) (0.00) (0.00) (0.00) (0.00) (0.00)

37
TABLE 4 Descriptive Statistics for the Cost of Equity Capital Estimates and Risk-Related Firm Characteristics
Panel A provides the descriptive statistics for the cost of equity capital and the risk-related firm characteristics for the pooled sample. R is the estimated cost of equity capital in percent, which is estimated by adopting the GLS (2001) approach and assuming that a firm’s ROE declines to the industry level by the next 6th year. Beta is the market beta estimated by Datastream, MV is the market capitalization in billions of U.S. dollars, and B/M is the ratio of book equity to market capitalization Panel B presents the descriptive statistics for the cost of equity capital estimates by economy. Panel A: Descriptive statistics for the cost of equity capital estimates (T=6) and the risk relevant firm characteristics for the pooled sample
Percentile Variable N Mean Standard
deviation Minimum 5% 25% 50% 75% 95%
Maximum
R 545 9.86 7.96 0.24 2.35 4.95 7.81 11.60 24.73 60.00 Beta 545 0.94 0.32 0.06 0.36 0.75 0.95 1.13 1.45 1.81 MV 545 3.44 9.92 0.02 0.14 0.44 0.93 2.56 12.44 120.88 B/M 545 0.75 0.94 0.01 0.09 0.27 0.55 0.93 2.04 12.50 Panel B: Descriptive Statistics for the cost of equity capital estimates (T=6) by economy
Percentile Economy N Mean Standard
deviation Minimum 5% 25% 50% 75% 95%
Maximum
Hong Kong 92 10.06 8.24 0.49 1.66 4.75 7.24 12.51 28.04 37.60 India 114 15.94 12.36 1.30 2.43 6.31 13.52 21.82 39.85 60.00 Indonesia 28 10.68 4.15 2.52 4.94 7.69 10.70 13.63 16.30 20.74 Korea 38 9.06 4.26 1.29 1.84 6.67 8.97 11.48 17.35 18.29 Malaysia 84 7.68 2.89 1.03 3.75 5.64 7.57 9.84 12.13 18.29 Philippines 31 6.91 4.66 0.24 1.14 3.85 4.56 9.73 17.35 17.73 Singapore 68 6.92 3.30 0.53 2.37 4.45 6.30 9.16 12.29 16.85 Thailand 22 11.51 5.98 3.30 4.73 7.84 9.44 15.15 23.23 27.19 Taiwan 68 5.96 2.50 1.91 2.23 4.21 5.61 7.27 10.93 14.04

38
TABLE 5 The OLS Regressions of the Cost of Equity Capital on the Measures of Firm Risk
This table provides the results of the OLS regression of the cost of equity capital on beta, firm size, and book-to-market equity. Cost of equity capital is estimated by adopting GLS (2001) and assuming a firm’s ROE declines to the industry median by the 6th year. Betai,t is the most current market beta from Datastream. MVi,t is the market value of equity (in millions of U.S. dollars) measured at the end of June of year t, B/Mi,t is the book-to-market ratio measured at the end of the previous calendar year. All variables are converted into within-economy/year fractional ranks. The sample covers 545 firm-year observations. The White-adjusted t-statistics are in parentheses. *, **, and *** indicate the significance level at 10%, 5%, and 1%.
Intercept
Beta
Log (MV)
Log(B/M)
Adj. R2(%)
43.69*** 0.15*** 2.22 (17.18) (3.57)
67.80*** -0.31*** 9.56
(27.95) (-8.00)
14.87*** 0.71*** 49.79 (8.83) (24.60)
59.73*** 0.16*** -0.31*** 11.89
(18.87) (3.84) (-8.08)
18.07*** 0.07** -0.10*** 0.67*** 51.66 (6.03) (2.42) (-2.87) (22.03)
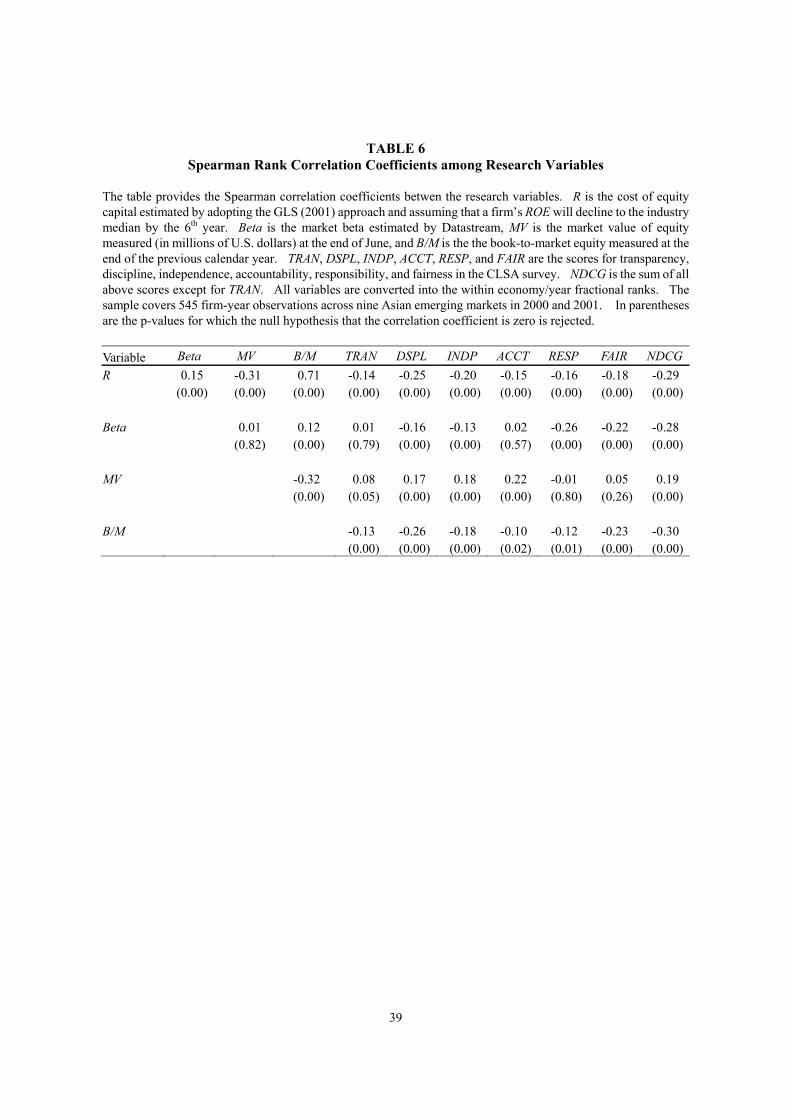
39
TABLE 6 Spearman Rank Correlation Coefficients among Research Variables
The table provides the Spearman correlation coefficients betwen the research variables. R is the cost of equity capital estimated by adopting the GLS (2001) approach and assuming that a firm’s ROE will decline to the industry median by the 6th year. Beta is the market beta estimated by Datastream, MV is the market value of equity measured (in millions of U.S. dollars) at the end of June, and B/M is the the book-to-market equity measured at the end of the previous calendar year. TRAN, DSPL, INDP, ACCT, RESP, and FAIR are the scores for transparency, discipline, independence, accountability, responsibility, and fairness in the CLSA survey. NDCG is the sum of all above scores except for TRAN. All variables are converted into the within economy/year fractional ranks. The sample covers 545 firm-year observations across nine Asian emerging markets in 2000 and 2001. In parentheses are the p-values for which the null hypothesis that the correlation coefficient is zero is rejected. Variable Beta MV B/M TRAN DSPL INDP ACCT RESP FAIR NDCG R 0.15 -0.31 0.71 -0.14 -0.25 -0.20 -0.15 -0.16 -0.18 -0.29 (0.00) (0.00) (0.00) (0.00) (0.00) (0.00) (0.00) (0.00) (0.00) (0.00) Beta 0.01 0.12 0.01 -0.16 -0.13 0.02 -0.26 -0.22 -0.28 (0.82) (0.00) (0.79) (0.00) (0.00) (0.57) (0.00) (0.00) (0.00) MV -0.32 0.08 0.17 0.18 0.22 -0.01 0.05 0.19 (0.00) (0.05) (0.00) (0.00) (0.00) (0.80) (0.26) (0.00) B/M -0.13 -0.26 -0.18 -0.10 -0.12 -0.23 -0.30 (0.00) (0.00) (0.00) (0.02) (0.01) (0.00) (0.00)

40
TABLE 7 OLS Regressions of the Cost of Equity Capital on Beta, Size, the CLSA Transparency,
and the CLSA non-Disclosure Governance Attributes This table presents the results of the OLS regressions of the cost of equity capital on beta, firm size, transparency, and non-disclosure governance mechanisms. Beta is the market beta estimated by Datastream, MV is the market value of equity measured (in millions of US dollars) at the end of each June. TRAN is the score for transparency in the CLSA survey. DSPL, INDP, ACCT, RESP, and FAIR are the scores for discipline, independence, accountability, responsibility, and fairness in the CLSA survey. NDCG is the equal-weighted average of all the above attributes. All variables are converted into the within-economy/year fractional ranks. The sample covers 545 firm year observations across nine Asia’s economies in year 2000 and 2001. White-adjusted t-statistics are in parentheses. ***, **, and * indicate 1%, 5%, and 10% significance in a two-tailed t-test.
Intercept
Beta
MV
TRAN
DSPL
INDP
ACCT
RESP
FAIR
NDCG
Adj. R2 (%)
66.38*** 0.16*** -0.31*** -0.12*** 13.11 (17.33) (3.90) (-7.99) (-2.89)
74.82*** 0.11** -0.27*** -0.07* -0.19*** 16.13
(17.43) (2.46) (-6.99) (-1.79) (-4.74)
85.27*** 0.10** -0.27*** -0.06 -0.13*** -0.03 -0.04 -0.07* -0.08* 16.32 (14.96) (2.29) (-6.95) (-1.56) (-2.89) (-0.74) (-0.80) (-1.71) (-1.88)

41
TABLE 8 OLS Regressions of the Cost of Equity Capital on Legal Protection, Beta, Size, Transparency, and non-Disclosure Governance
Attributes This table reports the results of the OLS regressions of the cost of equity capital on the legal protection of investors, beta, firm size, transparency, and non-disclosure governance mechanisms. LEGAL is the sum of the index of government corruption, the index of expropriation risk by government, and the index of contract repudiation by government. Beta is market beta estimated by Datastream, MV is the market value of equity measured (in million US dollars) at the end of each June. TRAN is the score for transparency in the CLSA survey. DSPL, INDP, ACCT, RESP, and FAIR are the scores for discipline, independence, accountability, responsibility, and fairness in the CLSA survey. NDCG is the equal-weighted average of the above five attributes. All variables are converted into the within-year fractional ranks. The sample covers 545 firm-year observations across nine Asian economies in 2000 and 2001. The White-adjusted t-statistics are in parentheses. ***, **, and * indicate 1%, 5%, and 10% significance levels in a two-tailed t-test.
Intercept
LEGAL
Beta MV TRAN DSPL INDP ACCT RESP FAIR NDCG Adj.R2(%)
88.03*** -1.14** 0.01 -0.35*** -0.05 -0.10** -0.13*** 0.06 -0.06 0.03 21.7 (18.19) (-2.05) (0.35) (-8.85) (-1.20) (-2.19) (-2.76) (1.34) (-1.42) (0.64)
85.47*** -1.28** 0.00 -0.35*** -0.04 -0.17*** 21.02
(20.42) (-2.42) (0.09) (-9.00) (-1.02) (-4.22)

42
TABLE 9 OLS Regressions of the Cost of Equity Capital on Beta, Size, and the CLSA Transparency and
non-Disclosure Governance Attributes: By Year and by Economy
This table provides the results of the OLS regressions of the cost of equity capital on beta, firm size, transparency, and non-disclosure governance mechanisms by year and by economy. Beta is the market beta estimated by Datastream, MV is the market value of equity (in millions of U.S. dollars) measured at the end of each June. TRAN is the score for transparency in the CLSA survey. NDCG is the equal-weighted average of DSPL, INDP, ACCT, RESP, and FAIR in the CLSA survey, where DSPL, INDP, ACCT, RESP, and FAIR are the scores for discipline, independence, accountability, responsibility, and fairness in the CLSA survey. All variables are converted into the within-economy/year fractional ranks. The White-adjusted t-statistics are in parentheses. ***, **, and * indicate 1%, 5%, and 10% significance levels in a two-tailed t-test.
Intercept
Beta Log(MV) TRAN NDCG Adj. R2(%) N
2000 83.81*** 0.01 -0.28*** -0.09 -0.24*** 15.95 270 (13.38) (0.14) (-5.18) (-1.57) (-4.13) 2001 67.50*** 0.19*** -0.26*** -0.06 -0.16*** 16.82 275 (11.91) (3.30) (-4.73) (-1.09) (-2.91) Hong Kong 85.15*** 0.09 -0.46*** -0.03 -0.26*** 33.75 92 (9.64) (0.93) (-5.78) (-0.33) (-2.69) India 85.00*** 0.11 -0.30*** -0.23*** -0.21** 23.40 114 (10.22) (1.23) (-3.39) (-2.74) (-2.20) Indonesia 33.34 0.21 0.42*** 0.12 -0.41** 7.90 28 (1.52) (1.21) (2.64) (0.80) (-2.14) Korea 71.00*** 0.01 -0.31* -0.10 0.07 2.64 38 (3.43) (0.03) (-1.67) (-0.50) (0.35) Malaysia 67.53*** 0.10 -0.18* -0.13 -0.08 2.01 84 (5.14) (0.89) (-1.82) (-1.01) (-0.75) Philippines 112.05*** -0.32* -0.26 0.00 -0.51*** 20.18 31 (7.86) (-1.78) (-1.48) (-0.02) (-3.18) Singapore 84.34*** 0.18** -0.43*** 0.01 -0.40*** 47.74 68 (10.71) (1.97) (-4.66) (0.11) (-5.01) Thailand 122.90*** -0.69*** 0.11 0.01 -0.68*** 21.09 22 (4.03) (-3.03) (0.48) (0.05) (-2.68) Taiwan 40.92*** 0.33** -0.08 0.15 -0.21* 11.97 68 (4.07) (2.39) (-0.68) (1.50) (-1.78)