disclosure report 2015 - the climate group · disclosure report 2015 ... a new global agreement on...
TRANSCRIPT

founding partners: supported by:
Disclosure report 2015the first global account of climate action from leading states, provinces and regions
Data powereD bybrought to you by

2 CompaCt of states and regions | disClosure report 20151CompaCt of states and regions | disClosure report 2015
ForeworD
reporting governments at a glance
1. tackling climate change region by region
driving Climate aCtion through the CompaCt of states and regions
a year of Change
2. state anD regional climate pleDges
greenhouse gas emission reduCtion targets
greenhouse gas emissions savings
progress toward greenhouse gas reduCtion targets
renewable energy targets
renewable power trends to date
energy effiCienCy targets
3. climate risk anD aDaptation
physiCal, soCial and eConomiC risk
adaptation plans and aCtion
4. beyonD a paris climate Deal: opportunities For low carbon growth
the eConomiC rewards of effeCtive Climate aCtion
leading a low Carbon future
list oF Figures
list oF tables
acknowleDgements
2
3
6
6
8
12
12
17
19
21
24
25
30
30
32
34
36
38
39
39
40
a new global agreement on climate change will be adopted in paris in december 2015. unprecedented climate action at all levels of government and in the community over the past years has led to us being in this position where we can secure a more prosperous, sustainable and equitable world.
it has been a privilege for Québec, basque Country and south australia to lead state and regional governments as part of this global effort on climate change.
our Compact of states and regions brings together the contributions of 44 sub-national governments from around the world. together we represent more than 325 million citizens and one eighth of the global economy. through the Compact, hundreds of individual climate commitments and actions have been put forward from governments.
these governments include states that rival some of the largest and most industrialized nations in the world, as well as rural areas and territories already heavily affected by climate change.
we all have different local circumstances and challenges to address, but through the Compact we demonstrate our collective commitment to climate action.
as state and regional governments, we have responsibility for key policy levers in the delivery of both climate change mitigation and adaptation. through the implementation of our policies, the administration of our budgets and the legislation we pass, we provide a bridge between both international and national objectives, and delivery at the city and local government levels.
and our leadership is needed now more than ever. we know the national climate plans submitted ahead of the paris talks – the intended nationally determined Contributions (indCs) – are not sufficient to limit global temperature rise to below two degrees Celsius. but states, provinces and regions can support this global effort by raising our own levels of ambition.
for many years, we have been at the forefront of climate leadership by setting ambitious climate and clean energy targets, and developing new and innovative policy responses. through the Compact of states and regions, we demonstrate the breadth of our collective commitments and scale of our potential impact.
many of us already have bold near term targets by 2020. but it is crucial we raise ambition before any new paris climate deal comes into force. the Compact will help us achieve this by providing an annual assessment of progress made toward our climate commitments and emission reduction targets.
and this is just the beginning. through the public disclosure of our mitigation and adaptation actions, we can measure and manage our achievements within our local and regional contexts. we will also provide a global overview of the trends, challenges and opportunities for collaboration across nations and regions.
our vision is that all governments in all parts of the world have access to high quality information, so that we can effectively manage our individual and collective responses to the global climate challenge.
on behalf of all Compact governments, we invite our state and regional counterparts around the world to join us and report to the Compact of states and regions in 2016 and far beyond – to secure a smarter, cleaner, safer future for all.
philippe couillard, premier of Québeciñigo urkullu, president of the basque Country Jay weatherill, premier of south australia
ForeworD contents
4 CompaCt of states and regions | disClosure report 20153CompaCt of states and regions | disClosure report 2015
renewableelectricity
state or regional government
Country head of government land area (km2) population gdp (us$)
Alberta Canada Premier Rachel Notley 661,848 4,175,409 328,000,000,000
Aquitaine France President Alain Rousset 41,300 3,303,000 101,534,850,000
Australian Capital Territory
Australia Chief Minister Andrew Barr 2,358 385,996 27,448,000,000
Baden-Württemberg Germany Minister-President Winfried Kretschmann
36,000 10,500,000 450,000,000,000
Basque Country Spain President Iñigo Urkullu 7,234 2,172,877 71,815,577,650
Bavaria Germany Minister-President Horst Seehofer 70,549 12,600,000 582,599,000,000
British Columbia Canada Premier Christy Clark 944,735 4,631,300 188,150,735,000
Brittany France President Pierrick Massiot 27,208 3,273,343 95,000,000,000
California United States Governor Edmund G. Brown Jr. 423,470 38,800,000 2,200,000,000,000
Carinthia Austria Governor Dr. Peter Kaiser 9,536 556,637 19,485,378,250
Catalonia Spain President Artur Mas i Gavarró 32,107 7,518,903 226,328,650,000
Connecticut United States Governor Dannel Malloy 12,997 3,644,545 253,036,000,000
Delta State Nigeria Executive Governor Dr. Ifeanyi Okowa 18,213 4,112,445 16,750,000,000
Drenthe Netherlands King’s Commissioner Jacques Tichelaar
2,639 488,600 13,500,000,000
Emilia-Romagna Italy President Stefano Bonaccini 22,453 4,457,115 154,976,610,291
Jalisco Mexico Governor Jorge Aristóteles Sandoval Díaz
126,497 7,350,682 57,888,000,000
Jammu and Kashmir India Chief Minister Mufti Mohammad Sayeed
101,387 12,548,926 13,730,000,000
Jämtland Sweden County Commissioner Robert Uitto 34,009 127,000 5,000,000,000
KwaZulu-Natal South Africa Premier Edward Senzo Mchunu 94,361 10,267,300 37,000,000,000
La Réunion France President Didier Robert 2,500 840,974 19,750,000,000
Laikipia County Kenya Governor Joshua Irungu 9,462 420,000 546,000,000
Lombardy Italy President Roberto Maroni 23,864 9,973,397 372,230,000,000
Manitoba Canada Premier Greg Selinger 649,947 1,272,000 61,323,000,000
state or regional government
Country head of government land area (km2) population gdp (us$)
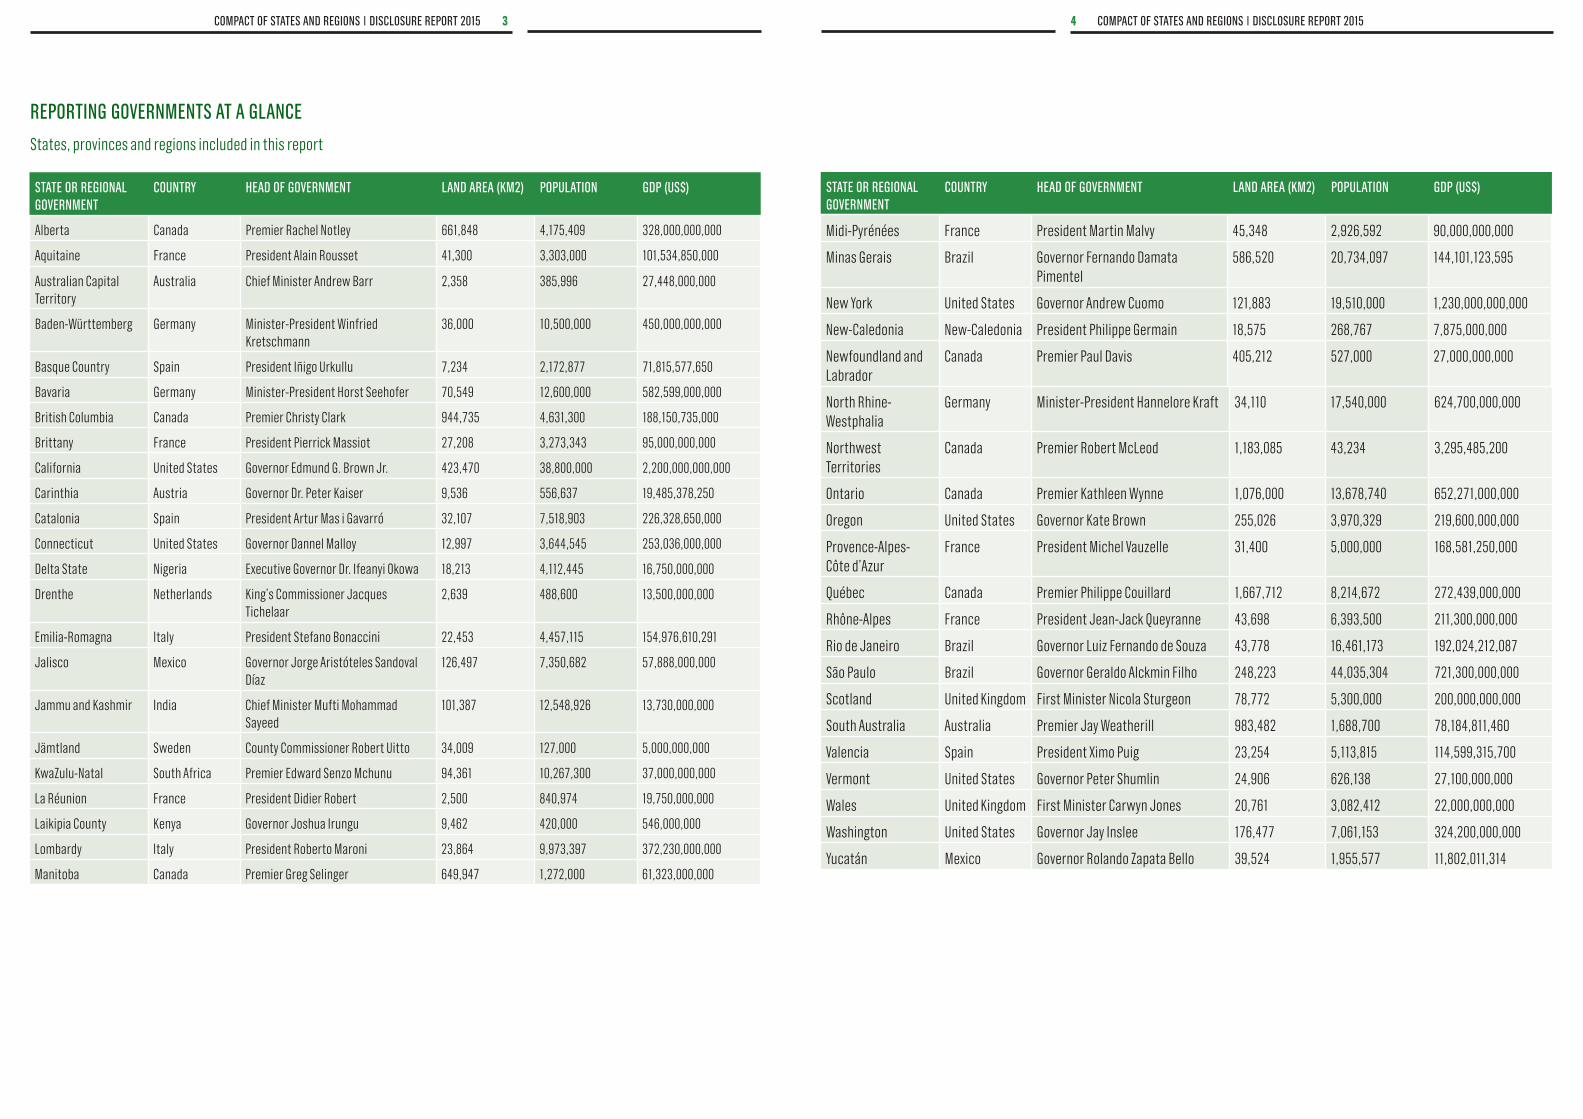
reporting governments at a glanCe
States, provinces and regions included in this report
Midi-Pyrénées France President Martin Malvy 45,348 2,926,592 90,000,000,000
Minas Gerais Brazil Governor Fernando Damata Pimentel
586,520 20,734,097 144,101,123,595
New York United States Governor Andrew Cuomo 121,883 19,510,000 1,230,000,000,000
New-Caledonia New-Caledonia President Philippe Germain 18,575 268,767 7,875,000,000
Newfoundland and Labrador
Canada Premier Paul Davis 405,212 527,000 27,000,000,000
North Rhine-Westphalia
Germany Minister-President Hannelore Kraft 34,110 17,540,000 624,700,000,000
Northwest Territories
Canada Premier Robert McLeod 1,183,085 43,234 3,295,485,200
Ontario Canada Premier Kathleen Wynne 1,076,000 13,678,740 652,271,000,000
Oregon United States Governor Kate Brown 255,026 3,970,329 219,600,000,000
Provence-Alpes-Côte d’Azur
France President Michel Vauzelle 31,400 5,000,000 168,581,250,000
Québec Canada Premier Philippe Couillard 1,667,712 8,214,672 272,439,000,000
Rhône-Alpes France President Jean-Jack Queyranne 43,698 6,393,500 211,300,000,000
Rio de Janeiro Brazil Governor Luiz Fernando de Souza 43,778 16,461,173 192,024,212,087
São Paulo Brazil Governor Geraldo Alckmin Filho 248,223 44,035,304 721,300,000,000
Scotland United Kingdom First Minister Nicola Sturgeon 78,772 5,300,000 200,000,000,000
South Australia Australia Premier Jay Weatherill 983,482 1,688,700 78,184,811,460
Valencia Spain President Ximo Puig 23,254 5,113,815 114,599,315,700
Vermont United States Governor Peter Shumlin 24,906 626,138 27,100,000,000
Wales United Kingdom First Minister Carwyn Jones 20,761 3,082,412 22,000,000,000
Washington United States Governor Jay Inslee 176,477 7,061,153 324,200,000,000
Yucatán Mexico Governor Rolando Zapata Bello 39,524 1,955,577 11,802,011,314

6 CompaCt of states and regions | disClosure report 20155CompaCt of states and regions | disClosure report 2015
tackling climate change region by regiondriving Climate aCtion through the CompaCt of states and regions
The global transition to a thriving low carbon economy is underway. This year GDP growth decoupled from emissions for the first time. While the world’s economies grew on average by 3.3%, emissions increased by 0.5%, leading to a record-breaking fall in carbon intensity of 2.7%.1 This milestone reflects the accelerated global momentum on climate action leading up to and throughout 2015; from G7 countries agreeing to phase out fossil fuel emissions by the end of the century to Pope Francis calling on leaders to urgently act on climate change.
But it isn’t just world leaders driving this change. The world’s most influential companies are committing to procure 100% of their electricity from renewable sources.2 Investors are divesting trillions of dollars of assets from fossil fuels3. And today the scale of climate actions from city, state, provincial and regional governments is unprecedented.
State, provincial and regional governments in particular have long risen to the climate challenge despite sometimes being overlooked by national leaders, academics and the media. This report brings their leadership into the spotlight. Through the Compact of States and Regions, we can reveal that 44 governments, spanning 18 different countries across six continents have reported their climate commitments and GHG inventories for the first time.
These state and regional governments are a force to be reckoned with. Together they represent more than 325 million people and over US$10.5 trillion in GDP. That is one eighth of the global economy. Of these 44 reporting governments, 37 have a state-wide GHG inventory4 and a public emissions reduction target. Seven governments have joined the Compact of States and Regions as ‘observers’, committing to develop a GHG target and inventory within a two year timeframe5. The potential collective emissions saving through the Compact represents one of the most significant commitments in the world ahead of COP21. But the Compact doesn’t stop in Paris. It also provides a platform for governments to increase their ambition and report climate data far beyond 2015.
Using data disclosed directly to the Compact of States and Regions, this report paints the first-ever picture of the contribution to global GHG emissions reductions by state and regional governments. Chapter 2 of this report provides an assessment of the pledged emissions savings in the long and short term. While disclosing GHG emissions targets is a mandatory requirement as part of reporting to the Compact, many states, provinces and regions also disclosed the climate measures, economic opportunities and adaptation actions that underpin their climate strategies. Chapters 3 and 4 give a flavor of the vast amount of additional data that has been disclosed to the Compact.
1 PWC, ‘Conscious Uncoupling? Low Carbon Economy Index’, in PWC. October 2015, http://www.pwc.co.uk/services/sustainability-climate-change/insights/low-carbon-economy-index-2015-download-section.html.2 RE100, ‘Companies’, http://there100.org/companies, 20153 Carrington, D. Howard, E, ‘Institutions worth $2.6 trillion have now pulled investments out of fossil fuels’, The Guardian, 22 September 2015, http://www.theguardian.com/environment/2015/sep/22/leonardo-dicaprio-joins-26tn-fossil-fuel-divestment-movement.4 The Compact of States and Regions accepted GHG emissions inventories dating back to 2010.5 Delta State, Jammu and Kashmir, KwaZulu-Natal, Laikipia County, New Caledonia, Valencia and Yucatan. Five observing governments already have either a sector-specific emissions reduction target and/or an emissions inventory that is sector-wide or dates from before 2010.
1
what is the compact oF states anD regions?
The Compact of States and Regions is an initiative that provides a transparent, global picture of efforts to tackle climate change from state and regional governments. Announced at the UN Climate Summit in New York in 2014, the Compact of States and Regions is supported by the United Nations and was launched by The Climate Group, CDP, R20 and nrg4SD.
The Compact of States and Regions is the first dedicated reporting mechanism for states, provinces and regions, showcasing and analyzing their climate efforts. Through an annual assessment, state and regional governments are able to measure their emissions and set ambitious reduction goals, while acknowledging their different capabilities and circumstances.
To join the Compact, governments must:
1. Make a public commitment to reduce greenhouse gas (GHG) emissions.
2. Publicly report a standard set of GHG inventory data on an annual basis.
Governments without existing GHG reduction targets and inventories can “observe” the Compact by stating their intent to develop a GHG target and inventory within two years. They are also encouraged to submit existing data to a recognized reporting platform on an annual basis, to build the capacity needed to eventually develop an inventory. Disclosure and assessment of progress will take place each year through an annual disclosure report.
The Compact is a critical part of the post-Paris agenda of action by Non-State Actors, so all state and regional governments are invited to join and begin reporting in 2016.

8 CompaCt of states and regions | disClosure report 20157CompaCt of states and regions | disClosure report 2015
figure 1: governments reporting to the Compact of states and regions in 2015
While limiting temperature rise to below 2 degrees Celsius is a global challenge requiring global governance, state and regional governments are racing ahead in setting ambitious GHG reduction goals – with potentially huge impacts.
Governments reporting to the Compact of States and Regions currently represent 2.81GtCO2e in
annual emissions6. Through their reported GHG emissions reduction commitments, we estimate total cumulative savings7 of:
• 3 gtCo2e by 2020, which is more than the combined annual GHG emissions of the UK, Germany and Japan in 2012;
• 12.4 gtCo2e by 2030, more than the combined GHG emissions of the US and EU, or China alone in 2012; and
• 47.4 gtCo2e by 2050, equalling world GHG emissions in 2012.
6 Compact ‘observers’ account for 2% of this figure. Further analysis in Chapter 2 is based on the emissions from those 37 states, provinces and regions that have fulfilled all Compact requirements (2.74 Gt CO
2e).
7 When compared to a business as usual scenario. For information about the methodology, please see chapter 2 “State and regional climate pledges”.
i wanted the rhône-alpes region to join the CompaCt of
states and regions, beCause the history of our Climate
now writes itself at the sub-national level. Countries
sign treaties, but it is regional governments who,
through their aCtions and Contributions, play a major
role eaCh day to taCkle Climate Change.
- jean-jack Queyranne, president, rhône-alpes
figure 2: projected ghg savings to 2050
3.5
3.0
2.5
2.0
1.5
1.0
0.5
0
tota
l ghg
em
issi
ons
(gtC
o 2e)
2010 20202015
ghgs under targetsghgs under business as usual
2025 2030 2035 2035 2040 2045 2050
19% reduCtion36% reduCtion
63% reduCtion
Not only have state and regional governments demonstrated the political will to achieve these substantial emissions reductions, they also have the jurisdictional power and budgets to deliver them. Across the world, states and regions are leading on a breadth of actions to address climate change, from large cross-border collaborations to small community interventions. British Columbia, for example, has adopted a revenue-neutral carbon tax for the purchase or use of fossil fuels, while California and Québec have established the largest regional carbon market in North America – and it is now being expanded to other provinces and countries. In Brazil, Rio de Janeiro has set a state-wide target to reduce solid waste GHG emissions.
In India, the state of Jammu and Kashmir is dedicated to developing renewable energy and providing access to this energy in rural communities, while in Mexico, Jalisco is installing solar photovoltaic lamps, water pumps and air conditioning in the administrations’ buildings. The government of North Rhine-Westphalia in Germany is boosting combined heat and power development with a funding program amounting to €250 million (US$270 million).
The Compact provides a tool for analyzing these and the many other policies and measures being implemented at the state and regional level.
*Observer to the Compact of States and Regions
this data is evidenCe of what we have long understood — that sub-national governments have an important role to play in reduCing greenhouse gas emissions, Combatting Climate Change and supporting the transition to a low Carbon eConomy. as we approaCh Cop21, sub-national governments are taking the opportunity to learn from one another so we Can advanCe our shared priorities and make real progress on this urgent and CritiCal issue.
- kathleen wynne, premier, ontario
by 2050, these governments will have reduced their annual emissions from 2.81 gtCo
2e to 1.28 gtCo
2e,
which equals an average absolute reduction of 55%. this constitutes a 63% reduction compared to a business as usual scenario, which would see emissions rise to 3.5 gtCo
2e by 2050.
British Columbia
Vermont
Connecticut
Ontario
New York
Rio de Janeiro
Minas Gerais
North Rhine-Westphalia
Bavaria WalesBrittany
Midi-Pyrénées
California
Jalisco
Manitoba
Northwest Territories
Oregon
Washington
Québec
NORTH AMERICA
SOUTH AMERICA
EUROPE
AFRICA
ASIA
AustralianCapital Territory
Scotland
Aquitaine
Rhône-Alpes
Newfoundland and Labrador
São Paulo
Jämtland
Delta State*
La Réunion
Jammu and Kashmir*
Laikipia County*
KwaZulu Natal*
South Australia
OCEANIA/AUSTRALIA
Basque Country
Valencia*
Catalonia
Provence-Alpes-Côte d'Azur
Drenthe
Baden-Württemberg
Lombardy
Emilia Romagna
Carinthia
New Caledonia
Yucatan*
Alberta
10 CompaCt of states and regions | disClosure report 20159CompaCt of states and regions | disClosure report 2015
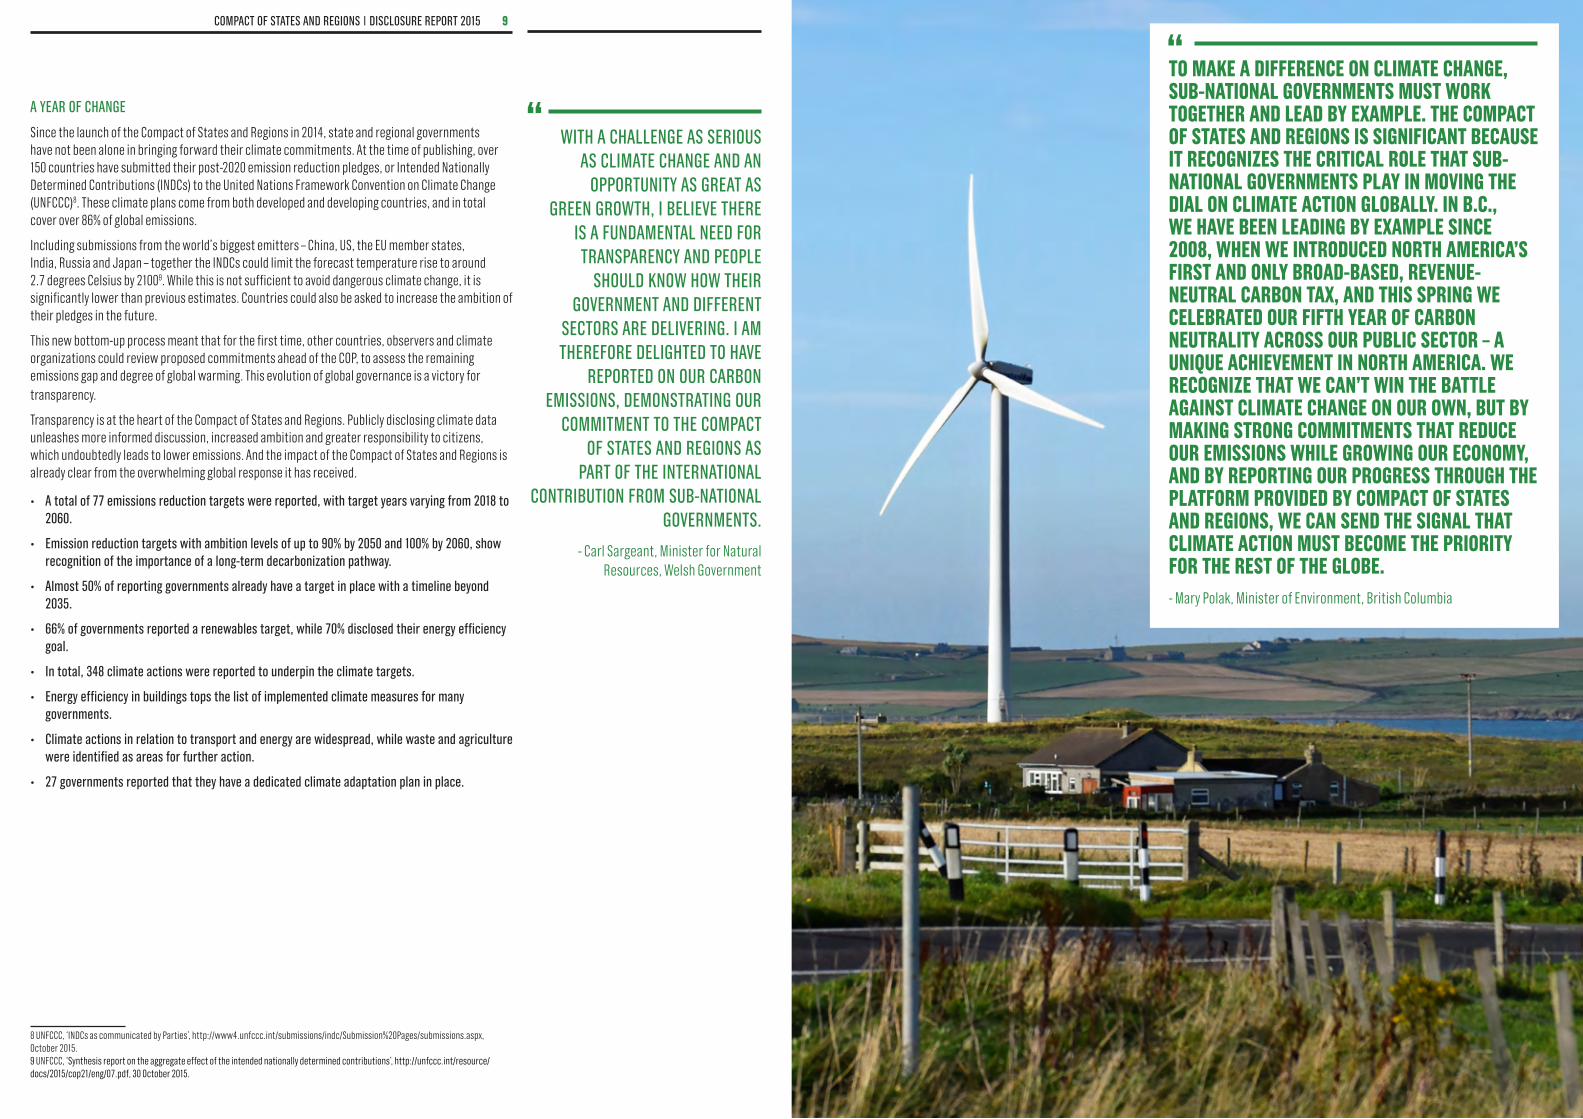
a year of Change
Since the launch of the Compact of States and Regions in 2014, state and regional governments have not been alone in bringing forward their climate commitments. At the time of publishing, over 150 countries have submitted their post-2020 emission reduction pledges, or Intended Nationally Determined Contributions (INDCs) to the United Nations Framework Convention on Climate Change (UNFCCC)8. These climate plans come from both developed and developing countries, and in total cover over 86% of global emissions.
Including submissions from the world’s biggest emitters – China, US, the EU member states, India, Russia and Japan – together the INDCs could limit the forecast temperature rise to around 2.7 degrees Celsius by 21009. While this is not sufficient to avoid dangerous climate change, it is significantly lower than previous estimates. Countries could also be asked to increase the ambition of their pledges in the future.
This new bottom-up process meant that for the first time, other countries, observers and climate organizations could review proposed commitments ahead of the COP, to assess the remaining emissions gap and degree of global warming. This evolution of global governance is a victory for transparency.
Transparency is at the heart of the Compact of States and Regions. Publicly disclosing climate data unleashes more informed discussion, increased ambition and greater responsibility to citizens, which undoubtedly leads to lower emissions. And the impact of the Compact of States and Regions is already clear from the overwhelming global response it has received.
• a total of 77 emissions reduction targets were reported, with target years varying from 2018 to 2060.
• emission reduction targets with ambition levels of up to 90% by 2050 and 100% by 2060, show recognition of the importance of a long-term decarbonization pathway.
• almost 50% of reporting governments already have a target in place with a timeline beyond 2035.
• 66% of governments reported a renewables target, while 70% disclosed their energy efficiency goal.
• in total, 348 climate actions were reported to underpin the climate targets.
• energy efficiency in buildings tops the list of implemented climate measures for many governments.
• Climate actions in relation to transport and energy are widespread, while waste and agriculture were identified as areas for further action.
• 27 governments reported that they have a dedicated climate adaptation plan in place.
8 UNFCCC, ‘INDCs as communicated by Parties’, http://www4.unfccc.int/submissions/indc/Submission%20Pages/submissions.aspx, October 2015. 9 UNFCCC, ‘Synthesis report on the aggregate effect of the intended nationally determined contributions’, http://unfccc.int/resource/docs/2015/cop21/eng/07.pdf, 30 October 2015.
with a Challenge as serious as Climate Change and an
opportunity as great as green growth, i believe there
is a fundamental need for transparenCy and people
should know how their government and different
seCtors are delivering. i am therefore delighted to have
reported on our Carbon emissions, demonstrating our
Commitment to the CompaCt of states and regions as
part of the international Contribution from sub-national
governments.
- Carl Sargeant, Minister for Natural Resources, Welsh Government
to make a DiFFerence on climate change, sub-national governments must work together anD leaD by example. the compact oF states anD regions is signiFicant because it recognizes the critical role that sub-national governments play in moving the Dial on climate action globally. in b.c., we have been leaDing by example since 2008, when we introDuceD north america’s First anD only broaD-baseD, revenue-neutral carbon tax, anD this spring we celebrateD our FiFth year oF carbon neutrality across our public sector – a unique achievement in north america. we recognize that we can’t win the battle against climate change on our own, but by making strong commitments that reDuce our emissions while growing our economy, anD by reporting our progress through the platForm proviDeD by compact oF states anD regions, we can senD the signal that climate action must become the priority For the rest oF the globe.- Mary Polak, Minister of Environment, British Columbia

12 CompaCt of states and regions | disClosure report 201511CompaCt of states and regions | disClosure report 2015
baden-württemberg’s 50-80-90 goals
In 2013 the Parliament of Baden-Wuerttemberg resolved the Act Governing the Mitigation of Climate Change in Baden-Württemberg. We are reorienting our climate policy, and as one of the consequences, our energy supply. This transition is called ‘Energiewende’. Our goals for the year 2050, we express with the formula ‘50-80-90’.
50% reduCtion in Consumption
Saving energy means more than simply using less energy. Electricity and heat must also be used more efficiently. That means using energy where it is really needed and ensuring that none of it is wasted.
80% renewable energy
We want 80% of the energy used in Baden-Wuerttemberg to come from renewable sources. Most electricity will come from the wind and sun, while solar collectors, ambient heat and geothermal energy will be the main sources of heat energy. This will reduce our reliance on imported raw materials and therefore Baden-Württemberg will be less affected by rising prices in the world market.
90% reduCtion in greenhouse gases
Our aim is to reduce energy-related greenhouse gas emissions in Baden-Württemberg by 90% by the year 2050. We aim to achieve a reduction of 25% as early as the year 2020.
prinCiples
Baden-Württemberg is highly industrialized and is for that reason dependent on reliable supplies of energy. This is why we will make absolutely sure that energy is available at all times. Also, electricity and heat must not be allowed to become luxuries. They both play a crucial role in private, public and economic life and must be affordable for everyone. The state government needs and actively elicits the competence and opinion of the people who live here in Baden-Württemberg, as well as its associations, businesses and local authorities. We are counting on the willingness of the people to shape the energy transition with us. Finally we want to ensure that the energy transition is compatible with a healthy environment and nature conservation.
jammu and kashmir’s renewable energy development
India’s Ministry of New and Renewable Energy has designated the Jammu and Kashmir Energy Development Agency (JAKEDA) to increase renewable energy in the State of Jammu and Kashmir. In recent years, our projects have included solar energy, mini hydro power, wind energy and biomass cooking devices.
In 2010, the Ministry also launched the Jawahar Lal Nehru National Solar Mission, with the aim of establishing India as a global leader in solar energy. The Jammu and Kashmir Government issued a Solar Power Policy in 2013, and based on this climate change initiative, we decided to adopt further preventive management strategies for transitioning to a cleaner, more energy efficient future.
Beyond solar, we issued a Hydro Power Policy in 2011 to electrify energy deficient areas by harnessing the state’s abundant fast running water.
And wind power too, offers potential in the region. In collaboration with the National Institute of Wind Energy, in 2008-09 we installed 50-meter high wind masts to assess this potential. On the basis of three years’ data, a potential of 336 watts per square meter was calculated in a village in the Reasi district, which is enough for 8 megawatts of wind energy. Work on the proposed project will begin soon.
‘Clean cooking’ is also a focus in rural areas of the state, with devices such as biomass and solar cook stoves being introduced. In tropical areas, we have also installed family and community-accessible biogas plants.
Many benefits have been recorded following the implementation of these projects. The state’s renewable energy sector is investment intensive, and solar and hydro policies are expected to attract investment within the sector. And by reducing emissions the state can also earn Renewable Energy Certificates. The growth of the clean energy sector also creates job opportunities. This will have an especially positive impact on our young people, as the state has the highest number of unemployed youth in India.
Besides unleashing large-scale capacity for a huge chunk of both rural and urban youth, the tapping of energy from renewable resources will strengthen the institutional infrastructure of the state. Finally, the allied sectors associated with the growth of the renewables industry both directly and indirectly improves research and development, design, manufacturing, marketing, installation and maintenance, as well as energy supply companies, equipment manufacturers, and regulatory bodies. The State of Jammu and Kashmir’s decision to invest in a low carbon future is set to bring many more benefits for all.
2 state anD regional climate pleDgesIn many parts of the world, setting headline targets has become the central feature of an effective strategy to tackle dangerous climate change. In many ways, the European Union set the tone back in 2008 by adopting a threefold energy and climate strategy seeking to go beyond the ambition of the Kyoto Protocol. In support of the EU Emissions Trading Scheme as a major pillar of the Union’s climate policy, the heads of state agreed to reduce domestic emissions by 20% by 2020, reach 20% renewable energy in total energy consumption by 2020 and aim to save 20% of energy consumption by 2020. Recently, the EU built on this plan by adopting a new set of targets to be achieved by 2030.
But a successful climate strategy should go beyond setting targets and ensure that appropriate climate actions are implemented, an adaptation strategy is developed and, if possible, should include climate goals in other areas of policymaking. Nevertheless, climate targets are often the backbone of decarbonization strategies and offer an indication of the ambition of the government in power, while giving clear signals to the public, businesses and investors.
Through the Compact of States and Regions, we are able to study emissions reduction, energy efficiency and renewable targets from states, provinces and regions for the first time ever. The composition of these targets varies in many respects, such as target years, base years, and applicable sectors, thus making their interpretation and evaluation challenging. Nevertheless, this chapter will provide a breakdown of the variety of targets disclosed through the Compact of States and Regions.
Of the 44 governments reporting to the Compact of States and Regions in 2015, 37 have a state-wide GHG inventory and a public emissions reduction target in place. The additional seven governments10
are ‘observing’ the Compact, committing to develop a GHG target and inventory within a two-year timeframe. All aggregate numbers in the below analysis are based on those 37states, provinces and regions which have reported a region-wide GHG reductions target and GHG inventory – fulfilling the core Compact criteria.11
The analysis includes an assessment of the potential future emissions savings that can be achieved as a result of these targets when compared with a business-as-usual scenario, as well as the progress governments have made to date.
greenhouse gas emission reduCtion targets
One of the most common climate commitments made by state and regional governments reporting to the Compact is a region-wide GHG emissions reduction target. Region-wide targets apply to the entire economy of a region, whereas other targets may apply to specific sectors. They are typically established as an “absolute” target, meaning that the reductions are independent of other social and economic factors, or they are set as an “intensity” target, meaning that the reductions are linked to factors such as GDP and population growth. Once adopted, region-wide GHG targets give perhaps the clearest indication of a state or region’s overall path toward decarbonization, as well as the future direction of its climate and energy policy.
10 Delta State, Jammu and Kashmir, KwaZulu-Natal, Laikipia County, New Caledonia, Valencia and Yucatan.11 Unless otherwise specified.
shafat sultan, Chief Executive Officer of JAKEDA, Jammu and Kashmir
franz untersteller, Minister of the Environment, Climate Protection and the Energy Sector, Baden-Württemberg

14 CompaCt of states and regions | disClosure report 201513CompaCt of states and regions | disClosure report 2015
government base year ghg reduCtion target by 2020
ghg reduCtion target by 2030
ghg reduCtion target by 2050
Absolute targets
Australian Capital Territory 1990 40% 80%12
Aquitaine 1990 20%
Baden-Württemberg 1990 25% 90%
Basque Country 2005 40% 80%
British Columbia 2007 33% 80%
Brittany 2005 17% 52%
California 1990 NA13 40% 80%
Carinthia 2005 16%14
Catalonia 2005 25%
Connecticut 199015 10% 80%
Drenthe 1990 20% 90%16
Emilia-Romagna 1990 20%17
Jalisco 2010 30% 50%
Jämtland 1990 50% 100%
La Réunion 2011 10%
Lombardy 2005 20%18 40%
Manitoba 2005 15%
Midi-Pyrénées 2005 19%
New York 1990 80%
Newfoundland and Labrador 199019 10% 75%
government base year ghg reduCtion target by 2020
ghg reduCtion target by 2030
ghg reduCtion target by 2050
North Rhine-Westphalia 1990 25% 80%
Northwest Territories 2005 NA20
Ontario 1990 15% 37% 80%
Oregon 1990 10% 75%
Provence-Alpes-Côte d’Azur 2007 20% 35%
Québec 1990 20%
Rhône Alpes 1990 29% 75%
São Paulo 2005 20%
Scotland 1990 42% 80%
South Australia 1990 60%
Vermont 1990 50%21 75%
Wales 1990 40% 80%
Washington 1990 NA22 25%23 50%
Intensity targets
Bavaria Reduce GHG emissions per capita to below 2 tons annually by 2050
Rio de Janeiro Reduce GHG emissions per unit of GDP below 2005 levels by 2030
Business as usual targets
Alberta BAU 16% 50%
Minas Gerais BAU 25%
- overall, all 37 governments have adopted a region-wide ghg reduction target (or targets).
- 89% of governments have set an absolute target (or targets).
12 ACT also has a target of 100% below 1990 levels by 2060. 13 California has a target to return GHG emissions to 1990 levels by 2020. 14 Carinthia’s target applies to non-EU ETS emissions.15 Connecticut’s 2050 target is based on a 2001 base year. 16 Drenthe’s targets are based on the national and EU targets.17 Emilia-Romagna’s target is based on the national target. 18 Lombardy’s target applies to non-EU ETS emissions.19 Newfoundland and Labrador’s 2050 target is based on a 2001 base year.
20 Northwest Territories’ target is to return GHG emissions to 2005 levels or below by 2030.21 Vermont’s mid-term target year is 2028.22 Washington has a target to return GHG emissions to 1990 levels by 2020.23 Washington’s mid-term target year is 2035.
table 1: region-wide ghg reduction targets
16 CompaCt of states and regions | disClosure report 201515CompaCt of states and regions | disClosure report 2015
AUSTRALIAN CAPITAL TERRITORY
AQUITAINE
BADEN-WüRTTEMBERG
BASQUE COUNTRY
BRITISH COLUMBIA
BRITTANY
CALIFORNIA
CARINTHIA
CATALONIA
CONNECTICUT
DRENTHE
EMILIA-ROMAGNA
JALISCO
JäMTLAND
LA RéUNION
LOMBARDY
MANITOBA
MIDI-PYRENEES
NEW YORK
NEWFOUNDLAND AND LABRADOR
NORTH RHINE-WESTPHALIA
NORTHWEST TERRITORIES
ONTARIO
OREGON
PROVENCE-ALPES-CôTE D’AZUR
QUEBEC
RHONE-ALPES
SãO PAULO
SCOTLAND
SOUTH AUSTRALIA
VERMONT
WALES
WASHINGTON
BAVARIA
RIO DE JANEIRO
ALBERTA
MINAS GERAIS
intensity targets
business as usual targets
absolute targets
target aims to return emissions to base year or below
business as usual targets
range of reduCtion targets10% 50% 100%
shaded on scale by percent
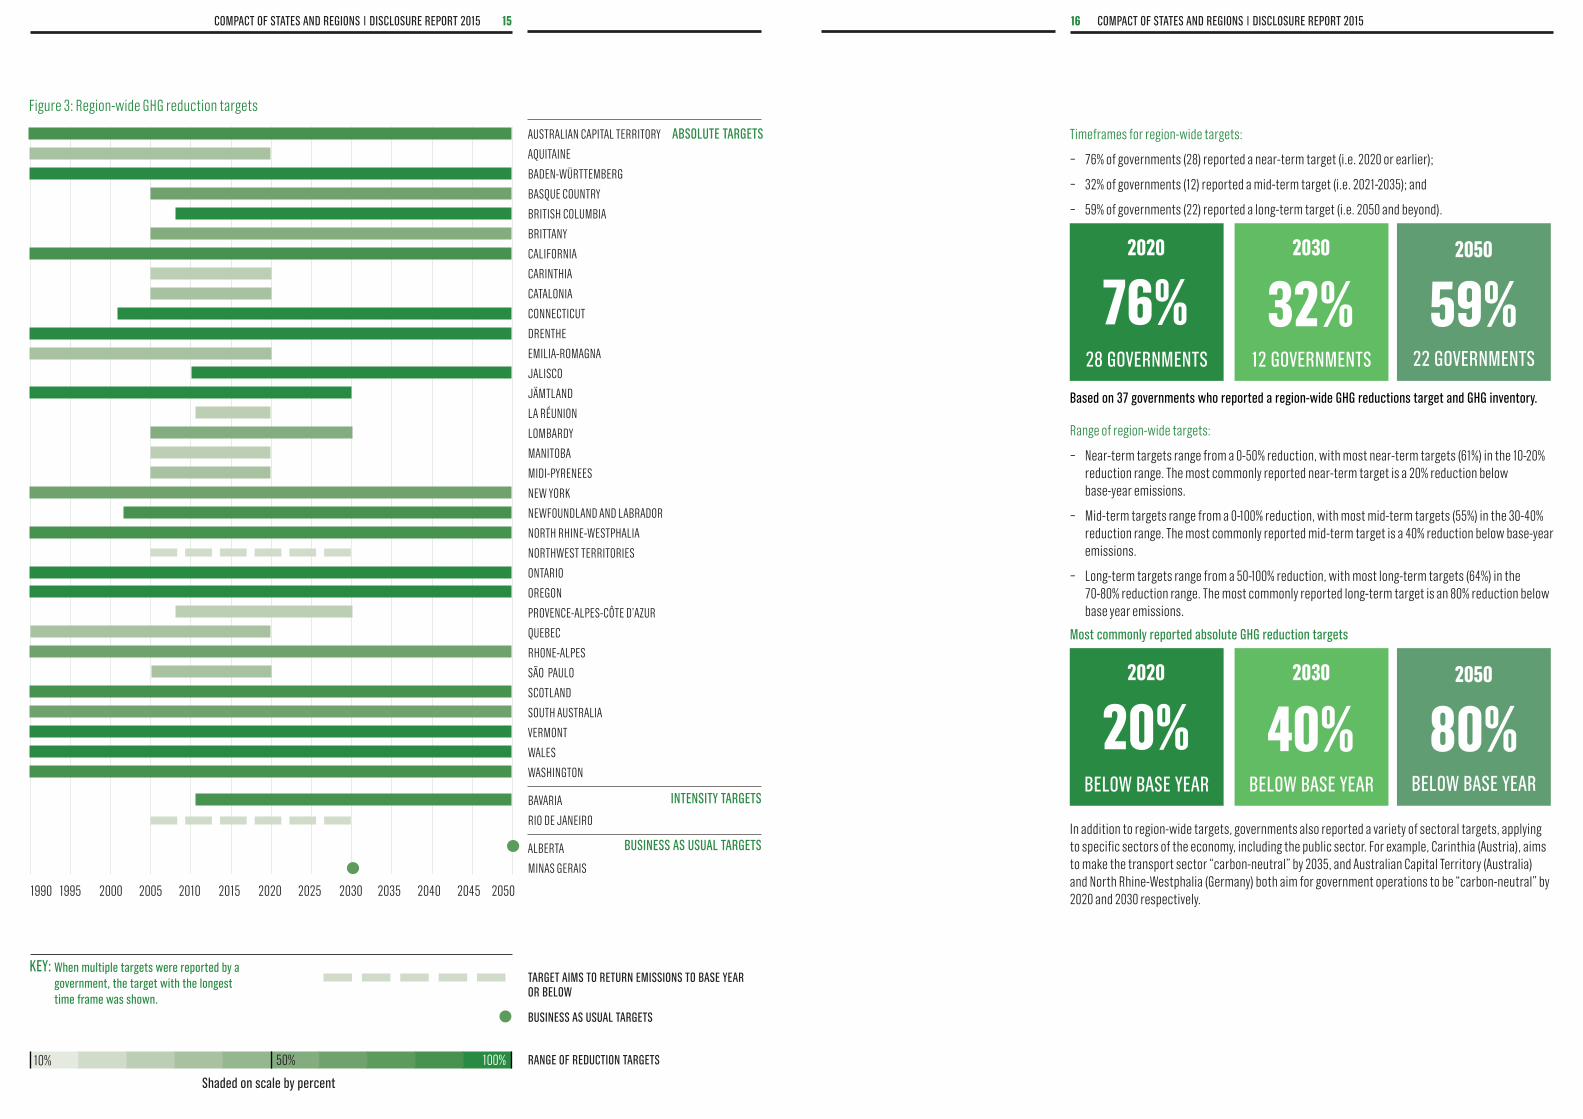
Timeframes for region-wide targets:
−− 76% of governments (28) reported a near-term target (i.e. 2020 or earlier);
−− 32% of governments (12) reported a mid-term target (i.e. 2021-2035); and
−− 59% of governments (22) reported a long-term target (i.e. 2050 and beyond).
2020
28 governments 12 governments 22 governments
76% 32% 59%2030 2050
based on 37 governments who reported a region-wide ghg reductions target and ghg inventory.
Range of region-wide targets:
−− Near-term targets range from a 0-50% reduction, with most near-term targets (61%) in the 10-20% reduction range. The most commonly reported near-term target is a 20% reduction below base-year emissions.
−− Mid-term targets range from a 0-100% reduction, with most mid-term targets (55%) in the 30-40% reduction range. The most commonly reported mid-term target is a 40% reduction below base-year emissions.
−− Long-term targets range from a 50-100% reduction, with most long-term targets (64%) in the 70-80% reduction range. The most commonly reported long-term target is an 80% reduction below base year emissions.
most commonly reported absolute ghg reduction targets
2020
below base year below base year below base year
20% 40% 80%2030 2050
In addition to region-wide targets, governments also reported a variety of sectoral targets, applying to specific sectors of the economy, including the public sector. For example, Carinthia (Austria), aims to make the transport sector “carbon-neutral” by 2035, and Australian Capital Territory (Australia) and North Rhine-Westphalia (Germany) both aim for government operations to be “carbon-neutral” by 2020 and 2030 respectively.
Figure 3: Region-wide GHG reduction targets
1990 1995 2000 2005 2010 2015 2020 2025 2030 2035 2040 2045 2050
key: when multiple targets were reported by a government, the target with the longest time frame was shown.
18 CompaCt of states and regions | disClosure report 201517CompaCt of states and regions | disClosure report 2015
SECTOR GOVERNMENT TARGET
Buildings New Caledonia Reduce GHG emissions in the residential and tertiary sectors by 35% below a trend scenario by 2030.
Energy New York Reduce GHG emissions from the energy sector by 40% below 1990 levels by 2030.
Industry New Caledonia Reduce GHG emissions from the mining and metallurgy sectors by 10% below a trend scenario by 2030.
Land use Laikipia County Increase annual tree planting by 25%, resulting in over 10 million trees by 2030.
Public sector Australian Capital Territory Achieve carbon neutrality in government operations by 2020.
North Rhine-Westphalia Achieve carbon neutrality in government operations by 2030.
Rio de Janeiro Reduce public sector energy-related GHG emissions by 30% below 2005 levels by 2030.
Vermont Reduce GHG emissions from government operations by 75% below 1990 levels by 2050.
Transport Carinthia Achieve carbon-neutrality in the transport sector by 2035.
Rio de Janeiro Reduce GHG emissions in the transport sector by 30% below 2010 levels by 2030.
Waste Rio de Janeiro Reduce GHG emissions from sewage by 65% below 2005 levels by 2030.
Reduce GHG emissions from solid waste by 65% below 2005 levels by 2030.
Table 2: Selected sectoral GHG reduction targets
greenhouse gas emissions savings
Analysis of the GHG reduction targets disclosed through the Compact of States and Regions shows that, should all governments meet their targets, the following annual and cumulative emissions savings can be achieved when compared with a ‘business as usual’ scenario starting in 2010:
Annual savings
§−0.6 gtCo2e/year in 2020
§−1.2 gtCo2e/year in 2030
§−2.2 gtCo2e/year in 2050
Cumulative savings
§−3 gtCo2e by 2020
§−12.4 gtCo2e by 2030
§−47.4 gtCo2e by 2050
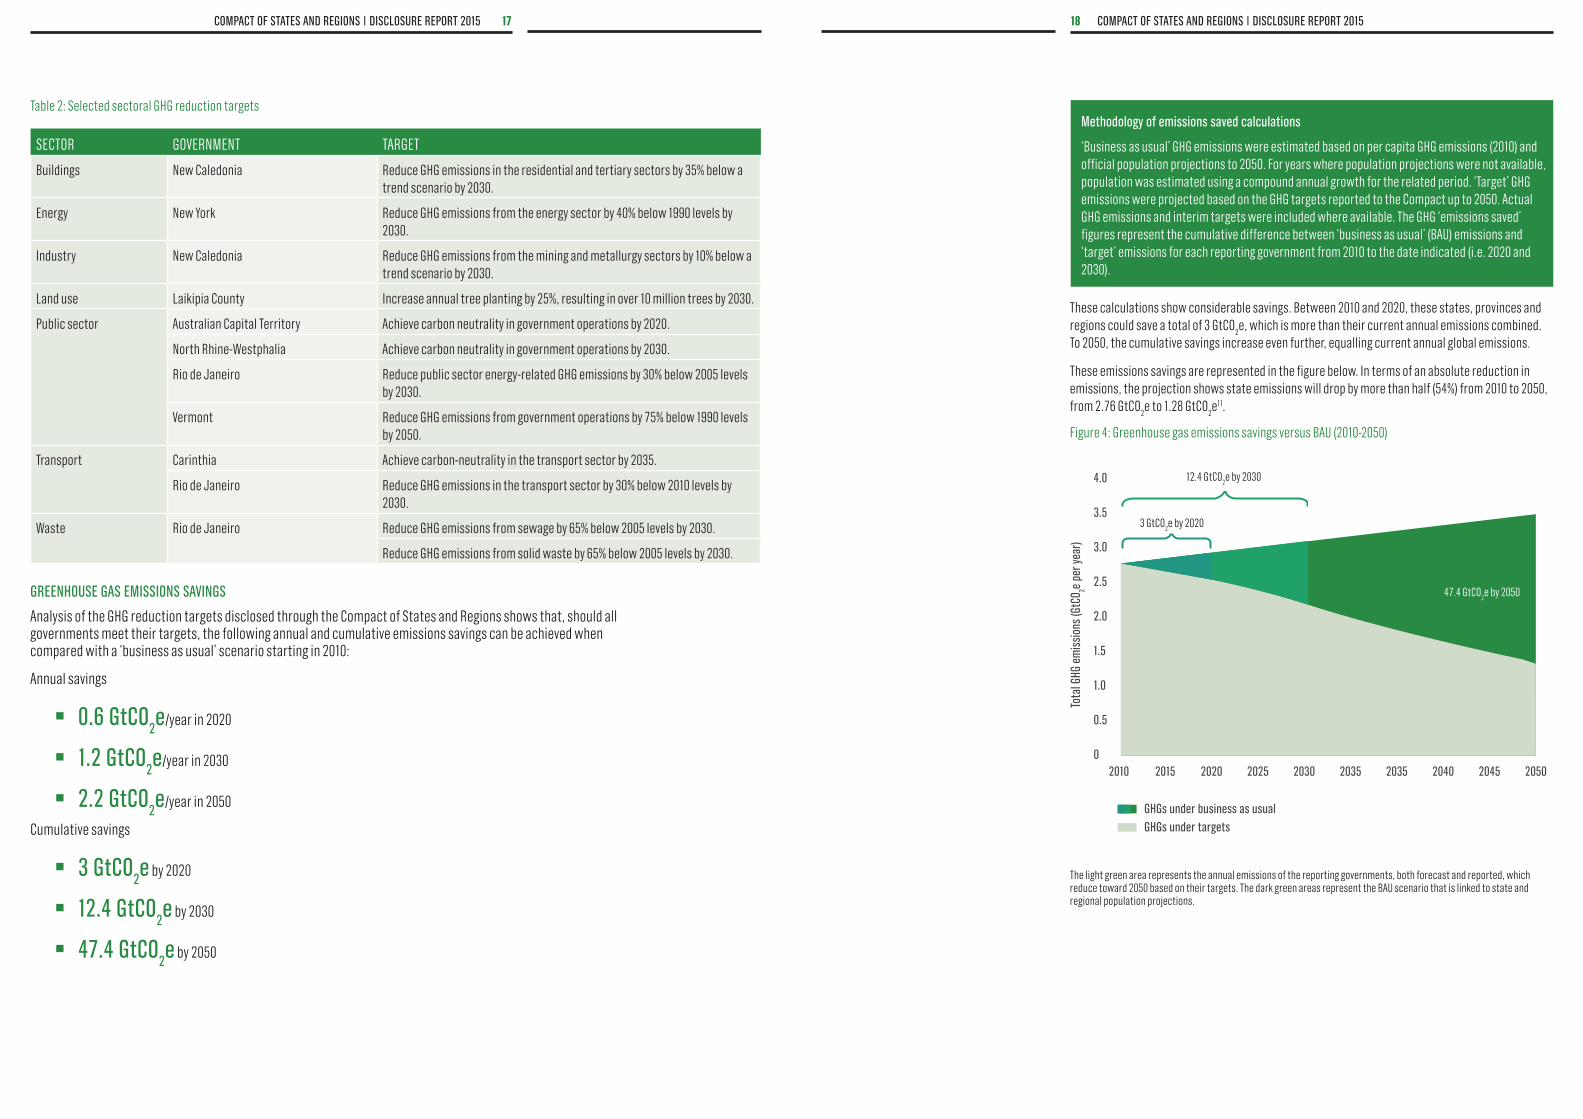
methodology of emissions saved calculations
‘Business as usual’ GHG emissions were estimated based on per capita GHG emissions (2010) and official population projections to 2050. For years where population projections were not available, population was estimated using a compound annual growth for the related period. ‘Target’ GHG emissions were projected based on the GHG targets reported to the Compact up to 2050. Actual GHG emissions and interim targets were included where available. The GHG ‘emissions saved’ figures represent the cumulative difference between ‘business as usual’ (BAU) emissions and ‘target’ emissions for each reporting government from 2010 to the date indicated (i.e. 2020 and 2030).
These calculations show considerable savings. Between 2010 and 2020, these states, provinces and regions could save a total of 3 GtCO
2e, which is more than their current annual emissions combined.
To 2050, the cumulative savings increase even further, equalling current annual global emissions.
These emissions savings are represented in the figure below. In terms of an absolute reduction in emissions, the projection shows state emissions will drop by more than half (54%) from 2010 to 2050, from 2.76 GtCO
2e to 1.28 GtCO
2e11.
Figure 4: Greenhouse gas emissions savings versus BAU (2010-2050)
The light green area represents the annual emissions of the reporting governments, both forecast and reported, which reduce toward 2050 based on their targets. The dark green areas represent the BAU scenario that is linked to state and regional population projections.
4.0
3.5
3.0
2.5
2.0
1.5
1.0
0.5
0
tota
l ghg
em
issi
ons
(gtC
o 2e pe
r yea
r)
2010 20202015
ghgs under targetsghgs under business as usual
2025 2030 2035 2035 2040 2045 2050
3 GtCO2e by 2020
12.4 GtCO2e by 2030
47.4 GtCO2e by 2050
20 CompaCt of states and regions | disClosure report 201519CompaCt of states and regions | disClosure report 2015
GOVERNMENT LATEST GHG EMISSIONS INVENTORY METRIC TONS CO2E
BASE YEAR
INVENTORY YEAR
PERCENT CHANGE FROM BASE YEAR
Aquitaine 19,297,345 1990 2012 -20%
Australian Capital Territory 3,990,000 1990 2013-2014 +25%
Baden-Württemberg 76,000,000 1990 2012 -15%
Basque Country 19,303,800 2005 2013 -25%
British Columbia 61,500,000 2007 2012 -4%
Brittany 24,500,000 2005 2010 -4%*
California 458,685,000 1990 2012 +6%
Carinthia 3,951,021 2005 2013 -17%
Catalonia 43,138,840 2005 2012 -10%
Connecticut 39,546,768 1990 2012 -11%
Drenthe 3,458,920 1990 2013 -8%
Emilia-Romagna 50,983,000 1990 2010 +50%
Jalisco 42,001,220 2010 2010 NA
Jämtland 880,000 1990 2011 -24%
La Réunion 4,659,201 2011 2011 NA
Lombardy 70,600,00 2005 2012 -18%
Manitoba 21,400,000 2005 2013 +3%
Midi-Pyrénées 18,543,000 2005 2013 -15%*
New York 211,740,000 1990 2011 -8%
Newfoundland and Labrador 8,640,000 1990 2013 -11%
North Rhine-Westphalia 308,812,000 1990 2013 -15%*
Northwest Territories 1,456,000 2005 2013 -12%
Ontario 167,000,000 1990 2012 -6%
Oregon 60,944,000 1990 2012 +9%
Provence-Alpes-Côte d’Azur 35,000,000 2007 2013 -27%
Québec 77,980,000 1990 2012 -8%
Rhône Alpes 42,389,000 1990 2013 -6%
São Paulo 98,037,080 2005 2013 +6%
Scotland 58,575,355 1990 2012 -26%*
South Australia 31,690,240 1990 2011-2012 -9%*
Vermont 8,269,000 1990 2012 +2%
Wales 45,825,984 1990 2012 -18%
Washington 94,100,000 1990 2012 +6%
Total 2,218,596,774 NA NA -6%
Table 4: Recent emissions trend Government Latest emissions -inventory
(2012)Percent change from base year (1990)
Percent change from 2005
California 458,685,000 +6% -6%
Oregon 60,944,000 +9% -11%
Vermont 8,269,000 +2% -11%
Washington 94,100,000 +6% -1%
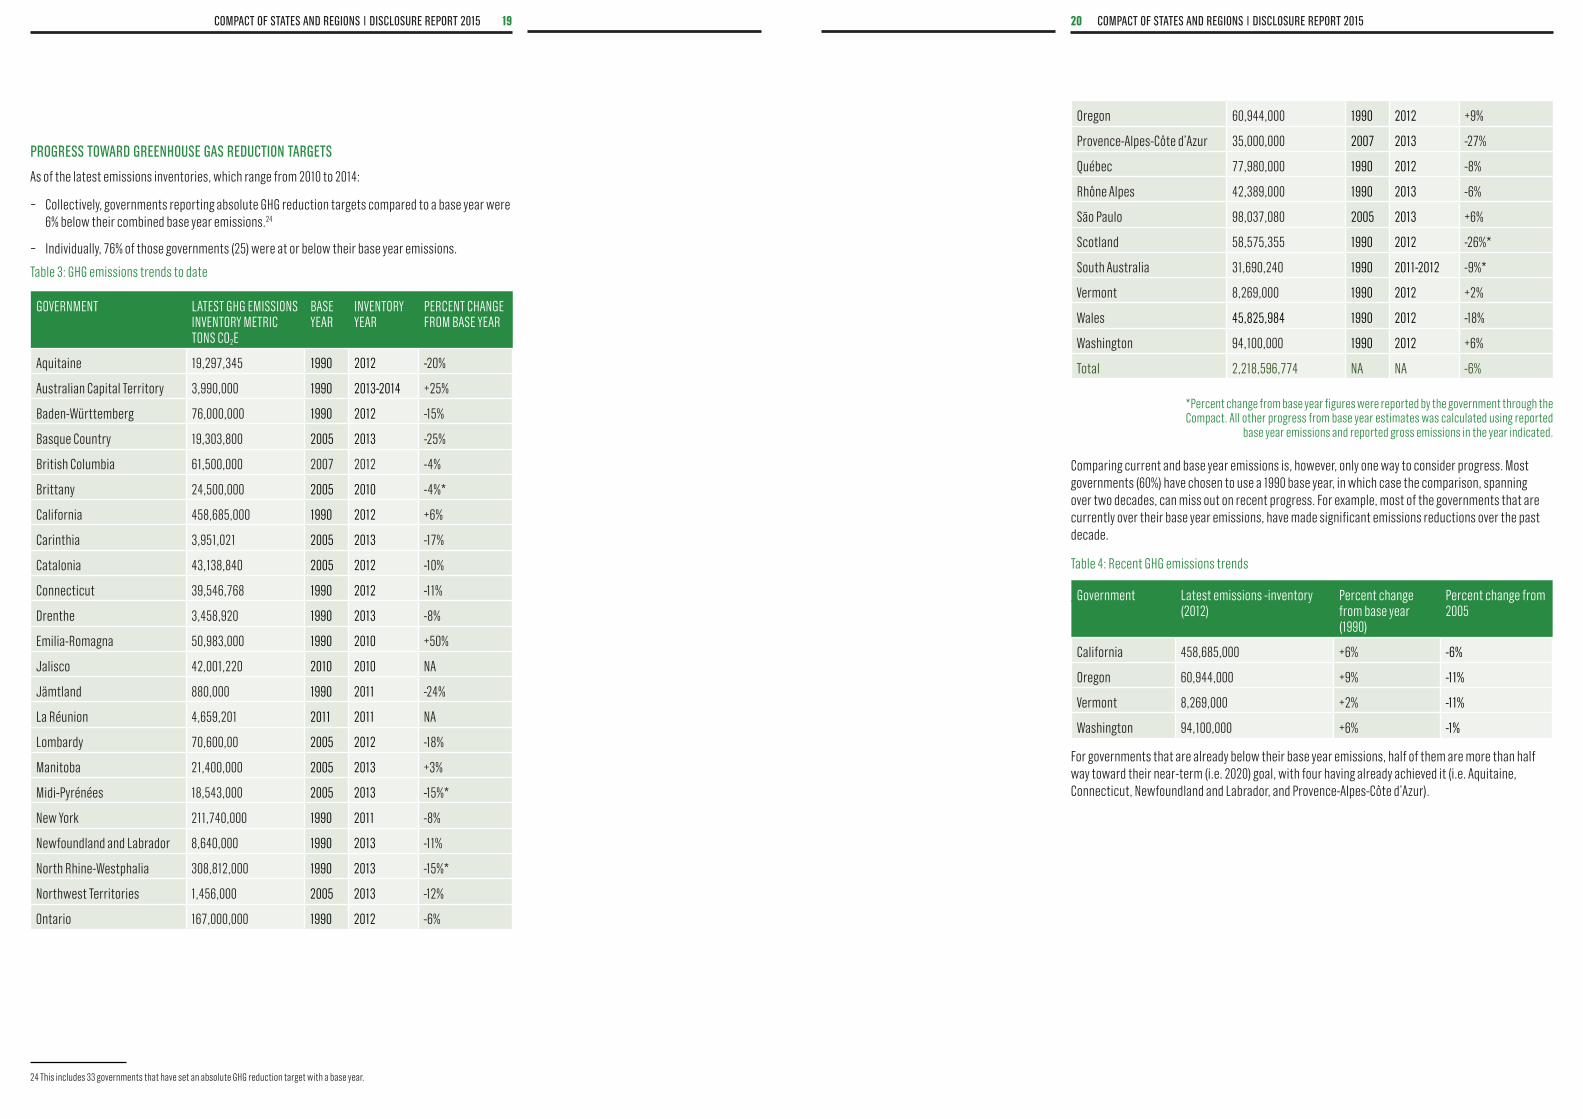
progress toward greenhouse gas reduCtion targets
As of the latest emissions inventories, which range from 2010 to 2014:
−− Collectively, governments reporting absolute GHG reduction targets compared to a base year were 6% below their combined base year emissions.24
−− Individually, 76% of those governments (25) were at or below their base year emissions.
Table 3: GHG emissions trends to date
Comparing current and base year emissions is, however, only one way to consider progress. Most governments (60%) have chosen to use a 1990 base year, in which case the comparison, spanning over two decades, can miss out on recent progress. For example, most of the governments that are currently over their base year emissions, have made significant emissions reductions over the past decade.
Table 4: Recent GHG emissions trends
For governments that are already below their base year emissions, half of them are more than half way toward their near-term (i.e. 2020) goal, with four having already achieved it (i.e. Aquitaine, Connecticut, Newfoundland and Labrador, and Provence-Alpes-Côte d’Azur).
24 This includes 33 governments that have set an absolute GHG reduction target with a base year.
*Percent change from base year figures were reported by the government through the Compact. All other progress from base year estimates was calculated using reported
base year emissions and reported gross emissions in the year indicated.

22 CompaCt of states and regions | disClosure report 201521CompaCt of states and regions | disClosure report 2015
GOVERNMENT TARGET SHARE OF RENEWABLE ENERGY/POWER IN 2020
TARGET SHARE OF RENEWABLE ENERGY/POWER IN 2030
TARGET SHARE OF RENEWABLE ENERGY/POWER IN 2050
Australian Capital Territory* 90%
Aquitaine 25%
Baden-Württemberg 25% 80%
Basque Country 20% 40%
Brittany 28%
California 33% 50%
Carinthia* 100%25
Catalonia* 20%
Connecticut* 27%26
Drenthe 16%
Emilia-Romagna 17%
La Réunion* 50% 100%
Lombardy 15%
Midi-Pyrénées 43%
New York* 50%
Ontario* 49%27
Oregon* 25%28
Provence-Alpes-Côte d’Azur 20% 30%
Rhône-Alpes 29%
São Paulo 69%
Scotland* 50%29
South Australia* 50%30
Vermont 90%
Wales* 15%
Washington* 15%31
Table 5: Progress toward 2020 GHG reduction targets
renewable energy targets
Another commonly reported climate commitment through the Compact of States and Regions is a renewable energy or power target, expressed as a percentage share of the region’s energy or power mix.
In the way that region-wide emissions reduction targets provide an indication of a region’s overall path toward decarbonization, renewables targets provide a similar sense of the region’s future energy profile.
The two types of targets often go hand in hand, with the decarbonization of energy supply contributing to overall GHG emission reductions. In fact, over two thirds of governments reporting a region-wide emissions reduction target also reported a renewable energy and/or power target.
−− Overall, 68% of reporting governments (25) have adopted a renewable energy and/or renewable power target.
−− About half of the renewable targets (12) apply only to the power sector.
timeframes for renewable energy/power targets:
−− 72% of governments (18) reported a near-term target (i.e. 2020 or earlier);
−− 36% of governments (9) reported a mid-term target (i.e. 2021-2035); and
−− 12% of governments (3) reported a long-term target (i.e. 2050 and beyond).
Table 6: Renewable energy/power targets
25 Carinthia’s target is for region-wide heat and power supply to be 100% CO2 neutral and nuclear-free by 2025 based on 2005 levels.
26 Connecticut’s target is a renewable portfolio standard, which requires individual electricity providers to obtain a minimum percentage of their retail load from renewable energy. The share of renewable power indicated in the target is therefore not necessarily the same as region-wide renewable power generation. 27 Ontario’s mid-term target year is 2025.28 Oregon’s mid-term target year is 2025. The target is a renewable portfolio standard, which requires Oregon’s largest utilities to obtain a minimum percentage of their retail load from renewable energy. Oregon currently gets 76% of its state-wide power from renewables. 29 Scotland’s near-term target year is 2015.30 South Australia’s mid-term target year is 2025.31 Washington’s target is a renewable portfolio standard, which requires 84% of utilities to obtain a minimum percentage of their retail load from renewable energy. Washington currently gets 76% of its state-wide power from renewables.
*Target applies to the power sector
GOVERNMENT CURRENT REDUCTION BELOW BASE YEAR
TARGET REDUCTION IN 2020
PROGRESS TOWARD 2020 TARGET
Aquitaine 20% 20% 100%
Baden-Württemberg 15% 25% 60%
British Columbia 4% 33% 12%
Brittany 4% 17% 24%
Catalonia 10% 25% 40%
Carinthia* 17% 16% 106%
Connecticut 11% 10% 110%
Drenthe 8% 20% 40%
Jämtland 24% 50% 48%
Lombardy* 18% 20% 90%
Midi-Pyrénées 15% 19% 79%
Newfoundland and Labrador 11% 10% 110%
North Rhine-Westphalia 15% 25% 60%
Ontario 6% 15% 40%
Provence-Alpes-Côte d’Azur 27% 20% 135%
Québec 8% 20% 40%
Rhône-Alpes 6% 29% 21%
Scotland 26% 42% 62%
Wales 18% 40% 45%
*Target applies to non-EU ETS emissions

24 CompaCt of states and regions | disClosure report 201523CompaCt of states and regions | disClosure report 2015
RENEWABLE SOURCE
GOVERNMENT TARGET
Biomass Northwest Territories
Increase the capacity of biomass heat in residential, commercial and institutional buildings by 100% by 2015.
Hydro Québec Add 4,000 MW of hydroelectricity production by 2017.
Solar Connecticut Increase deployment of residential solar photovoltaic systems from 30 MW to 300 MW by 2022.
KwaZulu-Natal Install solar geysers in one of every 20 new government-supplied housing units by 2020.
La Réunion Have 50% of residential housing equipped with solar hot water by 2020, and 80% by 2030.
Laikipia County Power 25% of households with solar electricity by 2025.
Northwest Territories
Increase the use of solar electricity within diesel powered communities to 20% by 2017.
Wind Manitoba Increase wind power capacity to 1,000 MW (as economically viable).
Québec Add 4,000 MW of wind electricity by 2017.
2020
18 governments 9 governments 3 governments
72% 36% 12%2030 2050
based on 25 governments who reported a renewable energy/power target.
range of renewable energy/power targets:
−− Half of the near-term renewable targets (9) are in the 15-25% range, with the other half ranging from 27-90%. No specific near-term target was particularly common, reflecting diversity between regions’ potential energy mix.
−− 44% of the mid-term renewable targets (4) are in the 40-50% range, with the most commonly reported mid-term target being a 50% share of renewables in the energy/power mix.
−− Two of the three long-term targets are in the 80-90% range (the other being 40% share of renewables in the energy mix).
In addition, several governments also reported source-specific renewable energy targets, aimed at increasing the generation or consumption of a specific renewable source, such as biomass, hydro, solar and wind.
Table 7: Selected source-specific renewable energy/power targets
Others, including Newfoundland and Labrador and British Columbia (Canada), which are already close to 100% renewable energy/power at 90% and 93% respectively, reported intent to continue in that direction with the addition of new renewable energy capacity in the coming years.
renewable power trends to date
Most reporting governments already get a significant amount of their power from renewable sources.
−− About a third of governments (31%) get more than 75% of their power from renewable sources.
−− 5% get between 50-74% of their power from renewable sources.
−− About a quarter (26%) get between 25-49% of their power from renewable sources.
−− About a third of governments (36%) currently get less than 25% of their power from renewable sources.
Figure 5: Share of fossil fuel, nuclear and renewable energy in region-wide electricity generation
ALBERTAAQUITAINE
AUSTRALIAN CAPITAL TERRITORY*BADEN-WüRTTEMBERG
BASQUE COUNTRYBAVARIA
BRITISH COLUMBIABRITTANY
CALIFORNIACARINTHIACATALONIA
CONNECTICUTDRENTHE**
EMILIA-ROMAGNAJALISCO
JäMTLANDKWAZULU-NATAL*
LA RéUNIONLAIKIPIA COUNTY
LOMBARDYMANITOBA
MIDI-PYRENEESMINAS GERAIS
NEW CALEDONIANEW YORK
NEWFOUNDLAND AND LABRADORNORTH RHINE-WESTPHALIA
NORTHWEST TERRITORIESONTARIOOREGON
PROVENCE-ALPES-COTES-D’AZURQUEBEC
RHôNE-ALPESRIO DE JANEIRO
SãO PAULOSCOTLAND
SOUTH AUSTRALIAVALENCIAVERMONT
WALESWASHINGTON
YUCATAN
Percent of region-wide electricity generation
0 402010 30 50 7060 80 10090
fossil fuels nuclear renewables other no data
* Reported electricity mix and associated figures refer to region-wide consumption not generation
** Data represents total energy mix, not solely electricity
26 CompaCt of states and regions | disClosure report 201525CompaCt of states and regions | disClosure report 2015
GOVERNMENT PERCENT INCREASE IN ENERGY EFFICIENCY
BASE YEAR TARGET YEAR
Aquitaine 28% 2008 2020
Catalonia 20% 2007 2020
Emilia-Romagna 20% BAU 2020
Jämtland 30% 1990 2020
Newfoundland and Labrador 20% 2007 2020
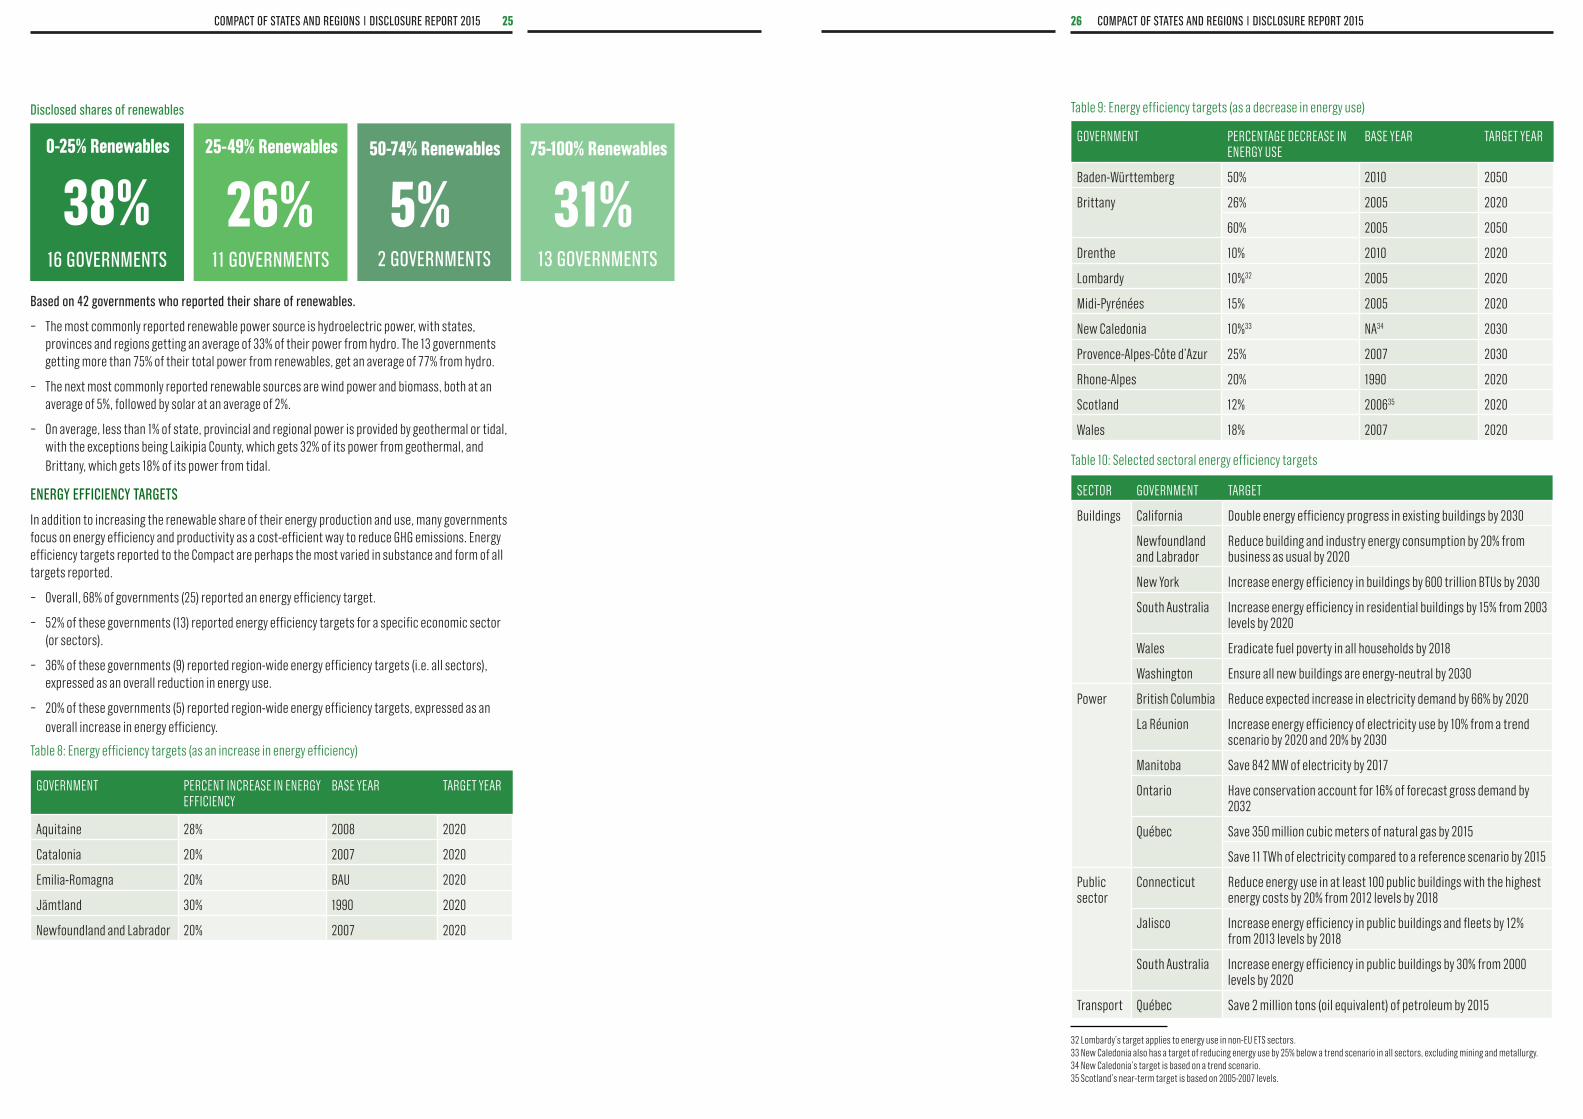
Table 9: Energy efficiency targets (as a decrease in energy use)
GOVERNMENT PERCENTAGE DECREASE IN ENERGY USE
BASE YEAR TARGET YEAR
Baden-Württemberg 50% 2010 2050
Brittany 26% 2005 2020
60% 2005 2050
Drenthe 10% 2010 2020
Lombardy 10%32 2005 2020
Midi-Pyrénées 15% 2005 2020
New Caledonia 10%33 NA34 2030
Provence-Alpes-Côte d’Azur 25% 2007 2030
Rhone-Alpes 20% 1990 2020
Scotland 12% 200635 2020
Wales 18% 2007 2020
Table 10: Selected sectoral energy efficiency targets
SECTOR GOVERNMENT TARGET
Buildings California Double energy efficiency progress in existing buildings by 2030
Newfoundland and Labrador
Reduce building and industry energy consumption by 20% from business as usual by 2020
New York Increase energy efficiency in buildings by 600 trillion BTUs by 2030
South Australia Increase energy efficiency in residential buildings by 15% from 2003 levels by 2020
Wales Eradicate fuel poverty in all households by 2018
Washington Ensure all new buildings are energy-neutral by 2030
Power British Columbia Reduce expected increase in electricity demand by 66% by 2020
La Réunion Increase energy efficiency of electricity use by 10% from a trend scenario by 2020 and 20% by 2030
Manitoba Save 842 MW of electricity by 2017
Ontario Have conservation account for 16% of forecast gross demand by 2032
Québec Save 350 million cubic meters of natural gas by 2015
Save 11 TWh of electricity compared to a reference scenario by 2015
Public sector
Connecticut Reduce energy use in at least 100 public buildings with the highest energy costs by 20% from 2012 levels by 2018
Jalisco Increase energy efficiency in public buildings and fleets by 12% from 2013 levels by 2018
South Australia Increase energy efficiency in public buildings by 30% from 2000 levels by 2020
Transport Québec Save 2 million tons (oil equivalent) of petroleum by 2015
disclosed shares of renewables
0-25% renewables
16 governments 11 governments 2 governments 13 governments
38% 26% 5% 31%25-49% renewables 50-74% renewables 75-100% renewables
based on 42 governments who reported their share of renewables.
−− The most commonly reported renewable power source is hydroelectric power, with states, provinces and regions getting an average of 33% of their power from hydro. The 13 governments getting more than 75% of their total power from renewables, get an average of 77% from hydro.
−− The next most commonly reported renewable sources are wind power and biomass, both at an average of 5%, followed by solar at an average of 2%.
−− On average, less than 1% of state, provincial and regional power is provided by geothermal or tidal, with the exceptions being Laikipia County, which gets 32% of its power from geothermal, and Brittany, which gets 18% of its power from tidal.
energy effiCienCy targets
In addition to increasing the renewable share of their energy production and use, many governments focus on energy efficiency and productivity as a cost-efficient way to reduce GHG emissions. Energy efficiency targets reported to the Compact are perhaps the most varied in substance and form of all targets reported.
−− Overall, 68% of governments (25) reported an energy efficiency target.
−− 52% of these governments (13) reported energy efficiency targets for a specific economic sector (or sectors).
−− 36% of these governments (9) reported region-wide energy efficiency targets (i.e. all sectors), expressed as an overall reduction in energy use.
−− 20% of these governments (5) reported region-wide energy efficiency targets, expressed as an overall increase in energy efficiency.
Table 8: Energy efficiency targets (as an increase in energy efficiency)
32 Lombardy’s target applies to energy use in non-EU ETS sectors. 33 New Caledonia also has a target of reducing energy use by 25% below a trend scenario in all sectors, excluding mining and metallurgy.34 New Caledonia’s target is based on a trend scenario.35 Scotland’s near-term target is based on 2005-2007 levels.
28 CompaCt of states and regions | disClosure report 2015
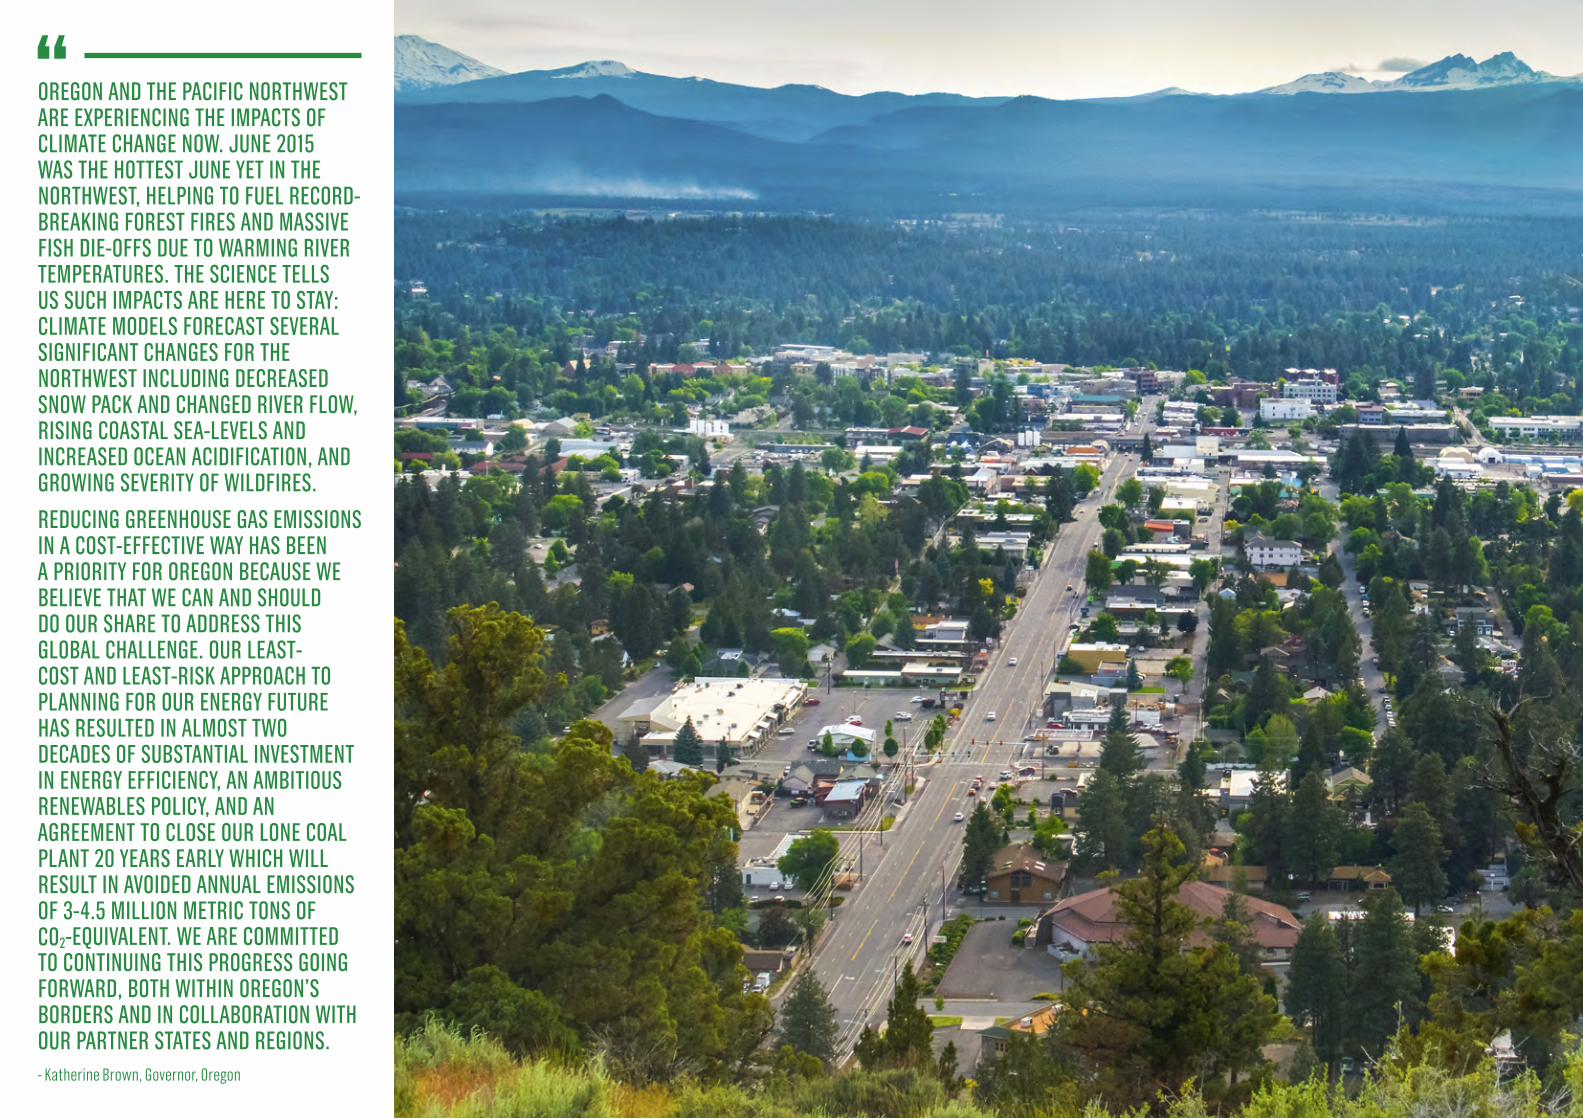
oregon and the paCifiC northwest are experienCing the impaCts of Climate Change now. june 2015 was the hottest june yet in the northwest, helping to fuel reCord-breaking forest fires and massive fish die-offs due to warming river temperatures. the sCienCe tells us suCh impaCts are here to stay: Climate models foreCast several signifiCant Changes for the northwest inCluding deCreased snow paCk and Changed river flow, rising Coastal sea-levels and inCreased oCean aCidifiCation, and growing severity of wildfires.
reduCing greenhouse gas emissions in a Cost-effeCtive way has been a priority for oregon beCause we believe that we Can and should do our share to address this global Challenge. our least-Cost and least-risk approaCh to planning for our energy future has resulted in almost two deCades of substantial investment in energy effiCienCy, an ambitious renewables poliCy, and an agreement to Close our lone Coal plant 20 years early whiCh will result in avoided annual emissions of 3-4.5 million metriC tons of Co2-eQuivalent. we are Committed to Continuing this progress going forward, both within oregon’s borders and in Collaboration with our partner states and regions. - Katherine Brown, Governor, Oregon
30 CompaCt of states and regions | disClosure report 201529CompaCt of states and regions | disClosure report 2015
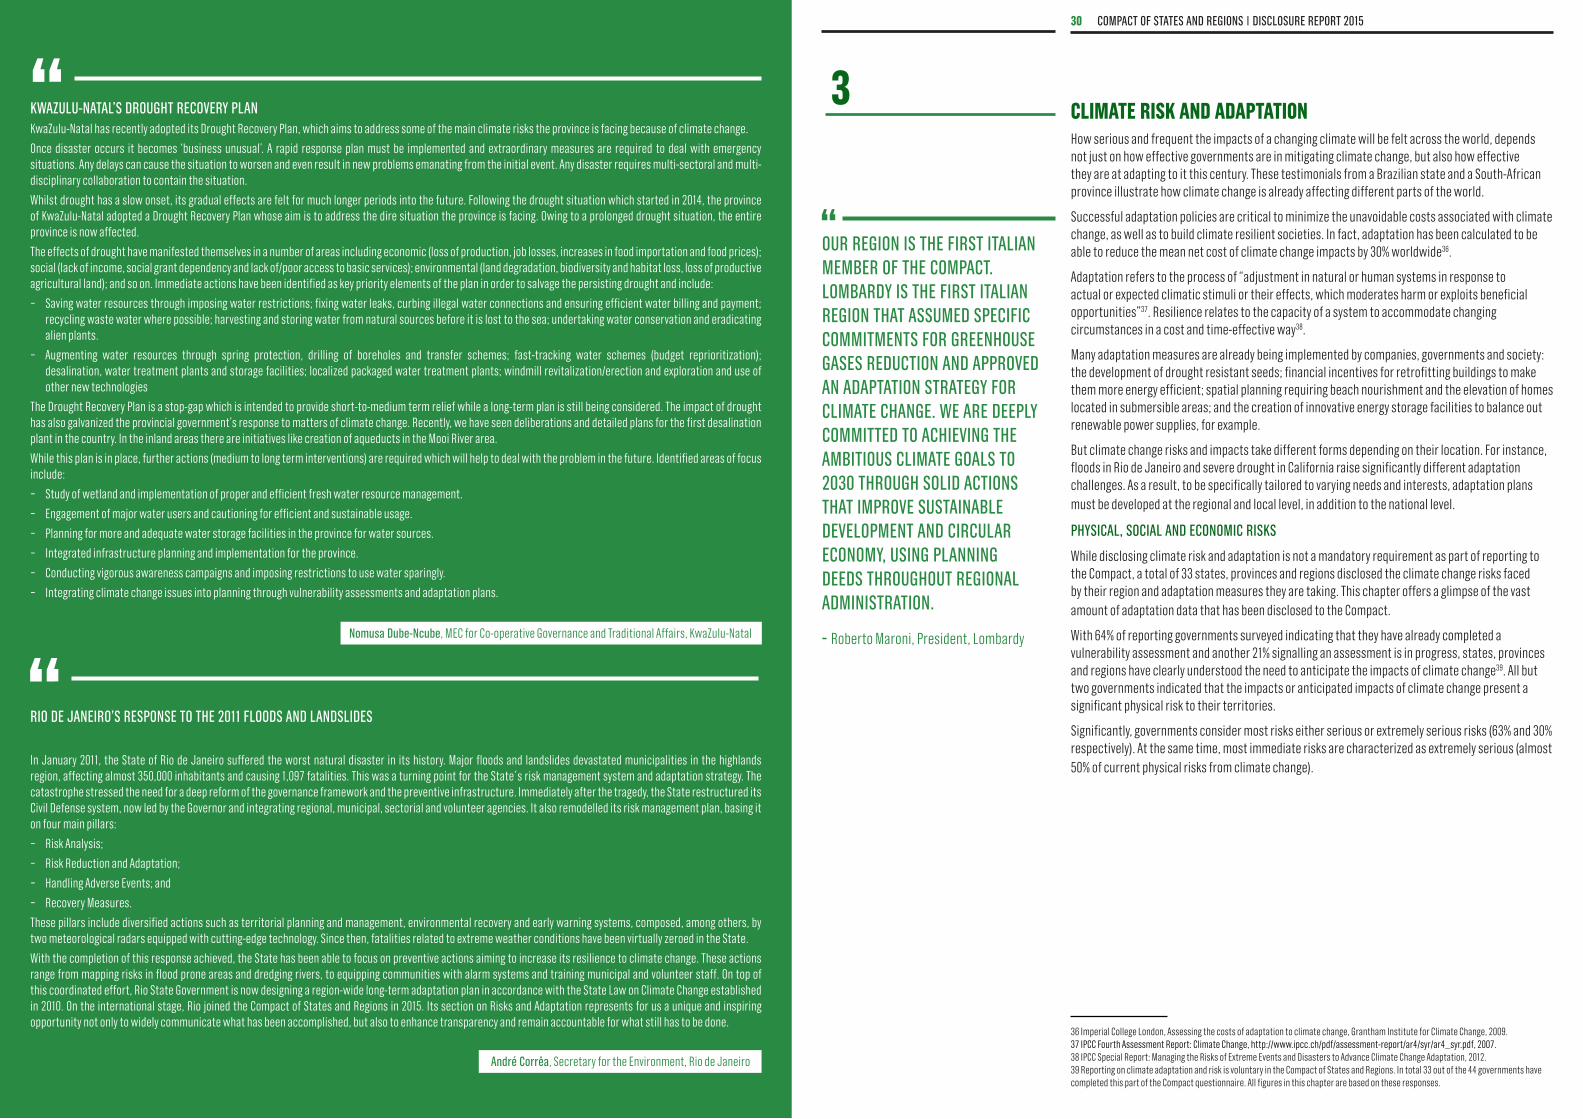
climate risk anD aDaptation How serious and frequent the impacts of a changing climate will be felt across the world, depends not just on how effective governments are in mitigating climate change, but also how effective they are at adapting to it this century. These testimonials from a Brazilian state and a South-African province illustrate how climate change is already affecting different parts of the world.
Successful adaptation policies are critical to minimize the unavoidable costs associated with climate change, as well as to build climate resilient societies. In fact, adaptation has been calculated to be able to reduce the mean net cost of climate change impacts by 30% worldwide36.
Adaptation refers to the process of “adjustment in natural or human systems in response to actual or expected climatic stimuli or their effects, which moderates harm or exploits beneficial opportunities”37. Resilience relates to the capacity of a system to accommodate changing circumstances in a cost and time-effective way38.
Many adaptation measures are already being implemented by companies, governments and society: the development of drought resistant seeds; financial incentives for retrofitting buildings to make them more energy efficient; spatial planning requiring beach nourishment and the elevation of homes located in submersible areas; and the creation of innovative energy storage facilities to balance out renewable power supplies, for example.
But climate change risks and impacts take different forms depending on their location. For instance, floods in Rio de Janeiro and severe drought in California raise significantly different adaptation challenges. As a result, to be specifically tailored to varying needs and interests, adaptation plans must be developed at the regional and local level, in addition to the national level.
physiCal, soCial and eConomiC risks
While disclosing climate risk and adaptation is not a mandatory requirement as part of reporting to the Compact, a total of 33 states, provinces and regions disclosed the climate change risks faced by their region and adaptation measures they are taking. This chapter offers a glimpse of the vast amount of adaptation data that has been disclosed to the Compact.
With 64% of reporting governments surveyed indicating that they have already completed a vulnerability assessment and another 21% signalling an assessment is in progress, states, provinces and regions have clearly understood the need to anticipate the impacts of climate change39. All but two governments indicated that the impacts or anticipated impacts of climate change present a significant physical risk to their territories.
Significantly, governments consider most risks either serious or extremely serious risks (63% and 30% respectively). At the same time, most immediate risks are characterized as extremely serious (almost 50% of current physical risks from climate change).
3
our region is the first italian member of the CompaCt. lombardy is the first italian region that assumed speCifiC Commitments for greenhouse gases reduCtion and approved an adaptation strategy for Climate Change. we are deeply Committed to aChieving the ambitious Climate goals to 2030 through solid aCtions that improve sustainable development and CirCular eConomy, using planning deeds throughout regional administration.
- Roberto Maroni, President, Lombardynomusa dube-ncube, MEC for Co-operative Governance and Traditional Affairs, KwaZulu-Natal
kwaZulu-natal’s drought reCovery plan KwaZulu-Natal has recently adopted its Drought Recovery Plan, which aims to address some of the main climate risks the province is facing because of climate change.
Once disaster occurs it becomes ‘business unusual’. A rapid response plan must be implemented and extraordinary measures are required to deal with emergency situations. Any delays can cause the situation to worsen and even result in new problems emanating from the initial event. Any disaster requires multi-sectoral and multi-disciplinary collaboration to contain the situation.
Whilst drought has a slow onset, its gradual effects are felt for much longer periods into the future. Following the drought situation which started in 2014, the province of KwaZulu-Natal adopted a Drought Recovery Plan whose aim is to address the dire situation the province is facing. Owing to a prolonged drought situation, the entire province is now affected.
The effects of drought have manifested themselves in a number of areas including economic (loss of production, job losses, increases in food importation and food prices); social (lack of income, social grant dependency and lack of/poor access to basic services); environmental (land degradation, biodiversity and habitat loss, loss of productive agricultural land); and so on. Immediate actions have been identified as key priority elements of the plan in order to salvage the persisting drought and include:
−− Saving water resources through imposing water restrictions; fixing water leaks, curbing illegal water connections and ensuring efficient water billing and payment; recycling waste water where possible; harvesting and storing water from natural sources before it is lost to the sea; undertaking water conservation and eradicating alien plants.
−− Augmenting water resources through spring protection, drilling of boreholes and transfer schemes; fast-tracking water schemes (budget reprioritization); desalination, water treatment plants and storage facilities; localized packaged water treatment plants; windmill revitalization/erection and exploration and use of other new technologies
The Drought Recovery Plan is a stop-gap which is intended to provide short-to-medium term relief while a long-term plan is still being considered. The impact of drought has also galvanized the provincial government’s response to matters of climate change. Recently, we have seen deliberations and detailed plans for the first desalination plant in the country. In the inland areas there are initiatives like creation of aqueducts in the Mooi River area.
While this plan is in place, further actions (medium to long term interventions) are required which will help to deal with the problem in the future. Identified areas of focus include:
−− Study of wetland and implementation of proper and efficient fresh water resource management.
−− Engagement of major water users and cautioning for efficient and sustainable usage.
−− Planning for more and adequate water storage facilities in the province for water sources.
−− Integrated infrastructure planning and implementation for the province.
−− Conducting vigorous awareness campaigns and imposing restrictions to use water sparingly.
−− Integrating climate change issues into planning through vulnerability assessments and adaptation plans.
rio de janeiro’s response to the 2011 floods and landslides
In January 2011, the State of Rio de Janeiro suffered the worst natural disaster in its history. Major floods and landslides devastated municipalities in the highlands region, affecting almost 350,000 inhabitants and causing 1,097 fatalities. This was a turning point for the State´s risk management system and adaptation strategy. The catastrophe stressed the need for a deep reform of the governance framework and the preventive infrastructure. Immediately after the tragedy, the State restructured its Civil Defense system, now led by the Governor and integrating regional, municipal, sectorial and volunteer agencies. It also remodelled its risk management plan, basing it on four main pillars:
−− Risk Analysis;
−− Risk Reduction and Adaptation;
−− Handling Adverse Events; and
−− Recovery Measures.
These pillars include diversified actions such as territorial planning and management, environmental recovery and early warning systems, composed, among others, by two meteorological radars equipped with cutting-edge technology. Since then, fatalities related to extreme weather conditions have been virtually zeroed in the State.
With the completion of this response achieved, the State has been able to focus on preventive actions aiming to increase its resilience to climate change. These actions range from mapping risks in flood prone areas and dredging rivers, to equipping communities with alarm systems and training municipal and volunteer staff. On top of this coordinated effort, Rio State Government is now designing a region-wide long-term adaptation plan in accordance with the State Law on Climate Change established in 2010. On the international stage, Rio joined the Compact of States and Regions in 2015. Its section on Risks and Adaptation represents for us a unique and inspiring opportunity not only to widely communicate what has been accomplished, but also to enhance transparency and remain accountable for what still has to be done.
andré Corrêa, Secretary for the Environment, Rio de Janeiro
36 Imperial College London, Assessing the costs of adaptation to climate change, Grantham Institute for Climate Change, 2009.37 IPCC Fourth Assessment Report: Climate Change, http://www.ipcc.ch/pdf/assessment-report/ar4/syr/ar4_syr.pdf, 2007.38 IPCC Special Report: Managing the Risks of Extreme Events and Disasters to Advance Climate Change Adaptation, 2012.39 Reporting on climate adaptation and risk is voluntary in the Compact of States and Regions. In total 33 out of the 44 governments have completed this part of the Compact questionnaire. All figures in this chapter are based on these responses.

32 CompaCt of states and regions | disClosure report 201531CompaCt of states and regions | disClosure report 2015
Figure 6: Physical risks from climate change
70
60
50
40
30
20
10
0
num
ber o
f ris
ks
short-term
(2016-2025)
medium-term
(2026-2050)
long-term
(>2050)Current
seriousless serious extremely serious
time scale of risk
Over 180 physical risks from climate change were reported by these 33 states, provinces and regions. The main concern for reporting governments at present relates to temperature increases and heatwaves (27% of total number of risks). Other significant risks are frequent or intense rainfall (24%), droughts (17%), and sea-level rise (12%).
Figure 7: Most commonly reported physical climate risks
Some of these climate risks pose similar threats to states, provinces and regions worldwide. No less than 15 governments flagged sea-level rise as a threat to their coastal communities. In places like Northwest Territories, sea-level rise is already impacting coastal settlements through erosion, while other states, provinces and regions are anticipating effects this century. New York State reported that by 2050, 800,000 people will live in the 100-year coastal floodplain for New York City.
For other climate risks, the immediate threats vary from region to region. Québec, for example, indicated that increased frequency of large storms raises the likelihood of damage to its energy production and transport network, while Yucatán identified more general threats to its resilience capacity such as damage to infrastructure, housing problems and health issues.
In addition to physical risks, the Compact of States and Regions also recorded economic and social risks of climate change. No less than 73% of the governments indicated that climate change threatens the ability of businesses to operate successfully in their region. The major concerns are in relation to activities dependent on natural resources such as agriculture, fishing and forestry.
A smaller number of states, provinces and regions were concerned with losses to businesses in industry, commerce or service sectors, in relation to infrastructure damage and more direct increases of costs to run operations40.
In terms of social impacts, governments indicate a sense of urgency with the majority of risks deemed to be taking place at present or in the short term (60%). As shown below, an increase of disease and risk to more vulnerable populations were the main concerns. Other significant problems were also raised, including fluctuations of socio-economic conditions, increases in resource and public service demands, and population displacements.
Figure 8: Distribution of disclosed social risks
adaptation plans and aCtion
An increasing number of states and regions are beginning to anticipate and plan for the impacts of a changing climate, in addition to executing climate mitigation strategies.
27 out of the 33 governments that reported on adaptation and risk through the Compact questionnaire (82%) reported that they already have a dedicated climate adaptation plan in place, while others are working to develop them. With all of these plans dating from 2010 or after, states, provinces and regions are clearly stepping up to build resilient economies.
Adaptation plans generally follow a basic structure:
−− Outline vulnerabilities to climate change impacts.
−− Develop a plan to become more resilient to these impacts.
−− Implement the plan and take action.
−− Monitor and evaluate progress.
With a total of 170 adaptation actions reported to the Compact, it is clear that states, provinces and regions are focused on the need to mitigate the physical, economic and social risks of climate change to protect their territories, businesses and populations.
However, adaptation measures are still linked to regional income. On average, states, provinces and regions with a higher GDP income per capita reported three times more adaptation actions compared to their counterparts with lower income levels.
population displacement
increased risk to already vulnerable populations
increased incidence and prevalence of disease
fluctuating socio-economic conditions
increased demand for public services (including health)
increased resource demand
other
6%
23%
23%16%
10%
11%
11%
0 2010 30 40 50
Temperature increase/heatwaves
Frequent/intense rainfall
Drought
Sea level rise
Storms/floods
Other
40 Some states chose to report affirmatively to damages to business but without identifying a specific sector (6 states).
on behalf of the people of delta state, i want to Congratulate the
CompaCt of states and regions for the unparalleled drive in emission
reduCtions. with the assistanCe of r20, our state has been able to establish projeCts foCused
on Climate Change mitigation and adaptation and Creation of
green jobs in line with the smart agenda of my administration.
- Dr. Ifeanyi Okowa, Executive Governor, Delta State, Nigeria
number of risks

34 CompaCt of states and regions | disClosure report 201533CompaCt of states and regions | disClosure report 2015
Figure 9: GDP/capita versus disclosed adaptation actions
876543210
us$5000-15,000 > us$15,000< us$5000
number of disclosed actions
real Climate aCtions are aCComplished through many small Changes in homes, neighborhoods and loCal Communities. the appliCation of praCtiCal solutions that solve the needs of people where they live and work while also Contributing to solving the Climate problem is the only way to truly move this global effort forward. the small-sCale farmers in laikipia County are proving this approaCh through the tist program (www.tist.org), where they improve their farms by growing trees that generate additional inCome and produCe substantial verified Climate benefits. the CompaCt of states and regions Creates a framework for reporting these types of individual and ColleCtive aCtions and learning from one another. as a front-line Climate leader, muCh of my time is Consumed by helping people deal with the impaCts of higher temperatures, more severe weather events, and less prediCtable preCipitation ‘patterns.’ while it is already too late to avoid all the impaCts of Climate Change on the people of laikipia County, now is the time for the deCisive and Coordinated response reQuired to avoid even more devastating impaCts.
- Joshua Irungu, Governor, Laikipia County
4 beyonD a paris climate Deal: opportunities For long-term growth To limit global warming below 2°C, we must restrict cumulative global emissions to one trillion tons of carbon41. In order to achieve this, climate science tells us global GHG emissions must be reduced 40-70% below 2010 levels by 2050 – and carbon neutrality achieved by the end of the century. If, as projected, global population rises to around 9-10 billion people, this can be translated to a carbon budget of 2 metric tons per capita. Setting out a clear long-term decarbonization path benefits governments at all levels by:
ensuring a cost-efficient, low carbon transition
−− Investment in low carbon technologies and renewable energy has been rapidly growing. Since 2007, the global market for environmental technology and resource efficiency has grown by 11.8% a year on average, while the rest of the global economy experienced only 2.4% growth. Additionally, 7.7 million people were employed in the renewables sector alone in 2014, and jobs in the low carbon sector are expected to increase to 60 million over the next 20 years. To ensure the most cost-efficient low carbon transition, the IPCC recommends that global emissions peak in the next decade42. The later they peak, the more drastic (and costly) the cut in emissions will need to be to stay within the 2 degrees Celsius pathway.
maintaining consistent and ambitious climate policy
−− It setting deep, long-term emission reduction targets, governments can ensure ambition is not lost with changes in administration. North-Rhine Westphalia and Baden-Württemberg in Germany for example, have adopted legislation to make respective reduction targets of 80% and 90% by 2050 legally binding. By developing an ambitious roadmap that includes both long-term targets and an adaptation strategy in line with this goal, governments can work with businesses and civil society to plan a realistic transition toward a low carbon society.
providing long-term investment signals
−− The transition toward a low carbon economy requires large investments in key sectors including transport, energy, buildings and agriculture. These sectors will not change overnight, yet investment decisions are often made on the basis of long-term certainty. So investors have been calling on global policymakers to provide policy models that favor less carbon-intensive investments43. Businesses have also been advocating for ambitious 2050 policy roadmaps for some time, to trigger new technologies and incentivize emission-reducing activities44.
As illustrated in Chapter 2, around half of the governments reporting to the Compact of States and Regions have already set 2050 goals. A majority of these aim for reductions of more than 70% below base-year emissions. The vast impact of these envisaged cuts become apparent when looking at the carbon intensity per capita for these regions. In 2010, average region-wide carbon intensity of these 21 governments equalled 11.92 tCO
2e per capita. Based on the 21 long-term targets disclosed through
the Compact of States and Regions, per capita carbon intensity would drop to 6.59 tCO2e by 2030 and
be reduced further to 2.66 tCO2e by 2050.
furthermore, data for individual governments reveals that over 43% are on course to lower their emissions below 2tCo
2e per capita by 2050, with an additional third of these governments seeking
to achieve between 2 and 3tCo2e per capita by 2050.
41 IPCC, 2014: Climate Change 2014: Synthesis Report Contribution of Working Groups I, II and III to the Fifth Assessment Report of the Intergovernmental Panel on Climate Change [Core Writing Team, R.K. Pachauri and L.A. Meyer (eds.)]. IPCC, Geneva, Switzerland, 151 pp.42 IPCC, ‘Emissions trajectories for stabilisations’, Climate Change 2007: Synthesis Report 2007, https://www.ipcc.ch/publications_and_data/ar4/syr/en/mains5-4.html.43 Principles for Responsible Investment Association, ‘Global investor statement on climate change: Reducing risks, seizing opportunities and closing the climate investment gap’, http://www.unpri.org/press/global-investor-statement-on-climate-change-reducing-risks-seizing-opportunities-and-closing-the-climate-investment-gap-2/, November 2010.44 We Mean Business, ‘The Climate Has Changed’, http://www.wemeanbusinesscoalition.org/sites/default/files/The%20Climate%20Has%20Changed_1.pdf, 2014.
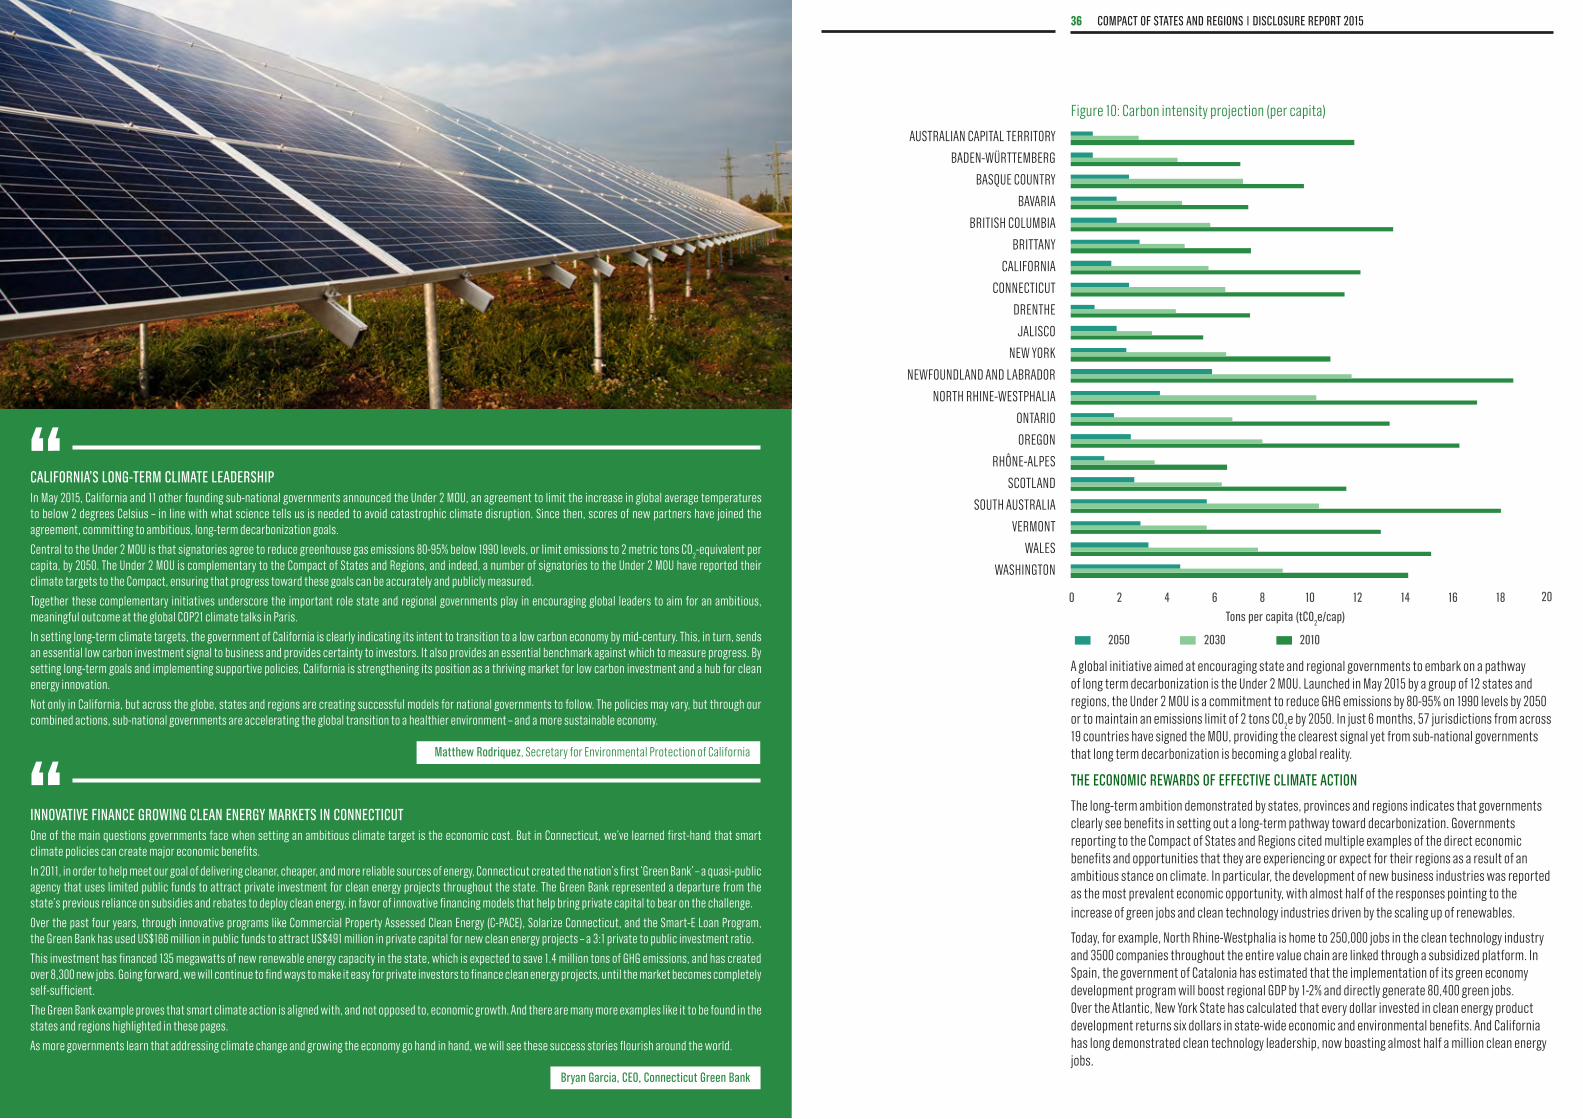
36 CompaCt of states and regions | disClosure report 201535CompaCt of states and regions | disClosure report 2015
Figure 10: Carbon intensity projection (per capita)
A global initiative aimed at encouraging state and regional governments to embark on a pathway of long term decarbonization is the Under 2 MOU. Launched in May 2015 by a group of 12 states and regions, the Under 2 MOU is a commitment to reduce GHG emissions by 80-95% on 1990 levels by 2050 or to maintain an emissions limit of 2 tons CO
2e by 2050. In just 6 months, 57 jurisdictions from across
19 countries have signed the MOU, providing the clearest signal yet from sub-national governments that long term decarbonization is becoming a global reality.
the eConomiC rewards of effeCtive Climate aCtion
The long-term ambition demonstrated by states, provinces and regions indicates that governments clearly see benefits in setting out a long-term pathway toward decarbonization. Governments reporting to the Compact of States and Regions cited multiple examples of the direct economic benefits and opportunities that they are experiencing or expect for their regions as a result of an ambitious stance on climate. In particular, the development of new business industries was reported as the most prevalent economic opportunity, with almost half of the responses pointing to the increase of green jobs and clean technology industries driven by the scaling up of renewables.
Today, for example, North Rhine-Westphalia is home to 250,000 jobs in the clean technology industry and 3500 companies throughout the entire value chain are linked through a subsidized platform. In Spain, the government of Catalonia has estimated that the implementation of its green economy development program will boost regional GDP by 1-2% and directly generate 80,400 green jobs. Over the Atlantic, New York State has calculated that every dollar invested in clean energy product development returns six dollars in state-wide economic and environmental benefits. And California has long demonstrated clean technology leadership, now boasting almost half a million clean energy jobs.
AUSTRALIAN CAPITAL TERRITORY
BADEN-WüRTTEMBERG
BASQUE COUNTRY
BAVARIA
BRITISH COLUMBIA
BRITTANY
CALIFORNIA
CONNECTICUT
DRENTHE
JALISCO
NEW YORK
NEWFOUNDLAND AND LABRADOR
NORTH RHINE-WESTPHALIA
ONTARIO
OREGON
RHôNE-ALPES
SCOTLAND
SOUTH AUSTRALIA
VERMONT
WALES
WASHINGTON
0 842 6 10 1412 16 18
2050 2030 2010
California’s long-term Climate leadership In May 2015, California and 11 other founding sub-national governments announced the Under 2 MOU, an agreement to limit the increase in global average temperatures to below 2 degrees Celsius – in line with what science tells us is needed to avoid catastrophic climate disruption. Since then, scores of new partners have joined the agreement, committing to ambitious, long-term decarbonization goals.
Central to the Under 2 MOU is that signatories agree to reduce greenhouse gas emissions 80-95% below 1990 levels, or limit emissions to 2 metric tons CO2-equivalent per
capita, by 2050. The Under 2 MOU is complementary to the Compact of States and Regions, and indeed, a number of signatories to the Under 2 MOU have reported their climate targets to the Compact, ensuring that progress toward these goals can be accurately and publicly measured.
Together these complementary initiatives underscore the important role state and regional governments play in encouraging global leaders to aim for an ambitious, meaningful outcome at the global COP21 climate talks in Paris.
In setting long-term climate targets, the government of California is clearly indicating its intent to transition to a low carbon economy by mid-century. This, in turn, sends an essential low carbon investment signal to business and provides certainty to investors. It also provides an essential benchmark against which to measure progress. By setting long-term goals and implementing supportive policies, California is strengthening its position as a thriving market for low carbon investment and a hub for clean energy innovation.
Not only in California, but across the globe, states and regions are creating successful models for national governments to follow. The policies may vary, but through our combined actions, sub-national governments are accelerating the global transition to a healthier environment – and a more sustainable economy.
matthew rodriquez, Secretary for Environmental Protection of California
innovative finanCe growing Clean energy markets in ConneCtiCutOne of the main questions governments face when setting an ambitious climate target is the economic cost. But in Connecticut, we’ve learned first-hand that smart climate policies can create major economic benefits.
In 2011, in order to help meet our goal of delivering cleaner, cheaper, and more reliable sources of energy, Connecticut created the nation’s first ‘Green Bank’ – a quasi-public agency that uses limited public funds to attract private investment for clean energy projects throughout the state. The Green Bank represented a departure from the state’s previous reliance on subsidies and rebates to deploy clean energy, in favor of innovative financing models that help bring private capital to bear on the challenge.
Over the past four years, through innovative programs like Commercial Property Assessed Clean Energy (C-PACE), Solarize Connecticut, and the Smart-E Loan Program, the Green Bank has used US$166 million in public funds to attract US$491 million in private capital for new clean energy projects – a 3:1 private to public investment ratio.
This investment has financed 135 megawatts of new renewable energy capacity in the state, which is expected to save 1.4 million tons of GHG emissions, and has created over 8,300 new jobs. Going forward, we will continue to find ways to make it easy for private investors to finance clean energy projects, until the market becomes completely self-sufficient.
The Green Bank example proves that smart climate action is aligned with, and not opposed to, economic growth. And there are many more examples like it to be found in the states and regions highlighted in these pages.
As more governments learn that addressing climate change and growing the economy go hand in hand, we will see these success stories flourish around the world.
bryan garcia, Ceo, Connecticut green bank
tons per capita (tCo2e/cap)
20
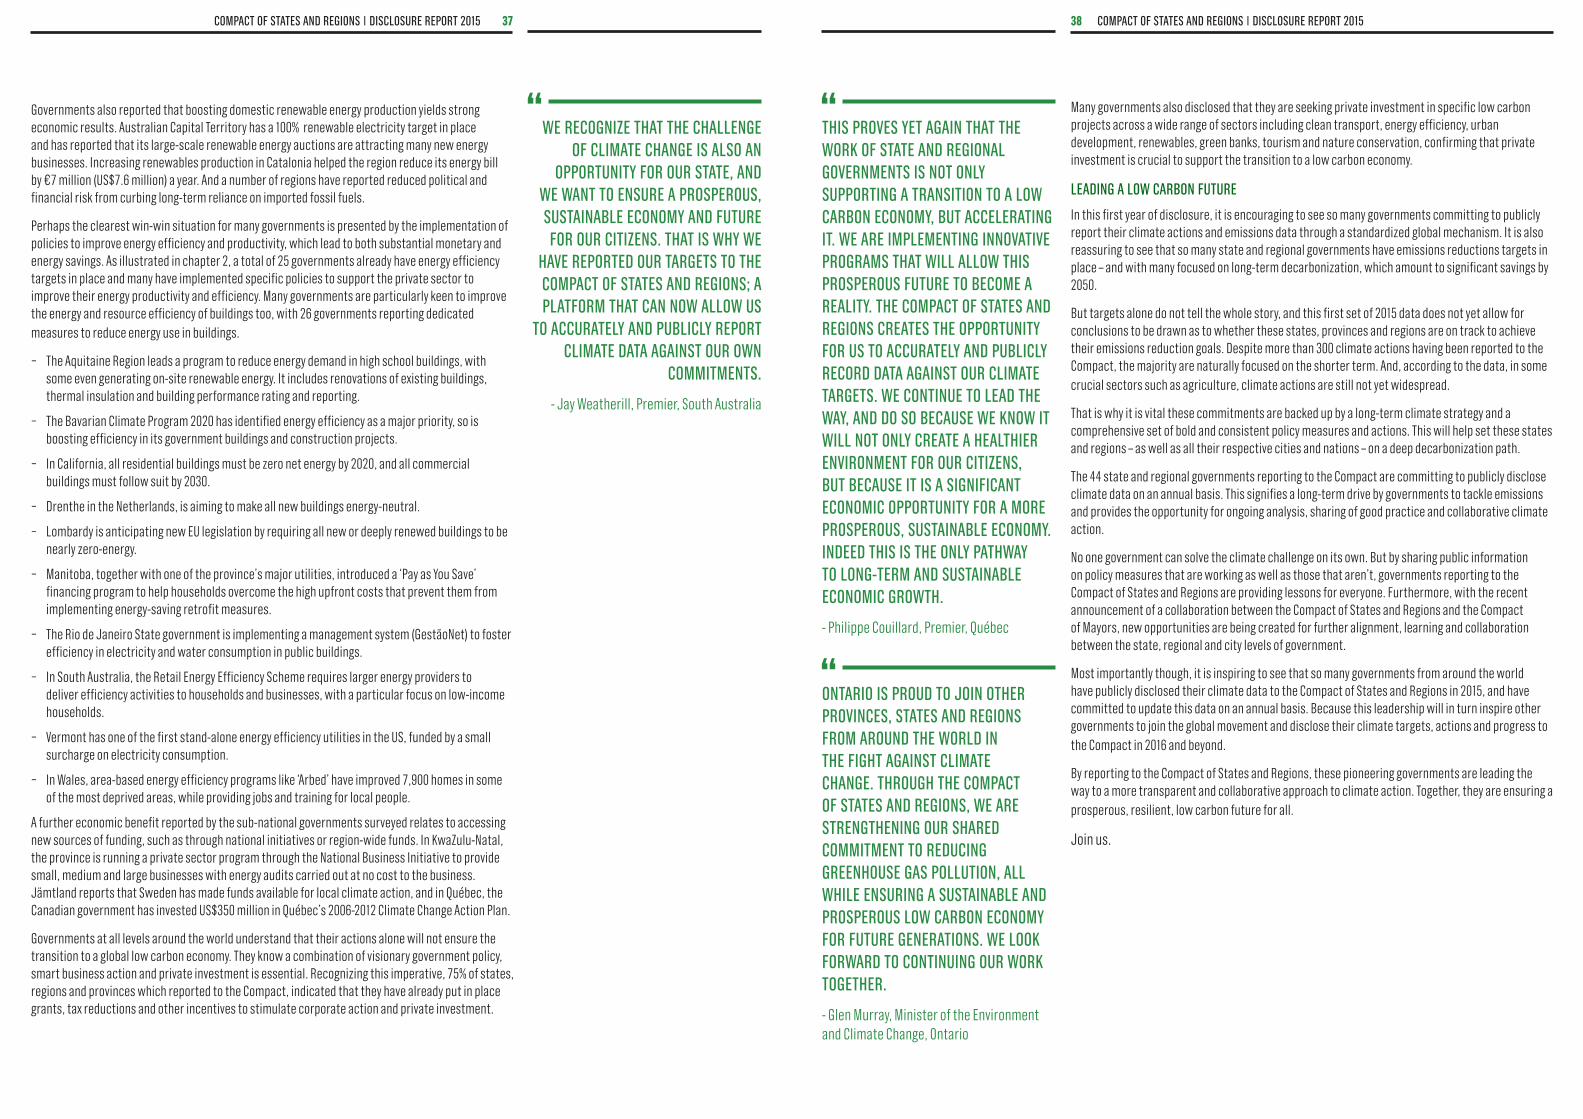
38 CompaCt of states and regions | disClosure report 201537CompaCt of states and regions | disClosure report 2015
Governments also reported that boosting domestic renewable energy production yields strong economic results. Australian Capital Territory has a 100% renewable electricity target in place and has reported that its large-scale renewable energy auctions are attracting many new energy businesses. Increasing renewables production in Catalonia helped the region reduce its energy bill by €7 million (US$7.6 million) a year. And a number of regions have reported reduced political and financial risk from curbing long-term reliance on imported fossil fuels.
Perhaps the clearest win-win situation for many governments is presented by the implementation of policies to improve energy efficiency and productivity, which lead to both substantial monetary and energy savings. As illustrated in chapter 2, a total of 25 governments already have energy efficiency targets in place and many have implemented specific policies to support the private sector to improve their energy productivity and efficiency. Many governments are particularly keen to improve the energy and resource efficiency of buildings too, with 26 governments reporting dedicated measures to reduce energy use in buildings.
−− The Aquitaine Region leads a program to reduce energy demand in high school buildings, with some even generating on-site renewable energy. It includes renovations of existing buildings, thermal insulation and building performance rating and reporting.
−− The Bavarian Climate Program 2020 has identified energy efficiency as a major priority, so is boosting efficiency in its government buildings and construction projects.
−− In California, all residential buildings must be zero net energy by 2020, and all commercial buildings must follow suit by 2030.
−− Drenthe in the Netherlands, is aiming to make all new buildings energy-neutral.
−− Lombardy is anticipating new EU legislation by requiring all new or deeply renewed buildings to be nearly zero-energy.
−− Manitoba, together with one of the province’s major utilities, introduced a ‘Pay as You Save’ financing program to help households overcome the high upfront costs that prevent them from implementing energy-saving retrofit measures.
−− The Rio de Janeiro State government is implementing a management system (GestãoNet) to foster efficiency in electricity and water consumption in public buildings.
−− In South Australia, the Retail Energy Efficiency Scheme requires larger energy providers to deliver efficiency activities to households and businesses, with a particular focus on low-income households.
−− Vermont has one of the first stand-alone energy efficiency utilities in the US, funded by a small surcharge on electricity consumption.
−− In Wales, area-based energy efficiency programs like ‘Arbed’ have improved 7,900 homes in some of the most deprived areas, while providing jobs and training for local people.
A further economic benefit reported by the sub-national governments surveyed relates to accessing new sources of funding, such as through national initiatives or region-wide funds. In KwaZulu-Natal, the province is running a private sector program through the National Business Initiative to provide small, medium and large businesses with energy audits carried out at no cost to the business. Jämtland reports that Sweden has made funds available for local climate action, and in Québec, the Canadian government has invested US$350 million in Québec’s 2006-2012 Climate Change Action Plan.
Governments at all levels around the world understand that their actions alone will not ensure the transition to a global low carbon economy. They know a combination of visionary government policy, smart business action and private investment is essential. Recognizing this imperative, 75% of states, regions and provinces which reported to the Compact, indicated that they have already put in place grants, tax reductions and other incentives to stimulate corporate action and private investment.
we reCogniZe that the Challenge of Climate Change is also an
opportunity for our state, and we want to ensure a prosperous, sustainable eConomy and future for our CitiZens. that is why we
have reported our targets to the CompaCt of states and regions; a platform that Can now allow us
to aCCurately and publiCly report Climate data against our own
Commitments.
- Jay Weatherill, Premier, South Australia
Many governments also disclosed that they are seeking private investment in specific low carbon projects across a wide range of sectors including clean transport, energy efficiency, urban development, renewables, green banks, tourism and nature conservation, confirming that private investment is crucial to support the transition to a low carbon economy.
leading a low Carbon future
In this first year of disclosure, it is encouraging to see so many governments committing to publicly report their climate actions and emissions data through a standardized global mechanism. It is also reassuring to see that so many state and regional governments have emissions reductions targets in place – and with many focused on long-term decarbonization, which amount to significant savings by 2050.
But targets alone do not tell the whole story, and this first set of 2015 data does not yet allow for conclusions to be drawn as to whether these states, provinces and regions are on track to achieve their emissions reduction goals. Despite more than 300 climate actions having been reported to the Compact, the majority are naturally focused on the shorter term. And, according to the data, in some crucial sectors such as agriculture, climate actions are still not yet widespread.
That is why it is vital these commitments are backed up by a long-term climate strategy and a comprehensive set of bold and consistent policy measures and actions. This will help set these states and regions – as well as all their respective cities and nations – on a deep decarbonization path.
The 44 state and regional governments reporting to the Compact are committing to publicly disclose climate data on an annual basis. This signifies a long-term drive by governments to tackle emissions and provides the opportunity for ongoing analysis, sharing of good practice and collaborative climate action.
No one government can solve the climate challenge on its own. But by sharing public information on policy measures that are working as well as those that aren’t, governments reporting to the Compact of States and Regions are providing lessons for everyone. Furthermore, with the recent announcement of a collaboration between the Compact of States and Regions and the Compact of Mayors, new opportunities are being created for further alignment, learning and collaboration between the state, regional and city levels of government.
Most importantly though, it is inspiring to see that so many governments from around the world have publicly disclosed their climate data to the Compact of States and Regions in 2015, and have committed to update this data on an annual basis. Because this leadership will in turn inspire other governments to join the global movement and disclose their climate targets, actions and progress to the Compact in 2016 and beyond.
By reporting to the Compact of States and Regions, these pioneering governments are leading the way to a more transparent and collaborative approach to climate action. Together, they are ensuring a prosperous, resilient, low carbon future for all.
Join us.
this proves yet again that the work of state and regional governments is not only supporting a transition to a low Carbon eConomy, but aCCelerating it. we are implementing innovative programs that will allow this prosperous future to beCome a reality. the CompaCt of states and regions Creates the opportunity for us to aCCurately and publiCly reCord data against our Climate targets. we Continue to lead the way, and do so beCause we know it will not only Create a healthier environment for our CitiZens, but beCause it is a signifiCant eConomiC opportunity for a more prosperous, sustainable eConomy. indeed this is the only pathway to long-term and sustainable eConomiC growth.
- Philippe Couillard, Premier, Québec
ontario is proud to join other provinCes, states and regions from around the world in the fight against Climate Change. through the CompaCt of states and regions, we are strengthening our shared Commitment to reduCing greenhouse gas pollution, all while ensuring a sustainable and prosperous low Carbon eConomy for future generations. we look forward to Continuing our work together.
- Glen Murray, Minister of the Environment and Climate Change, Ontario
40 CompaCt of states and regions | disClosure report 201539CompaCt of states and regions | disClosure report 2015
list of figures
figure 1: governments reporting to the Compact of states and regions in 2015
figure 2: projected ghg savings to 2050
figure 3: region-wide ghg reduction targets
figure 4: greenhouse gas emissions savings versus bau (2010-2050)
figure 5: share of fossil fuel, nuclear and renewable energy in region-wide electricity
generation
figure 6: physical risks from climate change
figure 7: most commonly reported physical climate risks
figure 8: distribution of disclosed social risks
figure 9: gdp/capita versus disclosed adaptation actions
figure 10: Carbon intensity projection (per capita)
list of tables
table 1: region-wide ghg reduction targets
table 2: selected sectoral ghg reduction targets
table 3: ghg emissions trend to date
table 4: recent ghg emissions trend
table 5: progress toward 2020 ghg reduction targets
table 6: renewable energy/power targets
table 7: selected source-specific renewable energy/power targets
table 8: energy efficiency targets (as an increase in overall energy efficiency)
table 9: energy efficiency targets (as a decrease in overall energy use)
table 10: selected sectoral energy efficiency targets
7
8
15
18
24
31
31
32
33
36
13
17
19
20
21
22
23
25
26
26
aCknowledgements authors:
Chris Thorpe, CDP
Evan Juska, The Climate Group
Gabriella Romano, The Climate Group
Jean-Charles Seghers, The Climate Group
Jeroen Gerlag, The Climate Group
Joana Setzer, nrg4SD
Kyra Appleby, CDP
Libby Ferguson, The Climate Group
Marine Puech, The Climate Group
data analysis:
Alice de Palma, CDP
Chris Thorpe, CDP
Evan Juska, The Climate Group
Jean-Charles Seghers, The Climate Group
Jody Dean, The Climate Group
Maia Kutner, CDP
Pedro Faria, CDP
editor: Clare Saxon Ghauri, The Climate Group
design : Jo Violaris, The Climate Group
project management : Jean-Charles Seghers, The Climate Group
42 CompaCt of states and regions | disClosure report 201541CompaCt of states and regions | disClosure report 2015
for more information, please contact any of the below organizations.
about the Climate group
The Climate Group is an award-winning, international non-profit. Our goal is a prosperous, low carbon future. We believe this will be achieved through a ‘clean revolution’: the rapid scale-up of low carbon energy and technology. We work with corporate and government partners to develop climate finance mechanisms, business models which promote innovation, and supportive policy frameworks. We convene leaders, share hard evidence of successful low carbon growth, and pilot practical solutions which can be replicated worldwide.
The Climate Group States & Regions Alliance brings together sub-national government leaders from around the world in a powerful, high-profile network that shares expertise, demonstrates impact and influences the international climate dialogue. Our 33 members represent some of the most economically powerful regions in the world and include governments from across Europe, the Americas, South Asia, Australia and Africa, collectively accounting for over 340 million citizens and 11% of global GDP.
theClimategroup.org | @Climategroup
about Cdp
CDP, formerly Carbon Disclosure Project, is an international, not-for-profit organization providing the only global system for companies, cities, and states and regions to measure, disclose, manage and share vital environmental information. CDP works with market forces, including 822 institutional investors with assets of US$95 trillion, to motivate companies to disclose their impacts on the environment and natural resources and take action to reduce them. CDP now holds the largest collection globally of primary climate change, water and forest risk commodities information and puts these insights at the heart of strategic business, investment and policy decisions.
Cdp.net | @Cdp
about nrg4sd
The Network of Regional Governments for Sustainable Development, nrg4SD is a non-profit international organization representing subnational governments and associations of subnational governments at global level. Established in 2002 at the World Summit of Johannesburg, today nrg4SD totals some 50 subnational governments from 30 countries and 7 associations of subnational governments.
nrg4SD campaigns internationally for the recognition of the role played by subnational governments in ensuring more effective sustainable development models. The network also focuses on Climate Change and Biodiversity, fostering the dissemination of members’ innovative actions, and encouraging cooperation and partnership programmes for the exchange of best practices.
nrg4sd.org | @nrg4sd
about r20
The R20-Regions of Climate Action is a non-profit organization founded in 2010 by former California Governor Arnold Schwarzenegger and other global leaders in cooperation with the United Nations. The R20 is a coalition of partners led by regional governments that work to promote and implement projects that are designed to produce local economic and environmental benefits in the form of reduced energy consumption and greenhouse gas emissions; strong local economies; improved public health; and new green jobs.
Through its large network of members and affiliate members (eg. the Assembly of European Regions), the R20 connects over 500 subnational and local governments around the world.
The R20 is a member of the Local Governments and Municipal Authorities (LGMA) constituency to the UNFCCC.
regions20.org | @regions20

43 CompaCt of states and regions | disClosure report 2015
PRINTED ON 100% RECYCLED PAPER