disclosure report as at 31 december - commerzbank
TRANSCRIPT

2020The bank at your side
Disclosure Report as at 31 December
in accordance with the Capital Requirements Regulation (CRR)
3 Introduction
5 Equity capital, capital requirement and RWA 5 Capital structure
9 Connection between balance-sheet and regulatory positions
13 Capital requirements and RWA
16 Risk-oriented overall bank management 16 Risk statement
18 Risk management organisation
18 Risk strategy and risk management
20 Risk-bearing capacity and stress testing
22 A. Credit risk (CR) 22 Risk management
25 Credit risk model
34 Credit risk mitigation
37 Credit risk and credit risk mitigation in the IRBA
43 Credit risk and credit risk mitigation in the SACR
46 Overarching portfolio analyses
52 Loan loss provisions for default risks
67 Investments in the banking book
69 B. Counterparty credit risk (CCR) 69 Risk management
71 Information on regulatory methods
73 Information by regulatory risk-weighting approach
77 Further information on counterparty credit risk
79 C. Securitisations (SEC) 79 Securitisation process
80 Risk management
81 Valuation methods and quantitative information
86 D. Market risk (MR) 86 Risk management
88 Market risk model
90 Quantitative information on market risks
94 Interest rate risk in the banking book
96 E. Liquidity risk (LR) 96 Risk management
96 Liquidity risk model
99 F. Operational risk (OR)
99 Risk management
100 OpRisk model
102 G. Other risks
103 Appendix 103 Additional tables (Appendix 1 to Appendix 5)
119 Overview: Compliance with the CRR requirements (Appendix 6)
122 List of abbreviations
Due to rounding, numbers and percentages presented throughout this report may notadd up precisely to the totals provided.
Contents

Introduction Equity capital Risk-oriented overall bank management Specific risk management Appendix 3
Commerzbank
Commerzbank is the leading bank for SMEs (the Mittelstand) and
a strong partner to some 30,000 corporate client groups and
around 11 million private and small-business customers in Ger-
many. The Bank offers a comprehensive portfolio of financial ser-
vices in two business segments – Private and Small-Business Cus-
tomers and Corporate Clients.
Commerzbank focuses on German SMEs, large companies and
institutional customers. In international business, the Bank sup-
ports customers who have business links with Germany and com-
panies in selected future-oriented sectors. Following the integra-
tion of comdirect, private and small-business customers benefit
from the services of one of Germany’s most modern online banks
combined with personal advisory services at a local level. The
Polish subsidiary mBank is an innovative digital bank. It serves
around 5.7 million private and small-business customers, mainly
in Poland but also in the Czech Republic and Slovakia.
The two segments Private and Small-Business Customers and
Corporate Clients are each managed by a member of the Board of
Managing Directors. All staff and management functions are con-
tained in Group Management: Group Audit, Group Communica-
tions, Group Compliance, Group Finance, Group Human Re-
sources, Group Investor Relations, Group Legal, Group Research,
Group Risk, Big Data & Advanced Analytics, Group Strategy Trans-
formation & Sustainability, Group Tax, Group Treasury and the
central risk functions. The support functions are provided by
Group Services. These include Group Corporate Clients&Treasury
Platforms, Group Business Platform, Group Digital Transformation,
Group Banking& Market Operations, Group Technology Founda-
tions, Group Operations Credit, Group Organisation&Security,
Group Delivery Centre and Group Client Data. The staff, manage-
ment and support functions are combined in the Others and Con-
solidation division for reporting purposes.
On the domestic market, Commerzbank Aktiengesellschaft is
headquartered in Frankfurt am Main, from where it manages its
branch network serving all customer groups. Following the mer-
ger with comdirect Bank AG, Commerz Real AG is now the biggest
domestic subsidiary. Outside of Germany, Commerzbank has 6
material subsidiaries, 20 operational foreign branches and 30 rep-
resentative offices in just under 50 countries and is represented in
all major financial centers, such as London, New York, Tokyo and
Singapore. However, the focus of the Bank’s international activi-
ties is on Europe.
A detailed description of Commerzbank Group is given in the
Annual Report 2020.
Objective of the Disclosure Report
This report is intended to give the reader a detailed insight into
Commerzbank’s current risk profile and risk management. In par-
ticular, it contains information on:
the Commerzbank Group’s structure from both a regulatory
and accounting perspective,
the Group’s capital structure,
the Commerzbank Group’s general risk management system
and
the risk management in respect of specific types of risk.
The report may also be seen as complementary to the Annual
Report pursuant to the German Commercial Code (Han-
delsgesetzbuch – HGB), since in contrast to the Annual Report it
focuses primarily on the supervisory perspective.
In this report Commerzbank Aktiengesellschaft as the ultimate
parent company of the regulated banking group is complying with
the disclosure requirements of Articles 431 – 455 of regulation
(EU) No. 575/2013 – the Capital Requirements Regulation (CRR)
and the guidelines on the disclosure requirements under Part
Eight of Regulation (EU) No. 575/2013 - EBA/GL/2016/11 - as at
31 December 2019.
The tables defined according to the EBA’s guidelines and inte-
grated into the report are indicated by the table names provided
with the prefix EU.
Fulfilment of the CRR requirements within the Commerzbank
Group is presented in detail in the „Overview: Compliance with the
CRR requirements“ in the appendix (table APP6).
Scope
This Disclosure Report is based on the group of companies consol-
idated for regulatory purposes. The companies consolidated for
regulatory purposes only include those carrying out banking and
other financial business. The consolidated group consists of a do-
mestic parent company and its affiliated companies. The aim of
regulatory consolidation is to prevent multiple use of capital that
in fact exists only once by subsidiary companies in the financial
sector. The companies consolidated under IFRS, by contrast,
comprise all the companies controlled by the ultimate parent
company.
In the context of the disclosure requirements (Article 431 (3)
CRR), besides the Disclosure Report itself, all policies and process-
es have to be documented as a main component to fulfil the Pillar 3
requirements of the Basel framework. The appropriateness and
practicality of the Bank’s disclosure practice has to be reviewed on
a regular basis. For this purpose, Commerzbank has defined guide-
lines for the Disclosure Report which regulate the overarching,
Introduction

4 Commerzbank Disclosure Report 2020
strategic part of the instructions. The operative targets and respon-
sibilities are additionally defined in separate documents.
Commerzbank is one of the largest institutions in Germany and
with its consolidated balance sheet total it is regularly well above
the €30bn limit relevant for the annual disclosure. Hence, Com-
merzbank has implemented the reporting requirements during the
period from Q2 2015 on and discloses the quarterly and semi-
annually required information as appropriate.1
Waiver rule pursuant to Article 7 CRR
Under the waiver rule pursuant to Article 7 CRR in conjunction
with section 2a (1) of the German Banking Act (KWG), subsidiary
companies in a banking group may apply for exemption from the
requirements of Article 6 (1) CRR (on capital, large exposures, ex-
posures to transferred credit risk and disclosure) at single entity
level. This is on condition, among other things, that both the par-
ent company and subsidiary are licensed in the same member
state and the subsidiary is included in the supervision on a consol-
idated basis of the parent company.
Exemption is also on condition that there is no current or fore-
seen material practical or legal impediment to the prompt transfer
of own funds or the repayment of liabilities by the parent company,
that the parent company guarantees the commitments entered into
by the subsidiary, the risk evaluation, measurement and control
procedures of the parent company cover the subsidiary, and the
parent company holds more than 50% of the voting rights in the
subsidiary or can appoint or remove a majority of the members of
the management body and can therefore exercise a dominant in-
fluence over the subsidiary.2
In the case of institutions and parent companies that were al-
ready making use of a waiver before the CRR came into effect un-
der the rules of the German Banking Act (KWG) applicable at the
time, using the disclosure procedure then specified, exemption is
deemed to have been granted under Article 7 CRR and the rele-
vant standards under section 25a (1) sentence 3 KWG (see section
2a (5) KWG).
Until the merger of comdirect Bank AG into Commerzbank Ak-
tiengesellschaft on 2 November 2020 was completed, the waiver
was invoked by comdirect Bank AG. The supervisory authorities
were informed upon notification of completion according to §10
sentence 3 of the German law, that this claim became void with
the completion of the merger.
According to Article 7 CRR in conjunction with section 2a (1)
KWG, parent companies within the group of companies consoli-
dated for regulatory purposes are also entitled to this exemption.
The opportunity this offers for Commerzbank Aktiengesellschaft as
the ultimate parent company of the Commerzbank Group to be
exempted from the requirements at single entity level has been
utilised since 2007. The conditions for claiming the waiver contin-
ue to apply.
Utilisation of the waiver rule was reported at the outset to BaFin
and the Bundesbank with evidence of compliance with the require-
ments and is subsequently monitored and documented on occasion.
1 See EBA/GL/2014/14, title V (18) and EBA/GL/2016/11 No. 46. 2 Under Article 7 (1) d) CRR, a dominant influence means either having a majority of voting rights or having the right to appoint a
majority of the members of the management body of the subsidiary.

Introduction Equity capital Risk-oriented overall bank management Specific risk management Appendix 5
Capital structure
The main rules governing compliance with minimum regulatory
capital ratios for solvency purposes in the EU are contained in the
Capital Requirements Directive (CRD) IV, the Capital Require-
ments Regulation (CRR), a European regulation which, unlike the
CRD IV Directive, has direct legal effect for all European banks,
together with the SSM Regulation (Council Regulation No.
1024/2013 of 15 October 2013 conferring specific tasks on the
European Central Bank concerning policies relating to the pruden-
tial supervision of credit institutions). This legislation is supple-
mented at national level in Germany by further provisions in the
German Banking Act, the German Solvency Regulation and other
regulations. In addition, Implementing Technical Standards (ITS)
and Regulatory Technical Standards (RTS) provide explanations
about particularly complex matters. The introduction of the new
regulations in 2014 has strengthened the quality of regulatory cap-
ital compared with the previous regime, made capital require-
ments more stringent and set higher minimum requirements for
banks’ capital adequacy.
To avoid having all these requirements take effect on a single
date, certain parts of the new rules which took effect in 2014 are
subject to defined phase-in rules (with transitional provisions). The
Phasing-in of the rules for capital deductions ended at the begin-
ning of the 2018 financial year. The CRR Regulation published in
2013 now only contains transitional provisions for the Additional
Tier 1 capital and Tier 2 capital, which will gradually reduce the
recognition of non-CRR-compliant capital issues until 2022.
Common Equity Tier 1 (CET1) capital consists largely of sub-
scribed capital plus reserves and non-controlling interests. Adjust-
ments to this figure may be necessitated by any number of causes,
for example goodwill, intangible assets, write-downs of assets (if
assets are not valued cautiously enough in the regulator’s view),
shortfalls due to the comparison of expected losses (EL) with the
provisions recognised for them and the correction of tax loss carry-
forwards. Adding Additional Tier 1 capital (AT1), which can contain
subordinated debt instruments with certain conditions, produces
Tier 1 capital. Tier 2 capital consists largely of subordinated debt
instruments which are not eligible as Additional Tier 1 capital. The
eligibility of these capital components has been reduced, as over
the final five years of their life they may now only be amortised on a
straight-line basis.
Commerzbank seeks to achieve the following objectives in
managing its capital:
adherence to the statutory minimum capital requirements at
Group level and in all companies included in the regulatory
Group,
ensuring that the planned capital ratios are met, including the
new ECB/EBA requirements,
provision of sufficient reserves to guarantee the Bank’s free-
dom of action at all times,
strategic allocation of Tier 1 capital to business segments and
divisions in order to exploit growth opportunities.
The financial crisis made the importance of adequate CET1
capital levels for banks become an issue of increasing public con-
cern. At Commerzbank, Tier 1 capital has always been a key man-
agement target. The Bank’s specifications for the capital ratios far
exceed the minimum statutory requirements. The Bank’s risk-
bearing capacity and market expectations play an important role in
determining the internal capital ratio targets. For this reason,
Commerzbank has stipulated minimum ratios for regulatory capital.
CET1 capital is allocated via a regular process that takes ac-
count of the Bank’s strategic direction, profitable new business
opportunities in the core business of each business segment as
well as aspects of risk-bearing capacity.
Measures relating to the Bank’s capital are approved by the full
Board of Managing Directors, subject to the authorisation granted
by the annual general meeting. During the past year, Commerz-
bank met the minimum statutory capital requirements as well as
the requirements of the ECB and EBA at all times. In the pro forma
calculation of the fully loaded implementation of the CRR require-
ments, the above mentioned transitional regulations are complete-
ly disregarded.
For the Commerzbank Group, the transitional provisions laid
down in Article 468 CRR and Article 473a shall not apply. We have
received approval from the supervisor for the application of the
transitional regime to IFRS 9 in accordance with Article 473a CRR.
However, the effects from the application are so marginal that we
do not take these into account as of 31 December 2020.
Information on equity capital, capital ratios and the leverage ra-
tio reflect the full impact of the IFRS 9 introduction.
Equity capital, capital requirement and risk-weighted assets
6 Commerzbank Disclosure Report 2020
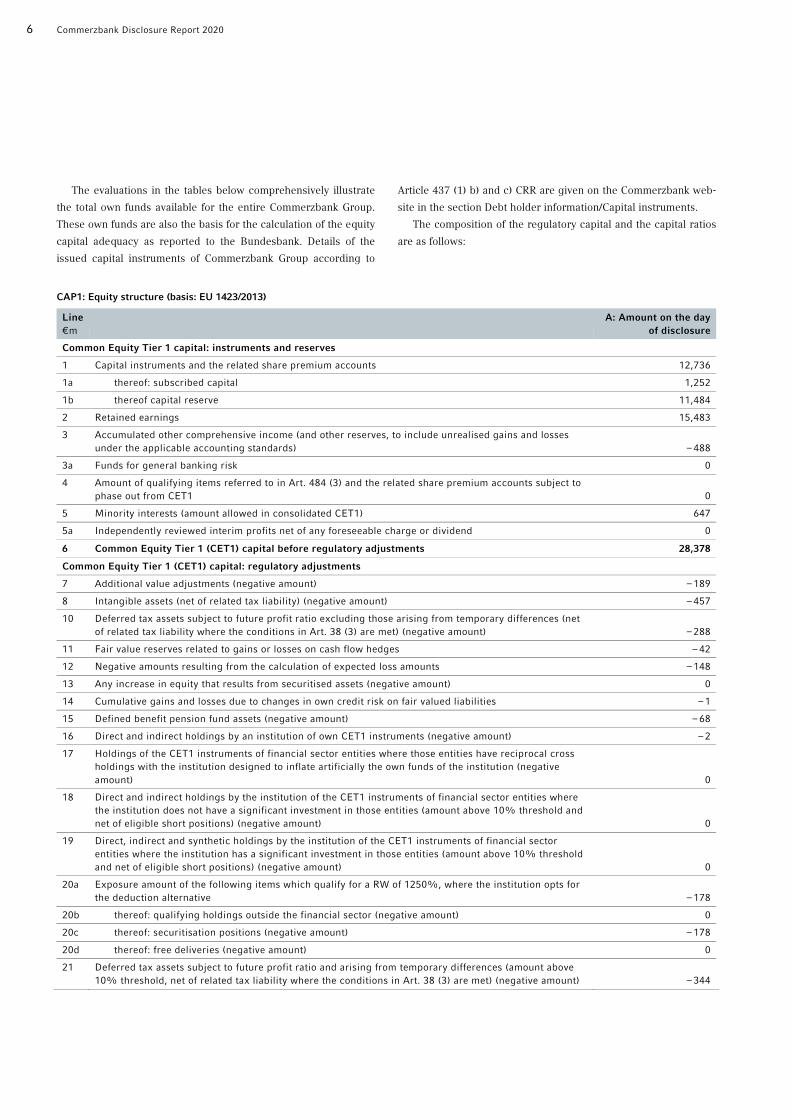
The evaluations in the tables below comprehensively illustrate
the total own funds available for the entire Commerzbank Group.
These own funds are also the basis for the calculation of the equity
capital adequacy as reported to the Bundesbank. Details of the
issued capital instruments of Commerzbank Group according to
Article 437 (1) b) and c) CRR are given on the Commerzbank web-
site in the section Debt holder information/Capital instruments.
The composition of the regulatory capital and the capital ratios
are as follows:
CAP1: Equity structure (basis: EU 1423/2013) Line €m
A: Amount on the day of disclosure
Common Equity Tier 1 capital: instruments and reserves
1 Capital instruments and the related share premium accounts 12,736
1a thereof: subscribed capital 1,252
1b thereof capital reserve 11,484
2 Retained earnings 15,483
3 Accumulated other comprehensive income (and other reserves, to include unrealised gains and losses under the applicable accounting standards) – 488
3a Funds for general banking risk 0
4 Amount of qualifying items referred to in Art. 484 (3) and the related share premium accounts subject to phase out from CET1 0
5 Minority interests (amount allowed in consolidated CET1) 647
5a Independently reviewed interim profits net of any foreseeable charge or dividend 0
6 Common Equity Tier 1 (CET1) capital before regulatory adjustments 28,378
Common Equity Tier 1 (CET1) capital: regulatory adjustments
7 Additional value adjustments (negative amount) – 189
8 Intangible assets (net of related tax liability) (negative amount) – 457
10 Deferred tax assets subject to future profit ratio excluding those arising from temporary differences (net of related tax liability where the conditions in Art. 38 (3) are met) (negative amount) – 288
11 Fair value reserves related to gains or losses on cash flow hedges – 42
12 Negative amounts resulting from the calculation of expected loss amounts – 148
13 Any increase in equity that results from securitised assets (negative amount) 0
14 Cumulative gains and losses due to changes in own credit risk on fair valued liabilities – 1
15 Defined benefit pension fund assets (negative amount) – 68
16 Direct and indirect holdings by an institution of own CET1 instruments (negative amount) – 2
17 Holdings of the CET1 instruments of financial sector entities where those entities have reciprocal cross holdings with the institution designed to inflate artificially the own funds of the institution (negative amount) 0
18 Direct and indirect holdings by the institution of the CET1 instruments of financial sector entities where the institution does not have a significant investment in those entities (amount above 10% threshold and net of eligible short positions) (negative amount) 0
19 Direct, indirect and synthetic holdings by the institution of the CET1 instruments of financial sector entities where the institution has a significant investment in those entities (amount above 10% threshold and net of eligible short positions) (negative amount) 0
20a Exposure amount of the following items which qualify for a RW of 1250%, where the institution opts for the deduction alternative – 178
20b thereof: qualifying holdings outside the financial sector (negative amount) 0
20c thereof: securitisation positions (negative amount) – 178
20d thereof: free deliveries (negative amount) 0
21 Deferred tax assets subject to future profit ratio and arising from temporary differences (amount above 10% threshold, net of related tax liability where the conditions in Art. 38 (3) are met) (negative amount) – 344

Introduction Equity capital Risk-oriented overall bank management Specific risk management Appendix 7
Line €m
A: Amount on the day of disclosure
22 Amount exceeding the 15% threshold (negative amount) 0
23 thereof: direct and indirect holdings by the institution of the CET1 instruments of financial sector entities where the institution has a significant investment in those entities 0
25 thereof: deferred tax assets subject to future profit ratio and arising from temporary differences 0
25a Losses for the current financial year (negative amount) – 2,962
25b Foreseeable tax charges relating to CET1 items (negative amount) 0
27 Qualifying AT1 deductions that exceed the AT1 capital of the institution (negative amount) 0
27a Other CET1 capital elements or deductions – 87
28 Total regulatory adjustments to Common Equity Tier 1 (CET1) capital – 4,767
29 CET1 capital 23,611
Additional Tier 1 (AT1) capital: instruments
30 Capital instruments and the related share premium accounts 2,619
31 thereof: classified as equity under applicable accounting standards 2,619
32 thereof: classified as liabilities under applicable accounting standards 0
33 Amount of qualifying items referred to in Art. 484 (4) and the related share premium accounts subject to phase out from AT1 452
34 Qualifying Tier 1 capital included in consolidated AT1 capital (including minority interests not included in line 5) issued by subsidiaries and held by third parties 108
35 thereof: instruments issued by subsidiaries subject to phase out 0
36 Additional Tier 1 (AT1) capital before regulatory adjustments 3,179
Additional Tier 1 (AT1) capital; regulatory adjustments
37 Direct and indirect holdings by an institution of own AT1 instruments (negative amount) 0
38 Holdings of the AT1 instruments of financial sector entities where those entities have reciprocal cross holdings with the institution designed to inflate artificially the own funds of the institution (negative amount) 0
39 Direct and indirect holdings of the AT1 instruments of financial sector entities where the institution does not have a significant investment in those entities (amount above 10% threshold and net of eligible short positions) (negative amount) 0
40 Direct and indirect holdings by the institution of the AT1 instruments of financial sector entities where the institution has a significant investment in those entities (amount above 10% threshold and net of eligible short positions) (negative amount) 0
42 Qualifying Tier 2 deductions that exceed the Tier 2 capital of the institution (negative amount) 0
43 Total regulatory adjustments to Additional Tier 1 (AT1) capital 0
44 Additional Tier 1 (AT1) capital 3,179
45 Tier 1 capital (T1 = CET1 + AT1) 26,790
Tier 2 capital: instruments and provisions
46 Capital instruments and the related share premium accounts 4,439
47 Amount of qualifying items referred to in Art. 484 (5) and the related share premium accounts subject to phase out from Tier 2 152
48 Qualifying own funds instruments included in consolidated Tier 2 capital (including minority interests and AT1 instruments not included in rows 5 or 34) issued by subsidiaries and held by third parties 252
49 thereof: instruments issued by subsidiaries subject to phase out 0
50 Credit risk adjustments 0
51 Tier 2 capital before regulatory adjustments 4,843
Tier 2 capital: regulatory adjustments
52 Direct and indirect holdings by an institution of own Tier 2 instruments and subordinated loans (negative amount) – 30
53 Holdings of the Tier 2 instruments and subordinated loans of financial sector entities where those entities have reciprocal cross holdings with the institution designed to inflate artificially the own funds of the institution (negative amount) 0

8 Commerzbank Disclosure Report 2020
Line €m
A: Amount on the day of disclosure
54 Direct and indirect holdings of the Tier 2 instruments and subordinated loans of financial sector entities where the institution does not have a significant investment in those entities (amount above 10% threshold and net of eligible short positions) (negative amount) 0
55 Direct and indirect holdings of the Tier 2 instruments and subordinated loans of financial sector entities where the institution has a significant investment in those entities (amount above 10% threshold and net of eligible short positions) (negative amount) 0
57 Total regulatory adjustments to Tier 2 capital – 30
58 Tier 2 capital 4,813
59 Total capital (TC = Tier 1 + Tier 2) 31,603
60 Total risk-weighted assets 178,581
Capital ratios and buffers
61 Common Equity Tier 1 (as a percentage of total risk exposure amount) 13.2
62 Tier 1 (as a percentage of total risk exposure amount) 15.0
63 Total capital (as a percentage of total risk exposure amount) 17.7
64 Institution specific buffer requirement (CET1 requirement in accordance with Art. 92 (1) (a) plus capital conservation and countercyclical buffer1 requirements, plus systemic risk buffer, plus systemically important institution (G-SII or O-SII) buffer expressed as a percentage of risk exposure amount) 8.3
65 thereof: capital conservation buffer requirement 2.5
66 thereof: countercyclical buffer requirement 0.02
67 thereof: systemic risk buffer requirement 0
67a thereof: Global Systemically Important Institution (G-SII) or Other Systemically Important Institution (O-SII) buffer 1.25
68 Common Equity Tier 1 available to meet buffers (as a percentage of risk exposure amount) 7.5
Amounts below the thresholds for deduction (before risk weighting)
72 Direct and indirect holdings by the institution of capital instruments of financial sector entities where the institution does not have a significant investment in those entities (amount below 10% threshold and net of eligible short positions) 319
73 Direct and indirect holdings by the institution of the CET1 instruments of relevant financial sector entities where the institution has a significant investment in those entities (amount below 10% threshold and net of eligible short positions) 234
75 Deferred tax assets subject to future profit ratio, arising from temporary differences (amount below 10% threshold, net of related tax liability where the conditions in Art. 38 (3) are met) 2,395
Applicable caps on the inclusion of provisions in Tier 2
76 Credit risk adjustments included in Tier 2 in respect of exposures under the standard approach (before application of cap) 0
77 Cap on inclusion of credit risk adjustments in Tier 2 under the standardised approach 257
78 Credit risk adjustments included in Tier 2 in respect of exposures subject to the internal ratings-based approach (before application of cap) 0
79 Cap on inclusion of credit risk adjustments allowable in Tier 2 related to exposures subject to internal ratings-based approach 691
Capital instruments subject to phase-out arrangements
80 Current cap for CET1 instruments subject to phase-out arrangements 0
81 Amount excluded from CET1 due to cap (excess over cap after redemptions and maturities) 0
82 Current cap on AT1 instruments subject to phase out arrangements 452
83 Amount excluded from AT1 due to cap (excess over cap after redemptions and maturities) – 181
84 Current cap on Tier 2 instruments subject to phase out arrangements 152
85 Amount excluded from Tier 2 due to cap (excess over cap after redemptions and maturities) – 120
1 The geographical breakdown of credit exposures relevant for the calculation of the countercyclical capital buffer is shown in APP2 in the appendix. It also derives the amount of institution-specific countercyclical capital buffer.

Introduction Equity capital Risk-oriented overall bank management Specific risk management Appendix 9
Connection between balance-sheet and regulatory positions
For Commerzbank as a banking group as defined in section 10a
KWG and Article 11 CRR the capital relevant to the determination
of regulatory capital is based on the consolidated financial state-
ments under FINREP which is prepared based on the Group bal-
ance sheet according to IFRS. To reconcile the requirements for
regulatory capital with the slightly different amounts reported in
the financial statements, capital as determined under IFRS was
adjusted with the aid of so-called prudential filters.
There was no under-capitalisation of subsidiaries subject to the
deduction method during the period under review. Nor are there
any obstacles to the transfer of own funds or the repayment of lia-
bilities in accordance with Article 436 c) CRR between Commerz-
bank AG and the main subsidiaries in the reporting period.
With Basel 3, the Basel Committee on Banking Supervision
published among other things comprehensive rules on the com-
ponents of shareholders’ equity and ratios as well as the manage-
ment of liquidity risk. The Capital Requirements Directive and
Regulation (CRD IV) package of measures, constituting the Euro-
pean implementation of Basel 3, has been in force since 1 January
2014. Numerous supplementary regulations have since been pub-
lished e.g. by the European Banking Authority (EBA), and these
gradually entered into force; this will continue in subsequent years.
Commerzbank has prepared itself for the more stringent capital
adequacy requirements by taking a number of steps.
The reconciliation between the Group’s equity reported in the
balance sheet and the equity reported for regulatory purposes is
shown in the tables CAP2 below.

10 Commerzbank Disclosure Report 2020
CAP2: Reconciliation of equity as reported in the balance sheet with regulatory capital (EU 1423/2013 / Art. 437a CRR) Position €m
Equity IFRS (Phase in)1 Equity FINREP2 Equity COREP3
Subscribed capital 1,252 1,252 1,252
Capital reserve 11,484 11,484 11,484
Retained earnings 15,484 15,483 15,483
Silent participations – – – Actuarial profits/losses current year 29 29 29
Changes due to the revaluation of own credit risk – 42 – 42 – 42
Revaluation reserve 96 88 88
Valuation of cash flow hedges 42 42 42
Currency translation reserve – 614 – 606 – 606
Distributable profit/loss from previous year (after suspension of retained earnings) 0 0 0
Distributable profit/loss from current year – 2,870 – 2,870 – 2,870
Non-controlling interests 1,119 1,114 1,114
Additional equity components4 2,619 2,619 0
Equity as shown in balance sheet 28,600 28,595 25,976
Equity as shown in balance sheet without additional equity components 25,981 25,976 25,976
Fair value gains and losses arising from the institution’s own credit risk related to derivative liabilities – 57
Cumulative gains and losses due to changes in own credit risk on fair valued liabilities 56
Correction to non-controlling interests (minority) – 468
Goodwill 0
Intangible assets – 457
Surplus in plan assets – 68
Deferred tax assets from loss carryforwards – 288
Shortfall due to expected loss – 148
Prudential valuation – 189
First loss positions from securitisations – 178
Deferred tax assets from temporary differences which exceed the 10% threshold – 344
Unrecognised gains – 92
Others – 131
Common Equity Tier 1 after deductions5 23,611
Hybrid capital 843 843 843
Eligible issues4 2,727
Not eligible issues 0
Cap due to Art. 471 CRR – 181
Others, especially hedge accounting, interests, agio, disagio – 210
Additional Tier 1 before deductions 3,179
Deduction of Additional Tier 1 capital (AT1) 0
Additional Tier 1 after deductions 3,179
Subordinated capital 7,199 7,199 7,199
Decreased offsetting in the last 5 years of residual maturity – 1,769
Not eligible non-controlling interests – 105
Inclusion of capped AT1 61
Others, especially hedge accounting, interests, agio, disagio – 574
Tier 2 before deductions 4,813
Deduction of Tier 2 capital 0
Tier 2 after deductions 4,813
Own funds 34,023 34,018 31,603
1 Equity as shown in balance sheet. 2 Financial reporting, equity as shown in balance sheet, regulatory group of consolidated companies. 3 Common solvency ratio reporting, regulatory capital (with transitional provisions). 4 AT 1 issue which is equity as shown in balance sheet and which is taken into account as
Additional Equity Tier 1 according to CRR. 5 This information includes the consolidated profit attributable to Commerzbank shareholders for regulatory purposes.

Introduction Equity capital Risk-oriented overall bank management Specific risk management Appendix 11
In table EU LI1, there is in total an immaterial difference of €92m
between the carrying values according to the group of consolidated
companies reported in the balance sheet (column a) and the carry-
ing values according to the regulatory group of consolidated com-
panies (column b). This difference results from the different scopes
of consolidation and consolidation methods for accounting and
regulatory purposes. The companies where the consolidation meth-
ods for accounting and regulatory purposes differ are listed entity by
entity in table EU LI3 in the Appendix.
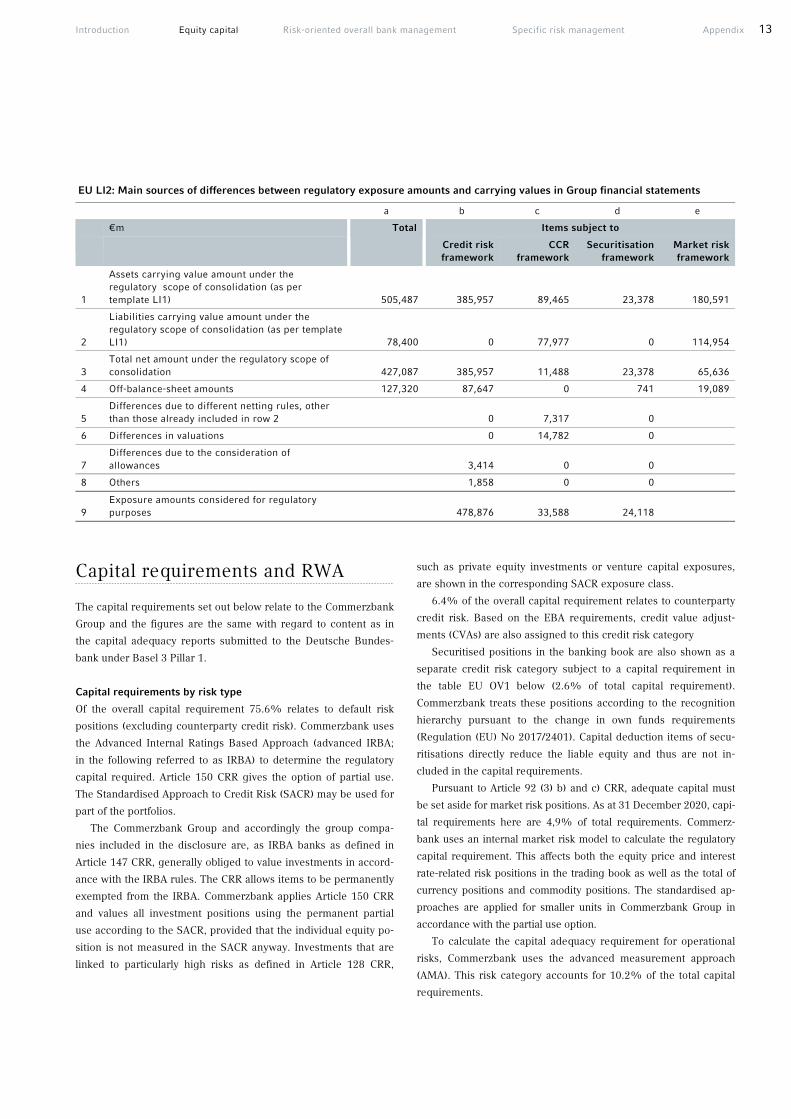
Table EU LI2 shows the main reasons for the differences between
the carrying values for financial reporting in the balance sheet and
the regulatory risk exposure amounts (exposure in the standard ap-
proach and exposure at default in the IRB approach). The carrying
values are reconciled to the regulatory risk exposure amounts. Row
1 of table EU LI2 comprises the carrying values of assets and row 2
the carrying values of liabilities for the regulatory group of compa-
nies in accordance with the allocation of table EU LI1. Column a of
rows 1 and 2 corresponds to the total of column b in table EU LI1
less the total of column g in table EU LI1. Row 3 is the difference
between row 1 and row 2.
The target figures to be reconciled (row 9) are the input values
for the RWA calculation. The target figure includes both on-balance-
sheet and off-balance-sheet positions. With the exception of netting,
credit risk mitigation methods (CRM) are not taken into account in
the target figure of on-balance-sheet positions. The target figure for
market risk is at present not clearly defined in functional terms. In
the internal model, risk parameters such as VaR, SVaR and IRC and
the RWAs calculated from them are relevant. By contrast, exposure
values are not considered separately here for the regulatory report-
ing. For this reason, a reconciliation of the values for market risk to
the exposure taken into account for regulatory purposes has been
dispensed within table EU LI2. As a result, no total has been calcu-
lated for rows 5 to 9 in column a.
Row 4 “Off-balance-sheet amounts” shows the off-balance-sheet
amounts in total and before taking into account credit conversion
factors (CCFs) in column a. In columns b (credit risk), d (securitisa-
tion risk) and e (market risk), the risk exposure values for the off-
balance-sheet positions are calculated after taking into account the
corresponding credit conversion factors (CCFs) and credit risk miti-
gation (CRM) methods to allow a comparison with COREP and with
the other tables in the Disclosure Report.
Row 5 “Differences resulting from different netting rules, other
than those already included in row 2” shows the effects from the
different regulatory netting rules compared with those for account-
ing purposes, taking into account the netting effect in accordance
with row 2. In terms of counterparty credit risk, effects result from
derivatives and securities financing transactions (SFTs).
Row 6 “Differences in valuation” discloses the valuation differ-
ences between carrying values in the balance sheet and regulatory
exposures after taking into account netting effects from row 5. The
valuation differences in counterparty credit risk include regulatory
add-ons for future risks due to considering wrong-way risk and rele-
vant haircuts for collaterals. In addition, as of 31 December 2020,
they contain around €8.7bn in conversion effects from the IMM
methodological changes planned for 2021.
Row 7 “Differences due to the consideration of allowances” shows
the value adjustments to the IRBA positions for credit risk and secu-
ritisation risk. The carrying values on the balance sheet are net carry-
ing values (after loan loss provisions). Under the IRB approach the
risk exposure amount is in general the carrying values in the balance
sheet; credit risk adjustments such as valuation allowances are not
deducted. Value adjustments deducted from the carrying value of
assets when drawing up the financial statements are added back as
part of the reconciliation.
Other reconciliation effects not already included in reconciliation
rows 5 to 7 are reported in row 8 “Others”.

12 Commerzbank Disclosure Report 2020
EU LI1: Differences between accounting and regulatory scopes of consolidation and the mapping of financial statement categories with regulatory risk categories a b c d e f g
Carrying values as reported in
published financial
statements
Carrying values under
the regulatory scope of
consolidation
Carrying values of items
€m
Subject to the credit risk framework
Subject to the CCR
framework
Subject to the securitisation
framework
Subject to the market risk framework
Not subject to capital requirements or subject to
deductions from capital
Assets
Cash on hand and cash on demand 75,603 75,603 75,603 0 0 12,954 0
Financial assets - Amortised Cost 292,420 292,653 257,447 17,251 17,792 79,129 163
Financial assets - Fair Value OCI 42,862 42,542 42,542 0 0 13,723 0
Financial Assets - Mandatorily Fair Value P&L 28,677 28,661 391 22,718 5,537 25,694 15
Financial Assets - Held for Trading 52,176 52,176 0 45,524 49 45,718 0
Value adjustment on portfolio fair value hedges 1,752 1,752 1,752 0 0 0 0
Positive fair values of derivative hedging instruments 1,878 1,878 0 1,878 0 1,196 0
Holdings in companies accounted for using the equity method 169 169 169 0 0 0 0
Intangible assets 1,420 1,417 646 0 0 0 771
Fixed assets 3,208 3,207 3,207 0 0 0 0
Investment properties 13 13 13 0 0 0 0
Non-current assets held for sale and disposal groups1 2,040 2,040 – 55 2,093 0 2,094 0
Current tax assets 130 130 130 0 0 0 0
Deferred tax assets 2,693 2,690 2,395 0 0 0 294
Other assets 1,877 1,893 1,716 0 0 82 95
Total assets 506,916 506,825 385,957 89,465 23,378 180,591 1,338
Liabilities and equity
Financial Liabilities - Amortised Cost 397,725 397,648 0 11,872 0 57,864 385,776
Financial Liabilities - Fair Value Option 20,104 20,104 0 15,820 0 17,027 4,284
Financial Liabilities - Held for Trading 42,843 42,843 0 42,418 0 38,808 11
Value adjustment on portfolio fair value hedges 1,412 1,412 0 0 0 0 1,412
Negative fair values of derivative hedging instruments 5,893 5,893 0 5,893 0 1,247 0
Provisions 3,396 3,393 0 0 0 0 3,393
Current tax liabilities 448 448 0 0 0 0 448
Deferred tax liabilities 10 7 0 0 0 0 7
Liabilities of disposal groups 2,051 2,051 0 1,974 0 9 69
Other liabilities 4,434 4,430 0 0 0 0 4,430
Equity 28,600 28,595 0 0 0 0 28,595
Total liabilities and equity 506,916 506,825 0 77,977 0 114,954 428,425
1 Withholding Tax Liabilities in the Held for Sale expsoure.
Introduction Equity capital Risk-oriented overall bank management Specific risk management Appendix 13
EU LI2: Main sources of differences between regulatory exposure amounts and carrying values in Group financial statements a b c d e
€m Total Items subject to
Credit risk framework
CCR framework
Securitisation framework
Market risk framework
1
Assets carrying value amount under the regulatory scope of consolidation (as per template LI1) 505,487 385,957 89,465 23,378 180,591
2
Liabilities carrying value amount under the regulatory scope of consolidation (as per template LI1) 78,400 0 77,977 0 114,954
3 Total net amount under the regulatory scope of consolidation 427,087 385,957 11,488 23,378 65,636
4 Off-balance-sheet amounts 127,320 87,647 0 741 19,089
5 Differences due to different netting rules, other than those already included in row 2 0 7,317 0
6 Differences in valuations 0 14,782 0
7 Differences due to the consideration of allowances 3,414 0 0
8 Others 1,858 0 0
9 Exposure amounts considered for regulatory purposes 478,876 33,588 24,118
Capital requirements and RWA
The capital requirements set out below relate to the Commerzbank
Group and the figures are the same with regard to content as in
the capital adequacy reports submitted to the Deutsche Bundes-
bank under Basel 3 Pillar 1.
Capital requirements by risk type
Of the overall capital requirement 75.6% relates to default risk
positions (excluding counterparty credit risk). Commerzbank uses
the Advanced Internal Ratings Based Approach (advanced IRBA;
in the following referred to as IRBA) to determine the regulatory
capital required. Article 150 CRR gives the option of partial use.
The Standardised Approach to Credit Risk (SACR) may be used for
part of the portfolios.
The Commerzbank Group and accordingly the group compa-
nies included in the disclosure are, as IRBA banks as defined in
Article 147 CRR, generally obliged to value investments in accord-
ance with the IRBA rules. The CRR allows items to be permanently
exempted from the IRBA. Commerzbank applies Article 150 CRR
and values all investment positions using the permanent partial
use according to the SACR, provided that the individual equity po-
sition is not measured in the SACR anyway. Investments that are
linked to particularly high risks as defined in Article 128 CRR,
such as private equity investments or venture capital exposures,
are shown in the corresponding SACR exposure class.
6.4% of the overall capital requirement relates to counterparty
credit risk. Based on the EBA requirements, credit value adjust-
ments (CVAs) are also assigned to this credit risk category
Securitised positions in the banking book are also shown as a
separate credit risk category subject to a capital requirement in
the table EU OV1 below (2.6% of total capital requirement).
Commerzbank treats these positions according to the recognition
hierarchy pursuant to the change in own funds requirements
(Regulation (EU) No 2017/2401). Capital deduction items of secu-
ritisations directly reduce the liable equity and thus are not in-
cluded in the capital requirements.
Pursuant to Article 92 (3) b) and c) CRR, adequate capital must
be set aside for market risk positions. As at 31 December 2020, capi-
tal requirements here are 4,9% of total requirements. Commerz-
bank uses an internal market risk model to calculate the regulatory
capital requirement. This affects both the equity price and interest
rate-related risk positions in the trading book as well as the total of
currency positions and commodity positions. The standardised ap-
proaches are applied for smaller units in Commerzbank Group in
accordance with the partial use option.
To calculate the capital adequacy requirement for operational
risks, Commerzbank uses the advanced measurement approach
(AMA). This risk category accounts for 10.2% of the total capital
requirements.
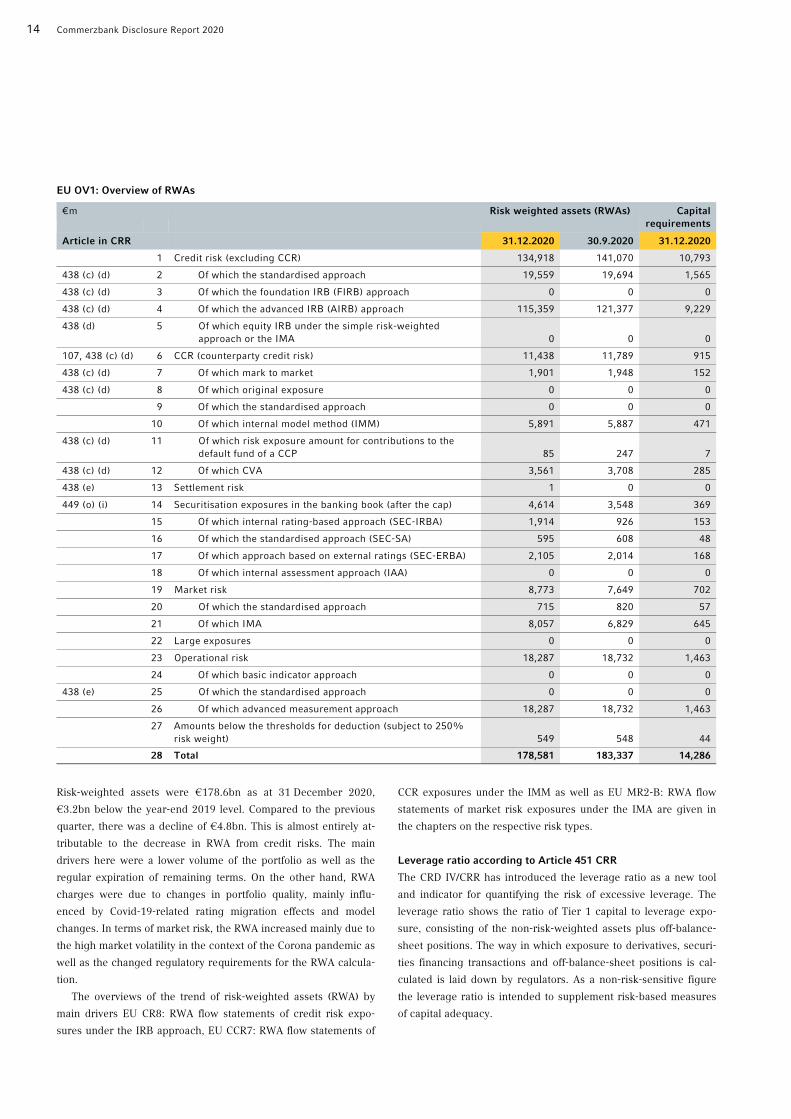
14 Commerzbank Disclosure Report 2020
EU OV1: Overview of RWAs €m Risk weighted assets (RWAs) Capital
requirements
Article in CRR 31.12.2020 30.9.2020 31.12.2020
1 Credit risk (excluding CCR) 134,918 141,070 10,793
438 (c) (d) 2 Of which the standardised approach 19,559 19,694 1,565
438 (c) (d) 3 Of which the foundation IRB (FIRB) approach 0 0 0
438 (c) (d) 4 Of which the advanced IRB (AIRB) approach 115,359 121,377 9,229
438 (d) 5 Of which equity IRB under the simple risk-weighted approach or the IMA 0 0 0
107, 438 (c) (d) 6 CCR (counterparty credit risk) 11,438 11,789 915
438 (c) (d) 7 Of which mark to market 1,901 1,948 152
438 (c) (d) 8 Of which original exposure 0 0 0
9 Of which the standardised approach 0 0 0
10 Of which internal model method (IMM) 5,891 5,887 471
438 (c) (d) 11 Of which risk exposure amount for contributions to the default fund of a CCP 85 247 7
438 (c) (d) 12 Of which CVA 3,561 3,708 285
438 (e) 13 Settlement risk 1 0 0
449 (o) (i) 14 Securitisation exposures in the banking book (after the cap) 4,614 3,548 369
15 Of which internal rating-based approach (SEC-IRBA) 1,914 926 153
16 Of which the standardised approach (SEC-SA) 595 608 48
17 Of which approach based on external ratings (SEC-ERBA) 2,105 2,014 168
18 Of which internal assessment approach (IAA) 0 0 0
19 Market risk 8,773 7,649 702
20 Of which the standardised approach 715 820 57
21 Of which IMA 8,057 6,829 645
22 Large exposures 0 0 0
23 Operational risk 18,287 18,732 1,463
24 Of which basic indicator approach 0 0 0
438 (e) 25 Of which the standardised approach 0 0 0
26 Of which advanced measurement approach 18,287 18,732 1,463
27 Amounts below the thresholds for deduction (subject to 250% risk weight) 549 548 44
28 Total 178,581 183,337 14,286
Risk-weighted assets were €178.6bn as at 31 December 2020,
€3.2bn below the year-end 2019 level. Compared to the previous
quarter, there was a decline of €4.8bn. This is almost entirely at-
tributable to the decrease in RWA from credit risks. The main
drivers here were a lower volume of the portfolio as well as the
regular expiration of remaining terms. On the other hand, RWA
charges were due to changes in portfolio quality, mainly influ-
enced by Covid-19-related rating migration effects and model
changes. In terms of market risk, the RWA increased mainly due to
the high market volatility in the context of the Corona pandemic as
well as the changed regulatory requirements for the RWA calcula-
tion.
The overviews of the trend of risk-weighted assets (RWA) by
main drivers EU CR8: RWA flow statements of credit risk expo-
sures under the IRB approach, EU CCR7: RWA flow statements of
CCR exposures under the IMM as well as EU MR2-B: RWA flow
statements of market risk exposures under the IMA are given in
the chapters on the respective risk types.
Leverage ratio according to Article 451 CRR
The CRD IV/CRR has introduced the leverage ratio as a new tool
and indicator for quantifying the risk of excessive leverage. The
leverage ratio shows the ratio of Tier 1 capital to leverage expo-
sure, consisting of the non-risk-weighted assets plus off-balance-
sheet positions. The way in which exposure to derivatives, securi-
ties financing transactions and off-balance-sheet positions is cal-
culated is laid down by regulators. As a non-risk-sensitive figure
the leverage ratio is intended to supplement risk-based measures
of capital adequacy.

Introduction Equity capital Risk-oriented overall bank management Specific risk management Appendix 15
The leverage ratio based on the CRR transitional provisions
was 4.9% as at 31 December 2020 (as at 30 September 2020:
4.9%). The leverage ratio fully loaded stood at 4.9%, compared
with 4.8% as at 30 September 2020.
The leverage ratio fully loaded rose slightly; the leverage ratio
with transitional provisions was unchanged as the effect of the
reduced leverage ratio exposure slightly overcompensated for the
reduced regulatory Tier 1 capital under fully loaded rules and bal-
anced it out under transitional rules. As at the reporting date, the
leverage ratio exposure was €541.4bn; as at 30 September 2020 it
was €572.7bn.
Leverage ratio exposure with transitional provisions and lever-
age ratio exposure fully loaded have been identical since 2018 due
to the expiry of the transition period for the leverage ratio expo-
sure relevant capital deductions on 31 December 2017. However,
transitional rules still apply to the numerator of the leverage ratio,
i.e. the Tier 1 capital, meaning that a ratio with transitional provi-
sions still needs to be declared.
Further details on the leverage ratio can be found in the 2020
Annual Report in the Note (64) from page 288.
16 Commerzbank Disclosure Report 2020
Commerzbank defines risk as the danger of possible losses or
profits foregone due to internal or external factors. In risk man-
agement, we normally distinguish between quantifiable and non-
quantifiable types of risk. Quantifiable risks are those to which a
value can normally be attached in financial statements or in regu-
latory capital requirements, while non-quantifiable risks, for ex-
ample, include compliance and reputational risk.
Risk statement
According to Article 435 (1) e) and f) CRR, the risk statement is a
declaration approved by the management body providing assur-
ance that the risk management systems put in place are adequate
and giving a description of the institution’s general risk profile
associated with the business strategy. The approval by the Board
of Managing Directors was given together with the approval of the
Disclosure Report.
Commerzbank is the leading bank for SMEs (the Mittelstand)
and a strong partner to some 30,000 corporate client groups and
around 11 million private and small-business customers in Germa-
ny. The Bank offers a comprehensive portfolio of financial services
in two business segments – Private and Small-Business Customers
and Corporate Clients. Commerzbank adopted its new “Strategy
2024” programme in February 2021. The measures announced
mark the start of an in-depth restructuring process and the com-
prehensive digitalisation of the Bank. The aim of the restructuring
is to combine the benefits of a fully digitalised bank with personal
advisory services, an unwavering customer focus and sustainability.
In its business with private and small-business customers the
bank aims to offer an attractive combination of powerful direct
banking and first-class advisory services by merging the digital
strengths and innovative power of comdirect with Commerzbank’s
advisory expertise. Services will be geared to customers’ individual
needs. Commerzbank intends to significantly expand its business
with affluent clients and small-business customers in Private Bank-
ing and Wealth Management.
In the corporate client sector, Commerzbank is the leading
bank for SMEs. Going forward, the Bank will continue to serve
German SMEs and large companies, along with international cus-
tomers who have business links with Germany. The Bank will re-
main true to its responsibilities as a strong financing and hedging
partner for German companies engaging in import and export
business throughout the world.
Corporate clients will continue to receive personal advisory
support and will have access to a network of regional branches.
At the same time, an innovative direct banking offering will grad-
ually be established for corporate clients who require standard
products and advisory services. Profitability is to be significantly
increased by digitalising processes, optimising pricing and, in
particular, making greater use of data-driven services.
Commerzbank will remain a strong partner for its customers
both in Germany and abroad. Its local presence will be structured
more efficiently. As a result, the Bank is planning to exit 15 inter-
national locations and convert two branches into local representa-
tive offices.
The Group Risk Strategy, together with the business strategy,
regulates the strategic risk management guidelines for the devel-
opment of Commerzbank’s investment portfolio. With acceptance
from its business model arising inherent existential threats the
Group Risk Strategy takes into account exogenous factors, such as
risks from the macroeconomic environment, as well as new regu-
latory requirements and endogenous factors, in particular the re-
sults of the annual risk inventory. In the risk inventory process, all
economically significant quantifiable and unquantifiable risks aris-
ing from our business activities are determined in terms of their
materiality for risk management.
Based on the results of the risk inventory 2020 we classified
default risk (credit risk including counterparty credit risk and se-
curitisations), market risk, operational risk, compliance risk, cyber
risk, physical asset risk, business risk, reputational risk, liquidity
risk and model risk as material types of risk for the Commerzbank
Group.
The scope and management of credit risk, counterparty credit
risk, securitisations, market risk, liquidity risk and operational risk
are presented in the relevant chapters of this report. The chapter
“Other risks” provides information on other types of risk classified
as material.
Our portfolio is clearly dominated by default risks, which ac-
count for 70% of economically required capital. Of this, our
home market Germany is accounting for 60% of the credit expo-
sure and 28% by other European countries. The Group’s expo-
sure at default increased from €445bn to €466bn in 2020. The
risk density declined from 23 basis points to 21 basis points over
the same period. Market risk in the trading book increased in
2020. The value at risk (VaR) increased from €6m to €12m over
the course of 2020. Operational risks decreased year-on-year. The
total charge for OpRisk events increased from €127m to €345m
compared with the previous year.
Risk appetite, determined by Group Risk Strategy, refers to the
maximum risk, in terms of both the amount and structure, which
the Bank is willing and able to incur in pursuing its business ob-
jectives, without exposing itself to existential threats (beyond in-
herent risks). The guiding principle regarding risk appetite is to
Risk-oriented overall bank management
Introduction Equity capital Risk-oriented overall bank management Specific risk management Appendix 17
ensure that the Commerzbank Group has sufficient economic and
regulatory capital and liquidity resources on a sustained basis. It is
quantified in terms of risk limits for capital and liquidity manage-
ment with defined escalation mechanisms, and by means of quan-
titative and qualitative early warning systems. Those risks as-
sessed as being material are included in the Group Risk Strategy.
The sub-risk strategies determine further details, e.g. limits and
guidelines are broken down across segments and portfolios and
they are specified and implemented via policies, regulations and
operating instructions/ guidelines. They form an integral part of
ongoing management and monitoring. In addition, from the per-
spective of risk concentrations regular portfolio-specific stress
tests are carried out. The annual update of the risk-bearing capaci-
ty concept ensures, that the main types of risk are adequately tak-
en into account in the risk-bearing capacity calculation.
Banks’ core functions as transformers of liquidity and risk result
in inevitable threats that can in extreme cases endanger the contin-
ued existence of the institution. For Commerzbank, in view of its
business model, these inherent existential threats include the de-
fault of Germany, Poland, one or more of the other major EU coun-
tries (France, Italy, Spain or the UK, although Brexit is not deemed
to be a default) or the default of the USA. Moreover, inherent
threats include a deep recession lasting several years with serious
repercussions for the German economy (caused, for instance, by a
global pandemic or by the USA or China), a bank run and the col-
lapse of global clearing houses or the foreign exchange markets,
possibly triggered by a cyber attack. In general, cyber risk includes
certain scenarios as the business environment becomes more digi-
talised which under certain circumstances can cause damage and
could therefore be significant for Commerzbank.
A key component of liquidity risk management is the daily cal-
culation of the liquidity gap profile. The liquidity gap profile shows
the deterministic or stochastic inflows and outflows expected in
the future on a given reporting date and across all portfolios. This
forms the basis for calculating liquidity requirements or excess
liquidity per maturity band. Based on the liquidity gap profile,
management mechanisms such as recovery and early warning in-
dicators are limited and monitored accordingly. The liquidity gap
profile is limited in all maturity bands. The Group limits are broken
down into individual Group units and currencies.
In order to meet the minimum requirements for the regulatory
liquidity coverage ratio (LCR), the Bank has established appropri-
ate limits and early warning indicators. In 2020, Commerzbank
significantly exceeded the minimum ratio of 100% stipulated for
that year on every reporting date. As at the end of 2020, the aver-
age month-end value of the LCR over the last twelve months was
135.68%. The net stable funding ratio (NSFR) was transposed into
European law by the Basel Committee as part of the Capital Re-
quirements Regulation II (CRR II) and will become binding from
June 2021. Commerzbank is already calculating LCR as well as
NSFR as part of its regulatory reporting processes, communicating
them in its internal reporting and reporting them to the superviso-
ry authority. In addition to risk-based measures of capital adequa-
cy, under Basel 3 the leverage ratio is used as a non-risksensitive
indicator of leverage. At 31 December 2020, the leverage ratio
came to 4.9% after taking into account the CRR transitional rules
(with transitional provisions) and as well to 4.9% after full applica-
tion of the revised CRR rule (fully loaded). Avoiding the risk of ex-
cessive leverage is an integral part of Commerzbank’s manage-
ment of its balance sheet.
To ensure an adequate capital backing, compliance with eco-
nomic risk-bearing capacity requirements and the regulatory capi-
tal ratios is reviewed by means of an early warning system in both
a forecast scenario and an adverse stress scenario. The risk-
bearing capacity (RBC) ratio of 159% (target: >100%) comforta-
bly meets risk-bearing capacity requirements. Commerzbank’s
Common Equity Tier 1 ratio is largely based on the capital re-
quirements resulting from the Supervisory Review and Evaluation
Process (SREP) carried out by the ECB as the responsible supervi-
sory authority, plus a buffer deemed appropriate by Commerz-
bank’s management to cover potential stress situations. The ECB
has left the SREP capital requirements valid for the 2020 financial
year unchanged for 2021, while the capital buffer for other sys-
temically important institutions (O-SII) set by the German banking
regulator as part of the SREP requirements was reduced to 1.25%
in November (previously: 1.5%). The Common Equity Tier 1 ratio
was therefore 13.2% at €178.6bn RWA and €23,6bn common eq-
uity tier 1 capital at the end of 2020. After booking additional re-
structuring charges of round about €0.9bn we target a CET1 ratio
of above 12% in 2021.
The Bank therefore believes it has a sufficiently comfortable
capital buffer to be able to cover the restructuring and investment
expenses required for the Group’s transformation entirely from its
own funds. This capitalisation is also evidence of a high risk-
bearing capacity should the difficult conditions continue for a
longer period. Nonetheless, there are numerous risk factors that
could affect the 2021 profit forecast to a considerable, though not
reliably quantifiable extent, should events take an unfavorable
turn. These include, first and foremost, exceptionally high global
economic risks resulting from the coronavirus pandemic, the
length and extent of which cannot yet be adequately assessed.
The risk result relating to the Group’s lending business in
2020 amounted to €–1,748m. Given the uncertainty of the further
development of the pandemic we expect a risk result of between
€–0.8bn and €–1.2bn for 2021. With a non performing exposure
ratio (NPE ratio) of only 1.0%, the quality of the credit book was
still high at the end of 2020. By focusing more on more efficient
use of equity capital (RWA optimization), particularly in the cor-
18 Commerzbank Disclosure Report 2020
porate client business, and reinvesting the risk assets released in
PUK and mbank, we expect a slight increase in RWA to around
€183bn by 2024.
Comprehensive, prompt, transparent and methodically ade-
quate risk measurement is vital for ensuring that the Commerz-
bank Group has sufficient liquidity and capital resources on a
permanent basis. Our business and risk strategy is made measur-
able, transparent, and controllable by the processes used. The risk
measurement methods and models that we use comply with the
latest common banking industry standards and are regularly re-
viewed by risk control, internal audit, our external auditors and
the German and European supervisory authorities. The processes
ensure that our risk-bearing capacity and our ability to meet finan-
cial obligations at all times are maintained on a lasting basis. We
consider our risk management methods and processes to be ap-
propriate and effective.
Risk management organisation
Commerzbank regards risk management as a task for the whole
Bank. The Chief Risk Officer (CRO) is responsible for developing
and implementing the Group’s risk policy guidelines for quantifia-
ble risks, laid down by the Board of Managing Directors, as well as
for measuring these risks. The CRO regularly reports to the full
Board of Managing Directors and the Supervisory Board’s Risk
Committee on the overall risk situation within the Group. The Risk
Committee met five times in 2020.
Until 31 December 2020, the risk management organisation
consisted of the following divisions: Group Credit Risk Manage-
ment, Group Kredit, Group Market Risk Management, Group Risk
Controlling & Capital Management and Group Cyber Risk & Infor-
mation Security.
As of 1 January 2021, Commerzbank combined the divisions
Group Market Risk Management and Group Risk Controlling &
Capital Management to form the new Group Risk Control division.
Furthermore, the Group Big Data & Advanced Analytics division
was integrated into the risk management organisation.
In addition, the CRO has assumed responsibility for Group
Compliance. It is Group Compliance’s responsibility to establish
appropriate governance, procedures and systems to avoid the
Bank being unintentionally endangered as a consequence of com-
pliance risks. Group Compliance is controlled by the Chief Compli-
ance Officer.
All divisions have a direct reporting line to the CRO.
The full Board of Managing Directors has exclusive responsibil-
ity for fundamental strategic decisions. The Board of Managing
Directors has delegated operative risk management to committees.
Under the relevant rules of procedure, these are the Group Credit
Committee, the Group Market Risk Committee, the Group OpRisk
Committee, the Group Cyber Risk & Information Security Commit-
tee and the Group Strategic Risk Committee, which decides on risk
issues of an overarching nature. The CRO chairs all these commit-
tees and has the right of veto. The CRO is also a member of the
central Asset Liability Committee. Here the CRO also has a right of
veto on certain topics (e.g. liquidity risk issues).
Further details on the risk management organisation can be
found in the Group Risk Report in the Annual Report 2020 from
page 124.
Risk strategy and risk management
The Group Risk Strategy, together with the business strategy, regu-
lates the strategic risk management guidelines for the development
of Commerzbank’s investment portfolio. It defines the risk appetite
as the maximum risk that the Bank is prepared and able to accept
while following its business objectives without exposing itself to
existential threats over and above the risks inherent in the business.
The guiding idea is to ensure that the Group holds sufficient liquidi-
ty and capital. Based on these requirements, suitable limits for the
risk resources capital and liquidity available to the Group are de-
fined. The overarching limits of the Group Risk Strategy are con-
sistent with the indicator thresholds of the recovery plan.
Banks’ core functions as transformers of liquidity and risk re-
sult in inevitable threats that can in extreme cases endanger the
continued existence of the institution. For Commerzbank, in view
of its business model, these inherent existential threats include the
default of Germany, Poland, one or more of the other major EU
countries (France, Italy, Spain or the UK, although Brexit is not
deemed to be a default) or the default of the USA. Italy has an idi-
osyncratic special position on account of the large legacy expo-
sure to the Italian state, whereas in the case of the other countries
the existential threat would result from the effects of a state de-
fault on the banks and companies and the implications for the oth-
er EU countries. Other risks seen as inherent include a deep re-
cession lasting several years with serious repercussions for the
German economy (caused, for instance, by a global pandemic or
by the USA or China), a bank run and the collapse of global clear-
ing houses or the foreign exchange markets, possibly triggered by
a cyber attack. In general, cyber risk in the context of increasing
digitalisation in the business environment, comprises certain sce-
narios which under certain circumstances may cause damages and
hence might be also significant for Commerzbank. As a result of
the unexpected and abrupt global economic slump triggered by
the outbreak of the coronavirus pandemic, the risks increased,
especially in view of Commerzbank’s positioning as the leading
bank for small and medium-sized enterprises in Germany.

Introduction Equity capital Risk-oriented overall bank management Specific risk management Appendix 19
When pursuing its business targets, the Bank accepts these ex-
istential threats. It may be necessary to adjust the business model
and hence the business and risk strategies in the medium and long
term if the full Board of Managing Directors’ assessment of these
threats to Commerzbank changes substantially. To the extent that
it is able to do so, Commerzbank makes early preparations in an-
ticipation of forthcoming changes in regulatory requirements and
accounting standards. Such changes and their (retrospective) in-
terpretation may have lasting implications for – and even threaten
the survival of – Commerzbank’s business model. Commerzbank
takes these “regulatory risks” into account because there are
many cases where there is no option to mitigate or manage them.
The overall Group Risk Strategy covers all material risks to
which Commerzbank is exposed. It is updated on an ad hoc basis
if necessary, detailed further in the form of sub-risk strategies for
the risk types which are material. These are then specified and
made operational through policies, regulations and instructions/
guidelines. By means of the risk inventory process – which has to
be carried out beforehand – Commerzbank ensures that all risks of
relevance to the Group are identified and their materiality is as-
sessed. The assessment of the materiality of a risk is based on
whether its occurrence could have a major direct or indirect nega-
tive impact on the Bank’s risk-bearing capacity.
As part of the planning process, the Board of Managing Direc-
tors decides the extent to which the risk coverage potential of the
Group should be utilised. On that basis, individual types of quanti-
fiable risk contributing to the capital demand are limited in a sec-
ond stage. A capital framework is allocated to the management-
relevant units through the planning process. Compliance with lim-
its and guidelines is monitored during the year, and management
measures are put in place where required. In addition, further
qualitative and quantitative early warning indicators are estab-
lished in the Group Risk Strategy. Potential negative developments
can be identified at an early stage with the help of these indicators.
One of the primary tasks of risk management is the avoidance
of risk concentrations. These can arise from the synchronous
movement of risk positions both within a single risk type (intra-
risk concentrations) and across different risk types (inter-risk con-
centrations). The latter result from common risk drivers or from
interactions between different risk drivers of different risk types.
By establishing adequate risk management and controlling pro-
cesses, Commerzbank provides for the identification, assessment,
management, monitoring and communication of material risks and
related risk concentrations. This ensures that all Commerzbank-
specific risk concentrations are taken into account in its risk man-
agement. Stress tests are regularly used to ensure transparency
regarding risk concentrations. The design of the scenarios, and the
procedure as a whole, ensure that the effects of adverse scenarios
on the portfolio emphases and risk concentrations are systematical-
ly analysed. Management is regularly informed about the results of
the analyses so that the potential risk of losses can be avoided in
good time.
The Group Risk & Capital Monitor is the monthly, controlling-
oriented risk report for capital, credit risk, market risk, liquidity and
OpRisk related subjects of Commerzbank’s risk management. It
shows all the above risk types, including economic and regulatory
risk-bearing capacity, for the Commerzbank Group. The report’s
aims include providing the full Board of Managing Directors and the
Supervisory Board’s Risk Committee with transparent and compre-
hensive information, highlighting important developments from a
risk perspective and setting management measures. Particularly,
limits and guidelines of the Group Risk Strategy are monitored by
the report. The Group Risk Strategy and the Group Risk & Capital
Monitor are approved by the full Board of Managing Directors.
Commerzbank has adopted a code of conduct that defines
binding minimum standards for Commerzbank’s corporate re-
sponsibility, its dealings with customers, business partners and
colleagues, and its day-to-day business. The Bank complies with
relevant laws, regulatory requirements, industry standards and
internal rules, and this therefore forms a particularly important
part of its risk culture. It actively demands appropriate and coura-
geous conduct and integrity of behaviour in compliance with rules,
and any failure to comply with rules is penalised. Expansions of
procedures ensure that misconduct is assessed in a standardised
and fair manner and thus strengthen the management of conse-
quences on a long term basis.
The main pillar of the Bank’s overall risk management and cul-
ture is the concept of “three lines of defence”, which is a core el-
ement of the Corporate Charter. Under this “three lines of defence
principle”, protecting against undesirable risks is an activity that is
not restricted to the risk function. Each unit (segment or function)
forms the first line of defence within its area of operational re-
sponsibility and is responsible for identifying and managing risks
within it while complying with the prescribed risk standards and
policies. For example, the front office forms the first line of de-
fence in all business decisions and has to take risk aspects into
account in reaching them. The second line of defence for each
type of risk lays down standards for appropriate management of
risks of that type, monitors this and ensures the application of
such standards, and analyses and evaluates the risks. The risk
function forms the second line of defence against credit and mar-
ket risks associated with business decisions. Particularly for credit
risk, this includes involvement in the credit decision process
through means of a second vote. Units outside the risk function
(e.g. Group Compliance and Group Finance) also operate as the
second line of defence for certain risk types. The third line of de-
fence is internal audit.

20 Commerzbank Disclosure Report 2020
Under the provisions of the Remuneration Ordinance for Insti-
tutions (Institutsvergütungsverordnung), every year Commerzbank
identifies, in a regular process, those employees that because of
their actions have a material impact on Commerzbank’s overall
risk profile (risk takers). These risk takers are identified in accord-
ance with regulatory requirements on the basis of their function
within the organisation (including management level) and their
function-related activities. Special regulations apply to risk takers
as regards measuring their performance and the manner in which
their variable remuneration is paid out. Information in relation to
the remuneration system of Commerzbank Group according to
Article 450 CRR can be found in the Remuneration Report within
the Annual Report 2020 and in the separate Remuneration Report
on the internet pages of Commerzbank. Information on corporate
governance according to Article 435 (2) CRR is provided in the
Annual Report 2020 (Corporate Governance Report) from page 27
(Declaration on corporate governance) and on the internet pages
of Commerzbank.
Information on the indicators of global systemic importance
according to Article 441 CRR is given in a separate disclosure on
the internet pages of Commerzbank in the section Bondholder in-
formation/Transparency disclosures.
Risk-bearing capacity and stress testing
Risk-bearing capacity analysis is a key part of overall bank man-
agement and Commerzbank’s ICAAP. The purpose is to ensure
that sufficient capital is held at all times. The risk-bearing capacity
concept is reviewed and optimised annually.
When determining the economically required capital, allow-
ance is made for potential unexpected fluctuations in value. Where
such fluctuations exceed forecasts, they must be covered by the
available economic capital to absorb unexpected losses (risk cov-
erage potential). Only the economic value of equity components
that absorb losses in the going concern approach is taken into ac-
count in determining the economic risk coverage potential.
The capital requirement for the risks taken is quantified using
the internal economic capital model. All risk types of the Commerz-
bank Group classified as significant and quantifiable within the
annual risk inventory are considered when determining the eco-
nomically required capital. The economic risk approach therefore
also comprises risk types that are not included in the regulatory
requirements for banks’ capital adequacy. The model also reflects
diversification effects incorporating all types of risk. The confi-
dence level for the calculation of economically required capital is
99.90% and is harmonised with the going concern approach. The
quantifiable significant risks in the economic capital model are
divided into default risk, market risk, operational risk and (not
separately disclosed in the table on the next page) business risk
and property value change risk. Business risk is the risk of a po-
tential loss resulting from deviations in actual income and expense
from the respective budgeted figures. Business risk is used to sub-
stantiate a higher-level management buffer that ensures the re-
sponsiveness of capital management. Physical asset risk is the risk
of an unexpected fall in the value of owned property which is ei-
ther already recognised as an asset in the Group’s balance sheet
or which can be recognised during the next 12 months under con-
tractually assured obligations with option character (especially
real estate). In the 2020 risk inventory, the reserve risk was again
classified as material. Allowance is made for this risk by means of
a corresponding risk buffer when considering risk-bearing capaci-
ty. The results of the risk-bearing capacity analysis are shown us-
ing the risk-bearing capacity ratio (RBC ratio), indicating the ex-
cess of the risk coverage potential in relation to the economically
required capital.
Risk-bearing capacity is monitored and managed monthly at
Group level. Risk-bearing capacity is deemed to be assured as
long as the RBC ratio is higher than 100%. In 2020, the RBC ratio
was consistently above 100% and stood at 159% as at 31 Decem-
ber 2020. The decrease in the risk coverage potential compared to
December 2019 was mainly due to the consolidated loss for the
2020 financial year. At the same time, the write-down of goodwill
included in this result led to a reduction in the risk buffer in the
economic capital. The RBC ratio is still well above the minimum
requirement.
RBC1: Group’s risk-bearing capacity Risk-bearing capacity Group | €bn 31.12.2020 31.12.2019
Economic risk coverage potential 22 24
Economically required capital1 14 15
thereof for credit risk 10 10
thereof for market risk2 4 4
thereof for operational risk 1 1
thereof diversification effects – 2 – 2
RBC ratio3 159% 161%
1 Including physical asset risk, risk of unlisted investments and the risk buffer for reserve risk and for the quantification of potential fluctuations in value of goodwill and intangibles. As a result of the write-down of goodwill, the corresponding risk buffer no longer applies as at 31 December 2020.
2 Including deposit model risk. 3 RBC ratio = economic risk coverage potential/economically required capital (including
risk buffer).
Commerzbank uses macroeconomic stress tests to review the risk-
bearing capacity in the event of assumed adverse changes in the
economic environment. The underlying scenarios take into ac-
count the interdependence of the development of the real econo-
my and the financial economy. They are updated quarterly and
approved by the ALCO. The scenarios describe an extraordinary

Introduction Equity capital Risk-oriented overall bank management Specific risk management Appendix 21
but plausible adverse development in the economy, focusing in
particular on portfolio priorities (e.g. export-based sectors in Ger-
many) and business strategies of relevance to Commerzbank. Cur-
rent adverse developments (e.g. the coronavirus pandemic) are
also taken into account when creating the scenarios. Stress tests in
the economic perspective cover a time horizon of 12 months. The
scenario simulation is run quarterly at Group level using the input
parameters of the economic capital requirements calculation for
all material and quantifiable risk types. In addition to the capital
required, the income statement is also subjected to a stress test
based on the macroeconomic scenarios. Based on this, changes in
the risk coverage potential are simulated. Whereas the RBC ratio
is embedded into Commerzbank’s limit system, guidelines for risk-
bearing capacity are set as an early warning system in the stressed
environment. The ongoing monitoring of the limits and guidelines
is a key part of internal reporting. Defined escalations are trig-
gered if the limits are breached.
The risk-bearing capacity and stress testing concept is subject
to an annual internal review and is refined on an ongoing basis.
The development of the regulatory environment is also considered.
In addition to the regular stress tests, reverse stress tests are im-
plemented annually at Group level. Unlike regular stress testing,
the result of the simulation – a sustained threat to the Bank – is
determined in advance. The aim of the analysis process in the re-
verse stress test is to improve the transparency of Bank-specific
risk potential and interactions of risk by identifying and assessing
extreme scenarios and events. On this basis, for instance, action
fields in risk management including the regular stress tests can be
identified and considered in the ongoing development efforts.

22 Commerzbank Disclosure Report 2020
Credit risk (default risk from credit risk) (CR) is defined as the risk
of losses sustained or profits foregone due to the default of a coun-
terparty. It is a quantifiable material risk and includes the sub-risk
types of credit default risk, issuer risk, counterparty credit risk,
country and transfer risk, dilution risk and reserve risk. The de-
fault risk from counterparty risk is shown separately in the section
on counterparty credit risk in this report.
Risk management
Strategy and organisation
The credit risk strategy is the sub-risk strategy for default risks
and is derived from the group risk strategy. It is embedded in the
ICAAP process of the Commerzbank Group and forms a link be-
tween the Bank’s overall risk management across all risk types and
the operationalisation of default risk management. The overriding
aim is to ensure the adequate portfolio quality of the credit portfo-
lio. To this end, the credit risk strategy defines the credit risk tol-
erance, specifies risk strategy priorities, provides an overview of
the material credit risk management concepts and thereby plays
an integral part in maintaining the Group’s risk-bearing capacity.
The credit risk strategy makes use of quantitative and qualitative
management tools that give decision-makers clear guidance on
both portfolio management and decisions in specific cases.
Credit risk management is a joint task of the front office and
the risk function, based on a standardised Group-wide credit risk
culture. Impeccable moral and ethical conduct in compliance with
the law and regulations is a key element of a culture of integrity
and core to the credit risk culture. Default risks are assessed
against uniform standards, regardless of segment limits. In line
with the three lines of defence principle, the front office is the first
line of defence and must take risk aspects into account when tak-
ing business decisions. The risk function is the second line of de-
fence (back office and risk controlling), its task being to manage,
limit and monitor risks. The third line of defence is internal audit.
It is tasked with independently auditing the Bank’s processes and
safety precautions, and as such also assesses the activities of the
first and second lines of defence.
The Group Credit Committee is the highest decision-making
committee for operative credit risk management, comprising two
representatives each from the back office and front office. It takes
decisions in line with the competencies delegated to it by the full
Board of Managing Directors and is responsible for managing all
credit risks. In so doing, the Group Credit Committee operates
based on the valid credit risk strategy. Reporting to the Group
Credit Committee are sub-credit committees, which operate on the
basis of their respective rules of procedure and within the compe-
tencies approved by the full Board of Managing Directors. They
comprise at least two representatives from the segments and two
representatives from Group Risk Management. The sub-credit
committees are generally in charge of managing all credit risks of
the sub-portfolios they take responsibility for and are authorised to
further delegate specific credit decisions in accordance with their
competencies
Discrete back-office areas are responsible for operational credit
risk management at portfolio level and on a case-by-case basis.
The responsibilities are separated between the performing loan
area on the one hand and intensively cared business on the other.
All credit decisions in the performing loan area are risk/return de-
cisions. The front and back office take joint responsibility for risk
and return from an exposure, with the front office having primary
responsibility for the return, and the back office for the risk. Ac-
cordingly, neither office can be overruled in its primary responsi-
bility in the credit decision process.
Higher-risk customers are handled by specialist Intensive Care
areas. The customers are moved to these areas as soon as they
meet defined criteria for assignment or mandatory transfer. The
principal reasons for assignment to the task sector Intensive Care
areas are criteria relating to number of days overdrawn, together
with event-related criteria such as rating, third-party enforcement
measures or credit fraud. The task sector Intensive Care decides
on further action based on the circumstances of individual cases.
Customers must be transferred to the task sector Intensive Care if
they are in default (for example due to insolvency). This graduated
approach ensures that higher-risk customers can continue to be
managed promptly by specialists in a manner appropriate to the
risks involved and in defined standardised processes.
Operative Risk management
Commerzbank manages default risk using a comprehensive risk
management system. The management framework comprises an
organisational structure, methods and models, quantitative and
qualitative management tools and regulations and processes. The
risk management system ensures that the entire portfolio and the
sub-portfolios, down to individual exposure level, are managed
consistently and thoroughly down on a top-down basis.
The ratios and measures required for the operational process of
risk management are based on the overarching Group objectives.
The principle of maintaining a low-risk profile in all business deci-
sions is closely combined here with the risk function’s aim of
providing the front office with appropriate support. It prefers
business and products with low complexity and pays attention to
the responsiveness of credit lines and exposures.
Quantitative credit risk strategy guidelines limit risks with re-
gard to poorer credit ratings and exposures with high loss-at-
A. Credit risk (CR)
Introduction Equity capital Risk-oriented overall bank management Specific risk management Appendix 23
A. Credit risk (CR)
default contributions (concentration management) and for selected
sub-portfolios with a high risk weight or regulatory importance,
and, as applicable, for individual products with a high portfolio
share. Detailed arrangements for operationalising the guidelines
for selected sub-portfolios are set out in separate portfolio policies.
In addition, qualitative management guidelines in the form of
credit policies define the target business of the Bank. At the level
of individual transactions, they regulate the transaction type with
which the risk resources provided are to be used. These credit pol-
icies are firmly embedded in the credit process: transactions
which do not meet the requirements are escalated through a fixed
competence regulation.
Group-wide guidelines are based on risk-oriented analyses of
trends (for instance, the changes in weaker credit ratings over
time) combined with an assessment of overall conditions and in-
ternal rules. Risk-oriented portfolio analyses (e.g. the rating profile
of individual asset classes) are used in particular to derive portfo-
lio guidelines. Trend analyses of product-specific risk drivers (for
example, the loan to value ratio in retail mortgage financing) are
key factors for determining product guidelines. In contrast, credit
and portfolio policies are primarily produced through a multi-level
coordination process involving the product and portfolio managers
from the front and back offices, combined with an assessment of
internal and external information sources.
To monitor compliance with credit risk strategy rules, continu-
ous monitoring and reporting has also been set up at whole Group
level and at segment or sub-portfolio level. Asset quality reviews
by the risk function make an important contribution here to quality
assurance and early risk detection. The key aspects of monitoring
vary according to the subject matter and target audience, and ad-
hoc reporting processes are in place. In addition, crisis events may
pose a risk to the adequacy of the Bank’s capital and liquidity re-
sources and thereby to its risk-bearing capacity. In a crisis, the
Risk Mitigation Task Force will manage decisions flexibly in a co-
ordinated, Group-wide process. As part of the current pandemic,
the Corona Task Force was established at the beginning of 2020 in
order to identify and counteract the effects on the Group portfolio
as soon as possible. As part of the process, emergency action
plans ensure that risk-mitigation measures are implemented
quickly and efficiently.
The avoidance of risk concentrations is a core strategy of risk
management. Risk concentrations are actively managed in order to
identify at an early stage and contain the increased potential for
loss in the synchronous movement of risk positions. In addition to
exposure-related credit risk concentrations (bulk risks), credit risk
management also considers country and sector concentrations.
Segment-specific features are considered here.
Management and the Supervisory Board’s Risk Committee are
regularly informed about the results of the analyses.
Management of economic capital commitment
Economic capital commitment is managed in order to ensure that
the Commerzbank Group holds sufficient capital. To this end, in
the Group Risk Strategy all risk types relevant for economic risk
capital are given limits on a Group-wide basis, with, in particular,
a CVaR limit being specified. Due to the systematically restricted
options for reducing default risk on a short-term basis, it is im-
portant to take account of expected trends (medium-term and
long-term) in order to manage credit risk. For this reason, forecast
values of credit risk parameters play a key role in ongoing man-
agement. At segment and business area level, changes of forecasts
are monitored and adjustments made when necessary. There is no
cascaded capital limit concept for credit risk below Group level.
Country risk management
The Group’s country risk assessment covers both transfer risks
and event risks driven by political and economic events which im-
pact on the individual economic entities of a country. Country risks
are managed based on transfer risk limits defined at country level.
Country exposures which are significant for Commerzbank due to
their size, are handled by the Credit Risk Committee on a separate
basis.
The regional breakdown of the exposure corresponds to the
Bank’s strategic direction and reflects the main areas of its global
business activities.
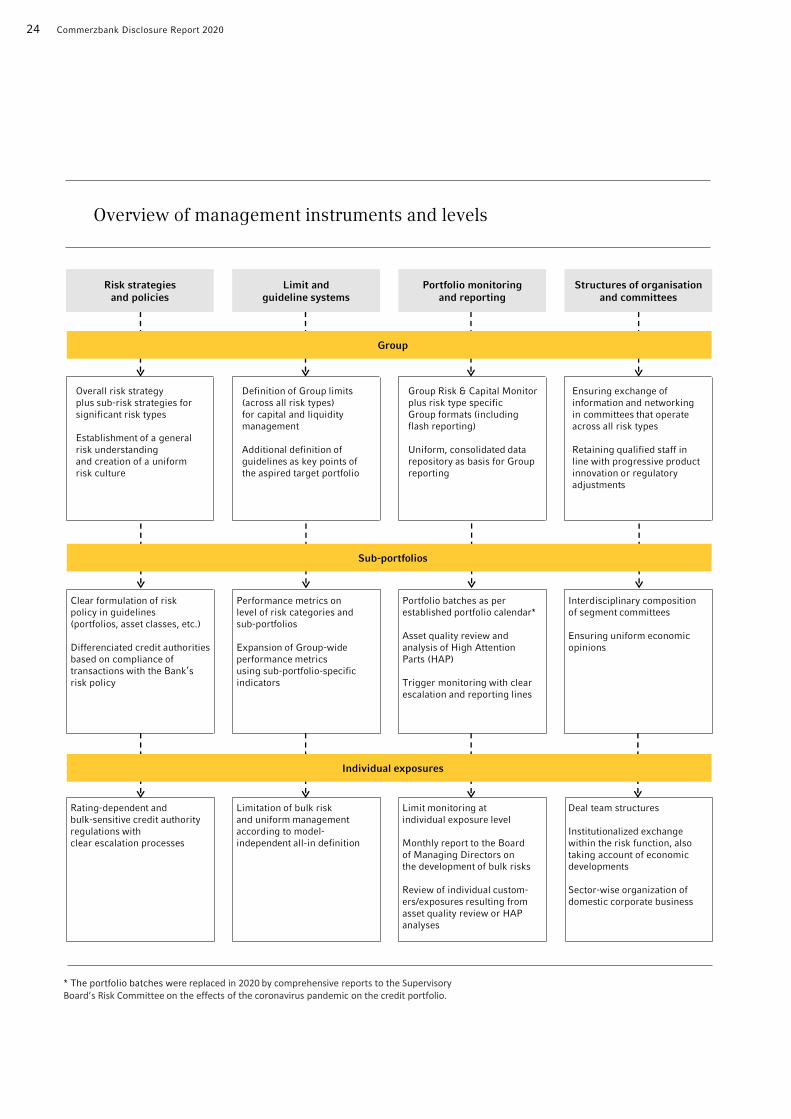
24 Commerzbank Disclosure Report 2020
Overview of management instruments and levels
Structures of organisationand committees
Group
Interdisciplinary compositionof segment committees
Ensuring uniform economicopinions
Portfolio batches as perestablished portfolio calendar*
Asset quality review andanalysis of High AttentionParts (HAP)
Trigger monitoring with clearescalation and reporting lines
Clear formulation of riskpolicy in guidelines(portfolios, asset classes, etc.)
Differenciated credit authoritiesbased on compliance oftransactions with the Bank’srisk policy
Performance metrics onlevel of risk categories andsub-portfolios
Expansion of Group-wideperformance metricsusing sub-portfolio-specificindicators
Deal team structures
Institutionalized exchangewithin the risk function, alsotaking account of economicdevelopments
Sector-wise organization ofdomestic corporate business
Limit monitoring atindividual exposure level
Monthly report to the Boardof Managing Directors onthe development of bulk risks
Review of individual custom-ers/exposures resulting fromasset quality review or HAPanalyses
Rating-dependent andbulk-sensitive credit authorityregulations withclear escalation processes
Limitation of bulk riskand uniform managementaccording to model-independent all-in definition
Risk strategiesand policies
Limit andguideline systems
Ensuring exchange ofinformation and networkingin committees that operateacross all risk types
Retaining qualified staff inline with progressive productinnovation or regulatoryadjustments
Group Risk & Capital Monitorplus risk type specificGroup formats (includingflash reporting)
Uniform, consolidated datarepository as basis for Groupreporting
Overall risk strategyplus sub-risk strategies forsignificant risk types
Establishment of a generalrisk understandingand creation of a uniformrisk culture
Definition of Group limits(across all risk types)for capital and liquiditymanagement
Additional definition ofguidelines as key points ofthe aspired target portfolio
Portfolio monitoringand reporting
Individual exposures
Sub-portfolios
* The portfolio batches were replaced in 2020 by comprehensive reports to the Supervisory Board’s Risk Committee on the effects of the coronavirus pandemic on the credit portfolio.
Introduction Equity capital Risk-oriented overall bank management Specific risk management Appendix 25
A. Credit risk (CR)
Credit risk model
The quantification of default risks takes place through the imple-
mentation of a Group-wide credit risk model, which consists of
internally developed rating systems and a loan portfolio model.
The rating systems calculate the risk parameters of probability of
default (PD), exposure at default (EaD1) and loss given default
(LGD) for every credit risk position. This enables the expected loss
and risk-weighted assets to be calculated for each individual posi-
tion pursuant to the IRB approach.
The loan portfolio model also produces probability statements
on losses from credit defaults and rating changes at portfolio level.
Unexpected loss (credit value at risk – CVaR) is quantified on a
risk horizon of one year. The model measures the extent of poten-
tial credit risk losses over and above the expected loss and must
be backed by equity capital within the internal capital adequacy
assessment process (ICAAP).
Commerzbank’s loan portfolio model is an in-house model
which, as with the CreditMetrics or Moody’s KMV model, is based
on the asset value approach. A Monte Carlo simulation simulates
potential realisations of borrowers’ assets and changes to borrow-
ers’ creditworthiness and defaults. Possible future losses at port-
folio level are calculated and statistically analysed on this basis.
The loan portfolio model requires transaction and customer da-
ta: level of exposure, creditworthiness, expected loss given default,
country and sector classification.
Dependencies between possible default events are also mod-
elled through around 60 systematic risk factors. Specific model
parameters (correlations) measure the connection of individual
borrowers to these system factors and the correlation between
system factors. This way they quantify potential diversification
effects between different sectors and countries.
Commerzbank’s credit risk model thus constitutes the basis for
the calculation of risk-weighted assets according to the IRB ap-
proach and is also a key part of the internal risk and capital man-
agement process of the Group portfolio.
Rating procedures
A key component of Commerzbank’s rating architecture is the use
of single point of methodology rating procedures, taking ad-
vantage of a central suite of computation kernels. This uniform
process architecture not only facilitates risk management and
monitoring but also supports consistent rating assignments within
the Commerzbank Group. The rating processes are in turn em-
bedded in rating systems. In addition to the conventional methods
of assessing creditworthiness and risk, these comprise all the pro-
cesses for preparing data, calculating ratings and implementing
monitoring and management measures.
The use of rating processes is an essential component of risk
assessment in the Commerzbank Group, irrespective of regulatory
requirements. The resulting ratings are then used in front and
back office credit decision-making processes, the determination of
loan loss provisions under IFRS and internal measurement of
CVaR and risk-bearing capacity, respectively. Rating processes are
also further revised and improved. These improvements make risk
forecasts more accurate and improve management mechanisms.
The tables below show the rating processes used in the IRBA in
the individual asset classes according to the CRR and their main
elements as at the reporting date. Further models are in use at
mBank. Details are given in the mBank disclosure report on their
English internet page (About us Capital Adequacy Information
Policy).
1 Economic EaD: Exposure at default amount taking into account a potential (partial) drawing of open lines and contingent liabilities that will adversely affect risk-bearing capacity in the event of default.
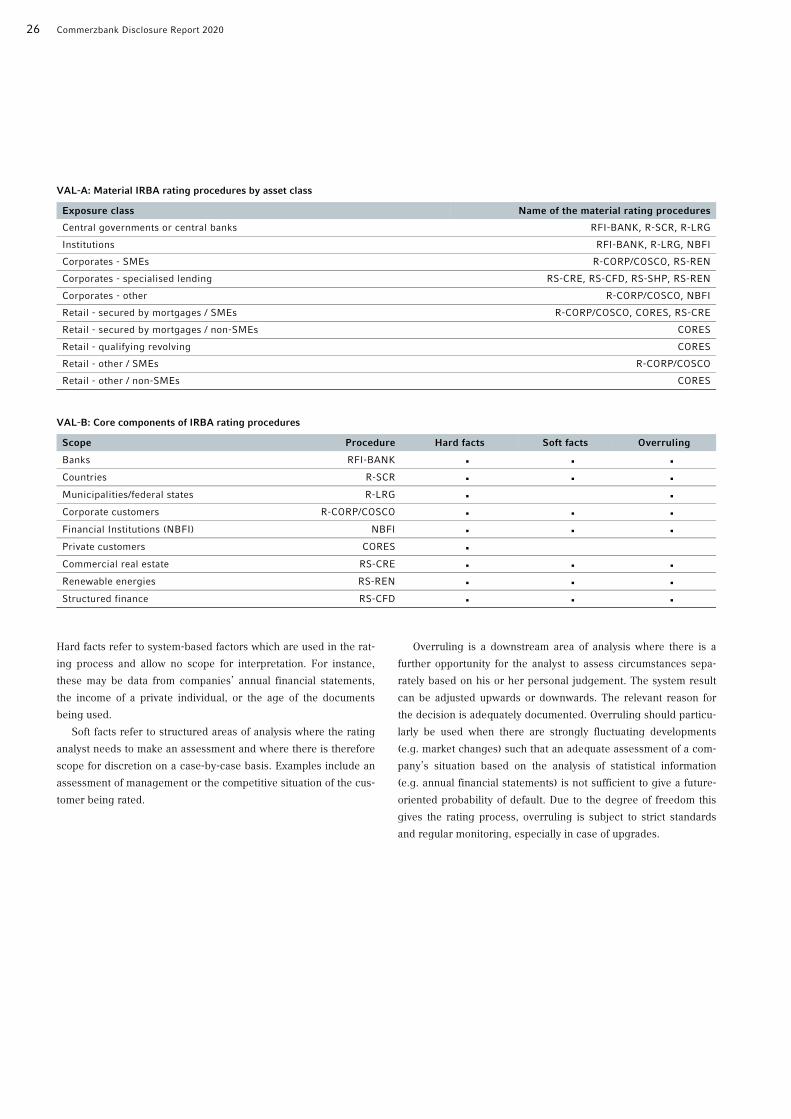
26 Commerzbank Disclosure Report 2020
VAL-A: Material IRBA rating procedures by asset class Exposure class Name of the material rating procedures
Central governments or central banks RFI-BANK, R-SCR, R-LRG
Institutions RFI-BANK, R-LRG, NBFI
Corporates - SMEs R-CORP/COSCO, RS-REN
Corporates - specialised lending RS-CRE, RS-CFD, RS-SHP, RS-REN
Corporates - other R-CORP/COSCO, NBFI
Retail - secured by mortgages / SMEs R-CORP/COSCO, CORES, RS-CRE
Retail - secured by mortgages / non-SMEs CORES
Retail - qualifying revolving CORES
Retail - other / SMEs R-CORP/COSCO
Retail - other / non-SMEs CORES
VAL-B: Core components of IRBA rating procedures Scope Procedure Hard facts Soft facts Overruling
Banks RFI-BANK ▪ ▪ ▪ Countries R-SCR ▪ ▪ ▪ Municipalities/federal states R-LRG ▪ ▪ Corporate customers R-CORP/COSCO ▪ ▪ ▪ Financial Institutions (NBFI) NBFI ▪ ▪ ▪ Private customers CORES ▪ Commercial real estate RS-CRE ▪ ▪ ▪ Renewable energies RS-REN ▪ ▪ ▪ Structured finance RS-CFD ▪ ▪ ▪
Hard facts refer to system-based factors which are used in the rat-
ing process and allow no scope for interpretation. For instance,
these may be data from companies’ annual financial statements,
the income of a private individual, or the age of the documents
being used.
Soft facts refer to structured areas of analysis where the rating
analyst needs to make an assessment and where there is therefore
scope for discretion on a case-by-case basis. Examples include an
assessment of management or the competitive situation of the cus-
tomer being rated.
Overruling is a downstream area of analysis where there is a
further opportunity for the analyst to assess circumstances sepa-
rately based on his or her personal judgement. The system result
can be adjusted upwards or downwards. The relevant reason for
the decision is adequately documented. Overruling should particu-
larly be used when there are strongly fluctuating developments
(e.g. market changes) such that an adequate assessment of a com-
pany’s situation based on the analysis of statistical information
(e.g. annual financial statements) is not sufficient to give a future-
oriented probability of default. Due to the degree of freedom this
gives the rating process, overruling is subject to strict standards
and regular monitoring, especially in case of upgrades.

Introduction Equity capital Risk-oriented overall bank management Specific risk management Appendix 27
A. Credit risk (CR)
The Commerzbank rating method comprises 25 rating classes
for customers not in default (1.0 to 5.8) and five default classes
(6.1 to 6.5). The Commerzbank master scale allocates precisely one
rating class, stable over time, to each probability of default. The
rating methods are validated annually and recalibrated where nec-
essary so that they reflect the latest assessment based on all actual
observed defaults. The probability of default ranges assigned to the
ratings are the same for all portfolios. This ensures internal compa-
rability consistent with the master scale method. For guidance and
indicative purposes, the Commerzbank master scale also shows
external ratings as well as credit quality steps in accordance with
Article 136 CRR. However, a direct reconciliation is not possible,
because external ratings of different portfolios show fluctuating
default rates from year to year.
The credit approval authorities of both individual staff and the
committees (Board of Managing Directors, credit committee, cred-
it sub-committees) are graduated by a range of factors including
size of exposure and rating class.
0
0.01
0.02
0.04
0.07
0.11
0.17
0.26
0.39
0.57
0.81
1.14
1.56
2.10
2.74
3.50
4.35
5.42
6.74
8.39
10.43
12.98
16.15
20.09
47.34
0
0 – 0.02
0.02 – 0.03
0.03 – 0.05
0.05 – 0.08
0.08 – 0.13
0.13 – 0.21
0.21 – 0.31
0.31 – 0.47
0.47 – 0.68
0.68 – 0.96
0.96 – 1.34
1.34 – 1.81
1.81 – 2.40
2.40 – 3.10
3.10 – 3.90
3.90 – 4.86
4.86 – 6.04
6.04 – 7.52
7.52 – 9.35
9.35 – 11.64
11.64 – 14.48
14.48 – 18.01
18.01 – 22.41
22.41 – 99.99
Investment
Grade
Sub-
investment
grade
Non-
investment
grade
Default
Commerzbank AGrating
PD and EL mid-point%
PD and EL range%
S&P scale Credit quality steps in accordancewith Article 136 CRR1
1.0
1.2
1.4
1.6
1.8
2.0
2.2
2.4
2.6
2.8
3.0
3.2
3.4
3.6
3.8
4.0
4.2
4.4
4.6
4.8
5.0
5.2
5.4
5.6
5.8
6.1
6.2
6.3
6.4
6.5
I
II
III
IV
V
VI
AAA
AA
A
BBB
BB
B
CCC
CC, C
AAA
AA+
AA, AA–
A+, A
A–
BBB+
BBB
BBB–
BB+
BB
BB–
B+
B
B–
CCC+
CCC, CCC–
CC, C
> 90 days past due
Imminent insolvency
Restructuring with recapitalisation
Termination without insolvency
Insolvency
D
1 CRR = Capital Requirements Regulation (EU) No 575/2013.
Commerzbank master scale
100

28 Commerzbank Disclosure Report 2020
As at 31 December 2020, Commerzbank has an IRBA coverage
ratio at Group level of 97.8% for IRBA exposure values and
92.3% for risk-weighted IRBA exposure values, exceeding the
IRBA exit threshold of 92% under section 10 of the Solvency Reg-
ulation (in the version applicable as at 1 January 2014). For loans
and receivables that are not covered by the procedures approved
by the supervisory authorities for the IRB approach, the standard-
ised approach for credit risk (SACR) applies, under which flat risk
weightings are to be used or risk weightings are to be based on
external assessments of the borrower’s creditworthiness.
Risk parameters
In addition to classifying the probability of default (PD) within the
scope of the rating process, correctly assessing loss severity is
essential for a reliable and holistic risk assessment. The loss sever-
ity is determined firstly by the exposure at default (EaD) and sec-
ondly by the loss given default (LGD).
In general, modelling the probabilities of default is based on
the Bank’s internal long-standing empirical default data. Should
this data not be sufficient for specific portfolios (low-default port-
folios), different approaches are used to model the probabilities of
default. Shadow rating procedures are one option. Comparing the
Bank’s internal risk factors with the ratings of external agencies
gives indications of how the Bank’s credit rating estimates should
be classified in relative terms. The shadow rating procedures are
calibrated based on empirical default rates over many years for the
rating classes used by external rating agencies. In rating proce-
dures for special funding, the customer’s credit rating derives
principally from the cash flows generated by the rating object.
Typically, the rating procedures are therefore based on cash flow
simulations using stochastic processes. The procedures are nor-
mally used in low default or low number portfolios for which only
very few external benchmarks exist. The models are therefore
causally produced and often calibrated using expert knowledge.
Wholly expert-based rating procedures are the final option. No
external target criterion is available for these procedures and
there are no cash flow simulations. Parameterisation of the models
and their calibration are based wholly on expert knowledge.
When forecasting EaD unused credit lines and other contingent
liabilities are included via credit conversion factors (CCFs). De-
pending on the transaction and the customer, the CCFs describe
the probability of drawdown in the event of a default within the
next twelve months.
The LGD is primarily determined by the expected proceeds
from collateral and unsecured portions of loans. Proceeds from
collateral are modelled via recovery rates representing a discount
on the previously defined market value. The recovery rate depends
on the characteristics of the collateral. For instance, when model-
ling for properties, the collateral is differentiated by property type
and location. To determine the proceeds on unsecured portions of
loans, the focus is primarily on the characteristics of the customer
and the transaction.
The CCF and LGD models are based on bank-internal empirical
loss data. For this purpose, Commerzbank refers to a database of
internal credit defaults since 1997. New defaults are recorded con-
tinuously and are made available for statistical analysis once pro-
cessing is complete. For quality assurance purposes, the data col-
lection process is monitored by a number of controls and
automatic checking procedures.
Both the internal and regulatory requirements of the CRR are
considered when developing statistical models for estimating EaD
and LGD. Discussions with experts from back office and debt
workout departments play an important role when identifying rel-
evant factors and validating the results. In instances where there is
only a small number of historical default or collateral utilisation
cases, the empirical analyses are supplemented with expert as-
sessments.
It is possible that a positive correlation of the risk parameters
PD, LGD and CCF with one or more common macroeconomic risk
factors may lead to a heightened systematic credit risk. It is for
this reason that CRR Art. 181 (1) b) requires the use of LGD esti-
mates that are appropriate even in an economic downturn (so-
called downturn LGDs). Periods of an economic downturn are
characterised by systemically high default rates above the long-
term average. In downturn analyses, downturn years were deter-
mined and/or confirmed to estimate the risk parameters (CCF and
LGD components). Statistical models, particularly regression
models, are used to examine whether the downturn phases iden-
tified have a significant impact on the loss ratios; if applicable, an
appropriate discount is determined.
All models are regularly validated and recalibrated based on
the new findings, if necessary. Empirically-based PD, LGD and
EaD parameters are used in all important internal processes at
Commerzbank. The PD, LGD and EaD models employed by
Commerzbank are approved for the advanced IRB approach for
the asset classes listed in CRR Art. 452(c) i) to iv). The suitability
of the models was verified by the Bundesbank, BaFin and the
ECB as part of the inspection prior to the granting of authorisa-
tion for the advanced IRB approach and ex post reviews.
Finally, combining the above components yields an assessment
of the expected loss (EL = EaD*PD*LGD) and the risk density as a
ratio of EL to EaD (EL to EaD in basis points). The internal master
scale is used to clearly allocate borrower PDs (customer ratings)
and loan commitment risk densities (credit ratings) to the Bank's
internal rating classes.

Introduction Equity capital Risk-oriented overall bank management Specific risk management Appendix 29
A. Credit risk (CR)
Validation
Pursuant to Article 185 CRR, all risk classification procedures are
subject to a regular validation and calibration of parameters. The
credit risk control unit is the relevant unit for model development
and parameter calibration. The relevant models are validated at
least once a year and the results recorded in validation reports.
Responsibility for this lies with the independent validation unit.
Independence is ensured through different reporting lines to the
senior management level.
All validation results together with the need for action resulting
from them are presented for approval to a validation committee in
which senior management is represented. A summary of the vali-
dation committee’s results as well as any irregularities and neces-
sary changes are presented to the Bank’s Strategic Risk Commit-
tee; approval is required if there are any red validation traffic
lights. Regular monitoring of procedures is an additional system
control element. To check the quality of the rating procedures,
specialist personnel within Internal Audit regularly review the
methods and processes used and inspect validation and monitor-
ing methods. In the event of changes to the rating systems in ac-
cordance with CRR Article 143, an independent formal investiga-
tion is carried out to establish whether the relevant quantitative
and qualitative criteria were considered during categorisation,
together with the resulting categorisation.
Validation concepts are defining which analyses have to be car-
ried out rotationally for the rating systems as well as for EaD and
LGD models. The material analysis results are grouped and evalu-
ated using a traffic-light system. If the standards and limits that
have been defined in the validation concept are not met, it must be
clarified if there is a need for action. In this case, concrete steps
must be defined along with a timetable for implementing them.
These steps may include, for instance, measures to improve data
quality or a revision of the process in question.
Generally a distinction is to be made between the method vali-
dation and the process validation of the models. Data quality as-
pects and statistical analyses are of specific interest for the method
validation. This involves comparing the model forecasts with the
reality over the course of the assessment period. The quality of the
forecasts is verified using mathematical/statistical methods. As-
sessing the discriminatory power of rating procedures may involve
using Gini coefficients, concordance indices and hit rate analyses,
for instance. The calibration of procedures may be checked using
various statistical tests, such as the Spiegelhalter or binomial test.
Validation and model development do not take into account any
regulatory floors for PD. These are only taken into account during
the regulatory capital calculation to determine RWA.
Depending on the type of model a different validation proce-
dure to back-test each single model has to be applied, as de-
scribed in the following:
Default/non-default rating procedure: In default/non-default
models, ratio selection, parameter estimates and calibration
are mainly based on internal default periods. A check is there-
fore made during validation to ascertain whether the internally
measured default rates tally with the predicted probabilities of
default. Discriminatory power is also checked by calculating
the AUC value, and the Gini coefficient respectively.
Shadow rating procedure: The classic back-testing methods
used for default/non-default models cannot normally be ap-
plied to portfolios with very few defaults. Consequently, back-
testing in shadow rating procedures relies very heavily on
comparisons with external ratings. Comparing the Bank’s in-
ternal ratings with those of external agencies (Stand-
ard & Poor’s, Moody’s and FitchRatings) gives indications of
how the Bank’s credit rating estimates should be classified in
relative terms. For this benchmarking, contingency tables, for
example, are produced, deviations analysed and the Spearman
correlation coefficient calculated. A benchmarking analysis is
naturally only useful or possible if a large number of external
ratings are available. If this is not the case, pseudo discrimina-
tory power values, for example, can be calculated using either
external or final internal ratings.
Hybrid models: Hybrid models are basically mixtures of de-
fault/non–default models and shadow rating procedures. In
some low-default portfolios, an internal data history has had
time to develop. While this alone, at the time of development,
was not sufficient to develop a default/non-default model and
corresponding validation, the available data history is yet being
incorporated for validation or development purposes. The vali-
dation techniques of default/non-default models and shadow
rating procedures are combined in these procedures.
Cash flow-based procedures: In rating procedures for special
funding, the customer’s credit rating derives principally from
the cash flows generated by the rating object. Typically, the
rating procedures are therefore based on cash flow simulations
using stochastic processes. The procedures are normally used
in low default and low number respectively portfolios for which
only very few external benchmarks exist. The models are
therefore causally produced and often calibrated using expert
knowledge. Direct comparisons of the predicted PDs with real-
ised default rates and discriminatory power analyses using the
AUC are not normally very meaningful due to the low number
of defaults. The statistical testing of EaD and LGD predictions
of these models are likewise difficult. Key elements of the vali-
dation of these procedures are descriptive analyses of the input
data and comparisons of the cash flows and volatilities predict-
ed by the users with actual cash flows.
Wholly expert-based PD procedures: No external target crite-
rion is available for these procedures and there are no cash

30 Commerzbank Disclosure Report 2020
flow simulations. Calibration is based wholly on expert know-
ledge. Validation is therefore very heavily reliant on expert
know-how, as is the development. For the validation, the results
produced by the procedure in particular are compared with the
expert opinion, e.g. by evaluating the overruling pattern.
EaD and LGD models: On the basis of additional default and
loss data full-sample and out-of-sample tests are carried out
through statistical backtests. In this context the validity of ex-
isting parameter differentiations and the discriminatory power
of the applied risk factors have always to be analysed. Data
quality and the representativeness of observations for future
loss events are also important subjects of analyses.
The following table gives an overview of the quantitative model
approaches used for the individual rating procedures. The scope
of application of the rating procedures is presented in the section
on rating procedures in tables VAL-A and VAL-B.
VAL1: Overview on IRBA rating procedures of Commerzbank AG PD validation EaD / LGD validation
Rating procedure Methodology Data history Years
Methodology Data history Years
RFI-BANK Shadowrating,
Default/non-default 11 Calibrated empirically 21
R-SCR Shadowrating 10 Calibrated empirically 21
R-LRG Shadowrating 13 Expert-based –
R-CORP/COSCO Shadowrating,
Default/non-default 11 Calibrated empirically 21
NBFI Expert-based, Shadowrating 11 Expert-based –
CORES Default/non-default 11 Calibrated empirically 21
RS-CRE Default/non-default,
Shadowrating 11 Calibrated empirically 13
RS-CFD Cash flow simulation 9 Cash flow simulation 13
RS-REN Cash flow simulation 10 Cash flow simulation 13
ABS IAA IAA-methods1 – IAA-methods1 –
1 For internal classification procedure for securities see page 81.
Process validation is carried out in collaboration with the risk
model users. This includes compliance of the procedures with
regulations, overruling analyses and general user acceptance. For
EaD and LGD procedures the precise technical implementation of
parameters in all using systems has to be verified. Asset Quality
Reviews established in credit risk management also guarantee a
continuously reliable data quality and the implementation of the
model true to the process. Monthly reporting of rating coverage to
the Board of Managing Directors ensures that the portfolios are
valued using up-to-date and valid rating analyses.
The validations performed in 2020 show largely unremarkable
findings. The validation results for all separately calibrated IRBA
parameters and/or sub-models are summarised in the tables below
and broken down by PD, LGD and EaD method. This shows the
cases in which the tolerance limits set by the corresponding vali-
dation concepts were exceeded, as a result of which adjustments
are recommended. In the PD area, several conservative results
were found in the financial institutions and RS-CFD areas for
which with the excemption of RS-CFD no specific adjustments
were recommended, but these were made transparent in the rele-
vant bodies. There was a significant need for adjustment from the
current validations in the LGD parameters for private clients,
commercial real estate finance and a partial portfolio of corporate
clients. The validations of the EaD models did not reveal any sig-
nificant need for adjustments.

Introduction Equity capital Risk-oriented overall bank management Specific risk management Appendix 31
A. Credit risk (CR)
VAL2: Validation results per calibration segment (validation based on data basis 2020) PD LGD EaD
Validation Number EaD in % Number EaD in % Number EaD in %
Adequate 44 99 291 87 27 98
Too conservative - adjustment recommended 1 1 7 9 4 1
Too progressive - adjustment recommended 0 0 12 4 1 1
Total 45 100 310 100 32 100
An overview of the PD validation results as at 31 December 2019
for the relevant rating systems by IRBA asset class is provided in
table EU CR9. The default observation therefore extends over
2020, which, as mentioned above, includes a modified default def-
inition which was set to be productive as of 18 November 2019.
The rating procedures used, on the other hand, were still de-
veloped on the old default definition. Studies on the new default
definitions showed that the effects are minimal compared to the
previous one, which justifies a non-consideration of these in the
historical default rates in Table EU CR9 before implementation.
Nevertheless, the new failure definition is considered in the ongo-
ing IRBA revision of the core processes.
In general, it can be said that the default rates of the Commerz-
bank Group (excluding mBank) are almost all below the intended
PD bands. This is due to the sustained positive economic climate
in Germany, with historically low default rates in the high-default-
rating methods. However, over the last few years there has been a
slight increase in default rates. So far there are no significant ef-
fects of the Corona pandemic.
The calibration method for shadow rating procedures and ex-
pert-based rating processes has also had an effect. Here the target
criterion is the external rating and/or expert assessments, which in
some cases substantially exceed the historical default rates in
these low-default portfolios. In the case of external ratings, the
rating agencies use default rates over many years. Accordingly, in
all asset classes with a significant contribution from low-default
rating procedures such as those found in table VAL-A, the internal
classification is a conservative one.
Around 90% of the Commerzbank Group’s total IRBA RWA are
accounted for by the rating procedures in table VAL1. The re-
mainder largely result from retail and corporate rating methods
run independently by mBank, whose results can be found in the
disclosure report of mBank on the bank’s English-language
homepage (at About us Capital Adequacy Information Policy).

32 Commerzbank Disclosure Report 2020
EU CR9: IRB approach – Backtesting of PD per exposure class a b c d e f g h i
PD range External rating
equivalent
Weighted average PD
%
Arithmetic average PD by obligors
%
Number of obligors Defaulted obligors in
the year
Of which new
obligors
Average historical
annual default rate
%
End of previous
year
End of the year
Cen
tral
gov
ern
men
ts o
r ce
ntr
al b
anks
0.00 to < 0.15 AAA to A- 0.11 0.05 101 30 0 0 0.00
0.15 to < 0.25 BBB+,BBB 0.15 0.17 2 5 0 0 0.00
0.25 to < 0.50 BBB- 0.27 0.33 12 7 0 0 0.00
0.50 to < 0.75 BB+ 0.72 0.58 6 3 0 0 0.00
0.75 to < 2.50 BB,BB- 1.41 1.31 6 11 0 0 0.00
2.50 to 10.00 B+ to B- 4.50 5.08 20 20 0 0 2.49
10.00 to < 100.00 CCC+ to C 21.94 21.57 11 12 1 0 2.74
Subtotal 0.20 2.54 158 88 1 0 0.71
Inst
itu
tion
s
0.00 to < 0.15 AAA to A- 0.07 0.07 573 502 0 0 0.00
0.15 to < 0.25 BBB+,BBB 0.19 0.19 169 126 0 0 0.00
0.25 to < 0.50 BBB- 0.38 0.35 268 282 0 0 0.00
0.50 to < 0.75 BB+ 0.56 0.61 121 106 1 0 0.29
0.75 to < 2.50 BB,BB- 1.22 1.46 325 285 0 0 0.32
2.50 to 10.00 B+ to B- 5.09 4.48 267 292 1 0 0.57
10.00 to < 100.00 CCC+ to C 26.62 29.44 44 66 0 0 1.87
Subtotal 0.76 2.21 1,767 1,659 2 0 0.27
Cor
por
ates
T
OT
AL
0.00 to < 0.15 AAA to A- 0.06 0.08 4,129 4,032 5 0 0.15
0.15 to < 0.25 BBB+,BBB 0.20 0.20 3,818 3,698 10 0 0.17
0.25 to < 0.50 BBB- 0.34 0.35 5,109 4,753 19 2 0.27
0.50 to < 0.75 BB+ 0.59 0.61 2,608 2,590 18 0 0.57
0.75 to < 2.50 BB,BB- 1.36 1.36 4,494 4,351 60 3 1.18
2.50 to 10.00 B+ to B- 4.57 4.77 1,706 1,516 123 4 4.87
10.00 to < 100.00 CCC+ to C 44.37 34.17 416 368 58 1 16.43
Subtotal 1.18 1.45 22,280 21,308 293 10 1.22
Cor
por
ates
, th
ereo
f S
ME
s
0.00 to < 0.15 AAA to A- 0.08 0.09 352 433 1 0 0.08
0.15 to < 0.25 BBB+,BBB 0.19 0.20 410 440 0 0 0.16
0.25 to < 0.50 BBB- 0.34 0.35 639 575 1 0 0.30
0.50 to < 0.75 BB+ 0.60 0.61 314 275 1 0 0.57
0.75 to < 2.50 BB to B+ 1.36 1.34 758 663 14 0 1.27
2.50 to 10.00 B+ to B- 5.22 5.00 491 395 34 0 5.19
10.00 to < 100.00 CCC+ to C 24.55 21.42 111 67 27 0 21.78
Subtotal 2.13 2.09 3,075 2,848 78 0 1.84
Cor
por
ates
, th
ereo
f
spec
iali
sed
len
din
g
0.00 to < 0.15 AAA to A- 0.03 0.03 488 552 0 0 0.43
0.15 to < 0.25 BBB+,BBB 0.22 0.22 135 139 0 0 0.42
0.25 to < 0.50 BBB- 0.33 0.35 356 345 1 0 0.95
0.50 to < 0.75 BB+ 0.60 0.62 248 205 0 0 1.15
0.75 to < 2.50 BB,BB- 1.16 1.31 239 239 6 0 1.85
2.50 to 10.00 B+ to B- 3.86 4.50 146 121 11 0 6.36
10.00 to < 100.00 CCC+ to C 66.19 71.13 118 114 3 0 15.24
Subtotal 2.46 5.08 1,730 1,715 21 0 3.17
Cor
por
ates
, th
ereo
f
oth
er
0.00 to < 0.15 AAA to A- 0.09 0.09 3,421 3,201 4 0 0.11
0.15 to < 0.25 BBB+,BBB 0.20 0.20 3,297 3,136 10 0 0.16
0.25 to < 0.50 BBB- 0.34 0.35 4,178 3,884 17 2 0.23
0.50 to < 0.75 BB+ 0.59 0.60 2,078 2,124 17 0 0.52
0.75 to < 2.50 BB,BB- 1.40 1.36 3,532 3,478 40 3 1.18
2.50 to 10.00 B+ to B- 4.72 4.72 1,089 1,010 78 4 4.53
10.00 to < 100.00 CCC+ to C 18.02 22.82 205 201 28 1 12.73
Subtotal 0.67 1.04 17,800 17,034 194 10 0.90

Introduction Equity capital Risk-oriented overall bank management Specific risk management Appendix 33
A. Credit risk (CR)
EU CR9_cont.: IRB approach – Backtesting of PD per exposure class
a b c d e f g h i
PD range External rating
equivalent
Weighted average PD
%
Atrithmetic average PD by
obligors
%
Number of obligors Defaulted obligors in
the year
Of which new
obligors
Average historical
annual default rate
%
End of previous
year
End of the year
Ret
ail
T
OT
AL
0.00 to < 0.15 AAA to A- 0.05 0.04 1,777,689 1,875,618 1,162 8 0.03
0.15 to < 0.25 BBB+,BBB 0.20 0.19 252,029 260,239 504 10 0.13
0.25 to < 0.50 BBB- 0.36 0.36 276,979 273,823 1,007 14 0.24
0.50 to < 0.75 BB+ 0.60 0.62 125,568 116,048 792 13 0.41
0.75 to < 2.50 BB,BB- 1.26 1.35 289,858 238,851 3,548 94 0.91
2.50 to 10.00 B+ to B- 4.74 5.15 123,157 94,913 6,271 282 3.62
10.00 to < 100.00 CCC+ to C 21.38 20.53 69,003 51,958 10,203 1,242 12.62
Subtotal 0.60 0.94 2,914,283 2,911,450 23,487 1,663 0.60
...
ther
eof
secu
red
by
mor
tgag
es /
SM
Es
0.00 to < 0.15 AAA to A- 0.10 0.10 169 26,533 0 0 0.01
0.15 to < 0.25 BBB+,BBB 0.20 0.20 209 10,442 0 0 0.09
0.25 to < 0.50 BBB- 0.35 0.36 374 13,439 0 0 0.11
0.50 to < 0.75 BB+ 0.61 0.60 111 5,109 0 0 0.40
0.75 to < 2.50 BB,BB- 1.31 1.13 205 5,412 2 0 0.35
2.50 to 10.00 B+ to B- 4.40 4.87 73 1,277 5 0 3.22
10.00 to < 100.00 CCC+ to C 21.18 24.17 22 465 2 1 10.67
Subtotal 1.00 1.17 1,163 62,677 9 1 0.55
...
ther
eof
secu
red
by
mor
tgag
es /
non
-SM
Es 0.00 to < 0.15 AAA to A- 0.05 0.06 231,991 222,434 182 1 0.06
0.15 to < 0.25 BBB+,BBB 0.20 0.20 109,616 106,744 128 2 0.11
0.25 to < 0.50 BBB- 0.36 0.35 99,002 89,078 196 1 0.15
0.50 to < 0.75 BB+ 0.60 0.60 27,894 22,177 134 0 0.28
0.75 to < 2.50 BB,BB- 1.21 1.23 24,088 16,550 275 2 0.69
2.50 to 10.00 B+ to B- 4.80 4.94 8,392 4,910 389 3 3.05
10.00 to < 100.00 CCC+ to C 20.80 20.78 4,017 2,347 821 7 14.63
Subtotal 0.48 0.47 505,000 464,240 2,125 16 0.39
...
ther
eof
qu
alif
yin
g
revo
lvin
g
0.00 to < 0.15 AAA to A- 0.03 0.04 1,493,273 1,568,078 866 4 0.03
0.15 to < 0.25 BBB+,BBB 0.19 0.19 106,538 103,642 276 1 0.14
0.25 to < 0.50 BBB- 0.36 0.36 122,590 112,404 541 3 0.26
0.50 to < 0.75 BB+ 0.62 0.62 64,322 57,039 437 2 0.42
0.75 to < 2.50 BB to B+ 1.39 1.39 150,713 122,167 1,927 28 0.87
2.50 to 10.00 B+ to B- 4.63 4.74 65,835 49,612 3,405 119 3.45
10.00 to < 100.00 CCC+ to C 19.53 17.44 26,011 18,712 3,366 244 12.64
Subtotal 0.35 0.58 2,029,282 2,031,654 10,818 401 0.35
...
ther
eof
oth
er /
SM
Es 0.00 to < 0.15 AAA to A- 0.10 0.11 4,946 107,817 11 0 0.13
0.15 to < 0.25 BBB+,BBB 0.20 0.20 10,498 29,271 33 1 0.16
0.25 to < 0.50 BBB- 0.36 0.35 18,668 39,542 79 2 0.28
0.50 to < 0.75 BB+ 0.62 0.62 5,752 14,320 38 0 0.49
0.75 to < 2.50 BB,BB- 1.23 1.27 12,330 35,339 213 7 1.11
2.50 to 10.00 B+ to B- 4.93 5.61 8,781 17,538 382 33 3.20
10.00 to < 100.00 CCC+ to C 19.62 19.44 2,867 6,145 376 107 9.25
Subtotal 1.70 2.08 63,842 249,972 1,132 150 1.40
...
ther
eof
oth
er /
non
-S
ME
s
0.00 to < 0.15 AAA to A- 0.06 0.05 216,131 122,742 303 4 0.06
0.15 to < 0.25 BBB+,BBB 0.20 0.20 47,331 31,422 131 6 0.16
0.25 to < 0.50 BBB- 0.36 0.36 62,704 43,631 312 8 0.30
0.50 to < 0.75 BB+ 0.60 0.63 37,379 25,903 266 9 0.48
0.75 to < 2.50 BB,BB- 1.31 1.34 115,313 69,745 1,365 50 1.06
2.50 to 10.00 B+ to B- 4.51 5.77 45,148 25,377 2,392 110 4.20
10.00 to < 100.00 CCC+ to C 24.55 22.84 38,444 25,985 6,300 844 13.47
Subtotal 0.83 2.65 562,450 344,805 11,069 1,031 1.42
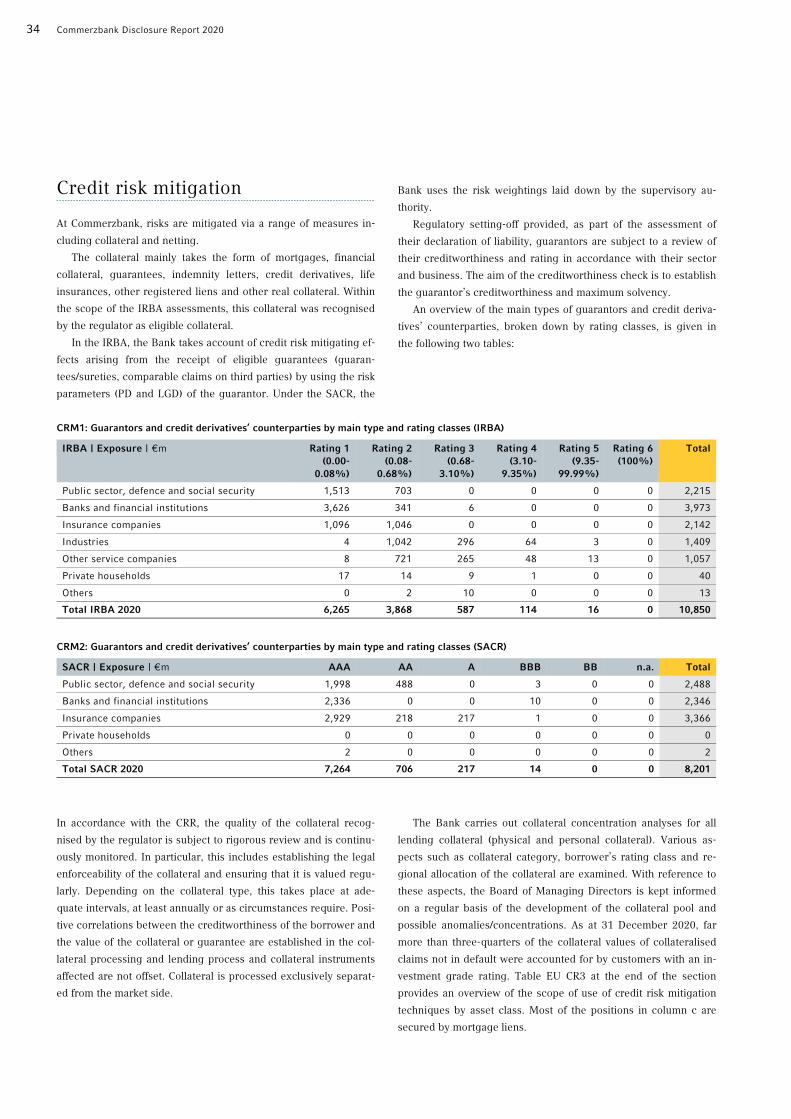
34 Commerzbank Disclosure Report 2020
Credit risk mitigation
At Commerzbank, risks are mitigated via a range of measures in-
cluding collateral and netting.
The collateral mainly takes the form of mortgages, financial
collateral, guarantees, indemnity letters, credit derivatives, life
insurances, other registered liens and other real collateral. Within
the scope of the IRBA assessments, this collateral was recognised
by the regulator as eligible collateral.
In the IRBA, the Bank takes account of credit risk mitigating ef-
fects arising from the receipt of eligible guarantees (guaran-
tees/sureties, comparable claims on third parties) by using the risk
parameters (PD and LGD) of the guarantor. Under the SACR, the
Bank uses the risk weightings laid down by the supervisory au-
thority.
Regulatory setting-off provided, as part of the assessment of
their declaration of liability, guarantors are subject to a review of
their creditworthiness and rating in accordance with their sector
and business. The aim of the creditworthiness check is to establish
the guarantor’s creditworthiness and maximum solvency.
An overview of the main types of guarantors and credit deriva-
tives’ counterparties, broken down by rating classes, is given in
the following two tables:
CRM1: Guarantors and credit derivatives’ counterparties by main type and rating classes (IRBA) IRBA | Exposure | €m Rating 1
(0.00-0.08%)
Rating 2 (0.08-
0.68%)
Rating 3 (0.68-
3.10%)
Rating 4 (3.10-
9.35%)
Rating 5 (9.35-
99.99%)
Rating 6 (100%)
Total
Public sector, defence and social security 1,513 703 0 0 0 0 2,215
Banks and financial institutions 3,626 341 6 0 0 0 3,973
Insurance companies 1,096 1,046 0 0 0 0 2,142
Industries 4 1,042 296 64 3 0 1,409
Other service companies 8 721 265 48 13 0 1,057
Private households 17 14 9 1 0 0 40
Others 0 2 10 0 0 0 13
Total IRBA 2020 6,265 3,868 587 114 16 0 10,850
CRM2: Guarantors and credit derivatives’ counterparties by main type and rating classes (SACR) SACR | Exposure | €m AAA AA A BBB BB n.a. Total
Public sector, defence and social security 1,998 488 0 3 0 0 2,488
Banks and financial institutions 2,336 0 0 10 0 0 2,346
Insurance companies 2,929 218 217 1 0 0 3,366
Private households 0 0 0 0 0 0 0
Others 2 0 0 0 0 0 2
Total SACR 2020 7,264 706 217 14 0 0 8,201
In accordance with the CRR, the quality of the collateral recog-
nised by the regulator is subject to rigorous review and is continu-
ously monitored. In particular, this includes establishing the legal
enforceability of the collateral and ensuring that it is valued regu-
larly. Depending on the collateral type, this takes place at ade-
quate intervals, at least annually or as circumstances require. Posi-
tive correlations between the creditworthiness of the borrower and
the value of the collateral or guarantee are established in the col-
lateral processing and lending process and collateral instruments
affected are not offset. Collateral is processed exclusively separat-
ed from the market side.
The Bank carries out collateral concentration analyses for all
lending collateral (physical and personal collateral). Various as-
pects such as collateral category, borrower’s rating class and re-
gional allocation of the collateral are examined. With reference to
these aspects, the Board of Managing Directors is kept informed
on a regular basis of the development of the collateral pool and
possible anomalies/concentrations. As at 31 December 2020, far
more than three-quarters of the collateral values of collateralised
claims not in default were accounted for by customers with an in-
vestment grade rating. Table EU CR3 at the end of the section
provides an overview of the scope of use of credit risk mitigation
techniques by asset class. Most of the positions in column c are
secured by mortgage liens.

Introduction Equity capital Risk-oriented overall bank management Specific risk management Appendix 35
A. Credit risk (CR)
The valuation and processing of collateral are governed by uni-
versally applicable standards and collateral-specific instructions
(guidelines, descriptions of processes, IT instructions). Collateral
agreements are legally validated; as far as possible, standard con-
tracts and samples are used. The standards established to hedge
against or mitigate the risks of loans, which also take account of
the regulatory requirements of CRR, include, amongst others:
Legal and operational standards for documentation and data
collection as well as valuation standards.
The standardisation and updating of collateral valuations are
ensured by laying down valuation processes, prescribing
standardised valuation methods, parameters and defined dis-
counts for collateral, clearly defining responsibilities for the
processing and valuation process, and stipulating requirements
for revaluations at regular intervals.
Other standards for taking account of specific risks, e.g. opera-
tional risks, correlation and concentration risks, market price
change risks (e.g. due to currency fluctuations), country risks,
legal risks or risks of changes in the law, and risks of insuffi-
cient insurance cover.
For the vast majority of its default risk positions from counter-
party credit risk, Commerzbank Group uses the internal model
method (IMM) according to Article 283 CRR. The credit equivalent
amounts are determined as expected future exposure through the
simulation of various market scenarios, taking netting and collat-
eral into account.
Also for securities repurchase, lending and comparable transac-
tions involving securities or goods, the exposures are determined
in accordance with Article 283 and Article 273 (2) CRR on the basis
of an internal model method. Guarantees and credit derivatives are
considered via the substitution approach. The double-default pro-
cedure defined under Article 153 (3) CRR is applied.
Details on the use of credit risk mitigation techniques in default
risks from counterparty credit risk are set out in the section on
counterparty credit risk.
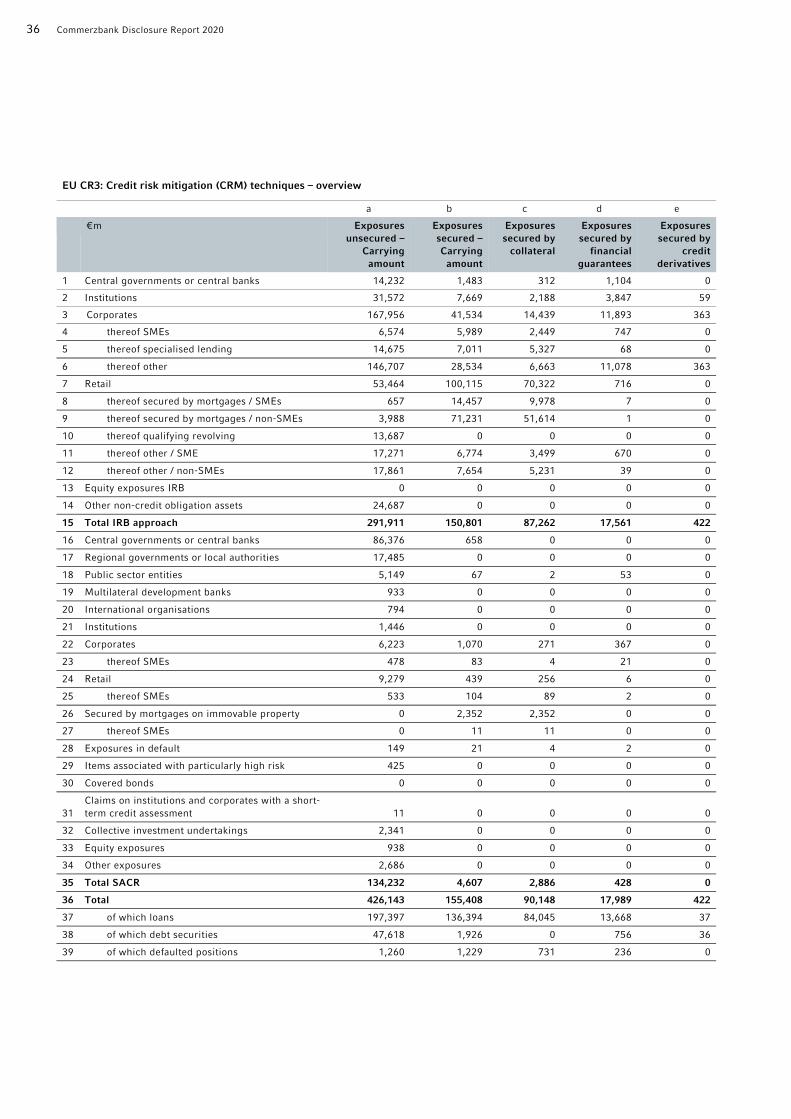
36 Commerzbank Disclosure Report 2020
EU CR3: Credit risk mitigation (CRM) techniques – overview a b c d e
€m Exposures unsecured –
Carrying amount
Exposures secured – Carrying
amount
Exposures secured by
collateral
Exposures secured by
financial guarantees
Exposures secured by
credit derivatives
1 Central governments or central banks 14,232 1,483 312 1,104 0
2 Institutions 31,572 7,669 2,188 3,847 59
3 Corporates 167,956 41,534 14,439 11,893 363
4 thereof SMEs 6,574 5,989 2,449 747 0
5 thereof specialised lending 14,675 7,011 5,327 68 0
6 thereof other 146,707 28,534 6,663 11,078 363
7 Retail 53,464 100,115 70,322 716 0
8 thereof secured by mortgages / SMEs 657 14,457 9,978 7 0
9 thereof secured by mortgages / non-SMEs 3,988 71,231 51,614 1 0
10 thereof qualifying revolving 13,687 0 0 0 0
11 thereof other / SME 17,271 6,774 3,499 670 0
12 thereof other / non-SMEs 17,861 7,654 5,231 39 0
13 Equity exposures IRB 0 0 0 0 0
14 Other non-credit obligation assets 24,687 0 0 0 0
15 Total IRB approach 291,911 150,801 87,262 17,561 422
16 Central governments or central banks 86,376 658 0 0 0
17 Regional governments or local authorities 17,485 0 0 0 0
18 Public sector entities 5,149 67 2 53 0
19 Multilateral development banks 933 0 0 0 0
20 International organisations 794 0 0 0 0
21 Institutions 1,446 0 0 0 0
22 Corporates 6,223 1,070 271 367 0
23 thereof SMEs 478 83 4 21 0
24 Retail 9,279 439 256 6 0
25 thereof SMEs 533 104 89 2 0
26 Secured by mortgages on immovable property 0 2,352 2,352 0 0
27 thereof SMEs 0 11 11 0 0
28 Exposures in default 149 21 4 2 0
29 Items associated with particularly high risk 425 0 0 0 0
30 Covered bonds 0 0 0 0 0
31 Claims on institutions and corporates with a short-term credit assessment 11 0 0 0 0
32 Collective investment undertakings 2,341 0 0 0 0
33 Equity exposures 938 0 0 0 0
34 Other exposures 2,686 0 0 0 0
35 Total SACR 134,232 4,607 2,886 428 0
36 Total 426,143 155,408 90,148 17,989 422
37 of which loans 197,397 136,394 84,045 13,668 37
38 of which debt securities 47,618 1,926 0 756 36
39 of which defaulted positions 1,260 1,229 731 236 0

Introduction Equity capital Risk-oriented overall bank management Specific risk management Appendix 37
A. Credit risk (CR)
Credit risk and credit risk mitigation in the IRBA
The credit risk of the Commerzbank Group’s IRBA portfolio divid-
ed into the relevant IRBA asset classes and PD ranges is shown
below. The information in table EU CR6 on on-balance-sheet gross
receivables refers to the risk exposure values to be determined
according to Article 166 CRR. These represent the expected
amounts of the IRBA positions that will be exposed to a risk of loss.
The off-balance-sheet claims are shown before taking into account
credit risk adjustments and conversion factors. Exposure at default
(regulatory EaD) shows the exposure values after taking into ac-
count credit risk mitigation. The risk parameters CCF, PD and LGD
are calculated as EaD-weighted averages. The IRBA default defini-
tion is also used for internal purposes.
The companies in the Commerzbank Group use the IRBA ap-
proach. They may therefore use internal estimates of credit con-
version factors (CCFs) for regulatory purposes, too. CCFs are nec-
essary for off-balance-sheet transactions in order to assess the
likely exposure in the event of a possible default on commitments
that have not yet been drawn.
Tables EU CR6 and EU CR7 show only portfolios which fall
within the scope of IRBA and are rated with a rating process that
has been approved by the supervisory authority. Positions in the
risk exposure class other non-loan-related assets are not listed in
table EU CR6. These assets amounting to €7.5bn do not have any
creditworthiness risks and are therefore not relevant for the man-
agement of default risks. Table EU CR6 also does not include
mBank S.A. positions of €2.1bn which are subject to the IRBA slot-
ting approach in accordance with Article 153 (5) CRR and are
shown in table EU CR10. Investment positions with a fixed risk
weighting according to Article 155 (2) CRR are not relevant in the
Commerzbank Group as at 31 December 2020 and are therefore
not part of table EU CR10. Appendix 5 contains an overview of the
exposure-weighted averages of the credit risk parameters PD and
LGD by asset class and relevant geographical location (countries
in which Commerzbank has been authorised or has a branch or a
subsidiary) according to Article 452 (j) i) CRR.
The securitisation exposures in the IRBA are presented separately
in the section on securitisations in this report. Counterparty de-
fault risks are shown in the section on default risks from counter-
party credit risks in this report.
The risk exposure values shown in this section generally differ
from the EaD values in the Annual Report (economic EaD) due to
the following:
As required by EBA guideline EBA/GL/2016/11 on disclosure
requirements, credit risk and counterparty credit risk are pre-
sented separately in the Disclosure Report.
Some transactions are not included in risk-weighted assets
(RWA) for regulatory purposes but are included in the EaD of
the Annual Report and Risk Report respectively.
The figures shown in this Disclosure Report refer to the regula-
tory scope of consolidation. By contrast, the figures in the An-
nual Report refer to the IFRS scope of consolidation.
The amount of the exposures secured by collateral, financial guar-
antees or credit derivatives and the amount of unsecured expo-
sures by asset class is shown in table EU CR3 in the preceding
section on credit risk mitigation. In addition to the collateral in the
standardised approach to credit risk (hereinafter referred to as
SACR), under the IRBA some physical and other collateral which is
only eligible for recognition under the IRBA is also offset.
The calculation of collateral is based on market values
weighted with recovery rates. These recovery rates are based on
empirical data and form part of the LGD models. By definition, the
rates cannot exceed 100%; therefore, the collateral values are
normally lower than the market values. By contrast, under the
IRBA the substitution approach is used to offset guarantees and
credit derivatives. The protection therefore does not take effect in
the LGD, as is the case with financial and other IRBA collateral,
but via the substitution of the debtor’s risk parameters with those
of the guarantor. Alternatively, the double-default procedure may
be used in the IRBA.
The impact of credit derivatives used as credit risk mitigation
techniques on the amount of RWA of credit risk in the IRBA port-
folio at 31 December 2020 comes to about 0.3% (see the next ta-
ble EU CR7).
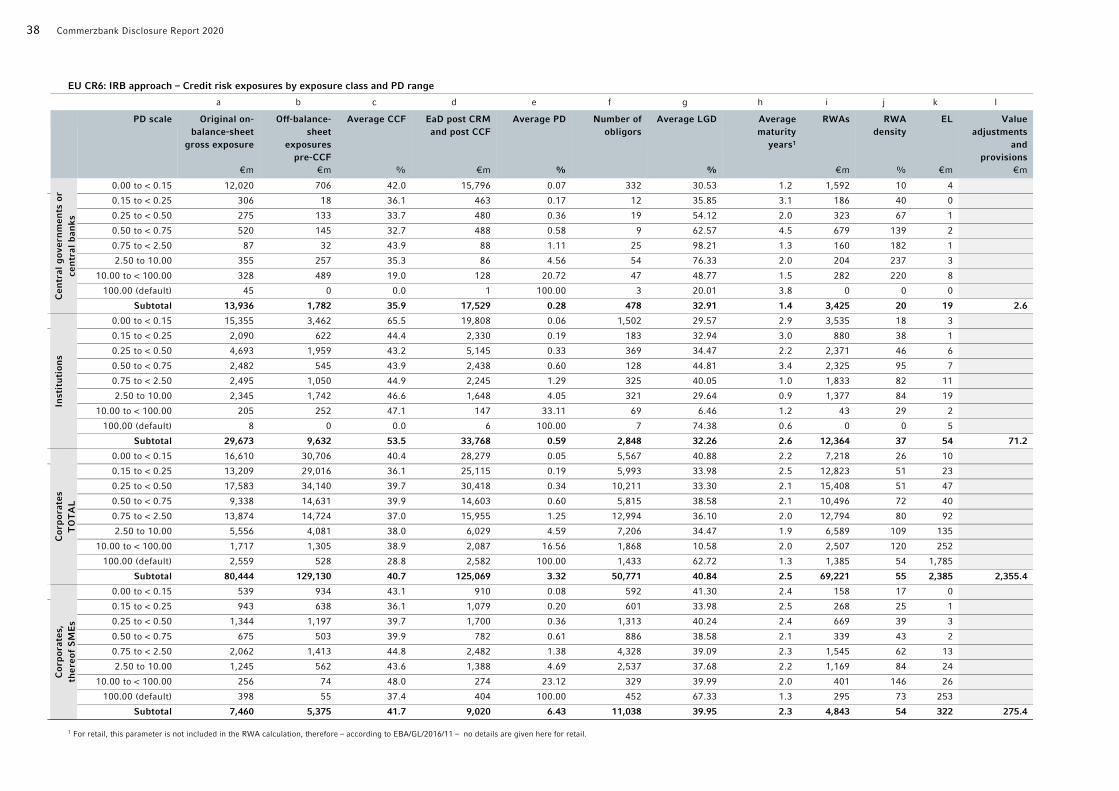
38 Commerzbank Disclosure Report 2020
EU CR6: IRB approach – Credit risk exposures by exposure class and PD range a b c d e f g h i j k l
PD scale Original on-balance-sheet
gross exposure
€m
Off-balance-sheet
exposures pre-CCF
€m
Average CCF
%
EaD post CRM and post CCF
€m
Average PD
%
Number of obligors
Average LGD
%
Average maturity
years1
RWAs
€m
RWA density
%
EL
€m
Value adjustments
and provisions
€m
Cen
tral
gov
ern
men
ts o
r ce
ntr
al b
anks
0.00 to < 0.15 12,020 706 42.0 15,796 0.07 332 30.53 1.2 1,592 10 4
0.15 to < 0.25 306 18 36.1 463 0.17 12 35.85 3.1 186 40 0
0.25 to < 0.50 275 133 33.7 480 0.36 19 54.12 2.0 323 67 1
0.50 to < 0.75 520 145 32.7 488 0.58 9 62.57 4.5 679 139 2
0.75 to < 2.50 87 32 43.9 88 1.11 25 98.21 1.3 160 182 1
2.50 to 10.00 355 257 35.3 86 4.56 54 76.33 2.0 204 237 3
10.00 to < 100.00 328 489 19.0 128 20.72 47 48.77 1.5 282 220 8
100.00 (default) 45 0 0.0 1 100.00 3 20.01 3.8 0 0 0
Subtotal 13,936 1,782 35.9 17,529 0.28 478 32.91 1.4 3,425 20 19 2.6
Inst
itu
tion
s
0.00 to < 0.15 15,355 3,462 65.5 19,808 0.06 1,502 29.57 2.9 3,535 18 3
0.15 to < 0.25 2,090 622 44.4 2,330 0.19 183 32.94 3.0 880 38 1
0.25 to < 0.50 4,693 1,959 43.2 5,145 0.33 369 34.47 2.2 2,371 46 6
0.50 to < 0.75 2,482 545 43.9 2,438 0.60 128 44.81 3.4 2,325 95 7
0.75 to < 2.50 2,495 1,050 44.9 2,245 1.29 325 40.05 1.0 1,833 82 11
2.50 to 10.00 2,345 1,742 46.6 1,648 4.05 321 29.64 0.9 1,377 84 19
10.00 to < 100.00 205 252 47.1 147 33.11 69 6.46 1.2 43 29 2
100.00 (default) 8 0 0.0 6 100.00 7 74.38 0.6 0 0 5
Subtotal 29,673 9,632 53.5 33,768 0.59 2,848 32.26 2.6 12,364 37 54 71.2
Cor
por
ates
T
OT
AL
0.00 to < 0.15 16,610 30,706 40.4 28,279 0.05 5,567 40.88 2.2 7,218 26 10
0.15 to < 0.25 13,209 29,016 36.1 25,115 0.19 5,993 33.98 2.5 12,823 51 23
0.25 to < 0.50 17,583 34,140 39.7 30,418 0.34 10,211 33.30 2.1 15,408 51 47
0.50 to < 0.75 9,338 14,631 39.9 14,603 0.60 5,815 38.58 2.1 10,496 72 40
0.75 to < 2.50 13,874 14,724 37.0 15,955 1.25 12,994 36.10 2.0 12,794 80 92
2.50 to 10.00 5,556 4,081 38.0 6,029 4.59 7,206 34.47 1.9 6,589 109 135
10.00 to < 100.00 1,717 1,305 38.9 2,087 16.56 1,868 10.58 2.0 2,507 120 252
100.00 (default) 2,559 528 28.8 2,582 100.00 1,433 62.72 1.3 1,385 54 1,785
Subtotal 80,444 129,130 40.7 125,069 3.32 50,771 40.84 2.5 69,221 55 2,385 2,355.4
Cor
por
ates
, th
ereo
f S
ME
s
0.00 to < 0.15 539 934 43.1 910 0.08 592 41.30 2.4 158 17 0
0.15 to < 0.25 943 638 36.1 1,079 0.20 601 33.98 2.5 268 25 1
0.25 to < 0.50 1,344 1,197 39.7 1,700 0.36 1,313 40.24 2.4 669 39 3
0.50 to < 0.75 675 503 39.9 782 0.61 886 38.58 2.1 339 43 2
0.75 to < 2.50 2,062 1,413 44.8 2,482 1.38 4,328 39.09 2.3 1,545 62 13
2.50 to 10.00 1,245 562 43.6 1,388 4.69 2,537 37.68 2.2 1,169 84 24
10.00 to < 100.00 256 74 48.0 274 23.12 329 39.99 2.0 401 146 26
100.00 (default) 398 55 37.4 404 100.00 452 67.33 1.3 295 73 253
Subtotal 7,460 5,375 41.7 9,020 6.43 11,038 39.95 2.3 4,843 54 322 275.4
1 For retail, this parameter is not included in the RWA calculation, therefore – according to EBA/GL/2016/11 – no details are given here for retail.

Introduction Equity capital Risk-oriented overall bank management Specific risk management Appendix 39
A. Credit risk (CR)
EU CR6_cont.: IRB approach – Credit risk exposures by exposure class and PD range a b c d e f g h i j k l
PD scale Original on-balance-sheet
gross exposure
€m
Off-balance-sheet
exposures pre-CCF
€m
Average CCF
%
EaD post CRM and post CCF
€m
Average PD
%
Number of obligors
Average LGD
%
Average maturity
years1
RWAs
€m
RWA density
%
EL
€m
Value adjustments
and provisions
€m
Cor
por
ates
, th
ereo
f
spec
iali
sed
len
din
g
0.00 to < 0.15 6,857 810 46.3 7,231 0.05 553 41.62 4.2 1,631 23 1
0.15 to < 0.25 1,397 382 44.3 1,559 0.22 139 36.94 3.4 528 34 1
0.25 to < 0.50 2,937 600 54.0 3,253 0.34 345 33.30 3.7 1,325 41 4
0.50 to < 0.75 1,411 329 66.7 1,614 0.60 205 39.09 3.8 1,006 62 4
0.75 to < 2.50 1,632 358 62.1 1,826 1.27 240 40.82 3.9 1,602 88 9
2.50 to 10.00 693 306 57.6 862 5.01 126 35.81 3.1 868 101 14
10.00 to < 100.00 656 766 41.4 973 63.52 115 10.58 2.8 435 45 46
100.00 (default) 619 6 45.7 622 100.00 47 80.62 2.6 148 24 490
Subtotal 16,201 3,557 50.8 17,941 7.43 1,707 38.78 3.8 7,543 42 569 338.3
Cor
por
ates
, th
ereo
f
oth
er
0.00 to < 0.15 9,214 28,963 40.4 20,137 0.10 4,432 40.88 2.2 5,430 27 9
0.15 to < 0.25 10,870 27,996 41.3 22,477 0.19 5,255 46.60 2.7 12,027 54 21
0.25 to < 0.50 13,302 32,343 40.8 25,465 0.35 8,569 39.04 2.1 13,414 53 41
0.50 to < 0.75 7,252 13,799 40.6 12,207 0.60 4,727 41.44 2.2 9,151 75 34
0.75 to < 2.50 10,180 12,953 37.0 11,646 1.25 8,429 36.10 2.0 9,648 83 70
2.50 to 10.00 3,618 3,213 38.0 3,780 4.59 4,546 34.47 1.9 4,551 120 97
10.00 to < 100.00 805 465 38.9 840 16.56 1,428 39.06 2.0 1,672 199 180
100.00 (default) 1,542 467 28.8 1,557 100.00 934 62.72 1.3 942 61 1,042
Subtotal 56,783 120,198 40.3 98,109 2.28 38,108 41.30 2.2 56,835 58 1,493 1,741.8
Ret
ail
0.00 to < 0.15 49,161 17,983 75.1 63,393 0.04 1,993,886 16.28 2,099 3 10
0.15 to < 0.25 17,616 3,997 58.9 20,498 0.19 398,941 16.82 1,907 9 10
0.25 to < 0.50 24,120 7,258 57.3 29,265 0.35 464,941 17.20 4,567 16 30
0.50 to < 0.75 9,525 3,370 58.9 12,122 0.60 213,235 18.01 2,993 25 24
0.75 to < 2.50 10,729 3,362 62.0 13,013 1.19 548,119 19.36 4,790 37 65
2.50 to 10.00 4,100 703 57.8 4,530 4.39 341,728 18.53 2,651 59 88
10.00 to < 100.00 1,179 77 57.8 1,221 20.13 96,480 18.95 1,143 94 107
100.00 (default) 1,284 39 38.6 1,283 100.00 86,356 30.40 989 77 664
Subtotal 117,714 36,790 76.7 145,325 1.50 4,134,582 28.64 21,140 15 998 924.7
Tot
al
0.00 to < 0.15 93,145 52,858 40.4 127,276 0.04 2,185,444 16.28 0.0 14,445 11 27
0.15 to < 0.25 33,222 33,654 36.1 48,406 0.17 430,558 16.82 0.0 15,795 33 35
0.25 to < 0.50 46,670 43,490 33.7 65,308 0.33 504,735 17.20 0.0 22,668 35 84
0.50 to < 0.75 21,865 18,692 32.7 29,651 0.58 229,770 18.01 0.0 16,493 56 72
0.75 to < 2.50 27,185 19,168 37.0 31,301 1.11 574,658 19.36 0.0 19,577 63 170
2.50 to 10.00 12,355 6,783 35.3 12,294 4.05 354,149 18.53 0.9 10,821 88 245
10.00 to < 100.00 3,428 2,123 19.0 3,584 16.56 101,084 6.46 1.2 3,976 111 369
100.00 (default) 3,895 567 28.8 3,872 100.00 90,280 20.01 0.6 2,375 61 2,454
Total (all portfolios) 241,766 177,334 48.8 321,691 2.04 4,187,161 34.00 1.3 106,150 33 3,455 3,353.9
1 For retail, this parameter is not included in the RWA calculation, therefore – according to EBA/GL/2016/11 – no details are given here for retail.

40 Commerzbank Disclosure Report 2020
EU CR6_Retail: IRB approach – Retail’s Credit risk exposures by exposure class and PD range a b c d e f g h i j k l
PD scale Original on-balance-sheet
gross exposure
€m
Off-balance-sheet
exposures pre-CCF
€m
Average CCF
%
EaD post CRM and post CCF
€m
Average PD
%
Number of obligors
Average LGD
%
Average maturity
years1
RWAs
€m
RWA density
%
EL
€m
Value adjustments
and provisions
€m
Ret
ail
0.00 to < 0.15 49,161 17,983 75.1 63,393 0.04 1,993,886 16.28 2,099 3 10
0.15 to < 0.25 17,616 3,997 58.9 20,498 0.19 398,941 16.82 1,907 9 10
0.25 to < 0.50 24,120 7,258 57.3 29,265 0.35 464,941 17.20 4,567 16 30
0.50 to < 0.75 9,525 3,370 58.9 12,122 0.60 213,235 18.01 2,993 25 24
0.75 to < 2.50 10,729 3,362 62.0 13,013 1.19 548,119 19.36 4,790 37 65
2.50 to 10.00 4,100 703 57.8 4,530 4.39 341,728 18.53 2,651 59 88
10.00 to < 100.00 1,179 77 57.8 1,221 20.13 96,480 18.95 1,143 94 107
100.00 (default) 1,284 39 38.6 1,283 100.00 86,356 30.40 989 77 664
Gesamt 117,714 36,790 76.7 145,325 1.50 4,134,582 28.64 21,140 15 998 924.7
...s
ecu
red
by
mor
tgag
es /
S
ME
s
0.00 to < 0.15 6,221 150 99.6 6,369 0.07 26,374 16.28 146 2 1
0.15 to < 0.25 1,891 42 96.8 1,932 0.20 10,711 17.63 109 6 1
0.25 to < 0.50 2,918 84 99.6 3,001 0.36 14,942 17.20 258 9 2
0.50 to < 0.75 1,465 69 102.8 1,536 0.61 6,614 18.01 199 13 2
0.75 to < 2.50 1,662 79 114.9 1,748 1.26 7,327 19.36 394 23 4
2.50 to 10.00 354 13 109.8 368 4.39 1,708 19.45 171 46 3
10.00 to < 100.00 97 0 567.8 98 22.29 676 18.95 80 81 4
100.00 (default) 109 0 72.8 109 100.00 750 30.40 122 111 25
Subtotal 14,716 438 103.1 15,162 1.30 69,101 17.36 1,479 10 41 41.2
...s
ecu
red
by
mor
tgag
es /
n
on-S
ME
s
0.00 to < 0.15 34,719 1,056 93.7 35,709 0.06 283,526 17.94 1,065 3 4
0.15 to < 0.25 12,580 316 97.2 12,887 0.20 114,729 16.82 923 7 4
0.25 to < 0.50 15,845 500 98.8 16,339 0.35 106,402 17.73 1,872 11 10
0.50 to < 0.75 4,856 295 99.9 5,150 0.60 30,328 19.46 939 18 6
0.75 to < 2.50 3,483 136 99.9 3,619 1.19 22,565 19.53 1,033 29 8
2.50 to 10.00 851 14 98.7 865 4.92 6,798 18.53 536 62 8
10.00 to < 100.00 377 1 90.5 379 21.22 3,553 19.44 414 109 16
100.00 (default) 370 1 56.8 371 100.00 3,872 38.29 383 103 115
Subtotal 73,081 2,319 96.5 75,318 0.89 571,530 18.00 7,163 10 172 181.1
...q
ual
ifyi
ng
rev
olvi
ng
0.00 to < 0.15 144 11,435 76.5 8,895 0.04 1,557,630 65.46 185 2 2
0.15 to < 0.25 38 502 77.0 425 0.19 111,835 64.39 51 12 1
0.25 to < 0.50 74 477 76.9 441 0.36 120,405 64.47 117 27 2
0.50 to < 0.75 50 195 76.1 198 0.62 58,363 64.80 96 48 2
0.75 to < 2.50 183 356 76.3 455 1.37 137,791 65.51 310 68 13
2.50 to 10.00 101 94 76.5 173 4.59 88,361 66.39 208 120 17
10.00 to < 100.00 30 17 75.3 43 22.63 22,705 67.71 96 223 28
100.00 (default) 18 3 74.6 20 100.00 8,355 66.99 13 63 31
Subtotal 638 13,080 76.5 10,649 0.48 2,105,445 65.40 1,076 10 97 31.2
1 For retail, this parameter is not included in the RWA calculation, therefore – according to EBA/GL/2016/11 – no details are given here for retail.
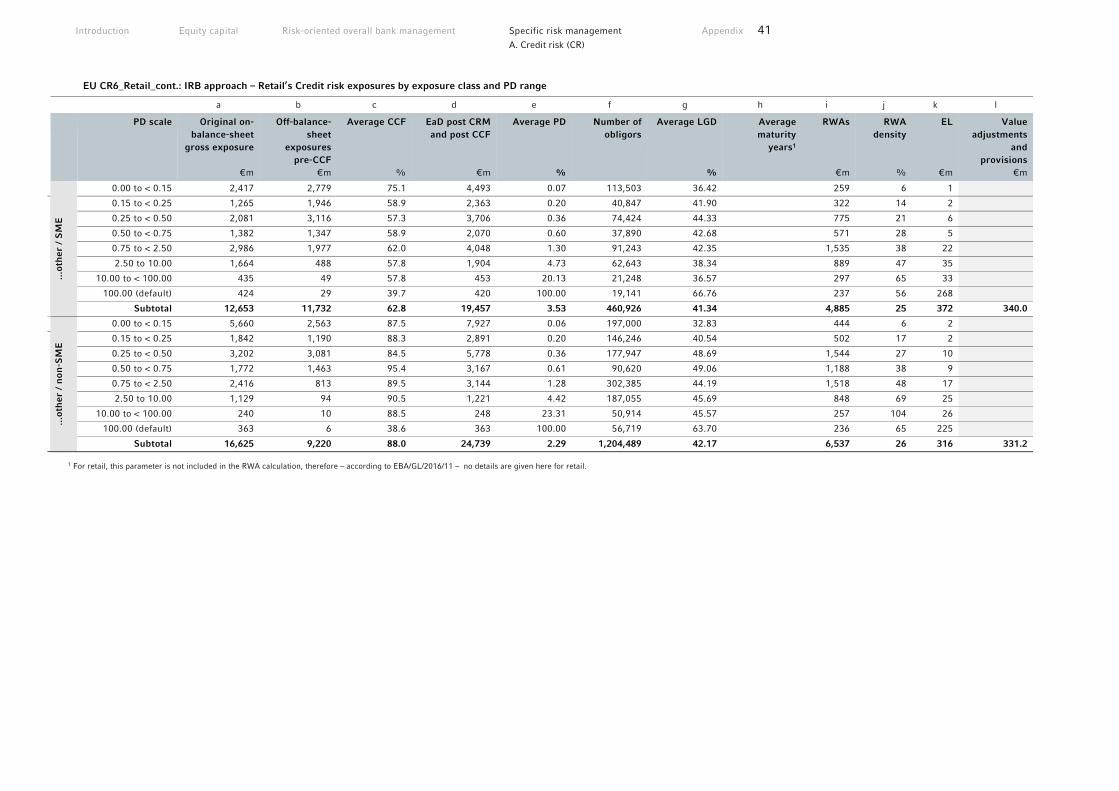
Introduction Equity capital Risk-oriented overall bank management Specific risk management Appendix 41
A. Credit risk (CR)
EU CR6_Retail_cont.: IRB approach – Retail’s Credit risk exposures by exposure class and PD range a b c d e f g h i j k l
PD scale Original on-balance-sheet
gross exposure
€m
Off-balance-sheet
exposures pre-CCF
€m
Average CCF
%
EaD post CRM and post CCF
€m
Average PD
%
Number of obligors
Average LGD
%
Average maturity
years1
RWAs
€m
RWA density
%
EL
€m
Value adjustments
and provisions
€m
...o
ther
/ S
ME
0.00 to < 0.15 2,417 2,779 75.1 4,493 0.07 113,503 36.42 259 6 1
0.15 to < 0.25 1,265 1,946 58.9 2,363 0.20 40,847 41.90 322 14 2
0.25 to < 0.50 2,081 3,116 57.3 3,706 0.36 74,424 44.33 775 21 6
0.50 to < 0.75 1,382 1,347 58.9 2,070 0.60 37,890 42.68 571 28 5
0.75 to < 2.50 2,986 1,977 62.0 4,048 1.30 91,243 42.35 1,535 38 22
2.50 to 10.00 1,664 488 57.8 1,904 4.73 62,643 38.34 889 47 35
10.00 to < 100.00 435 49 57.8 453 20.13 21,248 36.57 297 65 33
100.00 (default) 424 29 39.7 420 100.00 19,141 66.76 237 56 268
Subtotal 12,653 11,732 62.8 19,457 3.53 460,926 41.34 4,885 25 372 340.0
...o
ther
/ n
on-S
ME
0.00 to < 0.15 5,660 2,563 87.5 7,927 0.06 197,000 32.83 444 6 2
0.15 to < 0.25 1,842 1,190 88.3 2,891 0.20 146,246 40.54 502 17 2
0.25 to < 0.50 3,202 3,081 84.5 5,778 0.36 177,947 48.69 1,544 27 10
0.50 to < 0.75 1,772 1,463 95.4 3,167 0.61 90,620 49.06 1,188 38 9
0.75 to < 2.50 2,416 813 89.5 3,144 1.28 302,385 44.19 1,518 48 17
2.50 to 10.00 1,129 94 90.5 1,221 4.42 187,055 45.69 848 69 25
10.00 to < 100.00 240 10 88.5 248 23.31 50,914 45.57 257 104 26
100.00 (default) 363 6 38.6 363 100.00 56,719 63.70 236 65 225
Subtotal 16,625 9,220 88.0 24,739 2.29 1,204,489 42.17 6,537 26 316 331.2
1 For retail, this parameter is not included in the RWA calculation, therefore – according to EBA/GL/2016/11 – no details are given here for retail.
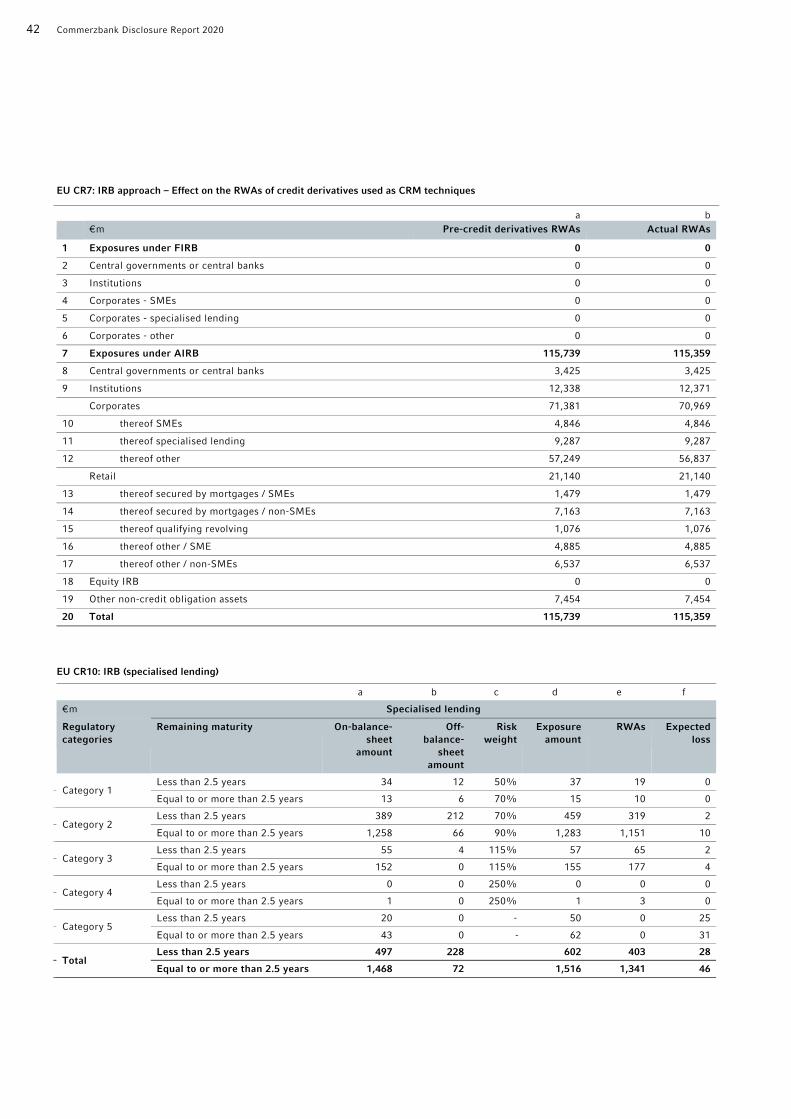
42 Commerzbank Disclosure Report 2020
EU CR7: IRB approach – Effect on the RWAs of credit derivatives used as CRM techniques a b
€m Pre-credit derivatives RWAs Actual RWAs
1 Exposures under FIRB 0 0
2 Central governments or central banks 0 0
3 Institutions 0 0
4 Corporates - SMEs 0 0
5 Corporates - specialised lending 0 0
6 Corporates - other 0 0
7 Exposures under AIRB 115,739 115,359
8 Central governments or central banks 3,425 3,425
9 Institutions 12,338 12,371
Corporates 71,381 70,969
10 thereof SMEs 4,846 4,846
11 thereof specialised lending 9,287 9,287
12 thereof other 57,249 56,837
Retail 21,140 21,140
13 thereof secured by mortgages / SMEs 1,479 1,479
14 thereof secured by mortgages / non-SMEs 7,163 7,163
15 thereof qualifying revolving 1,076 1,076
16 thereof other / SME 4,885 4,885
17 thereof other / non-SMEs 6,537 6,537
18 Equity IRB 0 0
19 Other non-credit obligation assets 7,454 7,454
20 Total 115,739 115,359
EU CR10: IRB (specialised lending)
a b c d e f
€m Specialised lending
Regulatory categories
Remaining maturity On-balance-sheet
amount
Off-balance-
sheet amount
Risk weight
Exposure amount
RWAs Expected loss
Category 1 Less than 2.5 years 34 12 50% 37 19 0
Equal to or more than 2.5 years 13 6 70% 15 10 0
Category 2 Less than 2.5 years 389 212 70% 459 319 2
Equal to or more than 2.5 years 1,258 66 90% 1,283 1,151 10
Category 3 Less than 2.5 years 55 4 115% 57 65 2
Equal to or more than 2.5 years 152 0 115% 155 177 4
Category 4 Less than 2.5 years 0 0 250% 0 0 0
Equal to or more than 2.5 years 1 0 250% 1 3 0
Category 5 Less than 2.5 years 20 0 - 50 0 25
Equal to or more than 2.5 years 43 0 - 62 0 31
Total Less than 2.5 years 497 228 602 403 28
Equal to or more than 2.5 years 1,468 72 1,516 1,341 46
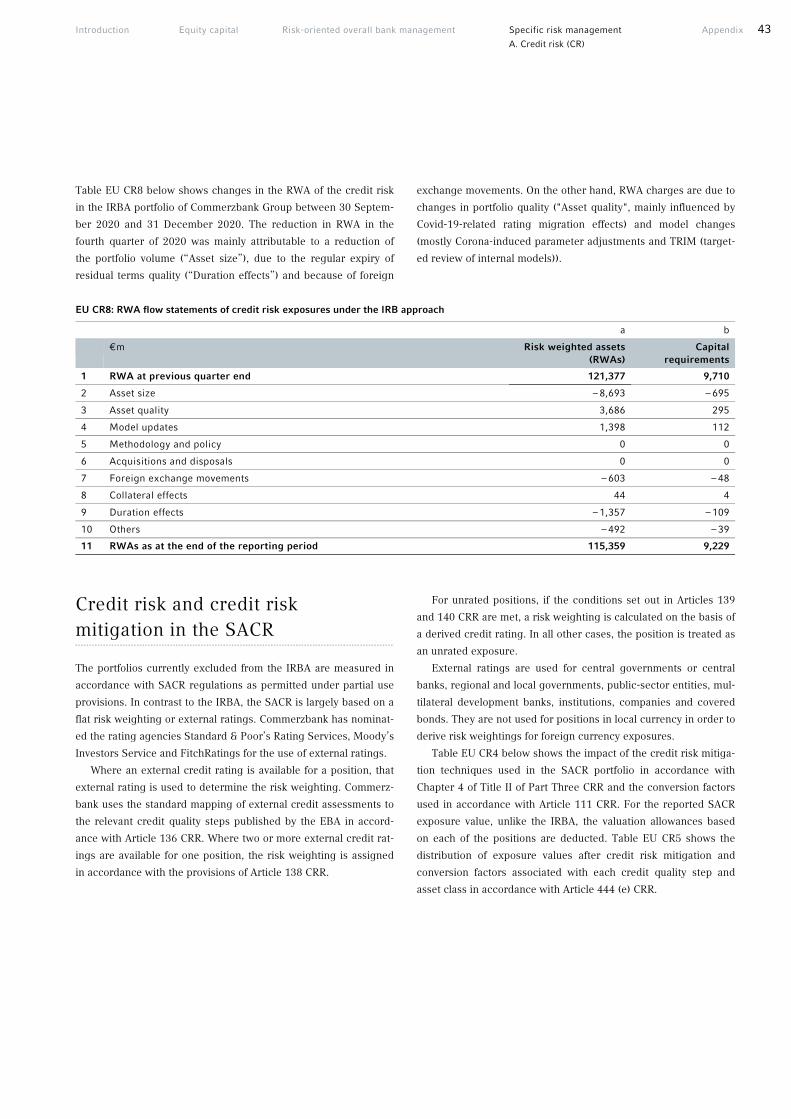
Introduction Equity capital Risk-oriented overall bank management Specific risk management Appendix 43
A. Credit risk (CR)
Table EU CR8 below shows changes in the RWA of the credit risk
in the IRBA portfolio of Commerzbank Group between 30 Septem-
ber 2020 and 31 December 2020. The reduction in RWA in the
fourth quarter of 2020 was mainly attributable to a reduction of
the portfolio volume (“Asset size”), due to the regular expiry of
residual terms quality (“Duration effects”) and because of foreign
exchange movements. On the other hand, RWA charges are due to
changes in portfolio quality ("Asset quality", mainly influenced by
Covid-19-related rating migration effects) and model changes
(mostly Corona-induced parameter adjustments and TRIM (target-
ed review of internal models)).
EU CR8: RWA flow statements of credit risk exposures under the IRB approach a b
€m Risk weighted assets (RWAs)
Capital requirements
1 RWA at previous quarter end 121,377 9,710
2 Asset size – 8,693 – 695
3 Asset quality 3,686 295
4 Model updates 1,398 112
5 Methodology and policy 0 0
6 Acquisitions and disposals 0 0
7 Foreign exchange movements – 603 – 48
8 Collateral effects 44 4
9 Duration effects – 1,357 – 109
10 Others – 492 – 39
11 RWAs as at the end of the reporting period 115,359 9,229
Credit risk and credit risk mitigation in the SACR
The portfolios currently excluded from the IRBA are measured in
accordance with SACR regulations as permitted under partial use
provisions. In contrast to the IRBA, the SACR is largely based on a
flat risk weighting or external ratings. Commerzbank has nominat-
ed the rating agencies Standard & Poor’s Rating Services, Moody’s
Investors Service and FitchRatings for the use of external ratings.
Where an external credit rating is available for a position, that
external rating is used to determine the risk weighting. Commerz-
bank uses the standard mapping of external credit assessments to
the relevant credit quality steps published by the EBA in accord-
ance with Article 136 CRR. Where two or more external credit rat-
ings are available for one position, the risk weighting is assigned
in accordance with the provisions of Article 138 CRR.
For unrated positions, if the conditions set out in Articles 139
and 140 CRR are met, a risk weighting is calculated on the basis of
a derived credit rating. In all other cases, the position is treated as
an unrated exposure.
External ratings are used for central governments or central
banks, regional and local governments, public-sector entities, mul-
tilateral development banks, institutions, companies and covered
bonds. They are not used for positions in local currency in order to
derive risk weightings for foreign currency exposures.
Table EU CR4 below shows the impact of the credit risk mitiga-
tion techniques used in the SACR portfolio in accordance with
Chapter 4 of Title II of Part Three CRR and the conversion factors
used in accordance with Article 111 CRR. For the reported SACR
exposure value, unlike the IRBA, the valuation allowances based
on each of the positions are deducted. Table EU CR5 shows the
distribution of exposure values after credit risk mitigation and
conversion factors associated with each credit quality step and
asset class in accordance with Article 444 (e) CRR.

44 Commerzbank Disclosure Report 2020
EU CR4: Standardised approach – Credit risk exposure and CRM effects a b c d e f
Exposure classes €m
Exposures before CCF and CRM
Exposures post CCF and CRM
RWAs and RWA density
On-balance-sheet
amount
Off-balance-sheet
amount
On-balance-sheet
amount
Off-balance-sheet
amount
RWAs RWA density
1 Central governments or central banks 86,982 52 91,014 346 606 0.7%
2 Regional government or local authorities 16,617 868 17,334 104 489 2.8%
3 Public sector entities 4,853 362 6,513 284 169 2.5%
4 Multilateral development banks 933 0 933 0 0 0.0%
5 International organisations 794 0 794 0 0 0.0%
6 Institutions 1,435 11 1,445 6 256 17.6%
7 Corporates 5,509 1,784 5,119 650 4,998 86.6%
8 Retail 5,480 4,237 5,239 219 4,075 74.7%
9 Secured by mortgages on immovable property 2,346 6 2,346 3 836 35.6%
10 Exposures in default 162 8 157 1 177 112.2%
11 Exposures associated with particularly high risk 425 0 425 0 637 150.0%
12 Covered bonds 0 0 0 0 0 0.0%
13 Institutions and corporates with a short-term credit assessment 11 0 11 0 2 20.0%
14 Collective investment undertakings 2,341 0 2,341 0 597 25.5%
15 Equity 938 0 938 0 1,267 135.1%
16 Other items 2,614 72 2,614 72 5,999 223.1%
17 Total 131,439 7,401 137,222 1,684 20,108 14.5%
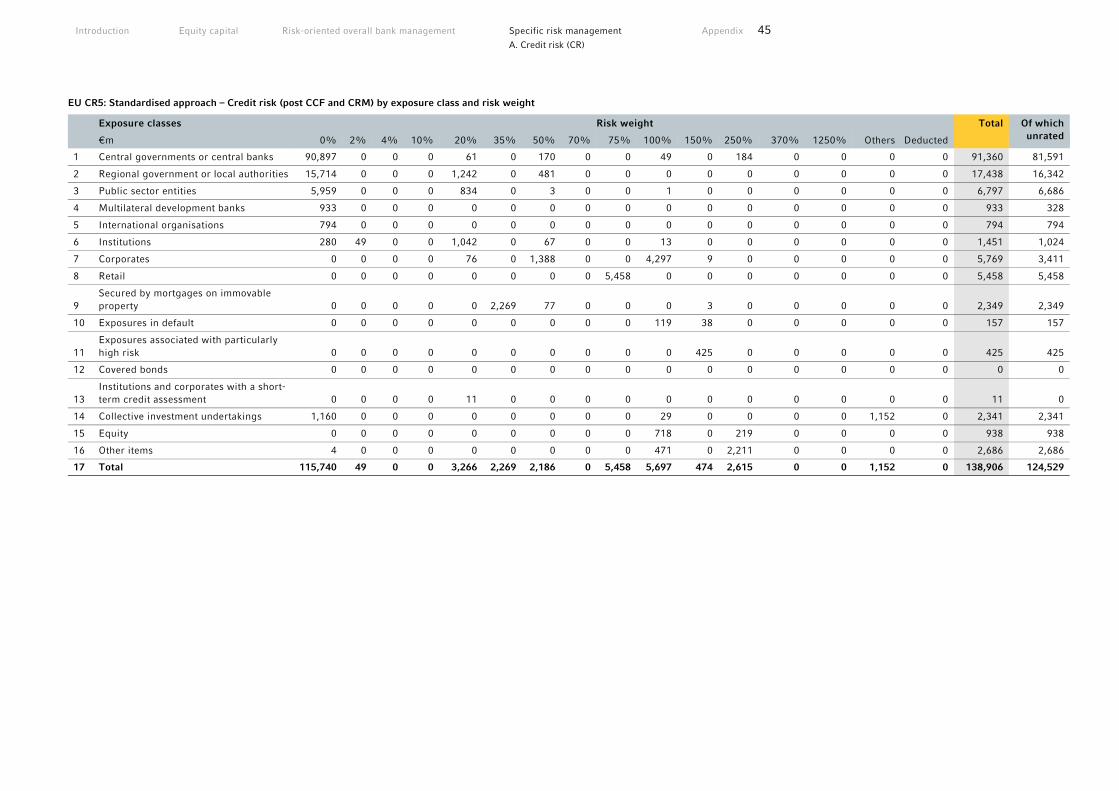
Introduction Equity capital Risk-oriented overall bank management Specific risk management Appendix 45
A. Credit risk (CR)
EU CR5: Standardised approach – Credit risk (post CCF and CRM) by exposure class and risk weight Exposure classes Risk weight Total Of which
unrated €m 0% 2% 4% 10% 20% 35% 50% 70% 75% 100% 150% 250% 370% 1250% Others Deducted
1 Central governments or central banks 90,897 0 0 0 61 0 170 0 0 49 0 184 0 0 0 0 91,360 81,591
2 Regional government or local authorities 15,714 0 0 0 1,242 0 481 0 0 0 0 0 0 0 0 0 17,438 16,342
3 Public sector entities 5,959 0 0 0 834 0 3 0 0 1 0 0 0 0 0 0 6,797 6,686
4 Multilateral development banks 933 0 0 0 0 0 0 0 0 0 0 0 0 0 0 0 933 328
5 International organisations 794 0 0 0 0 0 0 0 0 0 0 0 0 0 0 0 794 794
6 Institutions 280 49 0 0 1,042 0 67 0 0 13 0 0 0 0 0 0 1,451 1,024
7 Corporates 0 0 0 0 76 0 1,388 0 0 4,297 9 0 0 0 0 0 5,769 3,411
8 Retail 0 0 0 0 0 0 0 0 5,458 0 0 0 0 0 0 0 5,458 5,458
9 Secured by mortgages on immovable property 0 0 0 0 0 2,269 77 0 0 0 3 0 0 0 0 0 2,349 2,349
10 Exposures in default 0 0 0 0 0 0 0 0 0 119 38 0 0 0 0 0 157 157
11 Exposures associated with particularly high risk 0 0 0 0 0 0 0 0 0 0 425 0 0 0 0 0 425 425
12 Covered bonds 0 0 0 0 0 0 0 0 0 0 0 0 0 0 0 0 0 0
13 Institutions and corporates with a short-term credit assessment 0 0 0 0 11 0 0 0 0 0 0 0 0 0 0 0 11 0
14 Collective investment undertakings 1,160 0 0 0 0 0 0 0 0 29 0 0 0 0 1,152 0 2,341 2,341
15 Equity 0 0 0 0 0 0 0 0 0 718 0 219 0 0 0 0 938 938
16 Other items 4 0 0 0 0 0 0 0 0 471 0 2,211 0 0 0 0 2,686 2,686
17 Total 115,740 49 0 0 3,266 2,269 2,186 0 5,458 5,697 474 2,615 0 0 1,152 0 138,906 124,529

46 Commerzbank Disclosure Report 2020
In order to mitigate credit risk in the SACR, the Commerzbank
Group takes financial collateral and guarantees into consideration.
These are dealt with separately in the section on risk mitigation.
Furthermore, collateral in the form of property charges also re-
duces the risk weighting.
Under the SACR, guarantees are treated according to the sub-
stitution principle. This means that the borrower’s risk weighting
is replaced by that of the guarantor. Consequently, the guaranteed
amount is transferred from the borrower’s exposure class to that
of the guarantor. This is why the exposure before CRM for assets
guaranteed by central governments and central banks, for exam-
ple, is less than after CRM. This can be seen in table EU CR4.
However, a transfer only takes place if the risk weighting of the
guarantor is lower than that of the borrower.
Past due positions are shown with a risk weighting of 150%.
Depending on the impairments based on these positions in ac-
cordance with IFRS 9 or the collateral, a risk weighting of 100%
can be applied or they may be shifted to another exposure class.
The amount of the exposures secured by collateral, financial
guarantees or credit derivatives and the amount of unsecured ex-
posures by asset class is shown in table EU CR3 in the section on
credit risk mitigation. The effectively secured risk position values,
i.e. taking into consideration all of the relevant haircuts for the
collateral, are allocated to the SACR exposure class. In taking fi-
nancial collateral into account as a credit risk mitigation technique,
Commerzbank generally uses the comprehensive method as de-
fined under Articles 223 to 228 CRR. In doing so, the risk expo-
sure value for the default risk position is reduced by the value of
the financial collateral.
Overarching portfolio analyses
This section provides an overview of the total portfolio containing
default risks from credit risk with a net exposure value of €582bn
as at 31 December 2020.
We show the total of SACR and IRBA positions with their net
exposure value as defined by the EBA guideline EBA\GL\2016\11
(77) to (83).
In accordance with Chapter 6 of Title II of Part III CRR, instru-
ments with counterparty default risk are not included in this sec-
tion. They are reported separately in the section on default risks
from counterparty credit risk.
Effectively securitised positions are also not included in the ta-
bles below. In accordance with Articles 244 to 246 CRR, positions
are deemed to be effectively securitised if there has been an effec-
tive and operative transfer of risk. This applies regardless of
whether these are traditionally or synthetically securitised posi-
tions. Securitisation positions arising from Group companies in-
cluded in this Disclosure Report acting as investors or sponsors
are also not included. Due to their particular significance, these
are shown in the separate chapter on securitisations.
Table EU CRB-B provides an overview of net exposure values
by asset class on the reporting date, average net exposure values
during the period under review and the percentage share of expo-
sures in each asset class in the Commerzbank Group’s total expo-
sure.
The country clusters selected in table EU CRB-C match the
classification by geographical area used for internal purposes. For
the presentation of exposures the following materiality threshold
was used to identify material geographical regions or countries: all
countries where net exposure share is at least 1% of total expo-
sure are reported separately within their region, all other countries
within that region are summarised under “Others”. All regions
where net exposure is at least 1% of the total exposure are re-
ported as a separate region. All other regions are combined in the
“Other regions” column. Alongside further additional information,
Appendix 4 includes a list of countries which are not considered to
be material within a region (share of total exposure <1%).
The breakdown by sector in table EU CRB-D is based on the
methodology applied by the Federal Statistical Office and a system
used internally.
Table EU CRB-E shows the net exposure values by contractual
residual terms. Overnight receivables include net debit balances
on current accounts, call and overnight transactions and credit
lines that can be terminated at any time.

Introduction Equity capital Risk-oriented overall bank management Specific risk management Appendix 47
A. Credit risk (CR)
EU CRB-B: Total and average net amount of exposure a b
€m Net value of exposures as at 31.12.2020
Average net exposures over the entire year
2020
Share as at 31.12.2020
%
1 Central governments or central banks 15,715 25,878 2.7
2 Institutions 39,241 41,938 6.7
3 Corporates 209,490 220,890 36.0
3a thereof SMEs 12,563 12,966 2.2
3b thereof specialised lending 21,685 21,442 3.7
3c thereof other 175,241 186,482 30.1
4 Retail 153,579 149,629 26.4
4a thereof secured by mortgages / SMEs 15,114 4,526 2.6
4b thereof secured by mortgages / non-SMEs 75,219 83,592 12.9
4c thereof qualifying revolving 13,687 13,718 2.4
4d thereof other / SME 24,045 16,707 4.1
4e thereof other / non-SMEs 25,514 31,086 4.4
5 Equity exposures IRB 0 0 0.0
6 Other non-credit obligation assets 24,687 17,953 4.2
7 Total IRB approach 442,711 456,287 76.1
8 Central governments or central banks 87,034 75,132 15.0
9 Regional governments or local authorities 17,485 16,728 3.0
10 Public sector entities 5,215 5,248 0.9
11 Multilateral development banks 933 854 0.2
12 International organisations 794 575 0.1
13 Institutions 1,446 1,793 0.2
14 Corporates 7,293 7,608 1.3
14a thereof SMEs 560 496 0.1
15 Retail 9,718 9,229 1.7
15a thereof SMEs 637 189 0.1
16 Secured by mortgages on immovable property 2,352 2,318 0.4
16a thereof SMEs 11 4 0.0
17 Exposures in default 170 199 0.0
18 Items associated with particularly high risk 425 304 0.1
19 Covered bonds 0 0 0.0
20 Claims on institutions and corporates with a short-term credit assessment 11 12 0.0
21 Collective investment undertakings 2,341 2,452 0.4
22 Equity exposures 938 894 0.2
23 Other exposures 2,686 2,823 0.5
24 Total SACR 138,839 126,169 23.9
25 Total 581,551 582,456 100.0

48 Commerzbank Disclosure Report 2020
EU CRB-C: Geographical breakdown of exposures by exposure class Net exposure value
Exposure class Western Europe thereof…
€m Germany Switzerland Great Britain Italy France Netherlands Spain Others
1 Central governments or central banks 1,763 117 358 0 393 0 0 0 896
2 Institutions 20,645 4,332 1,642 3,751 1,104 3,516 411 1,100 4,788
3 Corporates 164,432 104,721 6,861 13,049 2,521 11,067 7,542 3,371 15,298
3a thereof SMEs 9,269 9,016 40 8 0 6 14 0 185
3b thereof specialised lending 18,599 12,514 201 1,955 115 604 976 180 2,055
3c thereof other 136,563 83,192 6,620 11,086 2,407 10,458 6,552 3,191 13,058
4 Retail 138,835 137,480 647 96 29 94 78 63 348
4a thereof secured by mortgages / SMEs 14,520 14,442 25 9 3 6 8 2 25
4b thereof secured by mortgages / non-SMEs 67,871 67,244 319 53 14 45 39 15 142
4c thereof qualifying revolving 13,609 13,508 24 12 5 12 7 7 33
4d thereof other / SME 21,042 20,875 67 8 4 3 9 3 74
4e thereof other / non-SMEs 21,793 21,411 212 14 4 28 15 36 74
5 Equity exposures IRB 0 0 0 0 0 0 0 0 0
6 Other non-credit obligation assets 22,055 15,957 1 4,488 160 1,201 0 0 248
7 Total IRB approach 347,728 262,607 9,509 21,384 4,208 15,878 8,031 4,534 21,577
8 Central governments or central banks 71,390 53,906 0 2,065 9,635 156 0 2,510 3,118
9 Regional governments or local authorities 15,717 14,491 0 50 175 0 0 874 127
10 Public sector entities 5,183 4,953 0 0 0 201 0 0 30
11 Multilateral development banks 686 0 0 0 0 0 0 0 686
12 International organisations 0 0 0 0 0 0 0 0 0
13 Institutions 1,307 1,024 0 59 0 3 0 0 221
14 Corporates 3,386 910 0 1,851 0 186 108 0 331
15 Retail 8,407 8,311 21 4 1 3 3 2 61
16 Secured by mortgages on immovable property 55 55 0 0 0 0 0 0 0
17 Exposures in default 82 82 0 0 0 0 0 0 0
18 Items associated with particularly high risk 273 224 0 43 0 2 1 0 3
19 Covered bonds 0 0 0 0 0 0 0 0 0
20 Claims on institutions and corporates with a short-term credit assessment 0 0 0 0 0 0 0 0 0
21 Collective investment undertakings 1,730 1,723 0 0 0 0 0 0 7
22 Equity exposures 720 572 5 6 0 1 0 0 136
23 Other exposures 2,605 2,531 3 44 0 6 2 1 17
24 Total SACR 111,541 88,781 30 4,122 9,811 558 113 3,387 4,738
25 Total 459,270 351,387 9,539 25,506 14,019 16,437 8,144 7,922 26,316
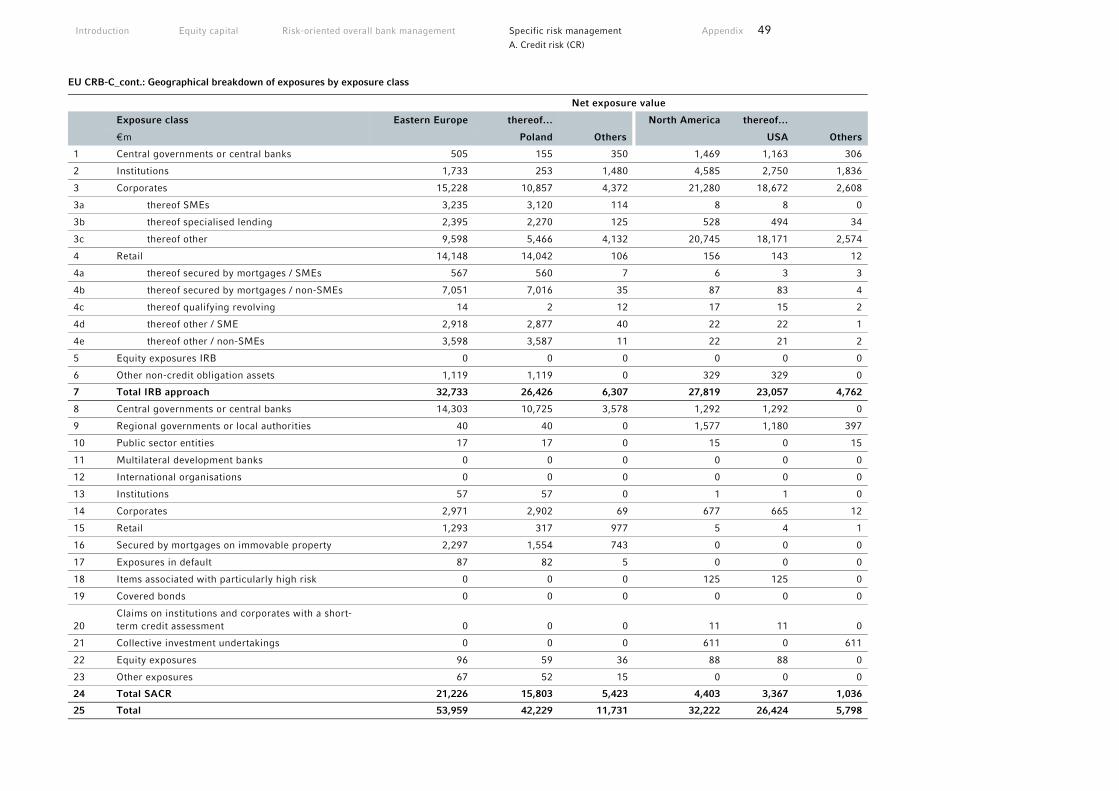
Introduction Equity capital Risk-oriented overall bank management Specific risk management Appendix 49
A. Credit risk (CR)
EU CRB-C_cont.: Geographical breakdown of exposures by exposure class Net exposure value
Exposure class Eastern Europe thereof… North America thereof…
€m Poland Others USA Others
1 Central governments or central banks 505 155 350 1,469 1,163 306
2 Institutions 1,733 253 1,480 4,585 2,750 1,836
3 Corporates 15,228 10,857 4,372 21,280 18,672 2,608
3a thereof SMEs 3,235 3,120 114 8 8 0
3b thereof specialised lending 2,395 2,270 125 528 494 34
3c thereof other 9,598 5,466 4,132 20,745 18,171 2,574
4 Retail 14,148 14,042 106 156 143 12
4a thereof secured by mortgages / SMEs 567 560 7 6 3 3
4b thereof secured by mortgages / non-SMEs 7,051 7,016 35 87 83 4
4c thereof qualifying revolving 14 2 12 17 15 2
4d thereof other / SME 2,918 2,877 40 22 22 1
4e thereof other / non-SMEs 3,598 3,587 11 22 21 2
5 Equity exposures IRB 0 0 0 0 0 0
6 Other non-credit obligation assets 1,119 1,119 0 329 329 0
7 Total IRB approach 32,733 26,426 6,307 27,819 23,057 4,762
8 Central governments or central banks 14,303 10,725 3,578 1,292 1,292 0
9 Regional governments or local authorities 40 40 0 1,577 1,180 397
10 Public sector entities 17 17 0 15 0 15
11 Multilateral development banks 0 0 0 0 0 0
12 International organisations 0 0 0 0 0 0
13 Institutions 57 57 0 1 1 0
14 Corporates 2,971 2,902 69 677 665 12
15 Retail 1,293 317 977 5 4 1
16 Secured by mortgages on immovable property 2,297 1,554 743 0 0 0
17 Exposures in default 87 82 5 0 0 0
18 Items associated with particularly high risk 0 0 0 125 125 0
19 Covered bonds 0 0 0 0 0 0
20 Claims on institutions and corporates with a short-term credit assessment 0 0 0 11 11 0
21 Collective investment undertakings 0 0 0 611 0 611
22 Equity exposures 96 59 36 88 88 0
23 Other exposures 67 52 15 0 0 0
24 Total SACR 21,226 15,803 5,423 4,403 3,367 1,036
25 Total 53,959 42,229 11,731 32,222 26,424 5,798

50 Commerzbank Disclosure Report 2020
EU CRB-C_cont.: Geographical breakdown of exposures by exposure class Exposure class Asia thereof… Latin America Other regions Total
€m Japan Others (incl. Mexiko)
1 Central governments or central banks 10,369 8,233 2,136 442 1,167 15,715
2 Institutions 7,596 146 7,450 2,732 1,950 39,241
3 Corporates 6,206 372 5,835 1,686 657 209,490
3a thereof SMEs 49 0 49 3 0 12,563
3b thereof specialised lending 109 0 109 53 2 21,685
3c thereof other 6,049 372 5,677 1,630 655 175,241
4 Retail 327 8 319 49 65 153,579
4a thereof secured by mortgages / SMEs 17 0 17 1 3 15,114
4b thereof secured by mortgages / non-SMEs 163 3 160 23 24 75,219
4c thereof qualifying revolving 24 3 21 12 11 13,687
4d thereof other / SME 45 1 43 1 17 24,045
4e thereof other / non-SMEs 79 1 78 12 10 25,514
5 Equity exposures IRB 0 0 0 0 0 0
6 Other non-credit obligation assets 177 177 0 737 270 24,687
7 Total IRB approach 24,675 8,935 15,740 5,646 4,109 442,711
8 Central governments or central banks 0 0 0 49 0 87,034
9 Regional governments or local authorities 152 152 0 0 0 17,485
10 Public sector entities 0 0 0 0 0 5,215
11 Multilateral development banks 0 0 0 0 246 933
12 International organisations 0 0 0 0 794 794
13 Institutions 2 0 2 20 59 1,446
14 Corporates 1 0 1 257 0 7,293
15 Retail 9 0 8 1 2 9,718
16 Secured by mortgages on immovable property 0 0 0 0 0 2,352
17 Exposures in default 0 0 0 0 0 170
18 Items associated with particularly high risk 8 0 8 19 0 425
19 Covered bonds 0 0 0 0 0 0
20 Claims on institutions and corporates with a short-term credit assessment 0 0 0 0 0 11
21 Collective investment undertakings 0 0 0 0 0 2,341
22 Equity exposures 31 1 30 0 4 938
23 Other exposures 10 1 10 4 0 2,686
24 Total SACR 213 154 59 351 1,106 138,839
25 Total 24,888 9,089 15,799 5,997 5,215 581,551

Introduction Equity capital Risk-oriented overall bank management Specific risk management Appendix 51
A. Credit risk (CR)
€m Pro
du
ctio
n
and
m
anu
fact
orin
g
ind
ust
ry
En
erg
y an
d
wat
er s
up
ply
Wh
oles
ale
and
re
tail
tra
de;
re
pai
rs
Tra
nsp
ort
and
te
leco
mm
un
icat
ion
Oth
er s
ervi
ces
Ban
ks
Oth
er f
inan
cial
in
du
stry
an
d
insu
ran
ces
Rea
l es
tate
ac
tivi
ties
Pu
bli
c ad
min
istr
atio
n
and
def
ence
, co
mp
uls
ory
soci
al s
ecu
rity
Pri
vate
h
ouse
hol
ds
Oth
ers
Tot
al
1 Central governments or central banks 0 4 0 1 5 9,808 158 0 5,738 1 0 15,715
2 Institutions 37 398 0 47 84 30,228 1,963 25 6,421 37 0 39,241
3 Corporates 96,220 21,945 24,060 15,128 10,432 20 14,110 23,557 0 2,902 1,115 209,490
3a thereof SMEs 5,113 239 2,399 466 1,149 0 900 2,096 0 40 161 12,563
3b thereof specialised lending 2,817 5,832 173 481 1,040 0 2,457 8,718 0 13 155 21,685
3c thereof other 88,289 15,874 21,488 14,182 8,243 20 10,753 12,743 0 2,848 800 175,241
4 Retail 8,692 113 5,738 1,196 9,130 3 1,692 10,610 0 115,630 775 153,579
4a thereof secured by mortgages / SMEs 1,470 21 1,436 302 4,598 0 942 5,370 0 699 277 15,114
4b thereof secured by mortgages / non-SMEs 670 0 41 1 24 0 0 3 0 74,445 35 75,219
4c thereof qualifying revolving 0 0 0 0 0 0 0 0 0 13,687 0 13,687
4d thereof other / SME 6,166 92 4,229 892 4,493 3 750 5,235 0 1,737 448 24,045
4e thereof other / non-SMEs 386 0 32 1 15 0 0 2 0 25,062 15 25,514
5 Equity exposures IRB 0 0 0 0 0 0 0 0 0 0 0 0
6 Other non-credit obligation assets 255 0 72 90 10,870 4,278 6,425 1 55 2,642 0 24,687
7 Total IRB approach 105,204 22,460 29,870 16,462 30,521 44,337 24,349 34,192 12,215 121,211 1,890 442,711
8 Central governments or central banks 1 0 0 0 11 6,166 110 228 80,391 126 0 87,034
9 Regional governments or local authorities 0 0 0 0 1 41 0 0 17,434 0 9 17,485
10 Public sector entities 0 129 11 55 604 4,068 0 60 277 0 11 5,215
11 Multilateral development banks 0 0 0 0 0 686 246 0 0 0 0 933
12 International organisations 0 0 0 0 0 0 0 0 794 0 0 794
13 Institutions 4 0 0 0 346 1,079 18 0 0 0 0 1,446
14 Corporates 1,064 624 228 438 2,011 95 1,068 848 415 437 60 7,287
15 Retail 98 8 51 14 285 0 67 152 0 9,034 8 9,718
16 Secured by mortgages on immovable property 4 0 6 1 42 0 14 11 0 2,275 0 2,352
17 Exposures in default 26 0 1 0 6 19 17 18 0 81 0 170
18 Items associated with particularly high risk 0 0 0 0 5 0 91 328 0 0 0 425
19 Covered bonds 0 0 0 0 0 0 0 0 0 0 0 0
20 Claims on institutions and corporates with a short-term credit assessment 0 0 0 0 0 0 11 0 0 0 0 11
21 Collective investment undertakings 0 0 0 0 0 0 2,341 0 0 0 0 2,341
22 Equity exposures 164 0 0 124 4 0 473 139 0 32 2 938
23 Other exposures 1 0 5 0 0 78 285 102 2,211 10 0 2,691
24 Total SACR 1,361 762 302 631 3,315 12,231 4,741 1,886 101,523 11,996 92 138,839
25 Total 106,565 23,221 30,172 17,094 33,836 56,568 29,090 36,078 113,738 133,207 1,982 581,551
EU CRB-D: Concentration of exposures by industry

52 Commerzbank Disclosure Report 2020
EU CRB-E: Maturity of exposures by exposure classes a b c d e f
Net exposure value
€m On demand
≤1 year >1 year ≤5 years
>5 years No stated maturity
Total
1 Central governments or central banks 9,390 2,678 2,135 1,512 0 15,715
2 Institutions 5,244 12,472 10,180 11,346 0 39,241
3 Corporates 52,282 43,867 80,781 32,559 0 209,490
4 Retail 28,472 7,317 17,113 100,677 0 153,579
5 Equity exposures IRB 0 0 0 0 0 0
6 Other non-credit obligation assets 14,978 2,900 1,009 5,800 0 24,687
7 Total IRB approach 110,366 69,234 111,218 151,894 0 442,711
8 Central governments or central banks 54,179 8,978 11,930 11,946 0 87,034
9 Regional governments or local authorities 695 909 4,052 11,828 0 17,485
10 Public sector entities 147 518 2,184 2,366 0 5,215
11 Multilateral development banks 0 238 372 322 0 933
12 International organisations 0 0 467 327 0 794
13 Institutions 1,005 30 357 54 0 1,446
14 Corporates 1,214 1,706 1,315 3,058 0 7,293
15 Retail 4,633 162 1,643 3,280 0 9,718
16 Secured by mortgages on immovable property 1 4 72 2,276 0 2,352
17 Exposures in default 91 12 33 34 0 170
18 Items associated with particularly high risk 425 0 0 0 0 425
19 Covered bonds 0 0 0 0 0 0
20 Claims on institutions and corporates with a short-term credit assessment 11 0 0 0 0 11
21 Collective investment undertakings 0 0 0 2,341 0 2,341
22 Equity exposures 778 0 160 0 0 938
23 Other exposures 370 16 30 2,270 0 2,686
24 Total SACR 63,549 12,574 22,616 40,101 0 138,839
25 Total 173,915 81,808 133,833 191,995 0 581,551
Loan loss provisions for default risks
Responsibility for processing non-performing loans lies with
Group Credit Risk Management. This division brings together the
specific expert knowledge needed to support customers undergo-
ing restructuring and to successfully process terminated commit-
ments including collateral realisation.
IFRS 9 stipulates that impairments for credit risks from loans
and securities that are not recognised at fair value through profit
or loss must be recognised using a 3-stage model based on ex-
pected credit losses. In the Commerzbank Group, the following
financial instruments are included in the scope of this impairment
model:
financial assets in the form of loans and advances as well as
securitised debt instruments measured at amortised cost (AC);
financial assets in the form of loans and advances as well as
securitised debt instruments measured at fair value through
other comprehensive income (FVOCI);
lease receivables;
irrevocable lending commitments which under IFRS 9 are not
measured at fair value through profit or loss;
financial guarantees within the scope of IFRS 9 that are not
measured at fair value through profit or loss.

Introduction Equity capital Risk-oriented overall bank management Specific risk management Appendix 53
A. Credit risk (CR)
The Group determines the impairment using a 3-stage model
based on the following requirements:
In stage 1, as a rule all financial instruments are recognised if
their risk of a loan loss (hereinafter default risk) has not risen
significantly since their initial recognition. In addition, stage 1
includes all transactions with limited default risk as at the re-
porting date for which Commerzbank utilises the option pro-
vided for in IFRS 9 to refrain from making an assessment about
a significant increase in the default risk. A limited default risk
exists for all financial instruments with an investment-grade in-
ternal credit rating on the financial reporting date (corresponds
to a Commerzbank rating of 2.8 or better, see master scale in
section Rating procedures). An impairment must be recognised
for financial instruments in stage 1 in the amount of the ex-
pected credit loss over the next 12 months (12-month ECL).
Stage 2 includes those financial instruments with default risk
that has risen significantly since their initial recognition and
which, as at the financial reporting date, cannot be classified as
transactions with limited default risk. Impairments in stage 2
are recognised in the amount of the financial instrument’s life-
time expected credit loss (LECL).
Financial instruments that are classified as defaulted as at the
reporting date are allocated to stage 3. Commerzbank’s criteri-
on for this classification is the definition of a default in accord-
ance with Art. 178 CRR in conjunction with delegated Regula-
tion (EU) 2018/171 supplementing Regulation (EU) No
575/2013 and Regulation (EU) 2018/1845 of the ECB. The fol-
lowing events are decisive in determining the default of a cus-
tomer:
– Imminent insolvency (over 90 days past due)
– Unlikely to pay (probability of settlement of liabilities)
– The Bank is assisting in the financial rescue/restructuring
measures of the customer with concessions
– The Bank has demanded immediate repayment of its claims
– The customer is in insolvency proceedings
The LECL is likewise used as the value of the required impair-
ment for stage-3 financial instruments in default. When determin-
ing the LECL, the Group distinguishes in principle between signif-
icant and insignificant transactions. The amount of the LECL for
insignificant transactions (volumes up to €5m1) is determined
based on statistical risk parameters. The LECL for significant
transactions (volumes greater than €5m) is the expected value of
1 For Commerzbank Z.r.t. the threshold amount was adjusted as at 30 September 2017 to an equivalent value of €1m.
the losses derived from individual expert assessments of future
cash flows based on several potential scenarios and their probabil-
ity of occurrence. The scenarios and probabilities are based on
assessments by recovery and resolution specialists. For each sce-
nario – whether it is a continuation or sale scenario – the timing
and amount of the expected future cash flows are estimated.
Both the customer-specific and the macroeconomic situation
are considered (for example currency restrictions, currency value
fluctuations, commodity price developments), as well as the sector
environment, with a view to the future. The estimate is also based
on external information. Sources include indices (e.g. World Cor-
ruption Index), forecasts (e.g. by the IMF), information from global
associations of financial service providers (e.g. the Institute of In-
ternational Finance) and publications from rating agencies and
auditing firms.
If there is no longer a default criterion, the financial instrument
recovers after a probation period of three or twelve months (de-
pending on the reason for failure) without complaints and is no
longer allocated to Stage 3. After recovery, a new assessment is
made based on the updated rating information to see if the default
risk has increased significantly since initial recognition in the bal-
ance sheet, and the instrument is allocated to Stage 1 or Stage 2
accordingly.
Financial instruments which when initially recognised are al-
ready considered impaired as per the aforementioned definition
(purchased or originated credit-impaired, or POCI) are handled
outside the three-stage impairment model and are therefore not
allocated to any of the three stages. The initial recognition is
based on fair value without recording an impairment, using an
effective interest rate that is adjusted for creditworthiness. The
impairment recognised in subsequent periods equals the cumula-
tive change in the LECL since the initial recognition in the balance
sheet. The LECL remains the basis for the measurement, even if
the value of the financial instrument has risen.
Receivables are written off in the balance sheet as soon as they
become uncollectible. Firstly, uncollectability may arise in the settle-
ment process based on various objective criteria. These can be, for
example, the demise of the borrower without realisable assets of the
estate, or completed insolvency proceedings without further pro-
spect of payments. Secondly, loans are generally regarded as (par-
tially) uncollectible at the latest by 720 days after their due date, and
are (partially) written down to the recoverable amount within the
framework of existing loan loss provisions. Such a (partial) write-
down has no direct impact on ongoing debt collection measures.

54 Commerzbank Disclosure Report 2020
Calculation of the expected credit loss in accordance with
IFRS 9
Commerzbank calculates the LECL as the probability-weighted,
unbiased and discounted expected value of future loan losses over
the total residual maturity of the respective financial instrument,
i.e. the maximum contractual term (including any renewal options)
during which Commerzbank is exposed to credit risk. The 12-
month ECL used for the recognition of impairments in stage 1 is
the portion of the LECL that results from default events which are
expected to occur within twelve months following the end of the
reporting period.
The ECL for stage 1 and stage 2 as well as for insignificant fi-
nancial instruments in stage 3 is determined on an individual
transaction basis taking into account statistical risk parameters.
These parameters have been derived from the Basel IRB approach
and modified to meet the requirements of IFRS 9. The significant
main parameters used in this determination include the:
customer-specific probability of default (PD);
loss given default (LGD); and the
exposure at default (EaD).
The Group derives the PD by applying an internal ratings pro-
cedure, which is based on the respective customer group. The de-
termination includes a wide variety of qualitative and quantitative
variables, which are taken into account or weighted based on the
respective procedure. The allocation of the PD ranges to the inter-
nal rating categories and the reconciliation to external ratings can
be found in the master scale contained in the section rating pro-
cedures in this report.
The LGD is the forecasted loss given default as a percentage of
the exposure at default (EaD), taking into account collateral and
the capital recovery potential on the unsecured portion. The
Group’s estimates, which are made specifically for different types
of collateral and customer groups, are determined using both ob-
served historical portfolio data and diverse external information,
such as indices and data regarding the development of purchasing
power.
The EaD is the expected loan utilisation as at the default date,
taking into account a (partial) drawing of open lines.
All risk parameters used from the Bank’s internal models have
been adjusted to meet the specific requirements of IFRS 9, and the
forecast horizon has been extended accordingly to cover the entire
term of the financial instruments. For example, the forecast for the
development of the exposure over the entire term of the financial
instrument therefore also includes, in particular, contractual and
statutory termination rights.
In the case of loan products that consist of a utilised loan
amount and an open credit line and for which in customary com-
mercial practice the credit risk is not limited to the contractual
notice period (in Commerzbank this relates primarily to revolving
products without a contractually agreed repayment structure, such
as overdrafts and credit card facilities), the LECL must be deter-
mined using a behavioral maturity, which typically exceeds the
maximum contractual period. In order to ensure that the LECL for
these products is determined in an empirically sound manner in
compliance with IFRS 9 requirements, Commerzbank calculates
the LECL directly for these products based on realised historical
losses.
As a rule, the Group estimates the risk parameters specific to
IFRS 9 based not only on historical default information but also, in
particular, on the current economic environment (point-in-time
perspective) and forward-looking information. This assessment
primarily involves reviewing the effects which the Bank’s macroe-
conomic forecasts will have regarding the amount of the ECL, and
including these effects in the determination of the ECL.
A baseline scenario is used for this purpose which relies on the
respective applicable consensus (forecasts of different banks on
significant macroeconomic factors, such as GDP growth and the
unemployment rate). This baseline scenario is then supplemented
with additional macroeconomic parameters that are relevant for
the model. The transformation of the macroeconomic baseline
scenario into the effects on the risk parameters is based on statis-
tically derived models. If needed, these models are supplemented
with expert-based assumptions, the collection of which is regulat-
ed by a policy set by a panel. Potential effects from non-linear cor-
relations between different macroeconomic scenarios and the ECL
are corrected using a separately determined adjustment factor.
When calculating the expected credit loss, additional effects
may also have to be taken into account such as those resulting
from scenarios or events that are not reflected in the IFRS 9 ECL
parameter set presented as part of the modelling (these may relate
to singular events such as substantial political decisions or military
conflicts); for these a separately determined adjustment to the re-
sult from the IFRS 9 ECL model is made. The examination as to
whether such top level adjustments with the involvement of senior
management are necessary, as well as their possible implementa-
tion, are regulated in a policy.
In the 2020 financial year, such an adjustment of the IFRS 9
ECL model result was deemed necessary due to the Corona pan-
demic. The parameters used in the standard model reflected nei-
ther the economic impact of the global lockdowns nor the massive
support and assistance measures of the states and institutions. The
adequacy of the TLA was examined during the year at the report-
ing dates and during the preparation of the consolidated financial
statements as of December 31, 2020.
Determination of the ECL is documented in comprehensive
specialist and technical guidelines.
All parameters used when determining the ECL are regularly
validated by an independent unit (usually once a year). If needed,
they are adjusted accordingly. The relevant policies are reviewed
on an ad hoc basis.

Introduction Equity capital Risk-oriented overall bank management Specific risk management Appendix 55
A. Credit risk (CR)
Assessment of a significant increase in default risk
Commerzbank’s rating systems combine into the PD all available
quantitative and qualitative information relevant for forecasting
the default risk. This metric is based primarily on a statistical se-
lection and weighting of all available indicators. In addition, the
PD adjusted in accordance with IFRS 9 requirements takes into
account not only historical information and the current economic
environment, but also, in particular, forward-looking information
such as the forecast for the development of macroeconomic condi-
tions.
For this reason, Commerzbank uses the PD only as a frame of
reference for assessing whether the default risk of a financial in-
strument has risen significantly since the date of its initial recogni-
tion. By anchoring the review of the relative transfer criterion in
the robust processes and procedures of the Bank’s Group-wide
credit-risk-management framework (in particular, early identifica-
tion of credit risk, controlling of overdrafts and the re-rating pro-
cess), the Bank ensures that a significant increase in the default
risk is identified in a reliable and timely manner based on objec-
tive criteria. For further information on Commerzbank’s processes
and procedures as well as governance in credit risk management,
please refer to the explanatory information in the chapter “Credit
risk” in this report.
The review to determine whether the default risk as at the fi-
nancial reporting date has risen significantly since the initial
recognition of the respective financial instrument is performed as
at the end of the reporting period. This review compares the ob-
served probability of default over the residual maturity of the fi-
nancial instrument (lifetime PD) against the lifetime PD over the
same period as expected on the date of initial recognition. In ac-
cordance with IFRS requirements, in some sub-portfolios, the
original and current PD are compared based on the probability of
default over a period of 12 months after the end of the reporting
period (12-month PD). In these cases, the Bank uses equivalence
analyses to demonstrate that no material variances have occurred
compared with an assessment using the lifetime PD.
Thresholds are set using a statistical procedure in order to de-
termine whether an increase in the PD compared with the initial
recognition date is “significant”. These thresholds, which are dif-
ferentiated by rating models, represent a critical degree of vari-
ance compared with the average development of the PD. In order
to ensure an economically sound assignment of the stage, transac-
tion-specific factors are taken into account, including the extent of
the PD at the initial recognition date, the term to date and the re-
maining term of the transaction.
Financial instruments are retransferred from stage 2 to stage 1
if at the end of the reporting period the default risk is no longer
significantly elevated compared with the initial recognition date.
The tables on loan loss provisions below show the gross carry-
ing values of all risk positions in default and not in default in the
IFRS categories AC and FVOCI, including the associated stock of
credit risk adjustments, the credit risk adjustment charges in the
second half of 2020 and the relevant write-offs in the financial year
2020.
The gross carrying values for risk positions not in default also
include loans that are past due by at least one day up to 90 days
but are not defined as in default by virtue of the minimum thresh-
old (1.0% of the limit or €100 in the retail business and €500 in
the individual business).
Commerzbank’s criterion for the definition of defaulted (im-
paired) claims is the definition of a default in accordance with arti-
cle 178 CRR in connection with the corresponding EBA guideline
and ECB directive. Pursuant to section 315a.1 of the German
Commercial Code, Commerzbank Group issues consolidated finan-
cial statements based on International Financial Reporting Stand-
ards (IFRS). Credit risk mitigation techniques applicable to mitigate
risks for the purpose of determining the capital requirement are not
relevant for the determination of the claim amount in terms of
accounting. The information is structured by risk exposure class
(table EU CR1-A), industry (table EU CR1-B) and geography (table
EU CR1-C). The following definitions are used:
Pursuant to the criteria of the EBA (most recently confirmed in
EBA/OP/2017/02), specific credit risk adjustments include the
following positions:
- The sum of Lifetime Expected Credit Loss (LECL) for sig-
nificant claims in default, determined on the basis of indi-
vidual cash flow estimates, taking into account various
possible scenarios (loan loss provision stage 3 on-balance
and off-balance, significant).
- LECL for non-significant exposures in default, transaction-
based determined on the basis of statistical risk parame-
ters (stage 3 on balance and off balance, non-significant)
- LECL for on- and off-balance exposures not in default
showing a significant increase in credit risk as according
to IFRS9 (stage 2 on- and off-balance) and ECL for on- and
off-balance exposures not in default and not showing a
significant increase in credit risk as according to IFRS9
(stage 1 on- and off-balance).
There are no general credit risk adjustments pursuant to the
EBA’s definition mentioned above.
The column accumulated write-offs is the balance of write-ups
and write-downs during the financial year 2020.

56 Commerzbank Disclosure Report 2020
The country clusters selected in table EU CR1-C match the
classification by geographical area used for table EU CRB-C in
section overarching portfolio analyses of this report.
The gross carrying value of the defaulted risk positions is at
€4.9bn as at 31 December 2020. Further information on this is given
in the Annual Report 2020 in the chapter “Default risk” from
page 138. In addition to the loan loss provisions presented in the
tables, the gross carrying values are also offset by collateral, which
is taken into account accordingly in the calculation of the expected
credit loss (specific credit risk adjustments).
The breakdown by gross carrying values reflects the Commerz-
bank Group’s focus on Germany and selected markets throughout
Europe. This means that the vast majority of the expected credit
loss and the loan loss provisions, respectively, are attributable to
borrowers based in these regions.
The tables EU CR1-D to EU CR1-F fulfil the requirements from
the EBA guidelines published on 17th December 2018 on the dis-
closure of non-performing and forborne exposures (EBA/GL/
2018/10) and replace the former tables CR1-D and CR1-E. Deviat-
ing from tables EU CR1-A, EU CR1-B and EU CR1-C, they also in-
clude positions of the IFRS category FVPL.
Commerzbank does not display table 9 on foreclosed assets,
which is also required in the above-mentioned EBA guidelines, as
it currently has no foreclosed assets in stock.
The decrease in the line Loans and advances in the tables EU
CR1-D and EU CR1-F to €282bn (June 2020: €310bn) mainly re-
sults from a seasonal decline in the collateralised money market
business in terms of reversed repos and cash collaterals as well as
from a decrease of other loans.
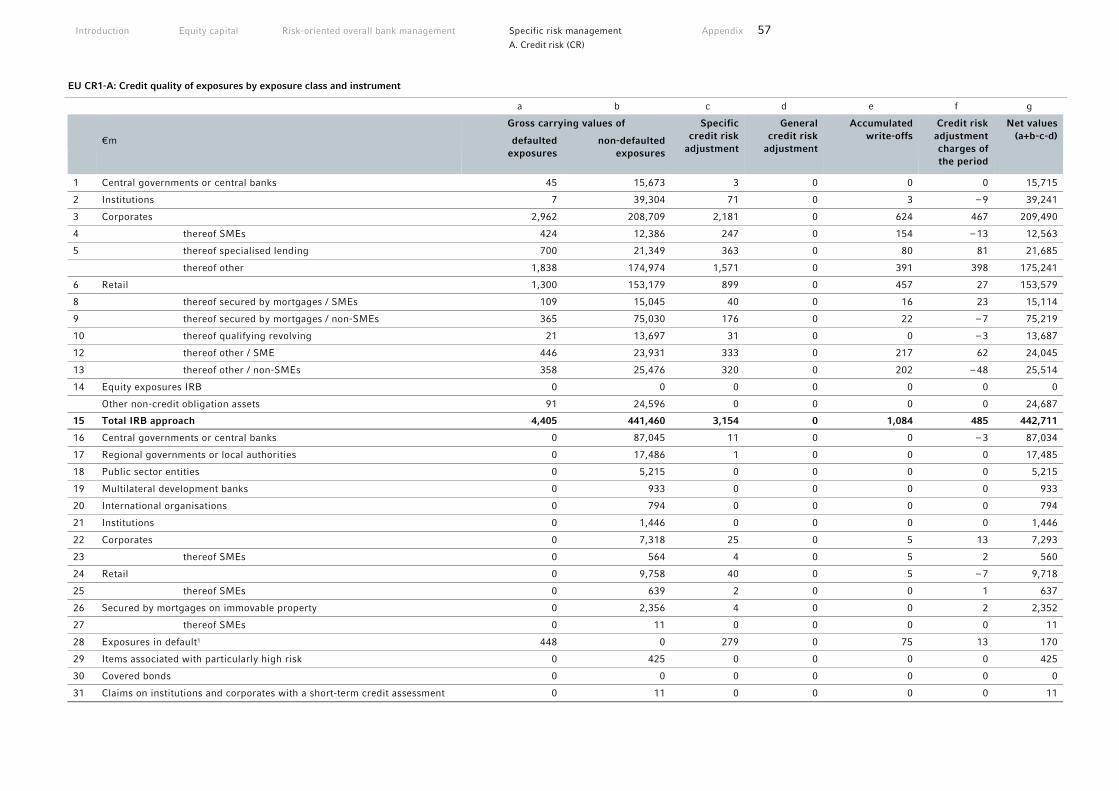
Introduction Equity capital Risk-oriented overall bank management Specific risk management Appendix 57
A. Credit risk (CR)
EU CR1-A: Credit quality of exposures by exposure class and instrument a b c d e f g
Gross carrying values of Specific credit risk
adjustment
General credit risk
adjustment
Accumulated write-offs
Credit risk adjustment charges of the period
Net values (a+b-c-d)
€m defaulted
exposures non-defaulted
exposures
1 Central governments or central banks 45 15,673 3 0 0 0 15,715
2 Institutions 7 39,304 71 0 3 – 9 39,241
3 Corporates 2,962 208,709 2,181 0 624 467 209,490
4 thereof SMEs 424 12,386 247 0 154 – 13 12,563
5 thereof specialised lending 700 21,349 363 0 80 81 21,685
thereof other 1,838 174,974 1,571 0 391 398 175,241
6 Retail 1,300 153,179 899 0 457 27 153,579
8 thereof secured by mortgages / SMEs 109 15,045 40 0 16 23 15,114
9 thereof secured by mortgages / non-SMEs 365 75,030 176 0 22 – 7 75,219
10 thereof qualifying revolving 21 13,697 31 0 0 – 3 13,687
12 thereof other / SME 446 23,931 333 0 217 62 24,045
13 thereof other / non-SMEs 358 25,476 320 0 202 – 48 25,514
14 Equity exposures IRB 0 0 0 0 0 0 0
Other non-credit obligation assets 91 24,596 0 0 0 0 24,687
15 Total IRB approach 4,405 441,460 3,154 0 1,084 485 442,711
16 Central governments or central banks 0 87,045 11 0 0 – 3 87,034
17 Regional governments or local authorities 0 17,486 1 0 0 0 17,485
18 Public sector entities 0 5,215 0 0 0 0 5,215
19 Multilateral development banks 0 933 0 0 0 0 933
20 International organisations 0 794 0 0 0 0 794
21 Institutions 0 1,446 0 0 0 0 1,446
22 Corporates 0 7,318 25 0 5 13 7,293
23 thereof SMEs 0 564 4 0 5 2 560
24 Retail 0 9,758 40 0 5 – 7 9,718
25 thereof SMEs 0 639 2 0 0 1 637
26 Secured by mortgages on immovable property 0 2,356 4 0 0 2 2,352
27 thereof SMEs 0 11 0 0 0 0 11
28 Exposures in default1 448 0 279 0 75 13 170
29 Items associated with particularly high risk 0 425 0 0 0 0 425
30 Covered bonds 0 0 0 0 0 0 0
31 Claims on institutions and corporates with a short-term credit assessment 0 11 0 0 0 0 11

58 Commerzbank Disclosure Report 2020
EU CR1-A_cont.: Credit quality of exposures by exposure class and instrument a b c d e f g
Gross carrying values of Specific credit risk
adjustment
General credit risk
adjustment
Accumulated write-offs
Credit risk adjustment charges of the period
Net values (a+b-c-d)
€m
defaulted exposures
non-defaulted exposures
32 Collective investment undertakings 0 2,341 0 0 0 0 2,341
33 Equity exposures 0 938 0 0 0 0 938
34 Other exposures 0 2,686 0 0 0 0 2,686
35 Total SACR 448 138,751 360 0 85 18 138,839
36 Total 4,853 580,212 3,514 0 1,169 502 581,551
37 of which loans 4,090 332,820 3,120 0 1,169 469 333,791
38 of which debt securities 0 49,567 24 0 0 – 3 49,543
39 of which off-balance-sheet exposures 343 39,563 134 0 0 8 39,772
1 According to EBA-Q&A_2017_3481, for the gross carrying values of the first column „a“ of exposures in default (in line 28) in application of Art. 112(j) CRR, the original asset class should be named in addition. To keep the consistency of the table in regard of totals formation under column „g: net values“ or in line 35 „Total SACR“, the required assignment is given below as follows:
The gross carrying values of the exposures in default (row 28) in SACR in the value of €448m with a value of €266m evolved from positions in the asset class „corporates“ (line 22) and with a value of €182m from the asset class „retail“ (line 24) in the SACR.
EU CR1-B: Credit quality of exposures by industry or counterparty types a b c d e f g
Gross carrying values of Specific credit risk adjustment
General credit risk
adjustment
Accumulated write-offs
Credit risk adjustment charges of the period
Net values (a+b-c-d)
€m
defaulted exposures
non-defaulted exposures
1 Production and manufactoring industry 1,667 105,723 825 0 356 9 106,565
2 Energy and water supply 16 23,226 21 0 16 – 1 23,221
3 Wholesale and retail trade; repairs 493 30,436 757 0 193 256 30,172
4 Transport and telecommunication 200 17,001 108 0 14 15 17,094
5 Other financial industry and insurances 178 33,942 283 0 174 115 33,836
6 Banks 46 56,600 78 0 3 – 7 56,568
7 Other financial industry and insurances 208 28,955 73 0 10 11 29,090
8 Real estate activities 924 35,675 520 0 169 112 36,078
9 Public administration and defence, compulsory social security 45 113,718 26 0 3 – 4 113,738
10 Private households 1,064 132,957 814 0 214 0 133,207
11 Others 13 1,977 8 0 16 – 3 1,982
12 Total 4,853 580,212 3,514 0 1,169 502 581,551

Introduction Equity capital Risk-oriented overall bank management Specific risk management Appendix 59
A. Credit risk (CR)
EU CR1-C: Credit quality of exposures by geography a b c d e f g
€m Gross carrying values of Specific credit risk
adjustment
General credit risk
adjustment
Accumulated write-offs
Credit risk adjustment charges of the period
Net values (a+b-c-d)
defaulted
exposures non-defaulted
exposures
1 Western Europe 3,375 458,242 2,347 0 1,036 511 459,270
2 thereof Germany 2,500 350,901 2,013 0 968 418 351,387
3 Switzerland 93 9,457 11 0 1 1 9,539
4 Great Britain 82 25,432 8 0 1 1 25,506
5 Italy 2 14,046 29 0 0 1 14,019
6 France 101 16,354 18 0 15 5 16,437
7 Netherlands 168 8,014 38 0 23 13 8,144
8 Spain 13 7,915 7 0 0 0 7,922
9 Others 416 26,122 223 0 27 73 26,316
10 Middle and Eastern Europe 1,169 53,736 946 0 127 – 13 53,959
11 thereof Poland 1,041 42,028 840 0 114 – 17 42,229
12 Others 128 11,708 106 0 13 4 11,731
13 North America 9 32,226 13 0 1 – 2 32,222
14 thereof USA 9 26,427 11 0 1 – 1 26,424
15 Others 0 5,799 1 0 0 – 1 5,798
16 Asia 148 24,894 154 0 1 3 24,888
17 thereof Japan 0 9,090 0 0 0 0 9,089
19 Others 148 15,804 153 0 1 3 15,799
20 Latin America (incl. Mexico) 82 5,946 31 0 4 7 5,997
21 Other regions 70 5,168 23 0 0 – 4 5,215
22 Total 4,853 580,212 3,514 0 1,169 502 581,551

60 Commerzbank Disclosure Report 2020
EU CR1-D: Ageing of past-due exposures
a b c d e f g h i j k l
Gross carrying values
Performing Portfolio Non-performing Portfolio
€m Of which performing or past due
≤30 days
Of which past due >30 days
and ≤90 days
Thereof repayment
unlikely and not past due or past due
≤90 days
Of which past due
>90 days and ≤180 days
Of which past
due >180 days and
≤1 year
Of which past
due >1 year and ≤2 years
Of which past
due >2 year and ≤5 years
Of which past due >5 year and ≤7
years
Of which past due >7
years
Of which defaulted
1 Loans and advances 281,648 281,407 241 4,466 1,979 189 898 569 546 113 172 4,415
2 Central banks 5,609 5,609 0 0 0 0 0 0 0 0 0 0
3 Central governments 16,733 16,733 0 45 8 0 37 0 0 0 0 45
4 Credit institutions 27,191 27,191 0 7 1 0 0 0 2 2 2 7
5 Other financial corporations 26,254 26,237 17 13 8 4
0 0 1 0 0 13
6 Non-financial corporations 88,139 88,039 99 3,228 1,606 100
712 302 303 71 132 3,220
7 thereof SMEs 23,856 23,807 48 966 389 51 91 180 140 29 86 958
8 Households 117,723 117,598 125 1,173 355 84 149 266 240 40 38 1,130
9 Debt securities 80,281 80,281 0 0 0 0 0 0 0 0 0 0
10 Central banks 0 0 0 0 0 0 0 0 0 0 0 0
11 Central governments 40,294 40,294 0 0 0 0 0 0 0 0 0 0
12 Credit institutions 17,875 17,875 0 0 0 0 0 0 0 0 0 0
13 Other financial corporations 15,015 15,015 0 0 0 0
0 0 0 0 0 0
14 Non-financial corporations 7,097 7,097 0 0 0 0
0 0 0 0 0 0
15 Off-balance-sheet exposures 187,453 585 585
16 Central banks 0 0 0
17 Central governments 1,427 0 0
18 Credit institutions 8,248 0 0
19 Other financial corporations 9,314 0
0
20 Non-financial corporations 135,384 566
566
21 Households 33,079 19 19
22 Total exposure1 615,710 428,015 241 5,051 1,979 189 898 569 546 113 172 5,000
1 This includes about €66bn Central bank balances and sight deposits (columns a and b).

Introduction Equity capital Risk-oriented overall bank management Specific risk management Appendix 61
A. Credit risk (CR)
EU CR1-E: Non-performing and forborne exposures
a b c d e f g h
Gross carrying value of positions with forbearance measures
Accumulated impairment, accumulated negative changes in fair
value due to credit risk and provisions
Collaterals and financial guarantees received on
forborne exposures
Performing Portfolio
Non-performing Portfolio On performing exposures with
forbearance measures
On non-performing
exposures with forbearance
measures
Of which colla-
teral and financial
guarantees received
on non-performing
exposures with for-
bearance measures
€m
Of which defaulted
Of which impaired
1 Loans and advances 2,020 1,585 1,535 1,406 – 50 – 684 1,032 443
2 Central banks 0 0 0 0 0 0 0 0
3 Central governments 0 37 37 37 0 – 1 36 36
4 Credit institutions 2 0 0 0 0 0 1 0
5 Other financial corporations
2 12 12 12 0 – 5 3 1
6 Non-financial corporations 1,660 1,229 1,222 1,095 – 42 – 590 685 277
7 Households 356 306 264 262 – 8 – 89 307 129
8 Debt securities 0 0 0 0 0 0 0 0
9 Loan commitments given 496 188 188 188 – 9 – 41 27 3
10 Total exposure 2,516 1,772 1,722 1,593 – 59 – 726 1,059 446

62 Commerzbank Disclosure Report 2020
EU CR1-F: Performing and non-performing exposures and related provisions
a b c d e f g h i j k l m n o
Gross carrying amount / nominal amount Accumulated impairment, accumulated negative changes in fair value due to credit risk and provisions
Accu-mulated
partial write-
offs
Collaterals and financial guarantees received
Performing Portfolio Non-performing Portfolio Performing Portfolio - accumulated
impairment and provisions
Non-performing exposures - accumulated
impairment, accumulated negative changes in fair value
due to credit risk and provisions
On performing exposures
On non-performing exposures
€m
thereof Stage 1
thereof Stage 2
thereof Stage 2
thereof Stage 3
thereof Stage 1
thereof Stage 2
thereof Stage 2
thereof Stage 3
1 Loans and advances 281,648 268,382 13,265 4,466 0 4,466 929 246 684 2,242 0 2,242 560 132,599 973
2 Central banks 5,609 5,609 0 0 0 0 0 0 0 0 0 0 0 5,289 0
3 Central governments 16,733 16,604 128 45 0 45 2 1 1 1 0 1 0 629 44
4 Credit institutions 27,191 26,319 872 7 0 7 23 13 10 2 0 2 0 9,593 2
5 Other financial corporations
26,254 25,796 457 13 0 13 8 6 2 13 0 13 3 14,671 1
6 Non-financial corporations
88,139 82,058 6,081 3,228 0 3,228 541 144 398 1,714 0 1,714 391 31,989 567
7 thereof SMEs 23,856 21,680 2,176 966 0 966 145 50 95 477 0 477 190 10,582 208
8 Households 117,723 111,997 5,727 1,173 0 1,173 354 82 273 512 0 512 165 70,428 360
9 Debt securities 80,281 79,699 582 0 0 0 56 36 21 0 0 0 0 0 0
10 Central banks 0 0 0 0 0 0 0 0 0 0 0 0 0 0 0
11 Central governments 40,294 39,737 558 0 0 0 43 23 20 0 0 0 0 0 0
12 Credit institutions 17,875 17,875 0 0 0 0 3 3 0 0 0 0 0 0 0
13 Other financial corporations
15,015 15,015 0 0 0 0 2 2 0 0 0 0 0 0 0
14 Non-financial corporations
7,097 7,072 25 0 0 0 8 7 0 0 0 0 0 0 0
15 Off-balance-sheet exposures 187,453 183,313 4,140 585 0 585 340 163 177 159 0 159 10,207 83
16 Central banks 0 0 0 0 0 0 0 0 0 0 0 0 359 0
17 Central governments 1,427 1,321 106 0 0 0 0 0 0 0 0 0 385 0
18 Credit institutions 8,248 8,226 23 0 0 0 40 40 0 0 0 0 2,130 0
19 Other financial corporations
9,314 9,119 196 0 0 0 5 2 3 0 0 0 292 0
20 Non-financial corporations
135,384 132,232 3,152 566 0 566 245 100 146 155 0 155 5,517 81
21 Households 33,079 32,415 664 19 0 19 49 21 28 4 0 4 1,524 2
22 Total exposure1 615,710 597,721 17,988 5,051 0 5,051 1,326 445 881 2,401 0 2,401 560 142,806 1,056
1 This includes about €66bn Central bank balances and sight deposits (columns a and b).
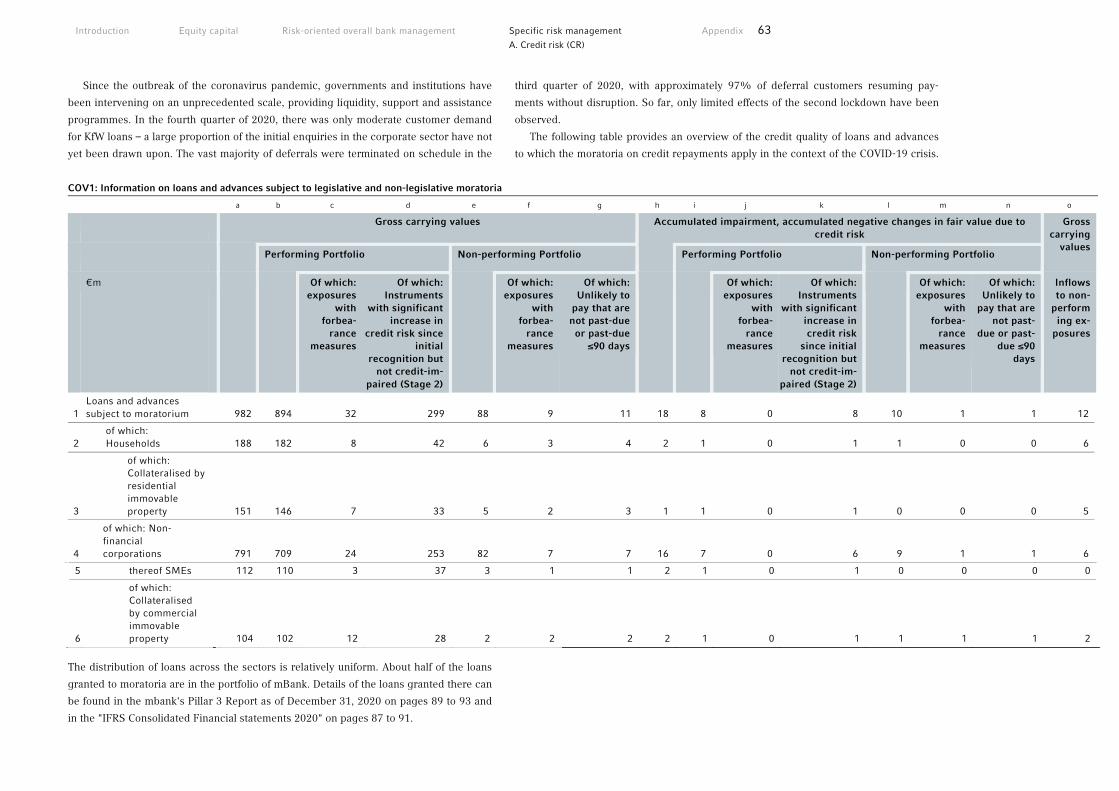
Introduction Equity capital Risk-oriented overall bank management Specific risk management Appendix 63
A. Credit risk (CR)
Since the outbreak of the coronavirus pandemic, governments and institutions have
been intervening on an unprecedented scale, providing liquidity, support and assistance
programmes. In the fourth quarter of 2020, there was only moderate customer demand
for KfW loans – a large proportion of the initial enquiries in the corporate sector have not
yet been drawn upon. The vast majority of deferrals were terminated on schedule in the
third quarter of 2020, with approximately 97% of deferral customers resuming pay-
ments without disruption. So far, only limited effects of the second lockdown have been
observed.
The following table provides an overview of the credit quality of loans and advances
to which the moratoria on credit repayments apply in the context of the COVID-19 crisis.
COV1: Information on loans and advances subject to legislative and non-legislative moratoria a b c d e f g h i j k l m n o
Gross carrying values Accumulated impairment, accumulated negative changes in fair value due to credit risk
Gross carrying
values
Performing Portfolio Non-performing Portfolio Performing Portfolio Non-performing Portfolio
€m Of which: exposures
with forbea-
rance measures
Of which: Instruments
with significant increase in
credit risk since initial
recognition but not credit-im-
paired (Stage 2)
Of which: exposures
with forbea-
rance measures
Of which: Unlikely to
pay that are not past-due
or past-due ≤90 days
Of which: exposures
with forbea-
rance measures
Of which: Instruments
with significant increase in credit risk
since initial recognition but
not credit-im-paired (Stage 2)
Of which: exposures
with forbea-
rance measures
Of which: Unlikely to
pay that are not past-
due or past-due ≤90
days
Inflows to non-
performing ex-
posures
1 Loans and advances subject to moratorium 982 894 32 299 88 9 11 18 8 0 8 10 1 1 12
2 of which: Households 188 182 8 42 6 3 4 2 1 0 1 1 0 0 6
3
of which: Collateralised by residential immovable property 151 146 7 33 5 2 3 1 1 0 1 0 0 0 5
4
of which: Non-financial corporations 791 709 24 253 82 7 7 16 7 0 6 9 1 1 6
5 thereof SMEs 112 110 3 37 3 1 1 2 1 0 1 0 0 0 0
6
of which: Collateralised by commercial immovable property 104 102 12 28 2 2 2 2 1 0 1 1 1 1 2
The distribution of loans across the sectors is relatively uniform. About half of the loans
granted to moratoria are in the portfolio of mBank. Details of the loans granted there can
be found in the mbank's Pillar 3 Report as of December 31, 2020 on pages 89 to 93 and
in the "IFRS Consolidated Financial statements 2020" on pages 87 to 91.

64 Commerzbank Disclosure Report 2020
Against the background of the Corona pandemic, the risk result of the Commerzbank
Group increased significantly. As of 31 December 2020, Corona generated €961m of the
risk result, of which €505m in the form of a top-level adjustment. For detailed infor-
mation, see Note 32 in the notes and pages 138 et seq. in the risk report of the Commerz-
bank Annual Report as of 31 December 2020.
The following table shows the breakdown of loans and advances by residual maturity
of the moratorium, which is subject to a legislative and non- legislative moratorium. The
following table shows the breakdown of loans and loans by the remaining term of the
moratoria subject to a legal and non-legal moratorium. In private customers, requests for
rate loans remain unchanged, with no corona-related increase. Among corporate cus-
tomers, the transport sector (including tourism) is most affected.
COV2: Breakdown of loans and advances subject to legislative and non-legislative moratoria by residual maturity of moratoria a b c d e f g h i
Number of
obligors
Gross carrying values
Of which: legislative moratoria
Of which: expired
Residual maturity of moratoria
≤3 months >3 months ≤6 months
>6 months ≤9 months
>9 months ≤12 months
>1 year
1 Loans and advances for which moratorium was offered 103,938 7,782
2 Loans and advances subject to moratorium (granted) 102,781 7,340 492 6,357 746 229 0 6 2
3 of which: Households 4,199 305 4,011 182 5 0 0 2
4 of which: Collateralised by residential immovable property 3,283 255 3,132 145 4 0 0 2
5 of which: Non-financial corporations 3,137 184 2,346 561 224 0 6 0
6 thereof SMEs 1,411 31 1,299 81 31 0 0 0
7 of which: Collateralised by commercial immovable property 1,261 70 1,157 103 1 0 0 0
As can be seen from the table below, almost €2,6bn of new loans were granted,
which are subject to a public guarantee scheme. More than 90% of these were allocated
to corporate customers. About 1% of the new loans are non-performing in line with the
EBA definition. In most cases, the terms of the new loans and advances are between two
and five years. The most affected industries are manufacturing, wholesale and retail.
COV3: Information on newly originated loans and advances provided under newly applicable public guarantee schemes introduced in response to COVID-19 crisis a b c d
Gross carrying values Maximum amount of the guarantee that can be considered
Gross carrying values
€m of which: forborne
Public guarantees received Inflows to non-performing exposures
1 Newly originated loans and advances subject to public guarantee schemes 2,640 51 1,679 27
2 of which: Households 168 0
3 of which: Collateralised by residential immovable property 4 0
4 of which: Non-financial corporations 2,467 50 1,660 27
5 thereof SMEs 1,070 3
6 of which: Collateralised by commercial immovable property 190 8
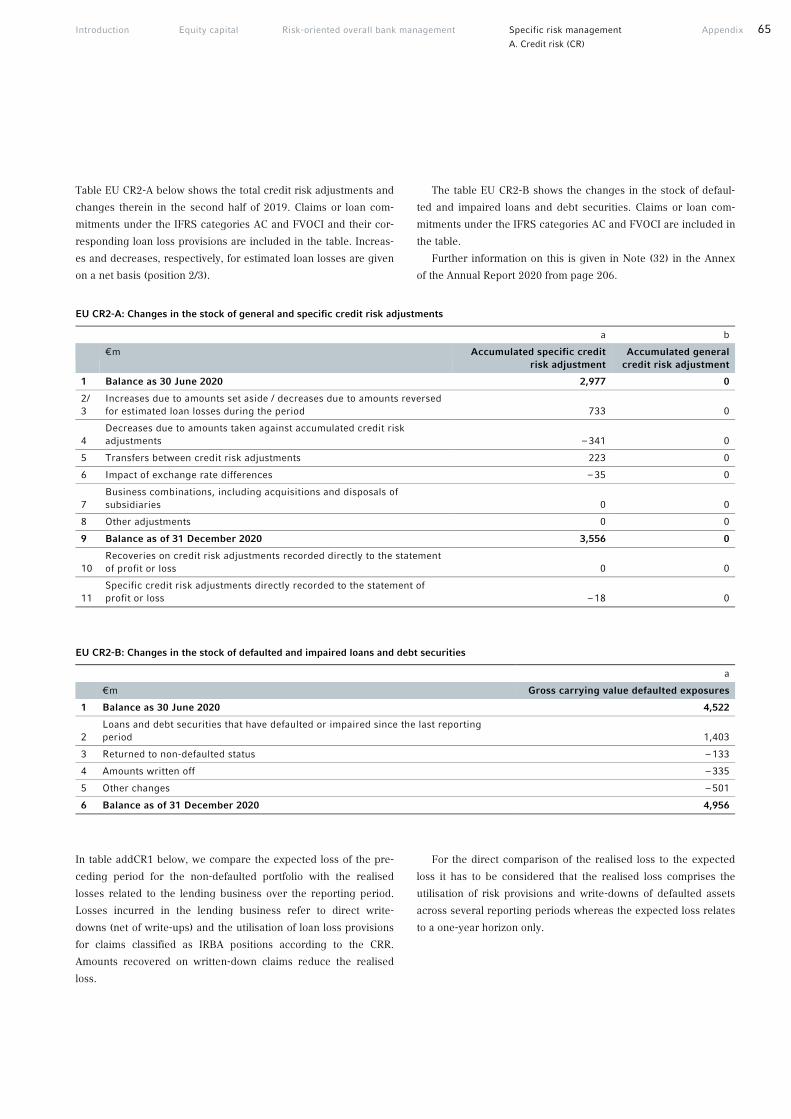
Introduction Equity capital Risk-oriented overall bank management Specific risk management Appendix 65
A. Credit risk (CR)
Table EU CR2-A below shows the total credit risk adjustments and
changes therein in the second half of 2019. Claims or loan com-
mitments under the IFRS categories AC and FVOCI and their cor-
responding loan loss provisions are included in the table. Increas-
es and decreases, respectively, for estimated loan losses are given
on a net basis (position 2/3).
The table EU CR2-B shows the changes in the stock of defaul-
ted and impaired loans and debt securities. Claims or loan com-
mitments under the IFRS categories AC and FVOCI are included in
the table.
Further information on this is given in Note (32) in the Annex
of the Annual Report 2020 from page 206.
EU CR2-A: Changes in the stock of general and specific credit risk adjustments a b
€m Accumulated specific credit risk adjustment
Accumulated general credit risk adjustment
1 Balance as 30 June 2020 2,977 0
2/3
Increases due to amounts set aside / decreases due to amounts reversed for estimated loan losses during the period 733 0
4 Decreases due to amounts taken against accumulated credit risk adjustments – 341 0
5 Transfers between credit risk adjustments 223 0
6 Impact of exchange rate differences – 35 0
7 Business combinations, including acquisitions and disposals of subsidiaries 0 0
8 Other adjustments 0 0
9 Balance as of 31 December 2020 3,556 0
10 Recoveries on credit risk adjustments recorded directly to the statement of profit or loss 0 0
11 Specific credit risk adjustments directly recorded to the statement of profit or loss – 18 0
EU CR2-B: Changes in the stock of defaulted and impaired loans and debt securities a
€m Gross carrying value defaulted exposures
1 Balance as 30 June 2020 4,522
2 Loans and debt securities that have defaulted or impaired since the last reporting period 1,403
3 Returned to non-defaulted status – 133
4 Amounts written off – 335
5 Other changes – 501
6 Balance as of 31 December 2020 4,956
In table addCR1 below, we compare the expected loss of the pre-
ceding period for the non-defaulted portfolio with the realised
losses related to the lending business over the reporting period.
Losses incurred in the lending business refer to direct write-
downs (net of write-ups) and the utilisation of loan loss provisions
for claims classified as IRBA positions according to the CRR.
Amounts recovered on written-down claims reduce the realised
loss.
For the direct comparison of the realised loss to the expected
loss it has to be considered that the realised loss comprises the
utilisation of risk provisions and write-downs of defaulted assets
across several reporting periods whereas the expected loss relates
to a one-year horizon only.

66 Commerzbank Disclosure Report 2020
Table addCR2 shows the realised losses related to the lending
business over the last five years in detail by exposure class.
The significant reduction in 2018 in realised losses compared to
prior years is mainly due to the reclassification of the shipping
portfolio to the fair-value approach as part of the transition to
IFRS 9 in 2018. However, the expected loss as at year-end 2017
still includes ship financings.
addCR1: Expected and realised losses in the lending business since 2017 Exposure class €m
Expected loss as at 31.12.2019
Realised loss 2020
Expected loss as at 31.12.2018
Realised loss 2019
Expected loss as at 31.12.2017
Realised loss 2018
Central governments or central banks 22 0 30 0 30 6
Institutions 70 0 91 – 19 91 8
Corporates 463 394 444 318 515 325
thereof SMEs 79 22 70 8 70 – 24
thereof specialised lending 110 12 121 105 192 65
thereof other 274 360 254 204 254 284
Retail 312 188 279 192 279 242
thereof SMEs 93 96 85 64 85 78
thereof secured by mortgages 73 11 65 20 65 39
thereof qualifying revolving 22 0 21 0 21 1
thereof other 123 81 108 107 108 125
Total 866 582 844 490 915 581
addCR2: Development of realised losses in the lending business since 2015 Exposure class €m
31.12.2020 31.12.2019 31.12.2018 31.12.2017 31.12.2016
Central governments or central banks 0 0 6 0 0
Institutions 0 – 19 8 3 13
Corporates 394 318 325 843 854
thereof SMEs 22 8 – 24 55 54
thereof specialised lending 12 105 65 554 535
thereof other 360 204 284 234 265
Retail 188 192 242 303 162
thereof SMEs 96 64 78 116 143
thereof secured by mortgages 11 20 39 32 17
thereof qualifying revolving 0 0 1 7 2
thereof other 81 107 125 148 0
Total 582 490 581 1,150 1,029
Unlike in the Annual Report, the expected loss amounts reported
in this Disclosure Report do not include SACR or securitisation
positions. Also, due to the change to SACR (permanent partial use
pursuant to Article 150 CRR) in 2009, the asset class Investments
is not shown here.

Introduction Equity capital Risk-oriented overall bank management Specific risk management Appendix 67
A. Credit risk (CR)
Investments in the banking book
Investment risks or shareholder risks are potential losses arising
from the provision of equity capital to investments as a result of a
fall in their value. They can be caused by general market fluctua-
tions or company-specific factors.
Composition of investments
Commerzbank’s portfolio of holdings is broken down in accord-
ance with its significance to business policy. The bulk of the in-
vestments held as financial assets (banking book) and holdings in
consolidated companies are designed to further the Bank’s busi-
ness objectives by supporting business lines/segments in the Bank
(segment-supporting investments) or by having a strategic man-
agement or service function for the Group as a whole (other stra-
tegic investments).
There are also other non-strategic investments where a divest-
ment concept is applied, the aim of which is to optimise Commerz-
bank’s market value, capital and income statement under appro-
priate market conditions.
Risk management
The investment risks are managed centrally as part of the ongoing
management and monitoring of Commerzbank’s holdings by the
Group Finance department and locally by the segments. The stra-
tegic investments are mainly majority holdings.
Under the “three lines of defence” principle, aimed at protect-
ing against undesirable risks and set out by Commerzbank in the
Group Risk Strategy, the respective operational segments respon-
sible therefore represent the first line of defence for investment
risks, while Group Finance, as the area responsible for the invest-
ment risk strategy, represents the second line of defence.
Regulatory valuation of investments
The Commerzbank Group and accordingly the group companies
included in the disclosure are, as IRBA banks as defined in Arti-
cle 147 CRR, generally obliged to value investments in accordance
with the IRBA rules. The CRR also allows items to be permanently
exempted from the IRBA. Commerzbank applies Article 150 CRR
and values all investment positions using the permanent partial
use of the SACR, if the individual equity position is not measured
in the SACR anyway. Investments that are associated with particu-
larly high risk according to the definition under Article 128 CRR,
such as private equity investments or venture capital investments,
are recognised in the corresponding SACR asset class.
Commercial valuation and accounting
As a rule, equity instruments that are not valued using the equity
method are reported at fair value. A valuation that differs from fair
value can only be justified by the principle of materiality.
Listed investments are continuously monitored with regard to
their market price development. External analysts’ opinions and
share price forecasts (consensus forecasts) are included in the risk
assessment. Listed holdings are monitored by means of impairment
tests carried out monthly by Management Investments Accounting
in accordance with the HGB accounting manual of Commerzbank
and tested for any significant qualitative or quantitative indicators
(trigger events) of impairment. As soon as there are any indications
of significant or lasting impairment, unrealised losses are written
down.
Risks arising from unlisted investments are subject to regular
monitoring involving a database-supported year-end valuation, a
monitoring of trigger events for relevant holdings to each balance
sheet reporting date and special monitoring of investments classi-
fied as critical. Various valuation methods (e.g. capitalised earnings
value, net asset value, liquidation value) are used to quantify the
risks, depending on the book value, status (e.g. active, inactive, in
liquidation) and type of business activity (e.g. operational, property
holding company, holding) of the investment. If the intention is to
sell the investment, it will be written down, if necessary, to a lower
expected selling price. For companies valued using the equity
method, the valuation is equal to the proportionate IFRS equity
capital.
Quantitative information on investments
This section covers investments as defined in Article 112 p) CRR.
This means that only equity investments that are not consolidated
for regulatory purposes but relate to the companies covered by
this report are shown. The definition of an investment in CRR is
wider than the usual accounting definition. For example, shares in
limited companies (GmbHs), profit-sharing certificates with equity
characteristics, promissory notes and derivative positions whose
underlying is an investment position have to be classified as in-
vestments for regulatory purposes. Classical forms of investments
nevertheless make up the majority of this CRR asset class.

68 Commerzbank Disclosure Report 2020
The table below shows the book value and fair value of the invest-
ment instruments under IFRS as reported in the financial state-
ments for the investment groups relevant to the Group’s objectives
and strategy.
INV1: Valuation of investment instruments Book value
(IFRS) Fair value Market value
(listed positions)
Investment group | €m 2020 2019 2020 2019 2020 2019
Segment-supporting investments 524 225 524 225 6 8
thereof listed positions 6 8 6 8 6 8
thereof unlisted positions 518 217 518 217 0 0
Other strategic investments 48 46 48 46 0 0
Other investments 366 407 366 407 0 0
Investments total 938 678 938 678 6 8
For listed positions the market value is given as well. For listed
investments the book value under IFRS is their historic costs.
For unlisted companies the book values under IFRS are used as
fair value. Special purpose vehicles (SPVs) are not shown as they
are not investments pursuant to regulatory definitions. The posi-
tions shown under Other strategic investments are exclusively un-
listed positions. Only €0.2m of the Other investments are listed
positions. All unlisted positions are classified as adequately diver-
sified investment portfolios.
Shares in investment funds are allocated to the investment
group Funds and certificates if the precise composition of the in-
vestment fund is not known and an average risk weighting sup-
plied by the investment company is not used for capital adequacy
purposes. Only shares in investment funds that invest wholly or
partly in investment instruments are relevant. Therefore, shares in
investment funds that are solely invested in fixed-income securi-
ties (e.g. bond funds) are not included here.
Table INV2 below shows realised and unrealised profits and
losses from investment instruments.
INV2: Realised and unrealised profits/losses from investment instruments Measured at equity Not measured at equity
€m Realised profits and losses from sale / liquidation of
equity holdings
Revaluation gains and losses (FVOCI) and valuation profits and losses (P&L) from equity holdings
Profits and losses from equity instruments without the trading
book
Revaluation gains and losses (FVOCI)
from equity instruments
2020 0 2 282 0
The application of IFRS 9 led to changes in the classification and
valuation of equity instruments.
As equity instruments do not result in any fixed repayments and
are only associated with a share right, the SPPI (solely payment of
principal and interest) criterion is not met. AC or FVOCI with a re-
cycling valuation is therefore excluded.
However, when an equity instrument is added which was pur-
chased as a conditional purchase price payment with trading intent
or else within the scope of a company acquisition, an irrevocable
decision may be made to value it in accordance with FVOCI, in-
stead of FVPL, without the recycling method. All value fluctuations
are reported as equity capital and not reported on the income
statement even in case of the disposal of the financial instrument
(without recycling). We have applied this option and have assigned
a portfolio to this group.
.

Introduction Equity capital Risk-oriented overall bank management Specific risk management Appendix 69
B. Counterparty credit risk (CCR)
Risk management
Counterparty credit risk (default risk from counterparty default
risk) is defined as the risk of losses sustained or profits foregone
due to the default of a counterparty in the context of a derivative
or securities financing transaction. In addition to market price
risks, derivative positions also give rise to default risks when a
claim arises against the counterparty in the form of positive mar-
ket values.
Commerzbank also looks at what is known as correlation risk
(wrong way risk). This occurs when a counterparty’s exposure and
credit quality (rating) are negatively correlated. Wrong way risk is
therefore an additional risk source, as the credit exposure is gen-
erally measured independently from the counterparty’s creditwor-
thiness. Commerzbank has a clear definition of specific and gen-
eral wrong way risk. There are guidelines to assist in identifying
and quantifying wrong way risk. They also set out how the expo-
sure must be adjusted to allow for the wrong way risk. In the case
of secured transactions, the potential relationship between the
performance of the collateral and the credit rating of the counter-
party also has to be considered and captured according to the
Commerzbank collateral matrix.1
The derivative positions shown in the tables below do not in-
clude securitisation positions as defined in the CRR as these are
shown in the securitisations chapter. This means that interest rate
and currency swaps or credit derivative transactions entered into
with special-purpose securitisation companies are not included.
Risk appetite is operationally structured in the Group Risk Strat-
egy through a consistent management system with limits, bench-
marks for risk strategy positioning and supplementary guidelines.
The specific risk appetite for the lending business is derived from
this and structured further in the credit risk strategy. The risk strat-
egy focus of the credit risk strategy thus adopts the cross-segment
benchmarks of the Group Risk Strategy that are relevant for the
default risk and specifies them specifically for the lending business
of the individual segments. Furthermore, the limit concept of the
Group Risk Strategy is supplemented by quantitative guidelines to
limit risk concentrations and weaker credit ratings. Downstream
policies operationalise the risk appetite at the level of selected sub-
portfolios.
In order to minimise both the economic and the regulatory cred-
it risk arising from these instruments, Commerzbank enters into
master agreements (bilateral netting agreements) such as the 2002
ISDA Master Agreement or the German Master Agreement for Fi-
nancial Futures with the respective counterparties. By means of
such bilateral netting agreements, the positive and negative market
values of the derivatives contracts included under a master agree-
ment can be offset against one another, and the regulatory add-ons
for future risks of these products can be reduced. This netting pro-
cess reduces the credit risk to a single net claim on the contracting
party (close-out netting). Table EU CCR5-A contains a detailed
presentation of netting effects. The netting policy sets out the re-
quirements for the external and internal netting of derivatives and
repo transactions. For repo/lending transactions Commerzbank
makes a distinction between “full netting” and “single transaction
netting”. Single transaction netting allows the netting of exposure
and collateral in one transaction, while in full netting all transac-
tions can be netted against each other.
For both regulatory reports and the internal measurement and
monitoring of credit exposures, these risk-mitigating techniques
are only used if Commerzbank considers them enforceable in the
jurisdiction in question, should the counterparty become insolvent.
Legal opinions are obtained from various international law firms in
order to verify enforceability.
Similar to the master agreements are the collateral agreements
(e.g. collateralisation annex for financial futures contracts, Credit
Support Annex), which Commerzbank concludes with its business
partners to secure the net claim or liability remaining after netting
(receipt or provision of collateral). As a rule, this collateral man-
agement reduces credit risk by means of prompt, usually daily or
weekly, measurement and adjustment of the customer exposure.
B. Counterparty credit risk (CCR)
1 Although in a regulatory context wrong way risk is normally mentioned in connection with counterparty risk, Commerzbank alsoconsiders it in connection with issuer risk (e.g. between the issuer of a bond and the guarantor).

70 Commerzbank Disclosure Report 2020
Commerzbank only uses cash and securities pledged as collat-
eral under master agreements. Table EU CCR5-B gives a detailed
list of collateral provided and received.
Regulations for risk mitigation measures are stipulated by the
“Guideline for Collateralized Trading”. The guideline covers legal
aspects such as types of master agreements and the enforceability
of netting transactions and collateral under master agreements. It
describes the requirements governing the netting of collateral and
the structuring of Credit Support Annexes.
The basis for determining the netting amounts for the default
risk from derivative positions is not the positive market values but
instead the so-called credit equivalent values. To determine the
assessment basis of derivative default risk positions, Commerz-
bank uses the internal model method (IMM) pursuant to Article
283 ff. CRR and the market valuation method pursuant to Article
274 CRR.
The approach to risk quantification under the IMM is generally
based on a risk simulation which generates future market scenari-
os and creates portfolio valuations based on these scenarios. Net-
ting and collateral agreements are taken into account.
In applying the internal model method, the EaD is defined per
counterparty as the product of the alpha factor and the calculat-
ed effective expected positive exposure E*. Risks that are not tak-
en into account when determining E*, correlation risks for exam-
ple, are included in the capital adequacy calculation through the
alpha factor. Banks can either estimate the alpha factor themselves
or use the supervisory value of 1.4. Commerzbank does not esti-
mate its own alpha factor, preferring instead to use the supervisory
value to calculate exposure at default.
The credit equivalent values for the counterparty default risk
from derivative positions and securities financing transactions –
including exchange-traded derivatives – used to determine the
(net) assessment basis amounted to €3,027m at the end of 2020
using the market valuation method and €15,531m using the inter-
nal model method (see table EU CCR1 – Analysis of counterparty
credit risk by approach). The proportion of derivatives and securi-
ties financing transactions processed via central counterparties
measured by EaD according to credit risk mitigation techniques
was 9% as at the end of the year (see table EU CCR8 – Exposures
to central counterparties (CCP). Table EU CCR4 provides an over-
view of the risk positions managed under the AIRB approach by
exposure class and PD scale.
Credit equivalent values effectively correspond to the risk posi-
tion values of balance-sheet default risk positions, as a credit con-
version factor of 100% is applied to derivative positions.
All operative units, branches and subsidiaries are, subject to
compliance with the regulations, authorised to use credit deriva-
tives to hedge credit risks in loan portfolios (i.e. purchase of hedg-
es). This allows them to hedge credit risks with a credit derivative
without having to sell or assign the loan. A detailed list of credit
derivatives can be found in table EU CCR6 – Credit derivatives ex-
posures.
Commerzbank creates credit reserves (credit valuation adjust-
ments, CVA) for derivatives, securities financing transactions and
money market transactions reported at fair value in order to
account for the counterparty’s expected default risk. The offsetting
of credit reserves compensates for the fair values of the transac-
tion calculated on the basis of risk-free parameters. The CVA are
determined by the sum of the discounted expected exposures until
the end of the contract period of the transaction, weighted by the
marginal probability of default of the counterparty and in consid-
eration of the expected loss upon default of the counterparty. In
order to calculate the expected exposure, Commerzbank uses a
Monte Carlo simulation based on a risk-neutral calibration.
As part of the regulatory requirements under Basel 3, since
2015 the Commerzbank Group has additionally calculated the cap-
ital requirements for credit value adjustments (CVA risk) accord-
ing to Article 381 ff. CRR. For the portfolios of Commerzbank Ak-
tiengesellschaft, CVA risk is calculated using the advanced method
according to Article 383 CRR via a sensitivity-based approach. For
the Group’s subsidiaries, the standardised approach according to
Article 384 CRR is applied. As at 31 December 2020 there were
eligible hedges under Article 386 CRR: Single name CDS of
€397m. The capital requirements for CVA risk amounted to
€285m (€3,561m RWA, see table EU CCR2 – CVA capital charge)
as at 31 December 2020 for the Group.
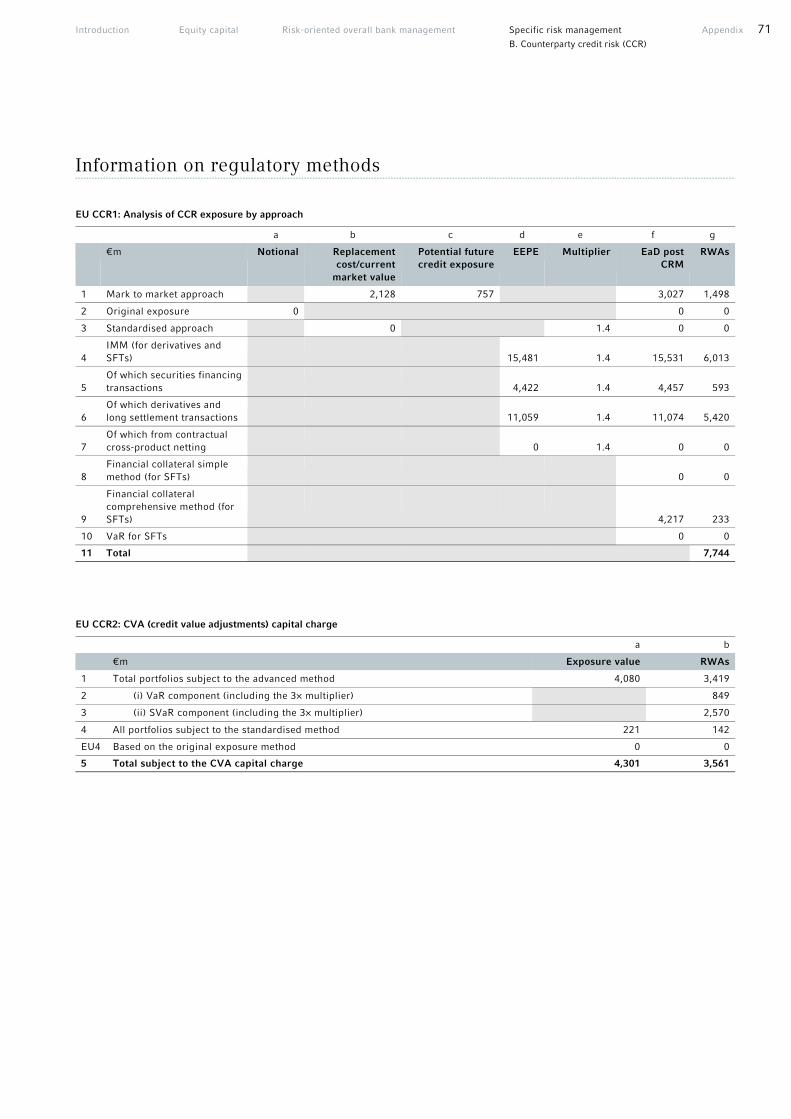
Introduction Equity capital Risk-oriented overall bank management Specific risk management Appendix 71
B. Counterparty credit risk (CCR)
Information on regulatory methods
EU CCR1: Analysis of CCR exposure by approach a b c d e f g
€m Notional Replacement cost/current
market value
Potential future credit exposure
EEPE Multiplier EaD post CRM
RWAs
1 Mark to market approach 2,128 757 3,027 1,498
2 Original exposure 0 0 0
3 Standardised approach 0 1.4 0 0
4 IMM (for derivatives and SFTs) 15,481 1.4 15,531 6,013
5 Of which securities financing transactions 4,422 1.4 4,457 593
6 Of which derivatives and long settlement transactions 11,059 1.4 11,074 5,420
7 Of which from contractual cross-product netting 0 1.4 0 0
8 Financial collateral simple method (for SFTs) 0 0
9
Financial collateral comprehensive method (for SFTs) 4,217 233
10 VaR for SFTs 0 0
11 Total 7,744
EU CCR2: CVA (credit value adjustments) capital charge a b
€m Exposure value RWAs
1 Total portfolios subject to the advanced method 4,080 3,419
2 (i) VaR component (including the 3× multiplier) 849
3 (ii) SVaR component (including the 3× multiplier) 2,570
4 All portfolios subject to the standardised method 221 142
EU4 Based on the original exposure method 0 0
5 Total subject to the CVA capital charge 4,301 3,561

72 Commerzbank Disclosure Report 2020
EU CCR8: Exposures to CCP (central counterparties) a b
€m EaD post CRM RWAs
1 Exposures to QCCPs (total) 133.1
2 Exposures for trades at QCCPs (excluding initial margin and default fund contributions); of which 2,097 48.4
3 (i) OTC derivatives 709 16.9
4 (ii) Exchange-traded derivatives 753 15.1
5 (iii) SFTs 634 16.4
6 (iv) Netting sets where cross-product netting has been approved 0 0.0
7 Segregated initial margin 0
8 Non-segregated initial margin 0 0.0
9 Prefunded default fund contributions 213 84.7
10 Alternative calculation of own funds requirements for exposures 0.0
11 Exposures to non-QCCPs (total) 0.0
12 Exposures for trades at non-QCCPs (excluding initial margin and default fund contributions); of which 0 0.0
13 (i) OTC derivatives 0 0.0
14 (ii) Exchange-traded derivatives 0 0.0
15 (iii) SFTs 0 0.0
16 (iv) Netting sets where cross-product netting has been approved 0 0.0
17 Segregated initial margin 0
18 Non-segregated initial margin 0 0.0
19 Prefunded default fund contributions 0 0.0
20 Unfunded default fund contributions 0 0.0

Introduction Equity capital Risk-oriented overall bank management Specific risk management Appendix 73
B. Counterparty credit risk (CCR)
Information by regulatory risk-weighting approach
EU CCR4: IRB approach – CCR exposures by portfolio and PD scale a b c d e f g PD scale EaD post
CRM Average PD Number of
obligors Average LGD Average
maturity1 RWAs RWA
density €m % % years €m %
Cen
tral
gov
ern
men
ts
or c
entr
al b
anks
0.00 to < 0.15 317 0.07 21 80.87 1.7 131 41.4
0.15 to < 0.25 31 0.22 5 34.47 1.0 8 27.1
0.25 to < 0.50 28 0.32 10 59.33 0.7 17 59.8
0.50 to < 0.75 0 0.72 1 100.00 1.5 0 162.0
0.75 to < 2.50 17 1.14 7 100.00 1.6 33 198.7
2.50 to < 10.00 6 3.19 10 100.00 1.2 15 268.7
10.00 to < 100.00 2 40.73 7 100.00 1.0 8 416.6
100.00 (Default) 0 0.00 0 0.00 0.0 0 0.0
Subtotal 401 0.39 61 76.97 1.6 214 53.4
Inst
itu
tion
s
0.00 to < 0.15 4,874 0.06 252 44.39 2.4 1,465 30.0
0.15 to < 0.25 215 0.22 63 52.83 1.6 124 57.4
0.25 to < 0.50 703 0.31 131 49.62 2.9 560 79.7
0.50 to < 0.75 77 0.59 44 52.36 1.0 60 77.1
0.75 to < 2.50 305 1.07 95 54.22 0.8 319 104.4
2.50 to < 10.00 97 3.87 70 53.09 1.6 157 162.3
10.00 to < 100.00 44 25.51 25 46.00 3.9 102 229.6
100.00 (Default) 0 0.00 0 0.00 0.0 0 0.0
Subtotal 6,316 0.38 680 45.97 2.4 2,785 44.1
Cor
por
ates
T
OT
AL
0.00 to < 0.15 2,400 0.05 1,764 38.56 2.1 575 23.9
0.15 to < 0.25 3,327 0.20 980 39.66 1.8 1,250 37.6
0.25 to < 0.50 1,217 0.29 1,829 41.33 2.6 773 63.6
0.50 to < 0.75 658 0.62 1,230 40.39 2.8 461 70.0
0.75 to < 2.50 578 1.23 2,544 43.14 1.9 567 98.2
2.50 to < 10.00 355 3.88 1,504 41.71 1.9 514 144.9
10.00 to < 100.00 54 19.72 194 40.19 2.7 115 210.2
100.00 (Default) 4 100.00 44 54.33 1.7 3 66.1
Subtotal 8,592 0.62 10,088 41.48 2.3 4,257 49.5
Cor
por
ates
, th
ereo
f S
ME
s
0.00 to < 0.15 311 0.05 1,003 55.81 4.2 91 29.1
0.15 to < 0.25 133 0.23 225 56.66 4.5 81 60.9
0.25 to < 0.50 178 0.29 553 62.87 4.4 135 75.7
0.50 to < 0.75 41 0.64 459 51.09 2.8 27 66.4
0.75 to < 2.50 69 1.23 1,529 54.76 3.0 66 95.3
2.50 to < 10.00 23 3.94 1,130 51.82 1.9 25 111.2
10.00 to < 100.00 5 29.31 112 47.89 2.7 9 178.7
100.00 (Default) 0 100.00 9 59.73 4.1 0 62.5
Subtotal 761 0.65 5,020 57.09 4.0 434 57.1
Cor
por
ates
, th
ereo
f sp
ecia
lise
d l
end
ing
0.00 to < 0.15 0 0.00 0 0.00 0.0 0 0.0
0.15 to < 0.25 0 0.00 0 0.00 0.0 0 0.0
0.25 to < 0.50 0 0.00 0 0.00 0.0 0 0.0
0.50 to < 0.75 0 0.00 0 0.00 0.0 0 0.0
0.75 to < 2.50 0 0.00 0 0.00 0.0 0 0.0
2.50 to < 10.00 0 0.00 0 0.00 0.0 0 0.0
10.00 to < 100.00 0 0.00 0 0.00 0.0 0 0.0
100.00 (Default) 0 0.00 0 0.00 0.0 0 0.0
Subtotal 0 0.00 0 0.00 0.0 0 0.0 1 Parameter is not subject to the RWA calculation for retail business. Hence, in compliance with EBA/GL/2016/11, no disclosure for retail business.

74 Commerzbank Disclosure Report 2020
EU CCR4_cont.: IRB approach – CCR exposures by portfolio and PD scale
a b c d e f g PD scale EaD post
CRM Average PD Number of
obligors Average LGD Average
maturity1 RWAs RWA density
€m % % years €m %
Cor
por
ates
, th
ereo
f ot
her
0.00 to < 0.15 2,089 0.09 761 38.56 2.1 484 23.2
0.15 to < 0.25 3,194 0.20 755 39.66 1.8 1,169 36.6
0.25 to < 0.50 1,038 0.35 1,276 41.33 2.6 639 61.5
0.50 to < 0.75 616 0.62 771 40.39 2.9 433 70.3
0.75 to < 2.50 509 1.30 1,015 43.14 1.9 502 98.6
2.50 to < 10.00 332 3.88 374 41.71 2.7 489 147.1
10.00 to < 100.00 49 19.72 82 40.19 3.4 105 213.5
100.00 (Default) 4 100.00 35 54.33 1.7 3 66.5
Subtotal 7,832 0.62 5,068 39.97 2.1 3,823 48.8
Ret
ail
0.00 to < 0.15 53 0.04 808 47.12 4 7.2
0.15 to < 0.25 8 0.19 234 51.72 2 21.4
0.25 to < 0.50 11 0.35 376 52.34 3 30.8
0.50 to < 0.75 5 0.55 238 50.39 2 38.6
0.75 to < 2.50 10 0.99 468 52.08 6 58.2
2.50 to < 10.00 8 3.85 318 53.22 6 76.3
10.00 to < 100.00 1 15.66 45 54.78 1 120.8
100.00 (Default) 0 100.00 19 31.87 0 62.5
Subtotal 95 0.83 2,506 51.74 24 24.7
Tot
al
0.00 to < 0.15 7,644 0.04 2,845 38.56 1.1 2,174 28.4
0.15 to < 0.25 3,581 0.19 1,282 34.47 1.0 1,383 38.6
0.25 to < 0.50 1,959 0.29 2,346 41.33 0.7 1,354 69.1
0.50 to < 0.75 740 0.55 1,513 40.39 1.0 522 70.6
0.75 to < 2.50 909 0.99 3,114 43.14 0.8 925 101.7
2.50 to < 10.00 465 3.19 1,902 41.71 1.0 692 148.8
10.00 to < 100.00 101 15.66 271 40.19 1.0 225 222.2
100.00 (Default) 4 100.00 63 31.87 1.7 3 66.0
Total (all portfolios) 15,404 0.52 13,335 44.31 2.3 7,280 47.3 1 Parameter is not subject to the RWA calculation for retail business. Hence, in compliance with EBA/GL/2016/11, no disclosure for retail business.

Introduction Equity capital Risk-oriented overall bank management Specific risk management Appendix 75
B. Counterparty credit risk (CCR)
EU CCR4_cont.: IRB approach – CCR exposures by retail sub-portfolio and PD scale
a b c d e f g PD scale EaD post
CRM Average PD Number of
obligors Average LGD Average
maturity1 RWAs RWA
density €m % % years €m %
Ret
ail
0.00 to < 0.15 53 0.04 808 47.12 4 7.2 0.15 to < 0.25 8 0.19 234 51.72 2 21.4 0.25 to < 0.50 11 0.35 376 52.34 3 30.8 0.50 to < 0.75 5 0.55 238 50.39 2 38.6 0.75 to < 2.50 10 0.99 468 52.08 6 58.2 2.50 to < 10.00 8 3.85 318 53.22 6 76.3 10.00 to < 100.00 1 15.66 45 54.78 1 120.8 100.00 (Default) 0 100.00 19 31.87 0 62.5 Subtotal 95 0.83 2,506 51.74 24 24.7
…se
cure
d b
y m
ortg
ages
/
SM
Es
0.00 to < 0.15 0 0.00 0 0.00 0 0.0 0.15 to < 0.25 0 0.00 0 0.00 0 0.0 0.25 to < 0.50 0 0.00 0 0.00 0 0.0 0.50 to < 0.75 0 0.00 0 0.00 0 0.0 0.75 to < 2.50 0 0.00 0 0.00 0 0.0 2.50 to < 10.00 0 0.00 0 0.00 0 0.0 10.00 to < 100.00 0 0.00 0 0.00 0 0.0 100.00 (Default) 0 0.00 0 0.00 0 0.0 Subtotal 0 0.00 0 0.00 0 0.0
…se
cure
d b
y m
ortg
ages
/
non
-SM
Es
0.00 to < 0.15 0 0.00 0 0.00 0 0.0 0.15 to < 0.25 0 0.00 0 0.00 0 0.0 0.25 to < 0.50 0 0.00 0 0.00 0 0.0 0.50 to < 0.75 0 0.00 0 0.00 0 0.0 0.75 to < 2.50 0 0.00 0 0.00 0 0.0 2.50 to < 10.00 0 0.00 0 0.00 0 0.0 10.00 to < 100.00 0 0.00 0 0.00 0 0.0 100.00 (Default) 0 0.00 0 0.00 0 0.0 Subtotal 0 0.00 0 0.00 0 0.0
…q
ual
ifie
d r
evol
vin
g 0.00 to < 0.15 0 0.00 0 0.00 0 0.0
0.15 to < 0.25 0 0.00 0 0.00 0 0.0 0.25 to < 0.50 0 0.00 0 0.00 0 0.0 0.50 to < 0.75 0 0.00 0 0.00 0 0.0 0.75 to < 2.50 0 0.00 0 0.00 0 0.0 2.50 to < 10.00 0 0.00 0 0.00 0 0.0 10.00 to < 100.00 0 0.00 0 0.00 0 0.0 100.00 (Default) 0 0.00 0 0.00 0 0.0 Subtotal 0 0.00 0 0.00 0 0.0
…ot
her
/ S
ME
s
0.00 to < 0.15 12 0.06 143 47.12 1 6.4 0.15 to < 0.25 6 0.21 116 51.72 1 17.5 0.25 to < 0.50 10 0.35 201 52.34 2 24.2 0.50 to < 0.75 5 0.56 118 50.39 2 31.3 0.75 to < 2.50 9 1.15 245 52.40 4 44.5 2.50 to < 10.00 4 4.03 120 55.10 2 63.9 10.00 to < 100.00 0 15.66 16 54.82 0 87.4 100.00 (Default) 0 100.00 12 66.77 0 62.5 Subtotal 46 0.92 971 50.98 12 27.1
…ot
her
/ n
on-S
ME
s
0.00 to < 0.15 41 0.04 607 52.40 3 6.7 0.15 to < 0.25 2 0.19 23 52.14 0 21.3 0.25 to < 0.50 1 0.37 12 52.66 0 33.8 0.50 to < 0.75 0 0.55 4 52.24 0 42.0 0.75 to < 2.50 1 0.99 7 52.08 1 56.0 2.50 to < 10.00 5 3.85 113 53.22 4 81.2 10.00 to < 100.00 0 52.08 9 54.78 0 147.9 100.00 (Default) 0 100.00 1 31.87 0 62.5 Subtotal 49 0.75 776 52.44 8 16.1
1 Parameter is not subject to the RWA calculation for retail business. Hence, in compliance with EBA/GL/2016/11, no disclosure for retail business.

76 Commerzbank Disclosure Report 2020
EU CCR7: RWA flow statements of CCR exposures under the IMM a b
€m Risk weighted assets (RWAs)
Capital requirements
1 RWA at previous quarter end 5,887 471
2 Asset size – 476 – 38
3 Credit quality of counterparties 364 29
4 Model updates 29 2
5 Methodology and policy 0 0
6 Acquisitions and disposals 0 0
7 Foreign exchange movements 87 7
8 Other 0 0
9 RWA at the end of the reporting period 5,891 471
The RWA from counterparty risk/CCR remained nearly unchanged in the fourth quarter of 2020.
EU CCR3: Standardised approach – CCR exposures by regulatory portfolio and risk Exposure classes | €m Risk weight Total Of which
unrated 0% 2% 4% 10% 20% 50% 70% 75% 100% 150% Other
1 Central governments or central banks 5,562 0 0 0 0 0 0 0 0 0 0 5,562 5,562
2 Regional governments or local authorities 927 0 0 0 0 0 0 0 0 0 0 927 927
3 Public sector entities 158 0 0 0 66 0 0 0 0 0 0 224 224
4 Multilateral development banks 0 0 0 0 0 0 0 0 0 0 0 0 0
5 International organisations 0 0 0 0 0 0 0 0 0 0 0 0 0
6 Institutions 2 925 138 0 211 139 0 0 22 0 0 1,437 1,143
7 Corporates 0 728 0 0 316 5 0 0 228 0 0 1,278 1,256
8 Retail 0 0 0 0 0 0 0 16 0 0 0 16 16
9 Durch Immobilien besichert 0 0 0 0 0 0 0 0 0 0 0 0 0
10 Exposures in default 0 0 0 0 0 0 0 0 0 1 0 1 1
11 Items associated with particularly high risk 0 0 0 0 0 0 0 0 0 0 0 0 0
12 Covered bonds 0 0 0 0 0 0 0 0 0 0 0 0 0
13 Institutions and corporates with a short-term credit assessment 0 0 0 0 0 0 0 0 0 0 0 0 0
14 Collective investment undertakings 0 0 0 0 0 0 0 0 0 0 0 0 0
15 Equity exposure 0 0 0 0 0 0 0 0 0 0 0 0 0
16 Other items 0 0 0 0 0 0 0 0 0 0 0 0 0
17 Total 6,649 1,654 138 0 592 144 0 16 249 1 0 9,443 9,128

Introduction Equity capital Risk-oriented overall bank management Specific risk management Appendix 77
B. Counterparty credit risk (CCR)
Further information on counterparty credit risk
EU CCR5-A: Impact of netting and collateral held on exposure values a b c d e
€m Gross positive fair value or net
carrying amount
Netting benefits
Netted current credit exposure
Collateral held
Net credit exposure
1 Derivatives 197,211 169,321 27,890 16,742 11,148
2 SFTs (securities financing transactions) 83,546 75,612 7,934 276 7,658
3 Cross-product netting 0 0 0 0 0
4 Total 280,756 244,933 35,823 17,018 18,805
EU CCR5-B: Composition of collateral for exposures to CCR a b c d e f
Collateral used in derivative transactions Collateral used in SFTs
Fair value of collateral received
Fair value of posted collateral
Fair value of collateral received
Fair value of posted
collateral €m Segregated Unsegregated Segregated Unsegregated
1 Cash 391 18,205 0 20,226 239 2,808
2 Sovereign Bonds 0 66 0 188 1 122
3 Other Bonds 0 2,346 0 2,600 3,227 1,321
4 Equities 0 0 0 0 1 983
5 Other collateral 0 0 0 0 0 0
6 Total 391 20,616 0 23,014 3,467 5,235
EU CCR6: Credit derivatives exposures a b c
Credit derivative hedges Other credit derivatives €m Protection bought Protection sold
1 Notionals
2 Single-name credit default swaps 2,167 331 8,230
3 Index credit default swaps 250 0 8,984
4 Total return swaps 0 0 2,573
5 Credit options 0 0 0
6 Other credit derivatives 0 0 0
7 Total notionals 2,417 331 19,786
8 Fair values
9 Positive fair value (asset) 63 42 214
10 Negative fair value (liability) 40 0 481

78 Commerzbank Disclosure Report 2020
Contractual agreements that oblige Commerzbank to provide addi-
tional collateral to its counterparties in the event of a downgrading
of its own rating are governed in the Credit Support Annexes
which are established as part of the netting master agreements for
OTC derivative business.
The counterparty ratings (from Standard & Poor’s, Moody’s
and Fitch Ratings) are automatically uploaded on a daily basis via
interfaces with Reuters, Telerate or Bloomberg into the collateral
management system, which can simulate downgrade scenarios if
necessary. This makes it possible to carry out an advance analysis
of the potential effects on the collateral amounts. Commerzbank
regularly reviews these collateral amounts as part of its stress test
assuming a simultaneous two-notch downgrade by the three big
rating agencies.
addCCR1: Additional contractual obligations (in stress test) Additional contractual obligations | €m
Contractual derivative outflows and margin calls 350
thereof collateralised interest rate derivatives 150
thereof uncollateralised interest rate derivatives 200
Other contractual outflows and margin calls 70
Total 2020 420
Total 2019 240

Introduction Equity capital Risk-oriented overall bank management Specific risk management Appendix 79
C. Securitisations (SEC)
Securitisation process
In securitisation business Commerzbank performs the three roles
provided for in regulatory legislation, namely originator, sponsor
and investor.
› Originator Parts of the Bank’s own loan portfolio are placed se-
lectively on the capital markets through securitisation transac-
tions. The transfer of the credit risk is mainly by means of syn-
thetic securitisations where the portfolio is hedged through fi-
nancial guarantee contracts. As at 31 December 2020, of the out-
standing securitisations of Commerzbank, risk exposures of
€12.2bn (securitised volume €10.2bn) were retained. By far the
largest portion of these positions is accounted for by €10.0bn of
senior tranches, which are nearly all rated good or very good. As
at the reporting date, Commerzbank’s securitisation transactions
placed on the capital markets and used to free up regulatory capi-
tal were as follows:
SEC1: Securitisation transactions with regulatory capital relief Securitisation programs1 Art2 Securitisation pool Maturity Issue currency Current volume | €m
CoCo Finance II– 3 S Corporates 2031 EUR 6,660
CoCo Finance III– 2 S Corporates 2029 EUR 1,723
CoCo Finance III– 3 S Corporates 2030 EUR 1,716
CoCo Finance III– 4 S Corporates 2031 EUR 2,138
Total Commerzbank AG 12,237
1 Securatisation of own customer receivables. 2 S = synthetic, T = True sale
At the reporting date Commerzbank had placed the transaction
CoCo Finance II-3 with a volume of €6bn and the transaction CoCo
Finance III-4 with a volume of €1.875bn. The assets securitised by
Commerzbank belong to the Bank and are derived from its Euro-
pean, mainly german lending business with small and medium-
sized business customers. At the reporting date the transactions
CoCo Finance III-1 with an initial volume of €1bn and CoSMO Fi-
nance III-2 with an initial volume of €2bn had been repaid accord-
ing to contract.
As part of the overall management of the Bank, the Commerz-
bank Group constantly reviews opportunities to securitise its own
assets. This process is primarily influenced by the market condi-
tions prevailing at any one time. At the reporting date, no further
placement of securitisation transactions was planned for the first
half of 2021. In the reporting year, due to the structure of the
transactions, Commerzbank did not hold any securitisation expo-
sures for which additional capital was required as a result of an
investor share to be taken into consideration by the originator un-
der Article 246 (Regulation (EU) 2017/2401). In addition, during
the reporting year Commerzbank provided no implicit support
within the meaning of Article 248 (Regulation (EU) 2017/2401).
In the period under review, Commerzbank did not sell invest-
ment products resulting from its role as originator to companies
that are managed or advised in investments by Commerzbank.
› Sponsor By securitising their own portfolios of receivables, i.e.
selling their receivables on a non-recourse basis, Commerzbank’s
customers are able to tap alternative sources of funding on the
capital markets. Structuring, arranging and securitising these re-
ceivables portfolios, particularly those of customers in the Corpo-
rate Clients segment, is a key component of the structured finance
product range. Special purpose vehicles (purchasing entities) are
typically established to manage these assets. The ABS conduit Sil-
ver Tower established by the bank regularly acts as the purchasing
entity. Since 2019 the refinancing of the purchases is primarily
done through the issuance of short-term registered notes. As
sponsor, the Bank is responsible for structuring and, as a rule,
purchasing and refinancing the transactions. Commerzbank pro-
vides the special purpose vehicles with note purchase agreements
to enable access to short-term liquidity through the purchase of
registered notes.
These note purchase agreements are counted in full when de-
termining the risk-weighted exposures. The mainly high diversi-
fied portfolios of receivables generally derive from customers’
working capital, such as trade receivables and car, machinery and
equipment leases. The receivables portfolios therefore reflect the
differing businesses of those selling the receivables. The volume in
the sponsor securitisation positions remained stable at €3.1bn in
2020.
C. Securitisations (SEC)

80 Commerzbank Disclosure Report 2020
› Investor The Commerzbank Group invests under its regulatory
banking book in securitisation positions. The Bank’s internal credit
risk strategy allows entering into new securitisation positions pro-
vided that the risk profile of each securitisation position is subject-
ed to a differentiated analysis and documentation. This allows
transaction risk drivers that may impact directly or indirectly on
the securitised position’s risk content to be taken into account. In
the year under review Commerzbank invested in senior-ranking
securitisation positions, mainly backed by pools of corporate loans
and consumer loans.
Risk management
The internal processes for monitoring the risk profile of securitisa-
tion exposures are based on the provisions of Articles 5 (due dili-
gence for institutional investors) and 7 (transparency requirements
for originators, sponsors and SSPE) ((Regulation (2017/2402)
amending Regulation (575/2013))and on the principles of the Min-
imum Requirements for Risk Management (MaRisk) as amended.
They apply equally to all securitisation exposures, irrespective of
whether they are part of the regulatory trading or banking book.
The processes put in place by the Bank take account of the in-
dividual risk profile of securitisation exposures on the basis of a
wide range of information sources. They ensure that various risks
directly and indirectly affecting the probability of default of the
securitised positions are monitored in a continuous and timely
manner. This also includes carrying out regular stress tests that
take account of macroeconomic factors and the individual risk pro-
file of the securitised positions.
› Originator The credit process for loans to customers does not
distinguish between loans which the Bank will securitise at a later
date and those for which it will continue to assume the risk.
Transactions which allow reliefs in capital for regulatory purposes
are subject to a monitoring process that ensures the continuous
compliance with the regulations on significant risk transfer ac-
cording to Articles 244 and 245 (Regulation (2017/2401)). The
amount to be retained in securitisation transactions in accordance
with Article 6 Regulation ((2017/2402) amending Regulation
(575/2013)) is reviewed regularly and published in the Investor
Report. A potential placement risk for Commerzbank’s transac-
tions is taken fully into account, as the receivables are included in
full in the Bank’s risk and capital management process up until the
actual risk transfer by means of securitisation and placement.
› Sponsor The customer transactions funded via conduits are sub-
ject to an ongoing credit process. A risk analysis of the transac-
tions is conducted when the transactions are structured and again
in regular reviews which are carried out annually and as circum-
stances require. A rating is assigned using the ABS rating systems
certified by the banking regulators (internal assessment approach).
For this purpose we take into account all significant risk drivers of
the securitised receivables portfolio (e.g. type of receivable, de-
fault rates, collateral provided, diversification, dilution risks, com-
mingling risks) and of the securitisation structure (e.g. whether
the creditor claims have a waterfall structure, credit enhance-
ments). Qualitative risk drivers ascertained from regular on-site
visits to the seller of receivables as well as the seller’s financial
position are also taken into account. For trade receivables, struc-
ture-inherent covers through credit insurance are taken into ac-
count in the rating model and credit analysis. Credit insurance is
used in order to mitigate concentration risk. The main counterpar-
ties here are Euler Hermes Deutschland, the German branch of
Euler Hermes SA and the German branch of Compagnie Française
d'Assurance pour le Commerce Extérieur SA (Coface). Before any
purchase of customer receivables, the minimum conditions agreed
in the contract documentation are reviewed and any non-
qualifying receivables are excluded. After the receivables have
been bought, their quality is reviewed continuously. If any poten-
tial problems come to light another credit analysis of the structure
is carried out.
› Investor Strict internal guidelines must be followed when ac-
quiring a new securitisation position. Such positions are subject to
a specific internal credit process that also ensures that the specific
requirements for securitisation positions regarding due diligence
and retention under Articles 5 and 6 ((Regulation(2017/2402)
amending Regulation (575/2013)) are met. In the credit process
applied to the Bank’s securitisation portfolio, the risk profile of the
securitisation positions is analysed quarterly or as circumstances
require. In preparing a credit assessment, at the level of the indi-
vidual tranche a securitisation-specific rating system is used which
has been developed internally within the Bank, while external
standard models are also applied. As with securitisation exposures,
the ranking of the individual tranches contained in the pool within
a securitisation structure are taken into account in this analysis, as
are the specific features of the asset classes and of the different
jurisdictions, in order to generate the expected aggregate cash
flow. The results are then used to model the entire waterfall struc-
ture at the level of the resecuritisation.

Introduction Equity capital Risk-oriented overall bank management Specific risk management Appendix 81
C. Securitisations (SEC)
› Nature of other risks Commerzbank takes into account not only
the original default risk of the securitised receivables but also sec-
ondary risks such as market value risk, liquidity risk, legal risk and
operational risk insofar as they are relevant with a direct or indi-
rect impact on the default risk. This process looks, for example, at
the performance reports for the securitised receivables, changes
in external ratings and movements in the market value of the secu-
ritisation exposures.
When determining market price risk, changes relating to inter-
est rates, foreign currency rates or credit spreads, among others,
are taken into account for the risk assessment of each tranche. In
addition, the combination of various conventional risk measures
(e.g. VaR) ensures the appropriate management of market risk
concentrations at Group level.
Liquidity risk refers in this context to the risk that Commerz-
bank will be unable to meet its payment obligations on a day-to-
day basis. Liquidity risks from securitizations are modelled con-
servatively in the internal liquidity risk model. In the case of varia-
ble-use transactions, it is assumed that the purchase facilities pro-
vided to the special-purpose vehicles must be funded by
Commerzbank for the duration of their term almost completely
and until the maturity date of the last funded claim. Securitisations
only qualify as liquid assets if they are eligible for rediscount at
the European Central Bank. These positions are only included in
the liquidity risk calculation after applying conservative discounts.
Legal risk in the context of securitisation transactions is the
risk that the Bank might suffer losses as a result of flaws in legal
transaction structures or as a result of missing or flawed legal
documentation. Commerzbank’s independent Legal department is
responsible for examining legal structures and all transaction con-
tracts. In terms of content, risks are divided into those arising from
the sphere of the originator itself or those directly connected with
the portfolio to be securitised. The subsequent refinancing and
collateral structure is also a key element of legal structuring and
risk assessment.
As well as being associated with legal risk as a risk type under
the overall heading of operational risk, securitisation business is
subject to the Group-wide management of operational risks. It
therefore falls within the framework of the certified advanced
measurement approach used by Commerzbank to measure opera-
tional risks.
Valuation methods and quantitative information
Regulatory valuation of securitisations
From 1 January 2019 the new EU securitisation regulation began
to apply for securitisation positions. It comprises two regulations:
the securitisation regulation (Regulation (EU)2017/2402) that for
the first time creates a European framework for simple, transpar-
ent and standardised securitisations (STS) as well as regulation
(EU) 2017/2401 where the necessary amendments regarding regu-
lation (EU) No 575/2013 (Capital Requirements Regulation, CRR)
are adapted.
The securitisation regulation regulates and harmonises the due
diligence requirements for institutional investors, the transparency
requirements and the specific requirements for the new STS-
securitisations. STS-securitisations are considered to be of high
quality and therefore receive a more benign capital treatment.
During the course of this year, for synthetic securitisations the
classification as a STS-securitisation is not intended.
The hierarchy foresees the internal based approach (SEC-IRBA)
at the top of the hierarchy if at least 95% of the underlying expo-
sure amounts can be calculated with the SEC-IRBA. If this is not
the case the standardised approach (SEC-SA) is to be used. Only if
the SEC-SA is not applicable the SEC ERBA which is based on eli-
gible external ratings is relevant.
Securitisation positions in the banking book
› Originator Capital is held against synthetic securitisation tran-
ches that have been placed on the market based on the risk
weighting of the party providing the collateral. Counterparties to
the hedging instruments used, e.g. financial guarantees, are insti-
tutional investors, whose deposits serve as collateral. For all trans-
actions whose capital charge is calculated according to the CRR,
the approach based on internal ratings (SEC-IRBA) is applied
› Sponsor The overwhelming majority of sponsor transactions have
to be allocated to the conduit business. Only in a few cases does
Commerzbank hold other sponsor positions. For capital require-
ments within the Conduit business the Standardised Approach
according to the amendments to CRR (EU Regulation 2017/2401)
applies. For purposes within the internal capital model, portfolio
monitoring as well as setting limits (ICAAP-processes), Commerz-
bank’s own rating systems (IAA) had been used for the receivables
classes of trade receivables, car finance and leasing, equipment
leasing and consumer lending. In addition, the internal assess-
ment approach is subject to an annual validation by Commerz-
bank’s risk function.

82 Commerzbank Disclosure Report 2020
The approaches to modelling probability of default (PD) or ex-
pected loss (EL) for securitisation tranches differ depending on the
type of the securitised asset class. They follow the guidelines of
the rating agencies and include main risk drivers of the securitized
portfolio as well as the special structural features of the securitiza-
tion position. Other quantitative and qualitative risk components
that are regarded as material by Commerzbank are also included
in the assessment. These include, in particular, seller risks and
qualitative risk drivers that are evaluated via structured qualitative
questionnaires. The result of the rating process is a tranche-
specific rating derived from the quantitative and qualitative results
of the assessment approach. Depending on the specific approach
used, this rating is based on the probability of default or expected
loss of the securitised tranche.
For the asset classes trade receivables, car finance and leasing,
equipment leasing and consumer lending, a range of different
stress factors used by the rating agencies are applied, depending
on the main risk drivers for the relevant transactions. These are,
for example, stress factors on concentration risks, default risks,
dilution risks and interest rate risks. Quantitative and qualitative
modelling components devised by the Bank are also used. When
calculating loss buffers, stress factors are determined individually
for different securitised asset types on the basis of the risk profiles
of the securitisation transactions.
For securitisation transactions within the strategic restructur-
ing of the conduit business a gradual transfer of the previous Sil-
ver Tower Conduit business to the new Silver Tower Conduit in
Luxemburg has taken place. Instead of Commercial Papers (CP)
the new Silver Tower Conduit is directly refinanced through
Commerzbank. Some transactions – in particular Co-purchase
transactions – are reflected directly on the balance sheet instead of
in Silver Tower.
› Investor For investor positions, external ratings are generally
available and lead to the ratings-based approach (RBA) according
the CRR being applied on a transitional basis as well as the SEC-
ERBA according the new securitisation regulation. Commerzbank
takes account of all available external ratings of securitisation po-
sitions issued by the rating agencies nominated by Commerzbank,
namely Standard & Poor’s, Moody’s and FitchRatings. It does so
irrespective of the type of receivables securitised and the type of
securitisation exposure. A very small portion of investor positions
is covered by guarantees from guarantors. The guarantee is taken
into account in the calculation of RWAs by substituting the risk
weighting of the guarantor for the risk weighting of the securitisa-
tion. The look-through approach is used to a limited extent. In just
a few cases a capital deduction is used due to the lack of an appli-
cable external rating.
Companies which are consolidated within the Commerzbank
Group for regulatory purposes may, as part of the Group-wide
business and risk strategy, act as investors in securitisation trans-
actions in which the Bank is acting as sponsor or originator.
Commerzbank currently only holds securitisation exposures
from transactions where it acts as sponsor or originator. All reten-
tions or repurchases of securitisation exposures from the Bank’s
own transactions with recognised regulatory risk transfer and se-
curitisation exposures from transactions where Commerzbank has
acted as sponsor are taken into account when determining the
regulatory capital requirement. In the case of transactions without
recognised regulatory risk transfer, the regulatory capital re-
quirement is determined for the securitised portfolio.
Securitisation exposures in the trading book
As at 31 December 2020, the majority of securitisation positions
included in the trading book are hedged against performance-
induced market price risks by means of credit default swaps with
counterparties of good credit quality. In addition, further positions
are allocated to the correlation trading book. The capital adequacy
requirements are determined by application of the provisions of
Articles 337 and 338 CRR relevant for securitisation exposures.
Valuation and accounting procedures
In true sale or synthetic securitisation transactions via special pur-
pose vehicles, IFRS accounting regulations require the Bank to
review whether or not the securitising special purpose vehicles
need to be consolidated in accordance with IFRS 10. This review
process is centralised in the Commerzbank Group in the account-
ing department. The central unit is informed of the establishment
or restructuring of a special purpose vehicle. On the basis of the
information submitted, it carries out a review to determine wheth-
er or not the special purpose vehicle needs to be consolidated.
› Originator If the special purpose vehicle is consolidated as part
of the Commerzbank Group, no further derecognition test is car-
ried out under IFRS 9. The asset is not derecognised in this case.
If the special purpose vehicle does not have to be consolidated, in
true sale securitisations the possible derecognition of the secu-
ritised receivables from the balance sheet is assessed. Following
an assessment of the risks and rewards of ownership as the prima-
ry derecognition criterion and the control concept as the second-
ary derecognition criterion according to IFRS 9.3.2, a derecogni-
tion or partial derecognition is reported where appropriate. In the
case of synthetic securitisations, the underlying receivables re-
main on the balance sheet. As with securitised receivables in true
sale securitisations that are not derecognised, they are reported in
their original IFRS category. These receivables continue to be ac-
counted for in accordance with the rules for this IFRS category.
Introduction Equity capital Risk-oriented overall bank management Specific risk management Appendix 83
C. Securitisations (SEC)
Where securitised receivables are derecognised, any resultant
gains or losses are recognised in the income statement. In some
cases, the derecognition of receivables may lead to the first-time
recognition of new exposures, for example bonds issued by spe-
cial purpose vehicles. Under IFRS these exposures are categorised
on the basis of the intention with which the securities were ac-
quired and the type of securities according to IFRS 9 (FVTPL,
Amortised Cost and FVOCI). Please refer to the notes to the IFRS
Group financial statements (Annual Report 2020, Notes to the bal-
ance sheet, from page 198 onwards) for a detailed explanation of
the classification rules and the related valuation procedures.
No securitisation transactions leading to derecognition of re-
ceivables were carried out in the period under review. As a result,
no gains or losses were realised from the sale of receivables in
connection with securitisation transactions during the reporting
period. The newly founded Coco Finance II–3 Ltd. is not yet con-
solidated in the year under review for accounting purposes due to
a lack of materiality in relation to P&L. The listed company is also
not consolidated for regulatory purposes.
If assets are earmarked for securitisation, this has no direct im-
pact on their accounting treatment or measurement within the ap-
plicable IFRS categories.
› Sponsor Under the Silver Tower Conduit since March 2019 sin-
gle compartments of Silver Tower S.A. are established for Silver
Tower transactions instead of using purchasing entities. The Silver
Tower S.A. and their compartments are not being consolidated.
› Investor Under IFRS, investor positions are categorised on the
basis of the intention with which the securities were acquired and
the type of securities according to IFRS 9 (FVTPL, Amortised Cost
and FVOCI). For a detailed explanation, please refer to the notes to
the IFRS Group financial statements (Annual Report 2020, Notes
to the balance sheet, from page 198 onwards), which also explains
the related valuation procedures. If the securitisation exposures
are traded on liquid markets with observable pricing, they are val-
ued on the basis of independent market prices. If direct measure-
ment at market prices is not possible, the value of the securitisa-
tion exposure is determined using prices from external providers.
In some cases, the value of the securitisation exposure is deter-
mined with the help of valuation models. This involves the applica-
tion of a discounted cash flow approach, with the cash flows and
other relevant parameters being based on data observable on the
market. Moreover, the approach is calibrated with market data for
application to similar securitisation structures. In many cases the
prices estimated by external providers are used. There were no
significant changes in the methods used to value securitisation
positions in the period under review.
Quantitative information on securitisations
Securitisation positions in the banking book The following in-
formation relates to transactions for which risk-weighted expo-
sures are determined in accordance with Articles 242–270 regula-
tion amending CRR (EU Regulation 2017/2401). This also includes
the Commerzbank Group’s own securitisation transactions for
which capital relief is available and made use of for regulatory
purposes.
The total volume of all retained or acquired securitisation ex-
posures (on- and off-balance-sheet) was €23.5bn as at the report-
ing date. This amount corresponds to the exposures after deduct-
ing eligible collateral.
A breakdown of retained or acquired securitisation exposures
by exposure type and the regulatory role assumed by Commerz-
bank is given in the following table.

84 Commerzbank Disclosure Report 2020
SEC2: Retained or acquired securitisation exposures in the banking book by type of exposure €m On-balance securitisation
positions Off-balance and derivative
securitisation positions
Loans to companies/SMEs 15,735 4
Consumer loans 4,191 0
Trade receivables 1,740 712
Leasing receivables 1,169 30
Commercial real estate 0 0
Residential real estate 18 43
Total 2020 22,852 789
Total 2019 16,925 853
Based on the country of the securitised claim, the securitisation
exposures originate predominantly from Germany at 60% (2019:
54%), the USA 23% (2019: 28%) and France 7% (2019: 7%).
The next table provides a breakdown of acquired or retained
securitisation exposures by risk weighting bands. Risk weightings
are ascertained by applying the risk approach applicable to each
securitisation exposure as per Article 254 CRR of the regulation
amending CRR (EU Regulation 2017/2401).
If a securitisation exposure has an external rating of B+ or
worse, the exposure is deducted from CET1 capital. The capital
requirements are determined by the exposure and its risk
weighting after taking account of any impairments. In order to en-
sure the comparability with the figures of the previous year the
securitisation positions that had to be treated according the old
regulation requirements until year end 2019 and since 1.1.2020
completely have to be treated according to the new capital re-
quirements are shown as follows:
Securitisation positions of the former IRBA Rating approach
(IRBA-RBA) as well as the KSA-RBA Rating based Approach (KSA-
RBA) have been allocated to the new Approach SEC-ERBA. Secu-
ritisation positions of the former Supervisory Formula Approach
(IRBA-SFA) as well as the IAA have been allocated to the new
SEC-SA. The two securitisation positions that had been calculated
with the Look Through Approach (KSA-LTA) are calculated ac-
cording the SEC-ERBA.
SEC3: Retained or acquired securitisation exposures in the banking book by risk weighting band according to amendments to CRR (Regula-
tion (EU) No. 2017/2401) SEC-IRBA SEC-ERBA SEC-SA
Risk weighting band €m
Position value
Capital requirement
Position value
Capital requirement
Position value
Capital requirement
≤ 10% 0 0 1,350 11 2,153 17
> 10% ≤ 20% 8,760 105 6,637 106 774 10
> 20% ≤ 50% 1,367 29 1,504 36 636 21
> 50% ≤ 100% 0 0 260 14 0 0
> 100% ≤ 650% 0 0 2 1 0 0
> 650% < 1,250% 22 19 0 0 0 0
Total 2020 10,148 153 9,753 168 3,563 48
Total 2019 4,991 86 9,064 110 3,533 72
As at 31 December 2020 the value of the securitisation exposures
deducted from equity capital was €209m (2019: €201m). After
taking account of impairments, the capital deduction amounted to
€178m (2019: €171m).
In the year under review, Commerzbank no longer had any
resecuritisation positions in its portfolio.
The table below shows the outstanding volumes of Commerz-
bank’s securitisation transactions. These were originator transac-
tions with recognised regulatory risk transfer or primary ABCP-
funded sponsor transactions.

Introduction Equity capital Risk-oriented overall bank management Specific risk management Appendix 85
C. Securitisations (SEC)
SEC4: Securitisation assets outstanding Originator Originator Sponsor
Traditional Synthetic
€m 2020 2019 2020 2019 2020 2019
Loans to companies/SMEs 59 59 11,248 4,746 155 169
Consumer loans 0 0 0 0 0 0
Securitised positions 0 0 0 0 0 0
Leasing receivables 0 0 0 0 831 766
Trade receivables 0 0 0 0 1,575 2,365
Commercial real estate 0 0 0 0 0 0
Residential real estate 0 0 0 0 0 0
Other 0 0 0 0 0 0
Total 59 59 11,248 4,746 2,562 3,300
On the reporting date, the securitised portfolios included non-
performing or past due loans as shown below:
SEC5: Impaired / past-due assets securitised Non-performing loans Past due loans
€m 2020 2019 2020 2019
Loans to companies/SMEs 13 52 6 3
Commercial real estate 0 0 0 0
Residential real estate 0 0 0 0
Total 13 52 6 3
During the period under review, no portfolio losses occurred un-
der the Commerzbank originator transactions. We have taken the
information on portfolio losses and on impaired and past due
claims from the investor reports for the respective underlying
transactions.
Securitisation transactions in the trading book The information
in this section relates to securitisation exposures in the trading
book (excluding the correlation trading portfolio) for which risk-
weighted exposure values are determined in accordance with Arti-
cle 337 CRR. This comprises securitisation exposures where
Commerzbank acts as sponsor, originator or investor.
The total net exposure of all retained or acquired securitisation
positions was below €1m at the reporting date, including credit
derivative hedges according to article 337 CRR. There are no fur-
ther off-balance-sheet hedge positions.
The trading book’s total retained or acquired securitisation po-
sition with a total net exposure below €1m as at 31 December
2020– as in the previous year – is subject to the SEC-ERBA ap-
proach.
Based on the country of the securitised claim most of these se-
curitisation exposures originate from the Germany.
At year-end 2020 (as at year-end-2019) there were no retained
or acquired resecuritisation exposures in the trading book.
As at the end of the reporting period, there were no trading
book securitisation exposures that were not deducted from CET1.
As at 31 December 2020 the value of the securitisation exposures
to be deducted from equity capital (including resecuritisations) as
well as the capital requirement was below €1m (2019: €<1m).
86 Commerzbank Disclosure Report 2020
Market risk is the risk of potential financial losses due to changes
in market prices (interest rates, commodities, credit spreads, ex-
change rates and equity prices) or in parameters that affect prices
such as volatilities and correlations. Losses may impact profit or
loss directly, e.g. in the case of trading book positions. However,
for banking book positions they are generally reflected in the re-
valuation reserve or in hidden liabilities/reserves.
Risk management
Strategy and organisation
Commerzbank’s market risk strategy is derived from its Group
Risk Strategy and the business strategies of the individual seg-
ments. It sets targets for market risk management in relation to
Commerzbank’s main business activities. The core market risk
management tasks are the identification of all material market
risks and drivers of market risk for the Group and the independent
measurement and evaluation of these. The results and estimates
serve as the basis for risk/return-oriented management.
The Board of Managing Directors of Commerzbank is respon-
sible for ensuring the effective management of market risk
throughout the Commerzbank Group. Specific levels of authority
and responsibility in relation to market risk management have
been assigned to the appropriate market risk committees.
Various market risk committees have been established within
the Bank. In these, segment representatives, along with represen-
tatives from the risk function and finance area, discuss current risk
positioning issues and decide on appropriate action. Chaired by
the risk function, the Group Market Risk Committee, which meets
monthly, deals with the Commerzbank Group’s market risk posi-
tion. Discussions centre on the monthly market risk report, which
is also presented to the Board of Managing Directors for their con-
sideration. The report summarises the latest developments on fi-
nancial markets, the Bank’s positioning and related risk ratios. The
Segment Market Risk Committee focuses on the Corporate Clients
segment and the Group Treasury division.
The risk management process involves the identification,
measurement, management and monitoring of risks and reporting
on them. It is the responsibility in functional terms of market risk
management, which is independent of trading activities. Central
market risk management is complemented by decentralised mar-
ket risk management units at segment level and for regional units
and subsidiaries. The close integration of central and local risk
management with the business units means that the risk manage-
ment process starts in the trading areas themselves. The trading
units are responsible in particular for the active management of
market risk positions, e.g. reduction measures or hedging.
Risk management
Commerzbank uses a wide range of quantitative and qualitative
tools to manage and monitor market risk. Quantitative limits for
sensitivities, value at risk (VaR) figures, stress tests, scenario anal-
yses and ratios on economic capital limit the market risk. Our
comprehensive rulebook, in the form of market risk policies and
guidelines as well as restrictions on portfolio structure, new prod-
ucts, maturities and minimum ratings, establishes the qualitative
framework for market risk management. The market risk strategy
lays down the weighting of figures in each segment by reference
to their relevance. Thereby allowance is made for the varying im-
pact of the parameters for the management of the segments in line
with the business strategy.
Market risk is managed internally at Group level, segment level
and in the segment’s reporting units. A comprehensive internal
limit system broken down to portfolio level is implemented and
forms a core part of internal market risk management.
The quantitative and qualitative factors limiting market price
risk are determined by the market risk committees by reference to
the Group’s management of economic capital. The utilisation of
these limits, together with the relevant net income figures, is re-
ported daily to the Board of Managing Directors and the responsi-
ble heads of the Group divisions. Based on qualitative analyses
and quantitative ratios, the market risk function identifies potential
future risks, anticipates potential financial losses in collaboration
with the finance function, and draws up proposals for further ac-
tion, which are discussed with the market units. Voting on the
proposed measures or exposures takes place in the above-
mentioned market risk committees and is subsequently submitted
to the Board of Managing Directors for approval.
Risk concentrations are restricted directly with specific limits
or are indirectly avoided, for example using stress test limits. In
addition, the combination of various conventional risk measures
(e.g. VaR, sensitivities) ensures the appropriate management of
concentration risks. Furthermore, risk drivers are analysed on a
regular basis in order to identify concentrations. The risk man-
agement of existing concentrations is also reviewed using situa-
tion-driven analyses and, where necessary, supplemented by tar-
geted measures such as limits.
Any limits that are breached are handled in a separate esca-
lation procedure. After a limit breach has been identified, the front
D. Market risk (MR)

Introduction Equity capital Risk-oriented overall bank management Specific risk management Appendix 87
D. Marktet risk (MR)
office and risk units design adequate countermeasures. If the limit
breach cannot be remedied within a reasonable period, it will be
escalated by the market risk function to the next hierarchical level.
Regulatory risk measures that are not included in economic
risk-bearing capacity are limited and managed separately. These
include, for example, stressed VaR and incremental risk charge.
Tradability and measurement of financial instruments
The criteria applicable within the Bank for the allocation of trans-
actions to the trading book or banking book are set as part of a
Group-wide policy which implements the regulatory requirements
for the allocation of transactions to the trading book with regard to
the bank-specific circumstances, particularly also with regard to
organisation and the focus of business policy.
Commerzbank has various control processes in place to identify
illiquid markets and trading restrictions, which provide indications
to determine the procedures to adopt in such cases. In addition to
this, the ability to hedge trading book positions and the assess-
ment of the reliability of measuring these trading book positions
are subject to regular reviews.
IFRS 13 standardises the rules for measuring fair value. Under
IFRS 13, the fair value of an asset is the amount for which it could
be sold between knowledgeable, willing, independent parties in an
arm’s length transaction. The fair value therefore represents a re-
alisable price.
The fair value of a liability is defined as the price at which the
debt could be transferred to a third party as part of an orderly
transaction. Furthermore, for the valuation of a debt one’s own
default risk has to be considered.
The most suitable measure of fair value is the quoted price for
an identical instrument in an active market (fair value hierarchy
level I). In cases where no quoted prices are available, valuation is
based on quoted prices for similar instruments in active markets.
In all other cases, fair value is derived using an appropriate valua-
tion model where the data inputs are obtained, as far as possible,
from verifiable market sources (fair value hierarchy level II).
Most valuation methods are based on data from verifiable mar-
ket sources. However, some valuation models use inputs for which
sufficient verifiable current market data is not available, and which
therefore inherently include a greater level of expert or manage-
ment judgement. These unobservable inputs may include data that
is extrapolated or interpolated, or may be derived by approxima-
tion to correlated or historical data. Here, to a maximum extent,
these inputs are market or third-party inputs and rely as little as
possible on expert estimates or company-specific inputs (fair value
hierarchy level III).
Valuation models must be consistent with accepted economic
methodologies for pricing financial instruments. They must incor-
porate all factors that market participants would consider appro-
priate in setting a price. In the Commerzbank Group, standards
have been established in the form of internal controls and proce-
dures for the independent verification and validation of all fair val-
ues including the creation of a valuation reserve. These controls
and procedures are carried out by various units within the inde-
pendent finance and risk functions, with a central supervisory
function being exercised by the Independent Price Verification
(IPV) Group within the risk function. The models, inputs and re-
sulting fair values are reviewed regularly by senior management,
the finance and the risk function.
The fair value itself is determined in a two-step process. As a
first step, the individual fair value components are calculated in
accordance with the relevant rules; the second step involves com-
bining the components on a monthly basis in a consolidated fair
value report for reporting at Group level.
The independent price verification (IPV) process ensures the
correctness of the prices and parameters used in the fair value
calculation as a central, independent process for determining and
verifying the fair value. The IPV process is based on a risk-
oriented approach which takes into account internal factors such
as changes in business strategy, the expansion or downsizing of
business activities as well as external factors such as develop-
ments in markets, products and valuation models. If a price is di-
rectly observable, e.g. the stock market price of a share, the prod-
ucts are valued at the bid or offer side, depending on whether they
are a long or a short position. However, if a valuation model for
determining fair value is applied, the respective input parameters
at mid-market are used, e.g. interest rates and implied volatilities
to value an interest rate option. This results in the positions affect-
ed being overvalued because their liquidation or hedging in the
market would always be realised at a bid or offer price. According-
ly, “bid-offer reserves” - totalling ½ of the bid-offer spread in rela-
tion to the associated position - must be taken into account as liq-
uidation or hedge costs for all positions valued at mid-market.

88 Commerzbank Disclosure Report 2020
In the event of illiquid products or input parameters the availa-
bility of independent market data sources may be restricted.
Where sufficient information is available for a solid independent
estimate made by experts, a parameter uncertainty reserve is set
up. Such estimates are usually based on comparable and available
market data (mapping), so the corresponding reserve can be cal-
culated on the basis of the standard deviation of this market data.
However, if the applied valuation models use input parameters for
which there is no market data or insufficient verifiable market data
(see Level III above), a “Day-1 reserve” is set up on the day the
transaction is executed. To this end, the profit or loss calculated
by the valuation model on the first day of trading (Day1) is set
aside and recognised on a pro-rata basis over the term of the
transaction or the period during which the relevant market param-
eters are expected to be unobservable.
Should valuation models show theoretical deficits or be subject
to certain restrictions in their practical application, it is necessary
to set up model reserves that reflect these uncertainties. Here, a
distinction is made between generic model reserves, which relate
to all transactions measured using a specific model, and specific
model reserves, which affect only individual transactions or par-
ticular model combinations. These reserves are usually estimated
using a revaluation with alternative models.
In addition, valuation adjustments (summarised under the term
xVA) for OTC derivatives have been taken into account. These val-
uation adjustments include the risk and funding profiles of coun-
terparties and of the bank itself in the valuation. Thus the credit
valuation adjustment (CVA) describes the valuation adjustment of
OTC derivatives for the default risk of the counterparty while the
debit valuation adjustment (DVA) depicts the adjustment for own
default risk. The funding valuation adjustment (FVA) for its part
offsets differences in funding costs on account of the incomplete
collateralisation of derivative transactions.
Market risk model
Value at Risk
A standardised value at risk model incorporating all positions is
used for the internal management of market risk. VaR quantifies
the potential loss from financial instruments due to changed mar-
ket conditions over a predefined time horizon and with a specific
probability.
Our VaR market risk model is based on a historical simulation
with a one-year interval of historical market data. The historical
simulation determines the profit and loss distribution of the cur-
rent portfolio by means of revaluation using historical changes in
market prices and volatility. This is done on the basis of independ-
ent market data which is quality-assured on a daily basis and fed
into a central market database at a standard defined time. Market
data is provided for all relevant positions in the asset classes inter-
est rates, credit spreads, equities, foreign currencies and com-
modities. This market data takes the form of prices quoted directly
on the market or market data such as yield and credit spread
curves derived using internal methods. A proxy concept is used if
no market data is available for individual exposures. In this case,
prices are derived from those for comparable instruments.
For internal management purposes, a confidence level of
97.5% and a holding period of one day are assumed. The value at
risk concept makes it possible to compare risks over a variety of
business areas. It enables many positions to be aggregated, tak-
ing account of correlations between different assets. This ensures a
consolidated view of the market risk at all times. A comprehen-
sive internal limit system broken down to portfolio level is imple-
mented and represents an important part of internal market risk
management.
The VaR market risk model described above is also used to cal-
culate regulatory required capital. This regulatory capital backing is
required for trading book risks and for currency and commodity
price risks in the banking book. A confidence level of 99% and a
ten-day holding period are used for the regulatory capital adequacy
requirement. These assumptions meet the requirements of the Ba-
sel Committee and other international standards on the manage-
ment of market risk. For certain evaluations, such as backtesting,
the VaR is also calculated on the basis of a one-day holding period.
Introduction Equity capital Risk-oriented overall bank management Specific risk management Appendix 89
D. Marktet risk (MR)
Stress test
As the VaR concept gives a prediction of potential losses on the
assumption of normal market conditions, it is supplemented by the
calculation of stress tests. These stress tests measure the risk to
which Commerzbank is exposed, based on unlikely but still plausi-
ble events. These events may be simulated using extreme move-
ments on various financial markets. The key scenarios relate to
major changes in credit spreads, interest rates and yield curves,
exchange rates, share prices and commodities prices. Events sim-
ulated in stress tests include all stock prices falling by 15%, a par-
allel shift in the yield curve or changes to the curve’s steepness.
Extensive Group-wide stress tests and scenario analyses are
carried out as part of risk monitoring. The Bank-wide stress test
calculation is based on a combination of short-term stress test
scenarios and scenarios based on macro-economic variables. The
stress test framework is completed by portfolio-specific stress
tests and ad-hoc scenario analyses.
Stress tests are intended to simulate the impact of crises and
extreme market conditions on the Bank’s overall market risk posi-
tion. The impact on the respective components of capital and the
income statement is also quantified in these tests.
In order to manage and monitor risks, short-term scenarios are
calculated daily, compared against fixed limits and reported to the
Board of Managing Directors. The longer-term scenarios are cal-
culated on a monthly basis and discussed in the respective com-
mittees.
Model validation
The reliability of the internal model (historic simulation) is moni-
tored in various ways, including by backtesting on a daily basis.
The VaR calculated is set against actually occurring profits and
losses. The VaR used in backtesting is based on the complete his-
toric simulation and therefore represents all components of the
internal model used in the market risk VaR calculation of capital
adequacy requirements at Group level. The process draws a dis-
tinction between “clean P&L” and “dirty P&L” backtesting. In
clean P&L backtesting, exactly the same positions in the income
statement are used as were used for calculating the VaR. This
means that the profits and losses result only from changes in mar-
ket prices (hypothetical changes in the portfolio value).
In dirty P&L backtesting, by contrast, profits and losses from
newly concluded and expired transactions from the day under
consideration are also included (actual profits and losses induced
by portfolio value changes). Profits and losses from valuation ad-
justments and model reserves are factored into dirty and clean
P&L according to the regulatory requirements. If the actual loss
exceeds the VaR, it is described as a negative backtesting outlier.
The analysis of the results of backtesting is used to evaluate the
appropriateness of the market risk model and provides an informa-
tive basis for checking parameters as well as for potential im-
provements. In 2019, we saw three negative clean P&L outlier and
two negative dirty P&L outliers. The outliers are all related to ex-
ceptionally strong market movements in response to the Corona
crisis, which by their nature could not be predicted by historically
calibrated VaR models. The underlying market movements ob-
served during these days exceeded the historical fluctuation range
of the 1-year period underlying the historical simulation. The main
factors for the outliers were extended credit spreads, cross-
currency basis spreads and fluctuations in interest rates, stock and
currency rates, as well as extended future-forward base spreads
for precious metals.
It was verified that none of the observed backtesting outliers
were caused by model weaknesses. Backtesting is also used by the
supervisory authorities for evaluating internal risk models. Nega-
tive outliers are classified by means of a traffic-light system laid
down by the supervisory authorities and may lead to additional
factors in the capital calculation.
Since the above-mentioned exceedances were not due to inad-
equacies of the internal models, Commerzbank was granted per-
mission to exclude the above-mentioned Corona-related three
clean P&L and two dirty P&L outliers from the calculation of the
surcharge factor of March 2020. Commerzbank's capital base is
not currently affected by this. This is identical with and without
exclusion of the backtesting outlier.

90 Commerzbank Disclosure Report 2020
EU MR4: Comparison of VaR estimates with gains/losses (clean)
EU MR4: Comparison of VaR estimates with gains/losses (dirty)
The individual components of the internal model are regularly val-
idated for their appropriateness for risk measurement. These in-
clude the underlying model assumptions and parameters and the
proxies used. Validation analyses are planned and carried out
based on the validation concept. The scope and frequency of the
validations are defined in the validation concept by means of a
materiality and risk-oriented prioritisation. The validation planning
and progress is regularly presented to the Validation Committee,
which discusses and approves the validation results.
The validation results are also reported to the Group Market
Risk Committee on a quarterly basis. The identification and elimi-
nation of model weaknesses are of particular importance.
Quantitative information on market risks
Pursuant to Article 92 (3) b) and c) CRR, adequate capital must be
set aside for market risk positions. Commerzbank uses an internal
market risk model to calculate the regulatory capital requirement.
This affects both the equity price and interest rate-related risk
positions in the trading book as well as the currency positions
and commodity positions. The standardised approaches are ap-
plied for smaller units in the Commerzbank Group in accordance
with the partial use option.
EU MR1: Market risk under the standardised approach a b
€m RWAs Capital requirements
Outright products
1 Interest rate risk (general and specific) 329 26
2 Equity risk (general and specific) – –
3 Foreign exchange risk 382 31
4 Commodity risk – –
Options
5 Simplified approach – –
6 Delta-plus method 2 0
7 Scenario approach – –
8 Securitisations (specific risk) – –
9 Collective investment undertakings 2 0
10 Total 715 57
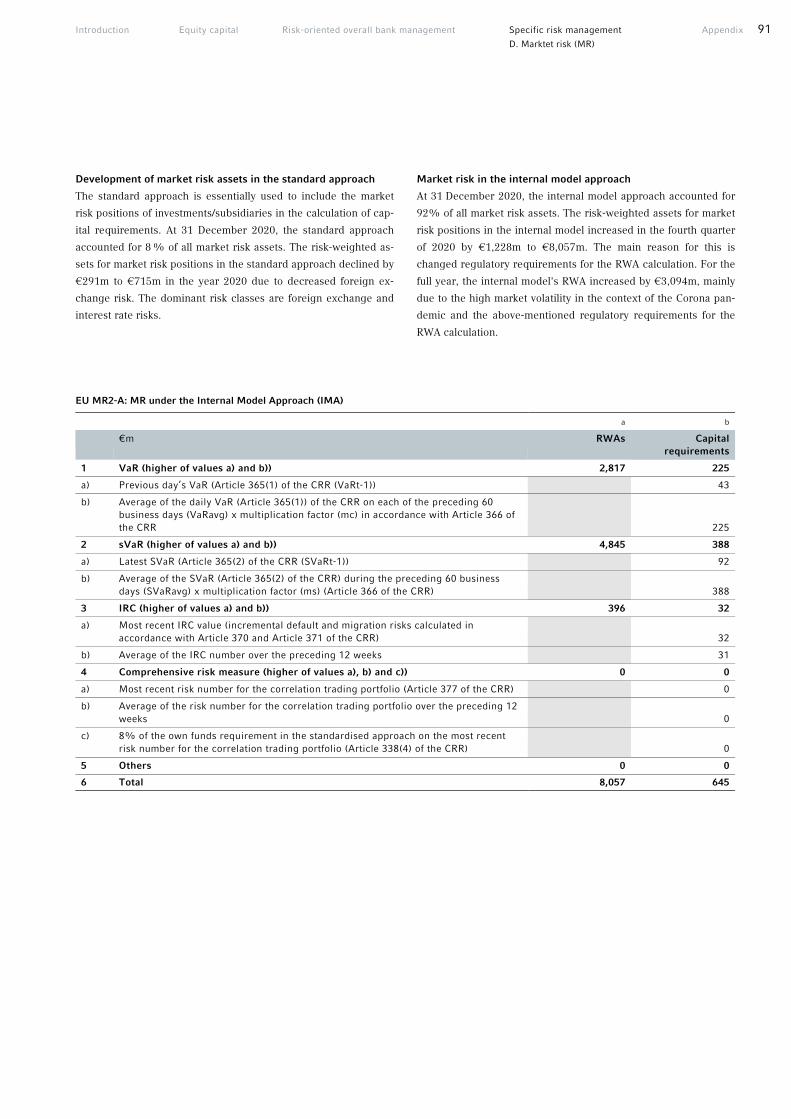
Introduction Equity capital Risk-oriented overall bank management Specific risk management Appendix 91
D. Marktet risk (MR)
Development of market risk assets in the standard approach
The standard approach is essentially used to include the market
risk positions of investments/subsidiaries in the calculation of cap-
ital requirements. At 31 December 2020, the standard approach
accounted for 8 % of all market risk assets. The risk-weighted as-
sets for market risk positions in the standard approach declined by
€291m to €715m in the year 2020 due to decreased foreign ex-
change risk. The dominant risk classes are foreign exchange and
interest rate risks.
Market risk in the internal model approach
At 31 December 2020, the internal model approach accounted for
92% of all market risk assets. The risk-weighted assets for market
risk positions in the internal model increased in the fourth quarter
of 2020 by €1,228m to €8,057m. The main reason for this is
changed regulatory requirements for the RWA calculation. For the
full year, the internal model's RWA increased by €3,094m, mainly
due to the high market volatility in the context of the Corona pan-
demic and the above-mentioned regulatory requirements for the
RWA calculation.
EU MR2-A: MR under the Internal Model Approach (IMA) a b
€m RWAs Capital requirements
1 VaR (higher of values a) and b)) 2,817 225
a) Previous day’s VaR (Article 365(1) of the CRR (VaRt-1)) 43
b) Average of the daily VaR (Article 365(1)) of the CRR on each of the preceding 60 business days (VaRavg) x multiplication factor (mc) in accordance with Article 366 of the CRR 225
2 sVaR (higher of values a) and b)) 4,845 388
a) Latest SVaR (Article 365(2) of the CRR (SVaRt-1)) 92
b) Average of the SVaR (Article 365(2) of the CRR) during the preceding 60 business days (SVaRavg) x multiplication factor (ms) (Article 366 of the CRR) 388
3 IRC (higher of values a) and b)) 396 32
a) Most recent IRC value (incremental default and migration risks calculated in accordance with Article 370 and Article 371 of the CRR) 32
b) Average of the IRC number over the preceding 12 weeks 31
4 Comprehensive risk measure (higher of values a), b) and c)) 0 0
a) Most recent risk number for the correlation trading portfolio (Article 377 of the CRR) 0
b) Average of the risk number for the correlation trading portfolio over the preceding 12 weeks 0
c) 8% of the own funds requirement in the standardised approach on the most recent risk number for the correlation trading portfolio (Article 338(4) of the CRR) 0
5 Others 0 0
6 Total 8,057 645

92 Commerzbank Disclosure Report 2020
EU MR2-B: RWA flow statements of market risk exposures under the Internal Model Approach (IMA) a b c d e f g
€m VaR SVaR IRC Comprehensive risk measure
Others Total RWAs
Total capital requirement
1 RWA at previous quarter end 2,357 4,050 422 0 0 6,829 546
1a Regulatory adjustment 0 0 0 0 0 0 0
1b RWA at previous quarter end (end of day) 2,357 4,050 422 0 0 6,829 546
2 Movement in risk levels – 32 – 68 – 26 0 0 – 126 – 10
3 Model updates/changes 0 8 0 0 0 8 1
4 Methodology and policy 492 855 0 0 0 1,347 108
5 Acquisitions and disposals 0 0 0 0 0 0 0
6 Foreign exchange movements1 0 0 0 0 0 0 0
7 Others 0 0 0 0 0 0 0
8a RWA at the end of the reporting period (end of day) 2,817 4,845 396 0 0 8,057 645
8b Regulatory adjustment 0 0 0 0 0 0 0
8 RWA at the end of the reporting period 2,817 4,845 396 0 0 8,057 645
1 Changes of RWA which are due to foreign exchange movements are reported under „Movement in risk levels“.

Introduction Equity capital Risk-oriented overall bank management Specific risk management Appendix 93
D. Marktet risk (MR)
Market risk in the trading book
Below, we show how the regulatory market risk ratios of the trad-
ing book portfolio developed. Most of Commerzbank’s trading
book positions derive from the Corporate Clients segment and
Treasury division.
The value at risk (10 days 99%) increased in the course of the
year from €18m at year-end 2019 to €38m as at 31 December
2020. The main reason for this is the increased market volatility in
the context of the Corona crisis, which has led to new extreme
scenarios in the VaR calculation.
The market risk profile is diversified across all asset classes, in-
terest rate risk, foreign exchange risk as well as credit spread,
commodity and inflation risks. The equity price risk has decreased
significantly due to the sale of the equity business.
Further risk ratios are calculated for regulatory capital adequa-
cy. This includes the calculation of stressed VaR. Stressed VaR is
calculated using the internal model on the basis of the VaR meth-
od described above. The main difference lies in the market data
used to value the assets. Stressed VaR measures the risk in the
present position in the trading book by reference to market
movements from a specified crisis period in the past. The crisis
observation period used for this is checked regularly through
model validation and approval processes and adjusted where nec-
essary. The crisis observation period remained the same in the
course of the year.
In addition, the incremental risk charge and the equity event
VaR figures quantify the risk of deterioration in creditworthiness
and event risks in trading book positions. Equity event VaR is con-
ceptually part of the historical simulation taking into account em-
pirical equity events over long observation periods. It is a compo-
nent in the regulatory VaR calculation and included in the values
of the following table EU MR3. Commerzbank does not have an
internal model for correlation trading activities.
The incremental risk charge is based on the credit VaR model
with historical data for rating migration and default probabilities
and for recovery factors. The model shows current gains and losses
on positions in the event of rating changes. In addition, in calculat-
ing the incremental risk charge, assumptions are made regarding
liquidity (average regrouping/liquidity horizon). These liquidity ho-
rizons are set on a portfolio-specific basis, taking into account mar-
ket structure and activity and concentrations of positions.
Stressed VaR (10 days 99%) increased by €9m year-on-year to
€90m, mainly due to exposure changes in the Treasury and corpo-
rate customers segment. The incremental risk charge increased by
€6m to €20m. This was due to exposure changes in the Corporate
Clients segment.
EU MR3: IMA values for trading portfolios €m a
VaR (10 day 99%)
1 Maximum value 99
2 Average value 41
3 Minimum value 15
4 Period end 38
sVaR (10 day 99%)
5 Maximum value 115
6 Average value 89
7 Minimum value 65
8 Period end 90
IRC (99.9%)
9 Maximum value 59
10 Average value 23
11 Minimum value 13
12 Period end 20
Comprehensive risk capital charge (99.9%)
13 Maximum value -
14 Average value -
15 Minimum value -
16 Period end -
addMR1: Incremental Risk Charge by sub-portfolio Sub-portfolio IRC1
€m
Average regrouping horizon | months
Corporate Customers 20 7
Treasury 0.8 12
1 Excluding diversification effects between sub-portfolios.
Market liquidity risk
The market liquidity risk is the risk of the Bank not being able to
liquidate or hedge risky positions in a timely manner, to the de-
sired extent and on acceptable terms as a result of insufficient li-
quidity in the market.
Market liquidity risk is taken into account in Commerzbank’s
risk-bearing capacity concept by scaling the value at risk to one
year, i.e. the implicitly recognised liquidation period. Additional
valuation adjustments for market liquidity risk are also reflected in
the calculation of the risk coverage capital.

94 Commerzbank Disclosure Report 2020
Interest rate risk in the banking book
Interest rate risk is one of the most significant financial risks
posed by banking operations. This includes in particular the risk of
value adjustments as a result of interest rate fluctuations over time.
The maturity of interest rate positions and their refinancing struc-
ture are fundamental factors in the management of interest rate
risks. In commercial business, the modelling of interest rate risk
includes assumptions on early repayments and on investor behav-
iour when deposits are open-ended. The risk of a flattening or
steepening in the yield curve is also covered. Interest rate risks
may also arise if positions are closed as a result of hedging trans-
actions with a different pricing type to the underlying transaction
(basis risks). Interest rate risks relate to Commerzbank’s banking
book and trading book. The combined position of both books re-
sults in Commerzbank’s overall interest rate risk.
Strategy and organisation
The interest rate risk in the Commerzbank Group’s banking book
primarily results from commercial business. Interest rate risks
arise here if interest rate positions in customer business are not
hedged or are only partially hedged. Interest rate risks also arise
from the investment models used by the central ALCO (Asset Lia-
bility Committee), which comprise in particular the investment
and/or refinancing of products without contractually fixed interest
rates, e.g. for equity capital, savings and sight deposits.
In the Commerzbank Group, interest rate risk in the banking
book is the responsibility of Group Treasury within the scope of
the business strategy. In addition to the positions of the central
Group Treasury division, the treasury activities of branches and all
subsidiaries are also taken into consideration.
Treasury’s main tasks include the management of the balance
sheet structure and of liquidity risks. The aim is to generate a posi-
tive interest margin from interest income and refinancing expens-
es. This gives rise to interest rate risks if positions are not re-
financed with matching maturities and matching currencies.
Management
Commerzbank jointly manages interest rate risk from both the
trading and banking book, as well as managing this risk separately
for the trading book and banking book. This is done strategically
by means of risk policies and operationally by means of appropri-
ate limit systems. The risks are consolidated in central risk man-
agement. Central risk management is supplemented by a risk
management unit for Treasury within the market risk function.
Interest rate risks in the banking book are managed in line with
the business strategy by means of maturity- and currency-
congruent refinancing and the use of interest rate derivatives. For
example, interest rate swaps with sufficient market liquidity ena-
ble a prompt response to management measures. However, some
products without fixed maturities, such as sight and savings de-
posits or equity capital, are available to the Bank in the long term.
Here the Bank uses appropriate models to manage interest rate
risks and stabilise earnings performance. Our models are regularly
monitored.
Quantitative information on interest rate risks in the banking
book
The measurement of interest rate risk is completely integrated into
the Bank’s daily measurement and monitoring of risk. As with the
measurement of trading book risks, risks in the banking book are
also quantified using the value at risk method. Stress tests and
scenario analyses are also calculated on a daily and monthly basis.
The stress test calculations as mentioned above are used for this
purpose. This standardised procedure is intended to ensure trans-
parency of interest rate risks in both the trading and banking book.
A further control variable for interest rate risks in the banking
book is interest rate sensitivities. These indicate how interest in-
come varies following a change in interest rates, for example of
one basis point (bp). Interest rate sensitivities are also monitored
on a daily and monthly basis. This monitoring takes place at both
portfolio and segment level as well as for the Commerzbank Group.
For management purposes, interest rate sensitivities are limited to
the various maturity bands at both Group and segment level. The
main focus is on interest rate sensitivities relating to long maturity
periods.
To manage its commercial business Commerzbank uses inter-
est rate risk models for the illustration of customer behavior risk
on the asset side (early repayments of mortgage loans and con-
sumer loans) and on the liabilities side (deposits without a fixed
term).
Deposits are modeled using replication portfolios, depending
on the product, segment and legal entity. The replication portfoli-
os are intended to reflect the economic maturity of the deposit and
ensure stable returns. An economically expected repayment pro-
file is derived for fixed-interest mortgage loans and consumer
loans. Interest rate risk management is then operated on this basis.

Introduction Equity capital Risk-oriented overall bank management Specific risk management Appendix 95
D. Marktet risk (MR)
The impact of an interest rate shock on the economic value of
the Group’s banking books is simulated monthly in compliance
with regulatory requirements. In accordance with the Banking Di-
rective, the Federal Financial Supervisory Authority (BaFin) and
the European Central Bank (ECB) have prescribed two uniform,
sudden and unexpected changes in interest rates (+/–200 basis
points) to be used by all banks, which have to report on the results
of this stress test every quarter.
On this basis, the interest rate shift of +200 basis points would
give a potential loss of €2,776m, and the shift of –200 basis points
a potential economic gain of €343m as at 31 December 2020.
Commerzbank does therefore not need to be classified as a bank
with higher interest rate risk as the negative changes in present
value account for less than 20% of regulatory capital.
addMR2: Interest rate risk in the banking book by currency €m 2020 2019
Interest rate shock – 200bp +200bp – 200bp +200bp
EUR 220 – 2,051 119 – 2,050
USD 71 – 235 75 – 91
GBP 69 – 365 322 – 388
JPY – 39 14 0 48
CHF – 3 8 0 – 13
Others 26 – 148 97 – 140
Total 343 – 2,776 614 – 2,635

96 Commerzbank Disclosure Report 2020
We define liquidity risk in a narrower sense as the risk that
Commerzbank will be unable to meet its payment obligations on a
day-to-day basis. In a broader sense, liquidity risk describes the
risk that future payments cannot be funded for the full amount, in
the required currency or at standard market conditions, as and
when they are due.
Risk management
Strategy and organisation
The Board of Managing Directors adopts the business strategy
and the Bank’s risk tolerance, which is associated with it. Liquidity
risk tolerance is then operationalised by defining the liquidity re-
serve period and the limit framework. In order to ensure an ap-
propriate liquidity risk management process, the Board of Manag-
ing Directors delegates certain competences and responsibilities
in connection with the Group-wide liquidity risk strategy to the
risk and treasury functions.
The central Asset Liability Committee (ALCO) is responsible for
limiting, analysing and monitoring liquidity risk and for strategic
liquidity positioning. ALCO is supported by various sub-commit-
tees in this.
Risk management
Commerzbank uses a wide range of tools to manage and monitor
liquidity risks on the basis of its internal liquidity risk model. The
stress scenario within the Bank that underlies the model and is
relevant for management purposes allows for the impact of both a
bank-specific stress event and a broader market crisis. Binding
regulatory requirements are an integral component of the man-
agement mechanism.
Group Treasury is responsible for the Group’s liquidity man-
agement operations. Group Treasury is represented in all major
locations of the Group in Germany and abroad and has reporting
lines into all subsidiaries.
Commerzbank manages its global liquidity centrally using cash
pooling. This approach ensures liquidity resources are used effi-
ciently and that this occurs across all time zones, as Group Treas-
ury units are located in Frankfurt, London, New York and Singa-
pore.
Additional information on this subject can be found in the sec-
tion “Funding and liquidity of the Commerzbank Group” in the
Annual Report 2019 from page 79. Liquidity risk is monitored on
the basis of the Bank’s own liquidity risk model by the independ-
ent risk function.
The Bank has established early warning indicators for the pur-
pose of managing liquidity risk. These ensure that appropriate
steps can be taken in good time to secure long-term financial so-
lidity.
Risk concentrations can lead to increased outflows of liquidity,
particularly in a stress situation, and thus to increased liquidity
risk. They can, for example, occur with regard to maturities, large
individual creditors or currencies. By means of ongoing monitor-
ing and reporting, emerging risk concentrations in funding can be
recognised in a timely manner and mitigated through suitable
measures.
This is also applicable for payment obligations in foreign cur-
rencies. In addition, the Bank also mitigates a concentration by
continuously using broadly diversified sources of funding, particu-
larly diverse customer deposits and capital market instruments.
Commerzbank also ensures that it monitors foreign exchange
risks and fulfils the currency matching requirements for highly
liquid assets and net liquidity outflows.
In the event of a liquidity crisis, the emergency plan provides
for various measures for different types of crisis that can be
launched by the central ALCO. The emergency plan forms an inte-
gral part of Commerzbank’s recovery plan and is updated at least
once a year, whereas the individual liquidity emergency measures
are checked regularly during the year for plausibility. The emer-
gency plan also defines a clear allocation of responsibilities for the
processes to be followed in emergency situations and gives details
of any action that may need to be taken.
Information on the encumbrance of assets pursuant to Article
443 CRR can be found in the Annual Report 2020, pages 339-341.
Liquidity risk model
A key component of liquidity risk management is the daily calcula-
tion of the liquidity gap profile. The liquidity gap profile shows the
deterministic or stochastic inflows and outflows expected in the
future on a given reporting date and across all portfolios. This
forms the basis for calculating liquidity requirements or excess
liquidity per maturity band. This also includes modelling the pro-
portion of customer deposits that will be permanently available,
known as the core deposit base.
The liquidity gap profile is also used to set the issuance strate-
gy of the Commerzbank Group, which is operationalised by the
Group Treasury division. The Group Finance division is responsi-
ble for calculating and allocating liquidity costs on the basis of the
liquidity gap profile, which are then incorporated in the manage-
ment of the segments’ business activities.
E. Liquidity risk (LR)
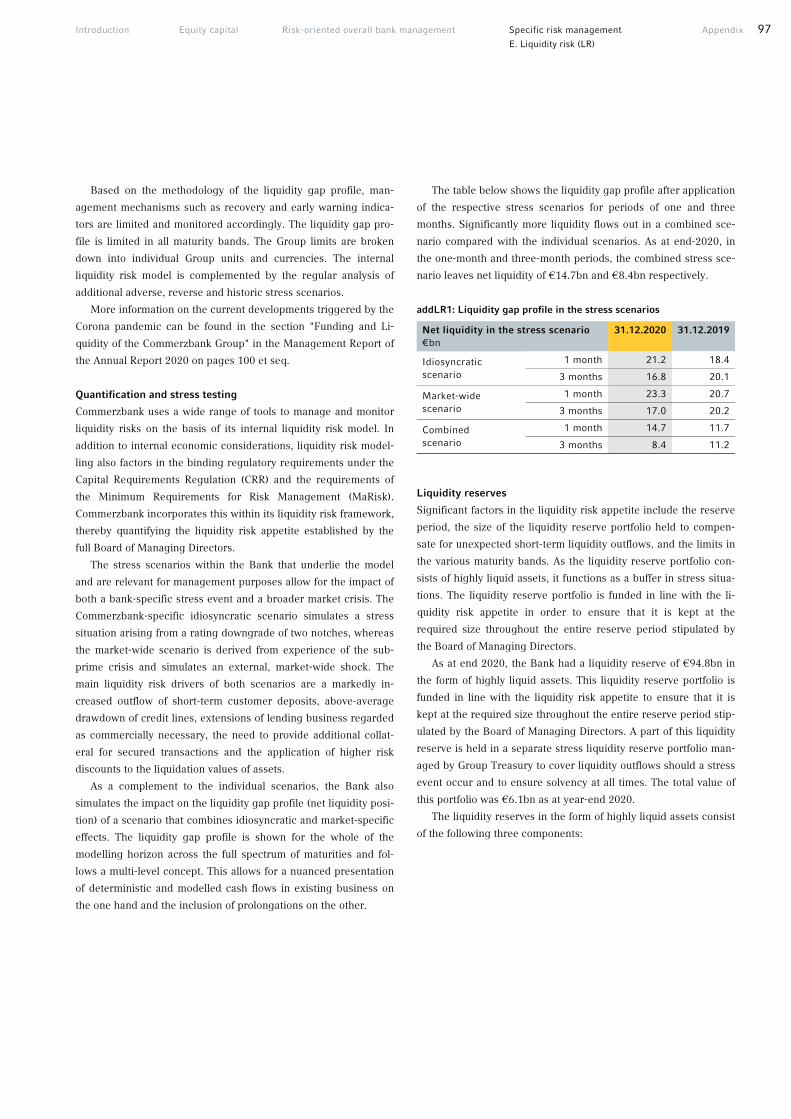
Introduction Equity capital Risk-oriented overall bank management Specific risk management Appendix 97
E. Liquidity risk (LR)
Based on the methodology of the liquidity gap profile, man-
agement mechanisms such as recovery and early warning indica-
tors are limited and monitored accordingly. The liquidity gap pro-
file is limited in all maturity bands. The Group limits are broken
down into individual Group units and currencies. The internal
liquidity risk model is complemented by the regular analysis of
additional adverse, reverse and historic stress scenarios.
More information on the current developments triggered by the
Corona pandemic can be found in the section "Funding and Li-
quidity of the Commerzbank Group" in the Management Report of
the Annual Report 2020 on pages 100 et seq.
Quantification and stress testing
Commerzbank uses a wide range of tools to manage and monitor
liquidity risks on the basis of its internal liquidity risk model. In
addition to internal economic considerations, liquidity risk model-
ling also factors in the binding regulatory requirements under the
Capital Requirements Regulation (CRR) and the requirements of
the Minimum Requirements for Risk Management (MaRisk).
Commerzbank incorporates this within its liquidity risk framework,
thereby quantifying the liquidity risk appetite established by the
full Board of Managing Directors.
The stress scenarios within the Bank that underlie the model
and are relevant for management purposes allow for the impact of
both a bank-specific stress event and a broader market crisis. The
Commerzbank-specific idiosyncratic scenario simulates a stress
situation arising from a rating downgrade of two notches, whereas
the market-wide scenario is derived from experience of the sub-
prime crisis and simulates an external, market-wide shock. The
main liquidity risk drivers of both scenarios are a markedly in-
creased outflow of short-term customer deposits, above-average
drawdown of credit lines, extensions of lending business regarded
as commercially necessary, the need to provide additional collat-
eral for secured transactions and the application of higher risk
discounts to the liquidation values of assets.
As a complement to the individual scenarios, the Bank also
simulates the impact on the liquidity gap profile (net liquidity posi-
tion) of a scenario that combines idiosyncratic and market-specific
effects. The liquidity gap profile is shown for the whole of the
modelling horizon across the full spectrum of maturities and fol-
lows a multi-level concept. This allows for a nuanced presentation
of deterministic and modelled cash flows in existing business on
the one hand and the inclusion of prolongations on the other.
The table below shows the liquidity gap profile after application
of the respective stress scenarios for periods of one and three
months. Significantly more liquidity flows out in a combined sce-
nario compared with the individual scenarios. As at end-2020, in
the one-month and three-month periods, the combined stress sce-
nario leaves net liquidity of €14.7bn and €8.4bn respectively.
addLR1: Liquidity gap profile in the stress scenarios Net liquidity in the stress scenario €bn
31.12.2020 31.12.2019
Idiosyncratic scenario
1 month 21.2 18.4
3 months 16.8 20.1
Market-wide scenario
1 month 23.3 20.7
3 months 17.0 20.2
Combined scenario
1 month 14.7 11.7
3 months 8.4 11.2
Liquidity reserves
Significant factors in the liquidity risk appetite include the reserve
period, the size of the liquidity reserve portfolio held to compen-
sate for unexpected short-term liquidity outflows, and the limits in
the various maturity bands. As the liquidity reserve portfolio con-
sists of highly liquid assets, it functions as a buffer in stress situa-
tions. The liquidity reserve portfolio is funded in line with the li-
quidity risk appetite in order to ensure that it is kept at the
required size throughout the entire reserve period stipulated by
the Board of Managing Directors.
As at end 2020, the Bank had a liquidity reserve of €94.8bn in
the form of highly liquid assets. This liquidity reserve portfolio is
funded in line with the liquidity risk appetite to ensure that it is
kept at the required size throughout the entire reserve period stip-
ulated by the Board of Managing Directors. A part of this liquidity
reserve is held in a separate stress liquidity reserve portfolio man-
aged by Group Treasury to cover liquidity outflows should a stress
event occur and to ensure solvency at all times. The total value of
this portfolio was €6.1bn as at year-end 2020.
The liquidity reserves in the form of highly liquid assets consist
of the following three components:

98 Commerzbank Disclosure Report 2020
addLR2: Liquidity reserves from highly liquid assets Liquidity reserves from highly liquid assets | €bn
31.12.2020 31.12.2019
Highly liquid assets 94.8 72.4
of which level 1 85.6 59.6
of which level 2A 8.6 11.5
of which level 2B 0.6 1.3
Liquidity ratios
Throughout 2020, Commerzbank’s internal liquidity ratios, includ-
ing the regulatory liquidity coverage ratio (LCR), were at all times
above the limits set by the Board of Managing Directors. The same
is true of compliance with the survival period calculation set down
by MaRisk.
The LCR is calculated as the ratio of liquid assets to net liquidity
outflows under stressed conditions. It is used to measure whether a
bank has a large enough liquidity buffer to independently withstand
any potential imbalance between inflows and outflows of liquidity
under stressed conditions over a period of 30 calendar days.
In 2020, Commerzbank significantly exceeded the minimum ra-
tio of 100% stipulated for that year on every reporting date. As at
the end of 2020, the average month-end value of the LCR over the
last twelve months was 135.68% (year-end 2019: 132.72%).
The Bank has established corresponding limits and early warn-
ing indicators to ensure the LCR minimum requirements are met.
Further information on liquidity risk and the liquidity coverage
ratio (LCR) according to the guideline on LCR disclosure –
EBA/GL/2017/01 – can be found in the Annual Report 2020 in the
section “Funding and liquidity of the Commerzbank Group” and in
Note (65) (Liquidity Coverage Ratio) of the appendix.

Introduction Equity capital Risk-oriented overall bank management Specific risk management Appendix 99
F. Operational risk (OR)
Based on the Capital Requirements Regulation (CRR), Commerz-
bank defines operational risk (OpRisk) as the risk of loss resulting
from the inadequacy or failure of internal processes, people and
systems or from external events. This definition includes legal
risks; it does not cover strategic or reputational risks. In view of
their increased economic significance, compliance risk and cyber
risk are managed as separate risk types. In line with the CRR,
however, losses from compliance and cyber risks are still incorpo-
rated into the model for determining the regulatory and economic
capital required for operational risks.
Risk management
Strategy and organisation
Within Commerzbank, OpRisk and governance issues of the inter-
nal control system (ICS) are closely connected in terms of both
organisational structure and methodology and are continuously
being enhanced. This is because many OpRisk cases are closely
linked with failures in the control mechanisms. A properly func-
tioning ICS thereby helps to reduce or avoid losses from opera-
tional risks and thus to lower the amount of capital required to
cover operational risks in the medium to long term. Conversely,
the operational risk management systems enable the ICS to adapt
itself consistently to them.
The further development of the ICS structure is an essential
aspect of the pro-active reduction or prevention of operational
risks. Accordingly, the governance of the ICS was reoriented in the
course of the Campus 2.0 realignment through extended phases of
risk identification, control inventory and control evaluation in or-
der to enable the units an efficient execution. In addition, a new
aggregated role bundle OpRisk & BCM Manager was created with-
in Campus 2.0, which includes the role of the ICS manager. All
new role owners were additionally trained with the help of infor-
mation events.
Chaired by the CRO, the Group OpRisk Committee meets at
least four times a year and deals with the management of opera-
tional risks within the Commerzbank Group. It also acts as the es-
calation and decision-making committee for key OpRisk topics that
span all areas. The Management Boards and/or the Segment
Committees with responsibility for operational risk deal with the
management of operational risk in the relevant units. They analyse
OpRisk issues that affect them, such as loss events, and define
subsequent measures or recommend action.
Commerzbank’s OpRisk strategy is approved on an annual ba-
sis by the full Board of Managing Directors after it has been dis-
cussed and voted upon in the Group OpRisk Committee. The
OpRisk strategy describes the risk profile, key elements of the de-
sired risk culture, its management framework and measures to be
taken by Commerzbank to manage operational risk.
As such, OpRisk management is based on three consecutive
levels (three lines of defence) which, when taken together, are
crucial for reaching the given strategic aims.
Risk management
Commerzbank takes an active approach to managing operational
risk, aiming to systematically identify OpRisk profiles and risk
concentrations and to define, prioritise and implement risk mitiga-
tion measures.
Operational risks are characterised by asymmetric distribution
of losses. This means that most of the losses are relatively small,
while isolated losses with a very low probability of occurrence
have the potential to be large and devastating. This makes it nec-
essary not only to limit high loss potential but also to proactively
manage losses that can be expected to occur frequently.
To do this, Commerzbank has set up a multi-stage system that
brings together the defined limits on economic capital (risk ca-
pacity) and those set for operational risk management during the
year (risk appetite/tolerance), complemented by rules on the
transparent and conscious acceptance and approval of individual
risks (risk acceptance).
OpRisk management includes an annual evaluation of the
Bank’s ICS and a risk scenario assessment. OpRisk loss events are
also subject to ongoing analysis and ICS backtesting on an event-
driven basis. Lessons learned activities are carried out after all
material loss events. External OpRisk events at competitors are
also systematically evaluated.
A structured, centralised and decentralised reporting system
ensures that the management of the Bank and its segments, mem-
bers of the OpRisk Committee and the supervisory bodies are in-
formed regularly, promptly and fully about operational risk.
OpRisk reports are produced quarterly. They contain changes in
OpRisk losses, the segments’ main loss events, current risk anal-
yses, changes in the capital requirement and the status of
measures implemented. Operational risks are also part of the
regular risk reporting process to the Board of Managing Directors
and to the Risk Committee of the Supervisory Board.
F. Operational risk (OR)

100 Commerzbank Disclosure Report 2020
OpRisk model
Commerzbank measures regulatory and economic capital for oper-
ational risk using the advanced measurement approach (AMA). The
capital charge determined using quantitative methods is supple-
mented by qualitative components, in line with the requirements of
CRR. The AMA is applied throughout the group.
Quantitative components
The AMA model’s quantitative components include internal and
external OpRisk loss data along with mathematical/statistical mod-
elling.
Group-wide internal OpRisk loss data in line with regulatory re-
quirements is collected mandatory from a starting threshold of
€10,000 in a Group-wide loss database. As the internally calculated
loss data history cannot always reflect extreme OpRisk events ade-
quately, external OpRisk events are also be factored into the AMA
model. For this purpose, we use relevant external loss data from
the Operational Riskdata eXchange Association (ORX), Genf, an
international data consortium. For mathematical/statistical model-
ling, the data is grouped by combinations of business line, event
category and region. Loss frequency is modelled on the basis of
internal loss data, while distribution is modelled on the basis of in-
ternal and external loss data.
Modelling of insurance and alternative OpRisk transfers does
not currently take place.
Qualitative components
Qualitative methods (risk scenario assessment and business envi-
ronment and control system) are used to complement the infor-
mation from the quantitative model components.
The risk scenario assessment is an ex-ante risk assessment of
operational risks. Based on expert opinions and in accordance with
the requirements of the Capital Requirement Regulation (CRR),
they serve to identify exceptional but plausibly possible risk events
which could jeopardise the Bank’s existence or severely affect its
results and incorporate these into modelling.
The business environment and control (BEC) system provides
incentives to reduce operational risk and improve risk management.
Business environment and internal control factors are shown in the
OpRisk model in the form of add-ons and reductions to regulatory
and economic OpRisk capital requirements. The BEC system takes
into account the following qualitative OpRisk elements:
Internal control system (ICS): As part of the annual ICS review,
the company-wide ICS control mechanism is evaluated in terms
of its functionality. To ensure that the internal control system
factors are properly represented, the ICS as a BEC subject area
consists of three components: ICS self-assessment (assessment
by the units carrying out the controls), ICS testing (independent
review by internal audit) and ICS documentation (modelling sta-
tus in the Bank’s process model).
Human resources risk: The human resources risk report pre-
pared by the Group Human Resources division takes into ac-
count current areas of human resources activity and presents
risk information on the basis of set criteria.
IT risk: The IT risk report prepared by the Cyber Risk and In-
formation Security division brings together data relating to IT
risk in the areas of IT security and incidents. The data cover the
four IT security targets: confidentiality, integrity, availability and
transparency. In addition, an assessment of the adequacy and
implementation of emergency plans will be included in the BEC.
Key risk indicators (KRIs): KRIs are used to manage operational
risk proactively by means of early warning signals.
OpRisk management: The OpRisk & ICS area evaluates the ac-
tive OpRisk management of the material units on the basis of a
uniform list of criteria. Information on the progress made
towards processing audit findings is also included in the BEC
system.
Top-level adjustments (TLAs): TLAs are only used in well-
founded exceptional cases to establish a risk buffer for extraor-
dinary changes in the OpRisk environment and include this in
the OpRisk capital requirement calculation at short notice. No
TLAs are currently applied.
Stress testing and validation
As an integral part of risk management and the risk-bearing capaci-
ty concept, stress tests for operational risk are carried out on a reg-
ular basis. As a basis for the stress methodology, the AMA model is
consistently used to determine the capital requirement, with suita-
ble increases in the relevant influencing factors (such as losses).

Introduction Equity capital Risk-oriented overall bank management Specific risk management Appendix 101
F. Operational risk (OR)
To ensure that the AMA model remains appropriate, the meas-
urement approach is validated on a regular basis. The validation
covers assessments of both quantitative and qualitative components
and the interaction between them. The validation of all AMA com-
ponents conducted in 2018 confirmed the appropriateness of the
model. As part of the ongoing development of the AMA measure-
ment system, not-significant changes are planned or have already
been implemented. No need for material additions or changes was
identified.
Outlook
The Commerzbank framework for operational risk management is
continuously reviewed and further developed. At present, the focus
is on supporting the strategic measures of Commerzbank.
The bank takes account of the increasing regulatory require-
ments relating to sustainability (Environmental, Social & Gov-
ernance risks, ESG) through active consultation of relevant regula-
tory proposals and close follow-up of new ESG regulations as well
as an anticipative analysis of the associated implementation needs.
In 2021, the planned integration of comdirect Bank and the associ-
ated inclusion of OpRisk and IKS-related topics in the methodology
and applications of Commerzbank AG will be implemented.
The IT applications for recording the internal loss data (OpRisk
Suite) as well as the ICS tool as a central management tool for the
inventory of IKS information, as well as the corresponding AMA
methods, are being further developed in both the central functions
and the delivery organization.
In the regulatory environment the implementation plan of the
Basel Committee provides for the introduction of the standardised
approach for calculating operational risk (OpRisk) regulatory capi-
tal requirements from 1 January 2023.

102 Commerzbank Disclosure Report 2020
Beyond the risk types explicitly mentioned in the CRR and pre-
sented in the previous chapters, the following risk types were clas-
sified as material in the risk inventory for 2020 and are subject to
active management within the Commerzbank Group:
Compliance risk
Cyber risk
Physical asset risk
Business risk
Reputational risk
Model risk.
Information on taking into account the physical asset risk, invest-
ment portfolio risk and business risk can be found in the chapter
on risk-bearing capacity and stress testing in this report. Details
on the other risks, particularly on the reputational risk and human
resources risk (a sub-category of operational risk) can be found in
the risk report of the Annual Report 2020 from page 155 onwards.
G. Other risks

Introduction Equity capital Risk-oriented overall bank management Specific risk management Appendix 103
Appendix
Appendix 1: Outline of the differences in the scopes of consolidation (entity by entity)
Appendix 2: Calculation of the institution-specific countercyclical capital buffer
Appendix 3: Supplement to equity structure (CAP1)
Appendix 4: Material geographical regions or countries
Appendix 5: Credit risk parameters by geographical location
Appendix 6: Overview – Compliance with the CRR requirements
List of abbreviations
Disclaimer
Appendix 1: Outline of the differences in the scopes of consolidation (entity by entity)
While for Commerzbank Group’s Annual Report pursuant to the
German Commercial Code the consolidation is based on IFRS, the
information in the Disclosure Report is based on the group of com-
panies consolidated for regulatory purposes.
Subsiduaries or companies controlled by the ultimate parent
company according to IFRS, which do not belong to the financial
sector are not part of the regulatory consolidation, but they are
included in the consolidated accounts according to IFRS.
In applying article 436 (b) CRR the differences in the scopes of
consolidation for financial accounting and regulatory purposes,
respectively, have to be disclosed by the institutions. For this pur-
pose, EBA/GL/2016/11 (Guidelines on disclosure requirements
under Part Eight of regulation (EU) No 575/2013 (CRR)) provides
the table EU LI3.
All entities for which the method of the accounting consolida-
tion is different from the method of the regulatory consolidation
have to be included in the disclosure. On an entity-by-entity level
the method of accounting consolidation has to be disclosed and
whether and how – under the regulatory scope of consolidation –
the entity is recognised, supplemented by a short description of
the entity.
Commerzbank complies with these requirements through the
table EU LI3 given on the following pages.

104 Commerzbank Disclosure Report 2020
EU LI3: Outline of the differences in the scopes of consolidation (entity by entity)
a b c d e f g
Accounting Regulatory consolidation Description
Name of the entity consolidation full pro rata
neither… nor (1)
deducted of the entity
1. CR Fonds-Verwaltungsgesellschaft mbH not included (2) x Financial institution (financial firm)
10. CR Fonds-Verwaltungsgesellschaft mbH not included (2) x Financial institution (financial firm)
11. CR Fonds-Verwaltungsgesellschaft mbH not included (2) x Financial institution (financial firm)
12. CR Fonds-Verwaltungsgesellschaft mbH not included (2) x Financial institution (financial firm)
13. CR Fonds-Verwaltungsgesellschaft mbH not included (2) x Financial institution (financial firm)
14. CR Fonds-Verwaltungsgesellschaft mbH not included (2) x Financial institution (financial firm)
2. CR Fonds-Verwaltungsgesellschaft mbH not included (2) x Financial institution (financial firm)
3. CR Fonds-Verwaltungsgesellschaft mbH not included (2) x Financial institution (financial firm)
4. CR Fonds-Verwaltungsgesellschaft mbH not included (2) x Financial institution (financial firm)
5. CR Fonds-Verwaltungsgesellschaft mbH not included (2) x Financial institution (financial firm)
6. CR Fonds-Verwaltungsgesellschaft mbH not included (2) x Financial institution (financial firm)
7. CR Fonds-Verwaltungsgesellschaft mbH not included (2) x Financial institution (financial firm)
8. CR Fonds-Verwaltungsgesellschaft mbH not included (2) x Financial institution (financial firm)
9. CR Fonds-Verwaltungsgesellschaft mbH not included (2) x Financial institution (financial firm)
ABANTITIM Grundstücks-Vermietungsgesellschaft mbH not included (2) x Financial institution (financial firm)
ABANTUM Beteiligungsgesellschaft mbH not included (2) x Financial institution (financial firm)
ABELASSA Grundstücks-Vermietungsgesellschaft mbH not included (2) x Financial institution (financial firm)
ABELASSA Grundstücks-Vermietungsgesellschaft mbH & Co. Objekt Witt Weiden KG not included (2) x Financial institution (financial firm)
ABODA Beteiligungsgesellschaft mbH not included (2) x Financial institution (financial firm)
ABORONUM Grundstücks-Vermietungsgesellschaft mbH not included (2) x Financial institution (financial firm)
ABORONUM Grundstücks-Vermietungsgesellschaft mbH & Co. Objekt Berlin KG not included (2) x Financial institution (financial firm)
ACARINA Beteiligungsgesellschaft mbH not included (2) x Financial institution (financial firm)
ACCESSA Grundstücks-Vermietungsgesellschaft mbH not included (2) x Financial institution (financial firm)
ACCOMO Hotel HafenCity GmbH & Co. KG not included (2) x Financial institution (financial firm)
ACILIA Grundstücks-Vermietungsgesellschaft mbH not included (2) x Financial institution (financial firm)
ACINA Grundstücks-Vermietungsgesellschaft mbH not included (2) x Financial institution (financial firm)
ACONITA Grundstücks-Vermietungsgesellschaft mbH not included (2) x Financial institution (financial firm)
ACRONA Photovoltaik-Beteiligungsgesellschaft mbH not included (2) x Financial institution (financial firm)
ACTOSA Grundstücks-Vermietungsgesellschaft mbH not included (2) x Financial institution (financial firm)
ADAMANTA Grundstücks-Vermietungsgesellschaft mbH not included (2) x Financial institution (financial firm)
ADENARA Flugzeug-Leasinggesellschaft mbH not included (2) x Financial institution (financial firm)
ADMEO Vermietungsgesellschaft mbH not included (2) x Financial institution (financial firm)
ADMERA Grundstücks-Vermietungsgesellschaft mbH not included (2) x Financial institution (financial firm)
ADRUGA Verwaltungsgesellschaft mbH not included (2) x Financial institution (financial firm)
ADURAMA Verwaltung und Treuhand GmbH not included (2) x Financial institution (financial firm)
AGARBA Grundstücks-Vermietungsgesellschaft mbH not included (2) x Financial institution (financial firm)
AGASILA Grundstücks-Vermietungsgesellschaft mbH not included (2) x Financial institution (financial firm)
AGUSTO Beteiligungsgesellschaft mbH not included (2) x Financial institution (financial firm)
AHOIH Beteiligungsgesellschaft mbH not included (2) x Financial institution (financial firm)
AJOLA Grundstücks-Vermietungsgesellschaft mbH not included (2) x Financial institution (financial firm)
AKA Ausfuhrkredit-Gesellschaft mbH at equity x Credit institution
AKERA Verwaltung und Treuhand GmbH not included (2) x Financial institution (financial firm)
ALACRITAS Verwaltungs- und Treuhand GmbH not included (2) x Financial institution (financial firm)
ALBELLA Verwaltung und Treuhand GmbH not included (2) x Financial institution (financial firm)
ALBOLA Verwaltung und Treuhand GmbH not included (2) x Financial institution (financial firm)
ALCARDA Grundstücks-Vermietungsgesellschaft mbH & Co. Objekt Tübingen KG not included (2) x Financial institution (financial firm)
ALDINGA Verwaltung und Treuhand GmbH not included (2) x Financial institution (financial firm)
ALDULA Verwaltung und Treuhand GmbH not included (2) x Financial institution (financial firm)
ALEMONA Verwaltung und Treuhand GmbH not included (2) x Financial institution (financial firm)
ALFUTURA Grundstücks-Vermietungsgesellschaft mbH not included (2) x Financial institution (financial firm)
ALIVERA Grundstücks-Vermietungsgesellschaft mbH not included (2) x Financial institution (financial firm)

Introduction Equity capital Risk-oriented overall bank management Specific risk management Appendix 105
a b c d e f g
Accounting Regulatory consolidation Description
Name of the entity consolidation full pro rata
neither… nor (1)
deducted of the entity
ALLATA Grundstücks-Vermietungsgesellschaft mbH not included (2) x Financial institution (financial firm)
ALLORUM Vermietungsgesellschaft mbH not included (2) x Financial institution (financial firm)
ALSENNA Grundstücks-Vermietungsgesellschaft mbH not included (2) x Financial institution (financial firm)
ALUBRA Verwaltung und Treuhand GmbH not included (2) x Financial institution (financial firm)
ALVARA Beteiligungsgesellschaft mbH not included (2) x Financial institution (financial firm)
AMALIA Verwaltung und Treuhand GmbH not included (2) x Financial institution (financial firm)
AMERA Verwaltung und Treuhand GmbH not included (2) x Financial institution (financial firm)
AMONEUS Grundstücks-Vermietungsgesellschaft mbH not included (2) x Financial institution (financial firm)
ANBANA Grundstücks-Vermietungsgesellschaft mbH not included (2) x Financial institution (financial firm)
ANCAVA Grundstücks-Vermietungsgesellschaft mbH not included (2) x Financial institution (financial firm)
ANDINO Beteiligungsgesellschaft mbH not included (2) x Financial institution (financial firm)
ANDINO Dritte Beteiligungsgesellschaft mbH not included (2) x Financial institution (financial firm)
ANDINO Vierte Beteiligungsgesellschaft mbH not included (2) x Financial institution (financial firm)
ANDINO Zweite Beteiligungsgesellschaft mbH not included (2) x Financial institution (financial firm)
ANET Verwaltungsgesellschaft mbH not included (2) x Financial institution (financial firm)
ARAFINA Grundstücks-Vermietungsgesellschaft mbH not included (2) x Financial institution (financial firm)
ARAUNA Verwaltung und Treuhand GmbH not included (2) x Financial institution (financial firm)
AREBA Verwaltung und Treuhand GmbH not included (2) x Financial institution (financial firm)
ARINGO Verwaltungsgesellschaft mbH not included (2) x Financial institution (financial firm)
ARVINA Verwaltung und Treuhand GmbH not included (2) x Financial institution (financial firm)
ASCETO Grundstücks-Vermietungsgesellschaft mbH not included (2) x Financial institution (financial firm)
ASERTUNA Grundstücks-Vermietungsgesellschaft mbH not included (2) x Financial institution (financial firm)
ASERTUNA Grundstücks-Vermietungsgesellschaft mbH & Co. Objekt Schülke-Mayr KG not included (2) x Financial institution (financial firm)
ASKIBA Grundstücks-Vermietungsgesellschaft mbH not included (2) x Financial institution (financial firm)
ASSANDRA Grundstücks-Vermietungsgesellschaft mbH not included (2) x Financial institution (financial firm)
ASSENTO Photovoltaik-Beteiligungsgesellschaft mbH not included (2) x Financial institution (financial firm)
ASSERTA Flugzeug-Leasinggesellschaft mbH not included (2) x Financial institution (financial firm)
ASTIRA Grundstücks-Vermietungsgesellschaft mbH not included (2) x Financial institution (financial firm)
ASTRADA Grundstücks-Vermietungsgesellschaft mbH not included (2) x Financial institution (financial firm)
ASTUTIA Beteiligungsgesellschaft mbH not included (2) x Financial institution (financial firm)
ATUNO Verwaltung und Treuhand GmbH not included (2) x Financial institution (financial firm)
AURESTA Grundstücks-Vermietungsgesellschaft mbH not included (2) x Financial institution (financial firm)
AVENTIMOLA Beteiligungsgesellschaft mbH not included (2) x Financial institution (financial firm)
AVIO Verwaltung und Treuhand GmbH not included (2) x Financial institution (financial firm)
AVOLO Flugzeugleasinggesellschaft mbH not included (2) x Financial institution (financial firm)
Actium Leasobjekt Gesellschaft mbH not included (2) x Financial institution (financial firm)
Alma Atlas Investments Limited not included (2) x Financial institution (financial firm)
Apolline Bail S.A.S. not included (2) x Financial institution (financial firm)
Arvilla Beteiligungsgesellschaft mbH not included (2) x Financial institution (financial firm)
Asekum Sp. z o.o. full (3) x Special purpose entity
BENE Verwaltung und Treuhand GmbH not included (2) x Financial institution (financial firm)
BERGFÜRST Service GmbH not included (2) x Financial institution (financial firm)
BONITAS Mobilien-Vermietungsgesellschaft mbH not included (2) x Financial institution (financial firm)
BONITAS Mobilien-Vermietungsgesellschaft mbH & Co. Objekt Friedrichshafen KG not included (2) x Financial institution (financial firm)
BTG Beteiligungsgesellschaft Hamburg mbH not included (2) x Financial institution (financial firm)
Blue Amber Fund Management S.A. not included (2) x Asset management company
(Fin. Investment mgmt. company)
Bosphorus Capital DAC full (3) x Special purpose entity
Bosphorus Investments DAC full (3) x Special purpose entity
BÜRGSCHAFTSBANK BRANDENBURG GmbH not included (2) x Other financial institution
Bürgschaftsbank Mecklenburg-Vorpommern GmbH not included (2) x Other financial institution
Bürgschaftsbank Sachsen GmbH not included (2) x Other financial institution
Bürgschaftsbank Sachsen-Anhalt GmbH not included (2) x Other financial institution
Bürgschaftsbank Thüringen GmbH not included (2) x Other financial institution
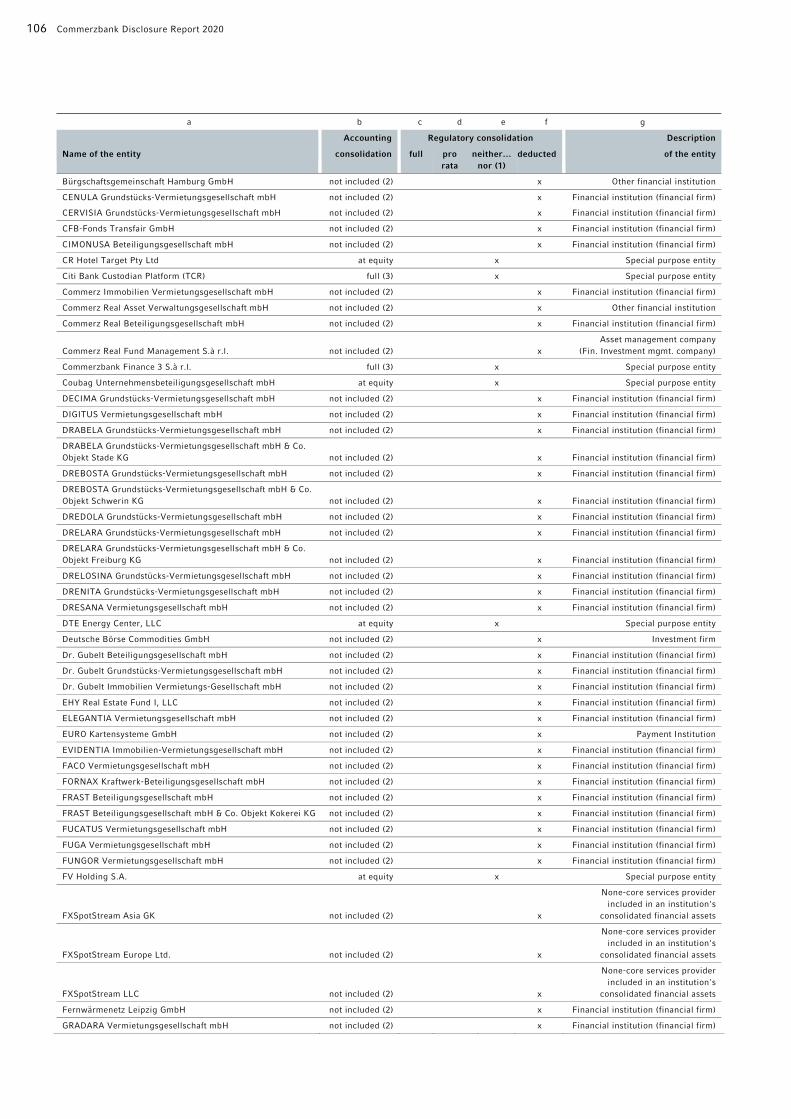
106 Commerzbank Disclosure Report 2020
a b c d e f g
Accounting Regulatory consolidation Description
Name of the entity consolidation full pro rata
neither… nor (1)
deducted of the entity
Bürgschaftsgemeinschaft Hamburg GmbH not included (2) x Other financial institution
CENULA Grundstücks-Vermietungsgesellschaft mbH not included (2) x Financial institution (financial firm)
CERVISIA Grundstücks-Vermietungsgesellschaft mbH not included (2) x Financial institution (financial firm)
CFB-Fonds Transfair GmbH not included (2) x Financial institution (financial firm)
CIMONUSA Beteiligungsgesellschaft mbH not included (2) x Financial institution (financial firm)
CR Hotel Target Pty Ltd at equity x Special purpose entity
Citi Bank Custodian Platform (TCR) full (3) x Special purpose entity
Commerz Immobilien Vermietungsgesellschaft mbH not included (2) x Financial institution (financial firm)
Commerz Real Asset Verwaltungsgesellschaft mbH not included (2) x Other financial institution
Commerz Real Beteiligungsgesellschaft mbH not included (2) x Financial institution (financial firm)
Commerz Real Fund Management S.à r.l. not included (2) x Asset management company
(Fin. Investment mgmt. company)
Commerzbank Finance 3 S.à r.l. full (3) x Special purpose entity
Coubag Unternehmensbeteiligungsgesellschaft mbH at equity x Special purpose entity
DECIMA Grundstücks-Vermietungsgesellschaft mbH not included (2) x Financial institution (financial firm)
DIGITUS Vermietungsgesellschaft mbH not included (2) x Financial institution (financial firm)
DRABELA Grundstücks-Vermietungsgesellschaft mbH not included (2) x Financial institution (financial firm)
DRABELA Grundstücks-Vermietungsgesellschaft mbH & Co. Objekt Stade KG not included (2) x Financial institution (financial firm)
DREBOSTA Grundstücks-Vermietungsgesellschaft mbH not included (2) x Financial institution (financial firm)
DREBOSTA Grundstücks-Vermietungsgesellschaft mbH & Co. Objekt Schwerin KG not included (2) x Financial institution (financial firm)
DREDOLA Grundstücks-Vermietungsgesellschaft mbH not included (2) x Financial institution (financial firm)
DRELARA Grundstücks-Vermietungsgesellschaft mbH not included (2) x Financial institution (financial firm)
DRELARA Grundstücks-Vermietungsgesellschaft mbH & Co. Objekt Freiburg KG not included (2) x Financial institution (financial firm)
DRELOSINA Grundstücks-Vermietungsgesellschaft mbH not included (2) x Financial institution (financial firm)
DRENITA Grundstücks-Vermietungsgesellschaft mbH not included (2) x Financial institution (financial firm)
DRESANA Vermietungsgesellschaft mbH not included (2) x Financial institution (financial firm)
DTE Energy Center, LLC at equity x Special purpose entity
Deutsche Börse Commodities GmbH not included (2) x Investment firm
Dr. Gubelt Beteiligungsgesellschaft mbH not included (2) x Financial institution (financial firm)
Dr. Gubelt Grundstücks-Vermietungsgesellschaft mbH not included (2) x Financial institution (financial firm)
Dr. Gubelt Immobilien Vermietungs-Gesellschaft mbH not included (2) x Financial institution (financial firm)
EHY Real Estate Fund I, LLC not included (2) x Financial institution (financial firm)
ELEGANTIA Vermietungsgesellschaft mbH not included (2) x Financial institution (financial firm)
EURO Kartensysteme GmbH not included (2) x Payment Institution
EVIDENTIA Immobilien-Vermietungsgesellschaft mbH not included (2) x Financial institution (financial firm)
FACO Vermietungsgesellschaft mbH not included (2) x Financial institution (financial firm)
FORNAX Kraftwerk-Beteiligungsgesellschaft mbH not included (2) x Financial institution (financial firm)
FRAST Beteiligungsgesellschaft mbH not included (2) x Financial institution (financial firm)
FRAST Beteiligungsgesellschaft mbH & Co. Objekt Kokerei KG not included (2) x Financial institution (financial firm)
FUCATUS Vermietungsgesellschaft mbH not included (2) x Financial institution (financial firm)
FUGA Vermietungsgesellschaft mbH not included (2) x Financial institution (financial firm)
FUNGOR Vermietungsgesellschaft mbH not included (2) x Financial institution (financial firm)
FV Holding S.A. at equity x Special purpose entity
FXSpotStream Asia GK not included (2) x
None-core services provider included in an institution's
consolidated financial assets
FXSpotStream Europe Ltd. not included (2) x
None-core services provider included in an institution's
consolidated financial assets
FXSpotStream LLC not included (2) x
None-core services provider included in an institution's
consolidated financial assets
Fernwärmenetz Leipzig GmbH not included (2) x Financial institution (financial firm)
GRADARA Vermietungsgesellschaft mbH not included (2) x Financial institution (financial firm)

Introduction Equity capital Risk-oriented overall bank management Specific risk management Appendix 107
a b c d e f g
Accounting Regulatory consolidation Description
Name of the entity consolidation full pro rata
neither… nor (1)
deducted of the entity
GRADARA Vermietungsgesellschaft mbH & Co. Objekt Neu-Ulm KG not included (2) x Financial institution (financial firm)
GRAFINO Vermietungsgesellschaft mbH not included (2) x Financial institution (financial firm)
GRALANA Vermietungsgesellschaft mbH not included (2) x Financial institution (financial firm)
GRAMINA Vermietungsgesellschaft mbH not included (2) x Financial institution (financial firm)
GRAMOLDISCUS Vermietungsgesellschaft mbH not included (2) x Financial institution (financial firm)
GRAMOLINDA Vermietungsgesellschaft mbH not included (2) x Financial institution (financial firm)
GRANA Grundstücks-Vermietungsgesellschaft mbH not included (2) x Financial institution (financial firm)
GRASSANO Vermietungsgesellschaft mbH not included (2) x Financial institution (financial firm)
GRATIA Grundstücks-Vermietungsgesellschaft mbH not included (2) x Financial institution (financial firm)
GRATNOMA Grundstücks-Vermietungsgesellschaft mbH not included (2) x Financial institution (financial firm)
GRENADO Vermietungsgesellschaft mbH not included (2) x Financial institution (financial firm)
GRETANA Vermietungsgesellschaft mbH not included (2) x Financial institution (financial firm)
GRONDOLA Vermietungsgesellschaft mbH not included (2) x Financial institution (financial firm)
GROSINA Vermietungsgesellschaft mbH not included (2) x Financial institution (financial firm)
GROTEGA Vermietungsgesellschaft mbH not included (2) x Financial institution (financial firm)
GRUMENTO Vermietungsgesellschaft mbH not included (2) x Financial institution (financial firm)
GRUMOSA Vermietungsgesellschaft mbH not included (2) x Financial institution (financial firm)
GRUNATA Vermietungsgesellschaft mbH not included (2) x Financial institution (financial firm)
GUSTO Grundstücks-Vermietungsgesellschaft mbH not included (2) x Financial institution (financial firm)
Garbary Sp. z o.o. full (3) x Special purpose entity
Gesellschaft für Kreditsicherung mbH not included (2) x Financial institution (financial firm)
HAJOBANTA GmbH not included (2) x Financial institution (financial firm)
HAJOBURGA Beteiligungsgesellschaft mbH not included (2) x Financial institution (financial firm)
HAJOGA-US Vermietungsgesellschaft mbH not included (2) x Financial institution (financial firm)
HAJOLENA Beteiligungsgesellschaft mbH not included (2) x Financial institution (financial firm)
HAJOLINDA Beteiligungsgesellschaft GmbH not included (2) x Financial institution (financial firm)
HAJOLUCA Beteiligungsgesellschaft mbH not included (2) x Financial institution (financial firm)
HAJOMA Beteiligungsgesellschaft mbH not included (2) x Financial institution (financial firm)
HAJOMINA Beteiligungsgesellschaft mbH not included (2) x Financial institution (financial firm)
HAJORALDIA Beteiligungsgesellschaft mbH not included (2) x Financial institution (financial firm)
HAJOSINTA Beteiligungsgesellschaft mbH not included (2) x Financial institution (financial firm)
HAJOSOLA Beteiligungsgesellschaft mbH not included (2) x Financial institution (financial firm)
HAJOTARA Beteiligungsgesellschaft mbH not included (2) x Financial institution (financial firm)
HDW Grundstücks-Vermietungsgesellschaft mbH not included (2) x Financial institution (financial firm)
HESTA Grundstücks-Vermietungsgesellschaft mbH not included (2) x Financial institution (financial firm)
HORA Grundstücks-Vermietungsgesellschaft mbH not included (2) x Financial institution (financial firm)
ILV DRITTE Fonds-Beteiligungsgesellschaft mbH not included (2) x Financial institution (financial firm)
ILV Immobilien Vermietungsgesellschaft mbH Objekte 1990 not included (2) x Financial institution (financial firm)
ILV Immobilien-Leasing Verwaltungsgesellschaft Düsseldorf mbH at equity x Financial institution (financial firm)
ILV ZWEITE Fonds-Beteiligungsgesellschaft mbH not included (2) x Financial institution (financial firm)
ILV-Fonds-Beteiligungsgesellschaft mbH not included (2) x Financial institution (financial firm)
Immobilien-Vermietungsgesellschaft Dr. Rühl GmbH & Co. Objekt Stutensee KG not included (2) x Financial institution (financial firm)
Kommanditgesellschaft MS "CPO ALICANTE" Offen Reederei GmbH & Co. full (3) x Special purpose entity
Kommanditgesellschaft MS "CPO ANCONA" Offen Reederei GmbH & Co. full (3) x Special purpose entity
Kommanditgesellschaft MS "CPO BILBAO" Offen Reederei GmbH & Co. full (3) x Special purpose entity
Kommanditgesellschaft MS "CPO MARSEILLE" Offen Reederei GmbH & Co. full (3) x Special purpose entity
Kommanditgesellschaft MS "CPO PALERMO" Offen Reederei GmbH & Co. full (3) x Special purpose entity
Kommanditgesellschaft MS "CPO TOULON" Offen Reederei GmbH & Co. full (3) x Special purpose entity

108 Commerzbank Disclosure Report 2020
a b c d e f g
Accounting Regulatory consolidation Description
Name of the entity consolidation full pro rata
neither… nor (1)
deducted of the entity
Kommanditgesellschaft MS "CPO VALENCIA" Offen Reederei GmbH & Co. full (3) x Special purpose entity
LARIX Grundstücks-Vermietungsgesellschaft mbH not included (2) x Financial institution (financial firm)
LENIS Grundstücks-Vermietungsgesellschaft mbH not included (2) x Financial institution (financial firm)
LIRIS Grundstücks-Vermietungsgesellschaft mbH not included (2) x Financial institution (financial firm)
LIVIDA MOLARIS Grundstücks-Vermietungsgesellschaft mbH not included (2) x Financial institution (financial firm)
LUTEA MOLARIS Grundstücks-Vermietungsgesellschaft mbH not included (2) x Financial institution (financial firm)
LiquidityMatch LLC not included (2) x Financial institution (financial firm)
MALEA Grundstücks-Vermietungsgesellschaft mbH i.L. not included (2) x Financial institution (financial firm)
MARBINO Vermietungsgesellschaft mbH & Co. Objekt BBS Stade KG not included (2) x Financial institution (financial firm)
MARBREVA Vermietungsgesellschaft mbH & Co. Objekt AOK Rheinland-Pfalz KG not included (2) x Financial institution (financial firm)
MARIUS Grundstücks-Vermietungsgesellschaft mbH not included (2) x Financial institution (financial firm)
MAXIMA Grundstücks-Vermietungsgesellschaft mbH not included (2) x Financial institution (financial firm)
MBG Mittelständische Beteiligungsgesellschaft Rheinland-Pfalz mbH not included (2) x Financial institution (financial firm)
MILES Grundstücks-Vermietungsgesellschaft mbH not included (2) x Financial institution (financial firm)
MINERVA Grundstücks-Vermietungsgesellschaft mbH not included (2) x Financial institution (financial firm)
MIRABILIS Grundstücks-Vermietungsgesellschaft mbH not included (2) x Financial institution (financial firm)
MOLANA Vermietungsgesellschaft mbH not included (2) x Financial institution (financial firm)
MOLANA Vermietungsgesellschaft mbH & Co. Objekt Gymnasium Harsefeld KG not included (2) x Financial institution (financial firm)
MOLANCONA Vermietungsgesellschaft mbH not included (2) x Financial institution (financial firm)
MOLANDA Vermietungsgesellschaft mbH not included (2) x Financial institution (financial firm)
MOLANGA Beteiligungsgesellschaft mbH not included (2) x Financial institution (financial firm)
MOLANZIO Vermietungsgesellschaft mbH not included (2) x Financial institution (financial firm)
MOLAREZZO Vermietungsgesellschaft mbH not included (2) x Financial institution (financial firm)
MOLARGA Grundstücks-Vermietungsgesellschaft mbH not included (2) x Financial institution (financial firm)
MOLARIS Beteiligungsgesellschaft mbH not included (2) x Financial institution (financial firm)
MOLARIS Geschäftsführungs GmbH not included (2) x Financial institution (financial firm)
MOLARIS Grundstücksverwaltung GmbH not included (2) x Financial institution (financial firm)
MOLARIS Immobilienverwaltung GmbH not included (2) x Financial institution (financial firm)
MOLARIS Managementgesellschaft mbH not included (2) x Financial institution (financial firm)
MOLARIS Objektverwaltung GmbH not included (2) x Financial institution (financial firm)
MOLARISSA Vermietungsgesellschaft mbH not included (2) x Financial institution (financial firm)
MOLAROSA Vermietungsgesellschaft mbH not included (2) x Financial institution (financial firm)
MOLASSA Vermietungsgesellschaft mbH not included (2) x Financial institution (financial firm)
MOLASSA Vermietungsgesellschaft mbH & Co. Objekt Herten KG not included (2) x Financial institution (financial firm)
MOLATHINA Vermietungsgesellschaft mbH not included (2) x Financial institution (financial firm)
MOLBAKKA Vermietungsgesellschaft mbH not included (2) x Financial institution (financial firm)
MOLBARVA Vermietungsgesellschaft mbH not included (2) x Financial institution (financial firm)
MOLBERA Vermietungsgesellschaft mbH not included (2) x Financial institution (financial firm)
MOLBERNO Vermietungsgesellschaft mbH not included (2) x Financial institution (financial firm)
MOLBOLLA Vermietungsgesellschaft mbH not included (2) x Financial institution (financial firm)
MOLBONA Vermietungsgesellschaft mbH not included (2) x Financial institution (financial firm)
MOLBONA Vermietungsgesellschaft mbH & Co. Objekt Schulgebäude Stade KG not included (2) x Financial institution (financial firm)
MOLBRIENZA Vermietungsgesellschaft mbH not included (2) x Financial institution (financial firm)
MOLBURGA Vermietungsgesellschaft mbH not included (2) x Financial institution (financial firm)
MOLCAMPO Vermietungsgesellschaft mbH not included (2) x Financial institution (financial firm)
MOLCENTO Vermietungsgesellschaft mbH not included (2) x Financial institution (financial firm)
MOLCORA Vermietungsgesellschaft mbH not included (2) x Financial institution (financial firm)
MOLDEO Mobilien-Vermietungsgesellschaft mbH not included (2) x Financial institution (financial firm)
MOLDEO Mobilien-Vermietungsgesellschaft mbH & Co. Objekt Lünen KG not included (2) x Financial institution (financial firm)

Introduction Equity capital Risk-oriented overall bank management Specific risk management Appendix 109
a b c d e f g
Accounting Regulatory consolidation Description
Name of the entity consolidation full pro rata
neither… nor (1)
deducted of the entity
MOLDOMA Vermietungsgesellschaft mbH not included (2) x Financial institution (financial firm)
MOLDORA Vermietungsgesellschaft mbH not included (2) x Financial institution (financial firm)
MOLEMPA Vermietungsgesellschaft mbH not included (2) x Financial institution (financial firm)
MOLETUM Vermietungsgesellschaft mbH not included (2) x Financial institution (financial firm)
MOLFOKKA Vermietungsgesellschaft mbH not included (2) x Financial institution (financial firm)
MOLGABA Vermietungsgesellschaft mbH not included (2) x Financial institution (financial firm)
MOLGEDI Vermietungsgesellschaft mbH not included (2) x Financial institution (financial firm)
MOLGERO Vermietungsgesellschaft mbH not included (2) x Financial institution (financial firm)
MOLIGELA Vermietungsgesellschaft mbH not included (2) x Financial institution (financial firm)
MOLIGELA Vermietungsgesellschaft mbH & Co. Objekt Celle KG not included (2) x Financial institution (financial firm)
MOLIGO Vermietungsgesellschaft mbH not included (2) x Financial institution (financial firm)
MOLIGO Vermietungsgesellschaft mbH & Co. Objekte Schulsanierungen Rostock KG not included (2) x Financial institution (financial firm)
MOLISTA Grundstücks-Vermietungsgesellschaft mbH not included (2) x Financial institution (financial firm)
MOLISTA Grundstücks-Vermietungsgesellschaft mbH & Co. Objekt Gesamtschule Peine KG not included (2) x Financial institution (financial firm)
MOLITA Vermietungsgesellschaft mbH not included (2) x Financial institution (financial firm)
MOLITA Vermietungsgesellschaft mbH & Co. Objekt Klinikum Barmbek KG not included (2) x Financial institution (financial firm)
MOLITA Vermietungsgesellschaft mbH & Co. Objekt TPFZ Hannover KG not included (2) x Financial institution (financial firm)
MOLKANDIS Grundstücks-Vermietungsgesellschaft mbH & Co. Objekt Kaltenkichen KG not included (2) x Financial institution (financial firm)
MOLMARTA Vermietungsgesellschaft mbH not included (2) x Financial institution (financial firm)
MOLMIRA Vermietungsgesellschft mbH not included (2) x Financial institution (financial firm)
MOLOTA Vermietungsgesellschaft mbH not included (2) x Financial institution (financial firm)
MOLPANA Vermietungsgesellschaft mbH not included (2) x Financial institution (financial firm)
MOLPERA Vermietungsgesellschaft mbH not included (2) x Financial institution (financial firm)
MOLPETTO Vermietungsgesellschaft mbH not included (2) x Financial institution (financial firm)
MOLPETTO Vermietungsgesellschaft mbH & Co. Objekt Bracht KG not included (2) x Financial institution (financial firm)
MOLPIKA Vermietungsgesellschaft mbH not included (2) x Financial institution (financial firm)
MOLPIREAS Vermietungsgesellschaft mbH not included (2) x Financial institution (financial firm)
MOLPURA Beteiligungsgesellschaft mbH not included (2) x Financial institution (financial firm)
MOLRANO Vermietungsgesellschaft mbH not included (2) x Financial institution (financial firm)
MOLRATUS Vermietungsgesellschaft mbH not included (2) x Financial institution (financial firm)
MOLRATUS Vermietungsgesellschaft mbH & Co. Objekt Loxstedt KG not included (2) x Financial institution (financial firm)
MOLRISTA Vermietungsgesellschaft mbH not included (2) x Financial institution (financial firm)
MOLRONDA Vermietungsgesellschaft mbH & Co. Objekt Nürnberg KG not included (2) x Financial institution (financial firm)
MOLSCHORA Vermietungsgesellschaft mbH not included (2) x Financial institution (financial firm)
MOLSOLA Vermietungsgesellschaft mbH not included (2) x Financial institution (financial firm)
MOLSOLA Vermietungsgesellschaft mbH & Co. Objekt Geminus KG not included (2) x
None-core services provider included in an institution's
consolidated financial assets
MOLSOLA Vermietungsgesellschaft mbH & Co. Objekt Halle Markt 11 KG not included (2) x
None-core services provider included in an institution's
consolidated financial assets
MOLSOLA Vermietungsgesellschaft mbH & Co. Objekt Halle Riegel KG not included (2) x
None-core services provider included in an institution's
consolidated financial assets
MOLSTEFFA Vermietungsgesellschaft mbH not included (2) x Financial institution (financial firm)
MOLSTINA Vermietungsgesellschaft mbH not included (2) x Financial institution (financial firm)
MOLSURA Vermietungsgesellschaft mbH not included (2) x Financial institution (financial firm)
MOLTANDO Vermietungsgesellschaft mbH not included (2) x Financial institution (financial firm)
MOLTANDO Vermietungsgesellschaft mbH & Co. Objekt Kassel KG not included (2) x Financial institution (financial firm)

110 Commerzbank Disclosure Report 2020
a b c d e f g
Accounting Regulatory consolidation Description
Name of the entity consolidation full pro rata
neither… nor (1)
deducted of the entity
MOLTARA Vermietungsgesellschaft mbH not included (2) x Financial institution (financial firm)
MOLTIVOLA Vermietungsgesellschaft mbH & Co. Objekt Gladbeck KG not included (2) x Financial institution (financial firm)
MOLUGA Vermietungsgesellschaft mbH not included (2) x Financial institution (financial firm)
MOLVANI Vermietungsgesellschaft mbH not included (2) x Financial institution (financial firm)
MOLWALLA Vermietungsgesellschaft mbH not included (2) x Financial institution (financial firm)
MOLWANKUM Vermietungsgesellschaft mbH not included (2) x Financial institution (financial firm)
MOLWORUM Vermietungsgesellschaft mbH not included (2) x Financial institution (financial firm)
MONEA Vermietungsgesellschaft mbH not included (2) x Financial institution (financial firm)
Marie Lease S.à r.l. not included (2) x Financial institution (financial firm)
Mittelständische Beteiligungsgesellschaft Berlin-Brandenburg GmbH not included (2) x Financial institution (financial firm)
Mittelständische Beteiligungsgesellschaft Mecklenburg-Vorpommern mbH not included (2) x Financial institution (financial firm)
Mittelständische Beteiligungsgesellschaft Niedersachsen (MBG) mit beschränkter Haftung not included (2) x Financial institution (financial firm)
Mittelständische Beteiligungsgesellschaft Sachsen mbH not included (2) x Financial institution (financial firm)
Mittelständische Beteiligungsgesellschaft Sachsen-Anhalt (MBG) mbH not included (2) x Financial institution (financial firm)
Mittelständische Beteiligungsgesellschaft Thüringen mbH not included (2) x Financial institution (financial firm)
NACOLO Schiffsbetriebsgesellschaft mbH not included (2) x Financial institution (financial firm)
NACONA Schiffsbetriebsgesellschaft mbH not included (2) x Financial institution (financial firm)
NACONGA Schiffsbetriebsgesellschaft mbH not included (2) x Financial institution (financial firm)
NAFARI Schiffsbetriebsgesellschaft mbH not included (2) x Financial institution (financial firm)
NAFIRINA Schiffsbetriebsgesellschaft mbH not included (2) x Financial institution (financial firm)
NASIRO Schiffsbetriebsgesellschaft mbH not included (2) x Financial institution (financial firm)
NASTO Schiffsbetriebsgesellschaft mbH not included (2) x Financial institution (financial firm)
NAUCULA Schiffsbetriebsgesellschaft mbH not included (2) x Financial institution (financial firm)
NAULUMO Schiffsbetriebsgesellschaft mbH not included (2) x Financial institution (financial firm)
NAURANTO Schiffsbetriebsgesellschaft mbH not included (2) x Financial institution (financial firm)
NAURATA Schiffsbetriebsgesellschaft mbH not included (2) x Financial institution (financial firm)
NAUSOLA Schiffsbetriebsgesellschaft mbH not included (2) x Financial institution (financial firm)
NAUTARO Schiffsbetriebsgesellschaft mbH not included (2) x Financial institution (financial firm)
NAUTESSA Schiffsbetriebsgesellschaft mbH not included
(2) x Financial institution (financial firm)
NAUTIS Schiffsbetriebsgesellschaft mbH not included (2) x Financial institution (financial firm)
NAUTLUS Schiffsbetriebsgesellschaft mbH not included (2) x Financial institution (financial firm)
NAUTO Schiffsbetriebsgesellschaft mbH not included (2) x Financial institution (financial firm)
NAUTORIA Schiffsbetriebsgesellschaft mbH not included (2) x Financial institution (financial firm)
NAUTUGO Schiffsbetriebsgesellschaft mbH not included (2) x Financial institution (financial firm)
NAVALIS Schiffsbetriebsgesellschaft mbH not included (2) x Financial institution (financial firm)
NAVIBOLA Schiffsbetriebsgesellschaft mbH not included (2) x Financial institution (financial firm)
NAVIBOTO Schiffsbetriebsgesellschaft mbH not included (2) x Financial institution (financial firm)
NAVIFIORI Schiffsbetriebsgesellschaft mbH not included (2) x Financial institution (financial firm)
NAVIGA Schiffsbeteiligung GmbH not included (2) x Financial institution (financial firm)
NAVIGATO Schiffsbetriebsgesellschaft mbH not included (2) x Financial institution (financial firm)
NAVIGOLO Schiffsbetriebsgesellschaft mbH not included (2) x Financial institution (financial firm)
NAVILO Vermietungsgesellschaft mbH not included (2) x Financial institution (financial firm)
NAVINA Schiffsbetriebsgesellschaft mbH not included (2) x Financial institution (financial firm)
NAVIRENA Schiffsbetriebsgesellschaft mbH not included (2) x Financial institution (financial firm)
NAVIROSSA Schiffsbetriebsgesellschaft mbH not included (2) x Financial institution (financial firm)
NAVITA Schiffsbetriebsgesellschaft mbH not included (2) x Financial institution (financial firm)
NAVITARIA Schiffsbetriebsgesellschaft mbH not included (2) x Financial institution (financial firm)
NAVITONI Schiffsbetriebsgesellschaft mbH not included (2) x Financial institution (financial firm)
NAVITOSA Schiffsbetriebsgesellschaft mbH not included (2) x Financial institution (financial firm)
NAVITURA Schiffsbetriebsgesellschaft mbH not included (2) x Financial institution (financial firm)
NEPTANA Schiffsbetriebsgesellschaft mbH not included (2) x Financial institution (financial firm)

Introduction Equity capital Risk-oriented overall bank management Specific risk management Appendix 111
a b c d e f g
Accounting Regulatory consolidation Description
Name of the entity consolidation full pro rata
neither… nor (1)
deducted of the entity
NEPTILA Schiffsbetriebsgesellschaft mbH not included (2) x Financial institution (financial firm)
NEPTORA Schiffsbetriebsgesellschaft mbH not included (2) x Financial institution (financial firm)
NEPTUGA Schiffsbetriebsgesellschaft mbH not included (2) x Financial institution (financial firm)
NEPTUNO Schiffsbetriebsgesellschaft mbH not included (2) x Financial institution (financial firm)
NERVUS Beteiligungsgesellschaft mbH not included (2) x Financial institution (financial firm)
NESTOR Grundstücks-Vermietungsgesellschaft mbH not included (2) x Financial institution (financial firm)
NOLICA Grundstücks-Vermietungsgesellschaft mbH not included (2) x Financial institution (financial firm)
NORA Grundstücks-Vermietungsgesellschaft mbH not included (2) x Financial institution (financial firm)
NORA Grundstücks-Vermietungsgesellschaft mbH & Co. Objekt Castrop-Rauxel KG not included (2) x Financial institution (financial firm)
NORA Grundstücks-Vermietungsgesellschaft mbH & Co. Objekt Koblenz-Kesselheim KG not included (2) x Financial institution (financial firm)
NORA Grundstücks-Vermietungsgesellschaft mbH & Co. Objekte Plön und Preetz KG not included (2) x Financial institution (financial firm)
NOTITIA Grundstücks-Vermietungsgesellschaft mbH not included (2) x Financial institution (financial firm)
NURUS Beteiligungsgesellschaft mbH not included (2) x Financial institution (financial firm)
OLEANDRA Grundstücks-Vermietungsgesellschaft mbH not included (2) x Financial institution (financial firm)
OPTIONA Vermietungsgesellschaft mbH not included (2) x Financial institution (financial firm)
OSKAR Medienbeteiligungsgesellschaft mbH not included (2) x Financial institution (financial firm)
Octopus Investment Sp. z o.o. not included (2) x Financial institution (financial firm)
PAREO Kraftwerk-Beteiligungsgesellschaft mbH not included (2) x Financial institution (financial firm)
PATELLA Vermietungsgesellschaft mbH not included (2) x Financial institution (financial firm)
PATELLA Vermietungsgesellschaft mbH & Co. Objekt Bibliothek Berlin KG not included (2) x Financial institution (financial firm)
PATELLA Vermietungsgesellschaft mbH & Co. Objekt Collegium Hungaricum KG not included (2) x Financial institution (financial firm)
PATELLA Vermietungsgesellschaft mbH & Co. Objekt Pulvermühle KG not included (2) x Financial institution (financial firm)
PATELLA Vermietungsgesellschaft mbH & Co. Objekt Technikmuseum KG not included (2) x Financial institution (financial firm)
RALTO Beteiligungsgesellschaft mbH not included (2) x Financial institution (financial firm)
RAMONIA Grundstücks-Vermietungsgesellschaft mbH not included (2) x Financial institution (financial firm)
RAMONIA Grundstücks-Vermietungsgesellschaft mbH & Co. Objekt Friedrichshafen KG not included (2) x Financial institution (financial firm)
RAMONIA Grundstücks-Vermietungsgesellschaft mbH & Co. Objekt Lichtenau KG not included (2) x Financial institution (financial firm)
RAMONIA Grundstücks-Vermietungsgesellschaft mbH & Co. Objekt München-Haar KG not included (2) x Financial institution (financial firm)
RANA Beteiligungsgesellschaft mbH not included (2) x Financial institution (financial firm)
RAPIDA Grundstücks-Vermietungsgesellschaft mbH not included (2) x Financial institution (financial firm)
RAYMO Vierte Portfolio GmbH not included (2) x Financial institution (financial firm)
RECURSA Grundstücks-Vermietungsgesellschaft mbH not included (2) x Financial institution (financial firm)
RESIDO Flugzeug-Leasinggesellschaft mbH not included (2) x Financial institution (financial firm)
RIPA Medien-Beteiligungsgesellschaft mbH not included (2) x Financial institution (financial firm)
ROSARIA Grundstücks-Vermietungsgesellschaft mbH not included (2) x Financial institution (financial firm)
ROSARIA Grundstücks-Vermietungsgesellschaft mbH & Co. Objekt Dettingen KG not included (2) x Financial institution (financial firm)
ROSARIA Grundstücks-Vermietungsgesellschaft mbH & Co. Objekt Frechen KG not included (2) x Financial institution (financial firm)
ROSARIA Grundstücks-Vermietungsgesellschaft mbH & Co. Objekt Gymnasium Buchholz KG not included (2) x Financial institution (financial firm)
ROSARIA Grundstücks-Vermietungsgesellschaft mbH & Co. Objekt Kahl KG not included (2) x Financial institution (financial firm)
ROSARIA Grundstücks-Vermietungsgesellschaft mbH & Co. Objekt Ochsenfurt KG not included (2) x Financial institution (financial firm)
ROSARIA Grundstücks-Vermietungsgesellschaft mbH & Co. Objekt Singen KG not included (2) x Financial institution (financial firm)
ROSATA Grundstücks-Vermietungsgesellschaft mbH not included (2) x Financial institution (financial firm)
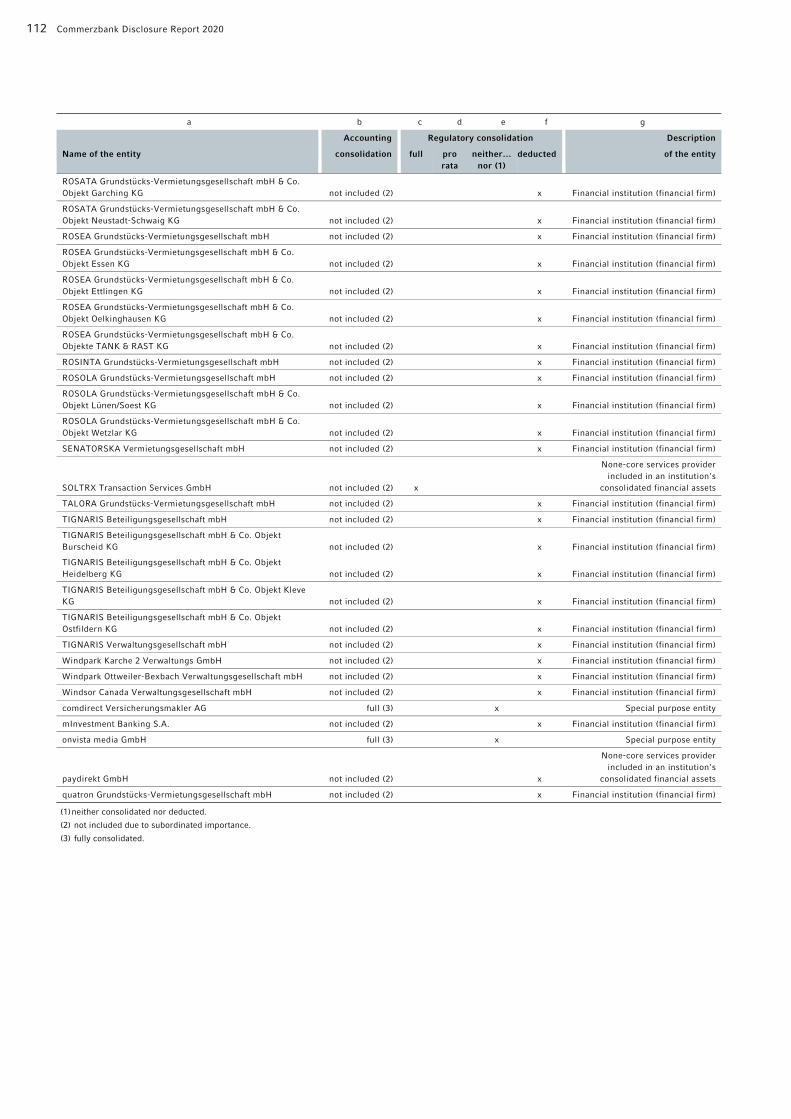
112 Commerzbank Disclosure Report 2020
a b c d e f g
Accounting Regulatory consolidation Description
Name of the entity consolidation full pro rata
neither… nor (1)
deducted of the entity
ROSATA Grundstücks-Vermietungsgesellschaft mbH & Co. Objekt Garching KG not included (2) x Financial institution (financial firm)
ROSATA Grundstücks-Vermietungsgesellschaft mbH & Co. Objekt Neustadt-Schwaig KG not included (2) x Financial institution (financial firm)
ROSEA Grundstücks-Vermietungsgesellschaft mbH not included (2) x Financial institution (financial firm)
ROSEA Grundstücks-Vermietungsgesellschaft mbH & Co. Objekt Essen KG not included (2) x Financial institution (financial firm)
ROSEA Grundstücks-Vermietungsgesellschaft mbH & Co. Objekt Ettlingen KG not included (2) x Financial institution (financial firm)
ROSEA Grundstücks-Vermietungsgesellschaft mbH & Co. Objekt Oelkinghausen KG not included (2) x Financial institution (financial firm)
ROSEA Grundstücks-Vermietungsgesellschaft mbH & Co. Objekte TANK & RAST KG not included (2) x Financial institution (financial firm)
ROSINTA Grundstücks-Vermietungsgesellschaft mbH not included (2) x Financial institution (financial firm)
ROSOLA Grundstücks-Vermietungsgesellschaft mbH not included (2) x Financial institution (financial firm)
ROSOLA Grundstücks-Vermietungsgesellschaft mbH & Co. Objekt Lünen/Soest KG not included (2) x Financial institution (financial firm)
ROSOLA Grundstücks-Vermietungsgesellschaft mbH & Co. Objekt Wetzlar KG not included (2) x Financial institution (financial firm)
SENATORSKA Vermietungsgesellschaft mbH not included (2) x Financial institution (financial firm)
SOLTRX Transaction Services GmbH not included (2) x
None-core services provider included in an institution's
consolidated financial assets
TALORA Grundstücks-Vermietungsgesellschaft mbH not included (2) x Financial institution (financial firm)
TIGNARIS Beteiligungsgesellschaft mbH not included (2) x Financial institution (financial firm)
TIGNARIS Beteiligungsgesellschaft mbH & Co. Objekt Burscheid KG not included (2) x Financial institution (financial firm)
TIGNARIS Beteiligungsgesellschaft mbH & Co. Objekt Heidelberg KG not included (2) x Financial institution (financial firm)
TIGNARIS Beteiligungsgesellschaft mbH & Co. Objekt Kleve KG not included (2) x Financial institution (financial firm)
TIGNARIS Beteiligungsgesellschaft mbH & Co. Objekt Ostfildern KG not included (2) x Financial institution (financial firm)
TIGNARIS Verwaltungsgesellschaft mbH not included (2) x Financial institution (financial firm)
Windpark Karche 2 Verwaltungs GmbH not included (2) x Financial institution (financial firm)
Windpark Ottweiler-Bexbach Verwaltungsgesellschaft mbH not included (2) x Financial institution (financial firm)
Windsor Canada Verwaltungsgesellschaft mbH not included (2) x Financial institution (financial firm)
comdirect Versicherungsmakler AG full (3) x Special purpose entity
mInvestment Banking S.A. not included (2) x Financial institution (financial firm)
onvista media GmbH full (3) x Special purpose entity
paydirekt GmbH not included (2) x
None-core services provider included in an institution's
consolidated financial assets
quatron Grundstücks-Vermietungsgesellschaft mbH not included (2) x Financial institution (financial firm) (1) neither consolidated nor deducted.
(2) not included due to subordinated importance.
(3) fully consolidated.
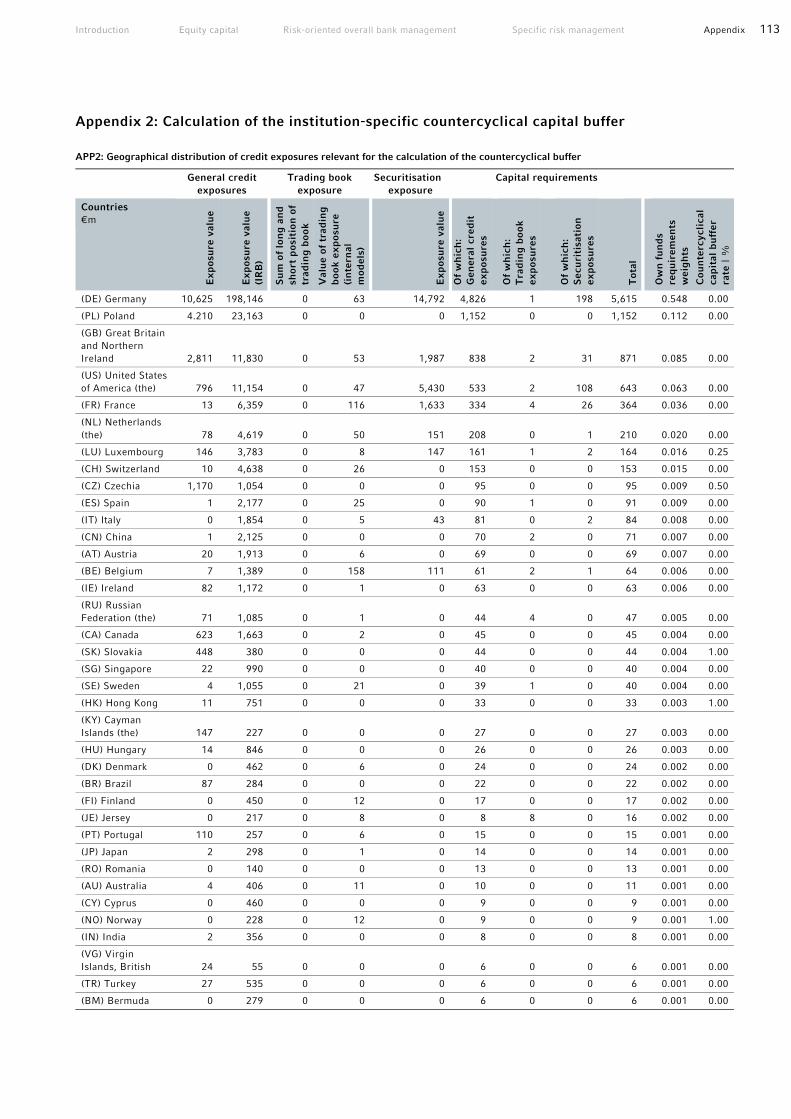
Introduction Equity capital Risk-oriented overall bank management Specific risk management Appendix 113
Appendix 2: Calculation of the institution-specific countercyclical capital buffer
APP2: Geographical distribution of credit exposures relevant for the calculation of the countercyclical buffer General credit
exposures Trading book
exposure Securitisation
exposure Capital requirements
Countries €m
Exp
osu
re v
alu
e
Exp
osu
re v
alu
e (I
RB
)
Su
m o
f lo
ng
an
d
shor
t p
osit
ion
of
trad
ing
boo
k
Val
ue
of t
rad
ing
b
ook
exp
osu
re
(in
tern
al
mod
els)
Exp
osu
re v
alu
e
Of
wh
ich
: G
ener
al c
red
it
exp
osu
res
Of
wh
ich
: T
rad
ing
boo
k ex
pos
ure
s
Of
wh
ich
: S
ecu
riti
sati
on
exp
osu
res
Tot
al
Ow
n f
un
ds
req
uir
emen
ts
wei
gh
ts
Cou
nte
rcyc
lica
l ca
pit
al b
uff
er
rate
| %
(DE) Germany 10,625 198,146 0 63 14,792 4,826 1 198 5,615 0.548 0.00
(PL) Poland 4.210 23,163 0 0 0 1,152 0 0 1,152 0.112 0.00
(GB) Great Britain and Northern Ireland 2,811 11,830 0 53 1,987 838 2 31 871 0.085 0.00
(US) United States of America (the) 796 11,154 0 47 5,430 533 2 108 643 0.063 0.00
(FR) France 13 6,359 0 116 1,633 334 4 26 364 0.036 0.00
(NL) Netherlands (the) 78 4,619 0 50 151 208 0 1 210 0.020 0.00
(LU) Luxembourg 146 3,783 0 8 147 161 1 2 164 0.016 0.25
(CH) Switzerland 10 4,638 0 26 0 153 0 0 153 0.015 0.00
(CZ) Czechia 1,170 1,054 0 0 0 95 0 0 95 0.009 0.50
(ES) Spain 1 2,177 0 25 0 90 1 0 91 0.009 0.00
(IT) Italy 0 1,854 0 5 43 81 0 2 84 0.008 0.00
(CN) China 1 2,125 0 0 0 70 2 0 71 0.007 0.00
(AT) Austria 20 1,913 0 6 0 69 0 0 69 0.007 0.00
(BE) Belgium 7 1,389 0 158 111 61 2 1 64 0.006 0.00
(IE) Ireland 82 1,172 0 1 0 63 0 0 63 0.006 0.00
(RU) Russian Federation (the) 71 1,085 0 1 0 44 4 0 47 0.005 0.00
(CA) Canada 623 1,663 0 2 0 45 0 0 45 0.004 0.00
(SK) Slovakia 448 380 0 0 0 44 0 0 44 0.004 1.00
(SG) Singapore 22 990 0 0 0 40 0 0 40 0.004 0.00
(SE) Sweden 4 1,055 0 21 0 39 1 0 40 0.004 0.00
(HK) Hong Kong 11 751 0 0 0 33 0 0 33 0.003 1.00
(KY) Cayman Islands (the) 147 227 0 0 0 27 0 0 27 0.003 0.00
(HU) Hungary 14 846 0 0 0 26 0 0 26 0.003 0.00
(DK) Denmark 0 462 0 6 0 24 0 0 24 0.002 0.00
(BR) Brazil 87 284 0 0 0 22 0 0 22 0.002 0.00
(FI) Finland 0 450 0 12 0 17 0 0 17 0.002 0.00
(JE) Jersey 0 217 0 8 0 8 8 0 16 0.002 0.00
(PT) Portugal 110 257 0 6 0 15 0 0 15 0.001 0.00
(JP) Japan 2 298 0 1 0 14 0 0 14 0.001 0.00
(RO) Romania 0 140 0 0 0 13 0 0 13 0.001 0.00
(AU) Australia 4 406 0 11 0 10 0 0 11 0.001 0.00
(CY) Cyprus 0 460 0 0 0 9 0 0 9 0.001 0.00
(NO) Norway 0 228 0 12 0 9 0 0 9 0.001 1.00
(IN) India 2 356 0 0 0 8 0 0 8 0.001 0.00
(VG) Virgin Islands, British 24 55 0 0 0 6 0 0 6 0.001 0.00
(TR) Turkey 27 535 0 0 0 6 0 0 6 0.001 0.00
(BM) Bermuda 0 279 0 0 0 6 0 0 6 0.001 0.00

114 Commerzbank Disclosure Report 2020
APP2_cont.: Geographical distribution of credit exposures relevant for the calculation of the countercyclical buffer
General credit
exposures Trading book
exposure Securitisation
exposure Capital requirements
Countries €m
Exp
osu
re v
alu
e
Exp
osu
re v
alu
e (I
RB
)
Su
m o
f lo
ng
an
d
shor
t p
osit
ion
of
trad
ing
boo
k
Val
ue
of t
rad
ing
b
ook
exp
osu
re
(in
tern
al
mod
els)
Exp
osu
re v
alu
e
Of
wh
ich
: G
ener
al c
red
it
exp
osu
res
Of
wh
ich
: T
rad
ing
boo
k ex
pos
ure
s
Of
wh
ich
: S
ecu
riti
sati
on
exp
osu
res
Tot
al
Ow
n f
un
ds
req
uir
emen
ts
wei
gh
ts
Cou
nte
rcyc
lica
l ca
pit
al b
uff
er
rate
| %
(CL) Chile 0 102 0 0 0 6 0 0 6 0.001 0.00
(MX) Mexico 0 121 0 0 0 5 0 0 5 0.001 0.00
(PE) Peru 0 160 0 0 0 5 0 0 5 0.001 0.00
(IS) Iceland 0 185 0 0 0 4 0 0 4 0.000 0.00
(VN) Viet Nam 0 162 0 0 0 4 0 0 4 0.000 0.00
(TW) Taiwan (Province of China) 4 73 0 0 0 4 0 0 4 0.000 0.00
(KR) Korea, (the) Republic of (former South Korea) 0 103 0 90 0 4 0 0 4 0,000 0.00
(SA) Saudi-Arabia 0 83 0 0 0 3 0 0 3 0.000 0.00
(CW) Curacao Island 0 83 0 0 0 3 0 0 3 0.000 0.00
(LI) Liechtenstein 0 153 0 0 0 3 0 0 3 0.000 0.00
(IL) Israel 8 86 0 0 0 2 0 0 2 0.000 0.00
(AE) United Arab Emirates (the) 1 143 0 0 0 2 0 0 2 0.000 0.00
(KN) Saint Kitts und Nevis 0 48 0 0 0 2 0 0 2 0.000 0.00
(GL) Greenland 0 56 0 0 0 2 0 0 2 0.000 0.00
(SI) Slovenia 0 42 0 0 2 1 0 0 1 0.000 0.00
(BH) Bahrain 0 183 0 0 0 1 0 0 1 0.000 0.00
(ZA) South Africa 0 36 0 4 0 1 0 0 1 0.000 0.00
(MU) Mauritius 0 34 0 0 0 1 0 0 1 0.000 0.00
(KW) Kuwait 0 78 0 0 0 1 0 0 1 0.000 0.00
(MT) Malta 0 29 0 0 0 1 0 0 1 0.000 0.00
(MY) Malaysia 3 11 0 0 0 1 0 0 1 0.000 0.00
(ID) Indonesia 0 142 0 1 0 0 1 0 1 0.000 0.00
(NZ) New Zealand 0 39 0 0 0 1 0 0 1 0.000 0.00
(GH) Ghana 0 31 0 0 0 1 0 0 1 0.000 0.00
(GR) Greece 0 113 0 4 0 0 0 0 1 0.000 0.00
(EG) Egypt 0 32 0 0 0 1 0 0 1 0.000 0.00
Others 1 402 0 0 0 3 0 0 3 0.000
Total 21,583 289,529 0 736 24,296 9,265 29 370 10,253 1.000
APP2: Amount of institution-specific countercyclical capital buffer €m 31.12.2020
Total risk exposure amount 178,581
Institution specific countercyclical buffer rate (%) 0.017
Institution specific countercyclical buffer requirement 30.47

Introduction Equity capital Risk-oriented overall bank management Specific risk management Appendix 115
Appendix 3: Supplement to equity structure (CAP1)
APP3: Supplemetary information to table CAP1 Line (B) Reference to article in the regulation (EU)
Nr. 575/2013
1 26 (1), 27, 28, 29
1a EBA list 26 (3)
1b EBA list 26 (3)
2 26 (1) (c)
3 26 (1)
3a 26 (1) (f)
4 486 (2)
5 84
5a 26 (2)
6
7 34, 105
8 36 (1) (b), 37
10 36 (1) (c), 38
11 33 (1) (a)
12 36 (1) (d), 40, 159
13 32 (1)
14 33 (1) (b)
15 36 (1) (e), 41
16 36 (1) (f), 42
17 36 (1) (g), 44
18 36 (1) (h), 43, 45, 46, 49 (2) & (3), 79
19 36 (1) (i), 43, 45, 47, 48 (1) (b), 49 (1) - (3), 79
20a 36 (1) (k)
20b 36 (1) (k) (i), 89 - 91
20c 36 (1) (k) (ii), 243 (1) (b), 244 (1) (b), 258
20d 36 (1) (k) (iii), 379 (3)
21 36 (1) (c), 38, 48 (1) (a)
22 48 (1)
23 36 (1) (i), 48 (1) (b)
25 36 (1) (c), 38, 48 (1) (a)
25a 36 (1) (a)
25b 36 (1) (l)
27 36 (1) (j)
28
29
30 51, 52
31
32
33 486 (3)
34 85, 86
35 486 (3)
36
37 52 (1) (b), 56 (a), 57
Line (B) Reference to article in the regulation (EU) Nr. 575/2013
38 56 (b), 58
39 56 (c), 59, 60, 79
40 56 (d), 59, 79
42 56 (e)
43
44
45
46 62, 63
47 486 (4)
48 87, 88
49 486 (4)
50 62 (c) & (d)
51
52 63 (b) (i), 66 (a), 67
53 66 (b), 68
54 66 (c), 69, 70, 79
55 66 (d), 69, 79
57
58
59
60
61 92 (2) (a)
62 92 (2) (b)
63 92 (2) (c)
64 CRD 128, 129, 130, 131, 133
65
66
67
67a
68 CRD 128
72 36 (1) (h), 45, 46, 56 (c), 59, 60, 66 (c), 69, 70
73 36 (1) (i), 45, 48
75 36 (1) (c), 38, 48
76 62
77 62
78 62
79 62
80 484 (3), 486 (2) & (5)
81 484 (3), 486 (2) & (5)
82 484 (4), 486 (3) & (5)
83 484 (4), 486 (3) & (5)
84 484 (5), 486 (4) & (5)
85 484 (5), 486 (4) & (5)

116 Commerzbank Disclosure Report 2020
Appendix 4: Material geographical regions or countries
The following threshold of materiality was taken as a basis for the
representation in tables EU CRB-C and EU CR1-C: all countries
with a net exposure share of the total exposure of at least 1 %, are
disclosed individually within their region, all other countries with-
in that region are summarised under „other countries“. All regions
with a net exposure share of the total exposure of at least 1 % are
disclosed as individual regions, all remaining regions are summa-
rised as „other regions“. For information purposes only, the fol-
lowing table displays all countries / regions on a single basis with
a share in net total exposure of ≥ 0.1%.
APP4: Material geographical regions or countries Region/Country Share of total exposure
Region: Western Europe 78.85%
1 Germany 60.36%
2 UK 4.36%
3 France 2.81%
4 Italy 2.40%
5 Switzerland 1.63%
6 Netherlands 1.40%
7 Spain 1.36%
8 Austria 0.77%
9 Luxemburg 0.74%
10 Belgium 0.59%
11 Sweden 0.43%
12 Ireland 0.34%
13 Portugal 0.33%
14 Turkey 0.26%
15 Finland 0.22%
16 Norway 0.20%
17 Greece 0.20%
18 Denmark 0.16%
19 Cypress 0.10%
other countries, each with a share of less than 0.1% of the total exposure
in total about 0.2%
Region: Eastern Europe 9.39%
1 Poland 7.37%
2 Czech. Republic 0.89%
3 Russia 0.47%
4 Hungary 0.28%
5 Slovakia 0.21%
other countries, each with a share of less than 0.1% of the total exposure
in total about 0.2%
Region: North America 5.51%
1 USA 4.52%
2 Canada 0.98%
3 Greenland 0.01%
Region/Country Share of total exposure
Region: Asia 4.28%
1 Japan 1.55%
2 China 0.73%
3 Singapore 0.30%
4 Hongkong 0.20%
5 South Korea 0.17%
6 Bangladesh 0.15%
7 India 0.15%
8 United Arabian Emirates 0.12%
other countries, each with a share of less than 0.1% of the total exposure
insgesamt ca. 0.9%
Region: Latin America 1.04%
1 Brazil 0.41%
2 Cayman Islands (GBR) 0.17%
other countries, each with a share of less than 0.1% of the total exposure
in total about 0.5%
Region: Africa 0.46%
1 Egypt 0.09%
other countries, each with a share of less than 0.1% of the total exposure
in total about 0.4%
Other regions: 0.47%
1 International organisations 0.32%
2 Oceania (Australia 0.1%) 0.11%
3 Others 0.05%
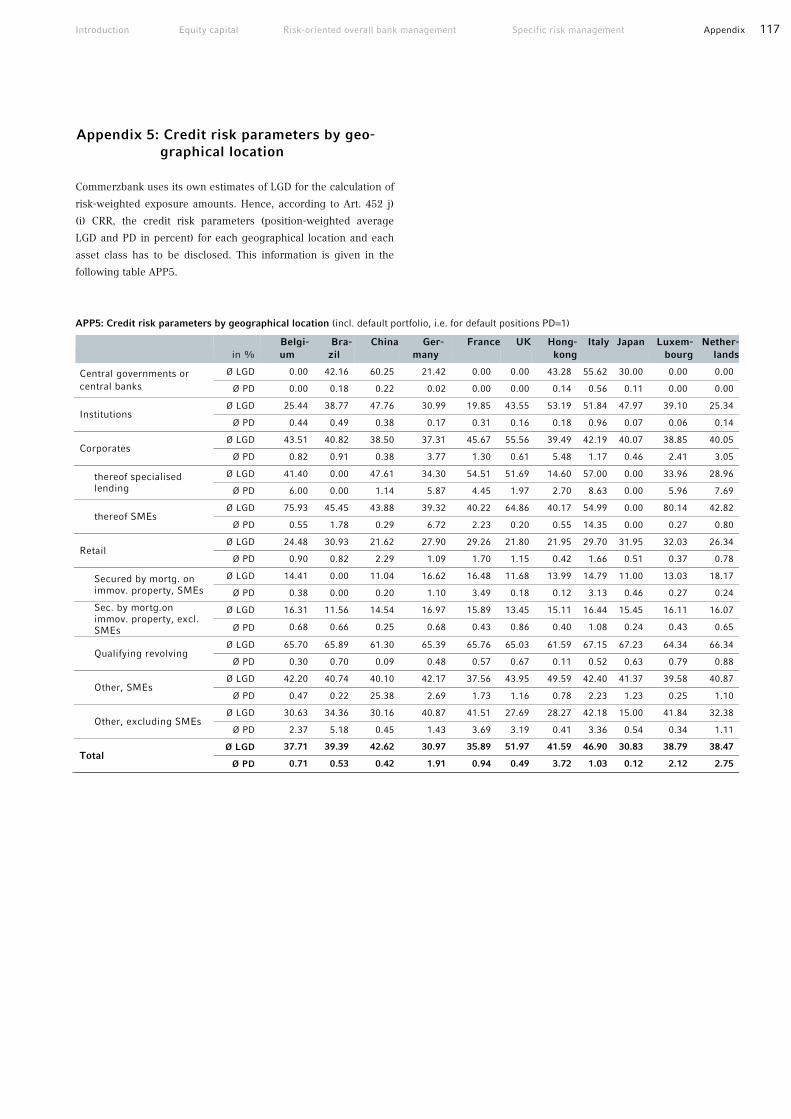
Introduction Equity capital Risk-oriented overall bank management Specific risk management Appendix 117
Appendix 5: Credit risk parameters by geo-graphical location
Commerzbank uses its own estimates of LGD for the calculation of
risk-weighted exposure amounts. Hence, according to Art. 452 j)
(i) CRR, the credit risk parameters (position-weighted average
LGD and PD in percent) for each geographical location and each
asset class has to be disclosed. This information is given in the
following table APP5.
APP5: Credit risk parameters by geographical location (incl. default portfolio, i.e. for default positions PD=1)
in % Belgi-um
Bra-zil
China Ger-many
France UK Hong-kong
Italy Japan Luxem-bourg
Nether-lands
Central governments or central banks
Ø LGD 0.00 42.16 60.25 21.42 0.00 0.00 43.28 55.62 30.00 0.00 0.00
Ø PD 0.00 0.18 0.22 0.02 0.00 0.00 0.14 0.56 0.11 0.00 0.00
Institutions Ø LGD 25.44 38.77 47.76 30.99 19.85 43.55 53.19 51.84 47.97 39.10 25.34
Ø PD 0.44 0.49 0.38 0.17 0.31 0.16 0.18 0.96 0.07 0.06 0.14
Corporates Ø LGD 43.51 40.82 38.50 37.31 45.67 55.56 39.49 42.19 40.07 38.85 40.05
Ø PD 0.82 0.91 0.38 3.77 1.30 0.61 5.48 1.17 0.46 2.41 3.05
thereof specialised lending
Ø LGD 41.40 0.00 47.61 34.30 54.51 51.69 14.60 57.00 0.00 33.96 28.96
Ø PD 6.00 0.00 1.14 5.87 4.45 1.97 2.70 8.63 0.00 5.96 7.69
thereof SMEs Ø LGD 75.93 45.45 43.88 39.32 40.22 64.86 40.17 54.99 0.00 80.14 42.82
Ø PD 0.55 1.78 0.29 6.72 2.23 0.20 0.55 14.35 0.00 0.27 0.80
Retail Ø LGD 24.48 30.93 21.62 27.90 29.26 21.80 21.95 29.70 31.95 32.03 26.34
Ø PD 0.90 0.82 2.29 1.09 1.70 1.15 0.42 1.66 0.51 0.37 0.78
Secured by mortg. on immov. property, SMEs
Ø LGD 14.41 0.00 11.04 16.62 16.48 11.68 13.99 14.79 11.00 13.03 18.17
Ø PD 0.38 0.00 0.20 1.10 3.49 0.18 0.12 3.13 0.46 0.27 0.24
Sec. by mortg.on immov. property, excl. SMEs
Ø LGD 16.31 11.56 14.54 16.97 15.89 13.45 15.11 16.44 15.45 16.11 16.07
Ø PD 0.68 0.66 0.25 0.68 0.43 0.86 0.40 1.08 0.24 0.43 0.65
Qualifying revolving Ø LGD 65.70 65.89 61.30 65.39 65.76 65.03 61.59 67.15 67.23 64.34 66.34
Ø PD 0.30 0.70 0.09 0.48 0.57 0.67 0.11 0.52 0.63 0.79 0.88
Other, SMEs Ø LGD 42.20 40.74 40.10 42.17 37.56 43.95 49.59 42.40 41.37 39.58 40.87
Ø PD 0.47 0.22 25.38 2.69 1.73 1.16 0.78 2.23 1.23 0.25 1.10
Other, excluding SMEs Ø LGD 30.63 34.36 30.16 40.87 41.51 27.69 28.27 42.18 15.00 41.84 32.38
Ø PD 2.37 5.18 0.45 1.43 3.69 3.19 0.41 3.36 0.54 0.34 1.11
Total Ø LGD 37.71 39.39 42.62 30.97 35.89 51.97 41.59 46.90 30.83 38.79 38.47
Ø PD 0.71 0.53 0.42 1.91 0.94 0.49 3.72 1.03 0.12 2.12 2.75

118 Commerzbank Disclosure Report 2020
APP5_cont.: Credit risk parameters by geographical location (incl. default portfolio, e.g. for default positions PD=1)
in %
Austria Poland Russia Swit-zer-land
Singa-pore
Slova-kia
Spain Czech Re-
public
Hun-gary
Unit. Arab
Emirates
USA
Central governments or central banks
Ø LGD 60,49 62,83 10,00 22,81 100,00 100,00 74,35 19,99
Ø PD 0,15 0,21 0,01 0,04 0,07 0,25 0,13
Institutions Ø LGD 19,07 40,77 37,89 25,89 46,34 7,58 30,14 42,56 41,95 45,51 49,18
Ø PD 0,17 0,45 1,17 0,06 0,03 0,31 0,23 0,07 0,09 0,39 0,13
Corporates Ø LGD 40,13 41,07 40,19 38,68 36,74 38,52 39,92 40,74 38,93 27,14 44,77
Ø PD 0,70 4,97 0,51 2,50 3,90 2,52 1,16 5,52 1,40 0,70 0,64
thereof specialised lending
Ø LGD 23,23 84,26 12,04 14,60 45,69 2,70 74,55 62,89
Ø PD 2,76 0,28 0,40 2,70 1,00 51,02 0,31 0,11
thereof SMEs Ø LGD 30,46 40,75 37,97 41,34 25,87 45,41 74,90 51,28 61,15
Ø PD 0,78 4,24 4,86 1,17 0,57 0,07 68,02 1,72 0,69
Retail Ø LGD 29,67 36,18 18,32 25,92 23,57 46,19 16,79 40,12 40,33 21,28 23,44
Ø PD 1,72 5,33 1,54 0,77 0,25 2,34 0,56 1,71 7,55 0,80 0,74
Secured by mortg. on immov. property, SMEs
Ø LGD 13,86 35,93 11,03 13,94 12,05 13,61 18,68 14,26 11,44
Ø PD 6,22 6,37 0,10 1,16 0,06 0,49 1,17 0,89 0,19
Sec. by mortg.on immov. property, excl. SMEs
Ø LGD 16,16 28,24 12,93 16,44 15,57 43,78 15,36 15,48 14,67 15,73 14,08
Ø PD 1,18 2,90 2,77 0,66 0,22 1,99 0,33 1,42 1,48 1,12 0,40
Qualifying revolving Ø LGD 64,65 67,65 65,05 64,97 61,88 69,50 66,36 68,10 67,49 62,61 65,76
Ø PD 0,39 2,27 0,21 0,52 0,44 0,37 0,61 2,32 0,63 0,92 0,88
Other, SMEs Ø LGD 41,18 37,43 14,29 29,60 44,62 45,55 40,64 41,76 45,12 25,67 33,11
Ø PD 3,59 8,27 0,18 1,00 0,65 2,48 2,35 0,72 9,65 0,35 2,03
Other, excluding SMEs Ø LGD 34,96 51,31 28,35 40,14 37,87 41,78 9,73 52,70 50,21 29,11 35,22
Ø PD 0,67 7,61 0,53 0,88 0,27 22,79 0,58 6,18 6,12 0,32 1,21
Total Ø LGD 35,02 38,01 41,95 32,26 32,88 34,02 36,10 47,51 41,87 43,27 44,02
Ø PD 0,64 5,11 0,70 1,48 2,55 2,19 0,83 4,80 1,21 0,45 0,46
Appendix 6: Overview – Compliance with the CRR requirements
Commerzbank Group’s compliance with the CRR requirements as at
31 December 2020 is given in detail in the following overview APP6.

Introduction Equity capital Risk-oriented overall bank management Specific risk management Appendix 119
APP6: Overview – Compliance with the CRR requirements Article CRR Topic Reference to disclosure
(Chapter of Disclosure Report or reference to separate document) Tables
431 - 434 Scope of disclosure requirements Non-material, proprietary or confidential information Frequency and means of disclosures
Introduction > Objective of the Disclosure Report Introduction > Scope Introduction > Waiver rule pursuant to Article 7 CRR
–
435(1) a)-d)
Risk management objectives and policies
Risk-oriented overall bank management > Risk management organisation > Risk strategy and risk management > Risk-bearing capacity and stress testing
–
Specific risk management > A. Credit risk (CR) > Risk management > B. Counterparty credit risk (CCR) > Risk management > D. Market risk (MR) > Risk management > E. Liquidity risk (LR) > F. Operational risk (OR) > Risk management
–
Annual Report 2020: > Economic report > Funding and liquidity of the Commerzbank Group
–
Annual Report 2020: >Notes (65) Liquidity Coverage Ratio
–
435(1) e), f) Risk management objectives and policies
Risk-oriented overall bank management > Risk statement
–
Annual Report 2020: > Economic report > Funding and liquidity of the Commerzbank Group
–
Annual Report 2020: > Notes (65) Liquidity Coverage Ratio
–
435(2) a) - d) Governance arrangements Annual Report 2020: Corporate governance report, chapters Board of Managing Directors, Supervisory Board and Diversity Homepage: https://www.commerzbank.de/en/hauptnavigation/aktionaere/governance_/corporate_governace_1.html
–
435(2) e) Governance arrangements Risk-oriented overall bank management > Risk management organisation > Risk strategy and risk management
–
436 a) Scope of application Introduction > Scope –
436 b) Scope of application Total capital, capital requirement and RWA > Connection between balance-sheet and regulatory positions
EU LI1 EU LI2
Appendix > Appendix 1 EU LI3
436 c), d) Scope of application Total capital, capital requirement and RWA > Connection between balance-sheet and regulatory positions
–
436 e) Scope of application Introduction > Waiver rule pursuant to Article 7 CRR –
437(1) a) 437(2)
Own funds
Total capital, capital requirement and RWA > Connection between balance-sheet and regulatory positions
CAP2
437(1) b)-c) Own funds
Homepage: https://www.commerzbank.de/en/hauptnavigation/aktionaere/informationen_f_r_fremdkapitalgeber/kapitalinstrumente/CapitalInstruments.html
–
437(1) d)-f) 437(2)
Own funds
Total capital, capital requirement and RWA > Capital structure Appendix > Appendix 3
CAP1 APP3
438 a), b) Capital requirements
Risk-oriented overall bank management > Risk-bearing capacity and stress testing
RBC1
438 c)-f) Capital requirements Total capital, capital requirement and RWA > Capital requirement and RWA
EU OV1
438 d) Capital requirements Specific risk management > A.Credit risk (CR) > Credit risk and credit risk mitigation in the IRBA
EU CR8
Specific risk management > B. Counterparty credit risk (CCR) > Information by regulatory risk-weighting approach
EU CCR7
438 last paragraph
Capital requirements Specific risk management > A.Credit risk (CR) > Credit risk and credit risk mitigation in the IRBA
EU CR10

120 Commerzbank Disclosure Report 2020
Article CRR Topic Reference to disclosure
(Chapter of Disclosure Report or reference to separate document) Tables
439 a)-c), i) Counterparty credit risk Specific risk management > B. Counterparty credit risk (CCR) > Risk management
–
439 d), e), g), h)
Counterparty credit risk Specific risk management > B. Counterparty credit risk (CCR) > Further information on counterparty credit risk
EU CCR5-A EU CCR5-B
EU CCR6 addCCR1
439 e), f), i) Counterparty credit risk Specific risk management > B. Counterparty credit risk (CCR) > Information on regulatory methods
EU CCR1 EU CCR2 EU CCR8
440 Capital buffers Appendix > Appendix 2 APP2
441 Indicators of global systemic importance Homepage: https://www.commerzbank.de/en/hauptnavigation/aktionaere/informationen_f_r_fremdkapitalgeber/deckungsregister/transparenzangaben.html
–
442 a)-b) Credit risk adjustments Specific risk management > A. Credit risk (CR) > Loan loss provisions for default risks
–
442 c)-f) Credit risk adjustments Specific risk management > A. Credit risk (CR) > Overarching portfolio analyses
EU CRB-B EU CRB-C EU CRB-D EU CRB-E
Appendix > Appendix 4 APP4
442 g)-i) Credit risk adjustments Specific risk management > A. Credit risk (CR) > Loan loss provisions for default risks
EU CR1-A EU CR1-B EU CR1-C EU CR1-D EU CR1-E EU CR1-F EU CR2-A EU CR2-B
443 Unencumbered assets Annual Report 2020: > Information on the encumbrance of assets
–
444 a)-e) Use of ECAIs Specific risk management >A. Credit risk (CR) > Credit risk and credit risk mitigation in the SACR
EU CR4 EU CR5
444 e) Use of ECAIs Specific risk management > B. Counterparty credit risk (CCR) > Information by regulatory risk-weighting approach
EU CCR3
445 Market risk Specific risk management > D. Market risk (MR) > Quantitative information on market risk
EU MR1
446 Operational risk Specific risk management > F. Operational risk (OR)
–
447 a) - e) Exposures in equities not included in the trading book
Specific risk management > A. Credit risk (CR) > Investments in the banking book
INV1 INV2
448 a), b) Exposure to interest rate risk on positions not included in the trading book
Specific risk management > D. Market risk (MR) > Interest rate risk in the banking book
addMR2
449 a)-r) Exposure to securitisation positions Specific risk management > C. Securitisations (SEC)
SEC1 SEC2 SEC3 SEC4 SEC5
450 Remuneration policy Annual Report 2020: > Remuneration Report Remuneration Report on the homepage: https://www.commerzbank.de/en/hauptnavigation/aktionaere/publikationen_und_veranstaltungen/unternehmensberichterstattung_1/index.html
–
451 Leverage Annual Report 2020: > Notes (63) Regulatory capital requirements > Notes (64) Leverage ratio
–
452 a)-c) Use of the IRB Approach to credit risk Specific risk management > A. Credit risk (CR)
VAL-A VAL-B
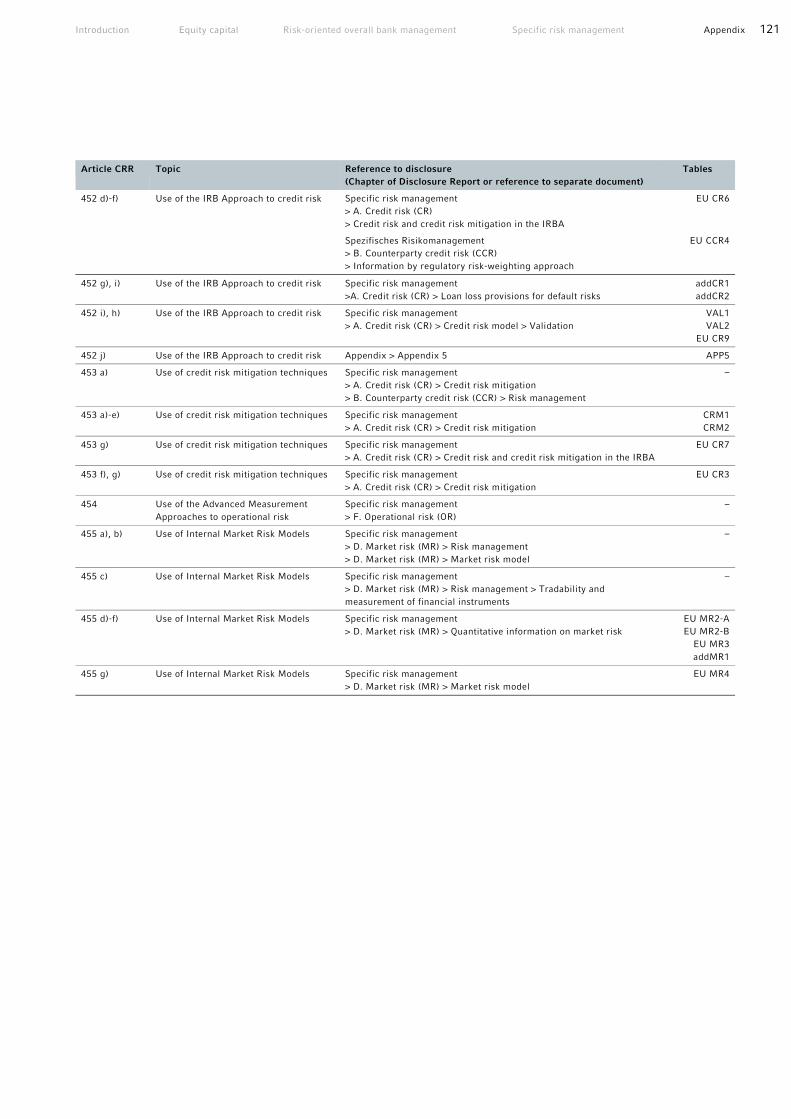
Introduction Equity capital Risk-oriented overall bank management Specific risk management Appendix 121
Article CRR Topic Reference to disclosure
(Chapter of Disclosure Report or reference to separate document) Tables
452 d)-f) Use of the IRB Approach to credit risk Specific risk management > A. Credit risk (CR) > Credit risk and credit risk mitigation in the IRBA
EU CR6
Spezifisches Risikomanagement > B. Counterparty credit risk (CCR) > Information by regulatory risk-weighting approach
EU CCR4
452 g), i) Use of the IRB Approach to credit risk Specific risk management >A. Credit risk (CR) > Loan loss provisions for default risks
addCR1 addCR2
452 i), h) Use of the IRB Approach to credit risk Specific risk management > A. Credit risk (CR) > Credit risk model > Validation
VAL1 VAL2
EU CR9
452 j) Use of the IRB Approach to credit risk Appendix > Appendix 5 APP5
453 a) Use of credit risk mitigation techniques Specific risk management > A. Credit risk (CR) > Credit risk mitigation > B. Counterparty credit risk (CCR) > Risk management
–
453 a)-e) Use of credit risk mitigation techniques Specific risk management > A. Credit risk (CR) > Credit risk mitigation
CRM1 CRM2
453 g) Use of credit risk mitigation techniques Specific risk management > A. Credit risk (CR) > Credit risk and credit risk mitigation in the IRBA
EU CR7
453 f), g) Use of credit risk mitigation techniques Specific risk management > A. Credit risk (CR) > Credit risk mitigation
EU CR3
454 Use of the Advanced Measurement Approaches to operational risk
Specific risk management > F. Operational risk (OR)
–
455 a), b) Use of Internal Market Risk Models Specific risk management > D. Market risk (MR) > Risk management > D. Market risk (MR) > Market risk model
–
455 c) Use of Internal Market Risk Models Specific risk management > D. Market risk (MR) > Risk management > Tradability and measurement of financial instruments
–
455 d)-f) Use of Internal Market Risk Models Specific risk management > D. Market risk (MR) > Quantitative information on market risk
EU MR2-A EU MR2-B
EU MR3 addMR1
455 g) Use of Internal Market Risk Models Specific risk management > D. Market risk (MR) > Market risk model
EU MR4

122 Commerzbank Disclosure Report 2020
List of abbreviations
ABCP Asset-backed Commercial Paper
ABS Asset-backed Securities
AC Amortised Cost
ACR Asset & Capital Recovery
ALCO Asset Liability Committee
AMA Advanced Measurement Approach
AUC Area under the curve
BaFin Federal Financial Supervisory Authority
BEC Business Environment and Control System
CCF Credit Conversion Factor
CCR Counterparty Credit Risk
CMBS Commercial Mortgage-backed Securities
COREP Common solvency ratio reporting
CP Commercial Paper
CR Credit Risk
CRD Capital Requirements Directive
CRM Credit Risk Mitigation
CRO Chief Risk Officer
CRR Capital Requirements Regulation
CVA Credit Valuation Adjustment
CVaR Credit Value at Risk
EaD Exposure at Default
EBA European Banking Authority
ECB European Central Bank
EEPE Effected Expected Positive Exposure
EL Expected Loss
ErC Economically required Capital
FINREP Financial Reporting
FVOCI Fair Value through Other Comprehensive Income
FVPL Fair Value through P&L
GL Guideline
G-SII Global Systemically Important Institution
HGB German Commercial Code
IAA Internal Assessment Approach
IAS International Accounting Standards
ICAAP Internal Capital Adequacy Assessment Process
ICS Internal Control System
IFRS International Financial Reporting Standards
IMA Internal Model Approach
IMM Internal Model Method
IPV Independent Price Verification
IRBA Internal Ratings Based Approach
IRC Incremental Risk Charge
ISDA International Swaps and Derivatives Association
ISIN International Securities Identification Number
ITS Implementing Technical Standards
KRI Key Risk Indicators
KWG German Banking Act
LaD Loss at Default
LCR Liquidity Coverage Ratio
LECL Lifetime Expected Credit Loss
LGD Loss Given Default
LR Liquidity Risk
LTA Look-through Approach
MaRisk Minimum Requirements for Risk Management
MR Market Risk
OpRisk Operational Risk
OR Operational Risk
ORX Operational Riskdata eXchange Association, Geneva
O-SII Other Sytemically Important Institution
P&L Profit & Loss
PD Probability of Default
PPU Permanent Partial Use
RBC ratio Risk-bearing capacity ratio
RMBS Residential Mortgage-backed Securities
RTS Regulatory Technical Standards
RW Risk weight
RWA Risk-weighted Assets
SACR Standardised Approach to Credit Risk
SEC Securitizations
SFA Supervisory Formula Approach
SFT Securities Financing Transactions
SME Small and medium-sized enterprises
SolvV German Solvency Regulation
SPV Special Purpose Vehicles
SPPI Solely Payment of Principal and Interest
SREP Supervisory Review and Evaluation Process
sVaR stressed Value-at-Risk
TLA Top Level Adjustment
TRIM Targeted Review of the Internal Models
VaR Value-at-Risk

Introduction Equity capital Risk-oriented overall bank management Specific risk management Appendix 123
Disclaimer
Commerzbank’s internal risk measurement methods and models which form the basis for the calculation of the figures shown in this re-
port are state-of-the-art and based on banking sector practice. The risk models produce results appropriate to the management of the
Bank. The measurement approaches are regularly reviewed by risk control and internal audit, external auditors and the German and Eu-
ropean supervisory authorities. Despite being carefully developed and regularly monitored, models cannot cover all the influencing factors
that have an impact in reality or illustrate their complex behaviour and interactions. These limits to risk modelling apply particularly in
extreme situations. Supplementary stress tests and scenario analyses can only show examples of the risks to which a portfolio may be ex-
posed in extreme market situations. However, stress testing all imaginable scenarios is not feasible. Stress tests cannot offer a final esti-
mate of the maximum loss should an extreme event occur.
The interpretations with regard to CRR/CRD IV rules are still ongoing. Therefore requirements for adjustment may occure due, for ex-
ample, to modified interpretations in the course of the Q&A-process with EBA or due to new binding Technical Standards or guidelines.
Against this background we will continue to refine our methods and models in line with the interpretation of the rules. Thus, our measures
may not be comparable with previously published measures and our competitors’ measures published may differ from ours.
This Annual Report contains forward-looking statements on Commerzbank’s business and earnings performance, which are based upon
our current plans, estimates, forecasts and expectations. The statements entail risks and uncertainties, as there are a variety of factors which
influence our business and to a great extent lie beyond our sphere of influence. Above all, these include the economic situation, the state of
the financial markets worldwide and possible loan losses. Actual results and developments may, therefore, diverge considerably from our
current assumptions, which, for this reason, are valid only at the time of publication. We undertake no obligation to revise our forward-
looking statements in the light of either new information or unexpected events.

Commerzbank AGHead OfficeKaiserplatzFrankfurt am Mainwww.commerzbank.com
Postal address60261 Frankfurt am MainTel. + 49 69 [email protected]
Investor RelationsTel. + 49 69 [email protected]
2021The bank at your side
Disclosure Report as at 31 March
in accordance with the Capital Requirements Regulation (CRR)