disclosures under basel iii - axis bank · pdf filedisclosures under basel iii capital...
TRANSCRIPT

Our custOmers. Our wOrld.
Axis Bank Limited254
Disclosures unDer Basel iii Capital Regulations (Consolidated) for the year ended 31 March, 2017
I. SCOPE OF APPLICATION AND CAPITAL ADEQUACY Name of the head of the banking group to which the framework applies: Axis Bank Limited axis Bank limited (the ‘Bank’) is a commercial bank, which was incorporated on the 3 December, 1993. The Bank is the
controlling entity for all group entities. The consolidated financial statements of the Bank comprise the financial statements of axis Bank limited and its subsidiaries that together constitute the ‘Group’. The Bank consolidates its subsidiaries in accordance with accounting standard 21 (as-21) ‘consolidated Financial statements’ issued by the institute of chartered accountants of india on a line-by-line basis by adding together the like items of assets, liabilities, income and expenditure.
(i) Qualitative Disclosures
The list of group entities considered for consolidation is given below:
Name of the Entity/Country of Incorporation
Included under Accounting Scope of Consolidation
Method of Consolidation
Included under Regulatory Scope of Consolidation
Method of Consolidation
Reasons for difference in the Method of Consolidation
Reasons, if Consolidated under only one of the Scopes of Consolidation
axis asset Management company limited/india
Yes consolidated in accordance with as-21- consolidated Financial statements
Yes consolidated in accordance with as-21- consolidated Financial statements
na na
axis Bank uK limited/uK
Yes consolidated in accordance with as-21- consolidated Financial statements
Yes consolidated in accordance with as-21- consolidated Financial statements
na na
axis capital limited/india
Yes consolidated in accordance with as-21- consolidated Financial statements
Yes consolidated in accordance with as-21- consolidated Financial statements
na na
axis Finance limited/india
Yes consolidated in accordance with as-21- consolidated Financial statements
Yes consolidated in accordance with as-21- consolidated Financial statements
na na
axis Mutual Fund Trustee limited/india
Yes consolidated in accordance with as-21- consolidated Financial statements
Yes consolidated in accordance with as-21- consolidated Financial statements
na na
axis Private equity limited/india
Yes consolidated in accordance with as-21- consolidated Financial statements
Yes consolidated in accordance with as-21- consolidated Financial statements
na na
axis securities limited/india
Yes consolidated in accordance with as-21- consolidated Financial statements
Yes consolidated in accordance with as-21- consolidated Financial statements
na na
axis Trustee services limited/india
Yes consolidated in accordance with as-21- consolidated Financial statements
Yes consolidated in accordance with as-21- consolidated Financial statements
na na
a.Treds limited/india
Yes consolidated in accordance with as-21-consolidated Financial statements
Yes consolidated in accordance with as-21- consolidated Financial statements
na na
* na – not applicable
as on 31 March, 2017, axis securities europe ltd. a wholly-owned subsidiary of the Bank in united Kingdom has opted for voluntary winding up and the same is under process.
There are no group entities that are not considered for consolidation under both the accounting scope of consolidation and regulatory scope of consolidation.

Annual Report 2016-17
Business oveRview
sTATuToRYRePoRTs
FinAnCiALsTATeMenTs
BAseL iii DisCLosuRes
255
(ii) Quantitative Disclosures
The list of group entities considered for consolidation as on 31 March, 2017 is given below:
(Amt. in millions)
Name of the Entity/Country of Incorporation
Principal Activity of the Entity Total Balance Sheet Equity*
Total Balance Sheet Assets
axis asset Management company limited/india
asset Management company for axis Mutual Fund `2,101 `3,739
axis Bank uK limited/uK retail Banking, corporate Banking, commercial Banking and Treasury services
`3,567(usD 55)
`53,350(usD 823)
axis capital limited/india Merchant Banking, institutional Broking and investment Banking Business
`735 `11,988
axis Finance limited/india non-Banking Financial activities `4,183 `52,756
axis Mutual Fund Trustee limited/india Trustee company for axis Mutual Fund `1 `4
axis Private equity limited/india Managing investments, venture capital funds and off-shore funds
`15 `42
axis securities limited/india Marketing of retail asset Products, credit cards and retail Broking
`1,445 `4,484
axis Trustee services limited/india Trusteeship services `15 `673
a.Treds limited/india setting up institutional mechanism to facilitate financing of trade receivables of MsMe
`250 `255
* Paid up equity capital
note -
There is no capital deficiency in any subsidiary, which is not included in the regulatory scope of consolidation.
as on 31 March, 2017, the Bank does not have controlling interest in any insurance entity.
There are no restrictions or impediments on transfer of funds or regulatory capital within the banking group.
II. CAPITAL ADEQUACY The Bank is subject to the capital adequacy guidelines stipulated by rBi, which are based on the framework of the Basel committee
on Banking supervision. as per Basel iii guidelines, the Bank is required to maintain a minimum capital to risk Weighted assets ratio (crar) of 9% {11.5% including capital conservation Buffer (ccB)}, with minimum common equity Tier i (ceT1) of 5.5% (8% including ccB) as on 31 March, 2019. These guidelines on Basel iii have been implemented on 1 april, 2013 in a phased manner. The minimum capital required to be maintained by the Bank for the year ended 31 March, 2017 is 10.25% with minimum common equity Tier 1 (ceT1) of 6.75% (including ccB of 1.25%).
an assessment of the capital requirement of the Bank is carried out through a comprehensive projection of future businesses that takes cognizance of the strategic intent of the Bank, profitability of particular businesses and opportunities for growth. The proper mapping of credit, operational and market risks to this projected business growth enables assignment of capital that not only adequately covers the minimum regulatory capital requirement but also provides headroom for growth. The calibration of risk to business is enabled by a strong risk culture in the Bank aided by appropriate, technology-based risk management systems. as part of the internal capital adequacy assessment Process (icaaP), the Bank also assesses the adequacy of capital under stress. a summary of the Bank’s capital requirement for credit, market and operational risk and the capital adequacy ratio as on 31 March, 2017 is presented below:

Our custOmers. Our wOrld.
Axis Bank Limited256
Disclosures unDer Basel iii (conT.)
(` in millions)
Capital Requirements for various Risks AmountCREDIT RISK
capital requirements for credit risk
- Portfolios subject to standardized approach 365,843
- securitisation exposures -
MARKET RISK
capital requirements for Market risk
- standardised duration approach 31,591
- interest rate risk 24,722
- Foreign exchange risk (including gold) 311
- equity risk 6,558
OPERATIONAL RISK
capital requirements for operational risk
- Basic indicator approach 38,869
capital requirement has been computed at 9% of rWa
Capital Adequacy Ratios Consolidated Standalone
common equity Tier - 1 crar 11.25% 11.13%
Tier - 1 crar 11.97% 11.87%
Total crar 15.01% 14.95%
III. RISK MANAGEMENT: OBJECTIVES AND ORGANISATION STRUCTURE The wide variety of businesses undertaken by the Bank requires it to identify, measure, control, monitor and report risks effectively.
The key components of the Bank’s risk management rely on the risk governance architecture, comprehensive processes and internal control mechanism based on approved policies and guidelines. The Bank’s risk governance architecture focuses on the key areas of risk such as credit, market (including liquidity) and operational risk and quantification of these risks, wherever possible, for effective and continuous monitoring and control.
Objectives and Policies
The Bank’s risk management processes are guided by well-defined policies appropriate for various risk categories, independent risk oversight and periodic monitoring through the sub-committees of the Board of Directors. The Board sets the overall risk appetite and philosophy for the Bank. The committee of Directors, the risk Management committee and the audit committee of the Board, which are sub-committees of the Board, review various aspects of risk arising from the businesses of the Bank. Various senior management committees operate within the broad policy framework as illustrated below:
Board of Directors
risk Managementcommittee (rMc)
executive risk Management committees
cro
respective teams work under these heads of
different components of risk
audit committee of the Board (acB)
committee ofDirectors (coD)
credit & investmentcommittees
Functional area Committeecredit risk crMsoperational risk orMsMarket risk, liquidity alcosubsidiary risk sGcreputation risk rrMcBusiness continuity risk BcPMcoutsourcing risk cocinfo security risk issc

Annual Report 2016-17
Business oveRview
sTATuToRYRePoRTs
FinAnCiALsTATeMenTs
BAseL iii DisCLosuRes
257
The Bank has put in place policies relating to management of credit risk, market risk, operational risk, information security risk, reputation risk, subsidiary risk and asset-liability both for the domestic as well as overseas operations along with overseas subsidiaries as per the respective host regulatory requirements and business needs. The overseas policies are drawn based on the risk perceptions of these economies and the Bank’s risk appetite.
The Bank has formulated a comprehensive stress Testing Policy to measure impact of adverse stress scenarios on the adequacy of capital. The stress scenarios are idiosyncratic, market wide and a combination of both.
Structure and Organisation
The chief risk officer reports to the Managing Director and ceo. The risk Management committee of the Board oversees the functioning of the Department. The Department has separate teams for individual components of risk i.e. credit risk, Market risk (including Treasury Mid office), operational risk, enterprise risk, risk analytics, risk Data Management and information security risk. These teams report to the chief risk officer.
IV. CREDIT RISK credit risk refers to the deterioration in the credit quality of the borrower or the counter-party adversely impacting the financial
performance of the Bank. The losses incurred by the Bank in a credit transaction could be due to inability or wilful default of the borrower in honouring the financial commitments to the Bank. The Bank is exposed to credit risk through lending and capital market activities.
Credit Risk Management Policy
The Board of Directors establishes parameters for risk appetite which are defined through strategic businesses plan as well as the corporate credit Policy. credit risk Management Policy lays down the roles and responsibilities, risk appetite, key processes and reporting framework. corporate credit is managed through rating of borrowers and the transaction, thorough due diligence through an appraisal process alongside risk vetting of individual exposures at origination and thorough periodic review (including portfolio review) after sanctioning. retail credit to individuals and small business is managed through definition of product criteria, appropriate credit filters and subsequent portfolio monitoring.
Credit Rating System
The foundation of credit risk management rests on the internal rating system. rating linked single borrower exposure norms, delegation of powers and review frequency have been adopted by the Bank. The Bank has developed rating tools specific to market segments such as large and mid-corporates, sMe, financial companies, microfinance companies and project finance to objectively assess underlying risk associated with such exposures.
The credit rating model uses a combination of quantitative and qualitative inputs to arrive at a ‘point-in-time’ view of the risk profile of counterparty. each internal rating grade corresponds to a distinct probability of default over one year. expert scorecards are used for various sMe schematic products and retail agriculture schemes. statistical application and behavioural scorecards have been developed for all major retail portfolios.
The Bank recognises cash, central/state government, bank and corporate guarantees, exclusive mortgage of properties and lease rental securitisation for the purpose of credit enhancement to arrive at a facility rating.
Model validation is carried out annually by objectively assessing the discriminatory power, calibration accuracy and stability of ratings. The Bank has completed the estimation and validation of PD, lGD and ccF models for corporate and retail portfolios.
Credit Sanction and Related Processes
The guiding principles behind the credit sanction process are as under:
• ‘KnowYourCustomer’isaleadingprincipleforallactivities.
• Theacceptabilityofcreditexposureisprimarilybasedonthesustainabilityandadequacyofborrower’snormalbusinessoperations and not based solely on the availability of security.

Our custOmers. Our wOrld.
Axis Bank Limited258
Disclosures unDer Basel iii (conT.)
The Bank has put in place a hierarchical committee structure based on the size and rating of the exposures for credit sanction and review; with sanctioning authority rested with higher level committees for larger and lesser rated exposures. committee of Directors (coD) is the topmost committee in the hierarchy which is a sub-committee of the Board.
all management level sanctioning committees require mandatory presence of a representative from risk Department for quorum.
Review and Monitoring
• Allcreditexposures,onceapproved,aremonitoredandreviewedperiodicallyagainsttheapprovedlimits.Borrowerswithlower credit rating are subject to more frequent reviews.
• Creditauditinvolvesindependentreviewofcreditriskassessment,compliancewithinternalpoliciesoftheBankandwiththe regulatory framework, compliance of sanction terms and conditions and effectiveness of loan administration.
• Customers with emerging credit problems are identified early and classified accordingly. Remedial action is initiatedpromptly to minimize the potential loss to the Bank.
Concentration Risk
The Bank manages concentration risk by means of appropriate structural limits and borrower-wise limits based on credit-worthiness. credit concentration in the Bank’s portfolios is monitored for the following:
• Largeexposurestotheindividualclientsorgroup:TheBankhasindividualborrower-wiseexposureceilingsbasedontheinternal rating of the borrower as well as group-wise borrowing limits which are continuously tracked and monitored.
• Geographicconcentrationforrealestateexposures.
• Concentrationby Industry: Industryanalysisplaysan importantpart inassessing theconcentration riskwithin the loanportfolio. industries are classified into various categories based on factors such as demand-supply, input related risks, government policy stance towards the sector and financial strength of the sector in general. such categorization is used in determining the expansion strategy for the particular industry.
Portfolio Management
Portfolio level risk analytics and reporting to senior management examines optimal spread of risk across various rating classes, undue risk concentration across any particular industry segments and delinquencies. Borrowers or portfolios are marked for early warning when signs of weakness or financial deterioration are envisaged in order that timely remedial actions may be initiated. in-depth sector specific studies are undertaken on portfolios vulnerable to extraneous shocks and the results are shared with the business departments. The Bank has a well-defined stress testing policy in place and periodic stress testing is undertaken on various portfolios to gauge the impact of stress situations on the health of portfolio, profitability and capital adequacy.
retail lending portfolio is the blended mix of consumer lending and retail rural lending Portfolios. secured products (like mortgage, wheels business) commands a major share of the consumer lending Portfolio, as the Bank continues to grow the unsecured lending book (personal loans and credit card business) albeit with prudent underwriting practice. The Bank has developed a robust risk management framework at each stage of retail loan cycle i.e. loan acquisition, underwriting and collections.
underwriting strategy relies on extensive usage of analytical scoring models which also takes inputs from bureau. The Bank uses ‘rules engine’ which helps customise business rules thereby aiding in faster decision making without compromising on the underlying risks. senior Management takes note of movement and direction of risk reported through information published on structured dashboards.
Definitions and Classification of Non-Performing Assets
advances are classified into performing and non-performing assets (nPas) as per rBi guidelines.
a non-performing asset (nPa) is a loan or an advance where;

Annual Report 2016-17
Business oveRview
sTATuToRYRePoRTs
FinAnCiALsTATeMenTs
BAseL iii DisCLosuRes
259
• interestand/orinstallmentofprincipalremainsoverdueforaperiodofmorethan90daysinrespectofatermloan,
• theaccountremains‘out-of-order’foraperiodofmorethan90daysinrespectofanOverdraftorCashCredit(OD/CC),
• thebillremainsoverdueforaperiodofmorethan90daysincaseofbillspurchasedanddiscounted,
• aloangrantedforshortdurationcropswillbetreatedasanNPAiftheinstallmentsofprincipalorinterestthereonremainoverdue for two crop seasons,
• aloangrantedforlongdurationcropswillbetreatedasanNPAiftheinstallmentsofprincipalorinterestthereonremainoverdue for one crop season,
• in respectofderivative transactions, theoverduereceivables representingpositivemark-to-marketvalueofaderivativecontract, if these remain unpaid for a period of 90 days from the specified due date for payment,
• the amount of liquidity facility remains outstanding for more than 90 days, in respect of a securitisation transactionundertaken in terms of guidelines on securitisation dated 1 February, 2006.
nPas are further classified into sub-standard, doubtful and loss assets based on the criteria stipulated by rBi. a sub-standard asset is one, which has remained an nPa for a period less than or equal to 12 months. an asset is classified as doubtful if it has remained in the sub-standard category for more than 12 months. a loss asset is one where loss has been identified by the Bank or internal or external auditors or during rBi inspection but the amount has not been written off fully.
Definition of Impairment
at each balance sheet date, the Bank ascertains if there is any impairment in its assets. if such impairment is detected, the Bank estimates the recoverable amount of the asset. if the recoverable amount of the asset or the cash-generating unit to which the asset belongs is less than its carrying amount, the carrying amount is reduced to its recoverable amount. The reduction is treated as an impairment loss and is recognised in the profit and loss account.
Credit Risk Exposures
Total Gross Credit Risk Exposure Including Geographic Distribution of Exposure – Position as on 31 March, 2017
(` in millions)
Domestic (Outstanding)
Overseas (Outstanding)
Total
Fund Based 5,164,546 594,638 5,759,184
non Fund Based * 1,059,702 90,135 1,149,837
Total 6,224,248 684,773 6,909,021
* non-fund based exposures are bank guarantees issued on behalf of constituents and acceptances and endorsements.

Our custOmers. Our wOrld.
Axis Bank Limited260
Disclosures unDer Basel iii (conT.)
Distribution of Credit Risk Exposure by Industry Sector – Position as on 31 March, 2017
(` in millions)Industry Classification Fund Based
(Outstanding)Non-Fund Based
(Outstanding)
Banking and Finance* 489,980 168,835
infrastructure (excluding Power) 232,289 233,496
engineering 82,418 183,728
Power Generation & Distribution 197,939 50,829
Trade 181,224 56,612
chemicals and chemical products 118,012 48,330
Metal and Metal Products 128,164 34,078
commercial real estate 141,652 12,428
iron and steel 112,322 32,239
Petroleum, coal Products and nuclear Fuels 48,327 93,059
nBFcs 86,748 19,294
Food Processing 93,251 4,348
construction 29,986 40,655
Professional services 63,087 3,834
cement and cement Products 48,102 13,251
cotton Textiles 45,160 2,887
computer software 25,953 20,891
rubber, Plastic and their Products 30,374 5,283
shipping Transportation & logistics 31,102 3,499
Vehicles, Vehicle Parts and Transport equipment 28,609 5,452
Mining and Quarrying (including coal) 30,213 967
other Textiles 26,689 3,272
entertainment & Media 16,593 10,344
edibile oils and Vanaspati 7,274 16,274
other industries 245,674 48,136
residual exposures 3,218,042 37,816
- of which other assets 185,998 -
- of which Banking Book investments 808,152 -
- of which retail, agriculture & others 2,223,892 -
Total 5,759,184 1,149,837
* includes cash, Balances with rBi and Balances with banks and money at call and short notice
as on 31 March, 2017, the Bank’s exposure to the industries stated below was more than 5% of the total gross credit exposure (outstanding):
Sr. No.
Industry Classification Percentage of the total gross credit exposure
1. Banking & Finance 10%
2. infrastructure (excluding Power) 7%
Annual Report 2016-17
Business oveRview
sTATuToRYRePoRTs
FinAnCiALsTATeMenTs
BAseL iii DisCLosuRes
261
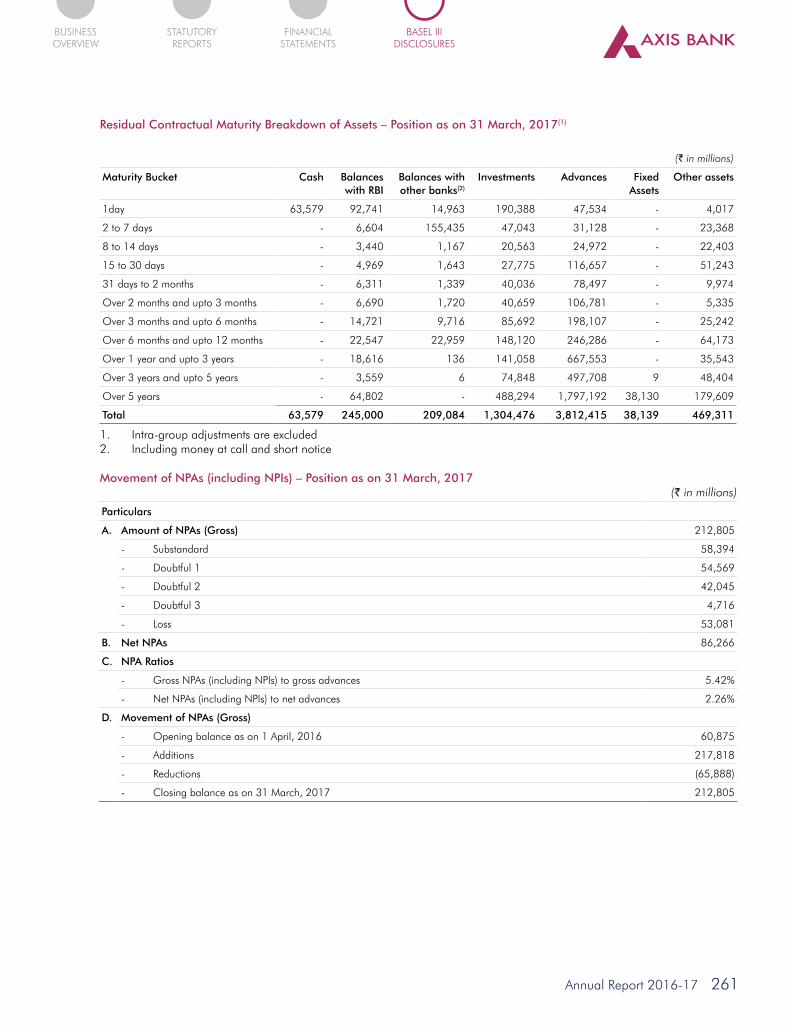
Residual Contractual Maturity Breakdown of Assets – Position as on 31 March, 2017(1)
(` in millions)
Maturity Bucket Cash Balances with RBI
Balances with other banks(2)
Investments Advances Fixed Assets
Other assets
1day 63,579 92,741 14,963 190,388 47,534 - 4,017
2 to 7 days - 6,604 155,435 47,043 31,128 - 23,368
8 to 14 days - 3,440 1,167 20,563 24,972 - 22,403
15 to 30 days - 4,969 1,643 27,775 116,657 - 51,243
31 days to 2 months - 6,311 1,339 40,036 78,497 - 9,974
over 2 months and upto 3 months - 6,690 1,720 40,659 106,781 - 5,335
over 3 months and upto 6 months - 14,721 9,716 85,692 198,107 - 25,242
over 6 months and upto 12 months - 22,547 22,959 148,120 246,286 - 64,173
over 1 year and upto 3 years - 18,616 136 141,058 667,553 - 35,543
over 3 years and upto 5 years - 3,559 6 74,848 497,708 9 48,404
over 5 years - 64,802 - 488,294 1,797,192 38,130 179,609
Total 63,579 245,000 209,084 1,304,476 3,812,415 38,139 469,311
1. intra-group adjustments are excluded 2. including money at call and short notice
Movement of NPAs (including NPIs) – Position as on 31 March, 2017(` in millions)
Particulars
A. Amount of NPAs (Gross) 212,805
- substandard 58,394
- Doubtful 1 54,569
- Doubtful 2 42,045
- Doubtful 3 4,716
- loss 53,081
B. Net NPAs 86,266
C. NPA Ratios
- Gross nPas (including nPis) to gross advances 5.42%
- net nPas (including nPis) to net advances 2.26%
D. Movement of NPAs (Gross)
- opening balance as on 1 april, 2016 60,875
- additions 217,818
- reductions (65,888)
- closing balance as on 31 March, 2017 212,805

Our custOmers. Our wOrld.
Axis Bank Limited262
Disclosures unDer Basel iii (conT.)
Movement of Specific & General Provision – Position as on 31 March, 2017
(` in millions)
Movement of Provisions Specific Provisions General Provisions
- opening balance as on 1 april, 2016 36,000 21,492
- Provision made in 2016-17(1)(2) 105,834 3,401
- Write-offs (18,301) -
- Write-back of excess provision (552) -
- closing balance as on 31 March, 2017 122,981 24,893
1. includes release of specific provision of `895 million on account of exchange rate fluctuation 2. includes impact of exchange rate fluctuation of `96 million in general provisions
Details of write-offs and recoveries that have been booked directly to the income statement – for the year ending 31 March, 2017
(` in millions)
Write-offs that have been booked directly to the income statement 2,731
recoveries that have been booked directly to the income statement 1,819
NPIs and Movement of Provision for Depreciation on Investments – Position as on 31 March, 2017
(` in millions)a. amount of non-Performing investments 12,348B. amount of Provision held for non-performing investments 9,609c. Movement of provision for depreciation on investments
- opening balance as on 1 april, 2016 2,226- Provision made in 2016-17 3,163- Write-offs/Write-back of excess provision (1,290)- closing balance as on 31 March, 2017 4,099
Breakup of NPA by major industries – Position as on 31 March, 2017
(` in millions)Particulars Gross NPA Specific Provisioniron and steel 41,044 13,425infrastructure (excluding Power) 29,262 16,394Professional services 16,871 12,631commercial real estate 10,941 7,610engineering 10,544 5,807Power Generation & Distribution 6,303 2,004Trade 6,043 2,330chemicals and chemical products 4,071 2,578Food Processing 3,634 1,583Banking and Finance 1,882 1,818Petroleum coal products and nuclear fuels 1,231 741other metal and metal products 796 775construction 773 439retail, agri & other industries 79,410 54,846Total 212,805 122,981
note: specific provisions include nPa and restructured provisions
General provision in Top 5 industries amounts to `5,487 million.
Annual Report 2016-17
Business oveRview
sTATuToRYRePoRTs
FinAnCiALsTATeMenTs
BAseL iii DisCLosuRes
263
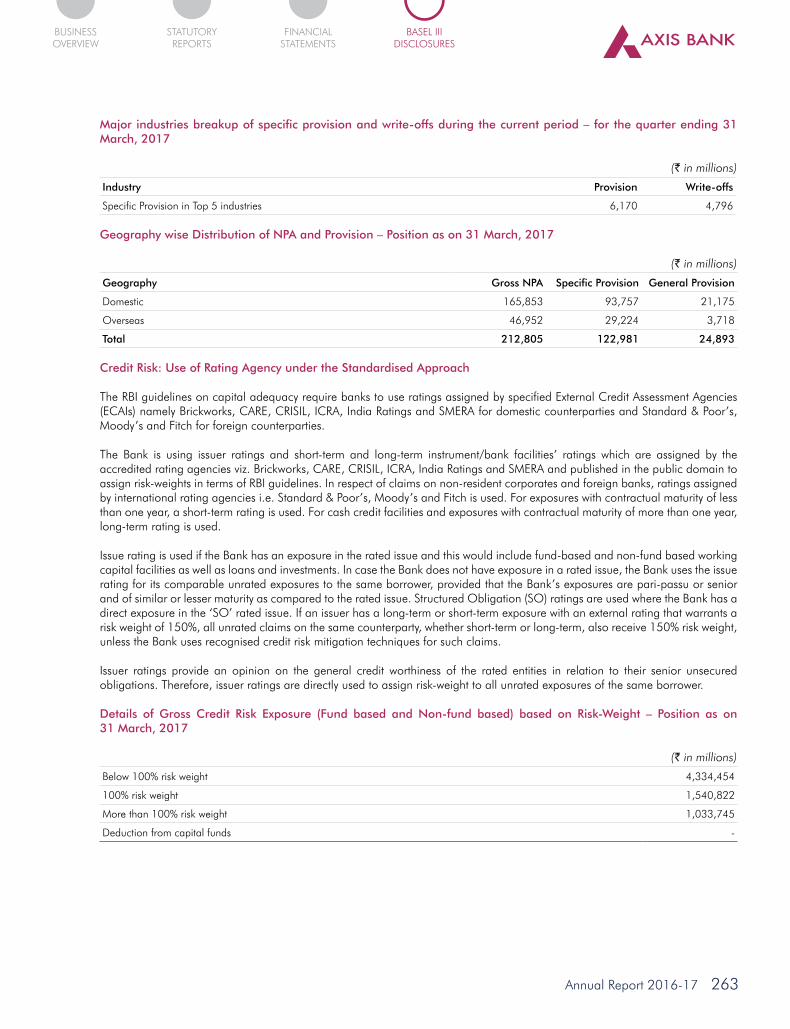
Major industries breakup of specific provision and write-offs during the current period – for the quarter ending 31 March, 2017
(` in millions)
Industry Provision Write-offs
specific Provision in Top 5 industries 6,170 4,796
Geography wise Distribution of NPA and Provision – Position as on 31 March, 2017
(` in millions)
Geography Gross NPA Specific Provision General Provision
Domestic 165,853 93,757 21,175
overseas 46,952 29,224 3,718
Total 212,805 122,981 24,893
Credit Risk: Use of Rating Agency under the Standardised Approach
The rBi guidelines on capital adequacy require banks to use ratings assigned by specified external credit assessment agencies (ecais) namely Brickworks, care, crisil, icra, india ratings and sMera for domestic counterparties and standard & Poor’s, Moody’s and Fitch for foreign counterparties.
The Bank is using issuer ratings and short-term and long-term instrument/bank facilities’ ratings which are assigned by the accredited rating agencies viz. Brickworks, care, crisil, icra, india ratings and sMera and published in the public domain to assign risk-weights in terms of rBi guidelines. in respect of claims on non-resident corporates and foreign banks, ratings assigned by international rating agencies i.e. standard & Poor’s, Moody’s and Fitch is used. For exposures with contractual maturity of less than one year, a short-term rating is used. For cash credit facilities and exposures with contractual maturity of more than one year, long-term rating is used.
issue rating is used if the Bank has an exposure in the rated issue and this would include fund-based and non-fund based working capital facilities as well as loans and investments. in case the Bank does not have exposure in a rated issue, the Bank uses the issue rating for its comparable unrated exposures to the same borrower, provided that the Bank’s exposures are pari-passu or senior and of similar or lesser maturity as compared to the rated issue. structured obligation (so) ratings are used where the Bank has a direct exposure in the ‘so’ rated issue. if an issuer has a long-term or short-term exposure with an external rating that warrants a risk weight of 150%, all unrated claims on the same counterparty, whether short-term or long-term, also receive 150% risk weight, unless the Bank uses recognised credit risk mitigation techniques for such claims.
issuer ratings provide an opinion on the general credit worthiness of the rated entities in relation to their senior unsecured obligations. Therefore, issuer ratings are directly used to assign risk-weight to all unrated exposures of the same borrower.
Details of Gross Credit Risk Exposure (Fund based and Non-fund based) based on Risk-Weight – Position as on 31 March, 2017
(` in millions)
Below 100% risk weight 4,334,454
100% risk weight 1,540,822
More than 100% risk weight 1,033,745
Deduction from capital funds -

Our custOmers. Our wOrld.
Axis Bank Limited264
Disclosures unDer Basel iii (conT.)
V. CREDIT RISK MITIGATION
The Bank uses various collaterals both financial as well as non-financial, guarantees and credit insurance as credit risk mitigants. The main financial collaterals include bank deposits, national savings certificate/Kisan Vikas Patra/life insurance Policy and gold, while main non-financial collaterals include land and building, plant and machinery, residential and commercial mortgages. The guarantees include guarantees given by corporate, bank and personal guarantees. This also includes loans and advances guaranteed by export credit & Guarantee corporation limited (ecGc), credit Guarantee Fund Trust for small industries (cGTsi), central Government and state Government.
The Bank has in place a collateral management policy, which underlines the eligibility requirements for credit risk Mitigants (crM) for capital computation as per Basel iii guidelines. The Bank reduces its credit exposure to counterparty with the value of eligible financial collateral to take account of the risk mitigating effect of the collateral. To account for the volatility in the value of collateral, haircut is applied based on the type, issuer, maturity, rating and re-margining/revaluation frequency of the collateral. The Bank revalues various financial collaterals at varied frequency depending on the type of collateral. The Bank has a valuation policy that covers processes for collateral valuation and empanelment of valuers.
Details of Total Credit Exposure (after on or off Balance Sheet Netting) as on 31 March, 2017
(` in millions)
Covered by:
- eligible financial collaterals after application of haircuts 227,342
- Guarantees/credit derivatives 165,970
VI. SECURITISATION The primary objectives for undertaking securitisation activity by the Bank are enhancing liquidity, optimisation of usage of capital
and churning of the assets as part of risk management strategy.
The securitisation of assets generally being undertaken by the Bank is on the basis of ‘True sale’, which provides 100% protection to the Bank from default. The Bank has not sponsored any special purpose vehicle which is required to be consolidated in the consolidated financial statements as per accounting norms.
The Bank may also invest in securitised instruments which offer attractive risk adjusted returns. The Bank enters into purchase/sale of corporate and retail loans through direct assignment/sPV. in most cases, post securitisation, the Bank continues to service the loans transferred to the assignee/sPV. The Bank, however, does not follow the originate to distribute model and pipeline and warehousing risk is not material to the Bank.
Valuation of securitised exposures is carried out in accordance with the Fixed income Money Market and Derivatives association (FiMMDa)/rBi guidelines. Gain on securitisation is recognised over the period of the underlying securities issued by the sPV. loss on securitisation is immediately debited to profit and loss account. The Bank also provides credit enhancement in the form of cash collaterals and/or by subordination of cash flows to senior pass through certificate holders. in respect of credit enhancements provided or recourse obligations (projected delinquencies, future servicing etc.) accepted by the Bank, appropriate provision/disclosure is made at the time of sale in accordance with as-29 ‘Provisions, contingent liabilities and contingent assets’.
The Bank follows the standardized approach prescribed by the rBi for the securitization activities. The Bank uses the ratings assigned by various external credit rating agencies viz. Brickworks, care, crisil, icra, india ratings and sMera for its securitisation exposures.
all transfers of assets under securitisation were effected on true sale basis. However, in the year ended 31 March, 2017, the Bank has not securitized any asset.

Annual Report 2016-17
Business oveRview
sTATuToRYRePoRTs
FinAnCiALsTATeMenTs
BAseL iii DisCLosuRes
265
A. Banking Book
Details of Exposure Securitised by the Bank and subject to Securitisation Framework
(` in millions)
Sr. No. Type of Securitisation
i Total amount of exposures securitised -
ii losses recognised by the Bank during the current period -
iii amount of assets intended to be securitised within a year -
of which
- amount of assets originated within a year before securitisation -
iv amount of exposures securitised
- corporate loans -
v unrecognised gain or losses on sale
- corporate loans -
Aggregate amount of Securitisation Exposures Retained or Purchased as on 31 March, 2017 is given below
(` in millions)
Sr. No. Type of Securitisation On Balance Sheet Off Balance Sheet
i retained - -
ii securities purchased - -
iii liquidity facility - -
iv credit enhancement (cash collateral) - -
v other commitments - -
Risk-weight wise Bucket Details of the Securitisation Exposures on the Basis of Book-Value
(` in millions)
Amount Capital charge
Below 100% risk weight - -
100% risk weight - -
More than 100% risk weight - -
Deductions
- entirely from Tier i capital - -
- credit enhancing i/os deducted from total capital - -
- credit enhancement (cash collateral) - -

Our custOmers. Our wOrld.
Axis Bank Limited266
Disclosures unDer Basel iii (conT.)
B. Trading Book
Details of Exposure Securitised by the Bank and subject to Securitisation Framework
(` in millions)
Sr. No. Type of Securitisation
i aggregate amount of exposures securitised by the Bank for which the Bank has retained some exposures and which is subject to the market risk approach
-
Aggregate amount of Securitisation Exposures Retained or Purchased as on 31 March, 2017 is given below
(` in millions)
Sr. No. Type of Securitisation On Balance Sheet*
Off Balance Sheet
i retained - -
ii securities purchased
- corporate loans - -
- lease rental 2,615 -
- Priority sector (auto pool & micro finance) 8,077 -
iii liquidity facility - -
iv credit enhancement (cash collateral) - -
v other commitments - -
* includes outstanding balance of PTcs purchased in earlier years also
Risk-weight wise Bucket Details of the Securitisation Exposures on the Basis of Book-Value
(` in millions)
Amount Capital charge
i exposures subject to comprehensive risk Measure for specific risk
- retained - -
- securities purchased - -
ii exposures subject to the securitisation framework for specific risk
Below 100% risk weight 10,692 343
100% risk weight - -
More than 100% risk weight - -
iii Deductions
- entirely from Tier i capital - -
- credit enhancing i/os deducted from Total capital - -
- credit enhancement (cash collateral) - -
VII. MARKET RISK IN TRADING BOOK Market risk is the risk of loss to the Bank’s earnings and capital due to changes in the market level of interest rates, price of
securities, foreign exchange rates and equities’ price, as well as the volatilities of those changes. The Bank is exposed to market risk through its investment activities and also trading activities, which are undertaken for customers as well as on a proprietary basis. The Bank adopts a comprehensive approach to market risk management for its trading, investment and asset/liability portfolios. For market risk management, the Bank has:
• Boardapprovedmarketriskpoliciesandguidelineswhicharealignedtotheregulatoryguidelinesandbasedonexperiencesgained over the years. The policies are reviewed periodically keeping in view regulatory changes, business requirements and market developments.

Annual Report 2016-17
Business oveRview
sTATuToRYRePoRTs
FinAnCiALsTATeMenTs
BAseL iii DisCLosuRes
267
• Processmanualwhichareupdatedregularlytoincorporateanddocumentthebestpractices.
• MarketriskidentificationthroughelaboratemappingoftheBank’smainbusinessestovariousmarketrisks.
• StatisticalmeasureslikeValueatRisk(VaR),supplementedbystresstests,backtestsandscenarioanalysis.
• Non-statisticalmeasures like position limits,marked-to-market (MTM), gaps and sensitivities (mark-to-market, positionlimits, duration, PVBP, option Greeks).
• ManagementInformationSystem(MIS)fortimelymarketriskreportingtoseniormanagementfunctionaries.Keyriskmetricsare presented to the risk Management committee of the Board through risk Dash-Boards.
risk limits such as position limits, stop-loss limits, alarm limits, gaps and sensitivities (duration, PVBP, option Greeks) are set up and reviewed periodically, based on a number of criteria including regulatory guidelines, relevant market analysis, business strategy, size of the investment and trading portfolio, management experience and the Bank’s risk appetite. These limits are monitored on an intra-day/daily basis by the Treasury Mid-office and the exceptions are put up to alco and risk Management committee of the Board.
The Bank uses Historical simulation and its variants for computing Var for its trading portfolio. Var is calculated and reported on a daily basis for the trading portfolios at a 99% confidence level for a one-day holding period, using 250 days of historical data or one year of relative changes in historical rates and prices. The model assumes that the risk factor changes observed in the past are a good estimate of those likely to occur in the future and is, therefore, limited by the relevance of the historical data used. The method, however, does not make any assumption about the nature or type of the loss distribution. The Var models for different portfolios are back-tested at regular intervals and the results are used to maintain and improve the efficacy of the model.
The Var measure is supplemented by a series of stress tests and sensitivity analysis that estimates the likely behaviour of a portfolio under extreme but plausible conditions and its impact on earnings and capital. The Bank undertakes stress tests for market risks for its trading book, irs, forex open position and forex gaps on a monthly basis as well as for liquidity risk at the end of each quarter. The Bank has built its capabilities to migrate to advanced approach i.e. internal Models approach for assessment of market risk capital.
Concentration Risk
The Bank has allocated the internal risk limits in order to avoid concentrations, wherever relevant. For example, the aggregate Gap limit, net open Position and daylight limits are allocated to various currencies and maturities into individual Gap limits to monitor concentrations. similarly, stop-loss limits and duration limits have been set up for different categories within a portfolio. Within the overall PV01 limit, a sub-limit is set up which is not expected to be breached by trades linked to any individual benchmark. some of the limits like currency wise net open position, stop loss limits and PV01 limits are allocated dealer-wise also, based on their skill and experience, to avoid build up of positions in a single dealer’s book.
Liquidity Risk
liquidity risk is the current and prospective risk to earnings or capital arising from a Bank’s inability to meet its current or future obligations on the due date. liquidity risk is two-dimensional viz., risk of being unable to fund portfolio of assets at appropriate maturity and rates (liability dimension) and the risk of being unable to liquidate an asset in a timely manner at a reasonable price (asset dimension).
The goal of liquidity risk Management is to meet all commitments on the due date and also be able to fund new investment opportunities by raising sufficient funds in the form of increasing fresh liabilities or by expeditious asset sell-off without incurring unacceptable losses, both under normal and adverse conditions. These objectives are ensured by setting up policies, operational level committees, measurement tools and monitoring and reporting mechanism using effective use of iT systems for availability of quality data.
The Bank manages its liquidity on a static as well as dynamic basis using various tools such as gap analysis, ratio analysis, dynamic liquidity statements, intraday liquidity monitoring tools and scenario analysis. The Bank’s alM policy defines the tolerance limits for its structural liquidity position. The liquidity Policy for the domestic operations as well as for the overseas branches lay down the operational framework for prudent risk management in the Bank. The liquidity profile of the Bank is analysed on a static basis by tracking all cash inflows and outflows in the maturity ladder based on the actual maturity and expected occurrence (for non-

Our custOmers. Our wOrld.
Axis Bank Limited268
Disclosures unDer Basel iii (conT.)
maturity items) of cash flows. The liquidity profile of the Bank is also estimated on a dynamic basis by considering the growth in deposits and loans, investment obligations, etc. for a short-term period of three months. The Bank undertakes behavioral analysis of the non-maturity products viz. savings and current deposits and cash credit/overdraft accounts on a periodic basis, to ascertain the volatility of residual balances in those accounts. The renewal pattern and premature withdrawals of term deposits and drawdown of unavailed credit limits are also captured through behavioral studies. The concentration of large deposits is monitored on a periodic basis.
The Bank’s ability to meet its obligations and fund itself in a crisis scenario is critical and accordingly, liquidity stress tests are conducted under different scenarios at periodical intervals to assess the impact on liquidity to withstand stressed conditions. The liquidity positions of overseas branches are managed in line with the Bank’s internal policies and host country regulations. such positions are also reviewed centrally by the Bank’s alco along with domestic positions.
The Bank has adopted the Basel iii framework on liquidity standards as prescribed by rBi and has put in place requisite systems and processes to enable periodical computation and reporting of the liquidity coverage ratio (lcr).
Counterparty Risk
The Bank has a counterparty risk Management Policy incorporating well laid-down guidelines, processes and measures for counterparty risk management. The policy includes separate counterparty rating models for commercial banks, foreign banks and co-operative banks for determining maximum permissible exposure limits for counterparties. The key financials, quality of management and the level of corporate governance are captured in the counterparty rating model. counterparty limits are monitored and reported daily and internal triggers have been put in place to guard against breach in limits. credit exposures to issuer of bonds, advances etc. are monitored separately under the prudential norms for exposure to a single borrower as per the Bank’s corporate credit risk Policy or investment Policy, as applicable. The counterparty exposure limits are reviewed at periodic intervals based on the financials of the counterparties, business need, past transaction experiences and market conditions. The Bank has also put in place the ‘Derivatives and suitability & appropriateness Policy’ and loan equivalent risk (ler) Policy to evaluate counterparty risk arising, out of all customer derivatives contracts.
Country Risk
The Bank has a country risk management policy containing the guidelines, systems and processes to effectively identify, assess, monitor and control its country risk exposures. Based on the risk profiling, countries are classified under seven categories i.e. insignificant, low, moderate, high, very high, restricted and off-credit. risk profiling is based on the ratings provided by export credit Guarantee corporation of india ltd. (ecGc), Dun & Bradstreet, standard & Poor’s Banking industry country risk assessment (Bicra), inputs received from overseas branches/business departments, reports published by various agencies viz. Moody’s, standard & Poor’s, Fitch and other publications of repute. The categorisation of countries is reviewed at quarterly intervals or at more frequent intervals if situations so warrant. an exposure to a country comprises all assets, both funded and non-funded, that represents claims on residents of another country. The Bank has in place both category wise and country wise exposure limits. The Bank monitors country risk exposures through a process of trigger limits as well as prior approval system for select categories viz. high, very high, restricted and off-credit to ensure effective monitoring and management of exposures. as a proactive measure of country risk management, risk department issues ‘rating Watch’ from time to time. Further, based on country-specific developments, the concerned business departments are provided updates on countries which have high probability of a rating downgrade.
Risk Management Framework for Overseas Operations
The Bank has put in place separate risk management policies for each of its overseas branches in singapore, Hong Kong, Dubai, colombo and shanghai. These country-specific risk policies are based on the host country regulators’ guidelines and in line with the practices followed for the indian operations. The asset liability Management and all the risk exposures for the overseas operations are monitored centrally at the central office.

Annual Report 2016-17
Business oveRview
sTATuToRYRePoRTs
FinAnCiALsTATeMenTs
BAseL iii DisCLosuRes
269
Capital Requirement for Market Risk – Position as on 31 March, 2017
(` in millions)
Type Amount of Capital Required
interest rate risk 24,722
Foreign exchange risk (including gold) 311
equity position risk 6,558
VIII. OPERATIONAL RISK
Strategies and Processes
operational risk (or) is the risk of loss resulting from inadequate or failed internal processes, people or systems, or from external events. The operational risk management policy documents the Bank’s approach towards management of operational risk and defines the roles and responsibilities of the various stakeholders within the Bank. The Bank also has a detailed framework for operational risk loss data collection, risk and control self-assessment and key risk indicators.
Based on the above policy the Bank has initiated several measures to manage operational risk. The Bank has put in place a hierarchical structure to effectively manage operational risk through the formation of several internal committees viz. operational risk Management committee, Product Management committee, change Management committee, central outsourcing committee, Business continuity Planning Management committee (BcPMc) and iT security committee.
Structure and Organisation
The risk Management committee (rMc) of the Board at the apex level is the policy making body. The rMc is supported by the operational risk Management committee (orMc), consisting of senior Management personnel, which is responsible for implementation of the operational risk policies of the Bank. This internal committee oversees the implementation of the or framework and oversees the management of operational risks across the Bank. a dedicated operational risk management unit ensures management of operational risk. a representative of the risk Department is also a permanent member of control committees on product management covering approval of new products, change management of processes, outsourcing, business continuity management and iT security.
Scope and Nature of Operational Risk Reporting and Measurement Systems
a systematic process for reporting risks, losses and non-compliance issues relating to operational risks has been developed and implemented. The information gathered is being used to develop triggers to initiate corrective actions to improve controls. critical risks and major loss events are reported to the senior Management/orMc.
The Bank has further enhanced its capability for effective management of operational risk with the implementation of an enterprise Governance risk and compliance platform (sas-eGrc).The iT platform acts as the single repository of processes and operational, compliance and financial reporting risks. it facilitates capturing of individual risks and the effectiveness of their controls, tagging of identified risks to processes and products, originates action plans and acts as a repository of all operational risk events.
Policies for Hedging and Mitigating Operational risk
an operational risk Management Policy approved by the risk Management committee of the Board details the framework for managing and monitoring operational risk in the Bank. Business units put in place basic internal controls as approved by the Product Management committee to ensure appropriate controls in the operating environment throughout the Bank. as per the policy, all new products are being vetted by the Product Management committee to identify and assess potential operational risks involved and suggest control measures to mitigate the risks. each new product or service introduced is subject to a risk review and sign-off process. similarly, any changes to the existing products/processes are being vetted by the change Management committee.
Key risk indicators (Kris) have been developed for various Business units of the Bank for effective monitoring of key operational risks. Kris for the branches has also been launched as a new initiative to help branches to manage operational risk better.
Our custOmers. Our wOrld.
Axis Bank Limited270
Disclosures unDer Basel iii (conT.)
The Bank has adopted BcP and iT Disaster recovery Policy wherein critical activities and system applications have been defined, recovery plan is in place for these critical activities and system applications to ensure timely recovery of the Bank’s critical products and services in the event of an emergency.
regular tests have been carried out to ascertain BcP preparedness. The test reports are shared with senior management on a regular frequency. Business continuity Planning Management committee (BcPMc) has been formed comprising of senior functionaries of the Bank, which monitors BcM framework implementation in the Bank.
Approach for Operational Risk Capital Assessment
as per rBi guidelines, the Bank has followed the Basic indicator approach for computing the capital for operational risk for the year ending 31 March, 2017.
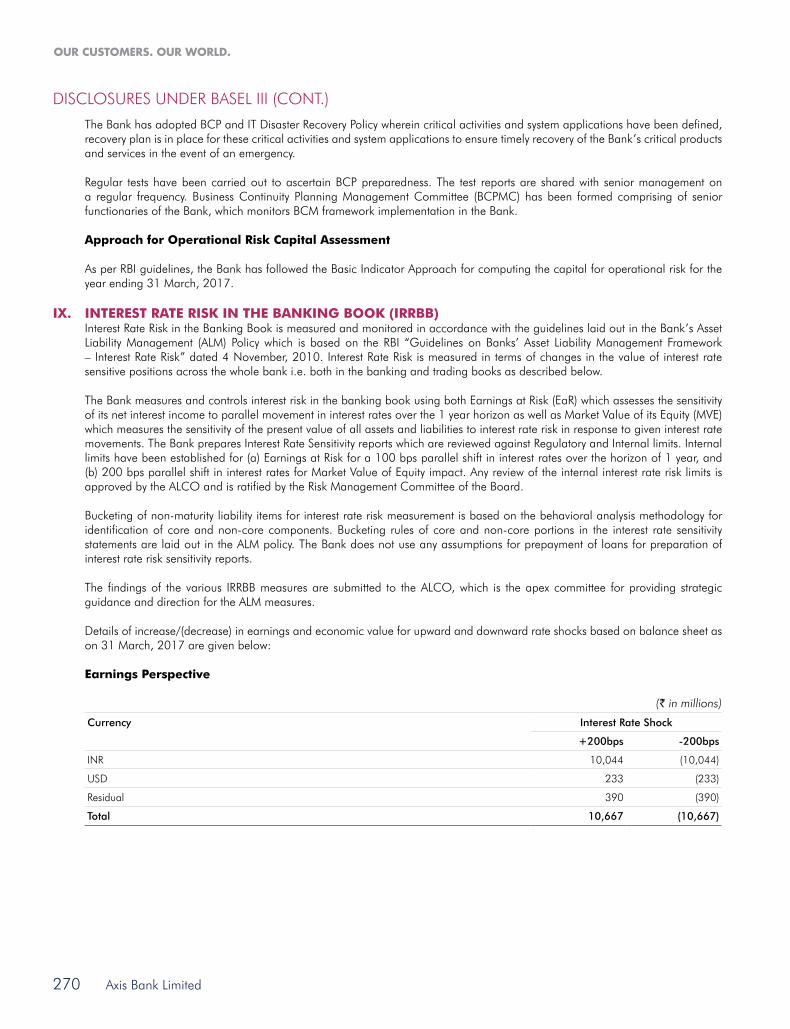
IX. INTEREST RATE RISK IN THE BANKING BOOK (IRRBB) interest rate risk in the Banking Book is measured and monitored in accordance with the guidelines laid out in the Bank’s asset
liability Management (alM) Policy which is based on the rBi “Guidelines on Banks’ asset liability Management Framework – interest rate risk” dated 4 november, 2010. interest rate risk is measured in terms of changes in the value of interest rate sensitive positions across the whole bank i.e. both in the banking and trading books as described below.
The Bank measures and controls interest risk in the banking book using both earnings at risk (ear) which assesses the sensitivity of its net interest income to parallel movement in interest rates over the 1 year horizon as well as Market Value of its equity (MVe) which measures the sensitivity of the present value of all assets and liabilities to interest rate risk in response to given interest rate movements. The Bank prepares interest rate sensitivity reports which are reviewed against regulatory and internal limits. internal limits have been established for (a) earnings at risk for a 100 bps parallel shift in interest rates over the horizon of 1 year, and (b) 200 bps parallel shift in interest rates for Market Value of equity impact. any review of the internal interest rate risk limits is approved by the alco and is ratified by the risk Management committee of the Board.
Bucketing of non-maturity liability items for interest rate risk measurement is based on the behavioral analysis methodology for identification of core and non-core components. Bucketing rules of core and non-core portions in the interest rate sensitivity statements are laid out in the alM policy. The Bank does not use any assumptions for prepayment of loans for preparation of interest rate risk sensitivity reports.
The findings of the various irrBB measures are submitted to the alco, which is the apex committee for providing strategic guidance and direction for the alM measures.
Details of increase/(decrease) in earnings and economic value for upward and downward rate shocks based on balance sheet as on 31 March, 2017 are given below:
Earnings Perspective
(` in millions)
Currency Interest Rate Shock
+200bps -200bps
inr 10,044 (10,044)
usD 233 (233)
residual 390 (390)
Total 10,667 (10,667)

Annual Report 2016-17
Business oveRview
sTATuToRYRePoRTs
FinAnCiALsTATeMenTs
BAseL iii DisCLosuRes
271
Economic Value Perspective
(` in millions)
Currency Interest Rate Shock
+200bps -200bps
inr (31,782) 31,782
usD 305 (305)
residual 1,690 (1,690)
Total (29,787) 29,787
note: interest rate risk in Banking Book is computed only for banks/bank like entities where the inherent business is maturity transformation of assets and liabilities, thereby resulting in interest rate mismatch. other subsidiaries whose core business is not banking activity, irrBB need not be computed.
X. EXPOSURES RELATED TO COUNTERPARTY CREDIT RISK counterparty credit limits and exposures are monitored daily and internal triggers are put in place to guard against breach in
limits. credit exposures to issuer of bonds, advances etc. are monitored separately under the prudential norms for exposure to a single borrower as per the Bank’s corporate credit risk Policy or investment Policy, as applicable. The counterparty exposure limits are reviewed at periodic intervals.
Methodology used to assign economic capital and credit limits for counterparty credit exposures
The Bank currently does not assign economic capital for its counterparty credit exposures. The Bank has adopted a methodology of computing economic capital within the framework of individual capital adequacy assessment Process (icaaP) and assesses the economic capital requirement within this framework. The Bank is adequately capitalized in terms of projected growth for the next three years and has sufficient capital buffer to account for Pillar ii risks.
Policies for securing collateral and establishing credit reserves
The Bank has a policy framework through its credit risk Management policy and collateral Management Policy which stipulates the eligible credit risk mitigants and management thereof. The Bank has adopted the comprehensive approach as suggested by rBi, which allows fuller offset of collateral against exposures, by effectively reducing the exposure amount by the value ascribed to the collateral. under this approach, the Bank takes eligible financial collateral on an account-by-account basis, to reduce the credit exposure to counterparty while calculating the capital requirements to take account of the risk mitigating effect of the collateral. The Bank also has a well-defined nPa management & recovery policy for establishing credit reserves on a prudential basis apart from being in consonance with the regulatory guidelines.
Policies with respect to wrong-way risk exposures
Wrong way risk associated with counterparty credit exposures can be of two types – General i.e. when the PD of counterparties is positively correlated with general market risk factors and specific i.e. when the exposure to a particular counterparty and the PD of the counterparty providing credit risk mitigation for the exposure are highly correlated. The Bank currently does not have a complete policy framework to address the wrong way risk. in the interim, the general wrong way risk is taken care of through monitoring of concentration of counterparty credit exposures on account of derivatives. also as per the credit risk management policy, collaterals whose values have a material positive correlation with the credit quality of the borrower is likely to provide little or no credit protection during stress, are not recognized for credit enhancement, thus mitigating any specific wrong way risk.
Impact of the amount of collateral the Bank would have to provide given a credit rating downgrade
The Bank currently assesses the liquidity impact and related costs of a possible downgrade as part of the bank-wide stress testing exercise. The Bank has already adopted credit Value adjustment (cVa) based on the regulatory guidelines on the asset side for capital computation purposes. The current regulatory guidelines do not require estimation of changes in collateral requirement in case of a likely rating downgrade of a Bank and the Bank also does not make such an assessment currently. However, the Bank is in the process of developing an internal methodology to estimate the changes in liabilities to counterparties in the event of its rating downgrade.
Our custOmers. Our wOrld.
Axis Bank Limited272
Disclosures unDer Basel iii (conT.)
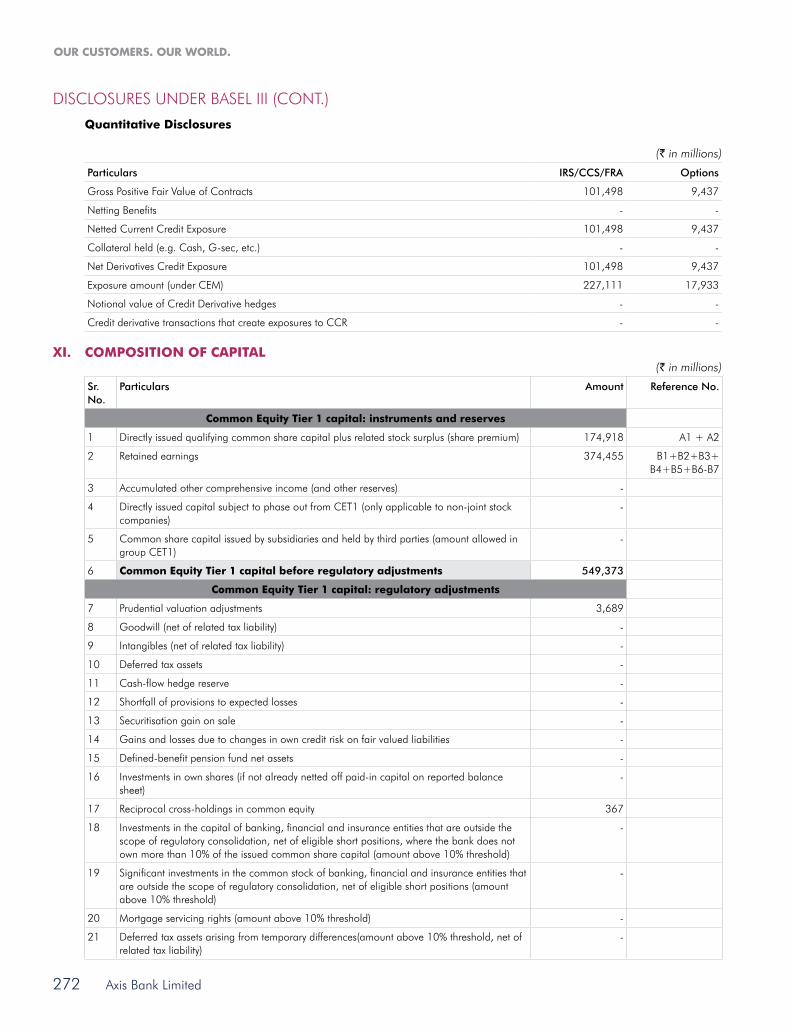
Quantitative Disclosures
(` in millions)
Particulars IRS/CCS/FRA Options
Gross Positive Fair Value of contracts 101,498 9,437
netting Benefits - -
netted current credit exposure 101,498 9,437
collateral held (e.g. cash, G-sec, etc.) - -
net Derivatives credit exposure 101,498 9,437
exposure amount (under ceM) 227,111 17,933
notional value of credit Derivative hedges - -
credit derivative transactions that create exposures to ccr - -
XI. COMPOSITION OF CAPITAL(` in millions)
Sr.No.
Particulars Amount Reference No.
Common Equity Tier 1 capital: instruments and reserves
1 Directly issued qualifying common share capital plus related stock surplus (share premium) 174,918 a1 + a2
2 retained earnings 374,455 B1+B2+B3+ B4+B5+B6-B7
3 accumulated other comprehensive income (and other reserves) -
4 Directly issued capital subject to phase out from ceT1 (only applicable to non-joint stock companies)
-
5 common share capital issued by subsidiaries and held by third parties (amount allowed in group ceT1)
-
6 Common Equity Tier 1 capital before regulatory adjustments 549,373
Common Equity Tier 1 capital: regulatory adjustments
7 Prudential valuation adjustments 3,689
8 Goodwill (net of related tax liability) -
9 intangibles (net of related tax liability) -
10 Deferred tax assets -
11 cash-flow hedge reserve -
12 shortfall of provisions to expected losses -
13 securitisation gain on sale -
14 Gains and losses due to changes in own credit risk on fair valued liabilities -
15 Defined-benefit pension fund net assets -
16 investments in own shares (if not already netted off paid-in capital on reported balance sheet)
-
17 reciprocal cross-holdings in common equity 367
18 investments in the capital of banking, financial and insurance entities that are outside the scope of regulatory consolidation, net of eligible short positions, where the bank does not own more than 10% of the issued common share capital (amount above 10% threshold)
-
19 significant investments in the common stock of banking, financial and insurance entities that are outside the scope of regulatory consolidation, net of eligible short positions (amount above 10% threshold)
-
20 Mortgage servicing rights (amount above 10% threshold) -
21 Deferred tax assets arising from temporary differences(amount above 10% threshold, net of related tax liability)
-
Annual Report 2016-17
Business oveRview
sTATuToRYRePoRTs
FinAnCiALsTATeMenTs
BAseL iii DisCLosuRes
273
Sr.No.
Particulars Amount Reference No.
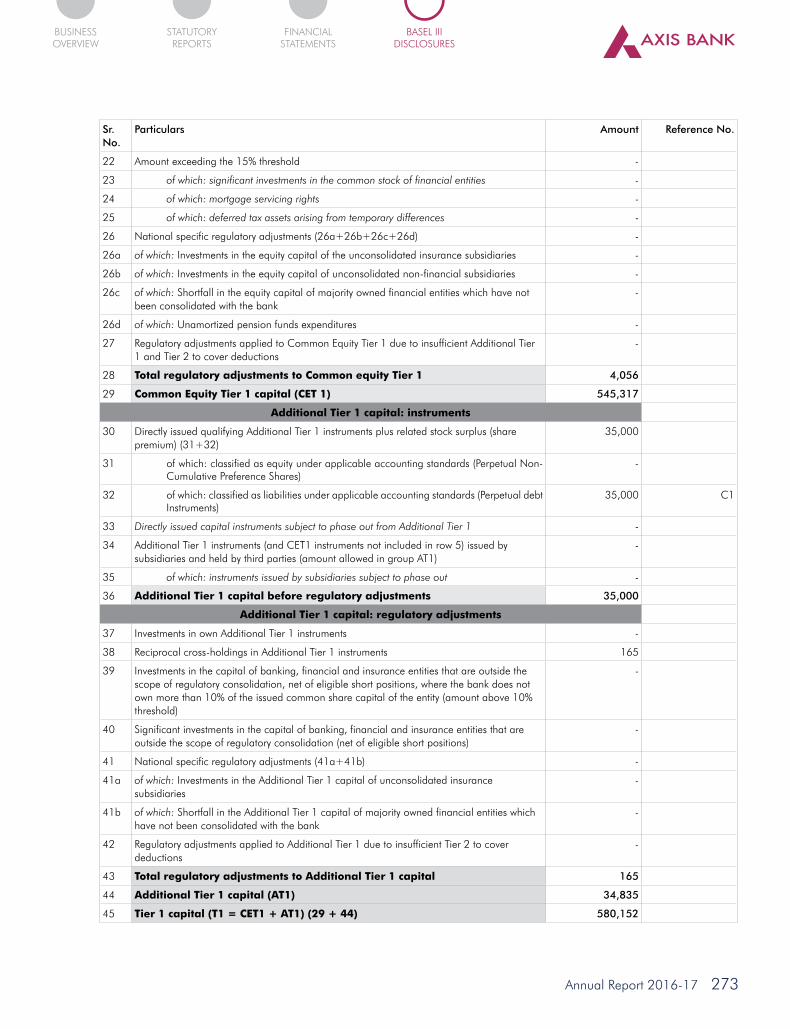
22 amount exceeding the 15% threshold -
23 of which: significant investments in the common stock of financial entities -
24 of which: mortgage servicing rights -
25 of which: deferred tax assets arising from temporary differences -
26 national specific regulatory adjustments (26a+26b+26c+26d) -
26a of which: investments in the equity capital of the unconsolidated insurance subsidiaries -
26b of which: investments in the equity capital of unconsolidated non-financial subsidiaries -
26c of which: shortfall in the equity capital of majority owned financial entities which have not been consolidated with the bank
-
26d of which: unamortized pension funds expenditures -
27 regulatory adjustments applied to common equity Tier 1 due to insufficient additional Tier 1 and Tier 2 to cover deductions
-
28 Total regulatory adjustments to Common equity Tier 1 4,056
29 Common Equity Tier 1 capital (CET 1) 545,317
Additional Tier 1 capital: instruments
30 Directly issued qualifying additional Tier 1 instruments plus related stock surplus (share premium) (31+32)
35,000
31 of which: classified as equity under applicable accounting standards (Perpetual non-cumulative Preference shares)
-
32 of which: classified as liabilities under applicable accounting standards (Perpetual debt instruments)
35,000 c1
33 Directly issued capital instruments subject to phase out from Additional Tier 1 -
34 additional Tier 1 instruments (and ceT1 instruments not included in row 5) issued by subsidiaries and held by third parties (amount allowed in group aT1)
-
35 of which: instruments issued by subsidiaries subject to phase out -
36 Additional Tier 1 capital before regulatory adjustments 35,000
Additional Tier 1 capital: regulatory adjustments
37 investments in own additional Tier 1 instruments -
38 reciprocal cross-holdings in additional Tier 1 instruments 165
39 investments in the capital of banking, financial and insurance entities that are outside the scope of regulatory consolidation, net of eligible short positions, where the bank does not own more than 10% of the issued common share capital of the entity (amount above 10% threshold)
-
40 significant investments in the capital of banking, financial and insurance entities that are outside the scope of regulatory consolidation (net of eligible short positions)
-
41 national specific regulatory adjustments (41a+41b) -
41a of which: investments in the additional Tier 1 capital of unconsolidated insurance subsidiaries
-
41b of which: shortfall in the additional Tier 1 capital of majority owned financial entities which have not been consolidated with the bank
-
42 regulatory adjustments applied to additional Tier 1 due to insufficient Tier 2 to cover deductions
-
43 Total regulatory adjustments to Additional Tier 1 capital 165
44 Additional Tier 1 capital (AT1) 34,835
45 Tier 1 capital (T1 = CET1 + AT1) (29 + 44) 580,152

Our custOmers. Our wOrld.
Axis Bank Limited274
Disclosures unDer Basel iii (conT.)
Sr.No.
Particulars Amount Reference No.
Tier 2 capital: instruments and provisions
46 Directly issued qualifying Tier 2 instruments plus related stock surplus 65,800 c2
47 Directly issued capital instruments subject to phase out from Tier 2 57,860 c2
48 Tier 2 instruments (and ceT1 and aT1 instruments not included in rows 5 or 34) issued by subsidiaries and held by third parties (amount allowed in group Tier 2)
-
49 of which: instruments issued by subsidiaries subject to phase out -
50 Provisions 24,926 D1+D2+D3+D4
51 Tier 2 capital before regulatory adjustments 148,586
Tier 2 capital: regulatory adjustments
52 investments in own Tier 2 instruments -
53 reciprocal cross-holdings in Tier 2 instruments 1,013
54 investments in the capital of banking, financial and insurance entities that are outside the scope of regulatory consolidation, net of eligible short positions, where the bank does not own more than 10% of the issued common share capital of the entity (amount above the 10% threshold)
-
55 significant investments in the capital banking, financial and insurance entities that are outside the scope of regulatory consolidation (net of eligible short positions)
-
56 national specific regulatory adjustments (56a+56b) -
56a of which: investments in the Tier 2 capital of unconsolidated subsidiaries -
56b of which: shortfall in the Tier 2 capital of majority owned financial entities which have not been consolidated with the bank
-
57 Total regulatory adjustments to Tier 2 capital 1,013
58 Tier 2 capital (T2) 147,573
59 Total capital (TC = T1 + T2) (45 + 58) 727,725
60 Total risk weighted assets (60a + 60b + 60c) 4,847,808
60a of which: total credit risk weighted assets 4,064,922
60b of which: total market risk weighted assets 351,007
60c of which: total operational risk weighted assets 431,879
Capital ratios and buffers
61 common equity Tier 1 (as a percentage of risk weighted assets) 11.25%
62 Tier 1 (as a percentage of risk weighted assets) 11.97%
63 Total capital (as a percentage of risk weighted assets) 15.01%
64 institution specific buffer requirement (minimum ceT1 requirement plus capital conservation and countercyclical buffer requirements, expressed as a percentage of risk weighted assets)
6.75%
65 of which: capital conservation buffer requirement 1.25%
66 of which: bank specific countercyclical buffer requirement -
67 of which: G-SIB buffer requirement -
68 common equity Tier 1 available to meet buffers (as a percentage of risk weighted assets) -
National minima (if different from Basel III)
69 national common equity Tier 1 minimum ratio (if different from Basel iii minimum) 5.50%
70 national Tier 1 minimum ratio (if different from Basel iii minimum) 7.00%
71 national total capital minimum ratio (if different from Basel iii minimum) 9.00%

Annual Report 2016-17
Business oveRview
sTATuToRYRePoRTs
FinAnCiALsTATeMenTs
BAseL iii DisCLosuRes
275
Sr.No.
Particulars Amount Reference No.
Amounts below the thresholds for deduction (before risk weighting)
72 non-significant investments in the capital of other financial entities 41,906
73 significant investments in the common stock of financial entities -
74 Mortgage servicing rights (net of related tax liability) na
75 Deferred tax assets arising from temporary differences (net of related tax liability) 50,730
Applicable caps on the inclusion of provisions in Tier 2
76 Provisions eligible for inclusion in Tier 2 in respect of exposures subject to standardised approach (prior to application of cap)
24,926
77 cap on inclusion of provisions in Tier 2 under standardised approach 50,812
78 Provisions eligible for inclusion in Tier 2 in respect of exposures subject to internal ratings-based approach (prior to application of cap)
na
79 cap for inclusion of provisions in Tier 2 under internal ratings-based approach na
Capital instruments subject to phase-out arrangement(only applicable between 31 March, 2017 and 31 March, 2022)
80 current cap on ceT1 instruments subject to phase out arrangements -
81 amount excluded from ceT1 due to cap (excess over cap after redemptions and maturities) -
82 current cap on aT1 instruments subject to phase out arrangements -
83 amount excluded from aT1 due to cap (excess over cap after redemptions and maturities) -
84 current cap on T2 instruments subject to phase out arrangements -
85 amount excluded from T2 due to cap (excess over cap after redemptions and maturities) -
* na – not applicable
Notes to the Template
Row No. of the template
Particular (` in millions)
10 Deferred tax assets associated with accumulated losses -
Deferred tax assets (excluding those associated with accumulated losses) net of Deferred tax liability -
Total as indicated in row 10 -
19 if investments in insurance subsidiaries are not deducted fully from capital and instead considered under 10% threshold for deduction, the resultant increase in the capital of the bank
-
of which: increase in common equity Tier 1 capital -
of which: increase in additional Tier 1 capital -
of which: increase in Tier 2 capital -
26b if investments in the equity capital of unconsolidated non-financial subsidiaries are not deducted and hence, risk weighted then:
-
(i) increase in common equity Tier 1 capital -
(ii) increase in risk weighted assets -
50 eligible Provisions included in Tier 2 capital 24,926
eligible revaluation reserves included in Tier 2 capital -
Total of row 50 24,926

Our custOmers. Our wOrld.
Axis Bank Limited276
Disclosures unDer Basel iii (conT.)
XII. THE RECONCILIATION OF REGULATORY CAPITAL ITEMS AS ON 31 MARCH, 2017 IS GIVEN BELOW:
Step 1 (` in millions)
Sr. No.
Particulars Balance sheet as in financial statements
Balance sheet under regulatory scope of
consolidation
A Capital and Liabilities
i Paid-up capital 4,790 4,790
reserves & surplus 559,013 559,013
Minority interest 613 613
Total capital 564,416 564,416
ii Deposits 4,149,827 4,149,827
of which: Deposits from banks 160,165 160,165
of which: customer deposits 3,989,662 3,989,662
iii Borrowings 1,124,548 1,124,548
i. Borrowings in india 552,930 552,930
(a) From rBi - -
(b) From banks 39,286 39,286
(c) From other institutions & agencies 513,644 513,644
ii. Borrowings outside india 571,618 571,618
of which: capital instruments 200,941 200,941
iV other liabilities & provisions 275,829 275,829
Total 6,114,620 6,114,620
B Assets
i cash and balances with reserve Bank of india 308,580 308,580
Balance with banks and money at call and short notice 201,082 201,082
ii investments 1,290,183 1,290,183
of which:
Government securities 932,321 932,321
shares 13,262 13,262
Debentures & Bonds 267,103 267,103
subsidiaries / Joint Ventures / associates - -
others (commercial Papers, Mutual Funds etc.) 77,497 77,497
iii loans and advances 3,810,803 3,810,803
iV Fixed assets 38,102 38,102
V other assets 465,870 465,870
of which:
Goodwill and intangible assets - -
Deferred tax assets (net) 50,730 50,730
Vi Goodwill on consolidation - -
Vii Debit balance in Profit & loss account - -
Total 6,114,620 6,114,620

Annual Report 2016-17
Business oveRview
sTATuToRYRePoRTs
FinAnCiALsTATeMenTs
BAseL iii DisCLosuRes
277
Step 2 (` in millions)
Sr. No.
Particulars Balance sheet as in financial
statements
Balance sheet under regulatory
scope of consolidation
Reference No.
A Capital and Liabilities
I Paid-up Capital 4,790 4,790 A1
Reserves & Surplus 559,013 559,013 -
of which:
statutory reserve 115,071 115,071 B1
share Premium 170,128 170,128 a2
investment reserve account - - D1
General reserve 3,864 3,864 B2
capital reserve 18,655 18,655 B3
Foreign currency Translation reserve 1,564 1,564
of which: considered under capital funds - 1,173 B4
reserve Fund 916 916 B5
Balance in Profit/loss a/c 248,815 248,815 B6
of which: Proposed dividend - 14,039 B7
Minority Interest 613 613 -
of which: amount eligible for ceT i - - -
Total Capital 564,416 564,416 -
II Deposits 4,149,827 4,149,827 -
of which:
Deposits from banks 160,165 160,165 -
customer deposits 3,989,662 3,989,662 -
III Borrowings 1,124,548 1,124,548 -
i. Borrowings in india 552,930 552,930 -
(a) From rBi - - -
(b) From banks 39,286 39,286 -
(c) From other institutions & agencies 513,644 513,644 -
ii. Borrowings outside india 571,618 571,618 -
of which: capital instruments 200,941 200,941
of which:
(a) eligible aT1 capital - 35,000 c1
(b) eligible Tier 2 capital - 123,660 c2
IV Other liabilities & provisions 275,829 275,829 -
of which:
Provision for standard advances 23,679 23,679 D2
Provision for unhedged Foreign currency exposure 1,214 1,214 D3
Total 6,114,620 6,114,620
B Assets
I cash and balances with reserve Bank of india 308,580 308,580 -
Balance with banks and money at call and short notice 201,082 201,082 -

Our custOmers. Our wOrld.
Axis Bank Limited278
Disclosures unDer Basel iii (conT.)
Sr. No.
Particulars Balance sheet as in financial
statements
Balance sheet under regulatory
scope of consolidation
Reference No.
II Investments 1,290,183 1,290,183 -
of which:
Government securities 932,321 932,321 -
shares 13,262 13,262 -
Debentures & Bonds 267,103 267,103 -
subsidiaries / Joint Ventures / associates - - -
others (commercial Papers, Mutual Funds etc.) 77,497 77,497 -
III Loans and advances 3,810,803 3,810,803 -
floating provision adjusted in loans & advances 33 33 D4
IV Fixed assets 38,102 38,102 -
V Other assets 465,870 465,870 -
of which:
Goodwill and intangible assets - - -
Deferred tax assets (net) 50,730 50,730
VI Goodwill on consolidation - - -
VII Debit balance in Profit & Loss account - - -
Total 6,114,620 6,114,620 -
DF XIII, XIV & XVDisclosures pertaining to main features of equity and debt instruments, terms and conditions of equity and debt instruments and remuneration of Key Management Personnel have been disclosed separately on the Bank’s website under the ‘regulatory Disclosure section’. The link to this section is as follows:
https://www.axisbank.com/shareholders-corner/regulatory-disclosure/basel-iii-disclosures
XVI. EQUITIES – DISCLOSURE FOR BANKING BOOK POSITIONS The risk oversight relating to the equity portfolio is part of the overall independent risk management structure of the Bank and is
subjected to the risk management processes and policies approved by the Bank.
in accordance with the rBi guidelines, investments are classified at the time of purchase as:
• HeldforTrading(‘HFT’);
• AvailableforSale(‘AFS’);and
• HeldtoMaturity(‘HTM’).
investments that are held principally for sale within a short period are classified as HFT securities. as per the rBi guidelines, HFT securities, which remain unsold for a period of 90 days are reclassified as aFs securities.
investments that the Bank intends to hold till maturity are classified under the HTM category. investments in the equity of subsidiaries/joint ventures are categorized as HTM in accordance with rBi guidelines. all other investments are classified as aFs securities.
equity investments carried under the HTM category are carried at acquisition cost. realised gains on investments under the HTM category are recognised in the Profit and loss account and subsequently appropriated to capital reserve account (net of taxes and transfer to statutory reserves) in accordance with rBi guidelines. losses are recognised in the Profit and loss account.
The Bank does not have any equity under the Banking Book.

Annual Report 2016-17
Business oveRview
sTATuToRYRePoRTs
FinAnCiALsTATeMenTs
BAseL iii DisCLosuRes
279
XVII. COMPARISION OF ACCOUNTING ASSETS AND LEVERAGE RATIO EXPOSURE MEASURE AS ON 31 MARCH, 2017
(` in millions)
Particulars Amount
Total consolidated assets as per published financial statements 6,114,620
adjustments for investments in banking, financial, insurance or commercial entities that are consolidated for accounting purpose but outside the scope of regulatory consolidation
-
adjustments for fiduciary assets recognized on the balance sheet pursuant to the operative accounting framework but excluded from the leverage ratio exposure measure
-
adjustments for derivative financial instruments 150,649
adjustment for securities financing transactions(i.e. repos and similar secured lending) -
adjustment for off-balance sheet items (i.e. conversion to credit equivalent amounts of off-balance sheet exposures) 839,662
other adjustments (532)
Leverage ratio exposure 7,104,399
XVIII. LEVERAGE RATIO COMMON DISCLOSURE TEMPLATE AS ON 31 MARCH, 2017(` in millions)
Particulars Leverage ratio framework
On-balance sheet exposures
1 on-balance sheet items(excluding derivatives and sFTs, but including collateral) 5,877,003
2 (asset amounts deducted in determining Basel iii Tier 1 capital) (532)
3 Total on-balance sheet exposures(excluding derivatives and SFTs)(sum of lines 1 and 2) 5,876,471
Derivative Exposures
4 replacement cost associated with all derivatives transactions (i.e. net of eligible cash variation margin) 110,935
5 add-on amounts for PFe associated with all derivatives transactions 134,109
6 Gross-up for derivatives collateral provided where deducted from the balance sheet assets pursuant to the operative accounting framework
-
7 (Deductions of receivables assets for cash variation margin provided in derivatives transactions) -
8 (exempted ccP leg of client-cleared trade exposures) -
9 adjusted effective notional amount of written credit derivatives -
10 (adjusted effective notional offsets and add-on deductions for written credit derivatives) -
11 Total derivative exposures (sum of lines 4 to 10) 245,044
Securities financing transaction exposures
12 Gross sFT assets (with no recognition of netting), after adjusting for sale accounting transactions 143,222
13 (netted amounts of cash payables and cash receivables of gross sFT assets) -
14 ccr exposure for sFT assets -
15 agent transaction exposures -
16 Total securities financing transaction exposures (sum of lines 12 to 15) 143,222
Other off-balance sheet exposures
17 off-balance sheet exposure at gross notional amount 2,461,873
18 (adjustments for conversion to credit equivalent amounts) (1,622,211)
19 Off-balance sheet items (sum of lines 17 and 18) 839,662
Capital and total exposures
20 Tier 1 capital 580,152
21 Total exposures (sum of lines 3,11,16 and 19) 7,104,399
Leverage Ratio
22 Basel III leverage ratio 8.17%

Our custOmers. Our wOrld.
Axis Bank Limited280
Disclosures unDer Basel iii (conT.)
XIX. RECONCILIATION OF TOTAL PUBLISHED BALANCE SHEET SIZE AND ON BALANCE SHEET EXPOSURE
(` in millions)
Sr. No.
Particulars Amount
1 Total consolidated assets as per published financial statements 6,114,620
2 replacement cost associated with all derivatives transactions, i.e. net of eligible cash variation margin (94,395)
3 adjustment for securities financing transactions (i.e. repos and similar secured lending) (143,222)
4 adjustment for entities outside the scope of regulatory consolidation -
5 On-balance sheet items (excluding derivatives and SFTs, but including collateral) 5,877,003