discover more about proteins and protein interactions · pdf file · 2010-11-26the...
TRANSCRIPT

Discover more about proteins and protein interactions


3Duolink – Protein interactions
Introduction
The Duolink® approach provides new insights into proteins and protein interactions. For the first time, individual proteins, their interactions and modifications, can be accurately and objectively quantified in unmodified cells and tissues. Utilizing only a few cells, sub-cellular events, even transient or weak interactions, are revealed in situ and sub-populations of cells can be differentiated. Within hours, results from conventional co-immunoprecipitation and co-localization techniques can be confirmed.

4 Duolink – Protein interactions
Visualize and locate protein interactions
The Duolink kits are based on in situ PLA®, a technology that extends the capabilities of traditional immunoassays to include direct detection of protein interactions with unparalleled specificity and sensitivity. For the first time, any target can be readily detected and localized with single molecule resolution. The following pages illustrate the advantages of utilizing this approach.
1. SIMULTANEOUSLY VISUALIZE AND LOCATE PROTEIN-PROTEIN INTERACTIONSA Duolink kit reveals individual proteins and their interactions as quantifiable fluorescent signals or chromogenic stains. Each kit can be configured to meet specific assay requirements.
2. SEE SUB-CELLULAR EVENTS IN SITURetain protein localization. No modification of cells or tissue. No cell lysis, no over-expression, no interference from tags.
Fig 2. Breast cancer tissue (Duolink Detection Reagents Brightfield).
Brown: HER2/HER3 interactions.
Fig 1. Single event resolution. Each red spot represents an SMAD 1/2/3 and SMAD 4 interaction in mouse embryonic fibroblasts.
Green: FITC-anti-actin. Blue: DAPI stained nuclei.

5Duolink – Protein interactions
3. REVEAL TRANSIENT AND WEAK INTERACTIONS IN SITUDetection and quantification of VE-PTP/VEGFR2 complexes in situ in endothelial cells treated or not with ligand (VEGF) for different time periods.
Fig 3. Red: VE-PTP/VEGFR2 complexes. Blue: Hoechst stained nuclei.
Fig 4. Quantification of VE-PTP/VEGFR2 complexes.
0 min – Unstimulated
10 min – Stimulated
5 min – Stimulated
15 min – Stimulated
Reproduced through the courtesy of FASEB Journal. Ref: Mellberg et al. FASEB J. 2009 May;23(5):1490-1502.
QUANTITATIVE ANALYSIS
“… we were able to confirm data from a 2-hybrid screen and from co-immunoprecipitation experiments that demonstrated a dynamic interaction between a membrane receptor and a transcription factor.”
Roxana Pincheira, PhD, University of California San Francisco
Spot
s pe
r cel
l
00 2 5 10 15
20
80
60
40
100
VEGF min

6 Duolink – Protein interactions
5. WORK WITH ENDOGENOUS PROTEINS USING ONLY A FEW CELLSER alpha/DYX1C1 interaction visualized in cell’s neurite extensions. Rat embryonic hippocampal neurons cultured 48 hours with estradiol. Proteins detected at endogenous levels – not seen using Western blot.
Fig 6. Red: ER alpha/DYX1C1 interactions. Blue: Hoechst stained nuclei. Green: FITC-anti-actin.
Estradiol-stimulatedUnstimulated control
Reproduced through the courtesy of Human Molecular Genetics. Ref: Massinen et al. Hum Mol Genet. 2009 May 7.
4. STUDY HOMODIMERIC PROTEIN COMPLEXESDuolink Probemaker enables the study of homodimeric complexes by allowing the use of same species monoclonal antibodies. Simply include Probemaker probes, instead of PLA probes, in a Duolink kit.
Fig 5. Visualization of HER2/HER2 homodimers in breast tissue.
Red:HER2/HER2 homodimers. Blue: DAPI stained nuclei.
Normal tissue Cancerous tissue
“… an important tool … for visualization of novel protein-protein interactions in cell lines and primary cells from different species.”
Hans Matsson, PhD, Dept. of Biosciences and Nutrition,
Karolinska Institute, Sweden

7Duolink – Protein interactions
6. DIFFERENTIATE BETWEEN SUB-POPULATIONS OF CELLSEvaluate phosphorylation levels. Discrete fluorescent signals reveal phosphorylation of PDGF receptors.
Fig 7. Red: phosphorylated PDGF receptors. Blue: Hoechst stained nuclei.
BB (PDGF ligand)-stimulated cellsUnstimulated control
50
45
40
35
30
25
20
15
10
0
5
NON STIMULATED STIMULATED
Fig 8. Dedicated Duolink ImageTool generates accurate data.
PLA SIGNALS (SIGNALS/CELL)
NON STIMULATED STIMULATED
“… allows visualization of the cellular compartment (nucleus, cytoplasm, etc) in which protein-protein interactions take place.“
Mark Wade, PhD, Gene Expression Laboratory (Wahl Lab),
The Salk Institute, San Diego, USA

8 Duolink – Protein interactions
7. SEE SUB-POPULATIONS OF CELLS WITHIN TISSUE SAMPLESAnalysis of PDGF receptor in paraffin-embedded choroid plexus carcinoma tissue reveals phosphorylated PDGF α and β receptor complexes in situ.
8. CONFIRM CONVENTIONAL CO-IP AND CO-LOCALIZATION RESULTS – IN ONE STEPDetection of PDGF-Rβ/VEGF-R2 receptor interactions after growth factor treatments of cells.
Fig 9. Red: PDGFR α or β. Blue: Hoechst stained nuclei. Green: autofluorescence.
Fig 10. Red: PDGF-Rβ/VEGF-R2 receptor interactions. Blue: Hoechst stained nuclei. Green: Cytoplasm stained with Alexa 488-Phalloidin.
α receptor β receptor
Reproduced through the courtesy of Janna Paulsson, PhD. Dept. of Oncology-Pathology Karolinska Institute. Ref: Koos B, et al. Am. J. Pathol. 2009, 175:1631-163.
Reproduced through the courtesy of Nature. Ref: Greenberg et al. Nature 2008 Nov 9.
“… may ultimately prove to be equivalent to FRET, but with the significant benefit of detecting endogenous protein-protein interactions.“
David A. Cheresh, Ph.D., Professor and Vice Chair of Pathology,
University of California, San Diego, Moores Cancer Center
9Duolink – Protein interactions
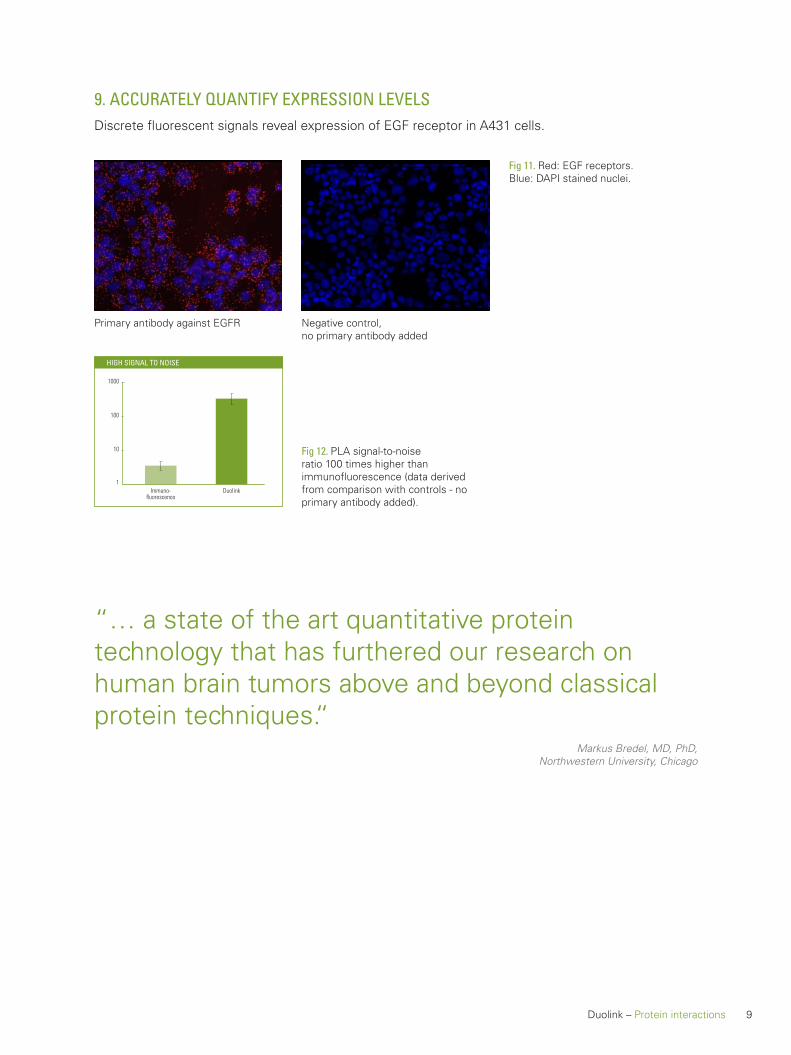
9. ACCURATELY QUANTIFY EXPRESSION LEVELSDiscrete fluorescent signals reveal expression of EGF receptor in A431 cells.
Fig 11. Red: EGF receptors. Blue: DAPI stained nuclei.
Fig 12. PLA signal-to-noise ratio 100 times higher than immunofluorescence (data derived from comparison with controls - no primary antibody added).
“… a state of the art quantitative protein technology that has furthered our research on human brain tumors above and beyond classical protein techniques.“
Markus Bredel, MD, PhD, Northwestern University, Chicago
Immuno-fluorescence
1
10
100
1000
Duolink
HIGH SIGNAL TO NOISE
Negative control, no primary antibody added
Primary antibody against EGFR

10 Duolink – Protein interactions
Results within one day
PREPARATIONPREPARATION AND INCUBATION OF PRIMARY ANTIBODIES AND PLA PROBES.
DETECTIONAMPLIFICATION AND DETECTION OF BOUND PLA PROBES.
STEP 1.Fix cells or tissues onto microscope slide, add blocking solution.
STEP 4.Wash and add Ligation solution.
STEP 2.Wash and add two primary antibodies.
STEP 5.Wash and add Amplification solution.
STEP 3.Wash and add the PLUS and MINUS PLA probes.
STEP 6.Wash, dry and mount slides.
Typical starting materials are adherent cells, cytospin preparations or tissue sections on a glass slide, fixed, pre-treated and blocked with a blocking reagent according to the requirements of the primary antibodies used.
The Ligation solution, consisting of two oligonucleotides (illustrated as red bands) and Ligase, is added and the oligonucleotides will hybridize to the two PLA probes and join to a closed circle if they are in close proximity (<40 nm).
Primary antibodies must be of different species and each must recognize two different epitopes on the target molecules.
The Amplification solution, consisting of nucleotides and fluorescently labeled oligonucleotides (detection probes), is added together with Polymerase. A rolling-circle-amplification reaction generates a concatemeric DNA strand onto which the detection probes subsequently hybridize.
PLA probes are secondary antibodies that bind to the primary antibodies. Each probe is equipped with a unique oligonucleotide.
Use the appropriate Duolink Mounting Medium to preserve and enhance the PLA signals. In order to stain the nuclei use Duolink Mounting Medium with DAPI. For brightfield applications use the nuclear stain included in the kit.

11Duolink – Protein interactions
ANALYSISIMAGING AND QUANTITATIVE ANALYSIS.
ADDITIONAL APPLICATIONSUsing the in situ PLA technology you can also detect modifications such as phosphorylations or the expression of a single protein.
STEP 7.Review and capture images.
DETECT AND QUANTIFY PROTEIN PHOSPHORYLATION
STEP 8.Obtain objective quantification using Duolink ImageTool.
DETECT AND QUANTIFY PROTEIN EXPRESSION
STEP 9.Data analysis.
The PLA signal is recognized as a fluorescent or chromogenic spot. For fluorescent microscopy, use the appropriate filters for the detection fluorophore used. Export raw data into Duolink ImageTool for objective quantification.
Detection of a modified protein such as a phosphorylated receptor can be done using one primary antibody against the receptor and the other against the phosphorylated site.
Automatic detection of nuclei and cytoplasmic regions. Compatible with data formats from major microscope vendors including Olympus, Leica, Nikon and Zeiss. Data can be exported into Excel for further evaluation.
Detection of a single protein with high sensitivity can be done using only one primary antibody. Use PLA probes PLUS and MINUS against the same species.
Duolink ImageTool enables single cell statistical analysis of expression levels in tissue or cell populations.
50
45
40
35
30
25
20
15
10
0
5
NON STIMULATED STIMULATED
DETECT AND QUANTIFY PROTEIN EXPRESSION
Detection of a single protein with high sensitivity and specificity. Use two primary antibodies from different species against different epitopes of the same protein.

12 Duolink – Protein interactions
The Duolink solution
BUILD YOUR OWN KITEach Duolink in situ PLA protein detection kit consists of customizable kit components and can be configured to meet specific assay requirements. In addition to the kit components you will also need two primary antibodies raised in different species.
BUILDING A KIT THAT PERFECTLY MATCHES YOUR NEED IS EASILY DONE IN FOUR STEPS1. Choose PLA probe PLUS against the species one of your primary antibody has been raised in or Probemaker PLUS
2. Choose PLA probe MINUS against the species the other primary antibody has been raised in or Probemaker MINUS
3. Choose detection reagents depending on your mode of detection, fluorescence or chromogenic
4. Choose the optimal accessories for your Duolink application
All necessary diluent solutions, enzymes and reagents needed to perform the Duolink assay are included in the kit components together with detailed step-by-step instructions.

13Duolink – Protein interactions
CUSTOMIZABLE KIT COMPONENTS PLA probe PLUS; anti-Mouse PLUS, anti-Goat PLUS or anti-Rabbit PLUS
PLA probe MINUS; anti-Mouse MINUS, anti-Goat MINUS or anti-Rabbit MINUS
Probemaker PLUS and MINUS enables you to ”make your own” PLA probes by conjugating the PLA oligonucleotide arms directly to antibodies
Detection Reagents; Orange, Red, Far red or Green for fluorescence microscopy
Detection Reagents Brightfield for brightfield microscopy
RECOMMENDED ACCESSORIES Wash Buffers for fluorescence or brightfield – ready-to-use powder for all
wash buffers
Control Kit – reference slides, primary antibody and PLA probes to use as positive controls with fluorescence-based assays
Mounting Medium with or without DAPI nuclear stain to preserve fluorescence signals
Brightfield Mounting Medium for chromogenic-based assays
Duolink Image Tool for image evaluation and result quantification

14 Duolink – Protein interactions
How to order
For information about the Duolink products visit www.olink.com. We strongly recommend that you use the Duolink Kit Wizard, which configures the kit to suit your needs. Orders can be placed directly online or sent via email to [email protected].
Online purchasing is available in selected countries. For information about your local distributor visit www.olink.com/contact/distributors.


0739
, v. 1
.2, 2
010-
11-1
1
Olink Bioscience is based on a strong intellectual property portfolio focused towards the development of cutting edge technologies for biomolecular analysis in research and diagnostics. The company’s proprietary Duolink product line enables researchers in academia and the pharmaceutical industry to visualize and accurately quantify individual proteins, their interactions and modifications, in unmodified cells and tissues. Such information is crucial to help elucidate disease mechanisms, leading to the development of novel diagnostics and therapeutics. The Duolink line is marketed and sold through a growing distributor network. A second revenue stream comes from the out-licensing of other proprietary technologies to major biotech supply companies.
Olink Bioscience is a privately held company, founded in 2004, and headquartered in Uppsala, Sweden.
© 2010 Olink AB. Duolink and PLA are trademarks of Olink AB. All third party trademarks are the property of their respective owners.
Olink Bioscience, Dag Hammarskjölds v. 54A SE-751 83 Uppsala, Sweden
www.olink.com