discovering dissonance in undergraduates: must they reconcile their religious conservatism and...
TRANSCRIPT
Discovering Dissonance in Undergraduates: Must They
Reconcile Their Religious Conservatism and
Social-Economic Liberalism?
John F. SettichBenedictine College; Atchison,
KS
at the Southern Political Science AssnIn New Orleans, LA 6 January 2005

Inquiry & Imagination: the Power of a child’s
mind
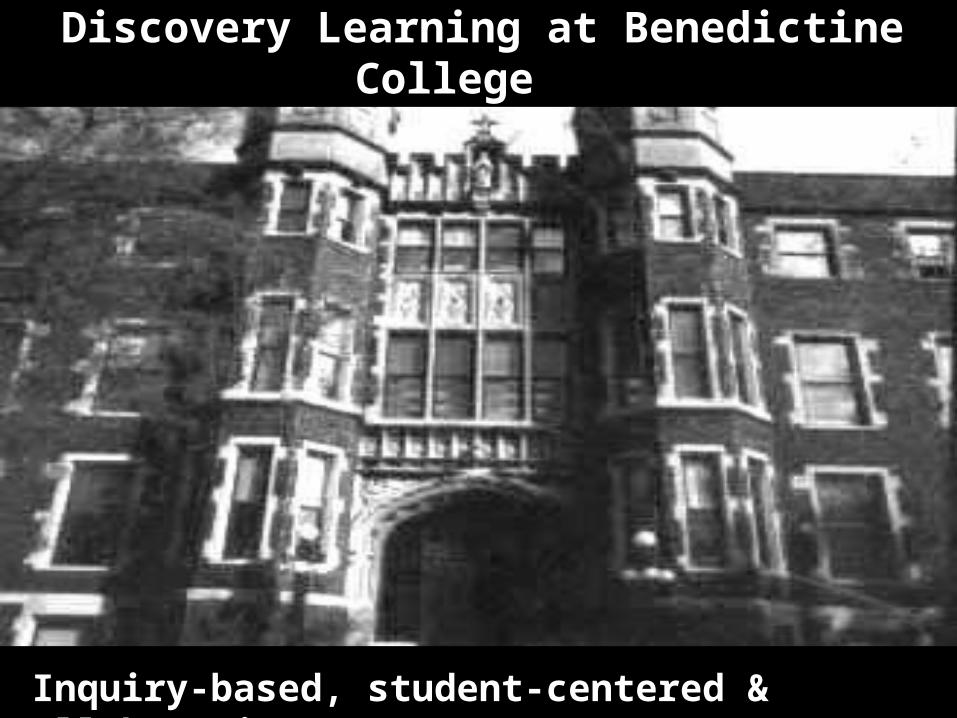
Discovery Learning at Benedictine College
Inquiry-based, student-centered & collaborative

“Supracurricular learning”
• Most Discovery projects arise from classroom
• Imagination and curiosity are essential
• About 1/3rd of faculty do
• 30 year history
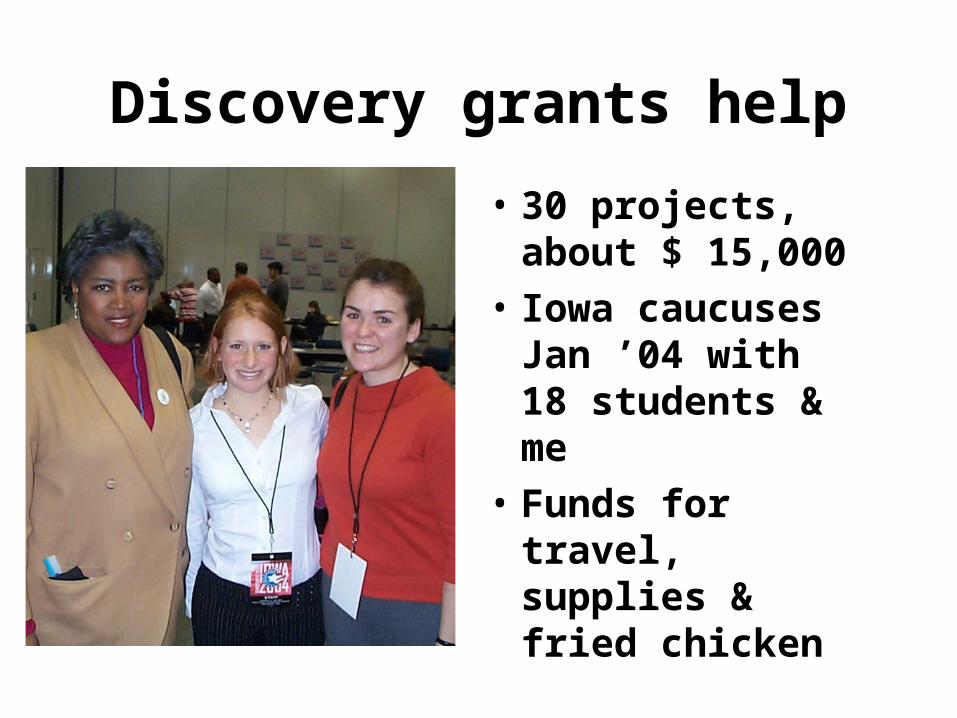
Discovery grants help
• 30 projects, about $ 15,000
• Iowa caucuses Jan ’04 with 18 students & me
• Funds for travel, supplies & fried chicken

Discovery Skills Seminar
• Goal: create & complete research project
• Four PS majors• Professor as
coach, guide, collaborator, disciplinarian and taskmaster

The central questions:
• Will students who hold conservative religious views also be political conservatives?
• And, are conservatives more likely to vote?
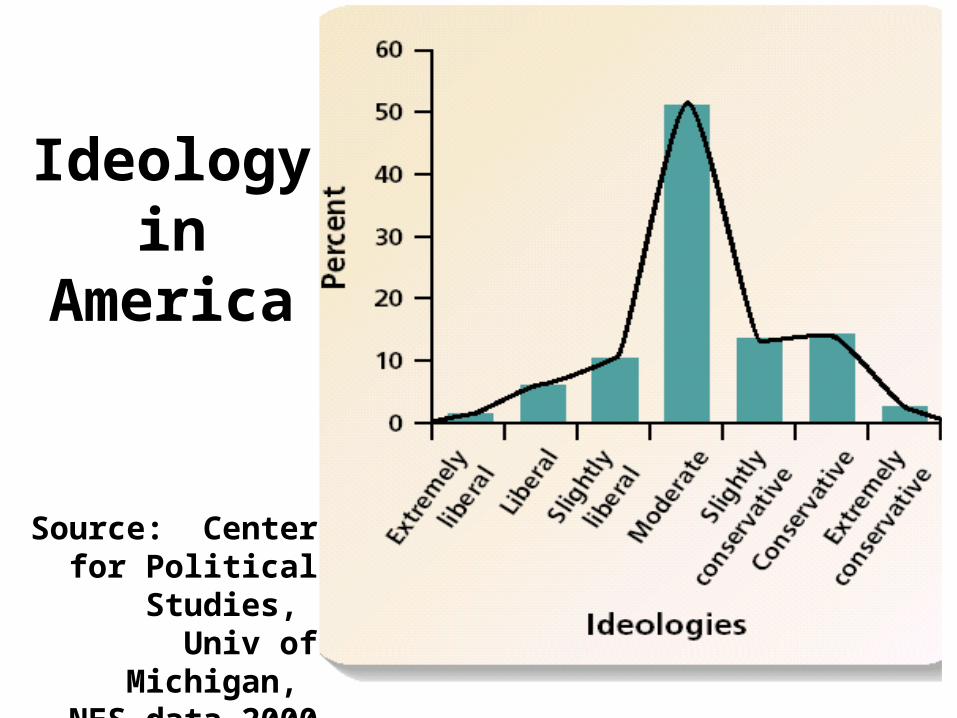
Ideologyin
America
Source: Center for Political
Studies, Univ of Michigan,
NES data 2000
Jost defines conservatism
“The core ideology of conservatism stresses resistance to change and justification of inequality and is motivated by needs that vary situationally and dispositionally to manage uncertainty and threat.”
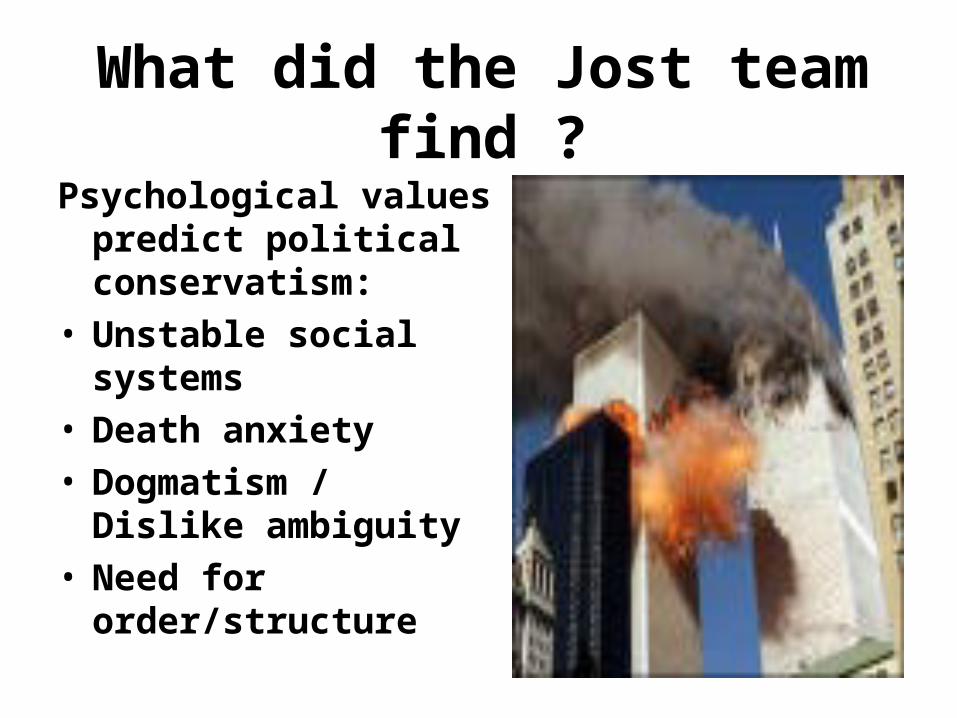
What did the Jost team find ?
Psychological values predict political conservatism:
• Unstable social systems
• Death anxiety • Dogmatism /
Dislike ambiguity• Need for
order/structure
Choosing our sample ….
• Random, stratified sample drawn from all BC undergraduate students enrolled in Fall, 2003
• Sample represents the universe of 980 students.
• N = 100 students
Research methods• Data entry by
respondents to contract website that delivered data in .xls format
• Respondents given evening appointments on 3 nights in 1 week
• Letters & personal invitation & incentive
Survey design1. Political Compass,
web-based survey2. Wilson-Patterson,
standard survey for ideology, amended
3. BC Catholic Values Index: 16-question survey of our design, consulted with Religious Studies faculty
Respondent characteristics
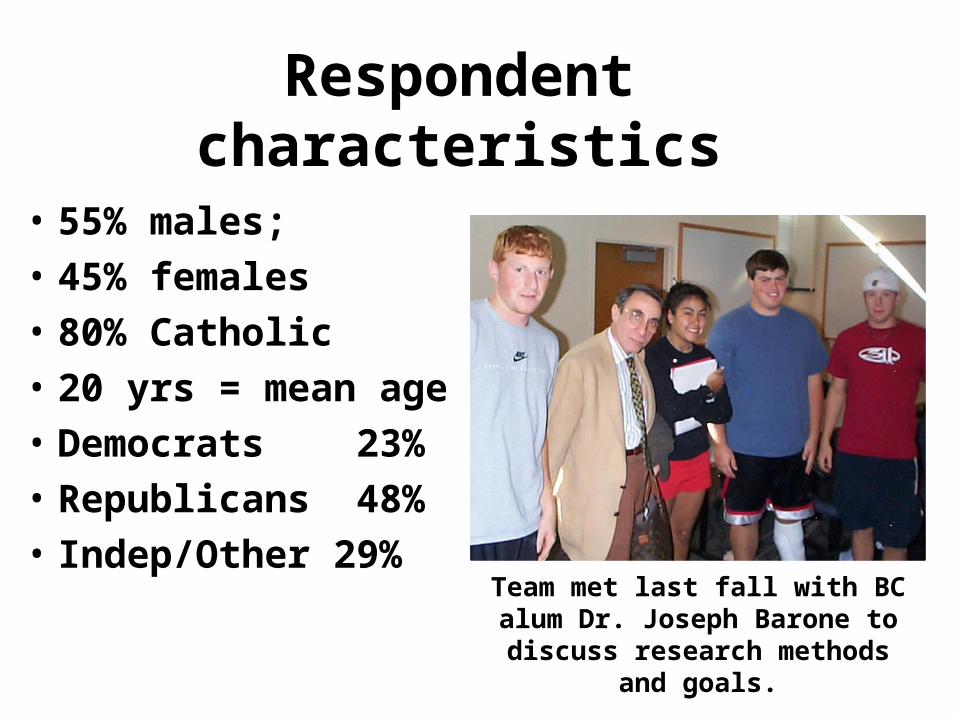
• 55% males;• 45% females• 80% Catholic• 20 yrs = mean age• Democrats 23%• Republicans 48%• Indep/Other 29%
Team met last fall with BC alum Dr. Joseph Barone to discuss research methods
and goals.
We could not measure
• Effect of majors: too many in sample were undeclared (50%)
• Political cynicism & optimism.• Political activism in many forms.• Effect of GPA on preferences.• Effects of race / ethnicity.• Knowledge of political events.
Conservatism Scale by Wilson & Patterson
• We adapted the C-scale for American cultural framework and abbreviated the survey.
• Introduced in 1968, published in 1988 in British Journal of Social & Clinical Psychology.
• Widely debated; widely used.• Uses only YES ? NO responses
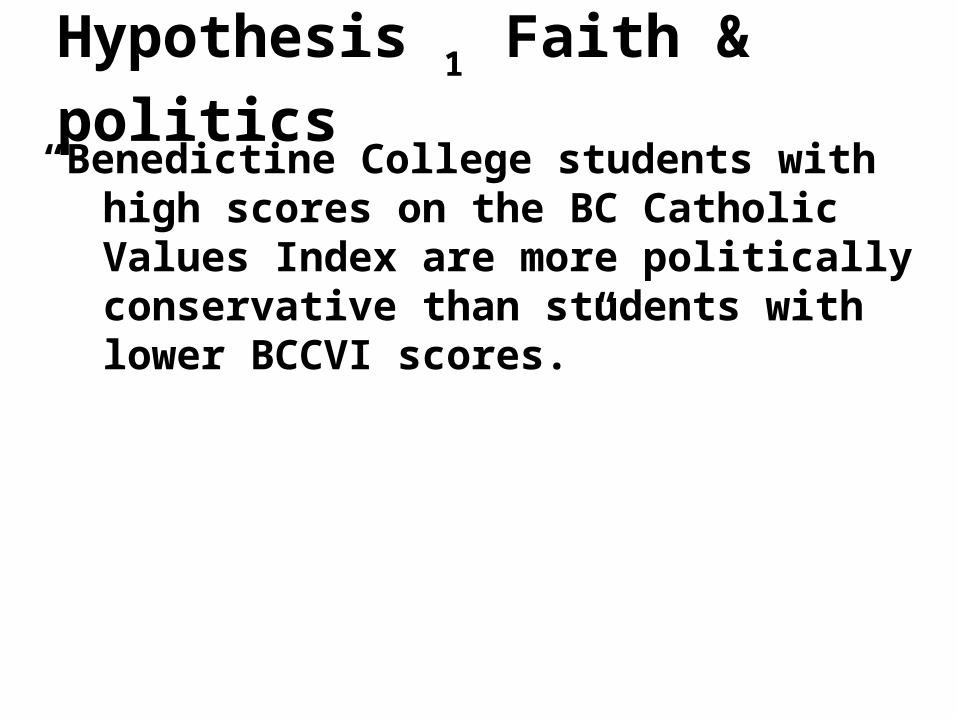
Hypothesis 1 Faith & politics
“Benedictine College students with high scores on the BC Catholic Values Index are more politically conservative than students with lower BCCVI scores.”
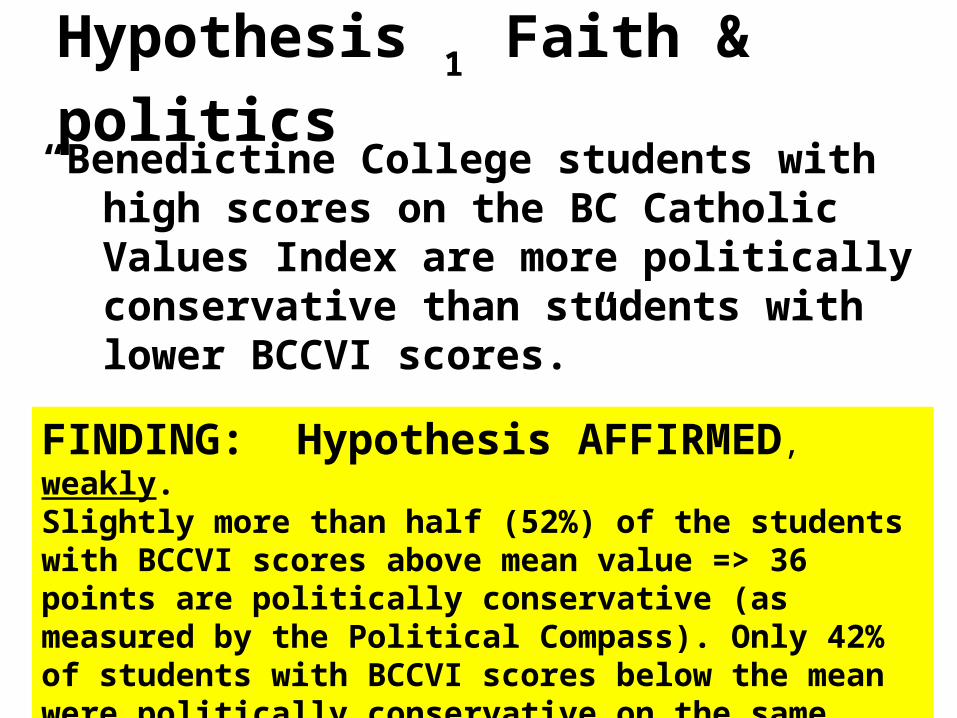
Hypothesis 1 Faith & politics
“Benedictine College students with high scores on the BC Catholic Values Index are more politically conservative than students with lower BCCVI scores.”
FINDING: Hypothesis AFFIRMED, weakly.Slightly more than half (52%) of the students with BCCVI scores above mean value => 36 points are politically conservative (as measured by the Political Compass). Only 42% of students with BCCVI scores below the mean were politically conservative on the same scale.

BC Catholic values index1. A Catholic may not vote for a
candidate who favors legalized abortion.
2. The next Pope who follows Pope John Paul II should follow the strict moral and theological views His Holiness has set for all of us.
3. Binge drinking is not a serious problem among college students in America.Strongly agree Agree No Opinion Disagree Strongly Disagree
------- | --------------- | ----------- | ------------- | -------------- | ------------

BC Catholic values index1. A Catholic may not vote for a
candidate who favors legalized abortion.
Strongly agree Agree No Opinion Disagree Strongly Disagree------- | --------------- | ----------- | ------------- | -------------- | ------------
4 3 0 2 1 Conservative LiberalAll 16 questions were coded for ideal
Conservative or Liberal values. •Higher scores = more Conservative•Lower scores = more Liberal

BCTL
Histogram for Variable BCTL
Fre
qu
en
cy
0
5
10
15
20
15.000 20.571 26.143 31.714 37.286 42.857 48.429 54.000
Mean 35.5
Median 37
St. Dev.
9.4
N = 100
BC Catholic values index
Mean
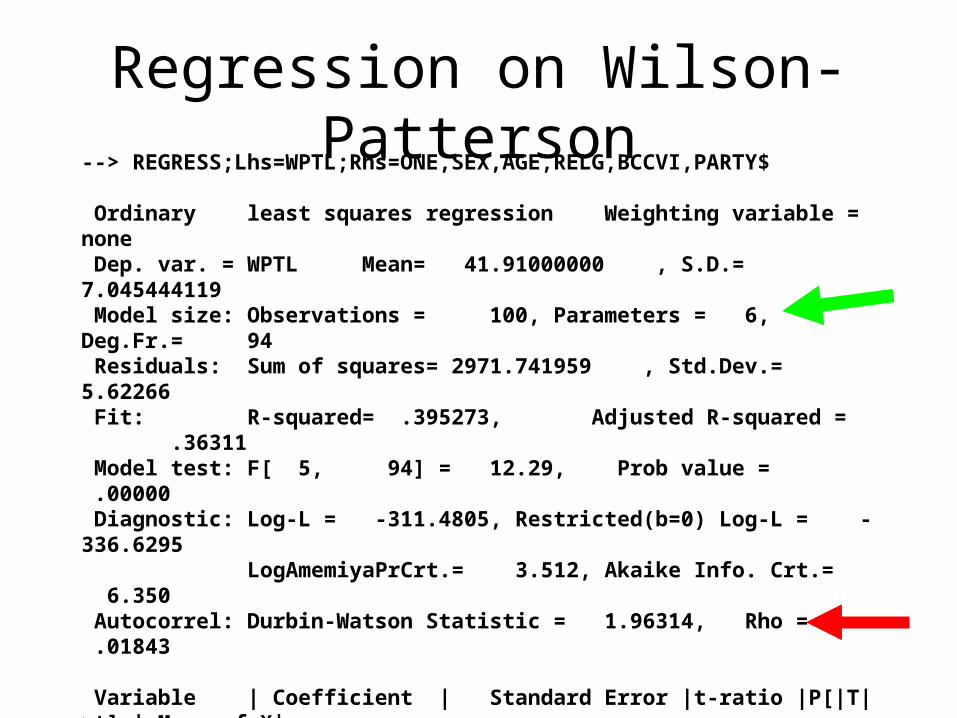
Regression on Wilson-Patterson--> REGRESS;Lhs=WPTL;Rhs=ONE,SEX,AGE,RELG,BCCVI,PARTY$ Ordinary least squares regression Weighting variable = none Dep. var. = WPTL Mean= 41.91000000 , S.D.= 7.045444119 Model size: Observations = 100, Parameters = 6, Deg.Fr.= 94 Residuals: Sum of squares= 2971.741959 , Std.Dev.= 5.62266 Fit: R-squared= .395273, Adjusted R-squared = .36311 Model test: F[ 5, 94] = 12.29, Prob value = .00000 Diagnostic: Log-L = -311.4805, Restricted(b=0) Log-L = -336.6295 LogAmemiyaPrCrt.= 3.512, Akaike Info. Crt.= 6.350 Autocorrel: Durbin-Watson Statistic = 1.96314, Rho = .01843 Variable | Coefficient | Standard Error |t-ratio |P[|T|>t] | Mean of X| Constant 39.79434580 7.9853090 4.983 .0000 SEX -.9485587023 1.1528748 -.823 .4127 1.4500000 AGE -.4742097367 .35168338 -1.348 .1808 19.850000 RELG -2.975829787 1.5914244 -1.870 .0646 .19000000 BCCVI .3684296984 .70586968E-01 5.220 .0000 35.530000 PART .3186790428 .72013451 .443 .6591 1.1900000

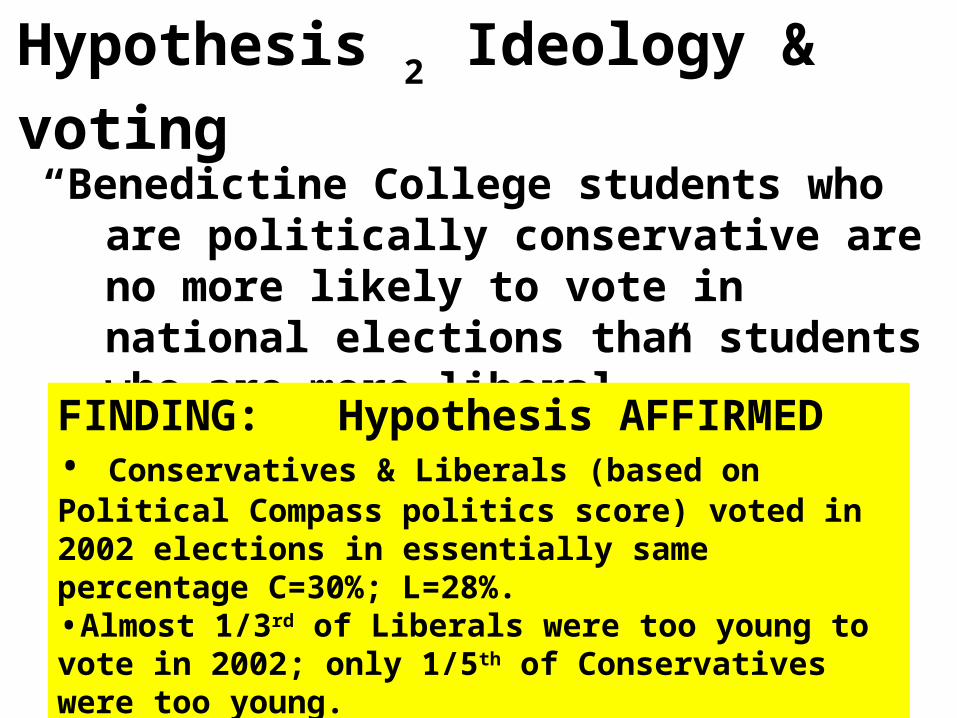
Hypothesis 2 Ideology & voting“Benedictine College students who
are politically conservative are no more likely to vote in national elections than students who are more liberal.”
Hypothesis 2 Ideology & voting“Benedictine College students who
are politically conservative are no more likely to vote in national elections than students who are more liberal.”
FINDING: Hypothesis AFFIRMED• Conservatives & Liberals (based on Political Compass politics score) voted in 2002 elections in essentially same percentage C=30%; L=28%.•Almost 1/3rd of Liberals were too young to vote in 2002; only 1/5th of Conservatives were too young.

Hypothesis 2 Ideology & voting“Benedictine College students who
are politically conservative are no more likely to vote in national elections than students who are more liberal.”In 2002 election
Liberals
Conservatives
Did not vote 43 % 51 %
Did vote 28 % 30 %
Not old enough
29 % 19 %
TOTAL N = 51 N = 47
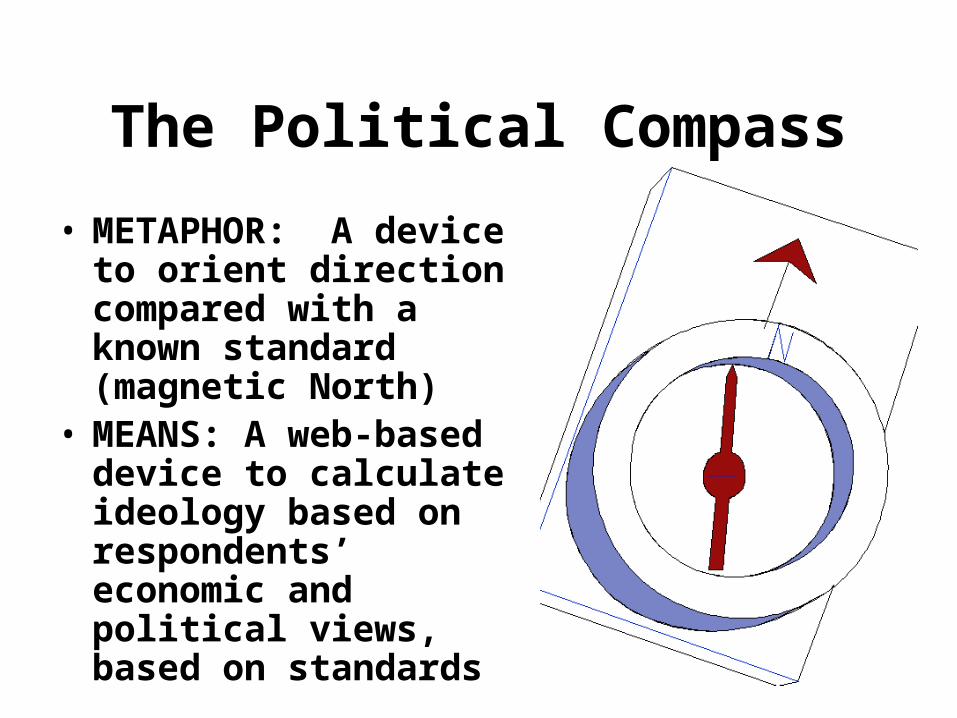
The Political Compass
• METAPHOR: A device to orient direction compared with a known standard (magnetic North)
• MEANS: A web-based device to calculate ideology based on respondents’ economic and political views, based on standards
-6 -5 -4 -3 -2 -1 0 1 2 3 4 5 6
6 6
5 5
4 4
3 . . 3
2 … … .. ... 2
1 … ……
……
…..
... . .. 1
0 ….
….
.….
.…
. 0
-1 . .. …...
.…..….
… .. . .. . -1
-2 . . . . -2
-3 . .. . -3
-4 . -4
-5 . . -5
-6 -6
-6 -5 -4 -3 -2 -1 0 1 2 3 4 5 6
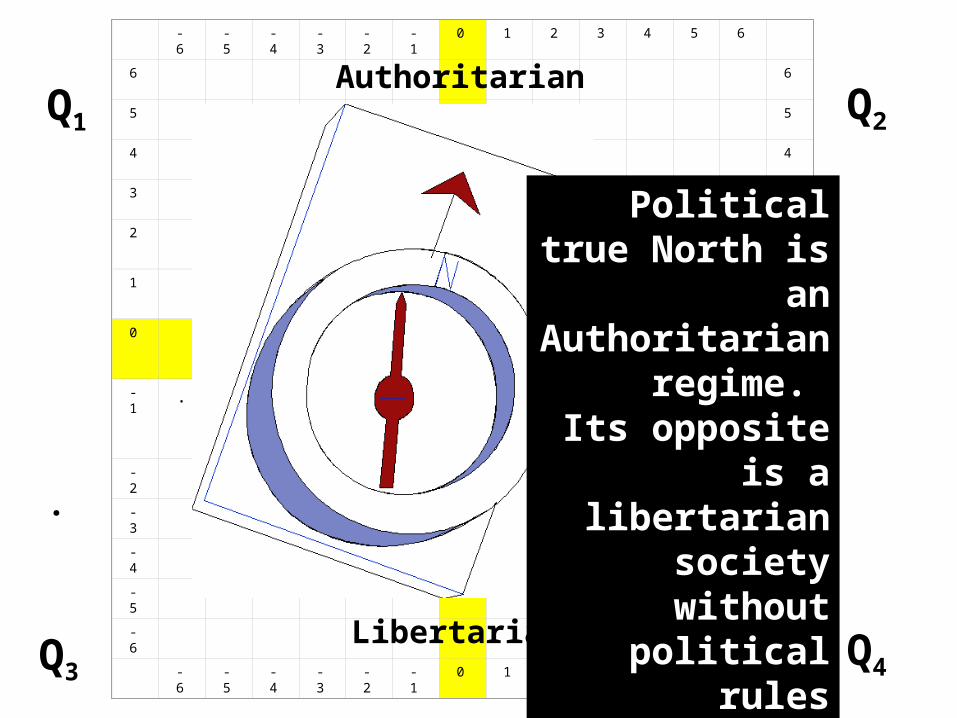
.
Authoritarian
Libertarian
Q1 Q2
Q4Q3
Political true North is an
Authoritarian regime.
Its opposite is a
libertarian society without
political rules
-6 -5 -4 -3 -2 -1 0 1 2 3 4 5 6
6 6
5 5
4 4
3 . . 3
2 … … .. ... 2
1 … ……
……
…..
... . .. 1
0 ….
….
.….
.…
. 0
-1 . .. …...
.…..….
… .. . .. . -1
-2 . . . . -2
-3 . .. . -3
-4 . -4
-5 . . -5
-6 -6
-6 -5 -4 -3 -2 -1 0 1 2 3 4 5 6
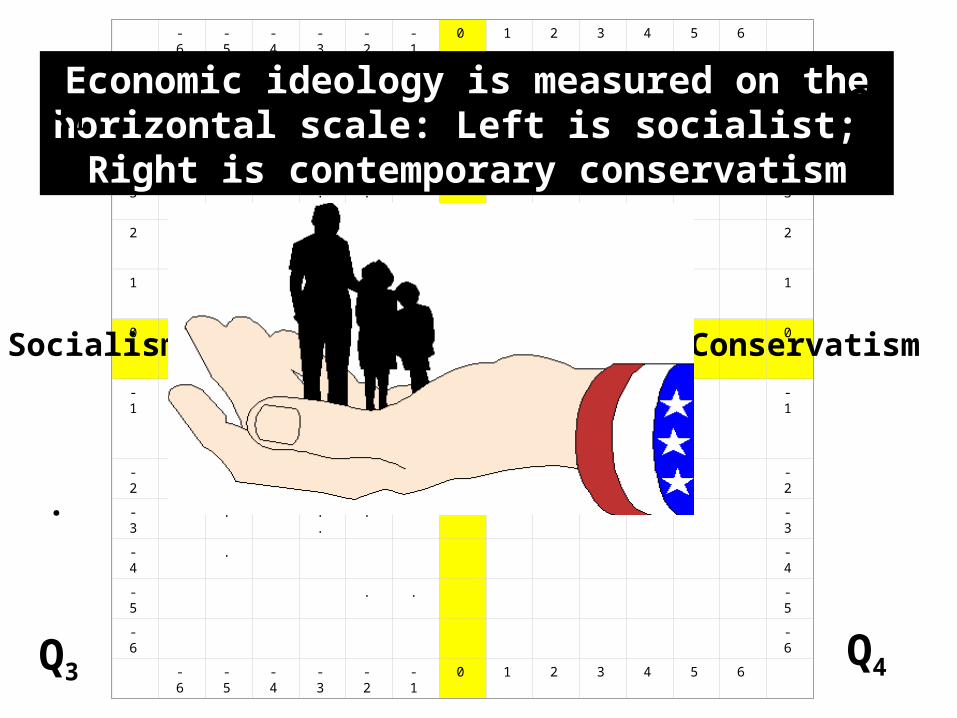
.
Economic ideology is measured on the horizontal scale: Left is socialist;
Right is contemporary conservatism
Socialism Conservatism
Q1 Q2
Q4Q3

-6 -5 -4 -3 -2 -1 0 1 2 3 4 5 6
6 6
5 5
4 4
3 . . 3
2 … … .. ... 2
1 … ……
……
…..
... . .. 1
0 ….
….
.….
.…
. 0
-1 . .. …...
.…..….
… .. . .. . -1
-2 . . . . -2
-3 . .. . -3
-4 . -4
-5 . . -5
-6 -6
-6 -5 -4 -3 -2 -1 0 1 2 3 4 5 6
.
Authoritarian
Libertarian
Socialism Conservatism
Q1 Q2
Q4Q3
Economics & politics liberal
Economics & politics
conservative
Politics liberal & economics conservative
Economics liberal & politics
conservative
-6 -5 -4 -3 -2 -1 0 1 2 3 4 5 6
6 6
5 5
4 4
3 . . 3
2 … … .. ... 2
1 … ……
……
…..
... . .. 1
0 ….
….
.….
.…
. 0
-1 . .. …...
.…..….
… .. . .. . -1
-2 . . . . -2
-3 . .. . -3
-4 . -4
-5 . . -5
-6 -6
-6 -5 -4 -3 -2 -1 0 1 2 3 4 5 6
.
Authoritarian
Libertarian
Socialism Conservatism
Q1 Q2
Q4Q3
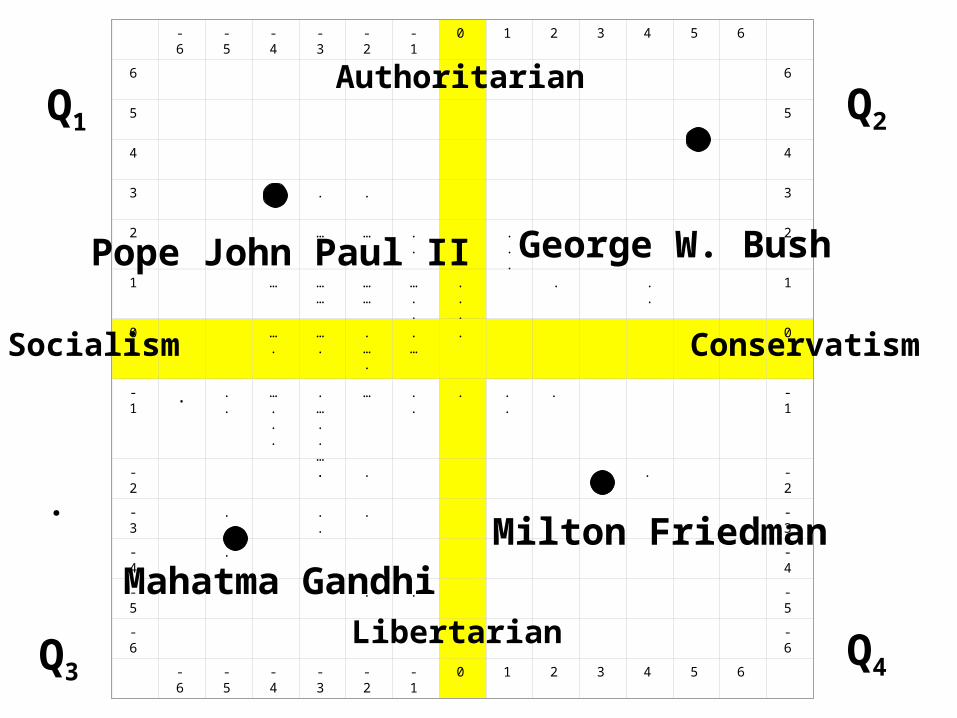
George W. Bush
Milton FriedmanMahatma Gandhi
Pope John Paul II
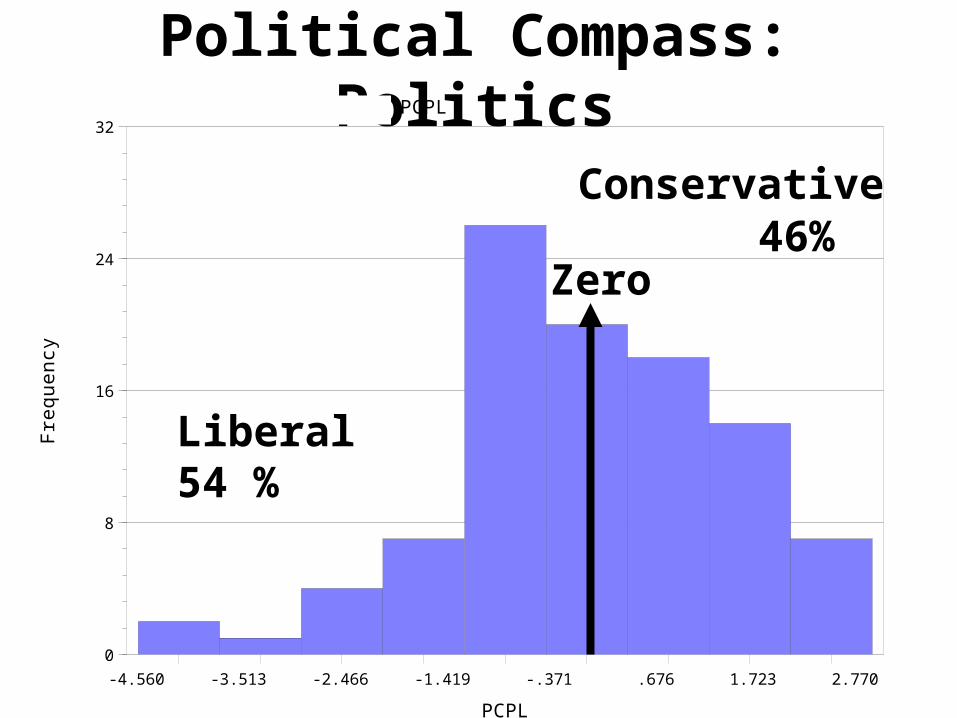
Political Compass: Politics
PCPL
Histogram for Variable PCPL
Fre
qu
en
cy
0
8
16
24
32
-4.560 -3.513 -2.466 -1.419 -.371 .676 1.723 2.770
Liberal54 %
Zero
Conservative46%
..

Political Compass: Economics
PCEC
Histogram for Variable PCEC
Fre
qu
en
cy
0
8
16
24
32
-6.000 -4.517 -3.034 -1.551 -.069 1.414 2.897 4.380
Zero
Conservative15%
Liberal85%
..
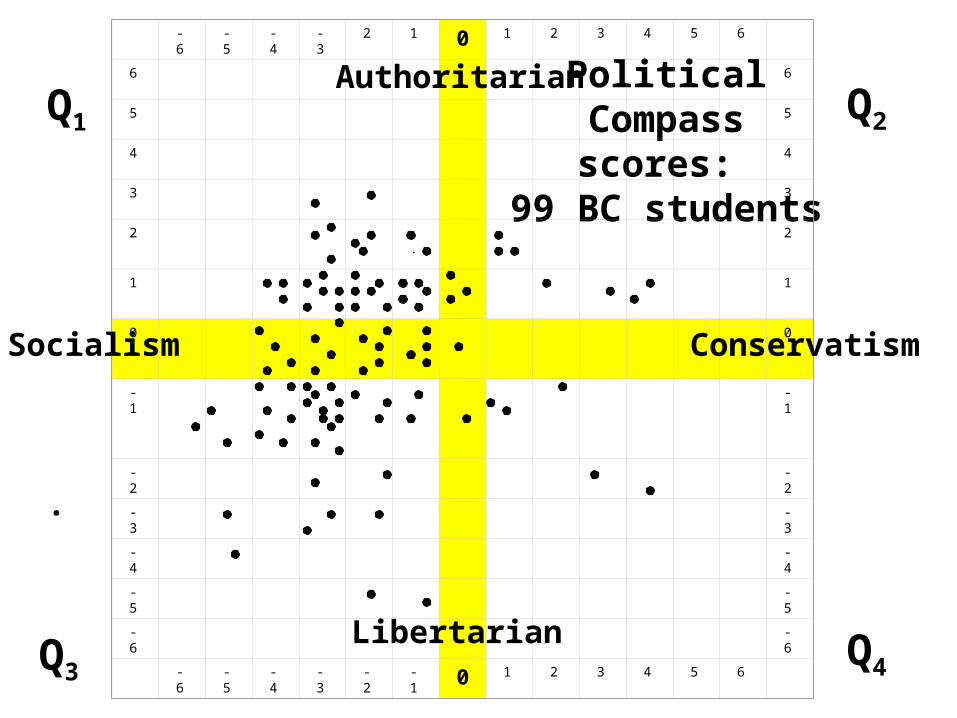
Political Compass scores:
99 BC students
-6 -5 -4 -3 2 1 0 1 2 3 4 5 6
6 6
5 5
4 4
3 3
2 .. 2
1 1
0 0
-1 -1
-2 -2
-3 -3
-4 -4
-5 -5
-6 -6
-6 -5 -4 -3 -2 -1 0 1 2 3 4 5 6
.
Authoritarian
Libertarian
Socialism Conservatism
Q1 Q2
Q4Q3

-6 -5 -4 -3 2 1 0 1 2 3 4 5 6
6 6
5 5
4 4
3 3
2 .. 2
1 1
0 0
-1 -1
-2 -2
-3 -3
-4 . -4
-5 -5
-6 -6
-6 -5 -4 -3 -2 -1 0 1 2 3 4 5 6
.
Authoritarian
Libertarian
Socialism Conservatism
Q1 Q2
Q4Q3
Most (85%) are more liberal on economic issues

-6 -5 -4 -3 2 1 0 1 2 3 4 5 6
6 6
5 5
4 4
3 3
2 .. 2
1 1
0 0
-1 -1
-2 -2
-3 -3
-4 . -4
-5 -5
-6 -6
-6 -5 -4 -3 -2 -1 0 1 2 3 4 5 6
.
Authoritarian
Libertarian
Socialism Conservatism
Q1 Q2
Q4Q3
Half (48%) are liberal on
economic and political issues
-6 -5 -4 -3 2 1 0 1 2 3 4 5 6
6 6
5 5
4 4
3 3
2 .. 2
1 1
0 0
-1 -1
-2 -2
-3 -3
-4 . -4
-5 -5
-6 -6
-6 -5 -4 -3 -2 -1 0 1 2 3 4 5 6
.
Authoritarian
Libertarian
Socialism Conservatism
Q1 Q2
Q4Q3
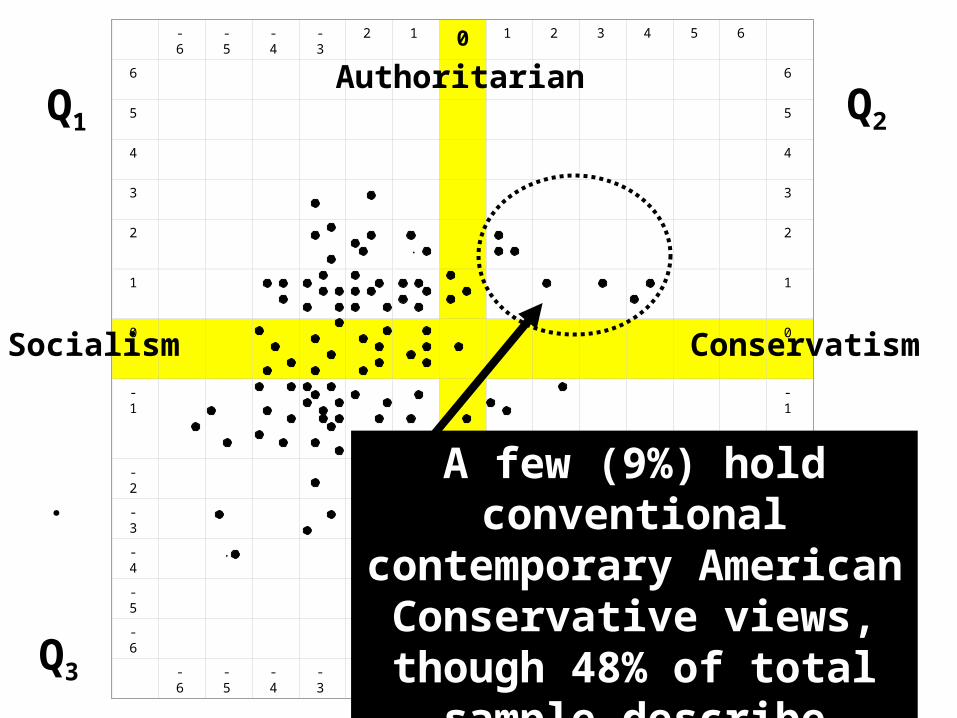
A few (9%) hold conventional contemporary American
Conservative views, though 48% of total sample describe
themselves as Republicans
-6 -5 -4 -3 -2 -1 0 1 2 3 4 5 6
6 6
5 5
4 4
3 . . 3
2 … … .. ... 2
1 … ……
……
…..
... . .. 1
0 ….
….
.….
.…
. 0
-1 . .. …...
.…..….
… .. . .. . -1
-2 . . . . -2
-3 . .. . -3
-4 . -4
-5 . . -5
-6 -6
-6 -5 -4 -3 -2 -1 0 1 2 3 4 5 6
.
Authoritarian
Libertarian
Socialism Conservatism
Q1 Q2
Q4Q3
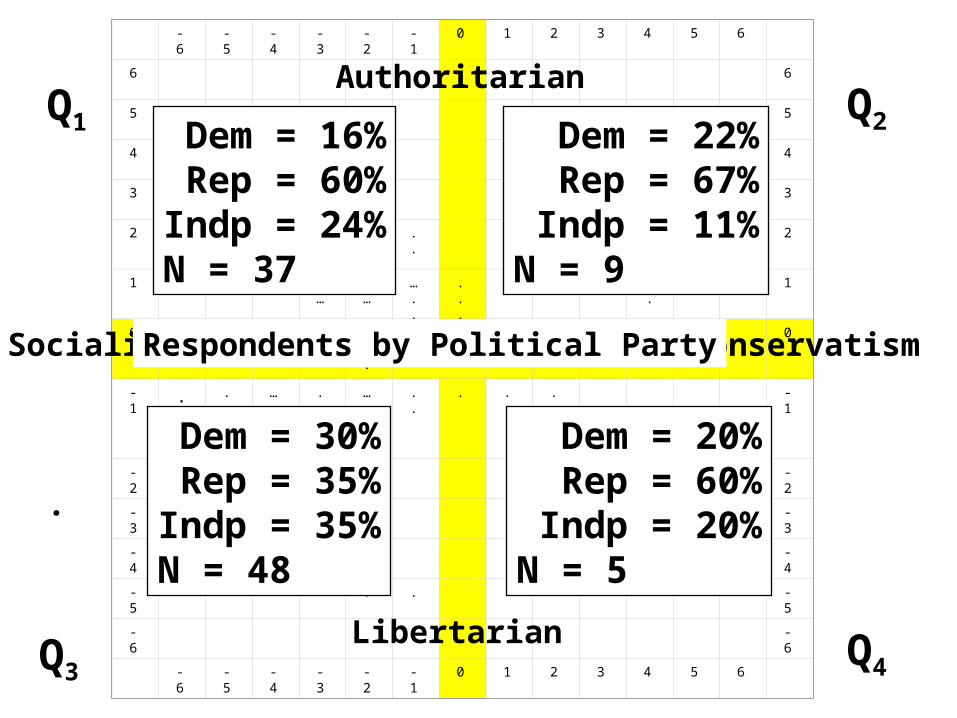
Dem = 16%Rep = 60%
Indp = 24%N = 37
Dem = 22%Rep = 67%
Indp = 11%N = 9
Dem = 20%Rep = 60%
Indp = 20%N = 5
Dem = 30%Rep = 35%
Indp = 35%N = 48
Respondents by Political Party
-6 -5 -4 -3 -2 -1 0 1 2 3 4 5 6
6 6
5 5
4 4
3 . . 3
2 … … .. ... 2
1 … ……
……
…..
... . .. 1
0 ….
….
.….
.…
. 0
-1 . .. …...
.…..….
… .. . .. . -1
-2 . . . . -2
-3 . .. . -3
-4 . -4
-5 . . -5
-6 -6
-6 -5 -4 -3 -2 -1 0 1 2 3 4 5 6
.
Authoritarian
Libertarian
Socialism Conservatism
Q1 Q2
Q4Q3
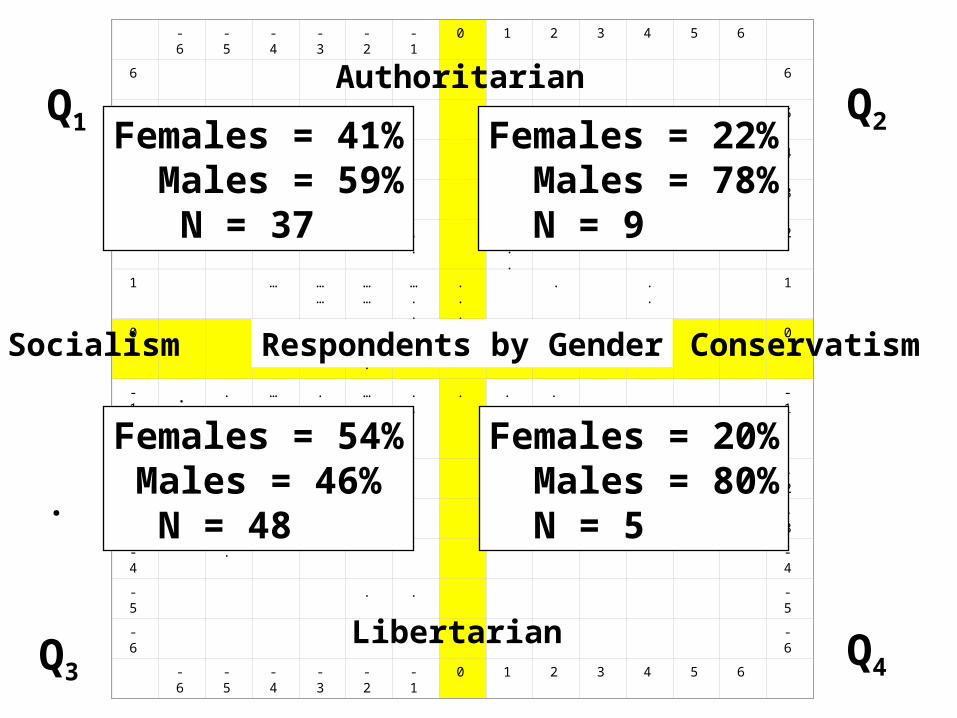
Females = 41%Males = 59%
N = 37
Females = 22%Males = 78%
N = 9
Females = 20%Males = 80%
N = 5
Females = 54%Males = 46%
N = 48
Respondents by Gender
-6 -5 -4 -3 -2 -1 0 1 2 3 4 5 6
6 6
5 5
4 4
3 . . 3
2 … … .. ... 2
1 … ……
……
…..
... . .. 1
0 ….
….
.….
.…
. 0
-1 . .. …...
.…..….
… .. . .. . -1
-2 . . . . -2
-3 . .. . -3
-4 . -4
-5 . . -5
-6 -6
-6 -5 -4 -3 -2 -1 0 1 2 3 4 5 6
.
Authoritarian
Libertarian
Socialism Conservatism
Q1 Q2
Q4Q3
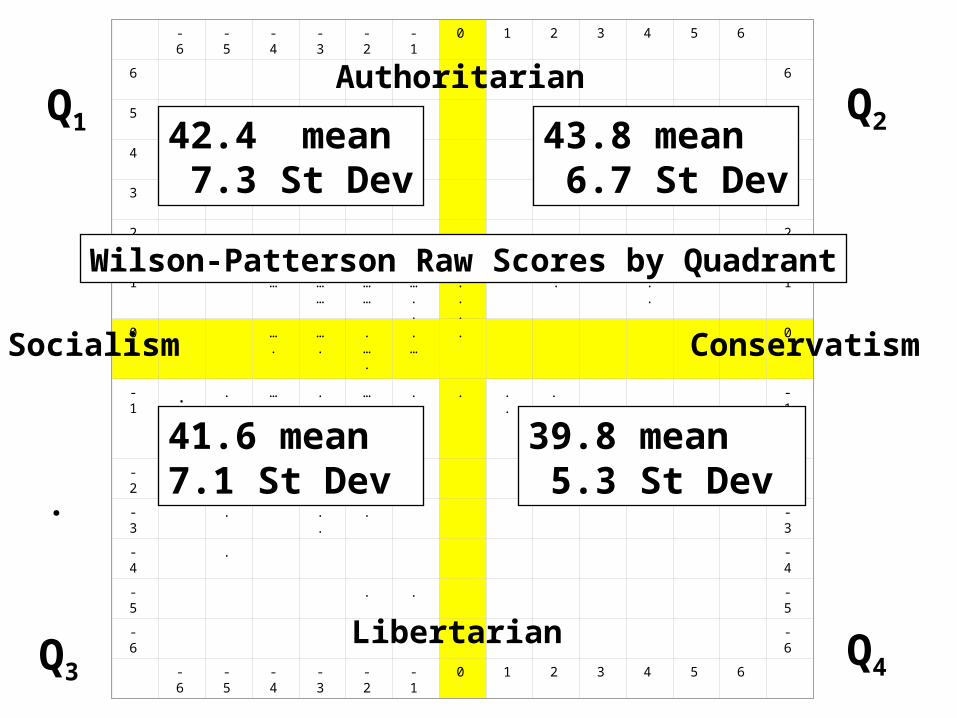
42.4 mean 7.3 St Dev
43.8 mean 6.7 St Dev
39.8 mean 5.3 St Dev
41.6 mean 7.1 St Dev
Wilson-Patterson Raw Scores by Quadrant
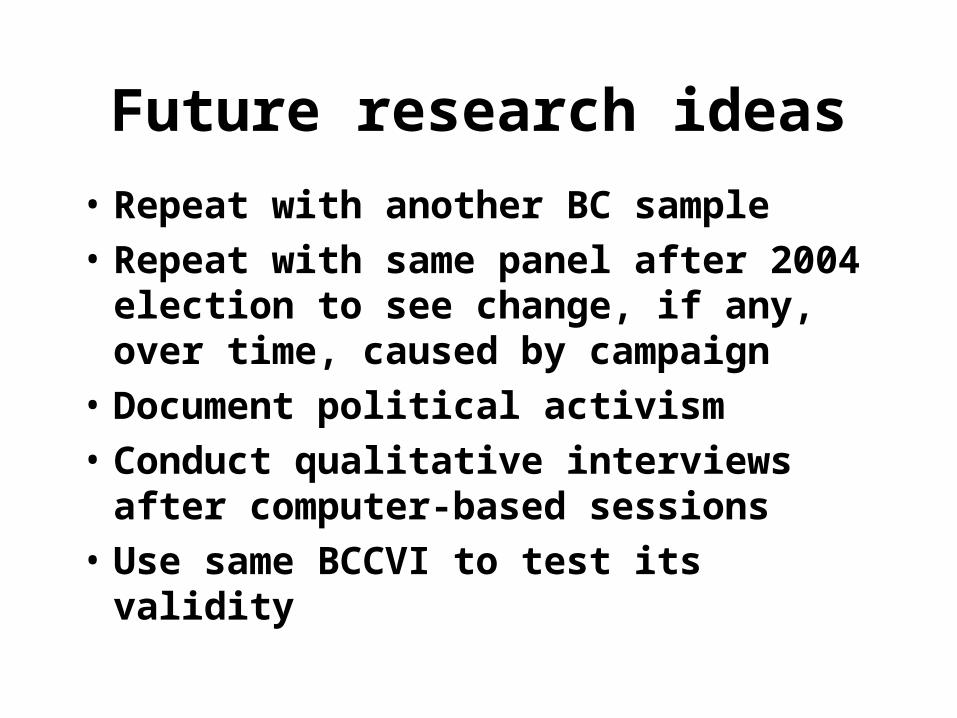
Future research ideas• Repeat with another BC sample• Repeat with same panel after 2004
election to see change, if any, over time, caused by campaign
• Document political activism• Conduct qualitative interviews after
computer-based sessions• Use same BCCVI to test its validity
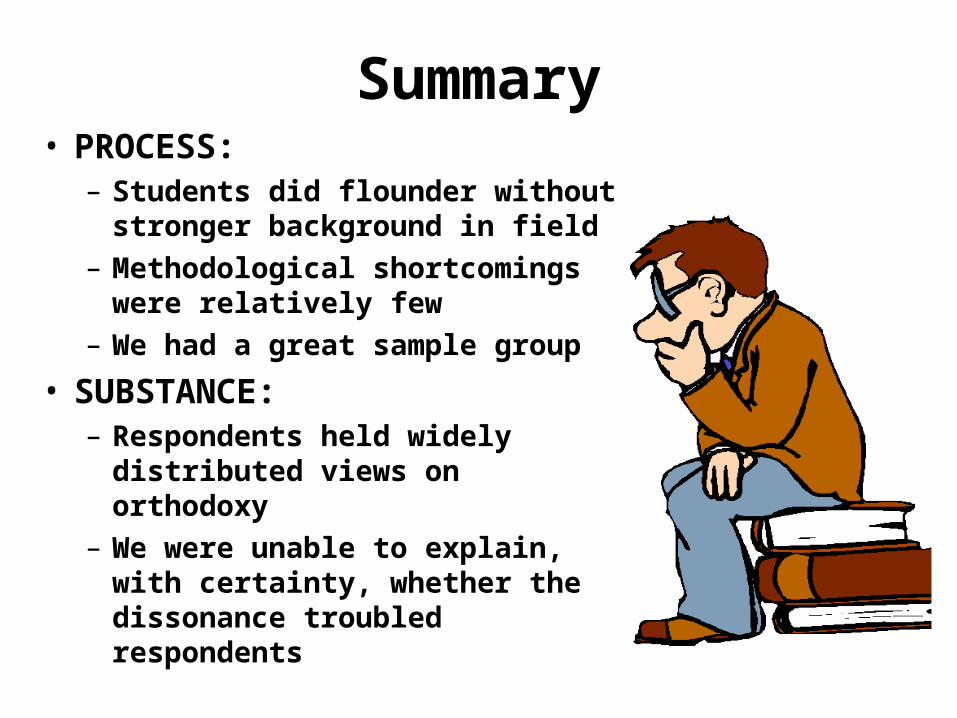
Summary• PROCESS:
– Students did flounder without stronger background in field
– Methodological shortcomings were relatively few
– We had a great sample group
• SUBSTANCE:– Respondents held widely
distributed views on orthodoxy– We were unable to explain,
with certainty, whether the dissonance troubled respondents

Discovery Learning at Benedictine College
Inquiry-based, student-centered & collaborative