discovering morphological similarity in traditional forms ...hannover/mmilab-andre_files/gme.pdf ·...
TRANSCRIPT

DISCOVERING MORPHOLOGICAL SIMILARITY IN TRADITIONALFORMS OF MUSIC
Andre Holzapfel
Institute of Computer Science, FORTH, Greece,and Multimedia Informatics Lab, Computer Science Department, University of Crete
ABSTRACT
In this report, the problem of the analysis of traditional music of the island of Crete is analyzed. Researchresults from musicology are outlined and confronted with the state of the art in music information retrieval.It is clarified that no systematic computational approach for this analysis exists, whereas it could form auseful tool for research in musicology. An analysis method as applied by musicologists is described.After showing the infeasibility of the computational realization of this method, a simplified statisticalapproach is proposed. Some preliminary results confirm the validity of this concept. The musicologicalcharacteristics of the music style under examination is emphasized throughout the text, because to theauthor’s best knowledge, these findings have been brought together for the first time in English language.
1. INTRODUCTION
Throughout the last decade, big progress has been achieved in the field of Music Information Retrieval(MIR). Systems to measure similarity of music have shown success in tasks like artist identification[33][24], or the classification of musical pieces into a certain genre [30][23]. These systems try to de-scribe the signals by using low level spectral descriptors derived from a short time analysis. In order todescribe the rhythmic content of musical signals, the salient periodicities contained in a longer temporalwindow are considered. An overview of different features for dance music classification is given in [12],where the classification of pieces of Ballroom dances is considered. An approach that improves the ro-bustness in presence of large variation in tempo has been proposed in [25].While the mentioned publications all use low level descriptors derived from the signal in order to cat-egorize a piece of music into a class of songs that are considered similar in some way, much work hasbeen done in order to approach the transcription of music. A necessary step when transcribing a pieceof music is the recognition of its meter, i.e. the positions of bars and the estimation of the tempo. In

[28], it is shown that these tasks can be performed in a robust way in music that has percussive content,while difficulties are encountered for music forms like Jazz or Classical music. The authors advise thereader of the difficulty of correctly estimating the position of the first beat of a measure. Furthermore, theestimation of the tempo suffers from doubling and halving, i.e. when a piece has a tempo of F beats perminute (bpm), algorithms often estimate 2F bpm or 0.5F bpm as the tempo.Another necessary step when transcribing a piece of music is the recognition of the succession of notesplayed by each instrument. However, the problem of transcription is only tractable when restricting tomonophonic signals, like described in [9]. The transcription of polyphonic signals make the previousseparation of the instrumental sound sources necessary, which is itself a problem only tractable for verysimple contents [45]. Hence, the automatic transcription of polyphonic music remains the holy grail of theMIR research community. As it will be detailed in the following, in order to achieve an analytic under-standing of the form of a piece of music, its transcription into a musical score is necessary. Consequently,as the transcription task remains unsolved, computational approaches to understanding musical form needto be based on lower level descriptors, as for example the system to detect a chorus in pieces of popularmusic as presented in [18].
To the author’s best knowledge, no computational approach has been proposed to gain informationabout the form of traditional kinds of music in the eastern Mediterranean. This field is of major interestfrom an ethnomusicological point of view, as the various interconnections between the traditional musicof different regions remain unexplored. In [42], the author directs the readers’ attention to this fact. Thevalidity of this assumption can be supported by the findings of the musicologist Samuel Baud-Bovy in [4]as well. In this text, the author divides the traditional forms of music encountered in the Hellenic cultureinto two parts. One is the mountain area of northern Greece, in which musical performance is followingstricter rules of musical form. The islands of Greece, the coast area and the region of Thrace follow,according to the author, a more improvisational character.
Regarding the analysis of musical form, in [41] morphology of music is defined as the methodicaldescription of the structure of the form of musical works. The word is derived from the German word For-menlehre. According to the musicologist Hugo Riemann (1849-1919) [35], the technical and aestheticalanalysis of a musical opus is based on its morphological organization. The elements of this organizationare themes, phrases and motives, which themselves are made up of characteristics of sound like tonalheight, duration, intensity and timbre. The analysis aims at the discovery of the sentence structure (Peri-odenbau, see Section 2.3) and the transformative structure of these elements. This discovery is the coreof morphology. For example, the musicologist Hugo Leichtentritt (1874-1951) emphasizes the antithesisbetween the forms of fuga and sonata, which follow the schemes AA′A′′· and ABA, respectively. By con-sidering the nominal form of an opus, one can locate all the characteristics and particularities of the piece,by examining the causal relations between the form and the particular opus. Another example would be

the analysis of the content of a pop song into chorus and verse and their variations, and analyzing possibledeviations from usual composition schemes for pop songs.
In [42], a method for the analysis of the morphology of traditional Cretan music is proposed. In thismusic, the tunes (skopos) are built from small melodic phrases and they do not have a specific morphologicstructure. This means, that there is no composed elaboration of a theme like for example in a fuga, neitheris there a clear periodic structure, according to that a musical theme is repeated, like the repeating elementof a chorus in popular western music. The author denotes that based upon an automatic morphologicalanalysis of tunes a comprehensive description of traditional dances could be derived. The author usesrecordings that have been done at the IMS/ITE1 and that contain 685 songs of traditional Cretan music.The melody lines of these songs have been transcribed into a musical score containing one staff. Fromthis notation, the motifs (gyrismata) that construct a theme (kontilia, see Section 1.1) are registered. Inorder to capture similarities between themes, the following approach is proposed: for theme i with n
bars, each bar is assigned a two field vector. The first field refers to the number (smaller than i) of apreviously analyzed theme and the second field denotes the bar in this theme which is equal to the barunder consideration. For example, for theme number 100 with four bars a feature vector [33 2 55 2 55 3 0 0]
would denote that the motif in the first bar of theme 100 is the same with the second of theme 33, thesecond and the third the same with the second and the third in theme 55, while the motif in the fourth barhas been found for the first time in this theme. This equals to the learning of an alphabet of motifs for atune under consideration. The author observes that the same motifs are often found in different pieces. Itis observed that in some traditional dances themes of four bar length predominate, while in the dance formPidikto dances themes of two bar length predominate. The author mentions that this way of numberingmotifs and the methodology of morphological analysis can be applied to music of the same region, forexample for the tunes Sousta or Pentozalis. But also melodies from the Dodekanes, Kyklades, or fromThrace, Macedonia or Epirus could be examined with this method. The extensibility of this approach hasalso been underlined by Amargianakis in [2], and is supported by the relations described by Baud-Bovyin [4], as mentioned earlier. Further extensions could include regions of Turkey as well. At least theclose cultural connection of Greek and Ottoman/Turkish culture suggest extensibility in this direction. Forexample, the urban form of Greek Rembetiko music makes use of melody lines that follow musical scales,which are similar in name and tonal steps to scales of Turkish music. Nevertheless, efforts towards thisdirection are complicated by the fact, that almost all available publications on Turkish traditional formsof music are in Turkish language. Thus, examination of these relationships will have to be postponed toa future collaboration with Turkish experts. Relations to music of Bulgaria and the states of the formerYugoslavia can be assumed as well, because in [4], page 30, a relation at least between the ballads of theseregions and some regions of Greece is observed.
1http://ims.forth.gr

At this point, it has to be clarified that the goal of this work is not the achievement of research resultsin ethnomusicology, but the development of computational tools that make such a musicological researchfeasible for experts. As mentioned in [42], it is a major effort to transcribe and analyze a big numberof pieces. The goal is to derive at least some conclusions in an automatic way. The complexity of thetask will be subject of Section 2, where the computational difficulties will be explained as well as thedifficulties an expert in musical studies faces when transcribing music. Because of these difficulties, inSection 3 a framework for estimating the morphological similarity of two pieces of music is proposed thatis based on statistical description of rhythmic and melodic characteristics of the pieces. Section 4 givessome preliminary results. Section 5 proposes user interfaces and a possible improvement of the proposedapproach. At first, in Section 1.1, some details of the musical subject under examination are given.
1.1. Cretan Traditional Music
As mentioned in the Introduction, the form of Cretan traditional music consists of small melodic phrases,and their arrangement does not follow a specific morphological structure. This has been observed earlieron in a text by Samuel Baud-Bovy ([5], page 175), where it is stated that in general most of Greek folkdances are made up of collocating small instrumental figures. In Greek language, in context of Cretantraditional music at least, these figures are called kontilies. In a musicological context these kind of figureshave been referred to as Spielfiguren in [6]. The different types of dances in Crete are characterized by analphabet of these kontilies. Exploring this alphabet by the method applied in [42] was the suggestion ofAmargianakis in [2]. It has to be noted that in [42] only one type of dance has been investigated, while forthe other dances such a study has not been done on a large scale, yet. It has been reported that in traditionalfolk music of different regions [32][3] performances of the same piece of music vary strongly in tempo.These tempo differences appear when comparing two separate performances, but even within the sameperformance throughout the duration of the piece. The variability between the performances of the sametune affects the melody as well, as can be proved by the observation done by Amargianakis in [2], page36, that a kontilia is rarely played two times in exactly the same way. Clearly, this variability makes ananalysis of this music a difficult task.Regarding their rhythmic properties, all traditional dances from the Greek islands share the property ofhaving a 2
4time signature ([4],page 32). Dances encountered on the islands that do not have this property
are considered as imported by the local population, e.g. the Kalamatianos (78), the Zeimbekiko (9
4) and
the Karsirlamas (98). For evaluation of the method as proposed in Section 3, a set of samples of Cretan
dances has been compiled by the author. This dataset contains six dances commonly encountered in theisland of Crete: Kalamatianos, Siganos, Maleviziotis, Pentozalis, Sousta and Kritikos Syrtos. The datasetwill be referred to as D1. Each class contains either fifteen or sixteen instrumental song excerpts of aboutten seconds length. As depicted in Table 1 their inner class variances in tempo are much larger than thoseusually encountered in western Ballroom dances, see [21]. In [21] on average the tempo of pieces in thesame class does not show a difference of more than 16 bpm. Further insight can be gained by modelling
the tempo values of the classes with Gaussian distributions. As will be shown in Section 2, the estimationof the tempo of a piece usually suffers from tempo halving and doubling errors. Taking this into account,Gouyon ([21]) shows that still at each tempo value, only two different dance styles in a dataset of Ballroomdances have high density values, thus making a classification based on their tempo estimation feasible. Forthe compiled set of Cretan music, the analog plots to Figures 1 and 2 from [21] are depicted in the upperpart of Figure 1 without considering doubling and halving errors, and in the lower part of Figure 1 withtaking these error types into account. It can be concluded that based on tempo estimation, only the danceSiganos can be separated from the other dances, while for each of the other dances, there is a significantoverlap of the tempo distribution with two other dances. This is the case, even though the number ofdance styles is six and not eight as in [21]. All depicted tempi are the rates of the quarter note. Notethat all dances in the dataset follow a 2
4meter, only Kalamatianos as a dance originating from a different
part of Greece has a 78
rhythm. Most of the pieces contain only two kinds of string instruments, whilepercussive instruments are not contained in most samples. This absence of percussive instruments makesa description of rhythm more difficult, as the onset energies are less peaky. The orchestral setup in datasetD1 is characteristical for the most common setup in Cretan music throughout the recent decades, whichconsists of Cretan lyra or violin accompanied by two Cretan lutes or one Cretan lute and one guitar. TheCretan lute is a string instrument with four double strings that is played with a pick. The Cretan lyra isa string instrument as well, which usually has three strings and is played with a bow. Like in most otherGreek islands, in the area of the city Chania there is a strong tradition of using a violin instead of lyra.
Table 1. Tempi of D2 (Traditional Dances)Dance Tempo Range (♩)
Kalamatianos 116-142Siganos 93-103
Maleviziotis 132-160Pentozalis 123-182
Sousta 111-136Kritikos Syrtos 58-79
From a musicological point of view, the length of the excerpts in dataset D1 is sufficient to classifythe pieces, as in the given duration at least one kontilia will be contained. Furthermore, it is interesting tonote that the dances seem to group into three different tempo classes. According to [34], Kritikos Syrtosand Siganos should be related to movement of circular shape, Kalamatianos and Sousta to expressingmovements of excitement and Maleviziotis and Pentozalis to smaller movements at a high repetition rate.Indeed, these descriptions fit the movements of the particular dances very well.Using the described dataset, preliminary listening tests have been conducted to evaluate the ability of alistener to correctly categorize the dances. Six subjects were asked to classify each piece in the dataset

50 100 150 2000
0.02
0.04
0.06
0.08
Quarter notes per minute
KalamatianoSiganosMalebiziotisPentozalisSoustaSyrtos Kritikos
No tempo doubling/halving errors
20 40 60 80 100 120 140 160 1800
0.01
0.02
0.03
0.04
0.05
0.06
Quarter notes per minute
Assuming tempo halving/doubling errors
Fig. 1. Tempi of the sample dataset modelled by Gaussian distributions
after listening to it one time. All subjects are dancers familiar with each of the dances. The averagecorrect classification per class and overall is depicted in Table 2. It can be seen that some of the classesare particularly difficult and the overall accuracy is far from being perfect.
Table 2. Listeners’ Mean Classification AccuraciesKal. Sig. Mal. Pen. Sous. Chan. Mean93.3 88.9 79.2 45.6 58.3 88.5 75.6
2. PROBLEMS OF COMPUTATIONAL MORPHOLOGICAL ANALYSIS
Regarding the characteristics of traditional music of Crete as described in Section 1.1, it appears reasonableto propose the implementation of a computational analysis method, that performs an analysis as describedin [42]. Such a system would include the automatic transcription of the melody lines contained in thesamples, followed by the morphological analysis as outlined in the Introduction. In this Section, theinfeasibility of such an approach is shown. For these purposes, the three subjects transcription, meter

analysis and sentence structure analysis are picked up. For these subjects, the current state of the art inMIR is contrasted with the demands of the task at hand.
2.1. Transcription
The term transcription of music can refer to different kinds of matters. In this text, transcription will beunderstood as the process of transferring music as a sound event into the symbolic form of a score [40]. Inwestern music the score usually contains a number of staves, one for each timbre present in the piece. Thecomplexity of this problem, for an algorithmic approach but to a certain extend also for a human being,depends on the complexity of the musical sound event that we want to transcribe. The state of the art inMIR will be outlined by referring to [27], leading to the conclusion that current systems deal fairly wellwith monophonic signals but face difficulties on polyphonic inputs. However, even for the human expert,transcription can be a matter of high complexity. These problems gained importance with the possibilityof recording musical performances, because it became possible to do field recordings of improvised musicthat has never been written in a score. In [40], the problems for musicologists in this context have been de-scribed in detail, an this publication shall be outlined to clarify the existant gap between the state of the artin MIR and the demands of the musical signals that will be considered in this report. The problem of tran-scription in ethnomusicology origins from the fact that a big part of the musical heritage is being passedfrom one generation to the next in oral form. A scientific investigation of these forms of music makes theirtranscription necessary. For this, the impact of progress in recording and analysis technology has been veryimportant throughout the last century ([40],p.205): Before the availability of sound recording techniques,a transcription had to be done either immediately when listening to a piece, or afterwards by transcribingfrom memory. This introduced a high grade of simplification and insecurity into the transcription. With thedevelopment of recording techniques, also complex styles of music could be transcripted, and the validityof the result could be evaluated by referring to the sound source ([40],p.207). One of the first musicologistswho observed the problem of notating music, which origins from other countries but Europe, was ErichMoritz von Hornbostel, who suggested standard annotations for transcribing exotic melodies into a stave[1] ([40],p.209). It can be observed that many of these notational problems also appear for the traditionalmusic of Crete. This can be proved by examining the transcriptions of Samuel Baud-Bovy in [5], wherefor example in transcription 53 of the dance tune Syrtos rethymniotikos many of these annotations appearthat indicate deviations in pitch from the notes as written in the score. The process of transcription is aprocess of abstraction, which transforms from a sensory to a rational field of cognition. This transitiondoes not completely transform the acoustic content, or better the perceived content, to the symbolic rep-resentation in the score. This is due to the limited expressiveness of the notational system, but also tothe difficulty of transforming a complex psychophysical process into a musical score ([40],p.210). Thisprocess is necessarily subjective, in opposition of the object related optical perception. This oppositionis referred to as bipolarity of the sensory functions. Compared to the transcription of spoken text, thetranscription of music is much more demanding, even though the process is similar. This is because the

diversity of the means and methods used for the production of music is much larger than those for theproduction of speech ([40],p.211). As well, the criteria for differentiating in phonological, morphologicaland syntactical levels, are much more immanent in speech, and much more sparse in music. Because ofthat, there is no existing symbolic system applicable to all different kinds of music, like it exists for speechby for example phonetic annotation ([40],p.211).In ([40],p.212) the author compares the process of transcription with a communication channel. The sourceis the musician and the receiver is the transcriber. In order for this channel to work without big loss, it isnot enough to establish an acoustic connection between source and receiver, but also to have a commoncodebook of musical norms and rules, such as scales and rhythmic patterns. The transcription can then beexpressed as the transcoding into another code, which is improved when the communication code betweensource and receiver is well understood by the receiver.Because of the high subjectivity of the transcription process, two transcriptions of the same piece by twoauthors are very unlikely to be exactly the same ([40],p.213). This has been examined in [31] as well.There, problems appeared more often in the annotation of duration than in the annotation of pitch, es-pecially when no clear reference beat was present. Nevertheless, the experiments in [31] resulted in atleast equivalent transcriptions in most cases. This variability can be considered as an equivalent to thevariability in the interpretations of a piece of classical music. Here the order of notation and performanceis exactly opposite, and thus the variability due to the subject happens in the performance ([40],p.214).Another source of variation in the transcriptions is mentioned to be the intention of the transcriber: whenintending to describe the general form of a piece, a small amount of details of the performance needs to betranscribed, while when emphasize is put on the personal style of a player, each ornament can be of impor-tance. However, the decision on what is an important detail is difficult and demands a familiarity with theexamined musical culture. Furthermore, it must not be forgotten, that the piece to be transcribed is alwaysjust a snapshot of a socio-cultural development. As such, one must be careful in over-interpreting details,and if possible, a big number of performances has to be considered in order to draw valid conclusions.This is very time demanding for a human subject, and indicates an advantage of applying computationalmethods in this fields of research.In order to capture all details considered important, four different approaches are mentioned ([40],p.215):
1. The enhancement of the notational system, by using accents to indicate a deviation from the pitchprescribed by the note. There have been many different proposals to do such annotations, with littleeffort to form some kind of standard. Nevertheless, indicators like ↓or ↑ over the affected note toindicate a slight decreased/increased pitch are common. Also for rhythmic deviations, there aredifferent kinds of annotations available.
2. Technical analysis methods, which e.g. enable to replace the arrow symbols by exact values of howmany cent deviation a note has. These method were restricted until recently to analysis of physical-acoustical processes, whereas only recently based on the research of Bregman [8] also the cognitiveprocess of auditory scene analysis has been tried to include into a melodic analysis [13].

3. Different notational systems, which make sense especially when the examined music differs stronglyfrom European norms. Besides notational systems adapted to the particular culture, also the verbaldescription of the music plays an important role here.
4. Improved recording systems, such as multichannel recordings or parallel video capturing.
In the following, Stockmann lists some important conditions and procedures for a meaningful transcriptionresult. Note that a part of these clues holds as well for computational approaches of the transcription ofmusic, as we will see in the summary of the paper by Klapuri [27]. At first, the tonal extension of aninstrument must be known. Also, it is helpful if the transcriber is familiar with playing the instrument.In performances with multiple voices, the exact number, position and timbres should be known. Theprocedure of a transcription process is in general as follows:
1. Establishing a general structure, e.g. A-B-A-B’...
2. Choosing a characteristic starting point for transcribing, which is typically NOT the beginning.
3. Which is the tonal extension, which is the general morphology and metric structure
4. Pitch annotation:
(a) determining the central tone
(b) determine the transposition
(c) determine the key
(d) preliminary melody annotation
5. Determination of durations
6. Determination of structure:
(a) finding verses, pauses, accents;
(b) setting the bars
7. Analysis of performance characteristics
(a) Ornaments, dynamics, register changes etc.
(b) Decision if these elements are assigned to the performer or the structure of the music performed
Thus, in general, at first central items are clarified and a structure is build up, which is then in a top downapproach filled with details.Contrasted with the transcription from a musicological point of view, in [27] Klapuri gives an overview ofthe transcription task as it is approached in Music Information Retrieval. Here, the task is constrained to

the transformation of harmonic sounds from the acoustic domain to a symbolic description like the MIDInote format. Thus, the pitch annotation task is simplified, because no decision about the musical key ortranspositions of the score annotation has to be made. In the paper, Klapuri refers to transcription as thedetection of the recipe of a piece of music, as he considers only music that has been composed in writtenform before performing. Even though the author mentions the application of musicological analysis ofimprovised music, no further comment about the differing demands of this task is made. It has to benoted, that in general these problematics have not been addressed systematically by computer scienceyet. Similar to Stockmann, also Klapuri points out the similarity to the task of speech recognition, whiledenoting that transcription of music has not received comparable interest, yet. The transcription of musicby computational means is mentioned to be feasible only when constraining sounds regarding polyphonyand instrumental timbres. However, even the transcription of a single singing voice is not perfectlypossible, with the difficulty consisting in assigning an estimated pitch to a note value. Klapuri dividesthe transcription problem into a multiple fundamental frequency (F0) estimation task and a rhythmicparsing task. While physiological representations in the human ear are mentioned, the highly subjectiveaspect of transcription as mentioned by Stockmann remains unobserved by the author. The systems thatrepresent the state of the art, are mostly pure signal processing systems, musicological knowledge aboutmorphologies has not been included in any way to such systems. In many approaches for the multiple F0analysis, a sinusoidal model [38] is used for representing the tonal components of a signal which are thengrouped into streams based on the principles of Auditory Scene Analysis [8]. These principles includeparameters like common onsets and modulations of components and frequency proximity. As will bedetailed in Section 3.1, also the system described in this text will make use of such a multiple F0 analysis.Regarding the rhythmic parsing task, Klapuri points out the importance of regular accents and stresses forthe analysis of the meter structure, like it was shown by Stockmann as well. As the author presented astate of the art system to tackle the problem of beat detection in the MIREX 2006 beat detection contest,this system will be outlined in Section 2.2.Summing up, the author states that the problem of transcribing polyphonic music is far from being solved.He suggests the automatic generation of music in order to train transcription systems. I has to be noted,that he assigns the difficulty of the task in the combination of multiple sources, while he assumes that eachof the sources has a complexity smaller than those of speech sounds. This assumption clearly contradictswith the findings from musicology as documented by Stockmann, which assign the higher complexity tothe sound elements in music.
Concluding the summaries, it has to be stated that transcription of music is in general not tractableusing computational approaches. Apart from the difficulties already observed in the MIR community, theconfrontation of two important publications from the fields of MIR and musicology sheds light on thefollowing facts:
• Transcription of traditional music is more complex due to its non-written character

• Part of the complexity of the transcription task is due to the best possible presentation in a staff, notjust as a MIDI note
• Transcription is difficult not only because it has high demands in terms of signal processing, but alsobecause it is a highly subjective process
• There is a disagreement concerning the complexity of the elementary sounds encountered in musicand speech
Due to these conclusions, in Sections 2.2 and 2.3, we will constrain the task of transcription to two sub-tasks: meter estimation and sentence structure estimation.
2.2. Meter Analysis
As mentioned in [27], the analysis of musical meter is part of the musical transcription process, and it ismentioned to be easier tractable than the problem of multiple F0 estimation. As has been documented inSection 2.1, in order to determine the form of a piece of music, its temporal structure has to be divided intomusical frames. For this, the time signature of the piece has to be determined. For example, possible timesignatures are 4
4and 9
8. The first signature defines a measure as the time duration that contains four quarter
notes, while the latter defines a measure as the duration containing nine eighth notes. Usually, a musicalsignal is analyzed and the most salient period appearing in the signal is used to estimate the tempo of thepiece, i.e. the frequency of the quarter notes in a n
4meter or the frequency of eighth note in a n
8meter. As
it will be shown by lining out a state of the art approach [28], these problems are difficult to solve, whendealing with audio signals of polyphonic music.In the publication [28] Klapuri et. al. propose a system for the analysis of musical meter, which is alsoreferred to as rhythmic parsing by the authors. Meter is described by pulses on three levels, which is alsoshown in Figure 2:
1. Tatum: short form for temporal atom, the shortest rhythmic period persent in the signal. The othertwo descriptors are multiples of the tatum.
2. Tactus: the tempo of a piece, i.e. given a 44
time signature, a tempo of 120 bpm refers to a tactuspulse that represents a series of 120 quarter notes without pauses in between.
3. Measure: a pulse with beats at the time instances of the beginning of a musical measure. Measureand tactus together imply the time signature, i.e. in Figure 2 every fifth tactus beat coincides with ameasure beat. Thus the time signature is either 4
4or 4
8.
The first step of the approach proposed in [28] is the computation of a power spectrum with b = 1...b0
critical bands, and b0 = 36. In each of the bands, from the coefficients xb(k) at analysis frame k a measureof the spectral change is computed by d
dtxb(k)/xb(k). The spectral change is then filtered to emphasize

Fig. 2. Waveform of a piece of music, with pulses that describe the meter, from [28]
the moments of onset. By summing nine neighboring bands, four bandwise accent function in differentfrequency regions are computed. These accent functions are then used as inputs to combfilter resonators,which are characterized by delays in a range of up to four seconds, resulting in four vectors of resonatoroutput values, one for each bandwise accent function. These are then summed up to a descriptor, that is,similar to a autocorrelation, a function of the resonator delays. A discrete power spectrum of this descrip-tor is estimated. The period estimation is performed using a hidden Markov model (HMM), that has thesepower spectra as observed instances. In doing so, the period estimation is more robust and is providedfrom frequent big changes. The tatum, tactus and measure pulse periods are the hidden states of a model.After the period estimation, the phase estimation is based on the periods, and makes use of HMM as well.In the experiments performed in the paper, the tactus is estimated correctly in about 80% of the cases,when doubling or halving errors are accepted. If this is not the case, the accuracy decreases to 64%. Themeasure estimation suffers additionally from phase errors, that equals to insecurity about the position ofthe first time instance of a musical measure. The accuracy of the measure estimation is 55%, when accept-ing doubling and halving errors, and 47% when these errors are not accepted. It is worth to note that theproposed method performed best in tempo estimation at the MIREX 2006 Beat tracking contest, and wasonly one per cent behind the best performing system for the positioning of the tactus pulses.Hence, using a method like proposed in [28] for the estimation of measures in the framework of a mor-phological analysis is very likely to introduce errors, because the estimations are not sufficiently reliable.Furthermore, when examining traditional forms of music, one is often confronted with forms of musicwithout clear meter, see [40], pages 218-219. Concerning Cretan music, it has been stated in [5] thatmany traditional songs follow a scheme that is referred to as stable syllabic two-cycle (giusto syllabiquebichrone,[7]). In this system, a syllable is connected to a single note, and the durations of the notes cantake two values, either full or half time. In these songs there is no time signature and doted bar lines aredenoted in the staff wherever the recitation implies a break. Even in Cretan dances, there is some ambi-guity immanent to the particular dance of Kritikos Syrtos: Baud-Bovy mentions in [5], page 178, that dueto the low range of tempo of this dance in comparison to other dances, it is often transcribed with notesof double value. This can be considered as a mistake, as it results in melodic phrases of double length.This means that a correct recognition of the tempo of this dance implies an understanding of the thematic

structure of the piece. This understanding is impossible for a meter analysis system as described in [28].
2.3. Sentence structure
The term sentence structure2 has been coined by Heinrich Christoph Koch [29], who considers melodies astonal speech, consisting of sentences, sentence structure and breaks. The term sentence structure refers tothe arrangement of sentences (or movements) within a musical opus. For example in the Viennese periodof classical music, a symphony consisted of four sentences with certain characteristics. In the context ofpopular music, the succession of verse and chorus parts can be interpreted as the sentence structure ofa piece. Even without the feasibility of an exact meter analysis or a correct transcription into a score,there have been tries to get some information about the sentence structure of a piece of music. In [18],a system is presented that aims at localizing a chorus in a piece of music. It makes use of two kinds oflow level spectral descriptors: Mel frequency Cepstral coefficients (MFCC) [10] and chroma features.Chroma features use a discrete Fourier transform and group coefficients to twelve pitch classes C, C],D,..., B. In [18], both the chroma feature vectors and MFCC have 12 dimensions. They are calculatedin a beat synchronous way, using the estimation of the tactus obtained from an approach presented bythe author in [37]. Thus, the analysis window is adjusted according to the beat positions, and a singlevector representation is obtained by computing the average vector throughout one beat segment. Then twosimilarity matrices are obtained by computing Euclidean distances at all beat synchronous time instancesof the signal. After applying image processing filters that sharpen vertical lines in the chroma baseddistance matrix, the two matrices are linearly combined. In the resulting self distance matrix, vertical linesare detected, because they represent sequences at different time instances that are very similar and thus areconsidered candidates for chorus parts. These candidates are then selected or sorted out based on criteriaregarding length and temporal proximity. One criterion is the expected position of a first chorus in a song,and thus takes into account some estimation of the typical morphology of a pop song. Also some criteriaare presented for the ideal relations of the positioning of the chosen segments within the matrix. The finalpropability of a segment in a matrix to represent a chorus is again a linear combination of the differentcriteria. The exact start and end times of the chorus are then determined based on the assumption that thetime signature is typically 4
4, and a chorus has a length of either 16 or 32 measures. The presented method
detects chorus segments correctly in 86% of the cases (F-measure), using 206 pop songs as a basis.Even though the method presented in [18] has been evaluated only for popular music, it could be appliedto traditional music of Crete as well. Note that as discussed in Section 1.1, this music does not havethe same morphology as popular music. Especially, there is nothing like a chorus in this kind of music.Nevertheless, in might be worth to examine if the successive melodic patterns (kontilies) in a piece resultin vertical structures in the self similarity matrix, that might enable to estimate start and end points of thoseelements. However, it is believed by the author that the detection of the temporal ranges of a kontilia inCretan music is by far more difficult than the detection of a chorus in pop music for the following regions:
2translation of the German term Periodenbau

in pop music a chorus differs from other parts by a rise in signal energy, by the introduction of additionaltimbres, such as backing vocals, and a melody line which is aimed to be “catchy”. All these points do nothold for transitions between kontilies. As well, the length of a kontilia is much shorter, typically four ortwo measures in a 2
4time signature, and a performance usually contains a wide range of different kontilies
and their transformations, which will result in a much less obvious structure of the self similarity matrix.On the other hand, the beat synchronous melodic analysis has been shown to improve melodic similaritymeasures from a mixture in [17] as well. Because of that the introduction of beat synchronous processingwill be proposed in Section 5.
Summing up, it has to be concluded that a computational approach to perform the analysis as describedin [42] is not possible, and will stay an open problem for a longer time, if not forever. Nevertheless, inSection 3 a simplified method is proposed, that will enable researchers to detect morphological similaritiesin traditional music that follows the form as described in [42], without the necessity to estimate meterpulses or multiple F0 values.
3. STATISTICAL APPROACH
In this Section, the possibilities of a system will be outlined, that estimates morphological similaritieswithout relying on meter estimations or any kind of transcriptions to a music score. A concept of sucha system works according to the steps as depicted in Figure 3. The first step is an algorithm for melody
ANALYSISRHYTHM
MELODYANALYSIS
DIST
DIST
BPM
INTERVAL
MELODYCONTOUR
DBwav D
Fig. 3. Schematic of the proposed statistical morphological analysis system
extraction. The best performing algorithm in the MIREX 2005 Melody Extraction Contest will be used.This algorithm is described in Section 3.1, and was presented in [13]. Note that in the context of theapplication on a collection of traditional music the following assumption can be made:
1. The number of types of instruments contained in the mixture is given. This is normally the case, asin a collection of field recordings in ethnomusicological context, for each recording the musicians

have been registered. Thus, using this available information, the problem can be simplified.
2. The type of instrument playing the leading melody line is given. In Cretan music nowadays thisinstruments is usually the lyra, a string instrument played with a bow, or the violin. This dependsbasically on the region of Crete, were the recording comes from, see Section 1.1.
In the case of the melody contour extraction algorithm of [13] these assumptions can be used to limitthe frequency range in which the melody contour is searched for, see Section 3.1 for details. As thefollowing steps of the analysis depend on the quality of the extraction, the applicability of the melodycontour extraction in the presented context will have to be a matter of evaluation. In the following, theanalysis is twisted into two parts: one part for melody analysis, and one part for rhythm analysis. Themelody analysis computes a histogram of the tonal intervals present in the sound event, and is describedin more detail in Section 3.2. The rhythm analysis computes the periodicities present in the signal in afrequency range from about 40 bpm until 1000 bpm. These periodicities are described by a periodicityspectrum. This computation is described in Section 3.3. Assuming that for a collection of sound events,all melody histograms and periodicity spectra have been computed and collected in the database DB, thedistances of the melody histogram and the periodicity spectra of a new sound event to all the sound eventdescriptors in DB can be computed. This results in two distance matrices, which will be linearly combinedafter weighting each matrix according to emphasizing rhythmic or melodic content. The suitable distancemetrics and estimators are introduced in Section 3.4.
Note that the analysis method depicted in Figure 3 represents a simplification of the analysis performedin [42]. This is due to the infeasibility of the transcription and meter analysis task, that would be necessaryin order to perform this analysis. The comparison of the results achieved by such a simplified analysiswith the analysis presented in [42] is one of the central items of evaluation. For this either the results in[42] can be taken as a reference. Another possibility is the evaluation on a data set consisting of differentforms of dances, like the dataset described in Section 1.1. This makes sense as the dances differ widelyin the repertoire of melodic patterns [42]. An advantage of the proposed method is its robustness to smalldifferences between two performances of the same piece. This is of importance for the type of musicencountered in Crete, because as mentioned in Section 1.1, a kontilia is rarely played two times in exactlythe same way, which makes this robustness necessary.
3.1. Melody Contour Extraction
For the extraction of the melody contour from a mixture, the algorithm presented in [13] is planned to beevaluated as a starting point. This algorithm performed best in the melody extraction task in the MIREXcontest 20053. First, it computes a multi resolution spectrogram using Short Time Fourier Transformswith different numbers of zero padding [14]. Then the phase vocoder method [19] is applied to estimate
3http://www.music-ir.org/mirex2005/index.php/Audio Melody Extraction
the instantaneous frequency. In the following, the sinusoidal components in the signal are estimated by asinusoidal plus noise model [38]. The noise is ignored and considered unimportant for the formation ofthe melody. After psychoacoustic weighting, the prominent pitches are estimated from the amplitudes andinstantaneous frequencies of the components. The pitches in the single analysis frames are then groupedaccording to aspects of auditory scene analysis [8], like spectral proximity and continuity. Then from allformed streams, one stream is chosen by concerning its length, tonal extension and amplitude.It has to be noted that even though the approach performed best in the MIREX melody extraction contest,its accuracy reached only about 71% of correctly estimated pitches. It is mentioned by the authors that thealgorithm performs worse in the presence of dense spectra, which happen for example for Rock music,while it is robust against noise due to the sinusoidal modeling. It has to be evaluated how well the approachworks in the framework proposed in this report. In the first step an evaluation version of the algorithmpresented in [13] is planned to be used, that is going to be available as an executable program. Becauseof that, provided that the method shows some reasonable success, it has to be implemented by the author.Note that it might be considered as well to simplify the algorithm by leaving out the final stream selectionstep. The methods for the examination of the tonal intervals in the following steps of the method proposedin this report could work on this multiple streams as well. It makes sense to take into account the frequencyrange of the lead instrument, which is usually the lyra. This would exclude some candidates of these mul-tiple streams. Furthermore, the usage of instrument models as suggested in [15] is desirable, because thesemodels enable to focus on searching melody lines played by a particular instrument. However, the trainingof such models demands the availability of a sample data base of the instruments to be modelled. Thecollection of such a database is very time consuming, as it has to contain a variety of instruments, eachplayed at all available pitches with different dynamics. A reasonable compromise could be using a violindatabase, because the violin has a timbre that is similar to that of the lyra.As depicted in Figure 3, the melody contour extraction is a preprocessing step not only for the melody, butalso for the rhythm analysis. This is because of the assumption that both melodic and rhythmic character-istics of the lead melody, the kontilia, are the most salient descriptors for the piece of music. Nevertheless,throughout the following Sections the rhythm descriptors are derived immediately from the signal, becausethese procedures have been already implemented. This way, some results of the rhythm analysis can beshown in this early stage of the work.
3.2. Melody Analysis
For melody analysis an approach motivated by [44] will be used. Taking the extracted melody contour asan input, it is straight forward to compute the MIDI note number from a given frequency. This equals to theright side expression in (1), rounded to the closest integer number. Here, this rounding equals to ignoringtonal steps smaller than a half note, that could result from a glissando between two analysis frames, fromthe usage of a musical scale, that does not follow the well tempered system, but also from undesiredvariability in the artists’ performance. It is possible to introduce a design parameter at this point: the Midi

note resolution σ, that specifies how many quantization steps we would like to have for two semitones.This results in the natural numbers of the usual midi note scale when set to the value 2, and results inarbitrary smaller steps for σ > 2. For example, setting this value to 9 would make following melodyanalysis capable of describing Turkish or Arabic scales, that divide two semitones in nine commas [39].Also Epiros, a mountain areas in the Greek mainland, traditional music uses scales that are not constructedusing semitones ([4], page 39).
n = 12 log2
f
440+ 69 (1)
Having the melody contours in the form of MIDI note numbers would make it possible to follow theapproach proposed in [44], by generating pitch histograms that depict, how often certain pitches appearin a sound event. Before quantizing the synchronous pitch values into σ bins per major second, it isconsidered to be meaningful to compensate for the sound event being slightly out of tune. For this, onemight consider first constructing a pitch histograms with a high number σ of bins per major second, say10 to 20, and then shifting the histogram in order to have the most salient peaks aligned with pitchescorresponding to notes of the well tempered system. This step compensates for players in a concertperformance being not properly tuned, or for the pitch deviation resulting from an analogue recordingplayed at a slightly wrong speed. The usage of folded histogram representations should be evaluated, ascomputed by
c = n mod 12 (2)
that represent the MIDI note numbers folded onto an octave range. The representation as a cycle of fifthas computed by
c′ = (7× c) mod 12 (3)
results in a representation that maps common intervals closer to each other, such as fifths and fourth inter-vals. It has to be evaluated as well. Note that the description of melodic characteristics using histogramsas that denoted in (2), has many similarities with the chroma features used in [18] and [17].The findings in [5] support the usage of histograms, because it is stated that the different traditional formsof music, at least in the island of Crete, differ in their melodic extension and in the width of the tonalsteps. As an example, the dance Pentozalis is mentioned to contain melodic phrases of a tonal range nomore than a sixth. A difference between the melodic phrases of the dances Kritikos Syrtos and Pentozalisis that Kritikos Syrtos often contains melodic phrases following scales with augmented seconds, whilethis is rarely the case for Pentozalis (see [5], pages 178 and 183).
3.3. Rhythm Analysis
The first step in computing the periodicity spectra is a computation of an onset strength signal, using thesame method and parameters as used by Dan Ellis in the MIREX 2006 beat tracking contest4. Note that
4www.music-ir.org/mirex2006/index.php/Audio Beat Tracking Results

we do not perform a peak picking on this signal thereafter, which would result in a discrete set of impulses,like described in [26]. From a signal processing point of view this onset strength signal, p(t), is the linearcombination of the convolution of N sound events ei with impulses at a finite set of lags Ki
p(t) =N∑
i=1
(ei(t) ∗
∑k∈Ki
δ(t− kT )
)(4)
where T is the sampling period of the onset strength signal and ’∗’ denotes convolution. Note that in [26],event vectors ei have been replaced by scalar values that denote the strength of the onset. While this isdesirable when aiming at beat tracking, this loss in detail is considered disadvantageous for a rhythmicsimilarity measurement.The periodicity spectra P(f) are obtained by computing the magnitude of the Fourier transform of theonset strength signal:
P(f) =
∣∣∣∣∣N∑
i=1
(1
TEi(f)
∑k∈Ki
δ(f − k
T)
)∣∣∣∣∣ (5)
In (5), we only consider f < 1000bpm which approximately equals 16.7Hz. Higher frequencies donot contribute to the perception of rhythm. The Fourier transform is computed on a hamming windowof appropriate length that is supposed to include several realizations of the basic rhythm. In this report,
345 6900
0.01
0.02
0.03
bpm
Faster Example of Siganos
345 6900
0.01
0.02
0.03
0.04
bpm
Slower Example of Siganos
Fig. 4. Two example periodicity spectra from the same class of D2
a window length of eight seconds is chosen, while the hop size is set to half a second. To get a single

vector describing the periodicities in a piece, the mean, P(f), of the spectra derived from the song’s onsetstrength signal is computed. In Figure 4 two such mean periodicity spectra are shown for dances of thesame class having different tempi. They show a similar shape, but they are not aligned. Thus, an alignmentof these description leads to the proposed similarity measurement as described in Section 3.4. While thepeaks of the two signatures appear to be closely related, for higher periodicities the peaks in the signaturesdrift further away from each other. The reason for this will be clarified by a small example: imaginetwo samples with the time signature 2
4, one with a tempo of 120 bpm, the other with a tempo of 135
bpm. Thus, when continuously quarter notes without pauses would be played, there would be 120 quarternotes for the one and 135 for the others per minute. Taking eighth notes would result in 240/270 notesfor the first/second piece, taking sixteenth in 480/540, respectively. This shows that the difference growslogarithmically for rising bpm.Several parameterizations of P(f) have been tried; its squared magnitude has been modeled by CepstralCoefficients, which lead to a smoothing of the spectra. This was observed to have the shortcoming ofintroducing artefacts in the shape of the spectra (i.e. smearing). Autoregressive modeling is not appropriatebecause of the often peaky structure of the spectra, that implies a filter close to instability. Therefore, ithas been decided to use the frequency bins of P(f) as inputs to the similarity measurement.
3.4. Distances
There are many possible ways to measure distances between the described melody and rhythmic descrip-tors. First, a measure is introduced that aims particularly at the similarity estimation of two rhythms:
3.4.1. Dynamic Periodicity Warping Distance
As clarified by Figure 4, a direct comparison of periodicity spectra will be problematic between rhythmi-cally similar pieces with different tempi. To solve this problem, a similarity measure based on DynamicPeriodicity Warping (DPW) is computed as depicted in Figure 5. At first, each of the input spectra, P1(f)
DPNORM PROJ
REFLINESIM
wDPW
ρ
Σ
S
dDPW
P1(f)
P2(f)
Fig. 5. Schematic of DPW dissimilarity computation
and P2(f), is normalized to sum to one. Then both normalized spectra are used to compute a minimumcost warping path wDPW through the difference matrix D, which contains the pairwise squared differenceof the values in P1(f) and P2(f): D(i, j) =
(P1(fi)− P2(fj)
)2. The path is computed using the fastalgorithm provided in [16], with step size one. In order to use this path for a distance measure, a reference

path has to be found that represents a perfect mapping. For this, a similarity matrix S is formed by com-puting the vector direct product of the two normalized periodicity spectra. This matrix has local maximawherever maxima in the two vectors coincide. As the description of tempo properties of the datasets inSection 1.1 shows, tempos of dances from the same class vary only within a certain bandwidth (in bpm).Assuming that two similar dances have similar periodicity spectra, there have to be strong maxima in ma-trix S: in the main diagonal and in a certain number of sub- and superdiagonals that cover this bandwidth,which was set to 20 bpm in this report. By localizing the highest local maximum within this tridiagonalmatrix, we get an estimation for the relation of the tempi of the two pieces. In the case when the two piecesare exactly the same, with only the tempo differing, the warping path between the two periodicity spectrawould be a straight line from the upper left corner of the distance matrix through this located maximum.This straight line ρ forms the reference line that would be the mapping path of two linearly warped period-icity spectra. In the next step, the distance of the orthogonal projection of each point on the warping pathwDPW onto ρ is computed. This distance vector is then weighted by the values of the normalized target atthe related points. The sum of these weighted distances gives the DPW dissimilarity dDPW introduced inthis work.Note that for the step matrix in the dynamic programming other possibilities have been tried, such as anadaption of the step cost to the angle of the reference line ρ. As this had no influence on the results, thesimple three steps matrix has been used throughout the experiments in Section 4.
3.4.2. Earth Mover’s Distance
The earth mover’s distance (EMD) has been introduced in [36] as a measure of similarity between twodistributions. It is based on the transportation problem [22] from linear optimization, and can as such besolved efficiently. Applied to two distributions it can be explained like that:Consider one probability density function as a mass of earth, piled up in a space of the same dimensions asthe dimension of p.d.f under consideration. It has a big pile of earth, where the density has high values, andjust some small crumbs of earth where the density has low values. A second distribution can be imaginedas a collection of holes in the same space, like changing the sign of its probability values. The EMDmeasures the least amount of work needed to fill the holes with the earth contained in the piles. A unit ofwork corresponds to transporting a unit of earth by a unit of ground distance.In [36], the histograms that represent a discrete probability density function are proposed to be convertedinto signatures before applying a distance metric. A signature is a clustering of the histogram into theregions containing a big amount of mass. A signature is defined by the set
S = {sj = (mj, wj)}, 1 ≤ j ≤ J (6)
with mj being the center of the cluster, wj the probability mass contained in this cluster and J the numberof clusters chosen to represent the density histogram. Thus, the choice of J depends on the amount ofmaxima of the histogram. It is worth to note that the EM distance works on representations of different
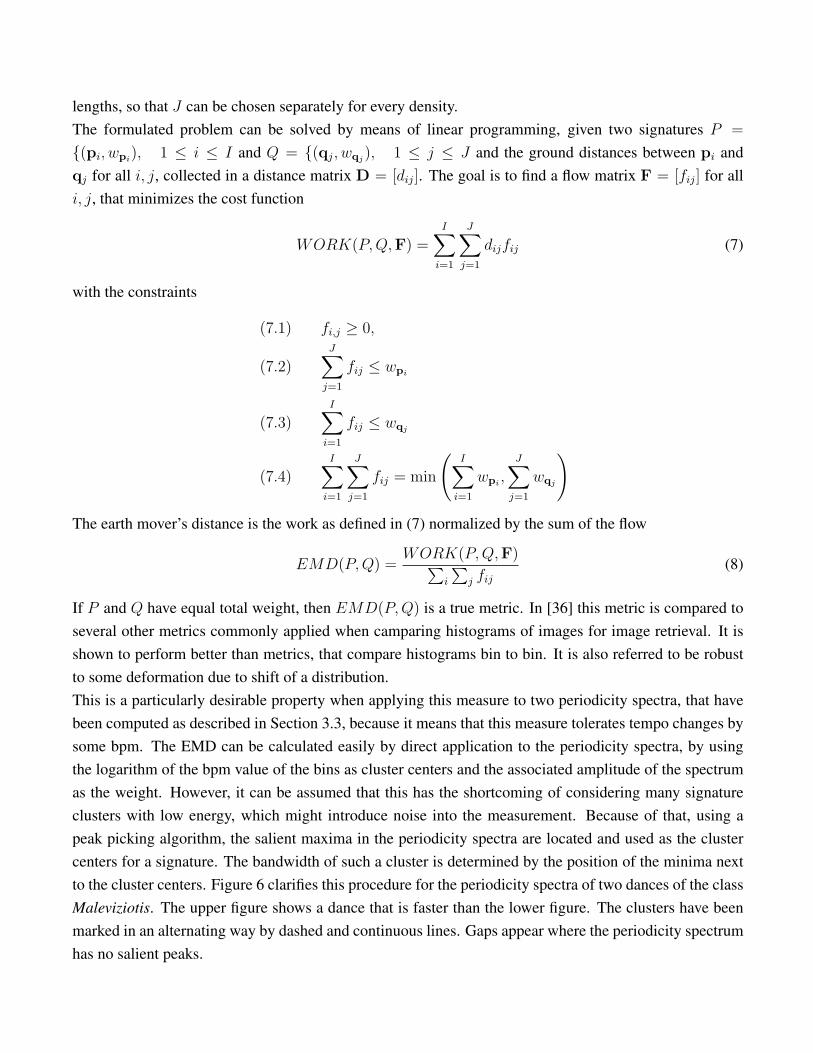
lengths, so that J can be chosen separately for every density.The formulated problem can be solved by means of linear programming, given two signatures P =
{(pi, wpi), 1 ≤ i ≤ I and Q = {(qj, wqj
), 1 ≤ j ≤ J and the ground distances between pi andqj for all i, j, collected in a distance matrix D = [dij]. The goal is to find a flow matrix F = [fij] for alli, j, that minimizes the cost function
WORK(P, Q,F) =I∑
i=1
J∑j=1
dijfij (7)
with the constraints
(7.1) fi,j ≥ 0,
(7.2)J∑
j=1
fij ≤ wpi
(7.3)I∑
i=1
fij ≤ wqj
(7.4)I∑
i=1
J∑j=1
fij = min
(I∑
i=1
wpi,
J∑j=1
wqj
)
The earth mover’s distance is the work as defined in (7) normalized by the sum of the flow
EMD(P, Q) =WORK(P, Q,F)∑
i
∑j fij
(8)
If P and Q have equal total weight, then EMD(P, Q) is a true metric. In [36] this metric is compared toseveral other metrics commonly applied when camparing histograms of images for image retrieval. It isshown to perform better than metrics, that compare histograms bin to bin. It is also referred to be robustto some deformation due to shift of a distribution.This is a particularly desirable property when applying this measure to two periodicity spectra, that havebeen computed as described in Section 3.3, because it means that this measure tolerates tempo changes bysome bpm. The EMD can be calculated easily by direct application to the periodicity spectra, by usingthe logarithm of the bpm value of the bins as cluster centers and the associated amplitude of the spectrumas the weight. However, it can be assumed that this has the shortcoming of considering many signatureclusters with low energy, which might introduce noise into the measurement. Because of that, using apeak picking algorithm, the salient maxima in the periodicity spectra are located and used as the clustercenters for a signature. The bandwidth of such a cluster is determined by the position of the minima nextto the cluster centers. Figure 6 clarifies this procedure for the periodicity spectra of two dances of the classMaleviziotis. The upper figure shows a dance that is faster than the lower figure. The clusters have beenmarked in an alternating way by dashed and continuous lines. Gaps appear where the periodicity spectrumhas no salient peaks.

0 20 40 60 80 100 120 1400
0.01
0.02
0.03
0.04
0.05
Periodicity Signature for a fast Maleviziotis
0 20 40 60 80 100 120 1400
0.01
0.02
0.03
0.04
0.05
0.06
Periodicity Signature for a slower Maleviziotis
Fig. 6. Two example periodicity signatures
The logarithmic growth in the misalignment of two periodicity spectra mentioned in Section 3.3 mo-tivates the choice of a logarithmic ground distance: The ground distance for EMD applied to rhythmdescriptors is computed by | log(pi) − log(qj)| where p, q are the cluster centers in bpm. The weight ofthe clusters is simply computed as the sum of the amplitudes of the periodicity coefficients contained in acluster. The all over sum over such a signature is normed to sum up to one, in order to give a true metricwhen measuring the distance between two signatures.
The EMD metric can be applied to the pitch histograms computed as described in Section 3.2 as wellin a straight forward manner, by using the amplitude of the bins as weight and their interval distance as aground distance. An alternative to the description of the melodic characteristics of a sound event by usingpitch histograms is the approach presented in [43], which uses EMD to detect melodic similarities as well.However, the approach presented in [43] works only on separated melodic phrases with a defined barpositions. Thus, two melodic phases of same length are in phase when comparing, which is not possiblein our case due to the problems of meter estimation and sound source separation as detailed in Section 2.
3.4.3. Baseline Distances
In order to examine the properties of the DPW and EMD measures, some widely used metrics will be usedfor comparison. In Section 4 their behavior will be compared with the DPW dissimilarity in classifying
traditional dances, so far only regarding their rhythmic similarities. As in [20] the Euclidean distanceand the cosine distance will be used, applied to the unwarped periodicity spectra. Regarding the findingsin [20] better results for the cosine distance might be expected. In order to justify the proposed DPWmeasure, it will also be compared with two other measures obtained after warping the spectra. The first isthe cost of the warping, dCost, obtained by summing the local costs on the warping path. The other is thecosine distance of the two aligned spectra, dCosPost.
3.5. Evaluation on datasets
The proposed method will be evaluated in a collection of musical recordings collected by the Instituteof Mediterranean Studies (IMS) in Rethymno, Crete. Details about this collection can be found on theInternet5. It consists of 444 recordings, played by different musicians of the region of Rethymno. Parts ofthe recordings have been transcripted, and the recordings have been categorized into classes of dances andtunes. These data will be used to expand the collection of Cretan music that has already been assembledby the author, as described in Section 1.1. The criterion to judge the validity of the presented approachwill be the classification accuracy, using for example a kNN classifier on the distance matrices as shownin Section 4.A second possibility for the evaluation of the method is the usage of the results in [42] as a ground truth.It can be then evaluated if sequences containing similar melodies according to the musicological analysishave a high similarity according to the proposed computational method as well. The same comparisoncan be done using analysis data that is available for the dance Sousta from the Institute of MediterraneanStudies6. It is possible that for the dance Kritikos Syrtos some results will be available soon, as a PhDthesis is currently in progress that has the subject of analyzing this dance.For evaluating the performance of the rhythm analysis tools, also tests on different kind of musical data areplanned. For this a dataset containing hand claps of Flamenco music will be assembled. This signals canbe assumed to have a rhythmical very expressive structure, due to the very impulse like character of thehand claps. Furthermore, resulting similarity measures can be nicely compared with the results presentedin [11].In Section 4 also some results on a set of eight different Ballroom dances are shown. This data set has beenused previously in [21], among others, and will be referred to as D2. Due to the results in Section 4 it wasconcluded that this dataset is too simple, but for comparability with other approaches, when concerningwith rhythmic similarity it will be referred to.
5http://gaia.ims.forth.gr/portal/default.asp6http://gaia.ims.forth.gr/portal/

4. PRELIMINARY RESULTS: RHYTHM SIMILARITY
In order to compare the quality of the similarity measures, their accuracies in a k-Nearest Neighbor (kNN)classification was measured. For this, 10 repetitions of 10-fold stratified cross-validations have beenperformed. A locally weighted k-Nearest Neighbor (wkNN) classifier has been tried as well. The simplekNN classifier just counts the training samples in the k neighborhood for each class, and assigns the testsample to the class which has most training samples in the k neighborhood. Thus, each training samplehas equal weight wi = 1, i = 1...k. The locally weighted kNN assigns wi = 1 − (di/dk+1) to the i-thtraining sample, where dk+1 is the distance of the k + 1-nearest neighbor to the test sample. Thus, trainingsamples more far away from the test sample, contribute less to its classification. Results for the EMDmetric cannot be shown yet, but throughout first experiments the results were slightly worse than for theDPW measure.
Table 3. Classification Accuracies on D1wkNN kNN
Cosine 53.8 (k=1) 53.8 (k=1)Euclidean 48.9 (k=1) 48.8 (k=1)
dCost 51.8 (k=18) 48.5 (k=8)dCosPost 51.1 (k=19) 48.7 (k=12)dDPW 69.0 (k=4) 64.4 (k=5)
Table 4. Classification Accuracies on D2wkNN kNN
Cosine 85.5 (k=7) 84.5 (k=3)Euclidean 83.8 (k=6) 82.7 (k=3)
dCost 72.4 (k=14) 70.7 (k=7)dCosPost 70.7 (k=32) 69.2 (k=17)dDPW 82.1 (k=11) 80.9 (k=20)
Tables 3 and 4 show the classification accuracies on the two datasets, the size of the neighborhoodof these optimal values is denoted in parentheses. It can be seen that using wkNN has a positive effecton both datasets. On D2, the best classification has been achieved using the cosine measure, slightlyoutperforming the Euclidean distance as well as the DPW dissimilarity. This confirms the results in [20],where the cosine measure was found superior on an exemplary set of pieces. The latter can be assignedto the small tempo variance of the dataset, which limits the gain of warping. Note that, according to the

authors’ knowledge, the best accuracies presented on this data set without the usage of tempo informationis 85.7% [12], where the features contained periodicity descriptions and rhythmic patterns, and adaptiveboosting was incorporated in classification. This indicates that due to small intra class variability, thisdataset might be too easy.On D1, the advantage of the DPW based similarity measure is obvious. While the superiority of the cosinemeasure compared with the Euclidean measure remains the same, the DPW based measure results in aclearly higher accuracy. It is important to notice the small difference of the classification result of 69.0%
of the presented system, and the classification accuracy by humans (75.6%) as shown in Table 2.A closer look at the misclassification using the DPW based measure on D1 is given in form of a confusionmatrix in Table 5. The row contains the correct class labels and the columns the prediction of the weightedkNN classifier, that achieved the highest accuracy in Table 3. The strongest confusion is observed betweenthe dances Maleviziotis and Pentozalis, a phenomenon that has been observed also in the listening tests.Compared to the listening tests, the accuracy for the Syrtos Kritikos is low. The reason for that is the largevariability of kontilies for this dance, which leads to periodicity spectra that vary stronger for this classthan for others. Because of that, the average intra class DPW dissimilarity is also the highest for this class.It is worth to note that Syrtos Kritikos is mostly confused with Kalamatianos, which is the only dancefollowing a 7
8beat. As such, differentiating between these metrical structure based on regularity of the
signal energy for example, could improve results.
Table 5. Confusion matrix for D1Kal. Sig. Mal. Pen. Sous. Chan.
Kal. 130 0 0 0 1 19Sig. 0 140 0 0 10 0Mal. 0 0 72 80 8 0Pen. 10 10 26 94 10 0Sous. 10 7 2 8 129 4Syrt. 33 0 12 20 18 77
The proposed DPW dissimilarity performs better than the cost of warping, dCost, and the post warp co-sine distance, dCosPost, on both datasets. This justifies the usage of the proposed measure. The explanationof the worse performance of the cosine measure after warping is the smaller distance of periodicity spectraof different classes after warping. This shows the necessity of considering the path chosen in DPW.

5. EXTENSIONS
In this Section, two possible expansions for the system proposed in Section 3 are proposed. The first is agraphical interface that depicts computed similarities in form of a planar graph, giving an intuitive interfacefor a musicologist. The second expansion is the introduction of a beat synchronous analysis method, thatis likely to improve the performance of the system.
5.1. Proposing an interface
A possible application of the system proposed in Section 3 is in the field of an ethnomusicological anal-ysis, where a researcher is looking for a piece, that has similar melodic patterns (kontilies) as the one heis currently listening to. A system that proposes a number of pieces reduces dramatically the time themusicologist spends looking for such pieces in the data. It even enables to discover some unexpectedsimilarities, when also pieces are involved in the search, that the specialist would not have included in hismanual search. In order to make such a software usable, some approaches have to be evaluated to providean intuitive interface.For this, the approach to investigate relations between rhythms as presented in [11] based on split treescould be investigated. The authors suggest using such trees to map the distance relations found in adistance matrix onto a plane graph. The distances used in [11] have been computed using symbolicdescriptions of rhythmic patterns. Such trees could be used as an indicator of how much distance mea-sures are valid, given some parameters, as the local descent or the dance specific categorization. When asuccessful system for the estimation of morphological similarity has been derived, the representations ina splits tree can be used to provide a more intuitive display of the distance relationships between differentsongs and possible morphological relationships between them. To the author’s best knowledge, thesesplits trees have not been applied to distance measures derived from acoustic signals. Thus, it has tobe evaluated if the representation as a tree provides with meaningful information. In order to show theexpressiveness of such tree models applied to a distance matrix, a tree has been computed on a subsetof the compiled dataset of Cretan music. This subset consists of five songs, that have been correctlyclassified in the results shown in Section 4. The tree in Figure 7 has some interesting connections with theclassification results detailed in Table 5. The samples of Siganos (marked as kont1...kont5) and of Sousta(sous1...sous5) represent compact regions, and for most of the songs there are direct connections in thetree. The class with the worst classification, Syrtos Kritikos, is represented by very wide spread nodes(xan1...xan5). However, until now there is no immanent tree structure visible for the complete set of data,the big number of paralelograms that divides the nodes into groups shows their isolation. It will be subjectof further investigation if a more sophisticated distance measure than the one shown in Figure 3 (usingonly the rhythm part) will introduce more tree-like structure. If this is the case, this tree generation can beapplied to whatever kind of music that is supposed to underly the same structuring, such as music fromother islands of Greece or Thrace. Possibly as well music from Turkey or the Balkan can be included, as

mentioned in the Introduction.
Fig. 7. Example of a splits tree computed on a distance matrix
5.2. Beat synchronous processing
As shown in [17], by using chroma features that have been computed in a beat synchronous way as ex-plained in Section 2.3, cover songs can be detected reasonably well. Note that this problem is not toodifferent from the problem of finding similar melodic phrases (kontilies) in Cretan music. While the exactestimation of the correct tempo and measure positions is not feasible as shown in Section 2.2, some kind ofmeter pulse can be derived. This pulse might suffer from doubling or halving errors, or from some phaseproblems, like confusion the first and the second beat in the usually encountered 2
4time signature of Greek
island music. Nevertheless, such a pulse can be used to synchronize the analysis depicted in Figure 3. Thiswill be explained by a short simplified example. In Figure 8 an excerpt of a Sousta tune is given. Supposethat the bold circles found above the score denote the beats of the pulse we have estimated from the signal.Assuming that the estimated pulse is the tactus, reasonable lengths for an analysis window would be eitherfour or eight tactus beats, because kontilies are most likely to span either two or four measures. Computingmidi note histograms of the melody in Figure 8 within a window of four beats, using one beat hop size,the sequence of MIDI pitch histograms obtained is depicted in Figure 9.
It is interesting to observe, that the in analysis frames 3-9 the pitch histograms remain identical. This

Fig. 8. Part of the melody transcription of a piece of Sousta
6768
6970
7172
7374
7576
12
34
56
78
910
1112
13
0
0.1
0.2
0.3
ANALYSIS FRAME
MIDI PITCH
NO
TE
EN
ER
GY
Fig. 9. Sequence of MIDI pitch histograms derived from the melody depicted in 8
is due to the fact, that in this duration one kontilia is repeated. As detailed previously in Section 1.1, themorphology of Cretan dances is characterized by a free combination of kontilies. Nevertheless, from thetranscriptions available in [5] and in the collection of the IMS7, each kontilia is repeated several times be-fore a change to a different kontilia is performed. Thus, the beat synchronous computation of periodicityspectra and pitch histograms, combined with a detection of stable segments is likely to improve the systemas depicted in 3. This way, the ability of the system to estimate valid pitch histograms and periodicityspectrum for description of kontilies could be improved, because the used windows are likely to contain asingle melodic pattern. However, note that computations until now have been performed using instrumen-tal samples. It can not be foreseen, how well a beat synchronous analysis system performs when the signalalso contain vocal segments.
7http://gaia.ims.forth.gr/portal/

6. REFERENCES
[1] O. Abraham and E. M. von Hornbostel. Propositions for the transcription of exotic melodies, (ingerman language). In Sonderdruck aus “Sammelbande der Internationalen Musikgesellschaft” XI,1. Leipzig, Internationale Musikgesellschaft, n.d., 1909.
[2] G. Amargianakis. Morphology of traditional cretan dance music. In Proc. of 2nd Conference onMusic and Dances of Crete, 2001.
[3] B. Aning. Tempo change: Dance music interactions in some ghanaian traditions. Institute of AfricanStudies: Research Review, 8(2):41–43, 1972.
[4] S. Baud-Bovy. An essay on the Greek folk song, (in Greek language). Laographic Institute ofPeleponese, 1984.
[5] S. Baud-Bovy. Musical field recordings in Crete 1953-1954, (in Greek language). Center of MinorAsiatic Studies / Musical Laographical Archives Melpos Merlie, 2006.
[6] H. Besseler. Spielfiguren in instrumental music. In Deutsches Jahrbuch der Musikwissenschaften,page 30. W. Vetter, Ed., 1957.
[7] C. Braıloıu. Le giusto syllabique. un systeme rythmique populaire roumain, (in french language).Anuario musical del Instituto Espanol de Musicologia, 7:117–158, 1952.
[8] A. S. Bregman. Auditory Scene Analysis. MIT Press, 1990.
[9] I. Bruno and P. Nesi. Automatic music transcription supporting different instruments. Journal ofNew Music Research, 34(2):139–149, 2005.
[10] S. Davis and P. Mermelstein. Comparison of parametric representations for monosyllabic wordrecognition in continuously spoken sentences. IEEE Transactions on Acoustic, Speech and SignalProcessing, ASSP-28(4):357–366, August 1980.
[11] M. Daz-Banez, G. Farigu, F. Gomez, D. Rappaport, and G. Toussaint. El compas flamenco: aphylogenetic analysis, 2004.
[12] S. Dixon, F. Gouyon, and G. Widmer. Towards characterisation of music via rhythmic patterns. InProc. of ISMIR 2004 - 5th International Conference on Music Information Retrieval, 2004.
[13] K. Dressler. Extraction of the melody pitch contour from polyphonic audio. In Proc. of ISMIR, 2005.
[14] K. Dressler. Sinusoidal extraction using an efficient implementation of a multi-resolution fft. In Proc.of the 9th Int. Conference on Digital Audio Effects (DAFx-06), 2006.

[15] J. Eggink and G. J. Brown. Extracting melody lines from complex audio. In 5th International ISMIR2004 Conference, 2004.
[16] D. Ellis. Dynamic Time Warp (DTW) in Matlab. www.ee.columbia.edu/∼dpwe/resources/matlab/dtw/,2002.
[17] D. Ellis and G. Poliner. Identifying cover songs with chroma features and dynamic programmingbeat tracking. In ICASSP 2007, pages IV–1429–1432, 2007.
[18] A. Eronen. Chorus detection with combined use of mfcc and chroma features and image processingfilters. In Proc. of the 10th Int. Conference on Digital Audio Effects (DAFx-07), 2007.
[19] J. Flanagan and R. Golden. Phase vocoder. Bell Sytem Technical Journal, pages 1493–1509, 1966.
[20] J. Foote, M. D. Cooper, and U. Nam. Audio retrieval by rhythmic similarity. In Proc. of ISMIR 2002- 3rd International Conference on Music Information Retrieval, 2002.
[21] F. Gouyon and S. Dixon. Dance music classification: A tempo based approach. In Proc. of ISMIR2004 - 5th International Conference on Music Information Retrieval, 2004.
[22] F. L. Hitchcock. The distribution of a product from several sources to numerous localities. Journalof Mathematics and Physics, 20:224–230, 1941.
[23] A. Holzapfel and Y. Stylianou. Musical genre classification using non-negative matrix factorizationbased features. Special Issue of IEEE Trans. on Audio, Speech and Language Procesing on MusicInformation retrieval, accepted for publication, 2007.
[24] A. Holzapfel and Y. Stylianou. Singer identification in rembetiko music. In Proc. of SMC 2007,Conference on Sound and Music Computing, Lefkada, Greece, 2007.
[25] A. Holzapfel and Y. Stylianou. Rhythmic similarity of music based on dynamic periodicity warping,submitted. In ICASSP 2008, 2008.
[26] A. Klapuri. Sound onset detection by applying psychoacoustic knowledge. In ICASSP ’99: Proceed-ings of the Acoustics, Speech, and Signal Processing, 1999. on 1999 IEEE International Conference,pages 3089–3092, Washington, DC, USA, 1999. IEEE Computer Society.
[27] A. P. Klapuri. Automatic music transcription as we know it today. Journal of New Music Research,33(3):269–282, 2004.
[28] A. P. Klapuri, A. J. Eronen, and J. T. Astola. Analysis of the meter of acoustic musical signals. IEEETransactions on Acoustics Speech and Signal Processing, in press.
[29] H. C. Koch. Versuch einer Anleitung zur Composition, (in German language). Rudolstadt, 1782.

[30] T. Li and M. Ogihara. Toward intelligent music information retrieval. IEEE Transactions on Multi-media, 8(3), 2006.
[31] G. List. The reliability of transcription. Ethnomusicology, 18(3):353–377, 1974.
[32] I. Loutzaki. Audio report: Greek folk dance music. Yearbook for traditional music, 26:168–179,1994.
[33] M. Mandel and D. Ellis. Labrosa’s audio music similarity and classification submissions. In Proc. ofISMIR 2007 - 8th International Conference on Music Information Retrieval, Vienna, Austria, 2007.
[34] D. Moelants. Dance music, movement and tempo preferences. In Proceedings of the 5th TriennialESCOM Conference, Hannover, Germany, 2003.
[35] H. Riemann. Musik-lexikon, (in German language). Leipzig, 1882.
[36] Y. Rubner, C. Tomasi, and L. J. Guibas. The earth mover’s distance as a metric for image retrieval.Int. J. Comput. Vision, 40(2):99–121, 2000.
[37] J. Seppnen, A. Eronen, and J. Hiipakka. Joint beat & tatum tracking from music signals. In ISMIR,pages 23–28, 2006.
[38] X. Serra. A System for Sound Analysis/ Transformation/ Synthesis based on a Deterministic plusStochastic Decomposition. PhD thesis, 1989.
[39] K. Signell. Makam: Modal Practice in Turkish Art Music. Seattle: Asian Music Publications, 1977.
[40] D. Stockmann. Transcription in ethnomusicology: history, problems, methods (in german language).Acta Musicologica, 51(2):204–245, 1979.
[41] D. Themelis. Morphology and analysis of music, (in Greek language). University Studio Press,Thessaloniki, 1994.
[42] I. B. Theodosopoulou. Methodology of morphological analysis and analytic data of small rhythmicpatterns of cretan folk music, (in Greek Language). Athens: Kultura, 2004.
[43] R. Typke, P. Giannopoulos, R. Veltkamp, F. Wiering, and R. van Oostrum. Using transportationdistances for measuring melodic similarity, 2003.
[44] G. Tzanetakis and P. Cook. Music genre classification of audio signals. IEEE Transactions on Speechand Audio Processing, 10(5):293–302, 2002.
[45] T. Virtanen. Monaural sound source separation by nonnegative matrix factorization with temporalcontinuity and sparseness criteria. IEEE Transactions on Audio, Speech and Language Processing,15(3):1066–1074, 2007.