discovery of cyanuric acid during an assessment of … chart of dissolved organic matter...
TRANSCRIPT

Prepared in cooperation with the Orange County Water District, Fountain Valley, California
Discovery of Cyanuric Acid During an Assessment of Natural Organic Matter in Stormflow Water of the Santa Ana River, Southern California, 2003–2004
Scientific Investigations Report 2007–5048
U.S. Department of the InteriorU.S. Geological Survey

Discovery of Cyanuric Acid During an Assessment of Natural Organic Matter in Stormflow Water of the Santa Ana River, Southern California, 2003–2004
By Jerry A. Leenheer, John A. Izbicki, Colleen E. Rostad, Ted I. Noyes, and Greg Woodside
Prepared in cooperation with the Orange County Water District, Fountain Valley, California
Scientific Investigations Report 2007–5048
U.S. Department of the InteriorU.S. Geological Survey
U.S. Department of the InteriorDIRK KEMPTHORNE, Secretary
U.S. Geological SurveyMark D. Myers, Director
U.S. Geological Survey, Reston, Virginia: 2008
For product and ordering information: World Wide Web: http://www.usgs.gov/pubprod Telephone: 1-888-ASK-USGS
For more information on the USGS--the Federal source for science about the Earth, its natural and living resources, natural hazards, and the environment: World Wide Web: http://www.usgs.gov Telephone: 1-888-ASK-USGS
Any use of trade, product, or firm names is for descriptive purposes only and does not imply endorsement by the U.S. Government.
Although this report is in the public domain, permission must be secured from the individual copyright owners to reproduce any copyrighted materials contained within this report.
Suggested citation:Leenheer, J.A., Izbicki, J.A., Rostad, C.E., Noyes, T.I., and Woodside, Greg, 2008, Discovery of cyanuric acid during an assessment of natural organic matter in stormflow water of the Santa Ana River, southern California, 2003–2004: U.S. Geological Survey Scientific Investigations Report 2007–5048, 13 p.

iii
Acknowledgments
The authors thank Patricia Bagley of the Orange County Flood Control District and Ed Nylund of the City of Chino for permission to install stream stage recorders and automated samplers at the urban drain at La Palma Avenue and at Mill Creek at Chino-Corona Road. The authors also thank Isabel Pimentel and Russell Johnson of the U.S. Geological Survey for their work on study design and implementation, respectively.
iv
Contents
Abstract ...........................................................................................................................................................1Introduction.....................................................................................................................................................1
Hydrologic Setting ................................................................................................................................3Methods and Approach ................................................................................................................................3
Sampling Approach ..............................................................................................................................3Preparative Dissolved Organic Matter Fractionation and Isolation Procedure ........................4Fourier Transform-Infrared Spectrometry ........................................................................................4Solid-State Cross-Polarization Magic Angle Spinning 13C-Nuclear Magnetic Resonance
Spectrometry ...........................................................................................................................4Electrospray Ionization/Mass Spectrometry ...................................................................................4Chemical Standard ..............................................................................................................................4
Cyanuric Acid in Stormflow Water .............................................................................................................6Storm Hydrographs...............................................................................................................................6Dissolved Organic Matter Fractionations .........................................................................................7Spectral Characterizations of Cyanuric Acid in Hydrophilic Acid plus Neutral Fractions .......7
Possible Sources of Cyanuric Acid ..........................................................................................................11Summary........................................................................................................................................................12References ....................................................................................................................................................13
Figures 1. Santa Ana River basin, southern California, and location of selected stream
gages and sample-collection sites ............................................................................................2 2. Flow chart of dissolved organic matter fractionation ............................................................5 3. Stream stage and cyanuric acid concentrations in an urban drain and Mill Creek,
tributary to the Santa Ana River, southern California .............................................................6 4. Streamflow and cyanuric acid concentrations in the Santa Ana River at the
diversion downstream from Imperial Highway, southern California....................................7 5. Bar diagrams of dissolved organic matter fractionations in stormflow samples ..............8 6. Infrared spectra of the hydrophilic acid plus neutral fractions from the Santa Ana
River ................................................................................................................................................9 7. Electrospray/mass spectra of hydrophilic acid plus neutral fractions from the
Santa Ana River and cyanuric acid standard ........................................................................11 8. 13C-NMR spectrum of hydrophilic acid plus neutral fractions from the Santa Ana
River, Storm III, sample 4 ...........................................................................................................11
Table 1. Cyanuric acid concentrations in stormflow, Santa Ana River and selected
tributaries, southern California .................................................................................................12

v
Conversion FactorsSi to Inch/Pound
Multiply By To obtainLength
centimeter (cm) 0.3937 inch (in)kilometer 0.6214 mile (mi)meter (m) 3.281 foot (ft)micrometer (µm) 0.00003937 inch (in)
Areasquare kilometer (km2) 0.3861 square mile (mi2)
Volumecubic meter (m3) 0.0008107 acre-footliter (L) 0.2642 gallon (gal)microliter (µL) 0.000000264 gallon (gal)milliliter (mL) 0.000264 gallon (gal)
Masskilogram (kg) 2.205 pound, avoirdupois (lb)milligram (mg) 0.00003527 ounce, avoirdupois (oz)
Pressurekilopascal (kPa) 0.1450 pounds per square inch (lb/in2)
Flow ratecubic meter per second (m3/s) 35.31 cubic foot per second (ft3/s)liter per minute (L/min) 0.2642 gallon per minute (gal/min)meter per second (m/s) 3.281 foot per second (ft/s)milliliter per minute (mL/min) 0.000264 gallon per minute (gal/min)
Temperature in degrees Celsius (°C) may be converted to degrees Fahrenheit (°F) as follows:°F=(1.8×°C)+32
Abbreviated Water-Quality Units Used in this ReportM molarity (moles per liter) mg/L milligrams per liter µg/L micrograms per liter µS/cm microsiemens per centimeter at 25°C
Abbreviations and Symbols Used in this ReportAFO animal feeding operation cm–1 reciprocal centimeters (FT-IR spectrometry wavenumber unit) CPMAS cross-polarization magic angle spinning DOC dissolved organic carbon DOM dissolved organic matter FT-IR Fourier transform-infrared spectrometry HPI-A+N hydrophilic acid plus neutral fraction HPO-A hydrophobic acid fraction HPO-N hydrophobic neutral fraction Hz hertz kg/d kilogram per day LC/MS liquid chromatograph/mass spectrometer
vi
LP La Palma Avenue MC Mill Creek MHz megahertz ms millisecond m/z mass-to-charge ratio NMR nuclear magnetic resonance NOM natural organic matter OCWD Orange County Water District ppm parts per million (NMR spectrometry chemical shift unit) s second SAR Santa Ana River TPI-A+N transphilic acid plus neutral fraction UV ultraviolet V volt µs microsecond
Abbreviations and Symbols Used in this Report—Continued
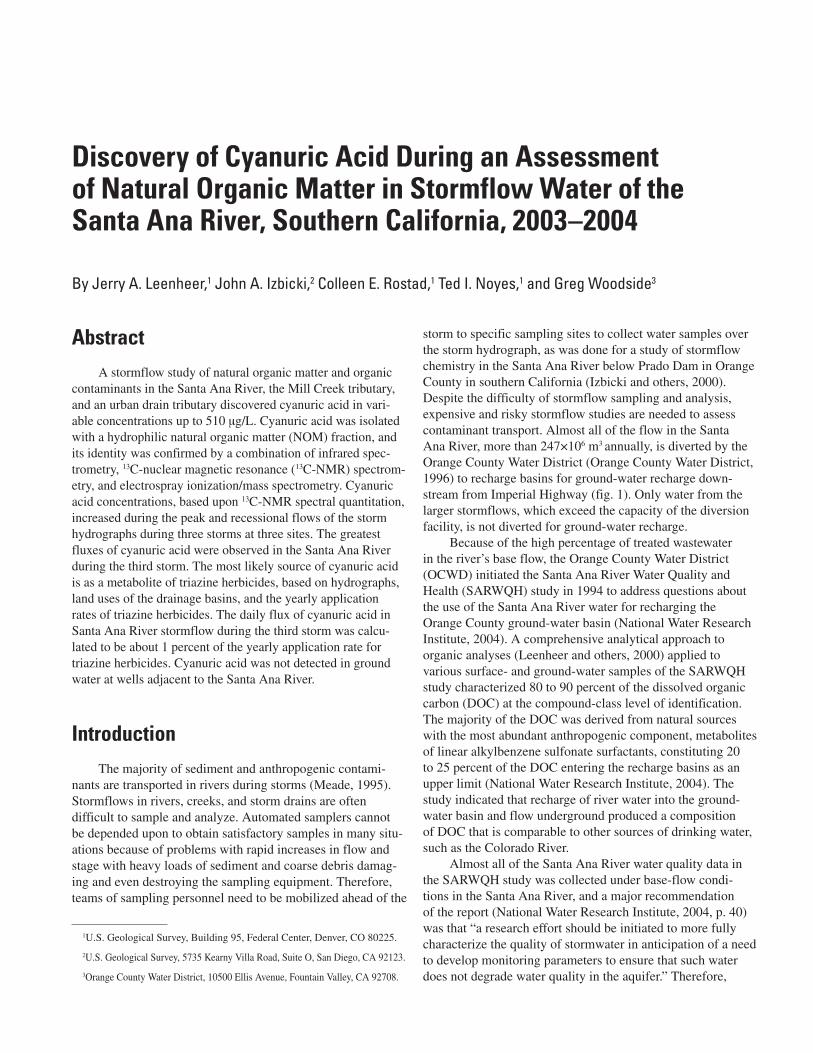
AbstractA stormflow study of natural organic matter and organic
contaminants in the Santa Ana River, the Mill Creek tributary, and an urban drain tributary discovered cyanuric acid in vari-able concentrations up to 510 µg/L. Cyanuric acid was isolated with a hydrophilic natural organic matter (NOM) fraction, and its identity was confirmed by a combination of infrared spec-trometry, 13C-nuclear magnetic resonance (13C-NMR) spectrom-etry, and electrospray ionization/mass spectrometry. Cyanuric acid concentrations, based upon 13C-NMR spectral quantitation, increased during the peak and recessional flows of the storm hydrographs during three storms at three sites. The greatest fluxes of cyanuric acid were observed in the Santa Ana River during the third storm. The most likely source of cyanuric acid is as a metabolite of triazine herbicides, based on hydrographs, land uses of the drainage basins, and the yearly application rates of triazine herbicides. The daily flux of cyanuric acid in Santa Ana River stormflow during the third storm was calcu-lated to be about 1 percent of the yearly application rate for triazine herbicides. Cyanuric acid was not detected in ground water at wells adjacent to the Santa Ana River.
IntroductionThe majority of sediment and anthropogenic contami-
nants are transported in rivers during storms (Meade, 1995). Stormflows in rivers, creeks, and storm drains are often difficult to sample and analyze. Automated samplers cannot be depended upon to obtain satisfactory samples in many situ-ations because of problems with rapid increases in flow and stage with heavy loads of sediment and coarse debris damag-ing and even destroying the sampling equipment. Therefore, teams of sampling personnel need to be mobilized ahead of the
storm to specific sampling sites to collect water samples over the storm hydrograph, as was done for a study of stormflow chemistry in the Santa Ana River below Prado Dam in Orange County in southern California (Izbicki and others, 2000). Despite the difficulty of stormflow sampling and analysis, expensive and risky stormflow studies are needed to assess contaminant transport. Almost all of the flow in the Santa Ana River, more than 247×106 m3 annually, is diverted by the Orange County Water District (Orange County Water District, 1996) to recharge basins for ground-water recharge down-stream from Imperial Highway (fig. 1). Only water from the larger stormflows, which exceed the capacity of the diversion facility, is not diverted for ground-water recharge.
Because of the high percentage of treated wastewater in the river’s base flow, the Orange County Water District (OCWD) initiated the Santa Ana River Water Quality and Health (SARWQH) study in 1994 to address questions about the use of the Santa Ana River water for recharging the Orange County ground-water basin (National Water Research Institute, 2004). A comprehensive analytical approach to organic analyses (Leenheer and others, 2000) applied to various surface- and ground-water samples of the SARWQH study characterized 80 to 90 percent of the dissolved organic carbon (DOC) at the compound-class level of identification. The majority of the DOC was derived from natural sources with the most abundant anthropogenic component, metabolites of linear alkylbenzene sulfonate surfactants, constituting 20 to 25 percent of the DOC entering the recharge basins as an upper limit (National Water Research Institute, 2004). The study indicated that recharge of river water into the ground-water basin and flow underground produced a composition of DOC that is comparable to other sources of drinking water, such as the Colorado River.
Almost all of the Santa Ana River water quality data in the SARWQH study was collected under base-flow condi-tions in the Santa Ana River, and a major recommendation of the report (National Water Research Institute, 2004, p. 40) was that “a research effort should be initiated to more fully characterize the quality of stormwater in anticipation of a need to develop monitoring parameters to ensure that such water does not degrade water quality in the aquifer.” Therefore,
1U.S. Geological Survey, Building 95, Federal Center, Denver, CO 80225.
2U.S. Geological Survey, 5735 Kearny Villa Road, Suite O, San Diego, CA 92123.
3Orange County Water District, 10500 Ellis Avenue, Fountain Valley, CA 92708.
Discovery of Cyanuric Acid During an Assessment of Natural Organic Matter in Stormflow Water of the Santa Ana River, Southern California, 2003–2004
By Jerry A. Leenheer,1 John A. Izbicki,2 Colleen E. Rostad,1 Ted I. Noyes,1 and Greg Woodside3
2 Discovery of Cyanuric Acid in Stormflow Water of the Santa Ana River, Southern California, 2003–2004
the Orange County Water District, in cooperation with the U.S. Geological Survey offices in San Diego, Calif., and Denver, Colo., conducted a stormflow study in the fall and winter, 2003–2004, to describe natural organic matter and organic contaminants in stormflow. This study received added significance because large portions of the Santa Ana River watershed in the Angeles and San Bernardino National Forests burned in the wildfires of October to November 2003, just prior to the beginning of the study.
Cyanuric acid was the major anthropogenic contaminant discovered in the stormflow study, and aromatic sulfonate metabolites of anionic surfacts were found to be the major class of anthropogenic contaminants in the Santa Ana River at base-flow conditions (Leenheer, 2003). Hypothetical sources of cyanuric acid include its biotic production as a metabolite from triazine herbicides or natural purine precursors, and (or) its abiotic production from degradation of synthetic cyanuryl chloride or melamine plastics. Cyanuric acid is difficult to
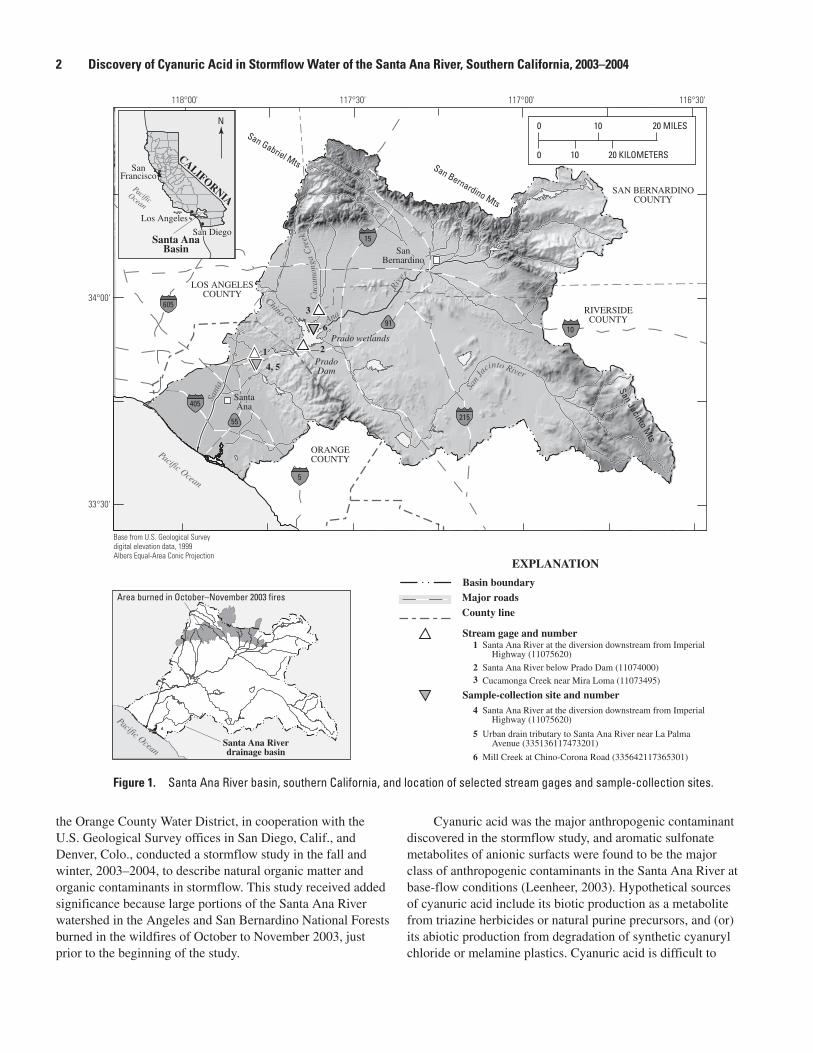
Figure 1. Santa Ana River basin, southern California, and location of selected stream gages and sample-collection sites.
4, 5
3
Base from U.S. Geological Surveydigital elevation data, 1999Albers Equal-Area Conic Projection
0 10 20 MILES
0 10 20 KILOMETERS
118°00' 117°30'
34°00'
33°30'
117°00' 116°30'
SAN BERNARDINOCOUNTY
N
CALIFORNIA
SanFrancisco
Los Angeles
San DiegoSanta Ana
Basin
LOS ANGELESCOUNTY
Pacific Ocean
PacificOcean
605
405
5
215
1091
15
55
EXPLANATION
Area burned in October–November 2003 fires
Santa Ana Riverdrainage basin
Pacific Ocean
Basin boundaryMajor roadsCounty line
Stream gage and number1
23
Santa Ana River at the diversion downstream from Imperial Highway (11075620)
Santa Ana River below Prado Dam (11074000)
Cucamonga Creek near Mira Loma (11073495)
Sample-collection site and number4
5
6
Santa Ana River at the diversion downstream from Imperial Highway (11075620)
Urban drain tributary to Santa Ana River near La Palma Avenue (335136117473201)
Mill Creek at Chino-Corona Road (335642117365301)
San Gabriel Mts San Bernardino Mts
Prado wetlands
PradoDam
ORANGECOUNTY
RIVERSIDECOUNTY
2
6
1
SantaAna
SanBernardino
San Jacinto Mts
Rive
r
AnaC
ucam
onga
Cre
ekChino Cr
Sant
a San
Ja
cinto River
Methods and Approach 3
detect with most analytical methods because cyanuric acid is a very polar organic solute that is not readily extracted from water for analysis. Cyanuric acid was not discovered in the stormflow study described in this report through the applica-tion of methods specific to its detection, but as a result of the study’s comprehensive organic analytical approach (Leenheer and others, 2000). The U.S. Environmental Protection Agency has placed cyanuric acid on the Drinking Water Contaminant Candidate List (U.S. Environmental Protection Agency, 1998) because it is a suspected gastrointestinal or liver toxicant in humans; it has recently developed methods for its detection in water (Cantu and others, 2000; Magnuson and others, 2001). Cyanuric acid had not been detected in the previous stormflow study (Izbicki and others, 2000), nor was it detected in ground water at wells adjacent to the Santa Ana River during the SARWQH study, which used the same comprehensive analyti-cal approach (Leenheer and others, 2000) as this report. The objectives of this report are to detail the qualitative and semi-quantitative data regarding cyanuric acid concentrations during stormflows and to relate its concentrations and mass transport over the storm hydrographs to land uses and possible sources.
Hydrologic Setting
The Santa Ana River, the largest river in southern California, drains about 6,950 km2 of the densely populated coastal area south and east of Los Angeles. Topography ranges from steep, rugged mountains with peaks as high as 3,500 m above sea level, to broad alluvial valleys, to a narrow, 25-km-wide coastal plain (fig. 1). The climate is mild with warm, dry summers and cool winters with episodic precipitation. Most precipitation occurs during the “winter” rainy season between November and March (U.S Army Corps of Engineers, 1994). Average annual precipitation ranges from about 0.3 m near the coast to about 0.35 m in the inland valleys. Annual precipita-tion totals can exceed 1 m in some of the high mountains.
In 2000, the population of the Santa Ana River basin was almost 5 million (Santa Ana Regional Water Quality Control Board, 2003). Land use ranged from dense urban development in the coastal plain and some inland valleys to undeveloped wilderness in the mountains. In 1999, about 300 animal feed-ing operations (AFOs) totaling more than 370,000 animals, mostly dairy cows, operated within the Santa Ana River basin (California Regional Water Quality Control Board, 1999). Most of these facilities were just north of Prado Dam in the area drained by Chino and Cucamonga Creeks (fig 1). Pollu-tion control practices at these facilities are intended to elimi-nate discharge and runoff to surface water for storms having a recurrence interval as large as once in 25 years (California Regional Water Quality Control Board, 1999).
Base flow in the Santa Ana River is maintained largely by the discharge of treated municipal wastewater from wastewater treatment plants. Stormflow during the rainy season had long
been considered a source of high-quality water for dilution of water recharged from the river during base flow. Stormflow is regulated by Prado Dam. The volume of water stored behind the dam varies during the rainy season and differs greatly in wet and dry years.
Almost all the water in the river, more than 247×106 m3 annually, is diverted to recharge basins about 10 km down-stream from Prado Dam (fig. 1), where it infiltrates and recharges aquifers underlying Orange County (Orange County Water District, 1996). Pumpage from these aquifers is the primary source of water for about 2 million people. The only water not diverted for ground water recharge and discharge to the Pacific Ocean are the larger stormflows that exceed the capacity of the diversion facilities.
Methods and Approach
Sampling Approach
Three stormflows (Storms I, II, and III) were sampled at three sites. Samples were collected from the Santa Ana River (SAR) at the diversion downstream from Imperial Highway, an urban drain tributary to the Santa Ana River near La Palma Avenue (about 0.5 km upstream from the diversion) (LP), and on Mill Creek (MC) at Chino-Corona Road upstream from Prado Dam (fig.1). Mill Creek, the downstream reach of Cucamonga Creek, drains mountain headwaters, urban areas, and parts of the dairy preserve. Changes in streamflow, based upon previously calibrated stage-to-discharge relation-ships, were measured on the Santa Ana River at the diversion downstream from Imperial Highway by Orange County Water District; changes in stream stage were measured on the urban drain and on Mill Creek using pressure transducers installed during the sample collection period. At each site large-volume samples (about 20 L) were collected by hand for dissolved organic matter (DOM) fractionation and isolation prior to the onset of stormflow, during the rising limb of the stormflow hydrograph, and during the falling limb of the stormflow hydrograph. Because stormflow hydrographs often are com-plex, additional samples were collected to describe changes in stormflow when needed.
Automated samplers at each site were used to collect smaller volume samples at more frequent intervals. These samples were analyzed for field properties (such as pH and specific conductance), dissolved organic carbon, ultra- violet absorbance, selected anions (such as chloride, sulfate, and nitrate), suspended sediment, and fecal indicator bac-teria concentrations. Data from automated samplers were used to describe changes in stormflow chemistry between collections of large-volume samples intended to character-ize changes in DOM fractionation. Data are available on the National Water Information System (NWIS) website at http://waterdata.usgs.gov/ca/nwis/.
4 Discovery of Cyanuric Acid in Stormflow Water of the Santa Ana River, Southern California, 2003–2004
Preparative Dissolved Organic Matter Fractionation and Isolation Procedure
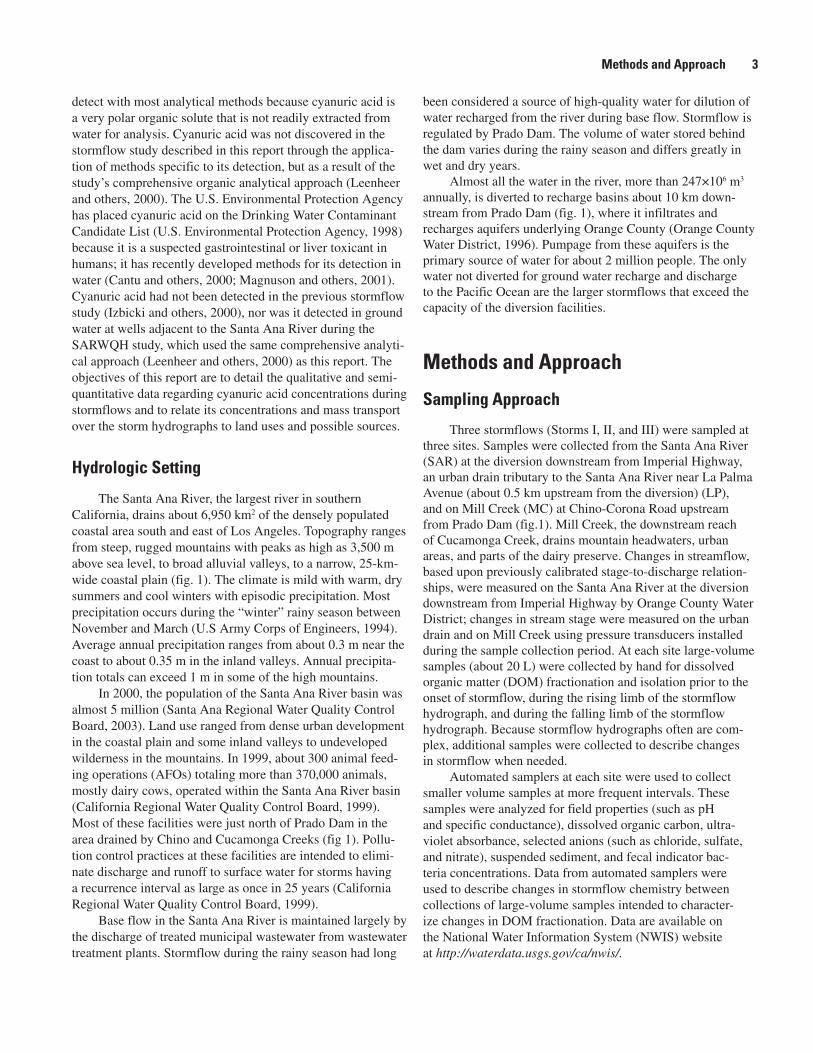
Most of the details of the preparative DOM fraction-ation and isolation procedure have been published previously (Leenheer and others, 2000). The difference between DOM and DOC is that the entire organic element (C, H, O, N, S, P) mass is measured in DOM fractionations as opposed to only the organic carbon mass in DOC fractionations. A general-ized flow chart of the DOM fractionation method is shown in figure 2. The stormwater DOM was fractionated into hydrophobic neutral (HPO-N), hydrophobic acid (HPO-A), transphilic acid plus neutral (TPI-A+N), hydrophilic acid plus neutral (HPI-A+N), and base fractions. Column and rinse volumes, desalting procedures, and evaporation and drying procedures are given in Leenheer and others (2000).
The following modifications from the preciously pub-lished method were made for this study:
The wet-sieving, sediment-settling, filtration, and dialysis 1. steps of figure 2 were designed for a total organic matter fractionation procedure that generated four particulate fractions and one colloid fraction. The complete fraction-ation procedure is only shown for the dissolved fractions in figure 2.
The first step in the published method (Leenheer and 2. others, 2000) is to pass the water sample through a sodium cation-exchange resin. This step was deleted because of concerns about the possible loss of basic DOM on the cation-exchange resin.
The hydrophobic neutral fraction was isolated before 3. using dialysis to separate the colloid fraction. This improvement was made to avoid losses of this low solubility fraction on the dialysis membrane during colloid isolation.
The base fraction was isolated before the hydrophobic 4. and transphilic fractions. This improvement was made to increase recoveries of this fraction that may have coisolated in the hydrophobic and transphilic fractions, and it also decreased the pH of the eluent from the cation-exchange resin to pH 2 or below. This decrease allowed the hydrogen cation-exchange resin, XAD-8 resin, and XAD-4 resin to be operated in series during one adsorp-tion step in the procedure. Column and rinse volumes, desalting procedures, and evaporation and drying proce-dures are given in Leenheer and others (2000).
Fourier Transform-Infrared Spectrometry
Infrared spectra were collected using 2–5 mg of DOM fraction isolates in potassium bromide pellets. The Perkin Elmer System 2000 FT-IR used an infrared source
with a pulsed laser carrier and a deuterated triglycine sul-fate detector. The instrument was set up to scan from 4,000 to 400 cm–1 averaging 10 scans at 1.0-cm–1 intervals with a resolution of 4.0 cm–1. All spectra were normal-ized after acquisition to a maximum absorbance of 1.0 for comparative purposes.
Solid-State Cross-Polarization Magic Angle Spinning 13C-Nuclear Magnetic Resonance Spectrometry
Cross-polarization magic angle spinning (CPMAS) 13C-NMR spectra were obtained on 5 to 200 mg of DOM samples. Freeze-dried samples were packed in ceramic rotors. Spectra were obtained on a 200 MHz Chemagnetics CMX spectrometer with a 7.5-mm-diameter probe. The spinning rate was 5,000 Hz. The acquisition parameters included a contact time of 5 ms, pulse delay of 1 s, and a pulse width of 4.5 µs for the 90° pulse. Variable contact time studies and comparison of liquid-state with solid-state 13C-NMR spectra by Wershaw and others (2000) indicate these are the optimum parameters for quantitatively determining different carbon structural group contributions to the DOM NMR spectra. The hydrophilic acid plus neutral fraction containing cyanuric acid was titrated to pH 8 with sodium hydroxide to create sodium (Na) salts of this fraction; the salts produced more anhydrous freeze-dried isolates for CPMAS 13C-NMR spectra acquisition than did the hydroscopic free-acid fraction.
Electrospray Ionization/Mass Spectrometry
The hydrophilic acid plus neutral fractions (Na salts) from Storm III samples from the Santa Ana River were dissolved in UV-grade 50/50 water/methanol, and 0.5 µL were analyzed by flow injection analysis on a Hewlett Packard Series 1100 liquid chromatograph/mass spectrometer (LC/MS) with negative electrospray ionization. The flow rate of the 25/75 water/methanol mobile phase was 0.2 mL/min. The quadrupole mass spectrometer scanned from 100 to 1,000 mass/charge (m/z) with capillary exit at 50 V. For negative electrospray ionization, the nitrogen drying gas was 350°C at 12 L/min with 35 lb/in2 nebulizer pressure and capil-lary voltage of 4,000 V. Source capillary exit voltage was set relatively low, based on results with standards, to maximize formation of molecular ions and minimize fragmentations.
Chemical Standard
Cyanuric acid (98 percent) was purchased from Sigma-Aldrich, Milwaukee, Wis.
Methods and Approach 5
Figure 2. Flow chart of dissolved organic matter fractionation.
1.0 L XAD-8resin column
0.5 L XAD-4resin column
Rinse MSC-1 resin with H2O. Desorb with 1 L of
3.0 M NH4OH, vacuum evaporate and freeze-dry
to isolate Bases.
Rinse XAD-8 resin with 0.01 M HC1. Desorb with 0.8 L 75% acetonitrile/25% H
2O, evaporate
and freeze-dry to isolate Hydrophobic Acids.
Rinse XAD-4 resin with 0.01 M HC1. Desorb with 0.4 L 75% acetonitrile/25% H
2O, evaporate and
freeze-dry to isolate Transphilic Acids plus Neutrals.
Remove NaCl, KCl, and CaSO4 by zeotrophic distillation procedure (Leenheer and others, 2000), in which water from
the sample is evaporated from glacial acetic acid and inorganic salts are removed by filtration while hydrophilic acids plus neutrals remain in solution.
Add 30 mL of 1M barium formate and centrifuge to remove barium sulfate precipitate. Wash precipitate with 20 mL of 1.0 M HCl, centrifuge, and evaporate to dryness with acetonitrile to remove HCl. Add wash residue to supernatant. Remove excess barium with 80 mL MSC-1H cation-exchange resin. Vacuum evaporate to dryness, add 98% formic acid and evaporate to dryness removing nitric acid as nitrogen dioxide. Add methanol and evaporate to dryness removing boric acid as volatiletrimethyl borate. Dissolve residue in 5.0 mL water, add saturated LiOH to adjust to pH 12 to precipitate Li
3PO
4, filter, and
remove excess lithium with 20 mL MSC-1H cation-exchange resin. Freeze-dry to isolate Hydrophilic Acids plus Neutrals.
Whole-water sample in 20-L polyethylene carboys
Wet-sieve sample through 63-µm sieve
Settle sediment for 2 days in refrigerated carboys
DecantSupernatant
SupernatantFilter through 142 mm 1-µm glass-fiber disk filter
Adjust pH to 7.0
1.0 L XAD-8resin column
Rinse XAD-8 with 0.01 M HC1. Desorb with 0.5 L75% acetonitrile/25% H
2O; evaporate and freeze-dry
to isolate Hydrophobic Neutrals.
Adjust pH to 4.0 with HC1; vacuum-evaporate to 100 mL salt slurry concentrate
Transfer to dialysis bag (3,500 Dalton) to separate colloids, and dialyze against1-L portions of deionized water until permeate conductivity is <10 µS
Permeate
MSC-1H cation-exchange
resin column
Sediment
Centrifuge
6 Discovery of Cyanuric Acid in Stormflow Water of the Santa Ana River, Southern California, 2003–2004
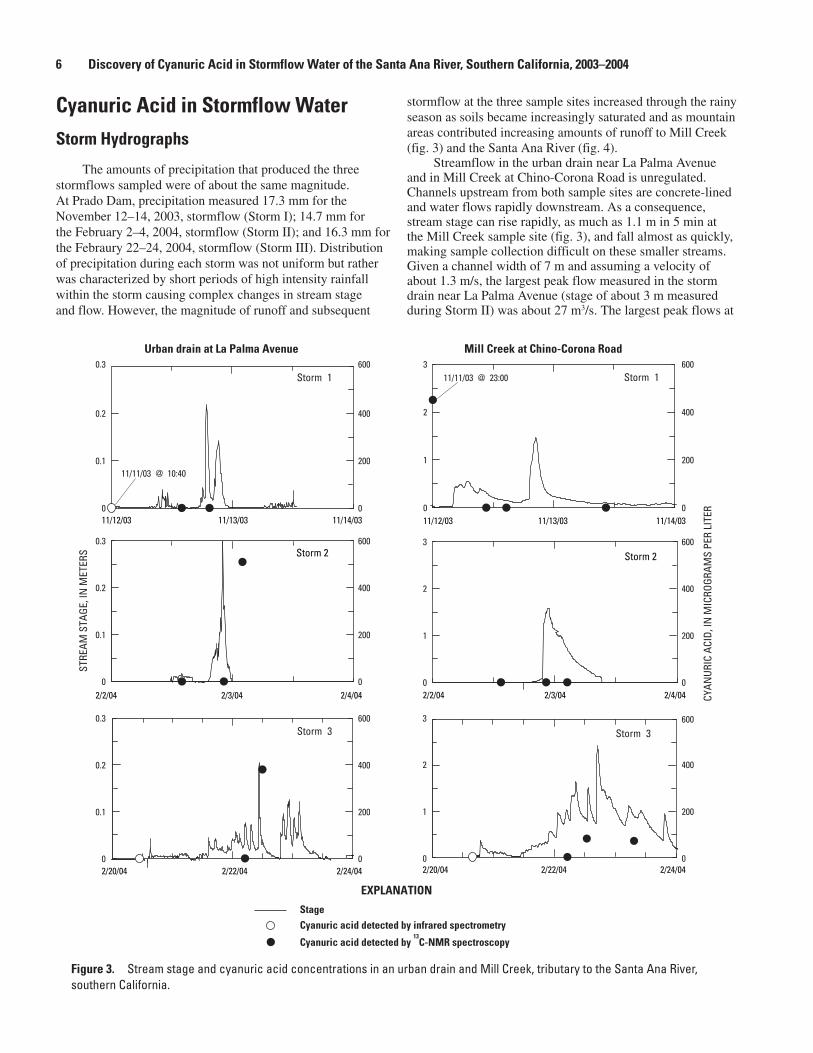
Cyanuric Acid in Stormflow WaterStorm Hydrographs
The amounts of precipitation that produced the three stormflows sampled were of about the same magnitude. At Prado Dam, precipitation measured 17.3 mm for the November 12–14, 2003, stormflow (Storm I); 14.7 mm for the February 2–4, 2004, stormflow (Storm II); and 16.3 mm for the Febraury 22–24, 2004, stormflow (Storm III). Distribution of precipitation during each storm was not uniform but rather was characterized by short periods of high intensity rainfall within the storm causing complex changes in stream stage and flow. However, the magnitude of runoff and subsequent
stormflow at the three sample sites increased through the rainy season as soils became increasingly saturated and as mountain areas contributed increasing amounts of runoff to Mill Creek (fig. 3) and the Santa Ana River (fig. 4).
Streamflow in the urban drain near La Palma Avenue and in Mill Creek at Chino-Corona Road is unregulated. Channels upstream from both sample sites are concrete-lined and water flows rapidly downstream. As a consequence, stream stage can rise rapidly, as much as 1.1 m in 5 min at the Mill Creek sample site (fig. 3), and fall almost as quickly, making sample collection difficult on these smaller streams. Given a channel width of 7 m and assuming a velocity of about 1.3 m/s, the largest peak flow measured in the storm drain near La Palma Avenue (stage of about 3 m measured during Storm II) was about 27 m3/s. The largest peak flows at
Figure 3. Stream stage and cyanuric acid concentrations in an urban drain and Mill Creek, tributary to the Santa Ana River, southern California.
0
1
2
3
0
200
400
600
0
0.1
0.2
0.3
0
200
400
600
0
1
2
3
0
200
400
600
0
0.1
0.2
0.3
0
200
400
600
0
1
2
3
0
200
400
600
0
0.1
0.2
0.3
0
200
400
600Storm 3
Urban drain at La Palma Avenue Mill Creek at Chino-Corona Road
Storm 1 Storm 1
Storm 3
STRE
AM S
TAGE
, IN
MET
ERS
CYAN
URIC
ACI
D, IN
MIC
ROGR
AMS
PER
LITE
R
EXPLANATION
StageCyanuric acid detected by infrared spectrometry
Cyanuric acid detected by 13
C-NMR spectroscopy
11/11/03 @ 23:00
11/11/03 @ 10:40
Storm 2 Storm 2
11/12/03 11/13/03 11/14/03
2/2/04 2/3/04 2/4/04
2/20/04 2/22/04 2/24/04 2/20/04 2/22/04 2/24/04
2/2/04 2/3/04 2/4/04
11/12/03 11/13/03 11/14/03

Cyanuric Acid in Stormflow Water 7
a stream gage on Cucamonga Creek near Mira Loma, located about 0.5 km upstream from the sample collection site on Mill Creek at Chino-Corona Road, were 52.9, 143, and 268 m3/s for Storm I, II, and III stormflows, respectively.
In contrast, streamflow in the Santa Ana River at the diversion downstream from Prado Dam is regulated by releases from Prado Dam. Regulation at Prado Dam may reduce streamflow at the onset of stormflow as water upstream from the dam is stored in the reservoir and may cause large, rapid increases in flow as stored water is released from the reservoir (Izbicki and others, 2000). Storage and release of water by Prado Dam produced a complex artificial hydrograph during Storm III that bears little resemblance to the distribu-tion of precipitation and runoff from that storm.
Figure 4. Streamflow and cyanuric acid concentrations in the Santa Ana River at the diversion downstream from Imperial Highway, southern California.
0
50
100
0
200
400
600
0
50
100
0
200
400
600
0
50
100
0
200
400
600
STRE
AMFL
OW, I
N C
UBIC
MET
ERS
PER
SECO
ND
CYAN
URIC
ACI
D, IN
MIC
ROGR
AMS
PER
LITE
R
EXPLANATIONStreamflowCyanuric acid detected by 13C-NMR spectroscopy
11/11/03 11/12/03 11/13/03 11/14/03
2/20/04 2/22/04 2/24/04
2/2/04 2/3/04 2/4/04
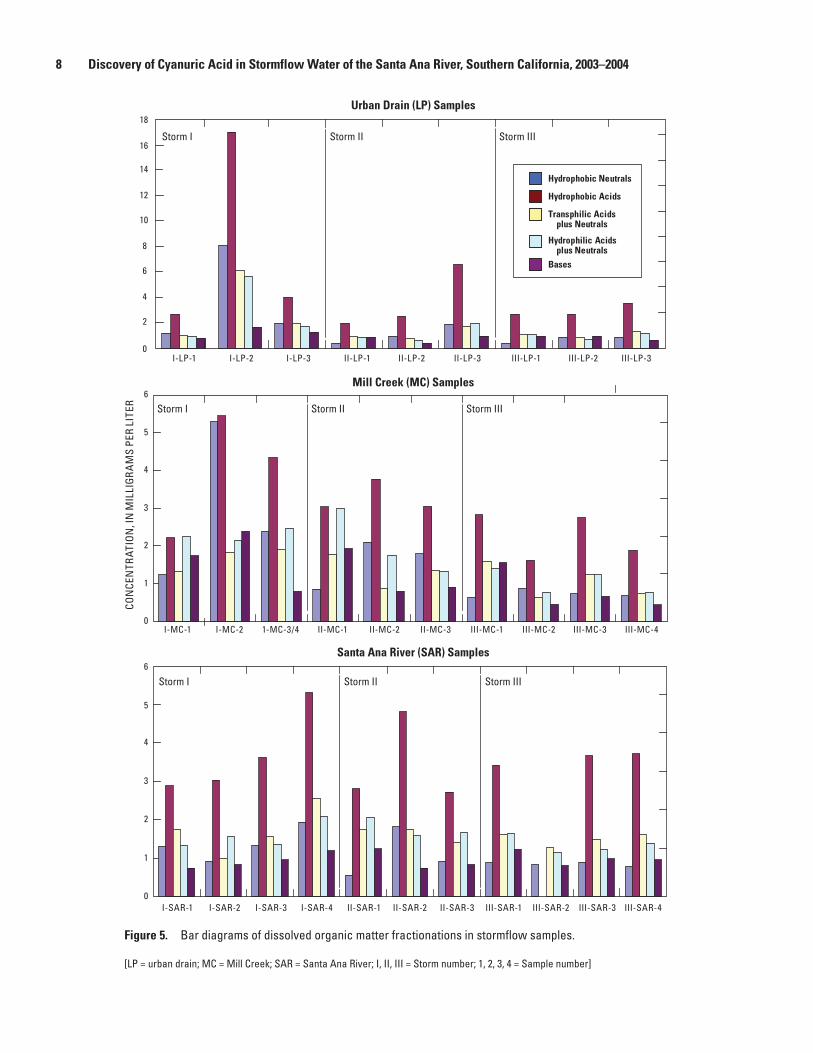
Dissolved Organic Matter Fractionations
Bar diagrams showing DOM fractionations from the urban drain, Mill Creek, and Santa Ana River sites are shown in figure 5. DOM concentrations and fractionation patterns exhibited considerable variability as a function of watershed, storm, and time of sampling in the hydrograph. For Storm I, the urban drain (LP) and Mill Creek (MC) samples had the greatest DOM concentrations with the “first flush” of the runoff prior to peak flow, whereas the greatest DOM concen-trations at these sites were more associated with peak flow for Storms II and III. The wildland fires of October 2004 likely contributed to the large DOM concentrations in the urban drain and Mill Creek, but others sources such as oxidized oils and grease in street runoff also contribute, especially in the “first flush” in Storm I. The urban drain basin did not burn—it con-sists largely residential and light-industrial land use—but did have substantial ashfall from which DOM was likely leached. The very high DOM concentrations in the urban drain (LP) samples compared to Mill Creek (MC) and Santa Ana River (SAR) samples result from street runoff in which DOM is not attenuated by adsorption on soil or sedimentation in wetlands, or diluted by other water sources. The DOM fractionations of samples with large DOM concentrations shifted to larger percentages of hydrophobic neutral and hydrophobic acids as compared to the prestorm samples. The Santa Ana River has a delayed response in increasing DOM concentrations as compared to the urban drain and Mill Creek sites; this delayed response is likely caused by the water retention in the Prado Basin and by the buffering effects of the passage of the Santa Ana River through the Prado Wetlands upstream from Prado Dam.
Spectral Characterizations of Cyanuric Acid in Hydrophilic Acid plus Neutral Fractions
The unexpected appearance of several sharp peaks in the infrared spectra of certain hydrophilic acid plus neutral frac-tions initiated a manual search of an infrared spectral library handbook (Pouchert, 1985) to determine the origin of these peaks. Peaks near 3,210; 3,060; 1,780; 1,420; 1,400; 800; and 530 cm–1 matched the published spectrum of cyanuric acid in frequency, relative intensity, and peak shape. These peaks are shown in the infrared spectra (fig. 6) of the hydrophilic acid plus neutral fractions of Santa Ana River samples collected in Storm III. The prestorm sample (III-SAR-1) shows no cyanuric acid, but the peaks assigned to cyanuric acid become progressively larger as the sample number increases during the progression of the storm runoff (fig. 6).
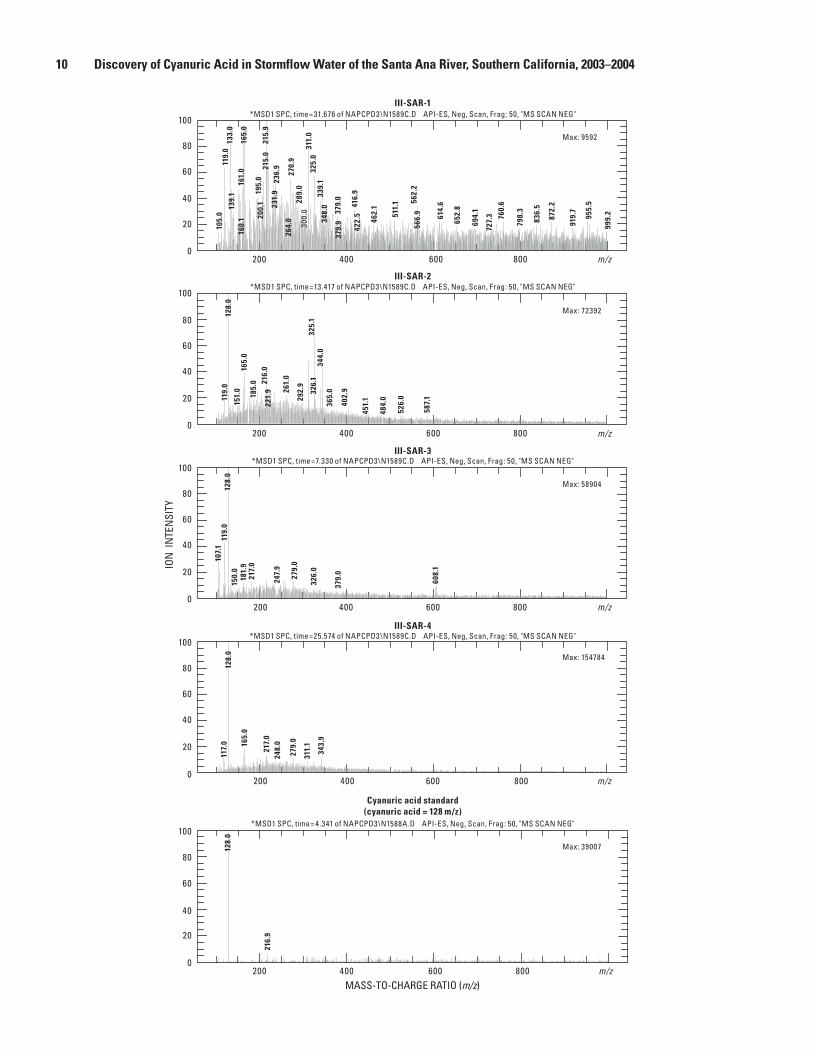
Electrospray/mass spectrometry of a cyanuric acid standard with negative ion detection gives a single negative ion of m/z of 128 (fig. 7). This ion corresponds to the singly charged deprotonated negative ion, as the molecular weight of cyanuric acid is 129. By itself, this single ion is not defini-tive evidence for cyanuric acid, but it provides additional
8 Discovery of Cyanuric Acid in Stormflow Water of the Santa Ana River, Southern California, 2003–2004
Figure 5. Bar diagrams of dissolved organic matter fractionations in stormflow samples.
[LP = urban drain; MC = Mill Creek; SAR = Santa Ana River; I, II, III = Storm number; 1, 2, 3, 4 = Sample number]
0
1
2
3
4
5
6
I-SAR-1 I-SAR-2 I-SAR-3 I-SAR-4 II-SAR-1 II-SAR-2 II-SAR-3 III-SAR-1 III-SAR-2 III-SAR-3 III-SAR-4
0
2
4
6
8
10
12
14
16
18
I-LP-1 I-LP-2 I-LP-3 II-LP-1 II-LP-2 II-LP-3 III-LP-1 III-LP-2 III-LP-3
0
1
2
3
4
5
6
I-MC-1 I-MC-2 1-MC-3/4 II-MC-1 II-MC-2 II-MC-3 III-MC-1 III-MC-2 III-MC-3 III-MC-4
Hydrophobic Neutrals
Hydrophobic Acids
Transphilic Acids plus Neutrals
Hydrophilic Acids plus NeutralsBases
Storm I
Storm I
Storm I
Storm II
Storm II
Storm II
Storm III
Storm III
Storm III
Urban Drain (LP) Samples
Mill Creek (MC) Samples
Santa Ana River (SAR) Samples
CON
CEN
TRAT
ION
, IN
MIL
LIG
RA
MS
PER
LITE
R

Cyanuric Acid in Stormflow Water 9
Figure 6. Infrared spectra of the hydrophilic acid plus neutral fractions from the Santa Ana River.
[SAR = Santa Ana River; I, II, III = Storm number; 1, 2, 3, 4 = Sample number; ND = Not detected]
independent supporting evidence in combination with the infrared and 13C-NMR spectral evidence. The hydrophilic acid plus neutral fractions suspected to contain cyanuric acid, based on previous infrared and 13C-NMR spectral assays, were directly infused into the electrospray/mass spectrometer with-out chromatographic separation from natural organic matter in order to compare relative amounts of cyanuric acid to the natural organic matter as detected by infrared and 13C-NMR spectrometry. The electrospray/mass spectra of the hydro-philic acid plus neutral fractions of Santa Ana River samples collected in Storm III (fig. 7) show increases in cyanuric acid (ion at 128 m/z) relative to natural DOM (all other ions), similar to that of the infrared spectra of these samples as seen in figure 6.
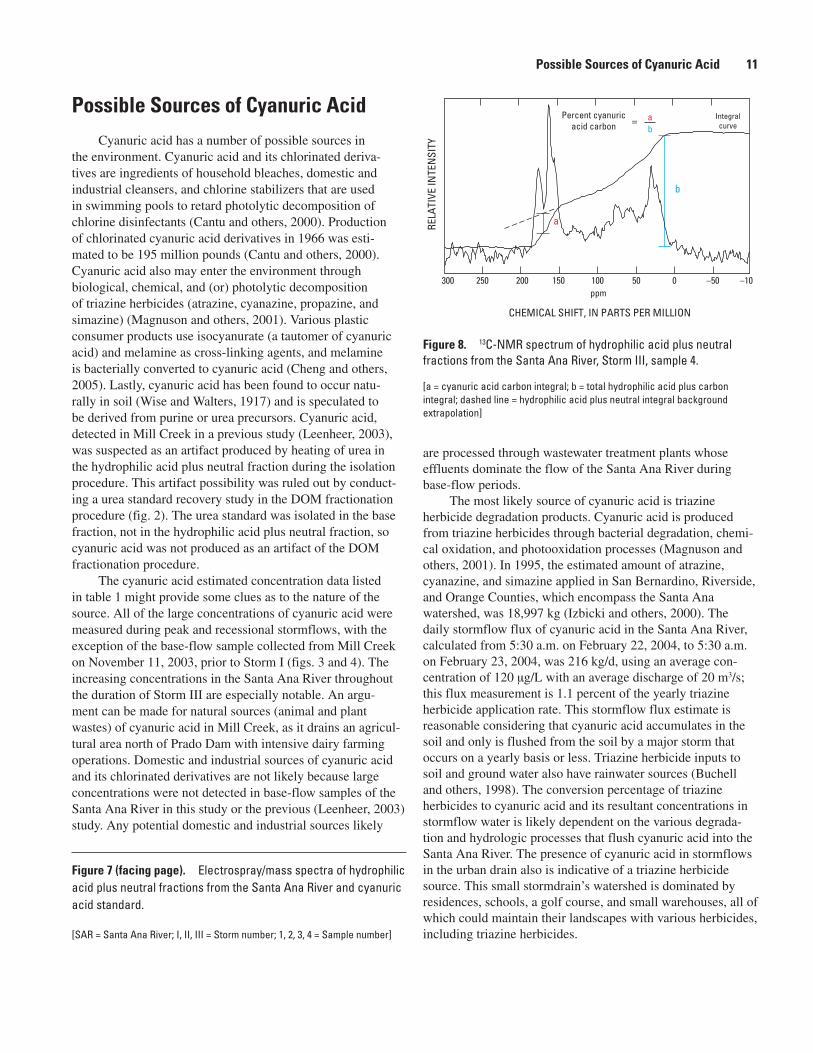
The 13C-NMR spectrum of the hydrophilic acid plus neu-tral fractions of the fourth Santa Ana River sample collected during Storm III is shown in figure 8. The peak at 163 ppm with a shoulder at 157 ppm is a tautomer of cyanuric acid with nonequivalent carbons that exist in the neutral salt form. The free acid form of cyanuric acid—obtained on hydrophilic acid plus neutral fractions of certain samples that gave dry prepara-tions upon freeze drying—gave a single peak at 153 ppm, in which all the carbons in the structure are equivalent.
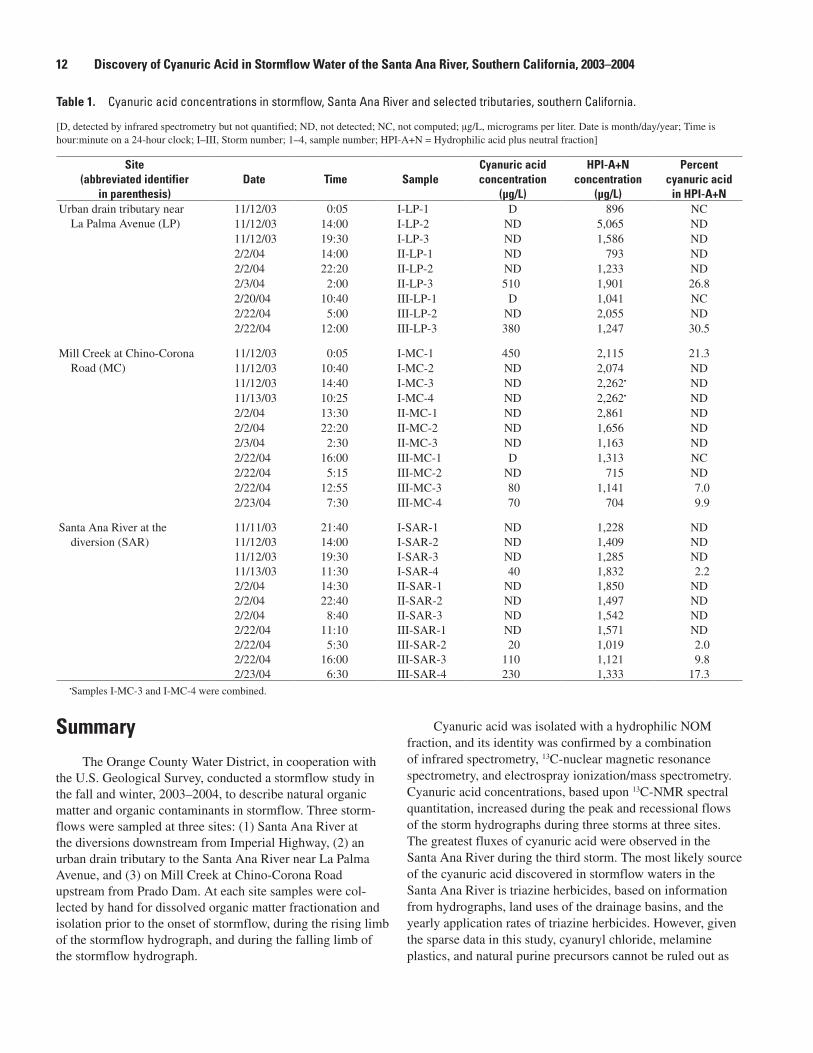
Quantitation of the percentage of cyanuric acid carbon in the hydrophilic acid plus neutral fraction is shown in figure 8. Cyanuric acid contains 30.3 percent carbon, and hydrophilic acid plus neutral fraction of natural DOM isolated in a similar manner contained 33 percent carbon (Leenheer and others, 2004). The errors inherent in obtaining quantitative 13C-NMR spectra (Wershaw and others, 2000), and the similarity of car-bon percentages between cyanuric acid and hydrophilic acid plus neutral DOM do not justify the use of conversion factors between cyanuric acid DOC percentages and cyanuric acid DOM percentages. Thus, an estimate (equation 1) of cyanuric acid concentrations in the water samples can be made by tak-ing the percentage carbon estimates from the integral curve of the 13C-NMR spectra and multiplying these percentages with the sample hydrophilic acid plus neutral concentrations shown in figure 8.
Cyanuric acid (µg/l) = HPI-A+N (µg/l) × (a/b) (l)
where
a = cyanuric acid carbon integral
and
b = total HPI-A+N carbon integral.
The results of these calculations are listed in table 1. The cyanuric acid concentration estimates in table 1 are minimum estimates because of analytical losses incurred in the extensive processing involved in the fractionation and isolation of the hydrophilic acid plus neutral fraction shown in figure 8. Cyanuric acid also does not have any protons directly attached to carbons in its structure; therefore, it likely gives a slightly lower response to CPMAS 13C-NMR than does the remainder of the hydrophilic acid plus neutral fraction, based upon response tests with a phloroglucinol/propionaldehyde condensation product (Wershaw and others, 2000).
There is little doubt about the identity of cyanuric acid in the Santa Ana River samples. It was detected by seven peaks in the infrared spectra that match peak frequency, relative intensity, and peak shape. It also was independently detected by both 13C-NMR and electrospray ionization/mass spectrometry.
RELA
TIVE
ABS
ORBA
NCE
WAVENUMBER, IN RECIPROCAL CENTIMETERS
4,000
3,600
3,200
2,800
2,400
2,000
1,800
1,600
1,400
1,200
1,000 80
060
040
0
cm–1
III-SAR-3
III-SAR-4
Cyanuricacid
III-SAR-1
III-SAR-1
Sample
230
110
20
ND
Cyanuric acid concentration,in micrograms
per liter
10 Discovery of Cyanuric Acid in Stormflow Water of the Santa Ana River, Southern California, 2003–2004
ION
IN
TEN
SITY
MASS-TO-CHARGE RATIO (m/z)m/z200 400 600 800
Cyanuric acid standard(cyanuric acid = 128 m/z)
128
.0
216
.9
*MSD1 SPC, time= 4.341 of NAPCPD3\N1588A.D API-ES, Neg, Scan, Frag: 50, "MS SCAN NEG"
Max: 39007
0
20
40
60
80
100
m/z200 400 600 800
III-SAR-4
128
.0
165
.0
217
.0
343
.9
279
.0
117
.0
311
.1
248
.0
Max: 154784
*MSD1 SPC, time=25.574 of NAPCPD3\N1589C.D API-ES, Neg, Scan, Frag: 50, "MS SCAN NEG"
m/z200 400 600 800
128
.0 1
19.0
107
.1
279
.0
181
.9 2
17.0
247
.9
608
.1
150
.0
326
.0
379
.0
III-SAR-3
III-SAR-2
III-SAR-1
*MSD1 SPC, time=7.330 of NAPCPD3\N1589C.D API-ES, Neg, Scan, Frag: 50, "MS SCAN NEG"
0
20
40
60
80
100
0
20
40
60
80
100
Max: 58904
0
20
40
60
80
100
m/z200 400 600 8000
20
40
60
80
100
*MSD1 SPC, time=31.676 of NAPCPD3\N1589C.D API-ES, Neg, Scan, Frag: 50, "MS SCAN NEG"
*MSD1 SPC, time=13.417 of NAPCPD3\N1589C.D API-ES, Neg, Scan, Frag: 50, "MS SCAN NEG"
m/z200 400 600 800
Max: 72392
Max: 9592
215
.9
133
.0
165
.0
311
.0
215
.0
119
.0
325
.0
270
.9
236
.9
161
.0
195
.0
339
.1
289
.0
562
.2
416
.9
231
.9
139
.1
379
.0
511
.1
614
.6
200
.1
760
.6
955
.5
872
.2
348
.0
462
.1
836
.5
652
.8
919
.7
798
.3
694
.1
300
.0
566
.9
999
.2
105
.0
727
.3
422
.5
160
.1
264
.0
379
.9
128
.0
325
.1 3
44.0
165
.0
216
.0
261
.0
326
.1
185
.0
119
.0
292
.9
151
.0
221
.9
402
.9
365
.0
451
.1
526
.0
587
.1
484
.0
Possible Sources of Cyanuric Acid 11
Possible Sources of Cyanuric AcidCyanuric acid has a number of possible sources in
the environment. Cyanuric acid and its chlorinated deriva-tives are ingredients of household bleaches, domestic and industrial cleansers, and chlorine stabilizers that are used in swimming pools to retard photolytic decomposition of chlorine disinfectants (Cantu and others, 2000). Production of chlorinated cyanuric acid derivatives in 1966 was esti-mated to be 195 million pounds (Cantu and others, 2000). Cyanuric acid also may enter the environment through biological, chemical, and (or) photolytic decomposition of triazine herbicides (atrazine, cyanazine, propazine, and simazine) (Magnuson and others, 2001). Various plastic consumer products use isocyanurate (a tautomer of cyanuric acid) and melamine as cross-linking agents, and melamine is bacterially converted to cyanuric acid (Cheng and others, 2005). Lastly, cyanuric acid has been found to occur natu-rally in soil (Wise and Walters, 1917) and is speculated to be derived from purine or urea precursors. Cyanuric acid, detected in Mill Creek in a previous study (Leenheer, 2003), was suspected as an artifact produced by heating of urea in the hydrophilic acid plus neutral fraction during the isolation procedure. This artifact possibility was ruled out by conduct-ing a urea standard recovery study in the DOM fractionation procedure (fig. 2). The urea standard was isolated in the base fraction, not in the hydrophilic acid plus neutral fraction, so cyanuric acid was not produced as an artifact of the DOM fractionation procedure.
The cyanuric acid estimated concentration data listed in table 1 might provide some clues as to the nature of the source. All of the large concentrations of cyanuric acid were measured during peak and recessional stormflows, with the exception of the base-flow sample collected from Mill Creek on November 11, 2003, prior to Storm I (figs. 3 and 4). The increasing concentrations in the Santa Ana River throughout the duration of Storm III are especially notable. An argu-ment can be made for natural sources (animal and plant wastes) of cyanuric acid in Mill Creek, as it drains an agricul-tural area north of Prado Dam with intensive dairy farming operations. Domestic and industrial sources of cyanuric acid and its chlorinated derivatives are not likely because large concentrations were not detected in base-flow samples of the Santa Ana River in this study or the previous (Leenheer, 2003) study. Any potential domestic and industrial sources likely
are processed through wastewater treatment plants whose effluents dominate the flow of the Santa Ana River during base-flow periods.
The most likely source of cyanuric acid is triazine herbicide degradation products. Cyanuric acid is produced from triazine herbicides through bacterial degradation, chemi-cal oxidation, and photooxidation processes (Magnuson and others, 2001). In 1995, the estimated amount of atrazine, cyanazine, and simazine applied in San Bernardino, Riverside, and Orange Counties, which encompass the Santa Ana watershed, was 18,997 kg (Izbicki and others, 2000). The daily stormflow flux of cyanuric acid in the Santa Ana River, calculated from 5:30 a.m. on February 22, 2004, to 5:30 a.m. on February 23, 2004, was 216 kg/d, using an average con-centration of 120 µg/L with an average discharge of 20 m3/s; this flux measurement is 1.1 percent of the yearly triazine herbicide application rate. This stormflow flux estimate is reasonable considering that cyanuric acid accumulates in the soil and only is flushed from the soil by a major storm that occurs on a yearly basis or less. Triazine herbicide inputs to soil and ground water also have rainwater sources (Buchell and others, 1998). The conversion percentage of triazine herbicides to cyanuric acid and its resultant concentrations in stormflow water is likely dependent on the various degrada-tion and hydrologic processes that flush cyanuric acid into the Santa Ana River. The presence of cyanuric acid in stormflows in the urban drain also is indicative of a triazine herbicide source. This small stormdrain’s watershed is dominated by residences, schools, a golf course, and small warehouses, all of which could maintain their landscapes with various herbicides, including triazine herbicides.
Figure 7 (facing page). Electrospray/mass spectra of hydrophilic acid plus neutral fractions from the Santa Ana River and cyanuric acid standard.
[SAR = Santa Ana River; I, II, III = Storm number; 1, 2, 3, 4 = Sample number]
Figure 8. 13C-NMR spectrum of hydrophilic acid plus neutral fractions from the Santa Ana River, Storm III, sample 4.
[a = cyanuric acid carbon integral; b = total hydrophilic acid plus carbon integral; dashed line = hydrophilic acid plus neutral integral background extrapolation]
RELA
TIVE
INTE
NSI
TY
ab
CHEMICAL SHIFT, IN PARTS PER MILLION
Integralcurve
Percent cyanuricacid carbon
a
b
300 250 200 150 100 050 –50 –10ppm
=
12 Discovery of Cyanuric Acid in Stormflow Water of the Santa Ana River, Southern California, 2003–2004
SummaryThe Orange County Water District, in cooperation with
the U.S. Geological Survey, conducted a stormflow study in the fall and winter, 2003–2004, to describe natural organic matter and organic contaminants in stormflow. Three storm-flows were sampled at three sites: (1) Santa Ana River at the diversions downstream from Imperial Highway, (2) an urban drain tributary to the Santa Ana River near La Palma Avenue, and (3) on Mill Creek at Chino-Corona Road upstream from Prado Dam. At each site samples were col-lected by hand for dissolved organic matter fractionation and isolation prior to the onset of stormflow, during the rising limb of the stormflow hydrograph, and during the falling limb of the stormflow hydrograph.
Cyanuric acid was isolated with a hydrophilic NOM fraction, and its identity was confirmed by a combination of infrared spectrometry, 13C-nuclear magnetic resonance spectrometry, and electrospray ionization/mass spectrometry. Cyanuric acid concentrations, based upon 13C-NMR spectral quantitation, increased during the peak and recessional flows of the storm hydrographs during three storms at three sites. The greatest fluxes of cyanuric acid were observed in the Santa Ana River during the third storm. The most likely source of the cyanuric acid discovered in stormflow waters in the Santa Ana River is triazine herbicides, based on information from hydrographs, land uses of the drainage basins, and the yearly application rates of triazine herbicides. However, given the sparse data in this study, cyanuryl chloride, melamine plastics, and natural purine precursors cannot be ruled out as
Table 1. Cyanuric acid concentrations in stormflow, Santa Ana River and selected tributaries, southern California.
[D, detected by infrared spectrometry but not quantified; ND, not detected; NC, not computed; µg/L, micrograms per liter. Date is month/day/year; Time is hour:minute on a 24-hour clock; I–III, Storm number; 1–4, sample number; HPI-A+N = Hydrophilic acid plus neutral fraction]
Site (abbreviated identifier
in parenthesis)Date Time Sample
Cyanuric acid concentration
(µg/L)
HPI-A+N concentration
(µg/L)
Percent cyanuric acid
in HPI-A+NUrban drain tributary near
La Palma Avenue (LP)11/12/03 0:05 I-LP-1 D 896 NC11/12/03 14:00 I-LP-2 ND 5,065 ND11/12/03 19:30 I-LP-3 ND 1,586 ND2/2/04 14:00 II-LP-1 ND 793 ND2/2/04 22:20 II-LP-2 ND 1,233 ND2/3/04 2:00 II-LP-3 510 1,901 26.82/20/04 10:40 III-LP-1 D 1,041 NC2/22/04 5:00 III-LP-2 ND 2,055 ND2/22/04 12:00 III-LP-3 380 1,247 30.5
Mill Creek at Chino-Corona Road (MC)
11/12/03 0:05 I-MC-1 450 2,115 21.311/12/03 10:40 I-MC-2 ND 2,074 ND11/12/03 14:40 I-MC-3 ND 2,262• ND11/13/03 10:25 I-MC-4 ND 2,262• ND2/2/04 13:30 II-MC-1 ND 2,861 ND2/2/04 22:20 II-MC-2 ND 1,656 ND2/3/04 2:30 II-MC-3 ND 1,163 ND2/22/04 16:00 III-MC-1 D 1,313 NC2/22/04 5:15 III-MC-2 ND 715 ND2/22/04 12:55 III-MC-3 80 1,141 7.02/23/04 7:30 III-MC-4 70 704 9.9
Santa Ana River at the diversion (SAR)
11/11/03 21:40 I-SAR-1 ND 1,228 ND11/12/03 14:00 I-SAR-2 ND 1,409 ND11/12/03 19:30 I-SAR-3 ND 1,285 ND11/13/03 11:30 I-SAR-4 40 1,832 2.22/2/04 14:30 II-SAR-1 ND 1,850 ND2/2/04 22:40 II-SAR-2 ND 1,497 ND2/2/04 8:40 II-SAR-3 ND 1,542 ND2/22/04 11:10 III-SAR-1 ND 1,571 ND2/22/04 5:30 III-SAR-2 20 1,019 2.02/22/04 16:00 III-SAR-3 110 1,121 9.82/23/04 6:30 III-SAR-4 230 1,333 17.3
•Samples I-MC-3 and I-MC-4 were combined.
References 13
possible sources. The daily flux of cyanuric acid in Santa Ana River stormflow during the third storm was calculated to be about 1 percent of the yearly application rate for triazine herbi-cides. Cyanuric acid was not detected in ground water at wells adjacent to the Santa Ana River.
Future studies of the source of cyanuric acid need to use analytical methods specifically targeted for cyanuric acid with limits of detection near 1 mg/L and should select study sites that are precursor specific. Triazine herbicide studies need to include application rates and soil and water concentrations of the parent compounds, measurements of deethylatrazine and deisopropylatrazine as intermediate metabolites of the degradation of triazine herbicides, and measurements of cyanuric acid as the final metabolite before complete degradation.
References
Buchell, T.D., Muller, S.R., Heberle, S., and Schwartzenback, R., 1998, Occurrence and behavior of pesticides in rainwater, roof runoff, and artificial stormwater infiltration: Environ-mental Science and Technology, v. 32, p. 3,457–3,464.
California Regional Water Quality Control Board, Santa Ana Region, 1999, General waste discharge require-ments for concentrated animal feeding operations (dair-ies and related facilities) within the Santa Ana Region: U.S. Environmental Protection Agency, Order No. 99–11, NPDES No. CAG018001, http://www.epa.gov/region09/animalwaste/generalfact.pdf, October 2, 2006.
Cantu, R., Evans, O., Kawahara, F.K., Shoemaker, J.A., and Dufour, A.P., 2000, An HPLC method with UV detection, pH control, and reductive ascorbic acid for cyanuric acid analysis in water: Analytical Chemistry, v. 72, p. 5,820–5,828.
Cheng, G., Shapir, N., Sadowsky, M.J., and Wackett, L.P., 2005, Allophanate hydrolase, not urease, functions in bacterial cyanuric acid metabolism: Applied Environmental Microbiology, v. 71, p. 4,437–4,445.
Izbicki, J.A., Mendez, G.O., and Burton, C.A., 2000, Storm-flow chemistry in the Santa Ana River below Prado Dam and at the diversion downstream from Imperial Highway, Southern California, 1995–98: U.S. Geological Survey Water-Resources Investigations Report 00–4127, 92 p.
Leenheer, J.A., 2003, Comprehensive characterization of dissolved and colloidal organic matter in waters associated with groundwater recharge at the Orange County Water Dis-trict: Fountain Valley, Calif., Orange County Water District, 20 p.
Leenheer, J.A., Croue, J.-P., Benjamin, M., Korshin, G.V., Hwang, C.J., Bruchet, A., and Aiken, G.R., 2000, Compre-hensive isolation of natural organic matter from water for spectral characterizations and reactivity testing, in Barret, S.E., Krasner, S.W., and Amy, G.L., eds., Natural organic matter and disinfection by-products: Washington D.C., ACS Symposium Series 761, American Chemical Society, p. 68–83.
Leenheer, J.A., Noyes, T.I., Rostad, C.E., and Davisson, M.L., 2004, Characterization and origin of polar organic matter from the Great Salt Lake: Biogeochemistry, v. 69, p. 25–41.
Magnuson, M.L., Kelty, C.A., and Cantu, R., 2001, Stable association complex electrospray mass spectrometry for the determination of cyanuric acid: Journal of the American Society of Mass Spectrometry, v. 12, p. 1,085–1,091.
Meade, R.H., 1995, Contaminants in the Mississippi River, 1987–92: U.S. Geological Survey Circular 1133, 140 p.
National Water Research Institute, 2004, Orange County Water District’s Santa Ana River water quality and health study––Report of the Scientific Advisory Panel: Fountain Valley, Calif., National Water Research Institute, 48 p.
Orange County Water District, 1996, Recharge—Building groundwater reserves: Fountain Valley, Calif., Orange County Water District, 2 p.
Pouchert, C.J., 1985, The Aldrich library of FT-IR Spectra: Milwaukee, Wis., Aldrich Chemical Company, 2,959 p.
Santa Ana Regional Water Quality Control Board, 2003, Santa Ana Region fact sheet: California Environmental Protection Agency, Santa Ana Regional Water Quality Con-trol Board, http://www.waterboards.ca.gov/santaana/html/region_overview.html, October 2, 2006.
U.S. Army Corps of Engineers, 1994, Water control manual. Prado Dam and reservoir. Santa Ana River, California: U.S. Army Corps of Engineers, Los Angeles District, 83 p.
U.S. Environmental Protection Agency, 1998, Drinking water contaminant candidate list: U.S. Environmental Protection Agency, Office of Water, Document no. 815–F–98–002.
Wershaw, R.L., Aiken, G.R., Leenheer, J.A., and Tregellas, J.R., 2000, Structural-group quantitation by CP/MAS 13C-NMR measurements of dissolved organic matter from natural surface waters, in Ghabbour, E.A., and Davies, G., eds, Humic substances—Versatile components of plants, soils, and water: Cambridge, United Kingdom, Royal Soci-ety of Chemistry, p. 63–81.
Wise, L.E., and Walters, E.H., 1917, Isolation of cyanuric acid from soil: Journal of Agricultural Research, v. 10, p. 85–91.