discovery of novel ovarian cancer biomarkers via proteomics and mass
TRANSCRIPT
DISCOVERY OF NOVEL OVARIAN CANCER BIOMARKERS VIA PROTEOMICS
AND MASS SPECTROMETRY
By
Chinthaka Geeth Gunawardana
A thesis submitted in conformity with the requirements for
the Degree of Doctor of Philosophy
Graduate Department of Laboratory Medicine and Pathobiology
University of Toronto
© Copyright by Chinthaka Geeth Gunawardana 2010
ii
DISCOVERY OF NOVEL OVARIAN CANCER BIOMARKERS VIA PROTEOMICS
AND MASS SPECTROMETRY
Chinthaka Geeth Gunawardana
Doctor of Philosophy 2010
Department of Laboratory Medicine and Pathobiology
University of Toronto
ABSTRACT
Proteins secreted or shed by tumors can be found in serum. Detecting these proteins by
mass spectrometry (MS) is difficult, due to the wide dynamic range of protein concentrations in
serum. To circumvent this issue, we mined the conditioned media of epithelial ovarian cancer
(EOC) cell lines which is a less complex fluid to work with. We hypothesize that some of the
proteins shed or secreted by EOC cell lines are similar to those secreted or shed by EOC tumors
and that some of these proteins can be used as biomarkers. We mined the conditioned medium
of four ovarian cancer cell lines (HTB75, TOV-112D, TOV-21G and RMUG-S) by two-
dimensional liquid chromatography-mass spectrometry. Our study identified 1208, 1252, 885,
and 463 proteins from the HTB-75, TOV-112D, TOV-21G, and RMUG-S cell lines
respectively. In all, we identified 2039 proteins from which we focused on 420 extracellular and
plasma membrane proteins. High abundance proteins such as albumin and immunoglobulins,
which are problematic for serum proteomics, did not interfere with our study. Several known
markers of EOC including CA-125, HE4, Mesothelin, and KLK6, were identified in this study.
The list of 420 extracellular and membrane proteins was cross-referenced with the proteome of
ascites fluid to generate a final list of 51 potential candidates. According to Ingenuity Pathway
Analysis, two of the top 10 diseases associated with our list of 51 proteins were cancer and
iii
reproductive diseases. Of the 51 candidates, 10 proteins were selected for verification in sera
from ovarian cancer patients and healthy individuals. Clusterin showed a significant difference
between cancer patients and normal, with sera from cancer patients showing higher levels.
Another protein, NPC2, did not show a difference in sera between cancer and normals. Protein
expression studies using immunohistochemistry showed that NPC2 is highly expressed in
ovarian cancer tissue and absent in normal ovarian surface epithelium. In summary, clusterin
and NPC2 appear to play a role in ovarian cancer pathobiology and their role in EOC need to be
studied further.

iv
DEDICATION
I want to dedicate this PhD dissertation to my beloved parents, Benadict and Padmini
Gunawardana. They have always been the symbol of fortitude in my life and I hope I made
them proud.
I also dedicate this work to those who are suffering from cancer. I pray that this work benefits
them soon.

v
ACKNOWLEDGEMENTS
I am grateful to my supervisor, Dr. Eleftherios P. Diamandis, for allowing me to work in his
first-class laboratory. This thesis would not have been possible without his guidance and
support. Dr. Diamandis is a great mentor and I am honoured to have worked under his
supervision.
I like to acknowledge the following members of my PhD advisory and oral examination
committee for their guidance and advice during the last five years:
Dr. Sylvia Asa
Dr. Alexander Romaschin
Dr. Joe Minta
Dr. Margaret Fahnestock
I want to extend my thanks to the Department of Laboratory Medicine and Pathobiology at the
University of Toronto, as well as the Samuel Lunenfeld Institute and the Department of
Pathology and Laboratory Medicine at the Mount Sinai Hospital. In addition, I want to thank
Dr. Constantina Petraki for her help in this study and Dr. Peter Lobel, who was gracious to share
his research with us.
To the staff I had the honour and privilege of working with over the last five years at the
Advanced Centre for Detection of Cancer (ACDC) Laboratory, I thank you for your support. I
want to write a special thank you to the lab managers, Antoninus Soosaipillai, Tammy Earle,

vi
and Linda Grass. It is their hard work that keeps everyday lab operations running smoothly. I
like to thank you so much for your technical support, expertise, and of course, friendship.

vii
TABLE OF CONTENTS
ABSTRACT .................................................................................................................... II
DEDICATION.................................................................................................................IV
ACKNOWLEDGEMENTS...............................................................................................V
TABLE OF CONTENTS ...............................................................................................VII
LIST OF TABLES ...........................................................................................................X
LIST OF FIGURES ........................................................................................................XI
LIST OF ABBREVIATIONS........................................................................................ XIV
CHAPTER 1: GENERAL INTRODUCTION ..................................................................1
1.1 Ovarian Cancer..................................................................................................................................................... 21.1.1 Anatomy of the Human Ovary........................................................................................................................ 21.1.2 Ovarian Cancer ............................................................................................................................................... 3
1.4 Cancer Biomarkers............................................................................................................................................. 171.4.1 Types of Biomarkers..................................................................................................................................... 171.4.2 The Ideal Tumor Marker............................................................................................................................... 191.4.3 Cancer Antigen-125...................................................................................................................................... 20
1.5 Mechanisms of biomarker elevation in biological fluids................................................................................. 22
1.6 Proteomics and ovarian cancer ......................................................................................................................... 231.6.1 Principles and instrumentation...................................................................................................................... 231.6.2 Ovarian cancer proteomics: sources to mine for biomarkers ....................................................................... 25
1.7 Purpose and aims of the present study ............................................................................................................. 271.7.1 Rationale ....................................................................................................................................................... 271.7.2 Hypothesis .................................................................................................................................................... 281.7.3 Objectives ..................................................................................................................................................... 28
CHAPTER 2: PROTEOMIC ANALYSIS OF CELL-CULTURE SUPERNATANTS BY 2D-LC MASS SPECTROMETRY .................................................................................30
2.1 Introduction ........................................................................................................................................................ 31
2.2 Materials and Methods ...................................................................................................................................... 342.2.1 Cell lines ....................................................................................................................................................... 34
viii
2.2.2 Cell Culture................................................................................................................................................... 342.2.3 Sample Preparation ....................................................................................................................................... 342.2.4 Strong Cation Exchange Chromatography ................................................................................................... 352.2.5 Mass Spectrometry ....................................................................................................................................... 352.2.6 Data Analysis ................................................................................................................................................ 36
2.3 Results.................................................................................................................................................................. 382.3.1 Optimization of culture conditions ............................................................................................................... 382.3.2 Identification of Proteins by Mass Spectrometry ......................................................................................... 392.3.3 Identification of internal control proteins ..................................................................................................... 392.3.4 Intracellular and intercellular overlap........................................................................................................... 412.3.5 Cellular localization ...................................................................................................................................... 41
2.4 Discussion ............................................................................................................................................................ 48
CHAPTER 3: CANDIDATE SELECTION AND VERIFICATION IN SERUM BY ELISA......................................................................................................................................54
3.1 Introduction..................................................................................................................................................... 55
3.2 Materials and Methods ...................................................................................................................................... 563.2.1 Immunoassays............................................................................................................................................... 563.2.2 Biotinylation of detection antibody .............................................................................................................. 573.2.3 Clinical Specimens ....................................................................................................................................... 583.2.4 Statistical Analysis........................................................................................................................................ 58
3.3 Results.................................................................................................................................................................. 593.3.1 Selection of candidates ................................................................................................................................. 593.3.2 Construction of immunoassays ..................................................................................................................... 643.3.3 Preclinical Validation of candidates ............................................................................................................. 65
3.4 Discussion ............................................................................................................................................................ 72
CHAPTER 4: STUDY OF CANDIDATE PROTEIN EXPRESSION IN OVARIAN CANCER TISSUE BY IMMUNOHISTOCHEMISTRY...................................................75
4.1 Introduction ........................................................................................................................................................ 76
4.2 Materials and Methods ...................................................................................................................................... 824.2.1 Materials ....................................................................................................................................................... 824.2.2 Tumor specimens.......................................................................................................................................... 824.2.3 Immunostaining ............................................................................................................................................ 824.2.4 Evaluation of immunohistochemical staining............................................................................................... 83
4.3 Results.................................................................................................................................................................. 844.3.1 ADAM15 expression .................................................................................................................................... 844.3.2 Clusterin expression...................................................................................................................................... 854.3.3 EPCR Expression.......................................................................................................................................... 924.3.4 ICAM 5 Expression ...................................................................................................................................... 964.3.5 IGFBP5 Expression .................................................................................................................................... 1004.3.6 IGFBP7 Expression .................................................................................................................................... 1004.3.7 Integrin β4 Expression ................................................................................................................................ 104
ix
4.4 Discussion .......................................................................................................................................................... 111
CHAPETER 5: ANTIBODY PRODUCTION AND IMMUNOASSAY DEVELOPMENT FOR NPC2 ..................................................................................................................117
5.1 Introduction ...................................................................................................................................................... 118
5.2 Materials and Methods .................................................................................................................................... 1205.2.1 Biological specimens .................................................................................................................................. 1205.2.2 NPC2 purification from seminal plasma .................................................................................................... 1205.2.3 In-Gel Digestion ......................................................................................................................................... 1215.2.4 Mass spectrometric analysis ....................................................................................................................... 1225.2.5 PIM assay design ........................................................................................................................................ 1235.2.6 Rabbit immunization................................................................................................................................... 1245.2.7 Antibody purification.................................................................................................................................. 1245.2.8 Western Blotting ......................................................................................................................................... 1255.2.9 Biotinylation of detection antibody ............................................................................................................ 1255.2.10 Immunoassays........................................................................................................................................... 125
5.3 Results................................................................................................................................................................ 1285.3.1 Analysis of Cell Culture Supernatants........................................................................................................ 1285.3.2 Analyzing complex fluids for NPC2 .......................................................................................................... 1285.3.2 Development of Product Ion Monitoring Assay for NPC2. ....................................................................... 1285.3.4 Development of a high-throughput screening assay for NPC2. ................................................................. 1385.3.5 Development of Polyclonal anti-NPC2 antibody ....................................................................................... 1455.3.6 Construction of NPC2 immunoassay.......................................................................................................... 1495.3.5 Measuring NPC2 in serum.......................................................................................................................... 152
5.4 Discussion .......................................................................................................................................................... 160
CHAPTER 6: SUMMARY AND FUTURE DIRECTIONS ..........................................163
6.1 Summary ........................................................................................................................................................... 1646.1.1 Key Findings............................................................................................................................................... 1646.1.2 Proof of Hypothesis .................................................................................................................................... 167
6.2 Future Directions .............................................................................................................................................. 170
REFERENCES............................................................................................................172
x
List of Tables
Table Title Page
Table 1.1: Types of Malignant Ovarian Tumors 8
Table 1.2: Risk and Protective Factors in Ovarian Cancer 10
Table 1.3: International Federation of Obstetrics and Gynecology Staging 14
Table 2.1: Previously studied proteins in EOC that were identified in this study. 47
Table 3.1: List of 51 protein candidates. 60-61
Table 4.1: Properties of the IGFBP 1-7 78
Table 4.2: ADAM15 expression in ovarian tumors (proportion of positive cases) 86
Table 4.3: Clusterin expression in ovarian tumors (proportion of positive cases) 89
Table 4.4: EPCR expression in ovarian tumors (proportion of positive cases) 93
Table 4.5: ICAM5 expression in ovarian tumors (proportion of positive cases) 97
Table 4.6: IGFBP5 expression in ovarian tumors (proportion of positive cases) 101
Table 4.7: IGFBP7 expression in ovarian tumors (proportion of positive cases) 105
Table 4.8: Integrin β4 expression in ovarian tumors (proportion of positive cases) 108
Table 5.1: Number of peptides of NPC2 identified in ovarian cancer cell lines 129
Table 5.2: Tryptic peptides of NPC2 identified by mass spectrometry 132
Table 5.3: NPC2 expression in ovarian tumors (proportion of positive cases) 156
xi
List of Figures
Figure Title Page
Figure 2.1: Experimental workflow 40
Figure 2.2: Overlap of proteins identified in the three replicates for each cell line 43
Figure 2.3: Intercellular overlap of all proteins identified in this study 44
Figure 2.4: The number of proteins identified in each subcellular compartment for each cell line
45
Figure 2.5: The number of proteins identified in each subcellular compartment 46
Figure 2.6: Comparing the proteins identified in this study with those found in other proteomic profiling studies for ovarian cancer
53
Figure 3.1: The major biological functions associated with the 51 candidate proteins 62
Figure 3.2: The major diseases associated with the 51 candidate proteins 63
Figure 3.3. Initial screening results of the 8 candidates tested in serum of EOC patients and healthy individuals
67
Figure 3.4: Proteins that interact with clusterin 70
Figure 3.5: Proteins that interact with IGFBP6 71
Figure 4.1: Immunohistochemical expression of ADAM15 in the four major types of epithelial ovarian cancer
87
Figure 4.2: Immunohistochemical expression of ADAM15 in normal surface epithelium 88
Figure 4.3: Immunohistochemical expression of Clusterin in the four major types of epithelial ovarian cancer
90
Figure 4.4: Immunohistochemical expression of Clusterin in normal surface epithelium 91
Figure 4.5: Immunohistochemical expression of EPCR in the four major types of epithelial ovarian cancer
94
Figure 4.6: Immunohistochemical expression of EPCR in normal surface epithelium 95
Figure 4.7: Immunohistochemical expression of ICAM5 in the four major types of epithelial ovarian cancer
98
Figure 4.8: Immunohistochemical expression of ICAM5 in normal surface epithelium 99
xii
Figure 4.9: Immunohistochemical expression of IGFBP5 in the four major types of epithelial ovarian cancer
102
Figure 4.10: Immunohistochemical expression of IGFBP5 in normal surface epithelium 103
Figure 4.11: Immunohistochemical expression of IGFBP7 in the four major types of epithelial ovarian cancer
106
Figures 4.12: Immunohistochemical expression of IGFBP7 in normal surface epithelium 107
Figure 4.13: Immunohistochemical expression of Integrin β4 in the four major types of epithelial ovarian cancer
109
Figures 4.14: Immunohistochemical expression of Integrin β4 in normal surface epithelium
110
Figure 5.1: LC-MS/MS analysis of semi-purified NPC2 protein showing the identification of proteotypic peptide A (upper panel) and the MS/MS daughter ions produced after fragmentation of peptide A (lower panel)
133
Figure 5.2: LC-MS/MS analysis of semi-purified NPC2 protein showing the identification of proteotypic peptide B (upper panel) and the MS/MS daughter ions produced after fragmentation of peptide B (lower panel)
134
Figure 5.3: Direct ELISA for NPC2 in gel filtration fractions 136
Figure 5.4: PIM assay using the NPC2 standard for calibrating the mass spectrometer 137
Figure 5.5: PIM assay on malignant ovarian ascites sample 1 140
Figure 5.6: PIM assay on malignant ovarian ascites sample 2 141
Figure 5.7: PIM assay on malignant ovarian ascites sample 3 142
Figure 5.8: PIM assay on malignant ovarian ascites sample 4 143
Figure 5.9: PIM assay on malignant ovarian ascites sample 5 144
Figure 5.10: Ion-exchange fractions separated by SDS-PAGE 147
Figure 5.11: Determining the presence of anti-NPC2 antibodies in rabbit antisera 148
Figure 5.12: Verifying the specificity of the new rabbit polyclonal anti-NPC2 antibody 150
Figure 5.13: NPC2 calibration curve for the NPC2 sandwich-type ELISA 151
Figure 5.14: Levels of NPC2 in sera from patients with ovarian cancer and healthy individuals
154
Figure 5.15: Immunohistochemical expression of NPC2 in the four major types of epithelial ovarian cancer
157

xiii
Figures 5.16: Immunohistochemical expression of NPC2 in normal surface epithelium 158
Figure 6.1: Flow chart representing the criteria used for candidate selection 165
xiv
LIST OF ABBREVIATIONS
ACN, Acetonitrile
ALP, alkaline phosphatase
BSA, bovine serum albumin
CA125, carbohydrate antigen 125
CM, Conditioned media
CT, computed axial tomography
DFP, diflunisal phosphate
DNA, deoxyribonucleic acid
DTT, dithiothreitol
EDTA, ethylenediamine tetra-acetic acid
ELISA, enzyme-linked immunosorbent assay
EOC, Epithelial ovarian cancer
EPCR, Endothelial protein C receptor ESI, electrospray ionization
FBS, Fetal bovine serum
FIGO, International Federation of Gynecology and Oncology
xv
FT-ICR, fourier-transform ion-cyclotron resonance
GO, gene ontology
HNPCC, hereditary nonpolyposis colorectal cancer
IGFBP, Insulin-like growth factor binding protein IPI, international protein index
kDa, kilodalton
KLK6, kallikrein 6
m/z, mass-to-charge ratio
MALDI, matrix-assisted laser desorption/ionization
MRM, multiple reaction monitoring
MS, mass spectrometry
MS/MS, tandem mass spectrometry
P value, probability value
PIM, product ion monitoring
RNA, ribonucleic acid
SCX, strong cation exchange chromatography
SRM, single reaction monitoring

xvi
TOF, time of flight
VEGF, vascular endothelial growth factor
WHO, world health organization

1
Chapter 1: General Introduction

2
1.1 Ovarian Cancer
1.1.1 Anatomy of the Human Ovary
The ovaries are the female equivalent of the testes in males. They are a pair of nodular
bodies, each one situated on the left and right side of the uterus, in relation to the lateral pelvic
wall. The ovaries are responsible for generating ova (eggs) and the female sex hormones,
estrogen and progesterone. They are suspended by peritoneal folds and ligaments on either side
of the uterus and attached to the back of the broad ligament of the uterus, behind and below the
uterine tubes. On average they measure between 3 to 5 cm in length and weigh between 2 to 4
grams.
The surface epithelium, the stromal cells, and the oocytes are the main types of cells
found in the ovary. The surface epithelium, which is derived from the coelomic epithelium,
lines the external surface of the ovaries and is a single cell layer of flat-to-cuboidal cells. The
coelomic epithelium also gives rise to the peritoneum, endometrium, endocervix and
endosalpinx. The stroma is made up of soft tissue that has an abundant supply of blood vessels.
It consists, for the most part, of spindle-shaped cells with a minority of connective tissue
dispersed here and there. Due to the similarities in resemblance some anatomists liken stromal
cells to unstriped muscle, whereas others have described them as being similar to connective-
tissue cells. On the surface of the organ (below the surface epithelium) the stromal tissue is
more condensed, and forms a layer (tunica albuginea) composed of short connective-tissue
fibres, with fusiform cells amongst them. Interstitial cells resembling those found in the testis
may also be found in the ovarian stroma. Germ cells or oocytes are found near the periphery of
the ovaries. The granulose cells surround the germinal cells that form the follicles. The stroma

3
immediately surrounding the follicles differentiates into elongated cells known as theca cells,
which produce androgens such as androstenedione when stimulated by luteinizing hormone.
1.1.2 Ovarian Cancer
1.1.2.1 Symptoms of ovarian cancer
Clinically, ovarian cancers often present as a mass in the pelvis. Over 80% of patients
have symptoms even when the disease is limited to the ovaries (58). Symptoms for ovarian
cancer can be grouped into abdominal, gastrointestinal, genitourinary and pelvic response
symptoms (131). These symptoms include increased abdominal size, abdominal bloating,
fatigue, abdominal pain, indigestion, urinary frequency, pelvic pain, constipation, urinary
incontinence, back pain, pain with intercourse, early satiety, weight loss, nausea, bleeding with
intercourse, deep venous thrombosis and diarrhea (107). Given that these symptoms mimic
benign conditions, they are not suitable for early diagnosis. According to the most recent report
released by the Canadian Cancer Society there will be 2500 new cases of ovarian cancer in
2009. Approximately, 1750 will succumb to the disease in 2009. Furthermore, the report
predicts a 1.4% chance for a woman to develop ovarian cancer in her lifetime and a 1.1%
chance of dying from the illness. Regardless of the stage, the 5-year survival rate is
approximately 45%, however if caught in the early stages the 5-year survival rate jumps to 95%.
1.1.2.2 Types of ovarian cancer
Ovarian cancer is a heterogeneous disease and tumors can be categorized based on the
cells of origin. The majority of tumors of the ovaries fall into one of three major categories:
surface epithelial tumors, sex cord-stromal tumors and germ cell tumors. Approximately, 10-
15% of ovarian cancer cases are sex cord-stromal tumors. More than 50% of stromal cell

4
tumors are seen in postmenopausal women over the age of 50. Some cases are also seen in
young girls. Female reproductive hormones are produced in some stromal cell tumors. This
results in vaginal bleeding in postmenopausal women, or precocious puberty in young girls. In
rare situations, male hormones can be produced resulting in menstrual irregularities, hirsutism,
and virilism. Common types of malignant stromal cell tumors include granulosa cell tumors,
theca cell tumors, sertoli-leydig cell tumors, and hilar cell tumors. About 5-10% of ovarian
cancer cases are germ cell tumors, which arise from the oocytes. These are more common in
adolescent girls and accounts for approximately 60% of ovarian tumors in women below 20
years of age (123). Teratomas, dysterminomas, endodermal sinus tumors, and choriocarcinomas
are the typical examples of germ cell tumors.
Epithelial ovarian cancer (EOC), the most lethal among all ovarian malignancies, arises
from the ovarian surface epithelium and makes up 80% of all ovarian cancer cases (7, 69).
Since epithelial ovarian cancer accounts for the majority of ovarian cancers, research is mainly
focused on diagnosis and treatment of EOC. The present study also focuses on this particular
form of ovarian cancer.
EOC can be either benign or malignant. The benign tumors seldom spread from the
ovaries and are not associated with serious disease. Benign tumors include serous adenomas,
mucinous adenomas, and Brenner tumors (173). Malignant tumors of the ovarian surface
epithelium are known as carcinomas. These malignancies have the potential to spread into the
proximal and distal areas of the body and therefore can cause life-threatening disease. Based
on tissue morphology, EOC can be subdivided into four major types: Serous, mucinous,
endometrioid, and clear-cell carcinomas. In addition there are other minor types of EOC such as
malignant Brenner tumors and undifferentiated carcinomas (153).
5
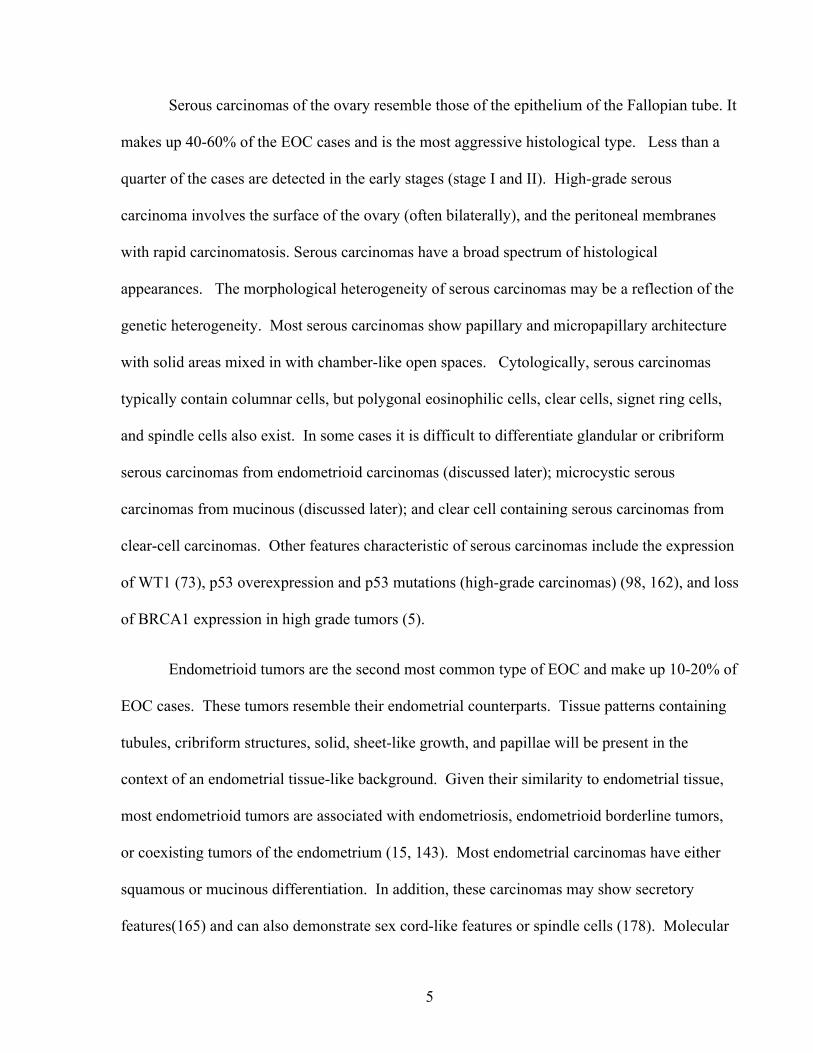
Serous carcinomas of the ovary resemble those of the epithelium of the Fallopian tube. It
makes up 40-60% of the EOC cases and is the most aggressive histological type. Less than a
quarter of the cases are detected in the early stages (stage I and II). High-grade serous
carcinoma involves the surface of the ovary (often bilaterally), and the peritoneal membranes
with rapid carcinomatosis. Serous carcinomas have a broad spectrum of histological
appearances. The morphological heterogeneity of serous carcinomas may be a reflection of the
genetic heterogeneity. Most serous carcinomas show papillary and micropapillary architecture
with solid areas mixed in with chamber-like open spaces. Cytologically, serous carcinomas
typically contain columnar cells, but polygonal eosinophilic cells, clear cells, signet ring cells,
and spindle cells also exist. In some cases it is difficult to differentiate glandular or cribriform
serous carcinomas from endometrioid carcinomas (discussed later); microcystic serous
carcinomas from mucinous (discussed later); and clear cell containing serous carcinomas from
clear-cell carcinomas. Other features characteristic of serous carcinomas include the expression
of WT1 (73), p53 overexpression and p53 mutations (high-grade carcinomas) (98, 162), and loss
of BRCA1 expression in high grade tumors (5).
Endometrioid tumors are the second most common type of EOC and make up 10-20% of
EOC cases. These tumors resemble their endometrial counterparts. Tissue patterns containing
tubules, cribriform structures, solid, sheet-like growth, and papillae will be present in the
context of an endometrial tissue-like background. Given their similarity to endometrial tissue,
most endometrioid tumors are associated with endometriosis, endometrioid borderline tumors,
or coexisting tumors of the endometrium (15, 143). Most endometrial carcinomas have either
squamous or mucinous differentiation. In addition, these carcinomas may show secretory
features(165) and can also demonstrate sex cord-like features or spindle cells (178). Molecular
6
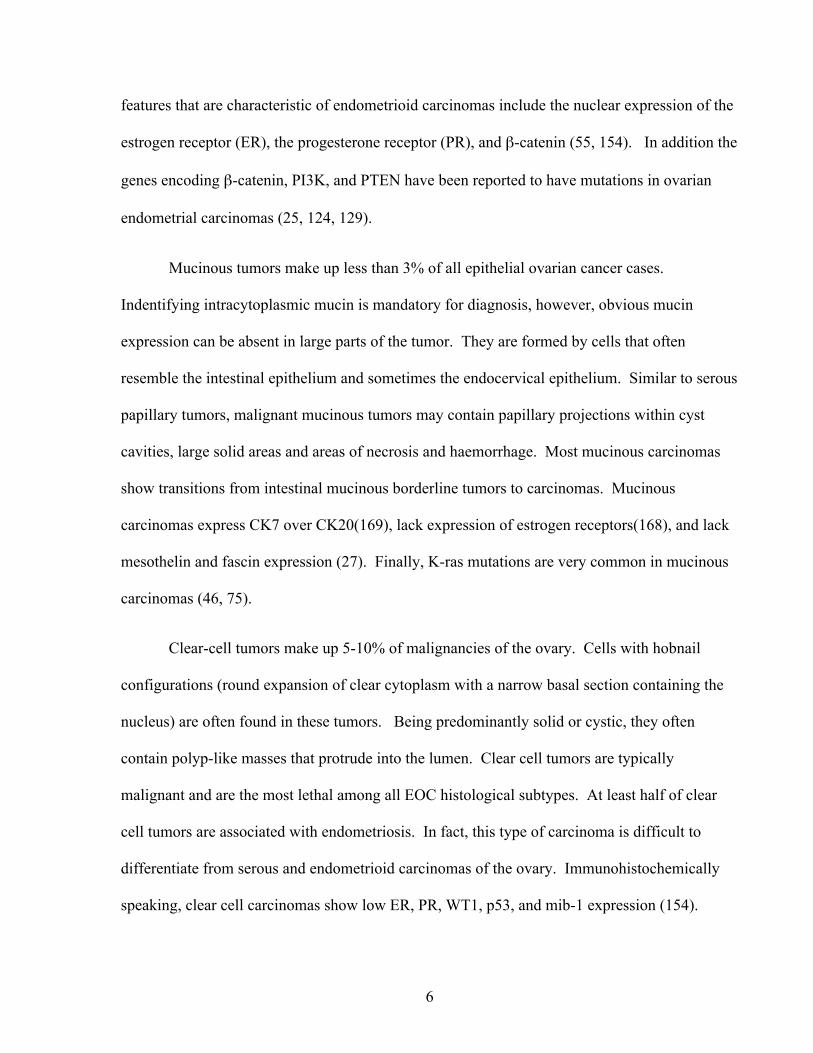
features that are characteristic of endometrioid carcinomas include the nuclear expression of the
estrogen receptor (ER), the progesterone receptor (PR), and β-catenin (55, 154). In addition the
genes encoding β-catenin, PI3K, and PTEN have been reported to have mutations in ovarian
endometrial carcinomas (25, 124, 129).
Mucinous tumors make up less than 3% of all epithelial ovarian cancer cases.
Indentifying intracytoplasmic mucin is mandatory for diagnosis, however, obvious mucin
expression can be absent in large parts of the tumor. They are formed by cells that often
resemble the intestinal epithelium and sometimes the endocervical epithelium. Similar to serous
papillary tumors, malignant mucinous tumors may contain papillary projections within cyst
cavities, large solid areas and areas of necrosis and haemorrhage. Most mucinous carcinomas
show transitions from intestinal mucinous borderline tumors to carcinomas. Mucinous
carcinomas express CK7 over CK20(169), lack expression of estrogen receptors(168), and lack
mesothelin and fascin expression (27). Finally, K-ras mutations are very common in mucinous
carcinomas (46, 75).
Clear-cell tumors make up 5-10% of malignancies of the ovary. Cells with hobnail
configurations (round expansion of clear cytoplasm with a narrow basal section containing the
nucleus) are often found in these tumors. Being predominantly solid or cystic, they often
contain polyp-like masses that protrude into the lumen. Clear cell tumors are typically
malignant and are the most lethal among all EOC histological subtypes. At least half of clear
cell tumors are associated with endometriosis. In fact, this type of carcinoma is difficult to
differentiate from serous and endometrioid carcinomas of the ovary. Immunohistochemically
speaking, clear cell carcinomas show low ER, PR, WT1, p53, and mib-1 expression (154).
7
Mutations in K-ras (127) and PTEN (146) have also been reported. However, solid markers that
can positively identify clear-cell ovarian carcinoma have not been found.
Other types of EOC include undifferentiated tumors, which consist of highly malignant
epithelial tumors that lack any specific differentiation with diffuse solid areas as the
predominant component. They do not resemble any of the above subtypes and tend to grow and
spread the fastest. Borderline tumors make up a large percentage of EOC cases (up to 10%).
They do not appear cancerous and are characterized as having low malignant potential.
Borderline tumors mostly behave as benign tumors and have good prognosis, but some may
recur after surgical removal and others may metastasize within the abdominal cavity. Most
borderline tumors are similar to serous and mucinous histologically and occur mainly in young
women. The list of malignant ovarian tumors is shown in Table 1.1.

8
Table 1.1: Types of Malignant Ovarian Tumors (173) 1. Common epithelial tumors
A. Serous tumors B. Mucinous tumors C. Endometrioid tumors D. Clear cell carcinomas E. Brenner Tumors F. Mixed epithelial tumors G. Undifferentiated carcinomas H. Unclassified tumors
2. Specialized stromal cell cancers A. Granulosa cell tumors B. Theca cell tumors C. Sertoli-Leydig cell tumors D. Hilar cell tumors
3. Germ cell tumors A. Teratomas B. Mature teratomas C. Immature teratomas D. Struma ovarli E. Carcinoids F. Dysgerminomas G. Embryonal cell carcinomas H. Endodermal sinus tumors I. Primary choriocarcinomas J. Gonadoblastomas
4. Soft tissue tumors not specific to the ovary 5. Unclassified tumors 6. Secondary (metastatic) tumors 7. Tumor-like conditions

9
1.1.3.1 Epidemiology
Accounting for approximately 3% of all new cancer cases in 2009, ovarian cancer ranks
fifth in cancer-related deaths in women. Although rare in comparison to breast cancer (1 in 7)
and prostate (1 in 6), ovarian cancer (1 in 59) is the most lethal gynecological malignancy and
overall one of the most lethal types of cancer, accounting for more deaths than endometrial and
cervical cancer combined (81). The median age of patients with epithelial ovarian cancer is 60
years (26). Among the risk factors for ovarian cancer, a strong family history of either ovarian
or breast cancer remains the most important one. However, the majority of ovarian cancer cases
are sporadic and only 5% of affected women have an identifiable genetic predisposition. Most
familial cases of EOC are related to mutations in the BRCA1/BRCA2 genes (26). Hereditary
ovarian cancer generally occurs 10 years earlier in comparison to familiar ovarian cancer cases
and is characterized by a trend towards an earlier age of diagnosis at each successive generation
(59). Ovarian cancer is a component of three hereditary cancer syndromes, namely breast-
ovarian cancer syndrome, site-specific ovarian cancer syndrome, and hereditary nonpolyposis
colorectal cancer (HNPCC)(59, 107). In addition to hereditary predisposition, other identified
risk factors include endocrine, environmental, dietary, and genetic factors (Table 1.2)(107).
More specifically, advancing age, nulliparity, hormonal therapy and exposure to talc have been
associated with increased risk (131). In contrast, the use of oral contraceptives, pregnancy, and
lactation are associated with reduced risk. Some of these findings suggest that continued
stimulation of the ovarian epithelium due to uninterrupted ovulation might increase the risk of
malignant transformation (172).
10
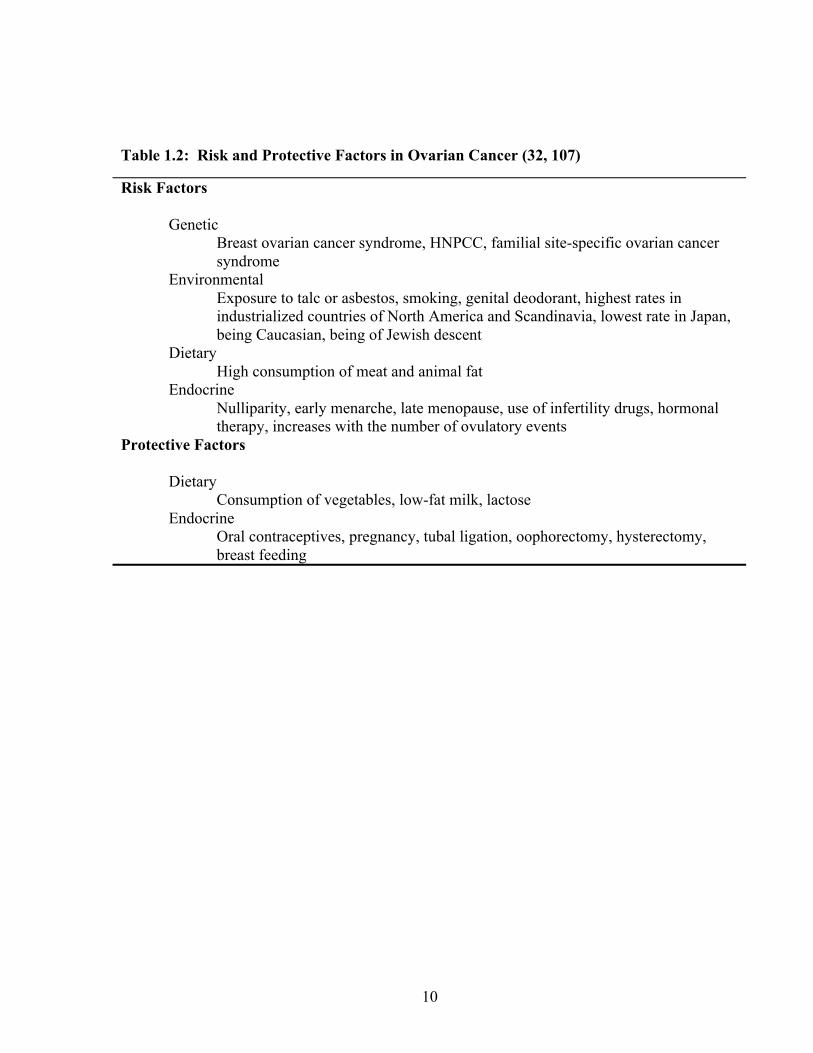
Table 1.2: Risk and Protective Factors in Ovarian Cancer (32, 107)
Risk Factors
Genetic Breast ovarian cancer syndrome, HNPCC, familial site-specific ovarian cancer syndrome
Environmental Exposure to talc or asbestos, smoking, genital deodorant, highest rates in industrialized countries of North America and Scandinavia, lowest rate in Japan, being Caucasian, being of Jewish descent
Dietary High consumption of meat and animal fat
Endocrine Nulliparity, early menarche, late menopause, use of infertility drugs, hormonal therapy, increases with the number of ovulatory events
Protective Factors
Dietary Consumption of vegetables, low-fat milk, lactose
Endocrine Oral contraceptives, pregnancy, tubal ligation, oophorectomy, hysterectomy, breast feeding
11
1.1.3.2 Etiology
There have been several hypotheses proposed regarding the beginnings of EOC. The
incessant ovulation hypothesis was developed when it appeared that women with a greater
number of ovulatory cycles have an increased risk of ovarian cancer (50). According to this
hypothesis, uninterrupted ovulation leads to a continuous cycle of damage and repair of the
surface epithelium. The repair mechanisms place the cells at an increased risk of developing
mutations and subsequent progression into a cancer. Additionally, higher ovulatory activity is
associated with more inclusion cysts and other changes in the ovarian surface, such as
invaginations. These inclusion cysts may be a suitable environment for ovarian cancer
development (51). Consistent with this hypothesis, women with multiple pregnancies,
increased time of lactation, and oral contraceptive use have a lower incidence of ovarian
cancer(64, 119, 172). However, this theory is weakened by the fact that progesterone-based oral
contraceptives that do not inhibit ovulation are equally effective as ovulation inhibiting
contraceptives (137). In addition, women with polycystic ovarian syndrome whose ovulatory
cycles are reduced, have a high risk of developing EOC (147).
Failure of the incessant ovulation hypothesis to explain certain observations such those
mentioned above led to the gonadotropin hypothesis. The pituitary gonadotropin hypothesis
suggests that increases in gonadotropins that initiate ovulation, persisting in high levels for years
following menopause are capable of stimulating the ovarian surface epithelial cells and inducing
malignant formation (34, 122, 128). In addition, gonadotropins are able to stimulate an
ovulation-like loss of the ovarian surface epithelial basement membrane (140). Since
inflammation is a well-known precursor to cancer development, the chronic inflammatory
processes of the ovarian surface epithelium may be a mechanism by which gonadotropin
12
stimulation and ovulation contribute to ovarian cancer risk (1, 122). Ovulation is an
inflammatory-like process involving multiple cytokines and proteolytic enzymes, and their
actions ultimately lead to tissue rupture. Inflammation may also provide an explanation for the
increased risk associated with talc and asbestos exposure, endometriosis, pelvic inflammatory
disease, and mumps infection (128).
The most recent theory hypothesizes that ovarian cancer does not begin in the ovary, but
at the distal fallopian tube. This hypothesis is supported by the fact that the majority of early
serous malignancies, detected in risk-reducing bilateral salpingo-oophorectomies (BSO) in
healthy women, were found in the distal fallopian tube and not the ovary. In addition, analysis
of mutations in TP53 in early serous malignancies of the distal fallopian tube and adjacent bulky
carcinomas of the ovary showed shared mutations (98). Though this theory may explain the
origin of serous carcinomas of the ovary, it does not explain endometrioid, mucinous, or clear
cell forms of ovarian cancer.
1.1.3.4 FIGO Classification
Ovarian cancer is classified based on the stage of the disease under the guidelines
established by the International Federation of Gynecology and Oncology (FIGO). This is
determined by considering the size of the tumor, the extent of tumor invasion into other tissues,
compromise of the lymphatic system, and establishment of distal metastasis. Typically, ovarian
cancer is classified into 4 stages: I, II, III and IV, where the first three stages are further
subdivided (Table 1.3) (66). Stage I tumors are those limited to one or both ovaries with the
tumor extending to the surface of the ovary by the third substage. Stage II identifies tumors
with pelvic extensions beyond the surface of the ovaries to the uterus, fallopian tubes and/or
other pelvic tissues by a pattern of spread called direct extension. Stage II tumors present with
13
ruptured capsules by the third substage. In stage III, the tumor extends intraperitoneally to
distant organs within the abdominal cavity and in stage IV, the tumor cells enter the circulation
and travel through the lymphatic system or the haematogenous circulation and metastasize to
lymph nodes and other organs in the body, including the pleural space, and the hepatic or
splenic parenchyma (36, 141).
The stage at diagnosis is established by thorough examination of the tumor and surgical
determination of disease progression (26). Patients diagnosed with FIGO stages I and II have a
5-year survival rate that exceeds 90% with surgery alone. However, those diagnosed with FIGO
states III and IV have significantly lower 5-year survival rates of 10-30% (21). Unfortunately,
only about 19% of cases are identified in the early stages (21, 81, 173). Patient prognosis and
treatment will vary depending on the stage of ovarian cancer.
1.1.3.5 Ovarian Cancer Screening, Detection, Treatment, Prognosis and Management
Unfortunately, only 19% of ovarian cancers are diagnosed at early stages (stage I or II)
while the tumor is still localized or confined to the ovary. About 7% are diagnosed with regional
(pelvic) spread and the vast majority (68%) are diagnosed with distant spread (abdomen and
extra-abdominal) (81). The fact that most cases are diagnosed at late stages is the major cause of
the high death rate of patients with ovarian cancer.
Screening is not suitable with ovarian cancer because no test or series of tests have been
found to be sufficiently sensitive or specific. Despite such limitations, current screening
methods for ovarian cancer consist of a combination of pelvic examinations, measurement of
serum cancer antigen-125 (CA 125) levels, and transvaginal or pelvic ultrasonography.
14
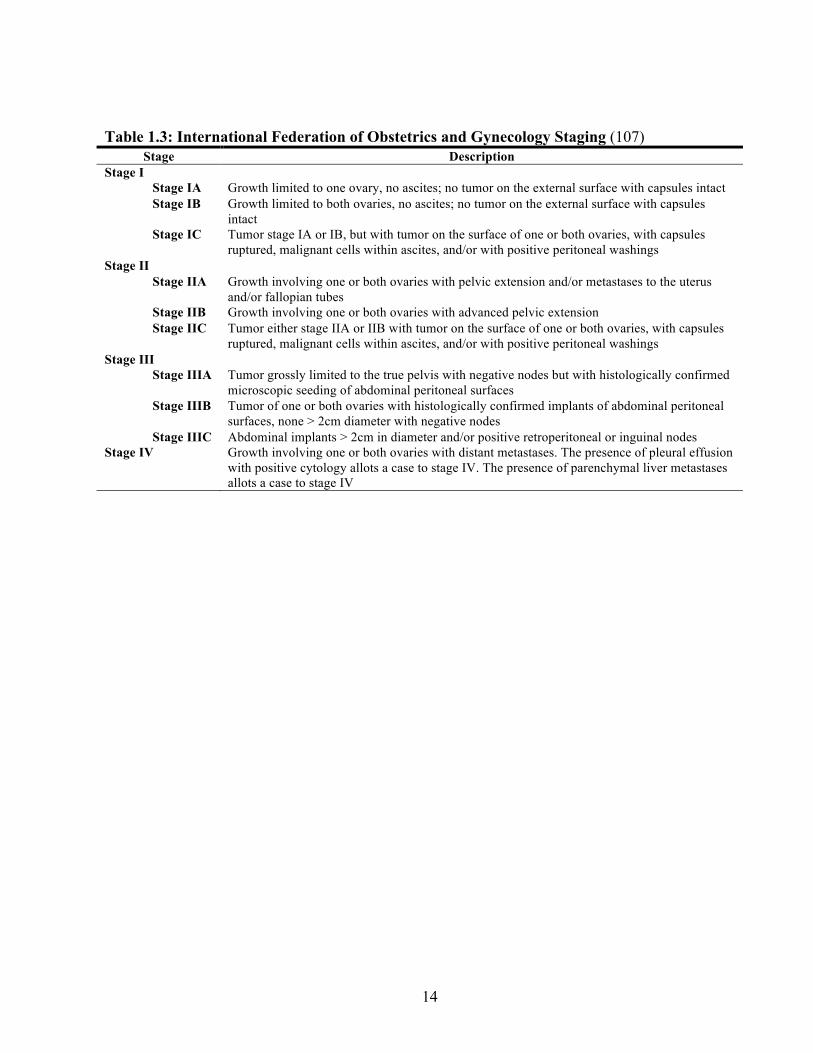
Table 1.3: International Federation of Obstetrics and Gynecology Staging (107) Stage Description
Stage I Stage IA Growth limited to one ovary, no ascites; no tumor on the external surface with capsules intact Stage IB Growth limited to both ovaries, no ascites; no tumor on the external surface with capsules
intact Stage IC Tumor stage IA or IB, but with tumor on the surface of one or both ovaries, with capsules
ruptured, malignant cells within ascites, and/or with positive peritoneal washings Stage II
Stage IIA Growth involving one or both ovaries with pelvic extension and/or metastases to the uterus and/or fallopian tubes
Stage IIB Growth involving one or both ovaries with advanced pelvic extension Stage IIC Tumor either stage IIA or IIB with tumor on the surface of one or both ovaries, with capsules
ruptured, malignant cells within ascites, and/or with positive peritoneal washings Stage III
Stage IIIA Tumor grossly limited to the true pelvis with negative nodes but with histologically confirmed microscopic seeding of abdominal peritoneal surfaces
Stage IIIB Tumor of one or both ovaries with histologically confirmed implants of abdominal peritoneal surfaces, none > 2cm diameter with negative nodes
Stage IIIC Abdominal implants > 2cm in diameter and/or positive retroperitoneal or inguinal nodes Stage IV Growth involving one or both ovaries with distant metastases. The presence of pleural effusion
with positive cytology allots a case to stage IV. The presence of parenchymal liver metastases allots a case to stage IV
15
These are normally performed annually or semi-annually, particularly in women with strong
family history of ovarian cancer (58, 81, 128).
Upon suspicion of ovarian cancer (based on symptoms and physical pelvic
examination), the levels of serum CA125 are measured along with transvaginal and abdominal
ultrasonography. In addition, a computed axial tomography (CT) scan of the abdomen and
pelvis is performed. Once diagnosed, exploratory laparotomy may lead to the resection of one
or both ovaries, fallopian tubes and/or uterus in addition to sampling of lymph nodes, liver and
suspicious sites within the abdomen to check for metastasis. The surgery provides a definite
diagnosis, identifies the histology and stage of the tumor, and removes the majority of the tumor
(26, 108). The surgeon will aim to remove as much tumor as possible in a process called optimal
debulking or cytoreduction, optimally leaving tumors no larger than 1cm. Ultimately, surgery is
performed to improve the patient’s response to chemotherapy (61, 108).
Additional treatment after surgery is dependent on the stage of the disease. Well-
differentiated stages IA or IB ovarian cancer that has been surgically removed usually requires
no further treatment. Patients with stage IA or IB ovarian cancer with a poorly differentiated
tumor and stages IC, II, III and IV disease are classified as high risk where chemotherapy
treatment is required. The optimal regimen for postoperative chemotherapy to eradicate residual
disease is currently still being studied, but combination therapy with a platinum compound such
as cisplatin or carboplatin, or a taxane/platinum combination such as paclitaxel/carboplatin are
given. The paclitaxel and platinum combination achieves clinical response in approximately
80% of patients (26, 108).
16
Although disease stage is the key prognostic factor, other factors such as volume of
cancerous tissue remaining after surgery, histological type, age of patient (over 69 fare worse),
and patient’s overall condition or performance status, may also influence the outcome. FIGO
staging is currently used to determine 5 year survival rates where women with stage I have a 5-
year survival rate of 80% to 95%, whereas women with stage III have only 10% to 30% chance
of surviving five years (21). Histologic type and grade are also significant, with clear-cell,
mucinous, and poorly differentiated tumors being the worst prognostically (107).
Although treatment strategies have improved ovarian cancer management, overall
survival rate has not improved. This is largely due to diagnosis at late stages where 5-year
survival rates are low. Early stage ovarian cancer often evades the current screening
procedures, as patients tend to be asymptomatic or exhibit common symptoms of upper
abdominal disease (12). Thus, nearly 80% of patients present with late stage disease when the
cancer has already metastasized to distant organs and the prognosis is poor.
17
1.4 Cancer Biomarkers
1.4.1 Types of Biomarkers
Serological biomarkers are an effective and relatively non-invasive approach for the
early detection, diagnosis, prognosis and management of many types of diseases, including
ovarian cancer. A biomarker is defined as a quantifiable characteristic that is objectively
measured and evaluated as an indicator of a normal biologic process, a pathogenic process, or a
pharmacologic response to a therapeutic intervention. Typically, they are endogenous molecules
that can be measured in bodily fluids or tissues with the ability to distinguish between disease
and normal states.
Cancer biomarkers may appear in different types and forms, including DNA, mRNA,
proteins, metabolites, or processes such as apoptosis, angiogenesis or proliferation (65).
Additionally, different functional subgroups of proteins, such as enzymes, glycoproteins,
oncofetal antigens and receptors, may serve as useful biomarkers. Furthermore, tumor changes
such as genetic mutations, amplifications, translocations and changes in microarray profiles
(signatures) may also be utilized as tumor markers.
Tumor markers may be detected in a variety of fluids, tissues and cell lines as they are
often produced by the tumor itself or by other tissues in response to the presence of cancer or
other associated conditions, such as inflammation. By measuring the levels of such markers
through a serological test, tumor markers can be used for population screening, differential
diagnosis in symptomatic patients, and for clinical staging of cancer. In addition, they may also
be used to estimate tumor volume, to evaluate response to treatment, and to assess recurrence
through monitoring or as prognostic indicators for disease progression (76).
18
Biomarkers are classified as being diagnostic, prognostic, or predictive. Diagnostic
markers are applied in disease detection and in identifying a given type of cancer in an
individual. To minimize false positive and false negatives rates, diagnostic markers are expected
to have high sensitivity and specificity. Screening markers are a specific type of diagnostic
markers where they are used to examine the general population for a disease (48). Currently,
there is no perfect screening marker for ovarian cancer.
Prognostic markers, on the other hand, are used once the disease state has been
established and are applied to determine the probability of a patient responding to therapy in
order to improve the accuracy of medical prediction and the etiology of the disease following
tumor resection. These markers are expected to predict the likely course of the disease, its
recurrence, and influence the type of therapy provided to the patient. Currently, FIGO staging is
the major prognostic factor for ovarian cancer to identify patient prognosis and treatment for
ovarian cancer patients.
Lastly, predictive markers are used to predict the response to a drug before treatment is
initiated. Optimally, it is able to classify individuals as likely responders or non-responders to a
particular treatment. Often, predictive markers arise from array-type experiments that make it
possible to predict clinical outcome from the molecular characteristics of the patient’s tumor.
Unfortunately, other than definitive diagnosis by biopsy and histopathology, there is currently
no single diagnostic, prognostic, or predictive tumor marker with acceptable sensitivity and
specificity for ovarian cancer.

19
1.4.2 The Ideal Tumor Marker
The World Health Organization (WHO) lists specific criteria that a biomarker must
satisfy. According to WHO, a good screening test must meet the following criteria (31):
1. There are significant mortality statistics for the target disease and occurrence in
the population
2. Disease progression should be well characterized
3. Early stage treatment of the disease should offer improved outcome
4. Public acceptance of the screening test
5. Availability of effective treatment options for individuals with advanced disease
6. Suitable treatment and diagnostic facilities
7. Policy outlining who can be subjected to treatment
8. Cost-effective screening
9. High positive predictive value, negative predictive value, sensitivity and
specificity
In addition to the above criteria, an ideal tumor marker should be measured easily,
quickly, reliably and cost-effectively using an assay with high analytical sensitivity and
specificity (48). Its differential expression in a significant portion of the patient population
should be characteristic of the cancer of interest, and rarely occur for other conditions or for
normal patients (41).
The ideal marker should be produced by the tumor cells and enter the circulation in order
for it to be detected by a non-invasive serological test. The marker should be present at low
levels in serum of healthy or benign disease patients and increase significantly in cancer
(preferably in one cancer type). Optimally, an ideal marker is present in detectable (or higher
20
than normal) quantities at early or preclinical stages and the quantitative levels of the tumor
marker should reflect the tumor burden. The assay for this marker should demonstrate high
diagnostic sensitivity (low false negatives) and high specificity (low false positives).
Current tumor markers for ovarian cancer, such as carbohydrate antigen 125 (CA125),
suffer from low diagnostic sensitivity and specificity when used alone. Consequently, they are
used in conjunction with imaging, biopsy and associated clinicopathological information prior to
setting a diagnosis or prognosis.
1.4.3 Cancer Antigen-125
Currently, the clinically accepted serum marker for ovarian cancer is carbohydrate
antigen 125 (CA125), a high molecular weight mucin (glycoprotein) with unknown function
(177). It was discovered initially by a radioimmunoassay in patients with advanced ovarian
cancer (9). It is expressed by fetal amniotic and coelomic epithelium, and in adult tissues that
are derived from the coelomic (mesothelial cells of the pleura, pericardium and peritoneum) and
Mullerian (tubal, endometrial and endocervial) epithelia. Normal epithelium of the ovaries does
not express CA125 on the surface (83).
While CA125 may be the best ovarian cancer biomarker discovered to date, its utility as
a screening marker is limited due to its high false positive rates. It is elevated in other
malignancies such as uterine, fallopian, colon and gastric cancer (77, 166) as well as in 1% of
the normal population, particularly in non-malignant conditions such as pregnancy,
menstruation and endometriosis (9-11, 77, 166). In addition, many prospective studies of
screening have revealed major limitations of CA125 also in its sensitivity (16). Specifically, the
sensitivity of CA125 is more than 90% for women with advanced stage ovarian cancer, but the
21
sensitivity for stage I ovarian cancer decreases to approximately 50%. As a result, its clinical
use for the early detection of ovarian cancer is limited (16, 77, 78). Therefore, CA125 is neither
sensitive nor specific enough to be used as a diagnostic biomarker.
Serum CA125 levels greater than 35 U/mL are considered elevated (166). These levels
may occur one to two years prior to conventional diagnosis (11, 44, 45, 166, 182). Screening
using CA125 may detect a proportion of ovarian cancer cases before symptoms arise (68, 78,
79). CA125 has been found to be particularly useful in detecting early relapse (112).
CA125 has also been shown to play a significant role in prognosis. Some studies have
demonstrated that concentrations of CA125 in the serum decrease with tumor regression, and
increase with progression in 74 to 95% of cases (13, 166). In addition, CA125 has been able to
predict survival outcomes in women with CA125 levels greater than 65 U/mL (116). Although
CA125 may be promising in its prognostic value, the current major prognostic factor is the
FIGO stage. Other conventional prognostic markers include variables such as tumor grade, size,
histological subtype, residual tumor after surgery, and patient age. However, ovarian cancer is a
highly heterogeneous disease, thus, cancers with similar clinical profiles may have different
outcomes.
Although CA-125 is used currently in clinical settings for diagnosis and prognosis, its
limitations in sensitivity and specificity warrant the development and identification of novel
ovarian cancer biomarkers that would complement CA125 in facilitating early disease detection,
determination of prognosis, and the development of more individualized and efficient treatment
plans for ovarian cancer patients.
22
1.5 Mechanisms of biomarker elevation in biological fluids
Protein levels are physiologically maintained in biological fluids. In disease states,
proteins may become elevated as a result of the disease by several mechanisms. These include
and are not limited to gene over-expression; angiogenesis, invasion and destruction of tissue
architecture; and finally increased protein secretion and shedding.
First, increased protein quantities may be due to increases in the specific gene or
chromosome copy number (gene amplification), epigenetic modifications such as DNA
methylation, and increased transcriptional activity. Increased transcriptional activity is often due
to the imbalance between gene repressors and activators.
Second, tissue invasion by the tumor may allow direct release of molecules into the
interstitial fluid, reabsorbed by the lymphatics and subsequently into the blood. In the case of
epithelial cancer types, proteins must break through the basement membrane of the invading
tumor before entering the circulation.
Third, as 20-25% of all proteins are secreted, elevated protein levels may occur due to
aberrant secretion or shedding of membrane-bound proteins containing an extracellular domain
(ECD). In addition, single nucleotide polymorphisms may cause alterations in the signal peptide
of proteins resulting in atypical secretion patterns (80). Cancer-associated glycoproteins may be
released into the circulation due to the change in the polarity of the cancer cells. Also, increased
protease expression may lead to increased ECD cleavage of membrane bound proteins resulting
in increased circulating levels of these cleaved products.
23
1.6 Proteomics and ovarian cancer
Proteomics focuses on the large-scale determination of gene and cellular function
directly at the protein level. The field of proteomics is a collection of various technical
disciplines, all of which contribute to protein analysis. One powerful proteomic approach
focuses on de novo analysis of proteins or protein populations isolated from cells or tissues.
Studies of cellular proteomes are challenging due to the high degree of complexity and the low
abundance of many proteins requiring highly sensitive analytical techniques in order to identify
these proteins. Among proteomic techniques, mass spectrometry (MS) has become the main
method used in the analysis of complex protein samples. It has an unparalleled ability to acquire
high-content quantitative information about biological samples of enormous complexity and
subsequently to use this data to identify proteins with high sensitivity and specificity.
1.6.1 Principles and instrumentation
MS identifies proteins by measuring the mass and charge of individual molecules and
atoms with high detection sensitivity and molecular specificity. This process is carried out in the
gas phase on ionized analytes, as the motion of gaseous molecules can be manipulated (156).
Typically, mass spectrometers consist of an ion source, a mass analyzer that measures the mass-
to-charge ratio (m/z) of the ionized analytes, and a detector that registers the number of ions at
each m/z value (35).
In order to volatize and ionize the proteins or peptides out of a solution prior to mass
spectrometry analysis, electrospray ionization (ESI) and matrix-assisted laser
desorption/ionization (MALDI) are the most commonly used ionization sources. ESI
encompasses three different processes: Droplet formation, droplet shrinkage and gaseous ion

24
formation. ESI-based systems ionize the analytes out of a solution as it is passed through an
electrostatic field (3-4 kV) generating a fine mist of charged droplets (156). Nitrogen gas is
often added to assist in evaporation of solvent from these charged droplets. ESI is often coupled
to liquid-based separation tools (chromatographic or electrophoretic). MALDI sublimates and
ionizes the samples out of a dry, crystalline matrix via a laser beam of short pulses (57). The
matrix absorbs energy at the wavelength of the laser and the energy is then transferred to the
samples as the laser beam causes evaporation of the matrix. Integrated liquid-chromatography
ESI-MS is normally used to analyze complex samples while MALDI-MS is used to analyze
relatively simple peptide mixtures.
Upon ionization, the peptide ions enter the first mass analyzer (MS1) which separates
gas-phase ions generated from the ionization source according to their m/z ratio. The molecular
mass of each peptide is determined in this step. Next, they are directed into a collision cell
where the peptides collide with neutral gas molecules and become fragmented. The m/z values
of the resultant fragments are measured in the second mass analyzer (MS2), producing a tandem
mass spectrum. This is carried out under high vacuum to prevent ions from colliding with other
species. The mass spectrum is then analyzed by various algorithms such as MASCOT,
SEQUEST and X!Tandem. The amino-acid sequence of each peptide is generated and matched
against the human genome sequence to identify possible proteins (105).
Ion motion in the mass analyzer can be manipulated by electric or magnetic fields in
order for ions to reach the detector in an m/z-dependent manner. Commonly used mass
analyzers include beam (time-of-flight (TOF) and quadrupole) and trapping (ion-trap and
Fourier-transform ion-cyclotron resonance (FT-ICR)) analyzers. Ion-trap mass analyzers store
25
and manipulate ions in time rather than in space. Quadrupole ion-trap instruments use an
oscillating electric field to “trap” and determine the masses of the ions.
1.6.2 Ovarian cancer proteomics: sources to mine for biomarkers
Potential biomarkers may be identified in various sources such as tumor tissues and biological
fluids such as serum, plasma, disease associated fluid, and cancer cell lines. These sources may
then be analyzed using mass spectrometry in order to identify the proteins (174).
In regards to ovarian cancer, the serum or plasma of ovarian cancer patients may be
compared to the serum or plasma of healthy controls. This biological fluid is an optimal source
to mine for biomarkers, as secreted proteins of the cancer should be found in the circulation. In
addition, if the biomarker is detectable within the serum of patients and controls, serological
tests to measure biomarker levels in plasma and serum are relatively non-invasive and
inexpensive. As the blood contains more than 100,000 different protein forms with abundances
spanning over 10-12 orders of magnitude (4), biomarkers are most likely present in this fluid.
Unfortunately, the search for tumor-derived biomarkers within this fluid is challenging as 20 of
the most abundant plasma proteins (concentration ranges in the mg/mL range) account for 99%
of the total protein mass and impedes the detection of lower abundance tumor antigens by mass
spectrometry (4). Potential tumor markers are expected to exist in the low nanogram to
picogram per millilitre concentration range. However, the presence of highly abundant proteins
such as albumin and immunoglobulins suppresses the ionization of low abundance proteins.
Currently, up-front fractionation techniques are performed in order to remove major proteins in
the blood in order to detect these potential low abundant tumor markers.

26
Alternatively, tissue samples from the disease may be another source to mine for
potential biomarkers, such as comparing normal ovarian tissue against ovarian tumors (174).
Hypothetically, certain proteins originating from the tissue could subsequently appear and be
monitored in the blood stream. The shedding and secretion of tumor proteins into the
bloodstream are expected to occur due to leaky capillary beds, protease cleavage and high rates
of cell death within the tumor mass. However, these samples are often complex incorporating
many different types of cells. Often, tumor biopsies may not simply contain tumor tissues but
also include blood components as well as normal tissue. Thus, proteomic analysis of tumor
biopsies may also identify proteins from circulating cells, normal tissues and from plasma thus
only identifying a small population of tumor related proteins (82).
27
1.7 Purpose and aims of the present study
1.7.1 Rationale
Proteins are the biological effector molecules in the body. Given that they are more
dynamic than DNA or RNA, and they reflect the physiological status of the human body,
proteins seem the best suited for biomarker research. With respect to cancer, classical tumor
markers such as carcinoembryonic antigen (CEA) and alpha-feto protein (AFP) were discovered
in the ‘60s with the development of novel and relatively sensitive immunological techniques
such as radial immuno-diffusion. The assays for the ovarian cancer marker, CA-125, were
developed in the late 70’s and early 80’s with the introduction of the monoclonal antibody
technology. The latest FDA approved biomarker for ovarian cancer, HE4, was discovered with
the use of DNA microarray technology. Based on these historical facts, the discovery of novel
biomarkers is intimately connected with technological advancement. With mass spectrometry
being the latest technology introduced to biomarker research, it is reasonable to predict that new
markers will be discovered using this technology
Many cancer biomarkers can be discovered using mass spectrometry as the tool for
discovery. These molecules, however, are difficult to identify because their concentrations in
serum and/or biological fluids are too low and therefore cannot be measured or purified, unless
specific immunological reagents and highly sensitive ELISA methods are available. As
discussed before, the complexity of serum is a problem for biomarker research using mass
spectrometry. Thus, in order to identify novel cancer biomarkers within the initial discovery
phase, a less complex sample needs to used.
28
1.7.2 Hypothesis
Tumors secrete or shed proteins, and these proteins have the potential to enter
circulation. Indeed, the best ovarian cancer biomarkers such as CA-125 and HE4 are shed and
secreted respectively by ovarian tumors and are found in the circulation. It is reasonable to
assume that cell lines derived from ovarian tumors secrete or shed proteins that are similar to the
tumor of origin. Given that conditioned media of ovarian cancer cell lines are relatively less
complex than serum, mining conditioned media avoids the drawbacks of serum proteomics
while providing useful clues to ovarian cancer biology.
We hypothesize that:
1. Proteins secreted or shed by ovarian cancer cell lines are similar to those secreted
or shed by primary ovarian tumours.
2. These proteins can be identified by two-dimensional liquid chromatography-
coupled mass spectrometry.
3. These proteins can be measured in biological fluids such as serum using antibody
based immunoassays and/or mass spectrometry-based single reaction
monitoring/multiple reaction monitoring assays.
4. Some proteins may serve as biomarkers for early detection or prognosis of
ovarian cancer.
1.7.3 Objectives
1. Utilize emerging proteomic technologies such as mass spectrometry to develop a
biomarker discovery platform.

29
2. Demonstrate the feasibility of using cell line models for biomarker discovery.
3. Demonstrate the power in using an integrated proteomic approach (combining
data from several proteomic studies) for selecting candidates for further study.
4. Construct antibodies and develop sensitive immunoassays for candidates that do
not have commercial immunological reagents available.
30
Chapter 2: Proteomic Analysis of Cell-Culture Supernatants by
2D-LC Mass Spectrometry
Reproduced with permission from The Journal of Proteome Research. Comprehensive analysis of conditioned media from ovarian cancer cell lines identifies novel candidate markers of epithelial ovarian cancer. Gunawardana CG, Kuk C, Smith CR, Batruch I, Soosaipillai A, Diamandis EP. J Proteome Res. 2009 Oct;8(10):4705-13 Copyright 2009 American Chemical Society
31
2.1 Introduction
Ovarian cancer (OvCa) kills more women than any other gynaecological malignancy.
For a cancer that accounts for only 3% of new cases, it is the 5th largest killer. The reason for
the high case-to-fatality rate is that it is often diagnosed when the cancer has metastasized to
other organs. The 5-year survival rate for patients with advanced disease (stage III & IV) is 10-
30% (26). In contrast, the 5-year survival rate for patients diagnosed with early-stage disease
can be as high as 94% (26). These numbers clearly support the need for early diagnosis.
In general, ovarian malignancies arise in 3 major cell types. Epithelial ovarian cancer
(EOC) accounts for 80% of the cases and is found on the surface epithelium. Stromal cell
tumors arise in the connective tissue below the surface epithelium and account for 10% of cases.
The third type arises from germ cells and accounts for less than 10% of cases. This study
focuses on EOC, and in particular the serous, endometrioid, clear-cell and mucinous histological
types.
The clinically accepted biomarker for EOC is CA-125 (8). Approximately 85% of
clinically advanced ovarian carcinomas can be identified by measuring CA-125 levels(10, 44).
However, this molecule is a poor marker for early detection due to frequent false positive and
false negative results (114). Other markers that have shown some clinical relevance in EOC are
HE4 (40), osteopontin (86), the carbohydrate antigens CA 15-3 and CA 19-9 (56), inhibin (139),
and several members of the kallikrein family (kallikreins 5, 6, 8,10, 11 and 14) (23, 102, 111,
148, 150). None of these proteins, however, have been effective early-detection biomarkers nor
have they reached the clinical efficacy of CA-125 for detecting recurrence and monitoring
therapy.
32
Many strategies exist to uncover novel biomarkers for cancer, including gene expression
profiling, protein microarrays, gene translocation/fusion analysis, peptidomics, and mass
spectrometry (MS)-based profiling (95). MS-based proteomic studies using EOC tissue (17,
181), ascites fluid (17, 60, 93, 181), and cancer cell lines (49, 53) have contributed greatly to the
list of potential protein markers. However, the selection and validation of these candidate
biomarkers have been major rate-limiting steps.
In the late ‘70’s the development of a novel technology, namely the monoclonal
antibody, helped in discovery of many tumor markers including CA-125, CA15-3, and PSA(9).
Therefore, it is conceivable that with new emerging technologies such as the mass spectrometer,
novel tumor markers can be identified. The assumption that suitable cancer biomarkers for
diagnosis and prognosis will be either secreted or plasma membrane proteins is reasonable given
that:
1. Secreted proteins are more likely to enter circulation
2. Membrane proteins have the potential to be cleaved and therefore can enter
circulation
3. These proteins can be measured using robust immunological techniques
4. All currently known biomarkers (e.g. PSA, CA-125, and CA 15-3) are secreted or
shed proteins.
Given that serum is too complex for mass-spectrometric based discovery projects, a less
complex sample is essential. Therefore, we examined the proteome of cell-culture supernatants
from ovarian cancer cell lines. In this study, we report a shotgun proteomics approach to

33
analyze the conditioned media of the HTB-75, TOV-112D, TOV21G, and RMUG-S cell lines.
Each cell line represents the serous, endometrioid, clear-cell, and mucinous EOC histological
types, respectively.

34
2.2 Materials and Methods
2.2.1 Cell lines
HTB-75, TOV-112D, and TOV-21G cell lines were purchased from the American Type
Culture Collection (ATCC), Manassas, VA. The RMUG-S cell line was purchased from the
Japanese Collection of Research Bioresources. (Osaka, Japan). HTB-75 cells were maintained
in RPMI medium containing 10% fetal bovine serum (FBS). TOV-112D and TOV 21G cell
lines were grown in a 1:1 mixture of MCDB 105 medium and Medium 199, containing 10%
fetal bovine serum. RMUG-S cells were maintained in Ham’s F12 medium containing 10%
fetal bovine serum. All media for cell culture was purchased from Invitrogen Canada Inc.
(Burlington, Ontario, Canada).
2.2.2 Cell Culture
Each cell type was seeded in T-175 cm2 cell culture flasks and cultured to 80%
confluency in normal growth medium (2 days). Eight flasks were grown per cell line and cells
were washed 3 times with 30 ml of phosphate buffered saline (PBS). Following the washes, 30
ml of chemically defined serum-free CDCHO medium (Invitrogen) supplemented with 8 mM
glutamine (Invitrogen) was added to each flask. HTB-75, TOV-112D, and TOV-21G cell lines
were grown for 48 hours, whereas RMUG-S was grown for 72 hours in serum-free CDCHO
medium. Following the growth in serum-free medium (SFM), the conditioned media (CM)
were collected and centrifuged to remove cellular debris.
2.2.3 Sample Preparation
A total of 240 ml of CM were collected per cell line (8 flasks, each having 30 ml of
CM). CM in the eight flasks (of each cell line) were first combined, centrifuged to remove
35
cellular debris and then separated into four aliquots (60 ml) per cell line. Each aliquot
represented a technical replicate, and thus 4 replicates were available per cell line. In this study,
we processed 3 replicates per cell line. Each replicate was dialyzed (3.5 kDa molecular mass
cut-off) against 5 litres of 1 mM ammonium bicarbonate with 2 buffer exchanges at 4oC.
Following dialysis, the replicates were lyophilized. Each lyophilized replicate was denatured
using 8M urea, reduced with 13mM dithiothreitol (DTT, Sigma), and then alkylated using 500
mM iodoacetamide (Sigma). Following reduction and alkylation, the replicates were desalted
using NAP5 columns (GE Healthcare). Each replicate was lyophilized and then trypsin-
digested (Promega) overnight at 37oC. Following trypsin digestion, each replicate was
lyophilized once more.
2.2.4 Strong Cation Exchange Chromatography
Each trypsin-digested and lyophilized replicate was resuspended in 120 µl of mobile
phase A [0.26 M formic acid in 10% acetonitrile(ACN)]. The sample was injected into a
PolySULFOETHYL ATM column with a 200-Å pore size and diameter of 5 µm (The Nest
Group, Inc.) containing a hydrophilic, anionic polymer (poly-2-sulfoethyl aspartamide). A 1-hr
separation was performed on an HPLC system (Agilent 1100) using a mobile phase B
containing 0.26 M formic acid in 10% acetonitrile and 1M ammonium formate. The eluate was
monitored at a wavelength of 280 nm. Fractions were collected every 5 minutes after the start
of the run at a flow rate of 200 µl/min.
2.2.5 Mass Spectrometry
Fractions 6-11 obtained from strong cation exchange (SCX) chromatography were used
for mass spectrometric analysis. Each fraction was loaded onto a ZipTip C18 pipette tip
36
(Millipore; catalogue number ZTC18S096) and eluted in 4µl of Buffer B [90% ACN, 0.1%
formic acid, 10% water, 0.02% Trifluoroacetic acid (TFA)]. The eluate was mixed with 80 µl
of Buffer A, and 40 µl were injected via an autosampler into an Agilent 1100 series HPLC.
The peptides were first injected onto a 2-cm C18 trap column (inner diameter, 200 µm), and
then eluted from the trap column into a resolving 5-cm analytical C18 column (inner diameter,
75 µm) with an 8 µm tip (New Objective). The LC setup was coupled online to a 2-D linear ion
trap (LTQ, Thermo Inc.) mass spectrometer using a nano-ESI source in data-dependent mode.
Each fraction was run on a 120 min gradient. The eluted peptides were subjected to MS/MS.
DTAs were created using the Mascot Daemon (version 2.16) and extract_msn. We used the
following parameters for DTA creation: minimum mass, 300 Da; maximum mass, 4000 Da;
automatic precursor charge selection; minimum peaks, 10 per MS/MS scan for acquisition; and
minimum scans per group, 1.
2.2.6 Data Analysis
Mass spectra from each fraction were analyzed using Mascot (Matrix Science, London,
UK; version 2.2) and X!Tandem (Global Proteome Machine Manager, version 2006.06.01)
search engines on the non-redundant International Protein Index (IPI) human database version
3.27 (containing 67528 entries). Up to one missed cleavage was allowed, and searches were
performed with fixed carbamidomethylation of cysteines and variable oxidation of methionine
residues. A fragment tolerance of 0.4 Da and a parent tolerance of 3.0 Da were used for both
Mascot and X!Tandem, with trypsin as the digestion enzyme. Six DAT files (Mascot) and six
XML files (X!Tandem) were generated per replicate, per cell line. The DAT and XML files
were uploaded and analyzed using Scaffold (v01_05_19, Proteome Software Inc., Portland,
OR). Peptide identifications and protein identifications were accepted if they could be

37
established with greater than 95% probability using the PeptideProphet algorithm and greater
than 80% probability using the ProteinProphet algorithm, respectively. The number of
identified peptides was set to at least one. All biological samples were searched using the
MudPIT (multidimensional protein identification technology) option. Sample reports were
exported from Scaffold and the identified proteins were assigned a cellular localization based on
information available from Swiss-Prot, Genome Ontology (GO), and other publicly available
databases. To calculate the false positive error rate, each fraction was analyzed using a
“sequence-reversed” decoy IPI human database version 3.27 by Mascot and X!Tandem and data
analysis was performed as mentioned above.
38
2.3 Results
2.3.1 Optimization of culture conditions
To optimize the growth conditions of cell lines, the following was performed:
1. For good coverage of the proteome of supernatants, at least 1 mg of total protein was
required. Therefore cell lines were grown such that at least 1 mg of total protein can
be obtained after growth in serum-free medium (SFM)
2. Cells were grown such that contamination from intracellular proteins was minimized.
3. Recovery of secreted proteins and shed proteins (membrane origin) was maximized
in cell culture supernatants while considering factors 1 & 2.
Each cell type was seeded in T-175 cm2 cell culture flasks and cultured to 80%
confluency in normal growth medium. Flasks were washed three times with 30 ml of phosphate
buffered saline (PBS). Following the washes, 30 ml of chemically defined serum-free CDCHO
medium (Invitrogen) supplemented with 8 mM glutamine (Invitrogen) was added to each flask.
LDH levels were measured every day for 5 days. KLK5 and KLK6 levels were also measured
every day for 5 days to monitor protein secretion.
LDH levels showed a steady increase in each of the cell lines and then a quick rise
starting around day 3. Total protein on day 2 for HTB-75, TOV-112D, and TOV21G met the
1mg requirement (data not shown). RMUG-S cells were grown for an extra day so that 1 mg of
total protein could be recovered. KLK5 and KLK6 levels showed a steady increase in HTB75
and RMUG-S cell lines over time. The levels of KLK5 and KLK6 in TOV112D and TOV21G
were below the detection limit of the ELISA. Based on these observations, we selected 3 days
39
of growth for the RMUG-S cell line, and 2 days of growth in serum- free medium for the HTB-
75, TOV-112D, and TOV21G cell lines.
2.3.2 Identification of Proteins by Mass Spectrometry
The workflow and experimental design are illustrated in (Figure 2.1). Approximately 29
proteins were found in the negative controls for TOV-112D and TOV-21G; 82 proteins for
HTB-75; and 45 proteins for RMUG-S. Proteins found in the negative controls were compared
with the list of proteins of their counterpart cell lines. We eliminated proteins that were
common to both the negative controls and the conditioned media only if the total spectra of a
given protein in the negative controls were greater than 10 % of the total spectra for the same
protein in conditioned media. After eliminating proteins found in the negative controls, 1208
proteins were found in HTB-75; 1252 proteins for TOV-112D; 885 for TOV-21G; and 467 for
RMUG-S. The proteins lists were combined and the redundancies were removed. In total,
2039 unique proteins were identified.
2.3.3 Identification of internal control proteins
One advantage of our approach to biomarker discovery was that one could measure the
levels of endogenous internal control proteins. We knew a priori that HTB75 and RMUG-S
produced KLK5 whereas the TOV-112D and TOV-21G cell lines did not. We measured KLK5
levels by ELISA in the conditioned media of all cell lines prior to mass spectrometric analysis.
We hypothesized that if our approach is valid, then the mass spectrometry should detect KLK5
protein in the supernatants of HTB75 and RMUG-S only.
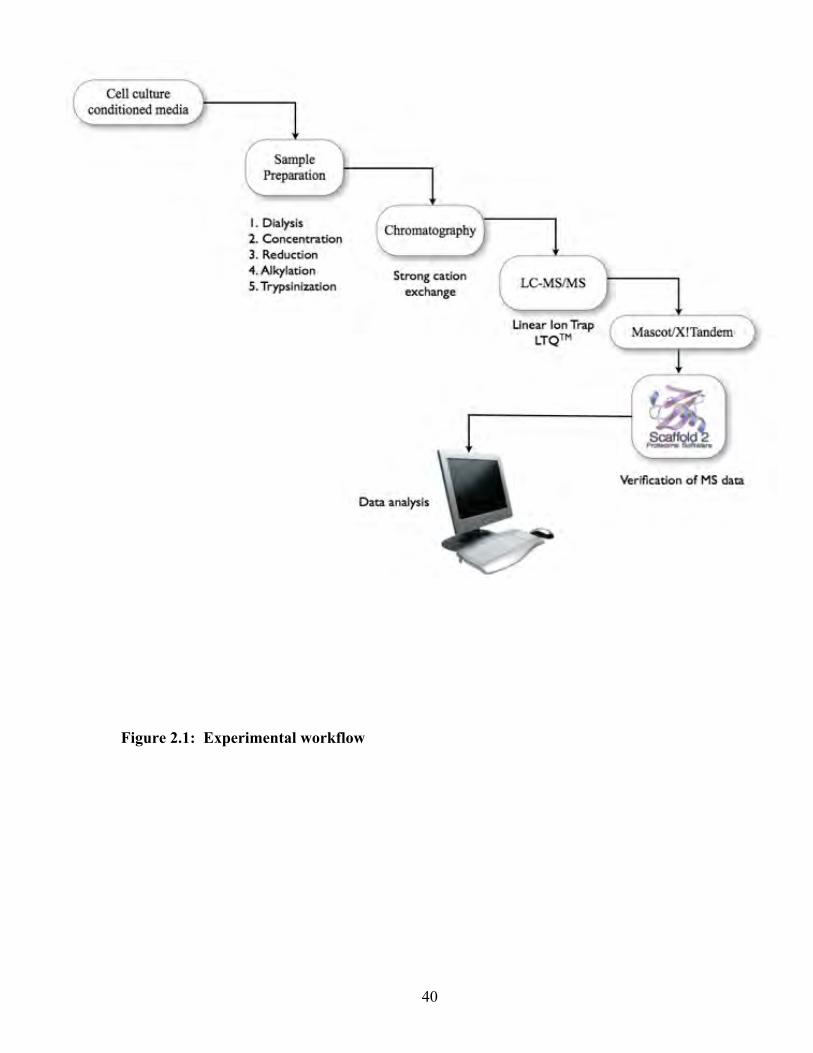
40
Figure 2.1: Experimental workflow
41
Indeed, this was the case. KLK5 levels in HTB75 conditioned media were 3 ng/ml and in
RMUG-S, levels were greater than 10 ng/ml. The KLK5 levels in TOV-112D and TOV-21G
conditioned media were below the detection limit of the KLK5 ELISA.
2.3.4 Intracellular and intercellular overlap
We examined the overlap of proteins identified in the three replicates for each cell line
analyzed. The overlap was 70 % for HTB75; 63 % for TOV-112D; 40 % TOV-21G; and 66%
for RMUG (Figure 2.2). We suspect the lower reproducibility of the TOV-21G cell-line was
due to differences in sample handling. That is, the third replicate of TOV-21G supernatant was
analyzed using a new reverse-phase chromatographic column on the mass spectrometer and
therefore may have been a source of variability. Despite the low overlap for the TOV-21G cell
line, 75 % of the proteins in the TOV-21G conditioned media were found in at least two of the
replicates.
We next examined the intercellular overlap of proteins identified. Of the 2039 proteins,
155 proteins were common to all four cell-lines (Figure 2.3). However, approximately 31 % of
the proteins were unique to HTB75; 27 % to TOV-112D; 15 % to TOV-21G; and 25 % to
RMUG-S. These proteins may be OvCa subtype specific and may have the potential to be used
as a subtype specific marker. This was beyond the scope of the present study and therefore we
did not explore this. All proteins identified in this study are available as part of supplementary
data in Gunawardana et al.(63)
2.3.5 Cellular localization
Proteins were cross-referenced with the Gene Ontology and Swiss-Prot databases to
determine their subcellular localizations. A significant proportion of proteins were from
42
intracellular locations such as the cytoplasm, golgi, endoplasmic reticulum, and the nucleus.
This was most likely due to cell lysis, which is unavoidable with cultured cells. Figure 2.4
depicts the distribution of proteins based on subcellular location for each cell line. Figure 2.5
depicts the distribution of proteins based on subcellular location for all 2039 proteins identified.
Approximately a fifth of the proteins identified in this study were either extracellular or
plasma membrane proteins. Williams et al. recently published a comprehensive review listing
the proteins that have been studied as biomarkers in serum or ascites fluid in EOC (173). We
cross-referenced our list of extracellular and plasma membrane proteins with the
aforementioned list and the common proteins are listed in Table 2.1. Known markers of ovarian
cancer such as CA-125, CA 15-3, HE4, KLK6, and mesothelin were identified in this study.
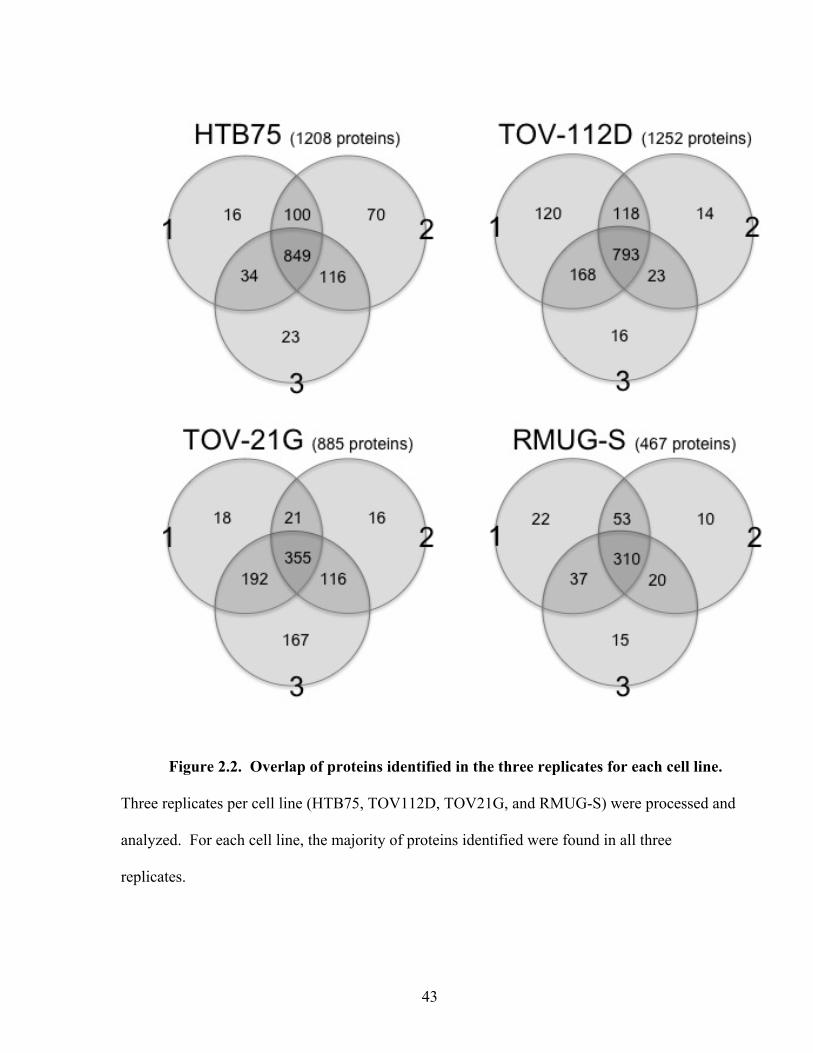
43
Figure 2.2. Overlap of proteins identified in the three replicates for each cell line.
Three replicates per cell line (HTB75, TOV112D, TOV21G, and RMUG-S) were processed and
analyzed. For each cell line, the majority of proteins identified were found in all three
replicates.

44
Figure 2.3: Intercellular overlap of all proteins identified in this study. A total of 2039
proteins were identified.
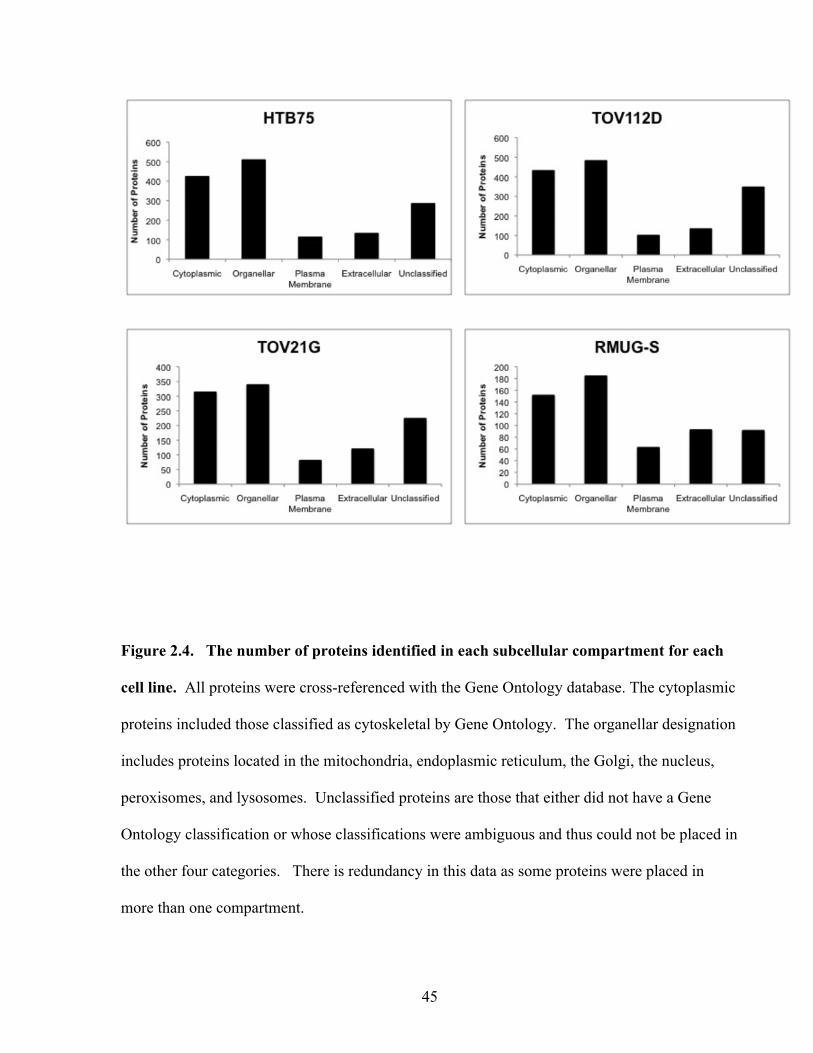
45
Figure 2.4. The number of proteins identified in each subcellular compartment for each
cell line. All proteins were cross-referenced with the Gene Ontology database. The cytoplasmic
proteins included those classified as cytoskeletal by Gene Ontology. The organellar designation
includes proteins located in the mitochondria, endoplasmic reticulum, the Golgi, the nucleus,
peroxisomes, and lysosomes. Unclassified proteins are those that either did not have a Gene
Ontology classification or whose classifications were ambiguous and thus could not be placed in
the other four categories. There is redundancy in this data as some proteins were placed in
more than one compartment.
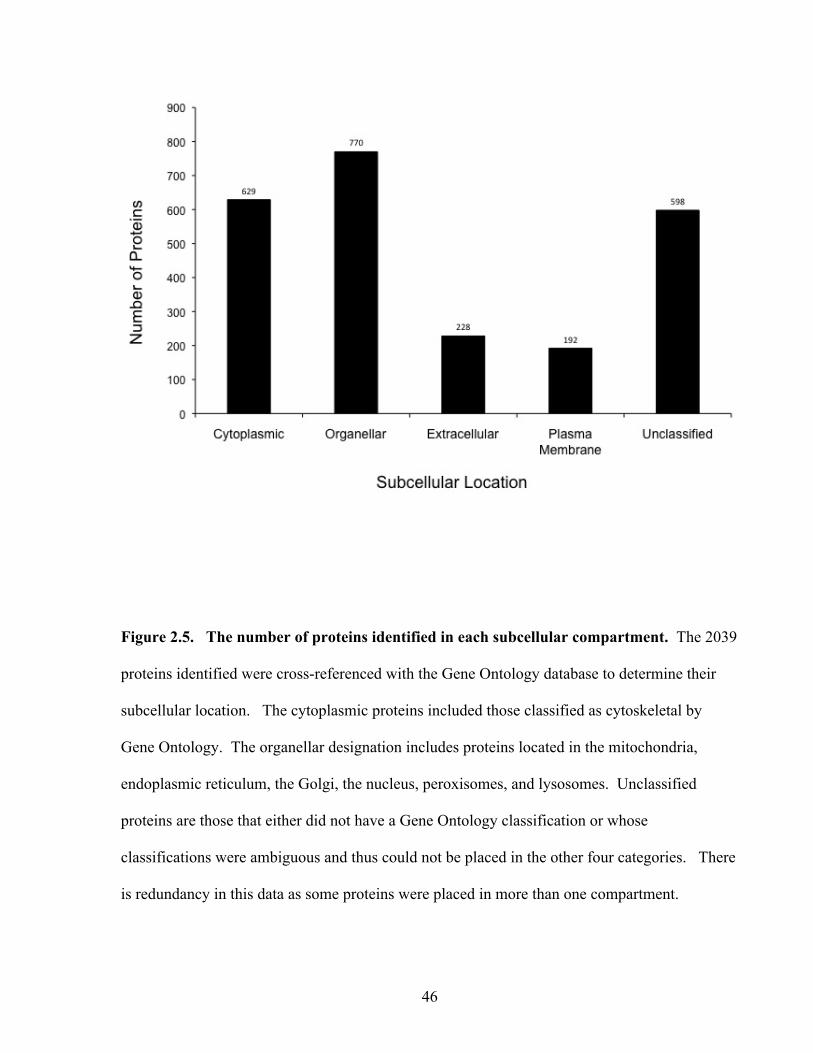
46
Figure 2.5. The number of proteins identified in each subcellular compartment. The 2039
proteins identified were cross-referenced with the Gene Ontology database to determine their
subcellular location. The cytoplasmic proteins included those classified as cytoskeletal by
Gene Ontology. The organellar designation includes proteins located in the mitochondria,
endoplasmic reticulum, the Golgi, the nucleus, peroxisomes, and lysosomes. Unclassified
proteins are those that either did not have a Gene Ontology classification or whose
classifications were ambiguous and thus could not be placed in the other four categories. There
is redundancy in this data as some proteins were placed in more than one compartment.

47
Table 2.1: Previously studied proteins in EOC that were identified in this study
Protein Subcellular location
Apolipoprotein A1 Extracellular
CA 125 Membrane
CA 15-3 Membrane
Cathepsin L Extracellular
Epidermal Growth Factor Receptor Membrane
Fibronectin Extracellular
Fibulin Extracellular
Human epididymal protein 4 Extracellular
Inhibin Extracellular
Interleukin-6 Extracellular
Kallikrein-6 Extracellular
Macrophage-colony stimulating factor Extracellular
Mesothelin Extracellular
Osteopontin Extracellular
α-1 antitrypsin
Extracellular
48
2.4 Discussion
In this study, a shotgun proteomics approach using LC-MS/MS was used to identify
proteins in conditioned media from 4 ovarian cancer cell lines. This technology has been
applied for biomarker discover previously (49, 94, 145). We hypothesized that the proteome of
the conditioned media of ovarian cancer cell lines may provide clues as to which proteins are
secreted by primary ovarian tumors. Mascot and X!Tandem databases were used to identify
over 2000 unique proteins. To our knowledge, this is one of the largest repositories of proteins
identified for ovarian cancer.
Serum is a fruitful source of potential markers for ovarian cancer. It contains more than
100,000 protein forms with concentrations ranging 10-12 orders of magnitude (4). The 20 most
abundant proteins make up 99 % of the total protein. The skewed protein distribution in serum
is a major challenge when MS-based strategies are used in pursuit of low-abundance cancer
biomarkers (37, 38). The main problems are:
1. Peptides from high abundance proteins outcompete their low abundance peptide
counterparts for ionization.
2. Peptides from the high abundance proteins suppress the ionization of the low
abundance peptides
On the grounds of these difficulties and more, we selected to analyze conditioned medium from
ovarian cancer cell lines, which is less complex than serum, yet is relevant to ovarian cancer
pathobiology. Furthermore, cell lines are easy to maintain and propagate, and offer an
inexhaustible source of mRNA and proteins. This material, in turn, can be rapidly processed
49
for profiling experiments using technologies such as DNA microarrays and mass spectrometry.
In addition, the biological variation between samples from the same cell line is low, thus
allowing greater reproducibility compared to tissue and serum samples. There are however,
several disadvantages of using cell culture supernatants for biomarker discovery. These are
listed below and are described in detail by Kulasingam et al.(96) :
1. A single cell line cannot model the heterogeneity of cancer.
2. There are multiple variants of the same cell line in circulation.
3. The interactions between the surrounding environment and the tumor that influence
its development are absent in a cell culture system.
4. Does not model the complex interactions among different cell types within the ovary.
5. Does not provide clues as to the causes of ovarian cancer.
In this study, we analyzed the cell culture supernatants of four cancer cell lines (focusing
on extracellular and plasma membrane proteins), each representing a histological type of
epithelial ovarian cancer. The HTB-75, TOV-112D, TOV-21G, and RMUG-S cells lines are
commonly used cell lines in ovarian cancer studies(85, 96, 133, 144). To represent serous
carcinoma we selected the HTB-75 cell line, the proteome of which is similar to tumor cells
originating from serous carcinoma of the ovary(49). The TOV-112D cell line represents the
endometrioid histological type. The proteome of this cell line clusters closer to cell lines
originating from endometrioid cancers of the ovary than to cell lines originating from other
histological types of EOC(171). The gene expression profile of TOV-21G, which represents
clear-cell carcinoma, is different from cell lines originating from other histological types (164).
Thus, we believe that HTB-75, TOV-112D, and TOV-21G provide a distinct look at ovarian
cancer. The choice of a mucinous carcinoma cell-line was RMUG-S. Studies comparing the
50
gene or protein expression profile of RMUG-S with mucinous carcinoma of the ovary were not
available in the literature. To our knowledge, this study is the first comparative proteomic study
conducted using this particular cell line.
A total of 2039 proteins were identified from the four cell lines. Of these, 420 proteins
were either extracellular or plasma membrane proteins. The proportion of extracellular and
membrane proteins (21%) relative to the total number proteins in this study is lower than studies
conducted on breast (34%)(94) and prostate cancer cell lines (39%)(145). We suspect that the
difference between the proportions found in this study and those of the other ones is due to the
following reasons:
1. Differences in bioinformatics. In this study, we attempted to improve upon the
searching strategies employed in the breast cancer and prostate cancer studies by not
only using gene ontology, but also employing the curated Swiss Prot database to
verify our extracellular and membrane protein classifications. By doing this we
noticed, for example, that some membrane proteins that were originally classified as
“plasma membrane” by gene ontology, were classified as membrane but of an
organellar origin. When there was a discrepancy between gene ontology and Swiss
Prot, we used the curated classifications of the Swiss Prot database.
2. We do not know whether or not a proteomic study on supernatants of cell lines of
different tissue origin will always provide the same proportion of extracellular and
plasma membrane proteins. It is possible that the ovarian cell lines we used had a
lower proportion of extracellular and plasma membrane proteins in the culture
media.
51
3. Sample preparation is a source of great variability, which may have contributed to
the discrepancy.
Furthermore, a large proportion of proteins (29%) with unknown Gene Ontology annotations
were identified and categorized as unclassified (Figure 2.4). Some of these proteins may indeed
be extracellular or plasma membrane proteins.
Of the 420 extracellular and membrane proteins identified, 94 were found in plasma by
HUPO(63, 126). The small overlap may be due to several reasons. First, some extracellular and
membrane proteins identified in this study have low abundance in plasma. With plasma being
very complex, it is reasonable to assume that mass spectrometry is unable to identify these
proteins. In addition, the elimination half-life for some proteins may be very short, meaning that
they are either removed from the circulation rapidly, or are eliminated within their
microenvironment before they can enter the circulation. Furthermore, some proteins may be
localized to particular compartments or microenvironments in the body and thus never enter the
circulation. Finally, some proteins are sensitive to sample handling and therefore are degraded
during the experiment.
The Kislinger group (60) and the Hanash group (49) recently published two major
proteomic studies using ascites fluid and ovarian cancer cell lines. Approximately, 44% of the
proteins identified in our study overlapped with the Hanash study whereas 29% of our proteins
overlapped with those found in the Kislinger study (Figure 2.5). However, comparing just the
extracellular and plasma membrane proteins, 75% of our proteins overlapped with those of the
Hanash study. Taking all three studies together, a repository of 8256 proteins can be
constructed, a valuable resource of proteins for further study in ovarian cancer. We have
contributed an additional 1091 proteins that were not identified in the Kislinger and Hanash

52
studies. A point to note is that only 555 proteins (7%) were common to all three studies. This is
most likely due to the differences in experimental approach, sample types, the inherent
variations in mass spectrometric analysis, and different bioinformatic platforms.
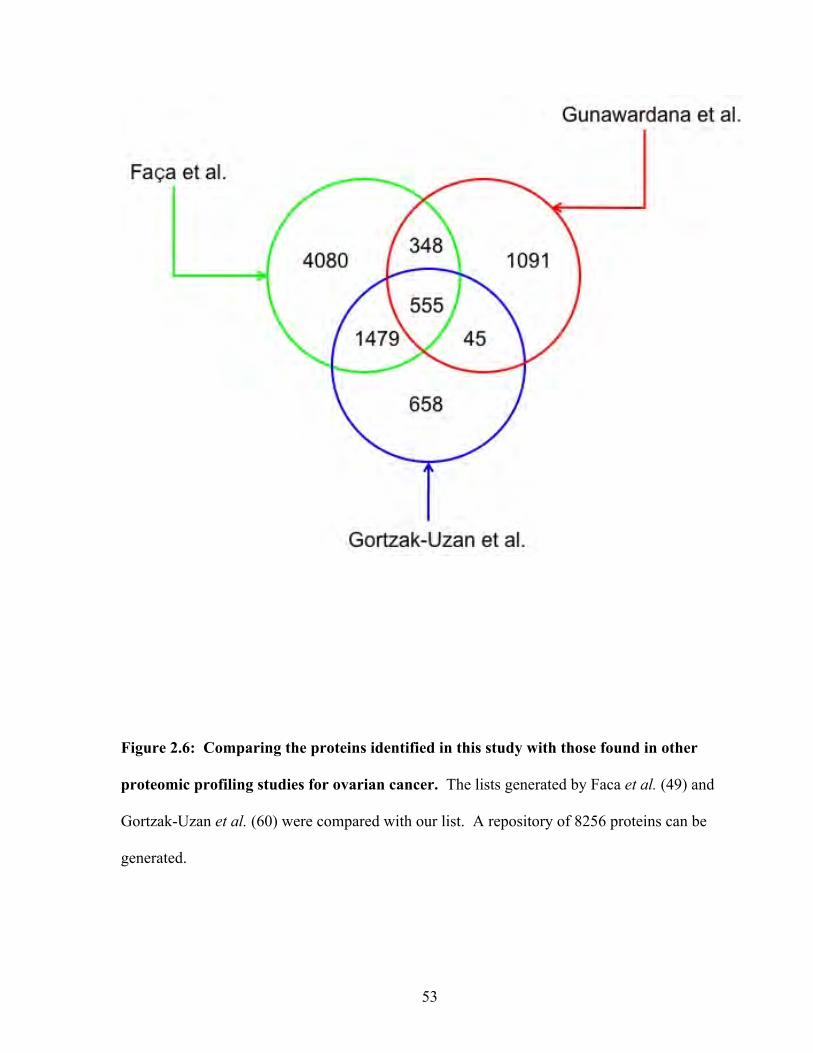
53
Figure 2.6: Comparing the proteins identified in this study with those found in other
proteomic profiling studies for ovarian cancer. The lists generated by Faca et al. (49) and
Gortzak-Uzan et al. (60) were compared with our list. A repository of 8256 proteins can be
generated.

54
Chapter 3: Candidate Selection and Verification in Serum by
ELISA
Reproduced with permission from The Journal of Proteome Research. Comprehensive analysis of conditioned media from ovarian cancer cell lines identifies novel candidate markers of epithelial ovarian cancer. Gunawardana CG, Kuk C, Smith CR, Batruch I, Soosaipillai A, Diamandis EP. J Proteome Res. 2009 Oct;8(10):4705-13 Copyright 2009 American Chemical Society
55
3.1 Introduction
Advances in MS-based proteomic technologies have helped create large datasets. These
enormous datasets have given rise to the hypothesis that new clinically relevant biomarkers will
be found within them. However, these optimistic predictions have yet to be fulfilled (136).
One of the greatest challenges in finding biomarkers is in selecting candidates for validation.
The critical question is what criteria to use when selecting candidates from a large list.
Considering the fact that the number of new proteins being discovered is increasing, selecting
the “best” candidates for testing proves more difficult. In fact, testing of candidates is limited
by several factors including the lack of suitable reagents, instrumentation, and manpower.
As mentioned in the preceding chapter, we discovered over 2000 proteins by analyzing
the conditioned media of four ovarian cancer cell lines. We hypothesize that novel biomarkers
can be found within our dataset. However, the criteria for selecting candidates are at the
investigators’ discretion. There are many strategies that can be employed to simplify a large
dataset including comparing proteomic lists with mRNA expression lists to select candidates
that are overexpressed in cancer, comparing several proteomic datasets to identify those proteins
that a consistently found in cancer, and focusing on a subset of proteins in a list (i.e. plasma
membrane proteins, proteins involved in adhesion, etc.) In this chapter we address the
aforementioned issue of selection criteria, and present a robust step-wise method to produce a
master list of candidates for ovarian cancer.
56
3.2 Materials and Methods
3.2.1 Immunoassays
IGFBP5, IGFBP6, βIG-H3, and cystatin C ELISA kits were purchased from R&D
Systems. The IGFBP4 kit was purchased from DSL Inc. and the clusterin assay was purchased
from ALPCO Laboratories. Immunoassays for IGFBP4, cystatin C, and clusterin were
performed according to the manufacturers instructions. Assays for IGFBP5, IGFBP6, and βIG-
H3 were also performed according to the manufacturers instructions but with a modification to
the detection step (see below). Some assays were not designed for use with serum and
therefore, required optimization (see Results section).
Non-biotinylated polyclonal and monoclonal antibodies to vasorin, EPCR, and IGFBP7,
were purchased from R&D Systems, as were the recombinant proteins used as protein
calibrators. Sandwich-type ELISAs were constructed in-house using a monoclonal or a
polyclonal antibody for antigen capture and a biotinylated polyclonal antibody for detection.
White polystyrene microtitre plates were coated with either 100ng/100µl (vasorin and IGFBP7)
or 200ng /100µl (EPCR) of monoclonal or polyclonal antibody in coating buffer (50mM Tris
buffer, 0.05% sodium azide, pH 7.8) and stored at room temperature overnight. Fifty
microlitres of protein calibrators or samples, and 50µl of assay buffer [50mM Tris, 6% BSA,
0.01% goat IgG, 0.1% bovine IgG (Sigma-Aldrich Inc, St. Louis MO), 0.005% mouse IgG
(Fortron Bio Science Inc, Morrisville, NC), 0.05% sodium azide, pH 7.8] with 0.5M KCl
(vasorin and IGFBP7) or without KCl (EPCR) were added to wells and incubated for 90 min
with shaking at room temperature. The plates were washed 6 times with washing buffer (5mM
Tris, 150mM NaCl, 0.05% Tween-20, pH 7.8). Approximately 100µl of biotinylated detection
57
antibody (125ng/ml in assay buffer containing 0.5M KCl) were added to each well and
incubated for 1 h at room temperature with shaking. The plates were then washed six times with
the washing buffer.
Detection of IGFBP5, IGFBP6, and βIG-H3 was modified from the manufacturer’s
instructions and performed the same way as that for vasorin, IGFBP7, and EPCR.
Approximately 100µl (5ng/well) of alkaline phosphatase-conjugated (ALP) streptavidin
(Jackson ImmunoResearch) in sample buffer (6% BSA, 50 mM Tris, 0.06% sodium azide, pH
7.8) was added to each well and incubated for 15 min with shaking at room temperature. The
plates were washed 6 times with the wash buffer, and then 100 µL of substrate buffer [0.1 mol/L
Tris buffer, pH 9.1, containing 0.5 mmol/L diflunisal phosphate (DFP), 0.1 mol/L NaCl, and 1
mmol/L MgCl2] were added to each well and incubated for 10 min with shaking at room
temperature. Approximately 100µl of developing solution (1 mol/L Tris base, 0.15 mol/L
NaOH, 2 mmol/L TbCl3, 3 mmol/L EDTA) were added to each well and incubated for 1 min
with shaking at room temperature. The fluorescence (615 nm) was measured with an
EnVision™ 2103 time-resolved fluorometer (Perkin Elmer).
3.2.2 Biotinylation of detection antibody
Biotinylated polyclonal antibodies to IGFBP5, IGFBP6 and βIG-H3 were provided with
their kits. Biotinylated polyclonal antibodies to vasorin, and EPCR were purchased from R&D
Systems. Approximately 50 ng of polyclonal anti-IGFBP7 antibody was incubated with 50 ng
of biotin in 0.5 M NaHC03 for 1 h. This was used as the detection antibody for the IGFBP7
assay. To verify the biotinylation reaction, sandwich-type ELISAs were first constructed (as
mentioned previously) using the biotinylated and the unbiotinylated versions of each antibody.
Purified recombinant proteins specific for each antibody were used as the standard. The
58
fluorescence (measured at 615 nm) was compared for the biotinylated and unbiotinylated
antibody.
3.2.3 Clinical Specimens
Serum samples (approximately 10 ml) were collected from stage III-IV EOC patients
and age-matched normal controls. Blood was initially collected in BD Vacutainer® SST™
tubes containing clot activator and serum separator gel. Tubes were inverted five times, allowed
to clot for 30 minutes, and centrifuged for 10 minutes at 1000-1300 x g in a swing bucket
centrifuge. The separated serum was then aliquoted and stored at -80 oC. Our protocols have
been approved by the Institutional Review Board at the University Health Network, Toronto,
Ontario, Canada.
3.2.4 Statistical Analysis
Assuming that cancer cases and normal cases are independent and their distributions are
non-parametric, the Mann-Whitney test was used to determine statistical significance when
comparing the concentrations of candidate biomarkers in normal and ovarian cancer sera.
59
3.3 Results
3.3.1 Selection of candidates
We used the following arbitrary criteria to pick candidates for analysis in serum of EOC cases
and healthy individuals:
1. The set of extracellular and membrane proteins was chosen as the starting point. It is
reasonable to hypothesize that extracellular (secreted) and membrane proteins (ones that
are shed) are more likely to enter the circulation. Comparing the list of the 228
extracellular and 192 plasma membrane proteins with that of the plasma proteome
published by HUPO (126), there was an overlap of 65 extracellular proteins and 29
plasma membrane proteins. We eliminated known high-abundance proteins with
concentrations greater than 5 µg/ml in plasma. Some proteins, such as clusterin, were
kept as candidates since their levels in patients with ovarian cancer have not been
reported in the primary literature.
2. Next, this set of extracellular and membrane proteins was compared with a list of 289
extracellular and membrane proteins of a separate study from our lab on the proteome of
ascites fluid (93). Seventy-two proteins overlapped and these were selected for further
investigation.
3. We further eliminated proteins that have been reported previously as serological markers
of ovarian cancer. By applying this criterion, 21 proteins were eliminated. The
remaining 51 proteins are listed in (Table 3.1). The major biological functions and
diseases associated with these proteins are illustrated in Figures 3.1 & 3.2.
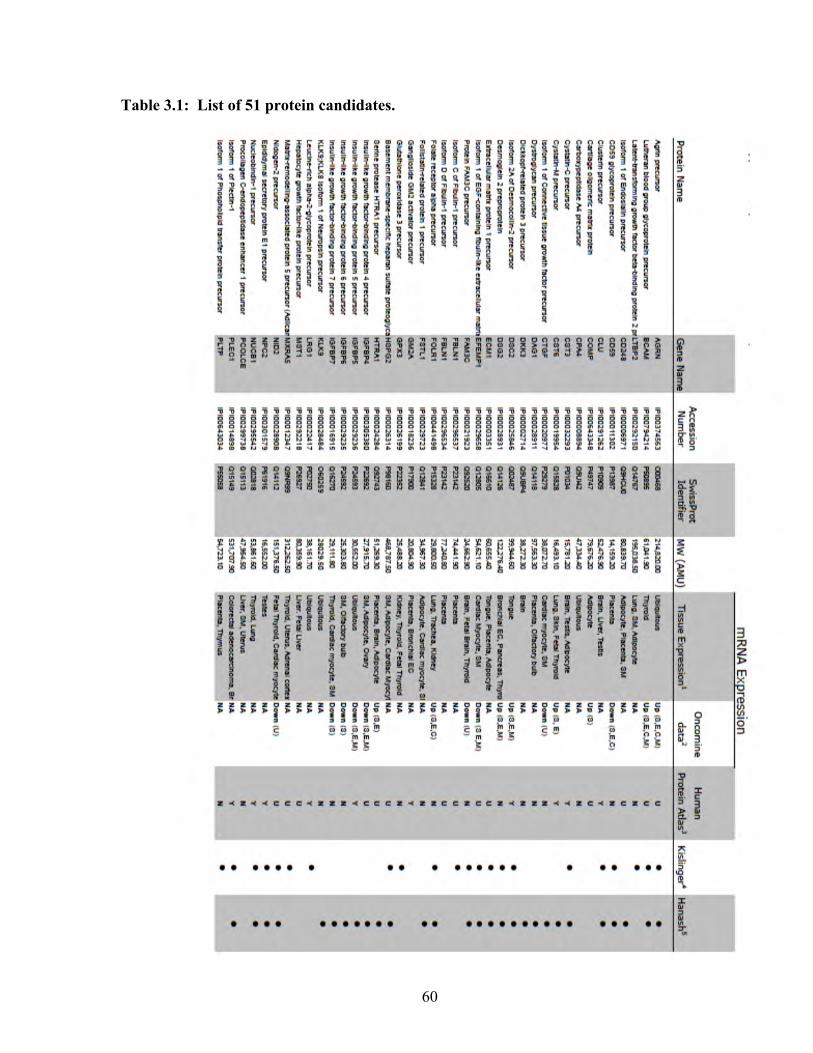
60
Table 3.1: List of 51 protein candidates.
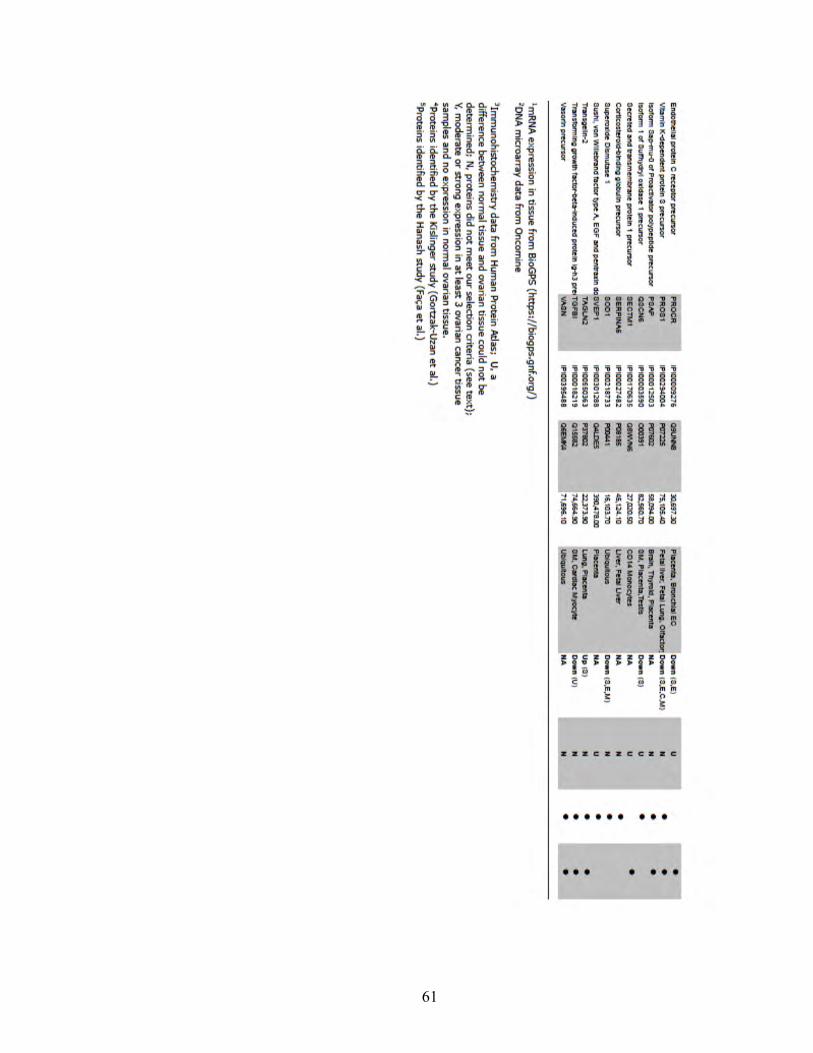
61
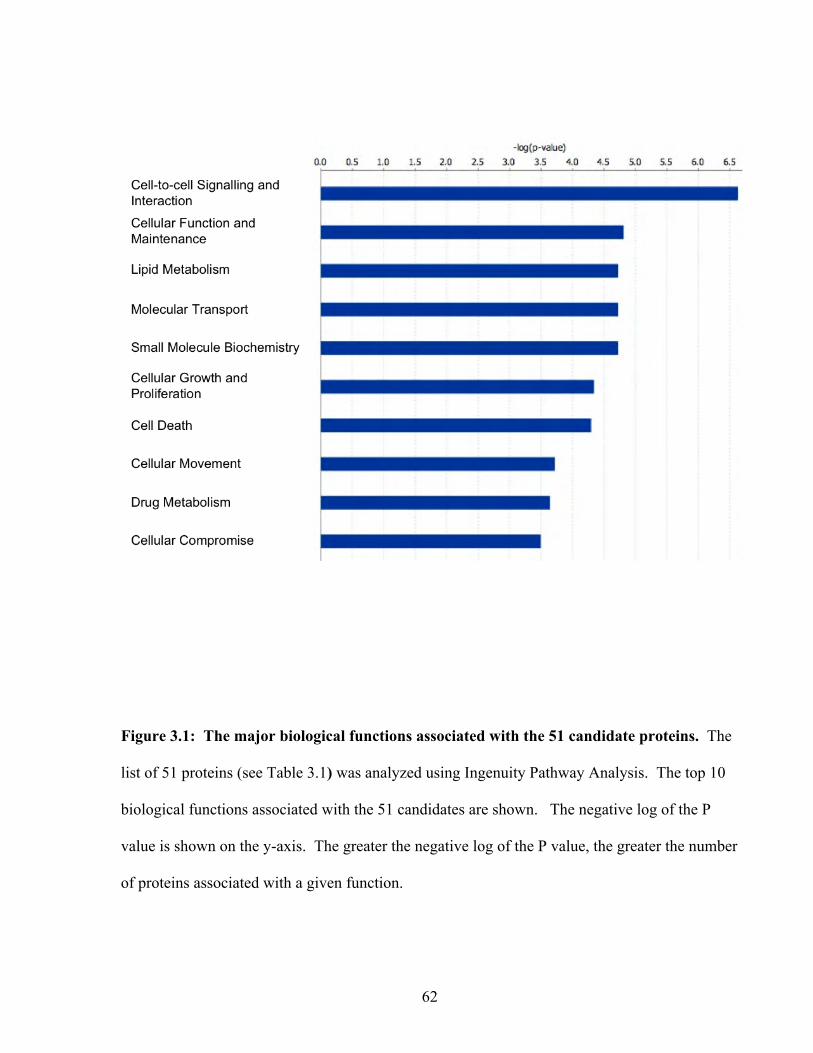
62
Figure 3.1: The major biological functions associated with the 51 candidate proteins. The
list of 51 proteins (see Table 3.1) was analyzed using Ingenuity Pathway Analysis. The top 10
biological functions associated with the 51 candidates are shown. The negative log of the P
value is shown on the y-axis. The greater the negative log of the P value, the greater the number
of proteins associated with a given function.
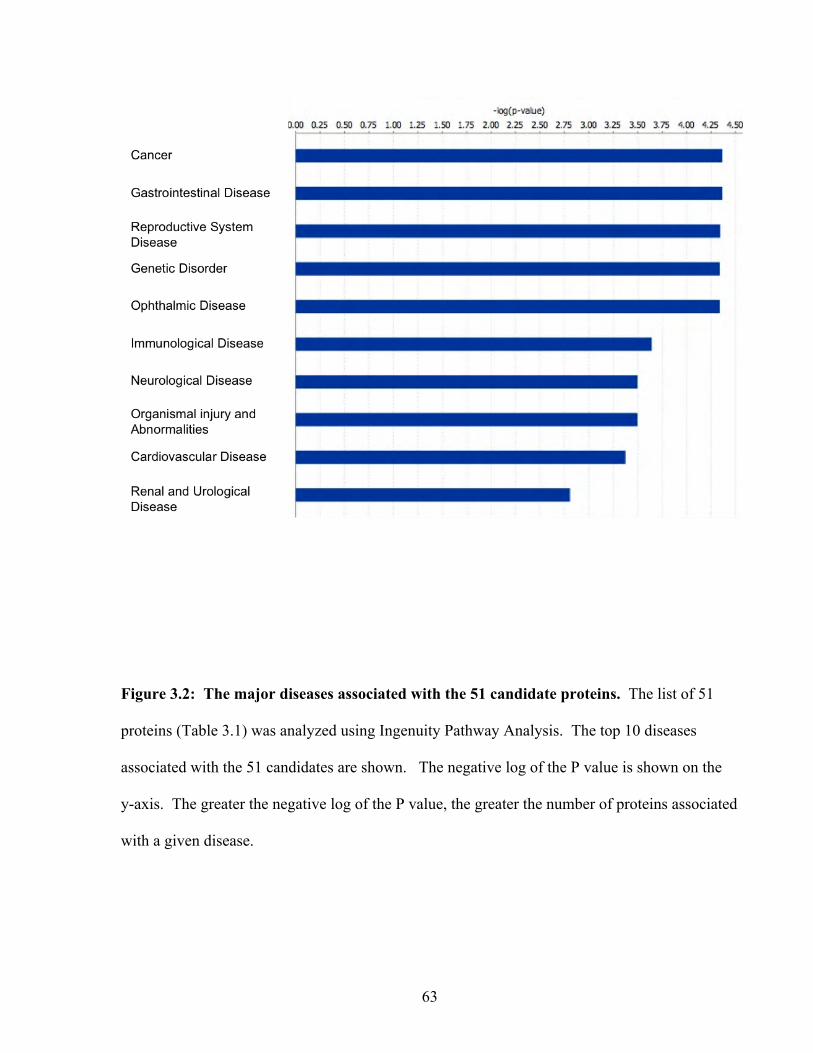
63
Figure 3.2: The major diseases associated with the 51 candidate proteins. The list of 51
proteins (Table 3.1) was analyzed using Ingenuity Pathway Analysis. The top 10 diseases
associated with the 51 candidates are shown. The negative log of the P value is shown on the
y-axis. The greater the negative log of the P value, the greater the number of proteins associated
with a given disease.
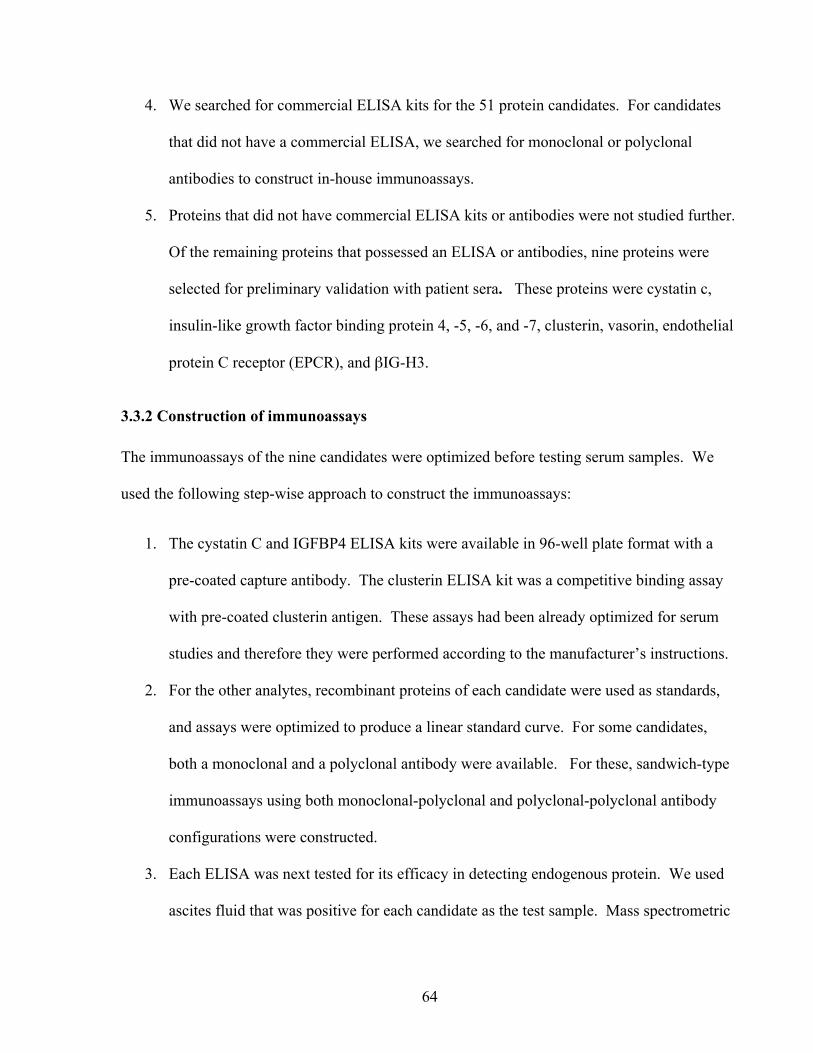
64
4. We searched for commercial ELISA kits for the 51 protein candidates. For candidates
that did not have a commercial ELISA, we searched for monoclonal or polyclonal
antibodies to construct in-house immunoassays.
5. Proteins that did not have commercial ELISA kits or antibodies were not studied further.
Of the remaining proteins that possessed an ELISA or antibodies, nine proteins were
selected for preliminary validation with patient sera. These proteins were cystatin c,
insulin-like growth factor binding protein 4, -5, -6, and -7, clusterin, vasorin, endothelial
protein C receptor (EPCR), and βIG-H3.
3.3.2 Construction of immunoassays
The immunoassays of the nine candidates were optimized before testing serum samples. We
used the following step-wise approach to construct the immunoassays:
1. The cystatin C and IGFBP4 ELISA kits were available in 96-well plate format with a
pre-coated capture antibody. The clusterin ELISA kit was a competitive binding assay
with pre-coated clusterin antigen. These assays had been already optimized for serum
studies and therefore they were performed according to the manufacturer’s instructions.
2. For the other analytes, recombinant proteins of each candidate were used as standards,
and assays were optimized to produce a linear standard curve. For some candidates,
both a monoclonal and a polyclonal antibody were available. For these, sandwich-type
immunoassays using both monoclonal-polyclonal and polyclonal-polyclonal antibody
configurations were constructed.
3. Each ELISA was next tested for its efficacy in detecting endogenous protein. We used
ascites fluid that was positive for each candidate as the test sample. Mass spectrometric
65
analysis verified the presence of each candidate in the ascites fluid, as described
elsewhere (93).
4. Lastly, we measured each analyte in serial dilutions of serum to examine the relationship
between the signal measured and the corresponding dilution. All assays, except
IGFBP5, produced linear dilution curves.
3.3.3 Preclinical Validation of candidates
Since we were unable to establish a workable IGFBP5 immunoassay, we could not
validate this candidate in this study. The eight remaining candidate proteins were evaluated
using sera from EOC cases (n=10) and normal healthy women (n=20). For 6 of the candidates
there was no significant difference between groups. A significant difference was seen
(p=0.0002, Mann-Whitney U test) between the EOC cases and healthy controls for clusterin,
with levels in EOC being higher (Figure 3.3). IGFBP6 was also significantly different
(p=0.002, Mann-Whitney U) between the EOC cases and healthy controls, with levels in EOC
being lower than the controls.
To examine whether the difference between normals and EOC cases for clusterin and
IGFBP6 is due to differences in gene expression, we searched the Oncomine gene expression
database (135) for DNA microarray data on these two proteins in ovarian cancer and healthy
tissue. Data showing clusterin mRNA expression in healthy and ovarian cancer tissue was not
available.
However, quantitative real-time PCR results presented by Hough et al. show that clusterin
mRNA is overexpressed in ovarian cancer tissue (72). Data for IGFBP6 showed that mRNA
expression is lower in serous ovarian cancer compared to normal ovarian tissue. To further

66
verify our findings, we conducted a search for immunohistochemistry data on both proteins
using the Human Protein Atlas (HPA) database (www.proteinatlas.org). A detailed description
of the HPA site is presented by Berglund et al(18). We searched for tissue data using the
following search parameters:
1. Moderate to strong staining in at least 3 patients with ovarian cancer
2. Negative staining in normal ovaries.
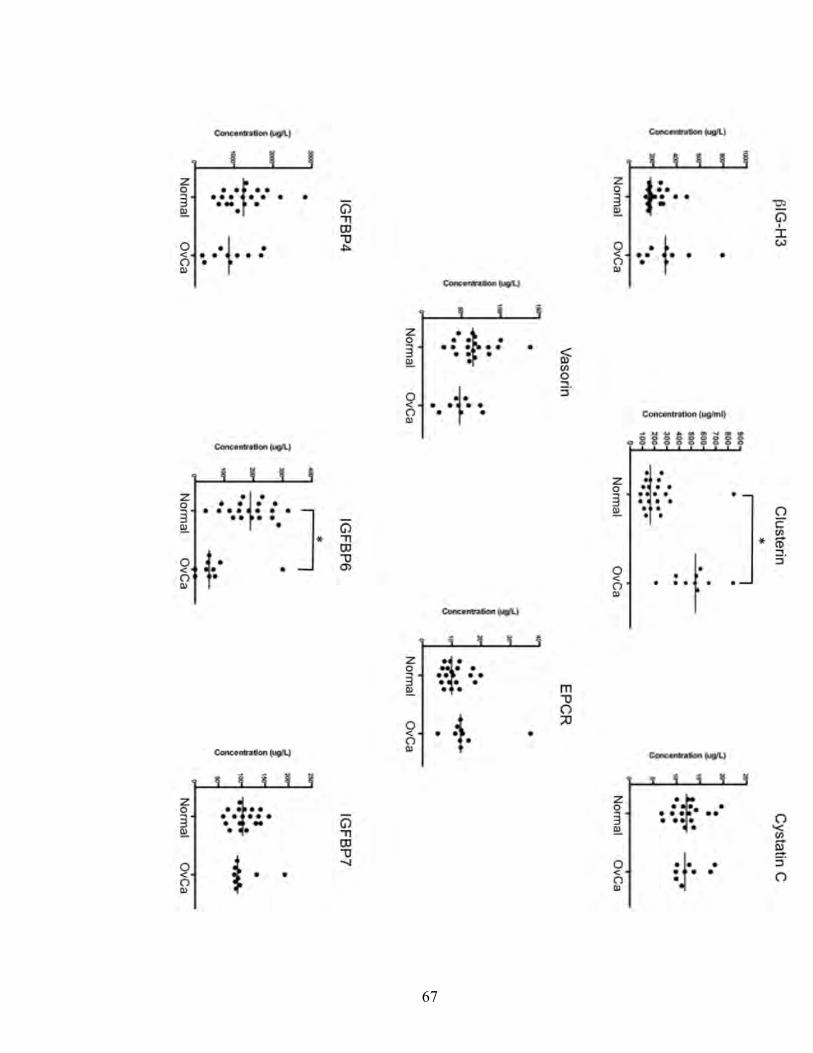
67

68
Figure 3.3. Initial screening results of the 8 candidates tested in serum of EOC patients
and healthy individuals. Normal designates women without ovarian cancer. OvCa designates
individual serum samples from EOC cases. Mann-Whitney test was used to calculate P values
and comparisons that are significantly different from each other (p < 0.01) are indicated with an
asterisk (*). Horizontal bar through each data set shows the median.

69
Clusterin showed staining in 5 out of 12 ovarian cancer tissue samples (data is not shown here
but is available publicly at the HPA). Normal ovarian tissue showed no staining, however data
was available for the stromal and follicular regions only. IGFBP6 did not pass our search
criteria as normal ovarian tissue (stromal tissue) showed weak staining (data available at the
HPA).
Furthermore, in order to elucidate the global cellular functions of these two proteins, we
examined clusterin and IGFBP6 using Ingenuity Pathway Analysis. The data showed clusterin
to be involved in several biological functions pertinent to tumor pathology including cell
development, growth and proliferation and movement. In addition, the major diseases associated
with clusterin were cancer, connective tissue disorders and endocrine disorders. The
interactome of clusterin is shown in Figure 3.4. The major biological functions for IGFBP6
were cell movement, growth and proliferation, and cell development. The major diseases
associated with IGFBP6 were cancer, skeletal and muscular disorders, and respiratory disease.
The interactome of IGFBP6 is shown in Figure 3.5.
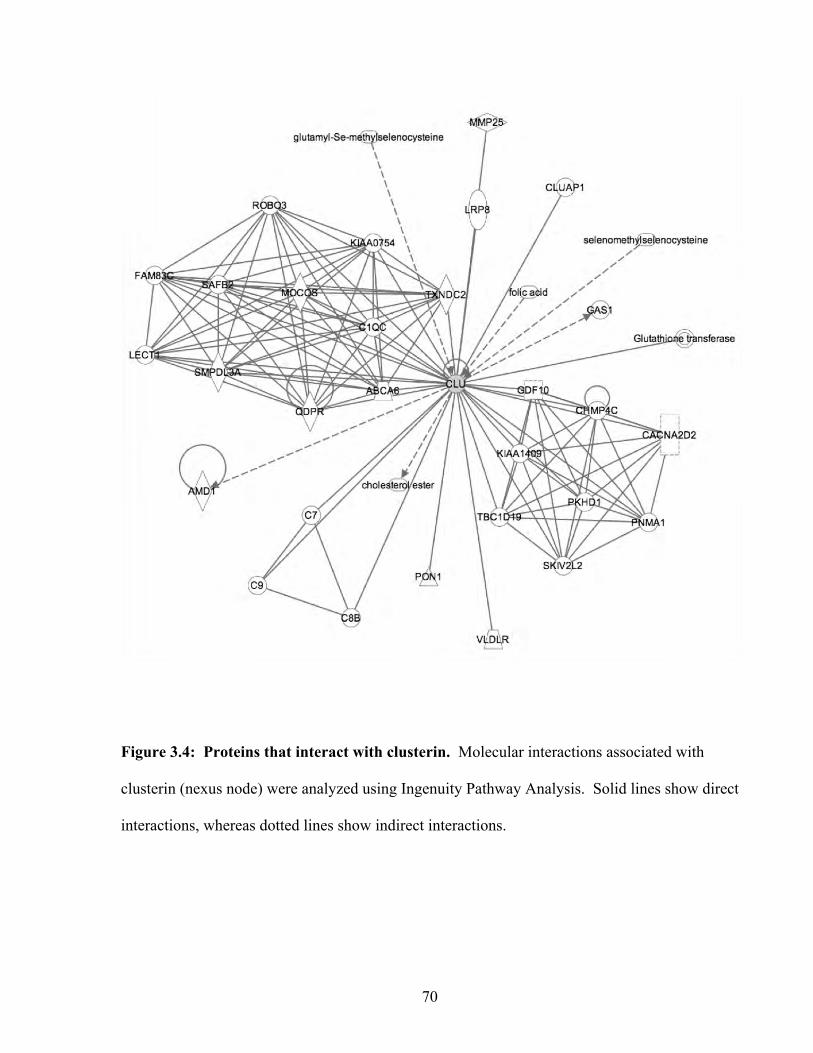
70
Figure 3.4: Proteins that interact with clusterin. Molecular interactions associated with
clusterin (nexus node) were analyzed using Ingenuity Pathway Analysis. Solid lines show direct
interactions, whereas dotted lines show indirect interactions.
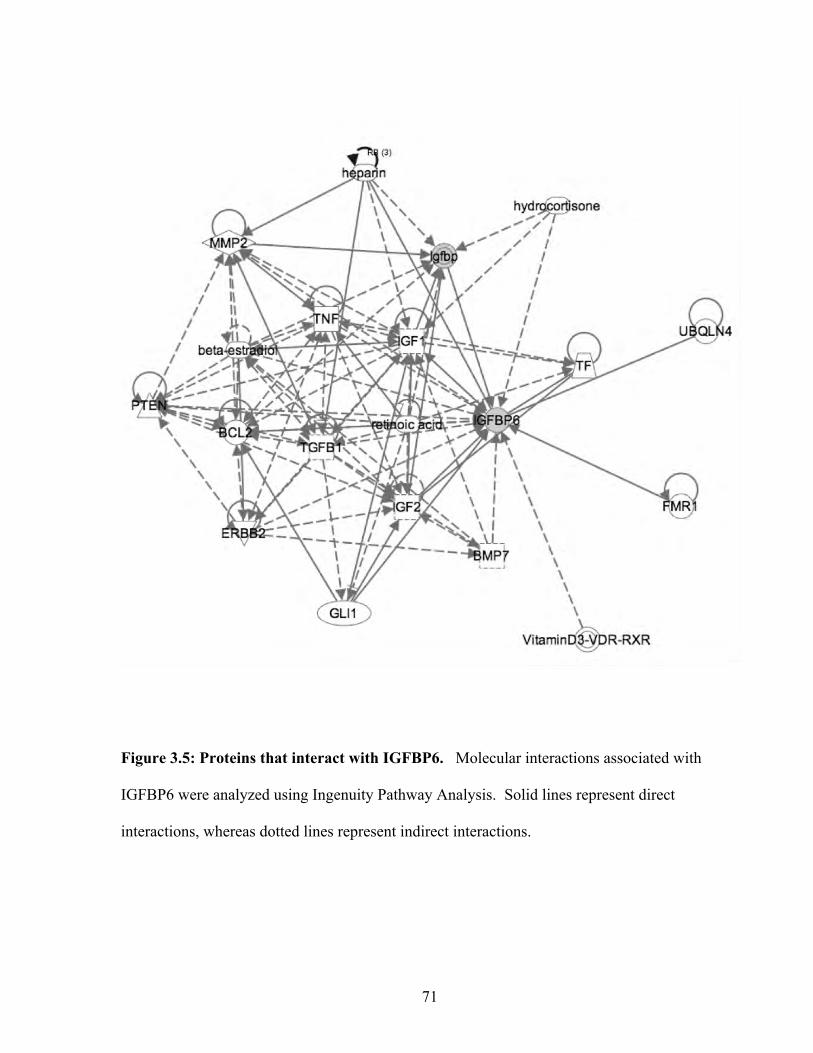
71
Figure 3.5: Proteins that interact with IGFBP6. Molecular interactions associated with
IGFBP6 were analyzed using Ingenuity Pathway Analysis. Solid lines represent direct
interactions, whereas dotted lines represent indirect interactions.
72
3.4 Discussion
Most investigations concerning biomarker research thus far have focused on analyzing
single types of specimens. That is, the research is limited to the use of only one source of
biomarkers such as cell lines, tissue specimens, or other biological fluids. In this study, we
used an integrated approach to mine for biomarkers. A key issue faced in this study was
applying reasonable criteria to choose meaningful candidates. The criteria are dependent on the
experimental questions being asked. In our analysis, we were interested in the extracellular and
membrane proteins since these are likely to enter the circulation and have a higher chance of
being measurable by a sensitive assay such as an ELISA. Therefore, our first criterion was to
select extracellular and membrane proteins only. However, a drawback of using cancer cell
lines is that they are no longer identical genetically or proteomically to the cancer from which
they originate. Therefore, candidates chosen exclusively from a list of proteins secreted or shed
by ovarian cancer cell lines may be biologically irrelevant to ovarian cancer.
Ascites fluid bathes the ovarian tumor and it is reasonable to assume that some proteins
found in ascites fluid originate from the tumor itself or its microenvironment. Therefore, by
selecting proteins that are common to both cell lines and ascites fluid, the list can be narrowed to
proteins that are biologically relevant to ovarian cancer. Indeed, by applying this criterion,
many well-documented markers of ovarian cancer were found in our study including HE4 (40,
67) and KLK6 (39, 70, 142) (see Table 2.1). CA-125 was also found in the conditioned media
of cell lines, but was not identified in the ascites study to which we compared our list of proteins
due to exclusion of proteins greater than 30 kDa (93). Altogether, our study demonstrates the
power of comparing the proteome of cell lines with that of a clinically relevant biological fluid
73
to identify new markers. This strategy is transferable to other cancers such as lung, pancreatic,
and liver.
Our final list of candidates included 51 proteins. Ingenuity pathway analysis revealed
that two of the major disease types associated with these proteins were cancer and reproduction.
This is encouraging given that our aim is to find biological markers of ovarian cancer. In
addition, some of the major molecular functions associated with these proteins include cell-to-
cell interaction, cellular function and maintenance, and cell growth and proliferation. These
functions are known to be important for tumor growth and metastasis (100).
A major bottleneck in identifying markers using a proteomic approach is candidate
validation. It is imperative that good antibodies and immunological assays are developed to
evaluate the numerous potential markers identified in studies so far. In our study, some
promising candidates could not be studied due to the lack of immunological reagents. We
analyzed 8 proteins that had ELISA kits or antibodies available. From this panel, both IGFBP6
and clusterin showed significant differences between EOC cases and healthy individuals.
Current standards imply that, a good biomarker is one that is preferably elevated in
tissues or biological fluids; clusterin showed such promise as a potential marker. To our
knowledge, clusterin levels in the serum of EOC cases have not been reported previously.
Regarding the candidates that did not show promise in serum, they cannot be dismissed since
their role in the pathogenesis of ovarian cancer needs to be determined. Although clusterin
showed promise, its effectiveness as a marker for early detection still remains an open question.
Our initial screen did not use serum from early stage EOC, and therefore, the use of clusterin to
detect early stage EOC cannot be ascertained. In addition, the sample size (n=30) in this study
74
is relatively low. Therefore further studies to test clusterin need a large cohort (n >100) with a
substantial number of early stage cancer patients.
Immunohistochemistry data available from the HPA show that clusterin is expressed in
greater amounts in ovarian cancer tissue relative to healthy. The immunohistochemistry data is
supported by the gene expression data published by Hough et al.(72) showing upregulated
clusterin mRNA in ovarian cancer. The results of our ELISA are concordant with the studies
mentioned above. These results raise the question as to why clusterin is upregulated in ovarian
cancer. Clusterin is important in several cellular functions including apoptosis (2, 30), cell
migration (99, 113), and cell development (149). Recent evidence suggests that clusterin may
be involved in ovarian cancer-related processes. Findings by Park et al. (130) showed that high
clusterin expressing ovarian cancer cells are resistant to Paclitaxel and that high clusterin
expression correlated with poor survival. Further studies are ongoing to understand the
pathobiological role of clusterin in ovarian cancer.
75
Chapter 4: Study of Candidate Protein Expression in Ovarian
Cancer Tissue by Immunohistochemistry
The immuohistochemical study was aided by our collaborating pathologist, Dr. Constantina Petraki, Evangelismos Hospital, Athens, Greece.
Dr. Petraki supervised the staining of tissues and provided expert interpretation of the data.
76
4.1 Introduction
Most proteins that enter circulation can be measured in body fluids such as blood, saliva,
and urine using highly sensitive technologies such as the ELISA. However, not all proteins
originating from tumors enter circulation. There may be several reasons for this:
1. The protein is intracellular.
2. The protein is cleared from the tumor microenvironment rapidly by proteases.
3. The protein degrades before it has a chance to enter circulation.
4. The protein is bound to other proteins that remain localized to the tumor
microenvironment.
Given the aforementioned reasons, if a tumor-specific protein is not found in the circulation, it
does not mean that it cannot be used as a biomarker. Such proteins can be used for tumor
staging, identifying histological type, prognosis, response to treatment, and so forth.
In the preceding chapter, we measured serum levels of 8 candidates, namely clusterin,
cystatin C, IGFBP4, -6, and -7, Vasorin, EPCR, and βIG-H3. Of these, clusterin and IGFBP6
showed a difference between cancer and normal sera. Very little protein expression data is
available regarding many of these candidates with respect to EOC. Therefore we looked at
protein expression using immunohistochemistry in four subtypes of EOC (serous, endometrioid,
clear-cell, and mucinous) and normal healthy ovarian surface epithelium. Of the 8 candidates
studied by ELISA, the antibodies to clusterin, IGFBP5, IGFBP7, and EPCR were also suitable
for immunohistochemistry. Therefore we looked at their protein expression in cancerous and
healthy tissue. In addition, we also studied the expression of three other proteins, namely
ADAM15, integrin β4, and ICAM5. These proteins were found in the proteomic study of cell
77
culture supernatants, and antibodies optimized for immunohistochemistry were available.
Therefore we included them as part of the study.
The ADAM (a disintegrin and metalloproteinase) proteins are members of the metzincin
superfamily of matrix metalloproteinases (22, 43). To date, 21 functional ADAMs have been
studied in humans (42). These proteins have two clearly defined biological functions:
Proteolysis and cell adhesion. Their protease activity is focused on transmembrane proteins
such as precursor forms of growth factors. The ADAMs have been implicated in shedding
ligands of HER family of receptor (42). The HER family of receptors has been implicated in the
progression and development of multiple cancer types (125). ADAM15 appears to be important
to metastasis, in that loss of ADAM15 decreased metastasis to the bone in a prostate cancer cell
line model. In addition, mice deficient in ADAM15 develop smaller tumors upon melanoma
cell injection.
The insulin growth factor binding proteins (IGFBPs) are a family of proteins that bind to
and modulate the activity of the IGF ligand. IGF signalling plays a major role in the growth,
differentiation, and proliferation of mammalian cells. IGF signalling has been implicated in
breast cancer biology, and thus the role played by IGFBPs in cancer is an exciting area of
research. There are seven IGFBPs, numbered 1-7. Table 4.1 summarizes the properties of these
seven IGFBPs. The activity of IGF is related to the level of circulating IGFBP.

78
Table 4.1: Properties of the IGFBP 1-7 (taken from Subramanian et al. (157))
IGFBP Production site a Molecular Weight (kDa)
Chromosomal location
Comments
1 liver 25-34 7p existence of both phosphorylated and unphosphorylated forms
2 CNS 32-34 2q preference for IGF-II
3 global 29-54 7p M.W. dependant on degree of glycosylation; b
4 bone/CNS/prostate 24 & 29 17q M.W. depends on glycosylationb
5 kidney 23 2q A factor in lung and bone development
6 ovary/prostate 30-32 12q Higher affinity for IGF-II than IGF-I
7 several sites 26 4q Also known as Mac25 or IGFBPrP1
a Primary site of production b M.W. (molecular weight)
79
The IGFBPs have a greater affinity for IGF than the IGF receptor itself. Thus IGF signalling is
controlled via competitive inhibition. The activity of IGFBPs is controlled by proteases such as
MMP-7 and MMP-9, however it appears that the nature of deactivating protease is tissue
dependant (157).
Clusterin is a highly abundant protein in serum (71) and is ubiquitous in tissue
distribution. Some biological processes involving clusterin include sperm maturation, tissue
differentiation, tissue remodelling, cell proliferation, and cell death. Clusterin is also involved
in several pathological states including neurodegenerative diseases and cancer (138, 149). In
fact, the protein is disregulated in many cancers including pancreatic, prostate, breast, and
esophageal cancer (19, 134, 175, 180). Interestingly, the expression of clusterin appears to be
cancer-dependant. In ovarian carcinoma, clusterin overexpression provides protection for
tumors against chemotherapeutic agents. This has been discussed in the preceding chapter (see
chapter 3, Discussion).
Adhesion molecules play a pivotal role in keeping the monolayer of surface epithelium
attached to the basement membrane in the ovary. Basement membranes are composed of many
components, including collagenous and non-collagenous proteins, proteoglycans, and growth
factors. Laminin is the major non-collagenous protein of the basement membranes. The
integrins are heterodimeric proteins composed of an α and β subunit that bind to laminin (74,
151). A positive correlation between integrin β4 and laminin expression in serous ovarian
carcinoma has been shown by Skubitz et al. (151). However no studies have been done looking
at integrin β4 expression in other forms of EOC. Therefore we looked at integrin β4 expression
in mucinous, clear-cell, and endometrioid ovarian carcinomas as well as serous carcinomas.
80
Intracellular adhesion molecule-5 (ICAM5), also known as telencephalin, is a member of
the ICAM-family of adhesion proteins. These proteins bind to leukocyte β2-integrins
(CD11/CD18). ICAM-5 is highly expressed in the mammalian forebrain, appears at the time of
birth, and is located in the soma and dendrites of neurons (54). ICAM5 was found in the cell
culture supernatants of ovarian cancer cell lines (63) and therefore is an interesting molecule to
explore in ovarian cancer for several reasons:
1. The molecule seems to be exclusive to neuronal tissue. A caveat though is that this
was confirmed in mouse models.
2. It can suppress T-cell activation
3. Ovarian cancer cell lines express ICAM5
4. Adhesion molecules play a pivotal role in cancer
Endothelial Protein C Receptor (EPCR) is a critical protein that regulates the
anticoagulant functions of activated protein C (aPC), which is a liver-derived serine protease
(52). Studies in mice suggest that EPCR is important for embryonic development (28, 62).
EPCR also regulates some of the anti-inflammatory and anti-apoptotic functions of activated
protein C (aPC). For example, EPCR may protect the lungs from severe inflammatory lung
diseases by mediating aPC anti-inflammatory activity. EPCR is normally found on the
endothelium of large blood vessels, however studies have shown expression in dendritic cells,
where it plays a role in innate immunity, and in neutrophils, where expression prevents
neutrophil chemotaxis (47). With respect to ovarian cancer, very little is known. Suzuki et.al.
reported that aPC increases migration of ovarian cancer cells and through an EPCR mediated

81
pathway, increases invasion (159). However, very little has been said whether or not primary
ovarian tumors express EPCR. In the present study, we address this question.
82
4.2 Materials and Methods
4.2.1 Materials
Antibodies to ADAM15, EPCR, Clusterin, ICAM-5, IGFBP5, IGFBP7, and integrin β4 were
purchased from R&D Systems.
4.2.2 Tumor specimens
Human ovarian tissue samples were taken from formalin-fixed, paraffin embedded
samples. The tissues included normal ovarian surface epithelium, and twenty-one cases of
epithelial ovarian cancer (EOC): six serous, five mucinous, five clear cell and five endometrioid
adenocarcinomas. The carcinomas were graded according to the International Federation of
Gynecology and Obstetrics (FIGO) histological grade.
4.2.3 Immunostaining
Immunohistochemical staining was performed on 3µm thick paraffin embedded sections
of tissues fixed in buffered formalin. Staining of normal tissue, cancerous tissue, and positive
controls were performed concurrently. Staining procedures included deparaffinization in warm
xylene for 5 min with two changes of xylene at room temperature, followed by rehydration by
transfer through graded alcohols and then rinsing with distilled water. The Trilogy antigen
retrieval system (Cell Marque) was used for one hour in order to expose the antigen epitopes.
After 20 minutes at room temperature and rinsing with distilled water, the sections were put in
3% H202 for 10 min in darkness. After washing with tap water, the sections were dipped twice
for 5 min in Tris buffer saline (TBS), incubated with the following antibodies, at the following
dilutions: mouse monoclonal ADAM15 (1:10), goat polyclonal Clusterin (1:1000), goat
polyclonal EPCR (1:400), mouse monoclonal ICAM-5 (1:10), monoclonal mouse IGFBP-5
83
(1:20), goat polyclonal IGFBP-7 (1:200), and mouse monoclonal integrin β4 (1:20) for 30 min,
rinsed with TBS for 10 min and then incubated with the Envision™ detection system
peroxidase/DAB+, Rabbit/Mouse (DAKO Cytomation, Denmark) for 30 min. Rinsing with
TBS for 10 minutes, incubation in diaminobenzidine (DAB) solution for 10 minutes at room
temperature and rinsing with tap water followed. The sections were then counterstained with
haematoxylin, dehydrated, cleared in xylene and mounted. Negative controls were performed
for all studied tissues by omitting the primary antibody
4.2.4 Evaluation of immunohistochemical staining
Staining was evaluated by an experienced Pathologist. Cytoplasmic/membranous
staining was evaluated as no staining (0), weak (1), moderate (2), or strong (3) based on
intensity. The percentage of each expression (weak, moderate, or strong) was assigned based on
the proportion of positive tumor cells to total tumor cells ranging from 0 to 100%. Percentages
for weak, moderate, and strong staining in every tumor section were multiplied by 1, 2 and 3
respectively. That is, if a tumor has no stain, the value is 0 (0 x 100). If it has strong staining in
100% of the section (the whole tumor is stained strongly) the value is 300 (3 x 100). If a tumor
section has 30% mild expression and 20% strong expression, then the value is 90 (0x50 + 1x30
+ 3x20). The obtained values (0-300) were categorized in four score groups with the following
ranges: 1=0-50, 2=51-150, 3=151-250, 4=251-300. A final score was obtained by using a two-
scale grouping, as follows: 1 (low expression)=0-150 and 2 (high expression)=151-300.
84
4.3 Results
The interpretation of staining intensity is highly subjective and may be affected by
storage time, variation in protocols, and fixation procedures. In addition, strength of antibody-
antigen interaction can also affect the intensity of staining. Therefore, we stained all tumour
tissue, normal tissue, and positive controls concurrently to keep the staining procedure constant
for each antibody. Staining intensity and scoring was performed by an experienced Pathologist.
4.3.1 ADAM15 expression
ADAM15 protein was detected in 5/6 serous carcinomas (Table 4.2). In the positive
cases, the expression was low regardless of the grade of the serous carcinoma. One tumor
section showed no staining for the protein. ADAM 15 was detected in all mucinous carcinomas
(5/5). Four specimens showed low expression and one showed high expression. The strength of
the staining did not correlate with tumor grade. All clear-cell carcinoma sections stained
positive for ADAM15. Again, the strength of the staining did not correlate with tumor grade.
However, 3/5 tumor sections (all FIGO stage II) showed high ADAM15 expression. Although
the expression was low, all five endometrioid carcinoma sections stained positive for ADAM15.
Tumor grade did not correlate with protein expression in these sections. Sections representative
of ADAM15 staining in the four subtypes of EOC are illustrated in Figure 4.1. Healthy ovarian
surface epithelium was also positive for ADAM15 protein, but expression was qualitatively
equivalent the cancer counterparts (Figure 4.2). Prostate cancer tissue was used as a positive
control for staining (result not shown). ADAM15 expression was observed in a predominately
cytoplasmic distribution pattern in all tissue sections including healthy surface epithelium.
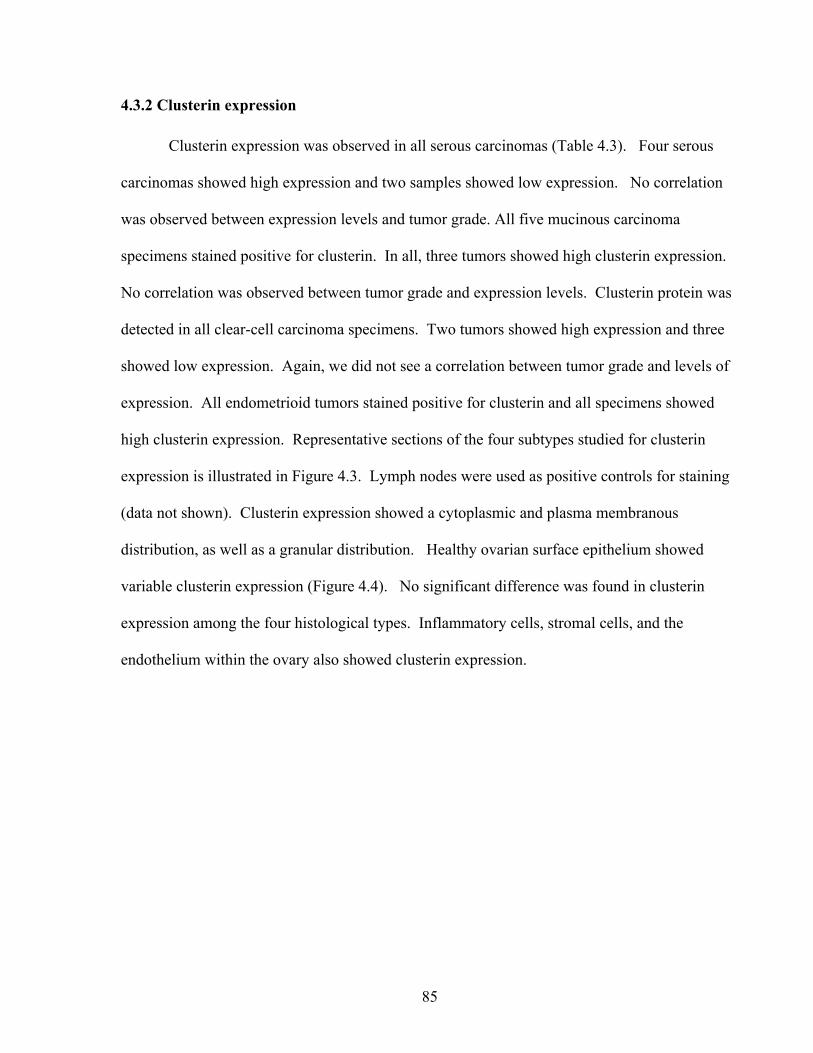
85
4.3.2 Clusterin expression
Clusterin expression was observed in all serous carcinomas (Table 4.3). Four serous
carcinomas showed high expression and two samples showed low expression. No correlation
was observed between expression levels and tumor grade. All five mucinous carcinoma
specimens stained positive for clusterin. In all, three tumors showed high clusterin expression.
No correlation was observed between tumor grade and expression levels. Clusterin protein was
detected in all clear-cell carcinoma specimens. Two tumors showed high expression and three
showed low expression. Again, we did not see a correlation between tumor grade and levels of
expression. All endometrioid tumors stained positive for clusterin and all specimens showed
high clusterin expression. Representative sections of the four subtypes studied for clusterin
expression is illustrated in Figure 4.3. Lymph nodes were used as positive controls for staining
(data not shown). Clusterin expression showed a cytoplasmic and plasma membranous
distribution, as well as a granular distribution. Healthy ovarian surface epithelium showed
variable clusterin expression (Figure 4.4). No significant difference was found in clusterin
expression among the four histological types. Inflammatory cells, stromal cells, and the
endothelium within the ovary also showed clusterin expression.
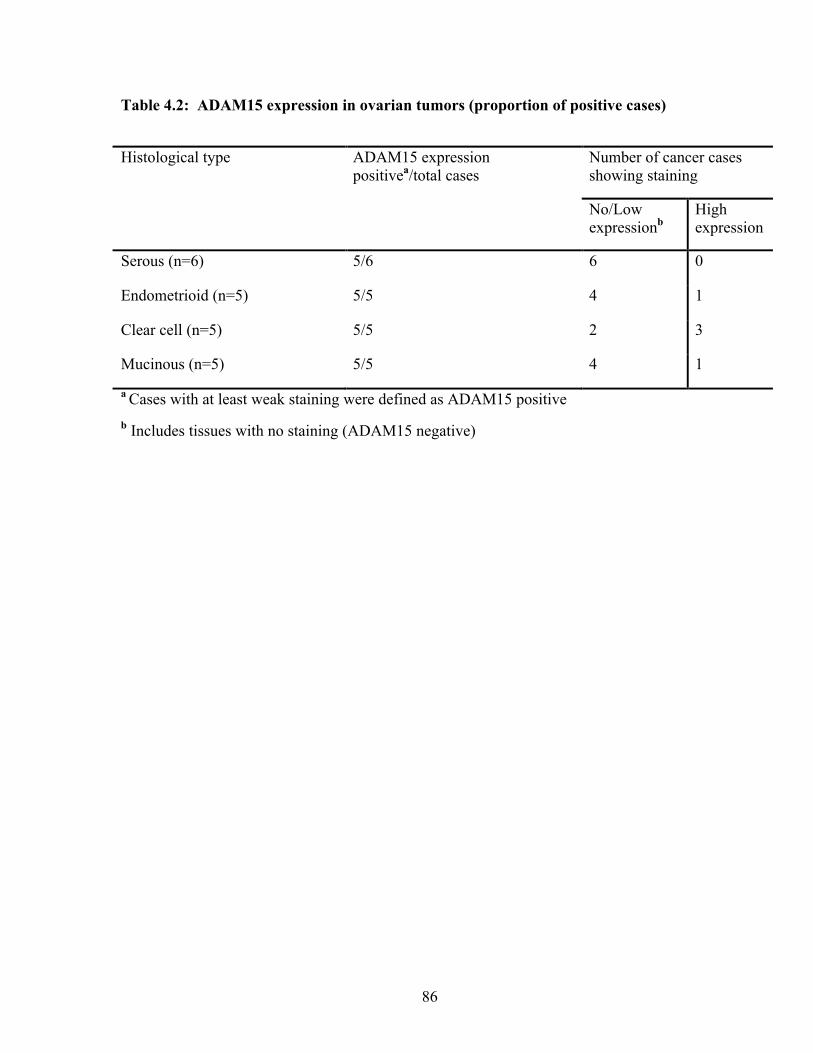
86
Table 4.2: ADAM15 expression in ovarian tumors (proportion of positive cases)
Histological type ADAM15 expression positivea/total cases
Number of cancer cases showing staining
No/Low expressionb
High expression
Serous (n=6) 5/6 6 0
Endometrioid (n=5) 5/5 4 1
Clear cell (n=5) 5/5 2 3
Mucinous (n=5) 5/5 4 1
a Cases with at least weak staining were defined as ADAM15 positive b Includes tissues with no staining (ADAM15 negative)
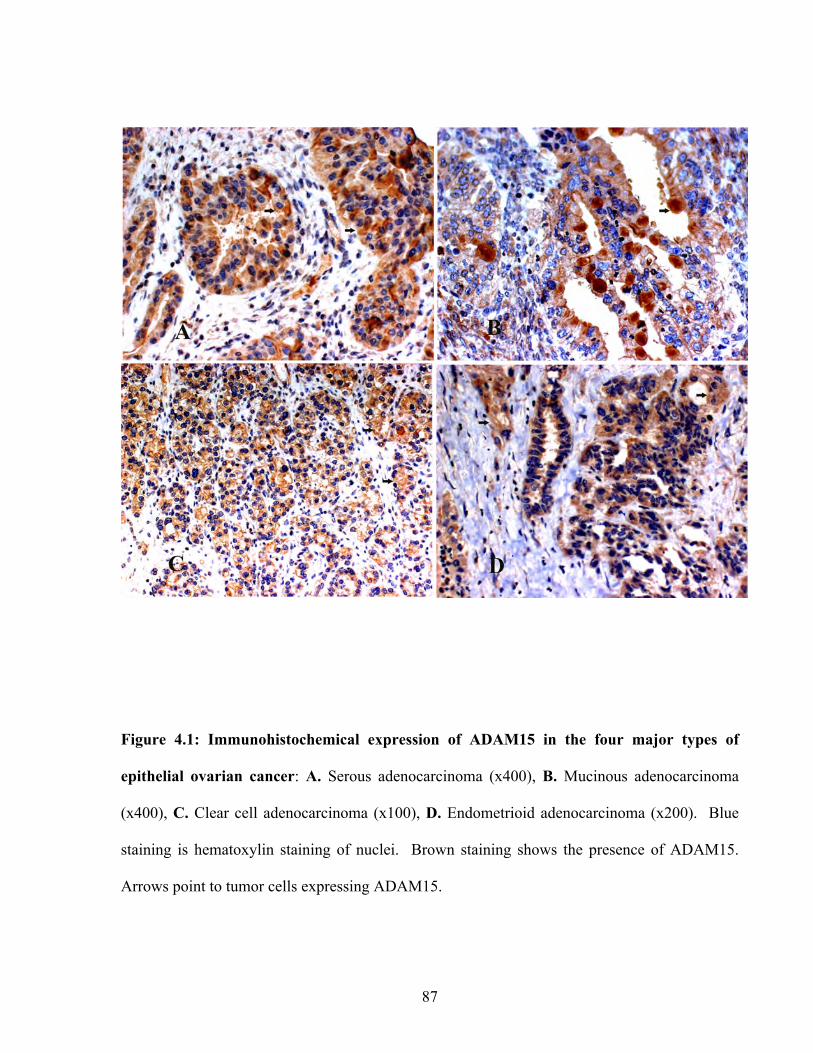
87
Figure 4.1: Immunohistochemical expression of ADAM15 in the four major types of
epithelial ovarian cancer: A. Serous adenocarcinoma (x400), B. Mucinous adenocarcinoma
(x400), C. Clear cell adenocarcinoma (x100), D. Endometrioid adenocarcinoma (x200). Blue
staining is hematoxylin staining of nuclei. Brown staining shows the presence of ADAM15.
Arrows point to tumor cells expressing ADAM15.
88
Figure 4.2: Immunohistochemical expression of ADAM15 in normal surface epithelium
(400X). Arrow points to surface epithelial cells that are positive for ADAM15 expression
(brown staining). ‘Str’ designates stromal tissue. Blue colour is hematoxylin stain.
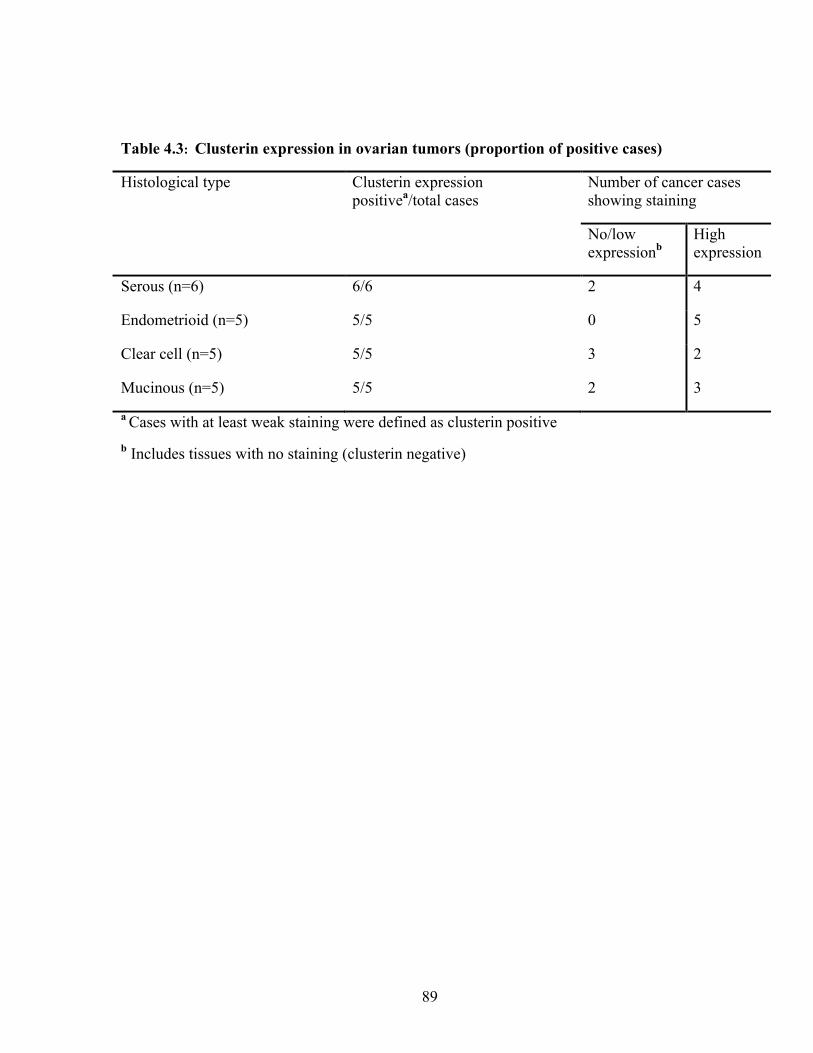
89
Table 4.3: Clusterin expression in ovarian tumors (proportion of positive cases)
Histological type Clusterin expression positivea/total cases
Number of cancer cases showing staining
No/low expressionb
High expression
Serous (n=6) 6/6 2 4
Endometrioid (n=5) 5/5 0 5
Clear cell (n=5) 5/5 3 2
Mucinous (n=5) 5/5 2 3
a Cases with at least weak staining were defined as clusterin positive b Includes tissues with no staining (clusterin negative)
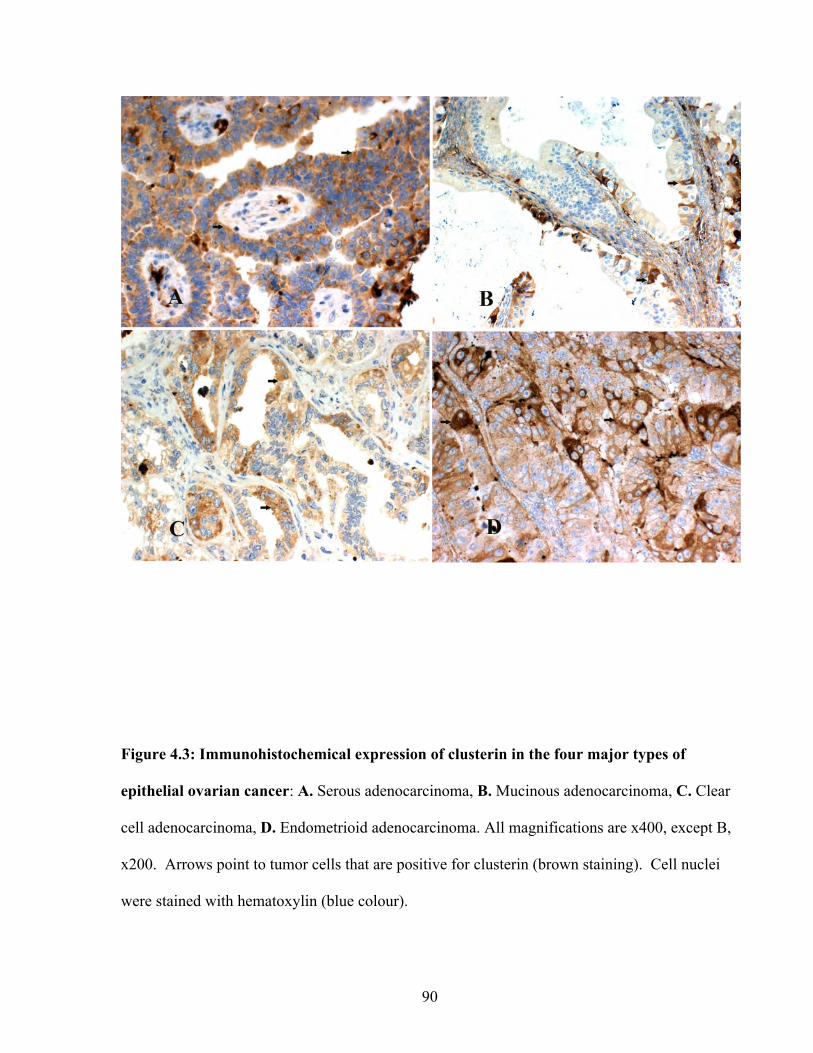
90
Figure 4.3: Immunohistochemical expression of clusterin in the four major types of
epithelial ovarian cancer: A. Serous adenocarcinoma, B. Mucinous adenocarcinoma, C. Clear
cell adenocarcinoma, D. Endometrioid adenocarcinoma. All magnifications are x400, except B,
x200. Arrows point to tumor cells that are positive for clusterin (brown staining). Cell nuclei
were stained with hematoxylin (blue colour).
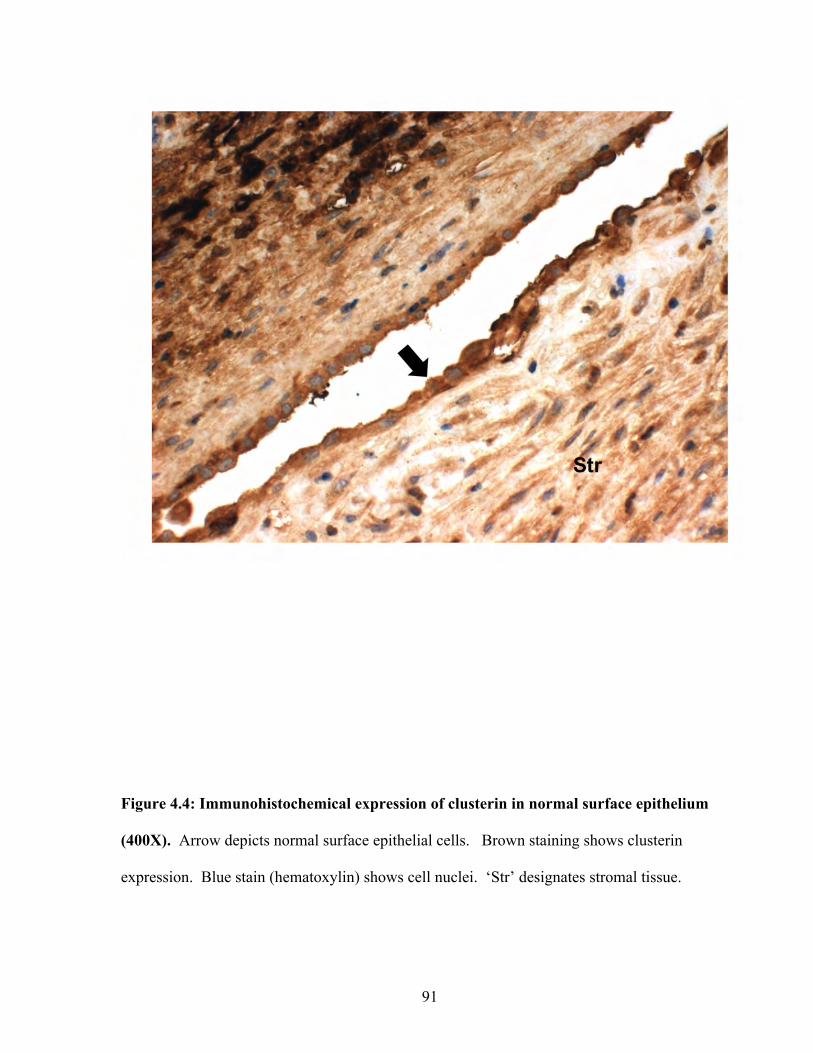
91
Figure 4.4: Immunohistochemical expression of clusterin in normal surface epithelium
(400X). Arrow depicts normal surface epithelial cells. Brown staining shows clusterin
expression. Blue stain (hematoxylin) shows cell nuclei. ‘Str’ designates stromal tissue.

92
4.3.3 EPCR Expression
EPCR protein was detected in all serous carcinomas (Table 4.4). In the positive cases,
three sections (50%) showed high expression. Expression levels of EPCR protein did not
correlate with tumor grade. EPCR was detected in all mucinous carcinomas (5/5). All
specimens showed low expression. The mucinous sections were either grade I or grade II
tumors. All but one clear-cell carcinoma section stained positive for EPCR protein. Although
expression levels were relatively low, the sections that stained positive were all from grade II
tumors. All but one endometrioid carcinoma sample stained positive for EPCR. Three sections
showed low expression, one showed high expression, and one showed no expression.
Expression levels did not correlate with tumor grade. Sections representative of EPCR staining
in the four subtypes are illustrated in Figure 4.5. Healthy ovarian surface epithelium was also
positive for EPCR protein, but the staining was qualitatively equivalent to or greater than the
cancer sections (Figure 4.6). We used liver tissue as a positive control for staining (result not
shown). EPCR expression was observed in both a granular cytoplasmic and membranous
distribution pattern in all tissue sections including healthy surface epithelium. As expected,
endothelial tissue was positive for EPCR.
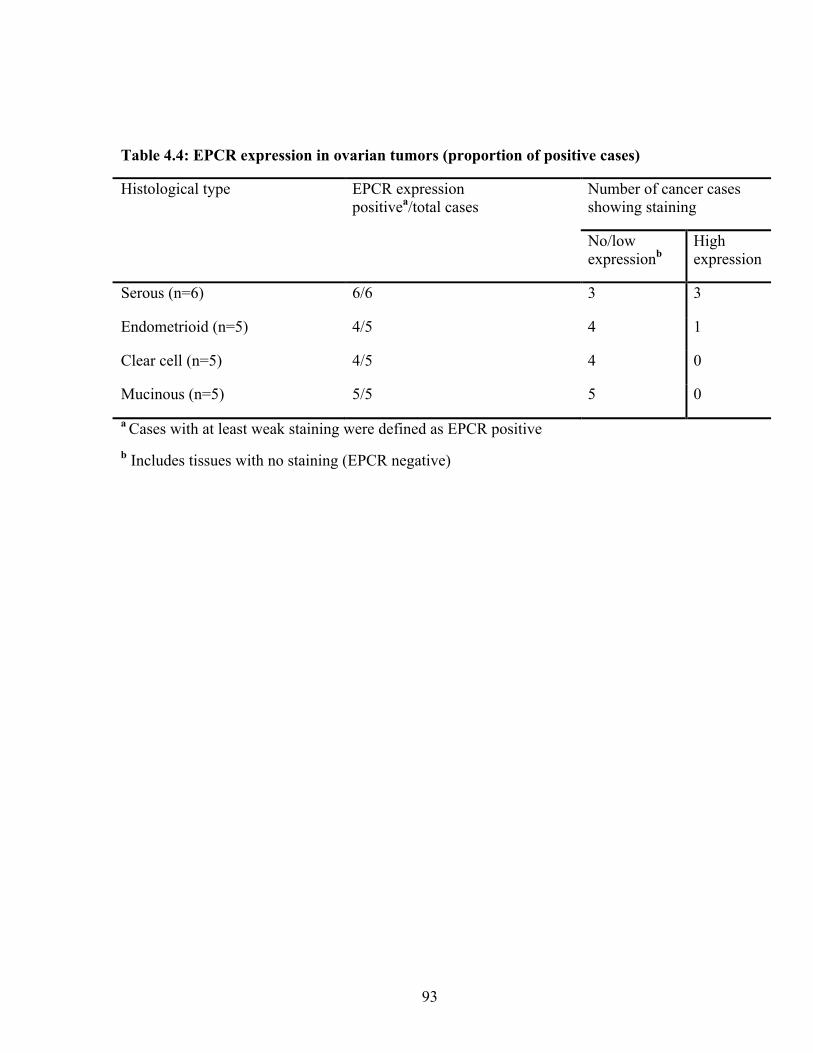
93
Table 4.4: EPCR expression in ovarian tumors (proportion of positive cases)
Histological type EPCR expression positivea/total cases
Number of cancer cases showing staining
No/low expressionb
High expression
Serous (n=6) 6/6 3 3
Endometrioid (n=5) 4/5 4 1
Clear cell (n=5) 4/5 4 0
Mucinous (n=5) 5/5 5 0
a Cases with at least weak staining were defined as EPCR positive b Includes tissues with no staining (EPCR negative)
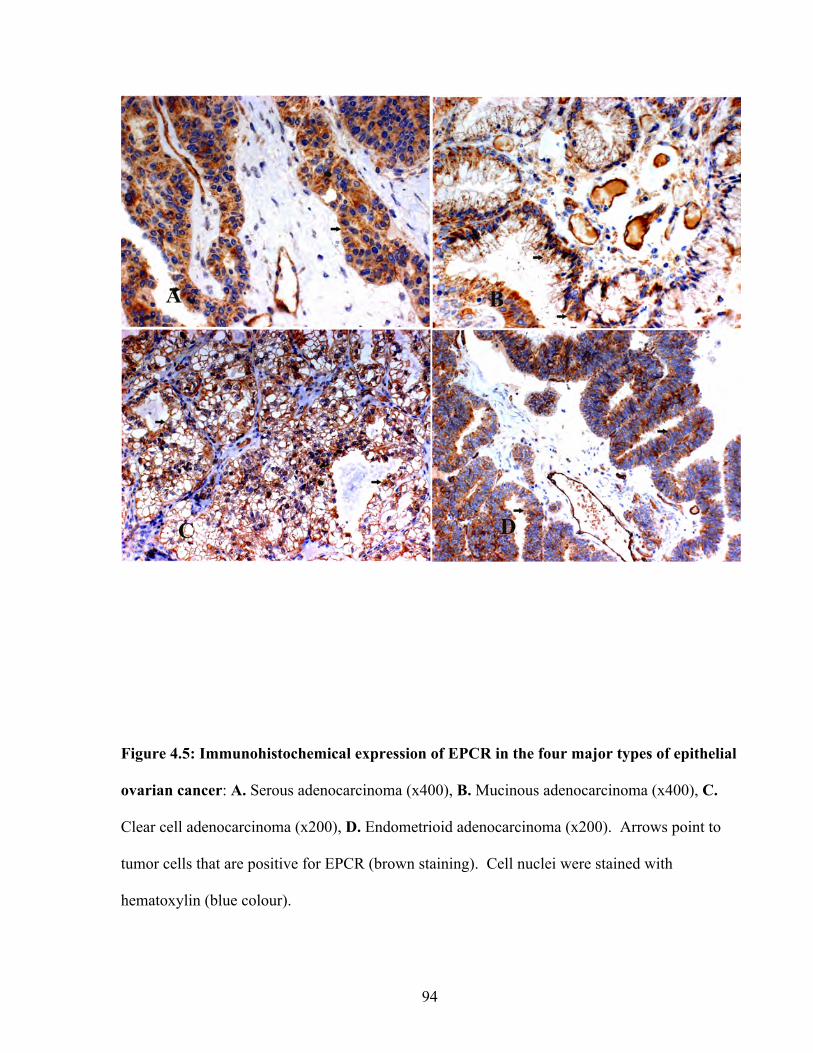
94
Figure 4.5: Immunohistochemical expression of EPCR in the four major types of epithelial
ovarian cancer: A. Serous adenocarcinoma (x400), B. Mucinous adenocarcinoma (x400), C.
Clear cell adenocarcinoma (x200), D. Endometrioid adenocarcinoma (x200). Arrows point to
tumor cells that are positive for EPCR (brown staining). Cell nuclei were stained with
hematoxylin (blue colour).
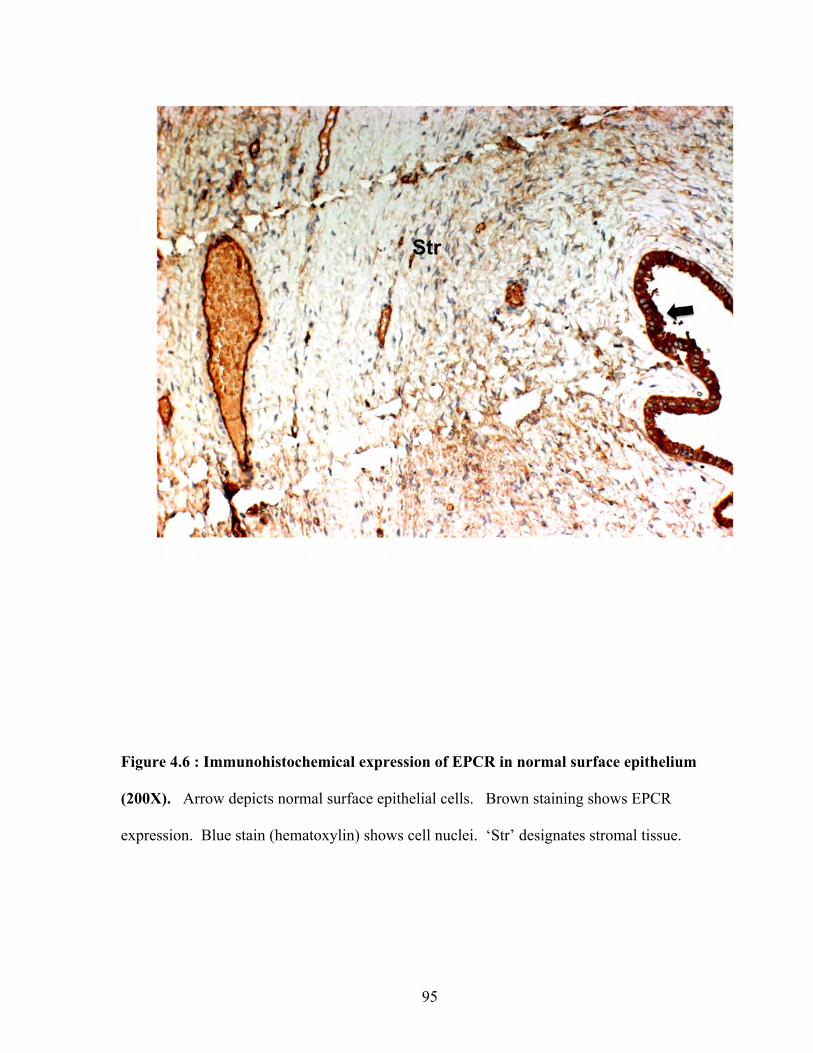
95
Figure 4.6 : Immunohistochemical expression of EPCR in normal surface epithelium
(200X). Arrow depicts normal surface epithelial cells. Brown staining shows EPCR
expression. Blue stain (hematoxylin) shows cell nuclei. ‘Str’ designates stromal tissue.
96
4.3.4 ICAM 5 Expression
ICAM5 protein was detected in all serous carcinomas (Table 4.5). Two grade II tumors
showed high expression of ICAM5, but we did not see a correlation between tumor stage and
expression levels. All mucinous carcinomas expressed ICAM5. Two tumor sections (one
grade I and one grade II) showed high expression. The strength of the staining did not correlate
with tumor grade. All clear-cell carcinoma sections stained positive for ICAM5, with one
section showing high expression. Again, the strength of the staining did not correlate with
tumor grade. Four endometrioid tumor sections showed low expression, and one (grade III)
showed high expression. Tumor grade did not correlate with protein expression in these
sections. Sections representative of ICAM5 staining in the four subtypes are illustrated in
Figure 4.7. Healthy ovarian surface epithelium showed negative to mild expression of ICAM5
and therefore was qualitatively less than cancer sections (Figure 4.8). We used breast cancer
tissue as a positive control for staining (result not shown). ICAM5 expression was observed in
a predominately cytoplasmic and membranous distribution pattern. Smooth muscle cells of the
ovary also expressed ICAM5.
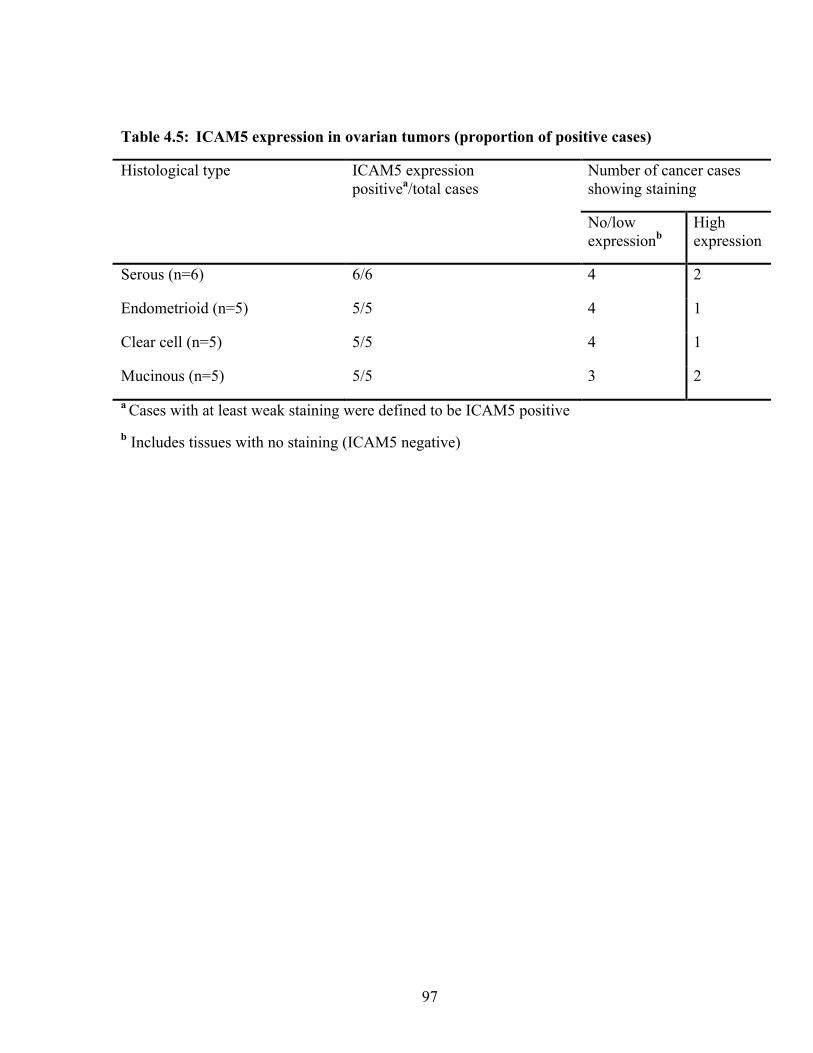
97
Table 4.5: ICAM5 expression in ovarian tumors (proportion of positive cases)
Histological type ICAM5 expression positivea/total cases
Number of cancer cases showing staining
No/low expressionb
High expression
Serous (n=6) 6/6 4 2
Endometrioid (n=5) 5/5 4 1
Clear cell (n=5) 5/5 4 1
Mucinous (n=5) 5/5 3 2
a Cases with at least weak staining were defined to be ICAM5 positive b Includes tissues with no staining (ICAM5 negative)
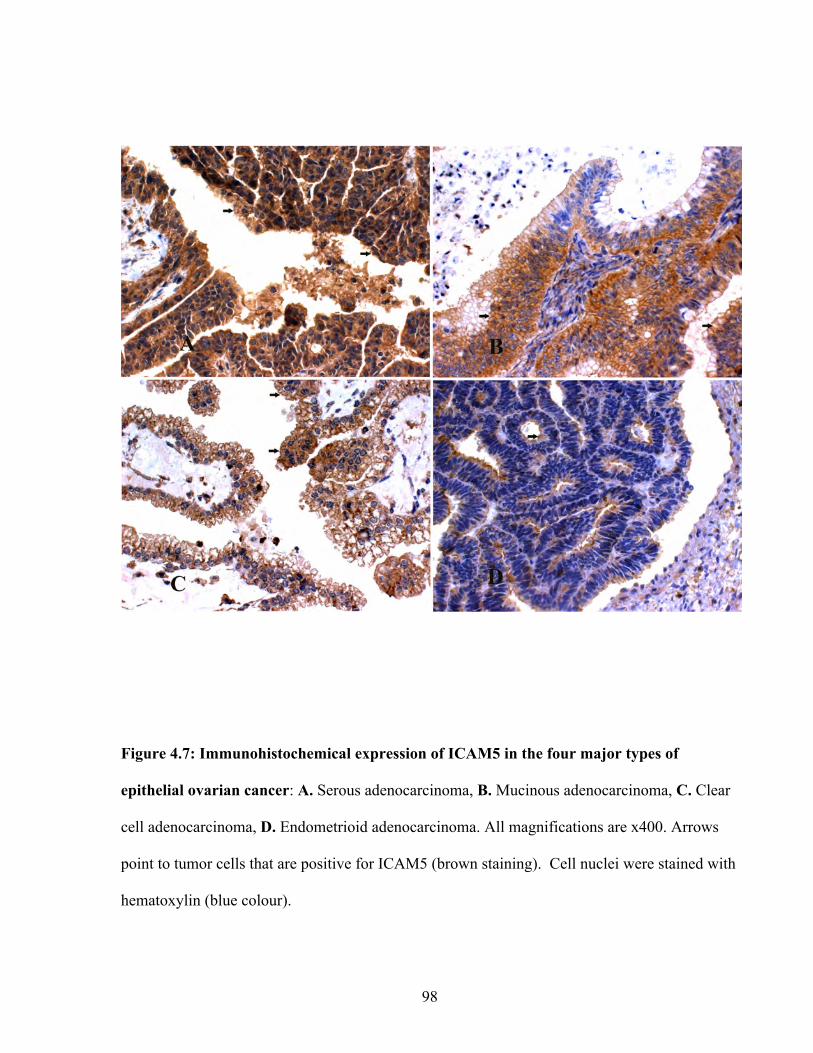
98
Figure 4.7: Immunohistochemical expression of ICAM5 in the four major types of
epithelial ovarian cancer: A. Serous adenocarcinoma, B. Mucinous adenocarcinoma, C. Clear
cell adenocarcinoma, D. Endometrioid adenocarcinoma. All magnifications are x400. Arrows
point to tumor cells that are positive for ICAM5 (brown staining). Cell nuclei were stained with
hematoxylin (blue colour).
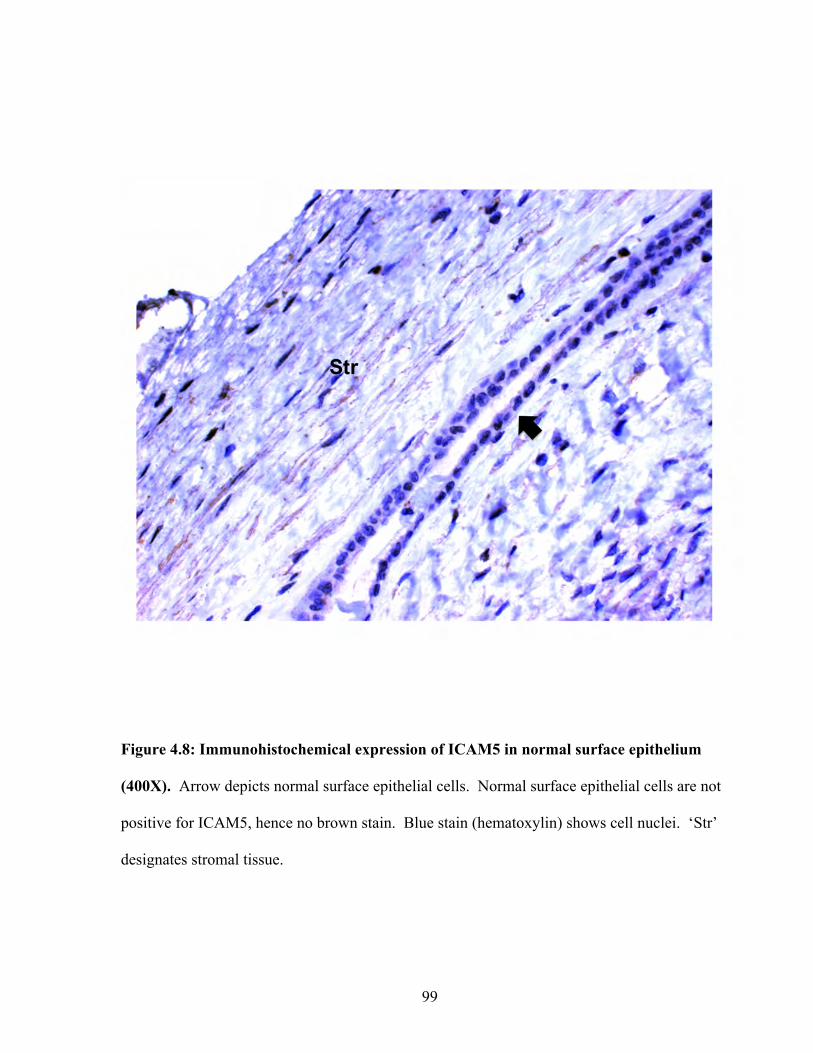
99
Figure 4.8: Immunohistochemical expression of ICAM5 in normal surface epithelium
(400X). Arrow depicts normal surface epithelial cells. Normal surface epithelial cells are not
positive for ICAM5, hence no brown stain. Blue stain (hematoxylin) shows cell nuclei. ‘Str’
designates stromal tissue.
100
4.3.5 IGFBP5 Expression
IGFBP5 protein was detected in three serous carcinomas (Table 4.6) but the expression
was low. Four mucinous carcinomas were positive for IGFBP5 protein with one having high
levels of expression. Two of the clear cell carcinoma specimens (tumor grade II) stained
positive for IGFBP5 and both showed high expression. Three of the endometrioid cancer
specimens stained positive for IGFBP5 with one showing high expression. Mild to moderate
expression was observed in normal surface epithelium. Representative samples from each EOC
subtype and normal surface epithelium showing IGFBP5 expression are illustrated in Figures
4.9 and 4.10. Placental tissue was used as a positive control (data not shown). Expression
followed a cytoplasmic and membranous distribution pattern. A correlation between tumor
stage and expression levels could not be established, as sample size was low. Reliable
statistical results could not be established to compare expression differences between the various
EOC subtypes as the number of samples were low. However, from a qualitative perspective,
serous carcinomas showed the weakest expression among the subtypes. Healthy ovarian
stromal tissue was also positive for IGFBP5 expression (data not shown).
4.3.6 IGFBP7 Expression
IGFBP7 protein was detected in all serous carcinomas (Table 4.7). All but one tumor
showed low expression. The sole high expressing tumor was a grade III tumor. A correlation
between tumor grade and expression levels could not be established. All mucinous carcinomas
were positive for IGFBP7 with low expression levels. All clear-cell carcinoma sections stained
positive for IGFBP7, with 3/5 sections showing high expression.
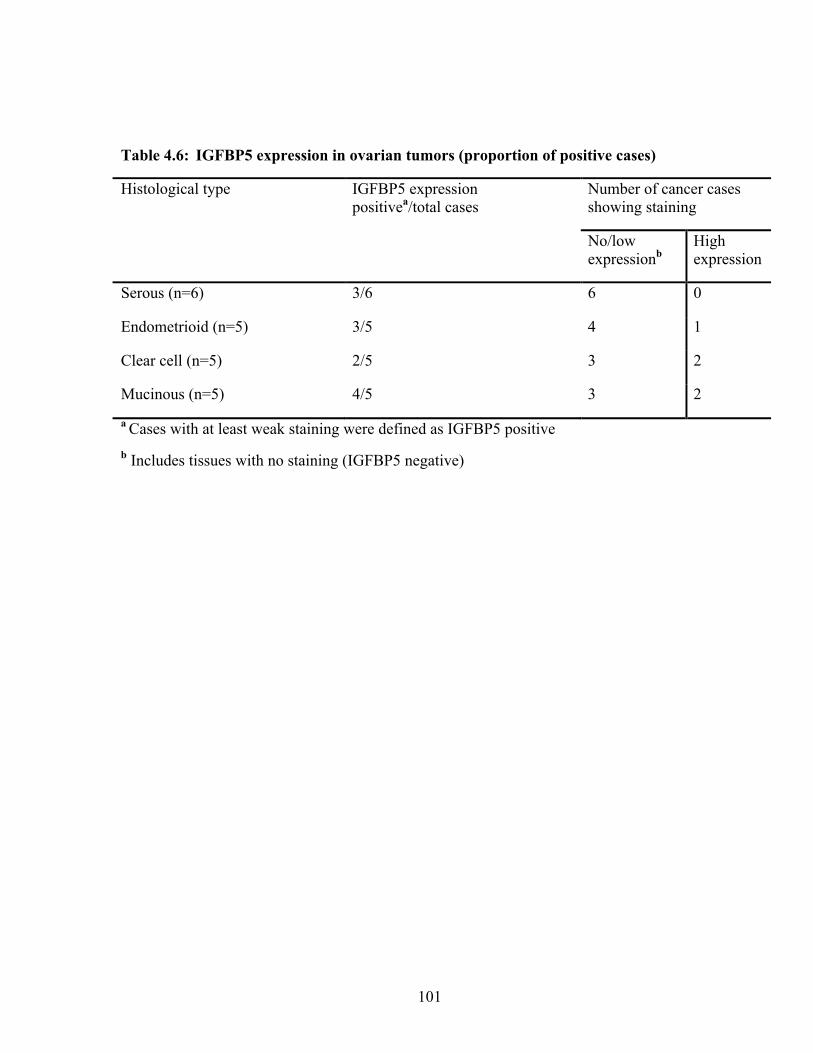
101
Table 4.6: IGFBP5 expression in ovarian tumors (proportion of positive cases)
Histological type IGFBP5 expression positivea/total cases
Number of cancer cases showing staining
No/low expressionb
High expression
Serous (n=6) 3/6 6 0
Endometrioid (n=5) 3/5 4 1
Clear cell (n=5) 2/5 3 2
Mucinous (n=5) 4/5 3 2
a Cases with at least weak staining were defined as IGFBP5 positive b Includes tissues with no staining (IGFBP5 negative)
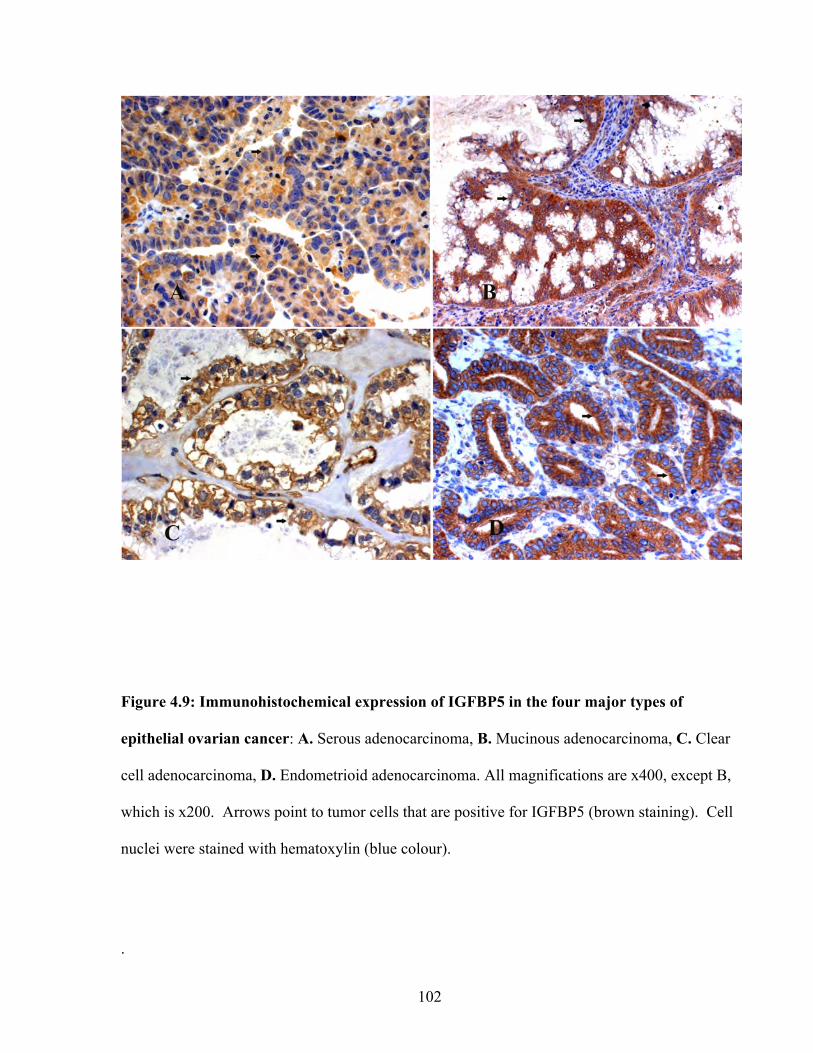
102
Figure 4.9: Immunohistochemical expression of IGFBP5 in the four major types of
epithelial ovarian cancer: A. Serous adenocarcinoma, B. Mucinous adenocarcinoma, C. Clear
cell adenocarcinoma, D. Endometrioid adenocarcinoma. All magnifications are x400, except B,
which is x200. Arrows point to tumor cells that are positive for IGFBP5 (brown staining). Cell
nuclei were stained with hematoxylin (blue colour).
.
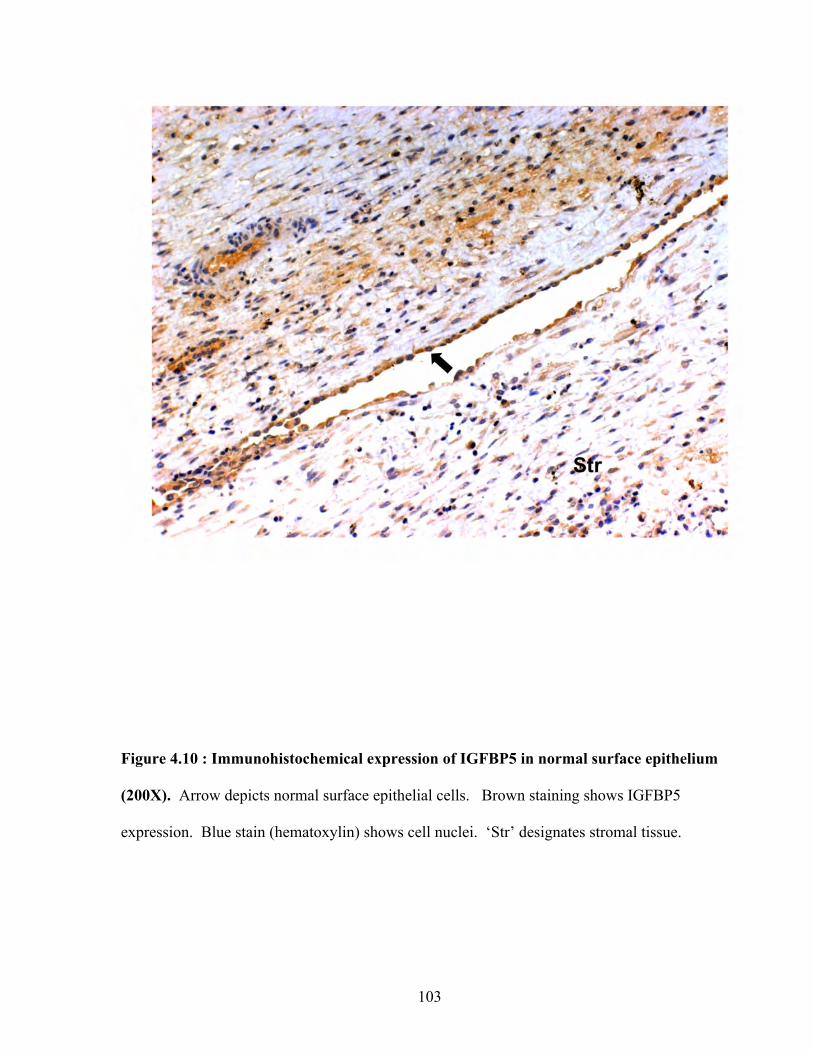
103
Figure 4.10 : Immunohistochemical expression of IGFBP5 in normal surface epithelium
(200X). Arrow depicts normal surface epithelial cells. Brown staining shows IGFBP5
expression. Blue stain (hematoxylin) shows cell nuclei. ‘Str’ designates stromal tissue.
104
The strength of the staining did not correlate with tumor grade, but the only grade III clear cell
tumor in the set showed high expression. All five endometrioid tumor sections were positive
for IGFBP7, with one grade II tumor and one grade III tumor showing high expression.
Sections representative of IGFBP7 staining in the four EOC subtypes are illustrated in Figure
4.11. Healthy ovarian surface epithelium showed negative to mild expression of IGFBP7 and
therefore was qualitatively less than cancer sections (Figure 4.12). IGFBP7 expression showed
a cytoplasmic and membranous distribution. Other ovarian tissues that tested positive for
IGFBP7 were endothelial and stromal tissue. We used endothelial tissue as a positive control
for staining.
4.3.7 Integrin β4 Expression
Integrin β4 protein was detected in 5/6 serous carcinomas (Table 4.8) with one showing
high expression. We did not obtain reliable data in mucinous carcinomas for integrin β4 protein
though one section was positive for high expression. Two of the clear cell carcinoma specimens
stained positive for integrin β4 with both showing low expression. Four endometrioid cancer
specimens stained positive for integrin β4 with one showing high expression. Normal surface
epithelium showed variable expression. Representative samples from each EOC subtype and
normal surface epithelium showing integrin B4 expression is illustrated in Figures 4.13 and
4.14. A squamous cell carcinoma was used as a positive control (data not shown). Expression
followed a cytoplasmic and membranous distribution pattern. A correlation between tumor
stage and expression levels was not established, as sample size was low. Healthy ovarian
stromal tissue was also positive for integrin B4 expression (data not shown).
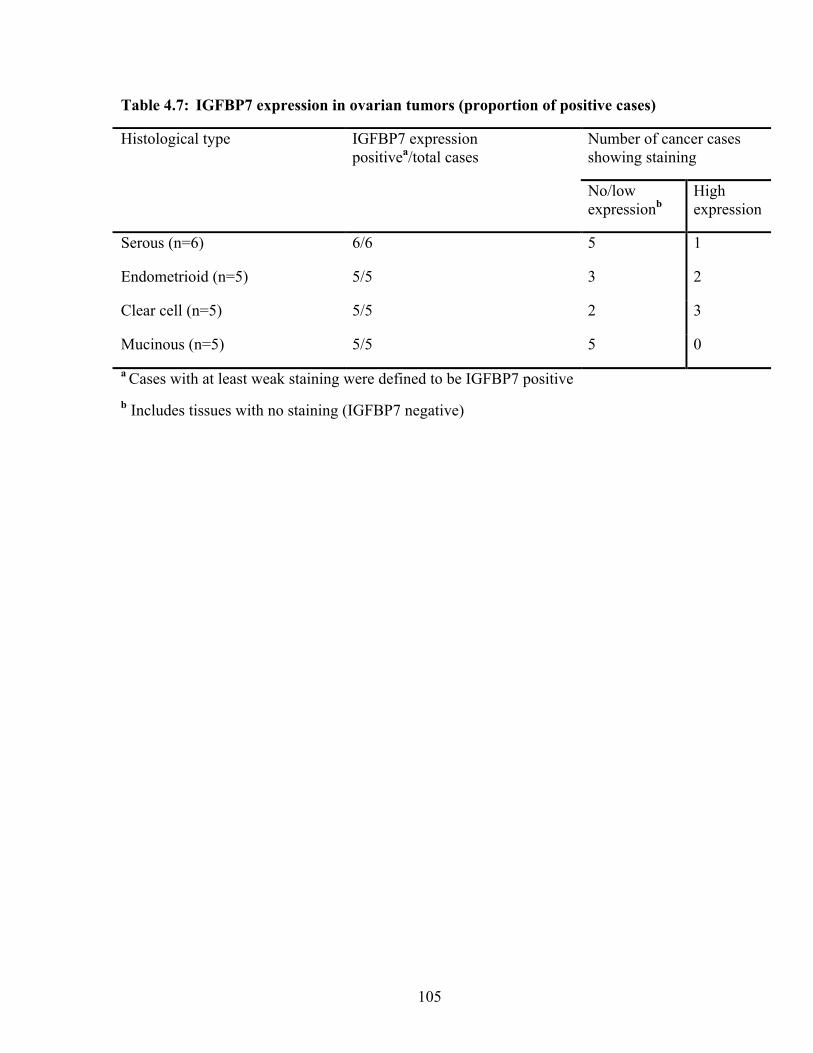
105
Table 4.7: IGFBP7 expression in ovarian tumors (proportion of positive cases)
Histological type IGFBP7 expression positivea/total cases
Number of cancer cases showing staining
No/low expressionb
High expression
Serous (n=6) 6/6 5 1
Endometrioid (n=5) 5/5 3 2
Clear cell (n=5) 5/5 2 3
Mucinous (n=5) 5/5 5 0
a Cases with at least weak staining were defined to be IGFBP7 positive b Includes tissues with no staining (IGFBP7 negative)
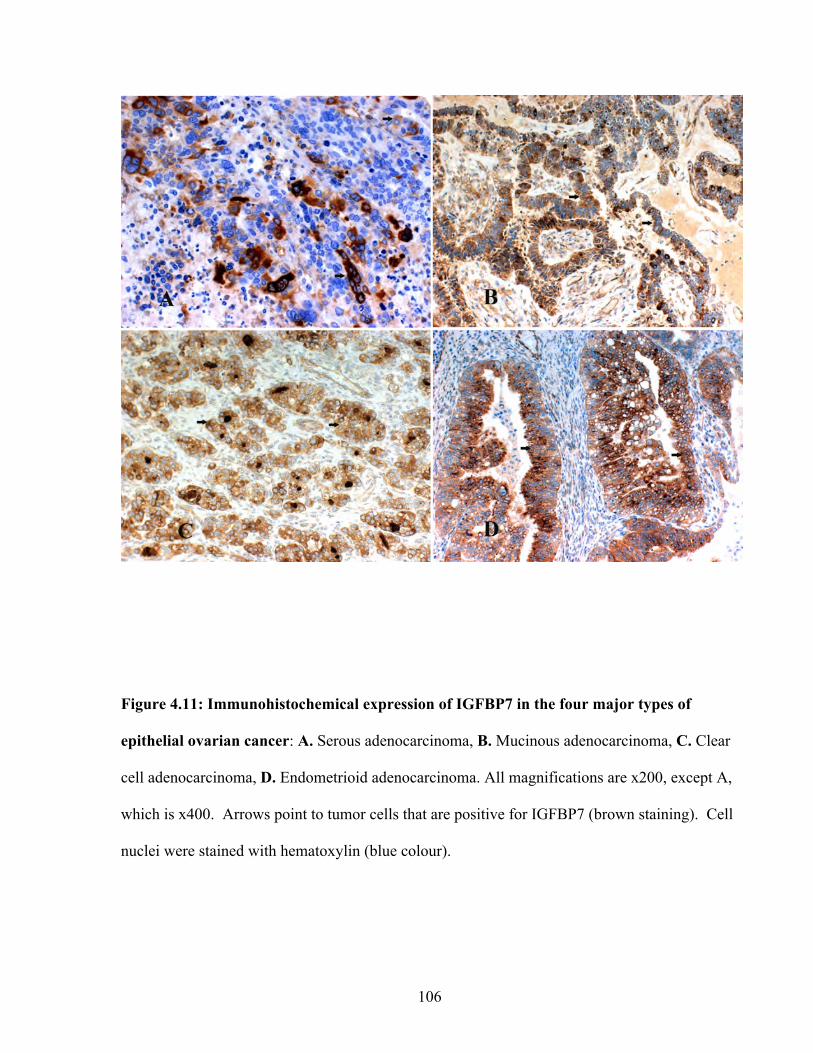
106
Figure 4.11: Immunohistochemical expression of IGFBP7 in the four major types of
epithelial ovarian cancer: A. Serous adenocarcinoma, B. Mucinous adenocarcinoma, C. Clear
cell adenocarcinoma, D. Endometrioid adenocarcinoma. All magnifications are x200, except A,
which is x400. Arrows point to tumor cells that are positive for IGFBP7 (brown staining). Cell
nuclei were stained with hematoxylin (blue colour).
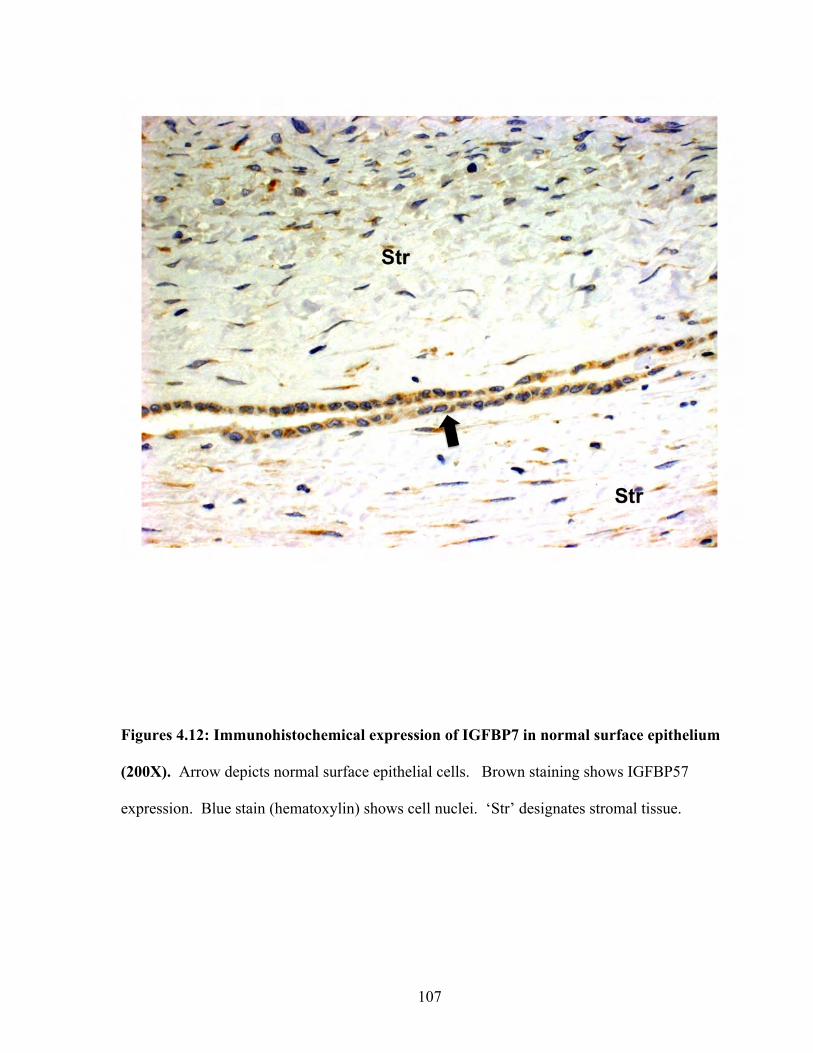
107
Figures 4.12: Immunohistochemical expression of IGFBP7 in normal surface epithelium
(200X). Arrow depicts normal surface epithelial cells. Brown staining shows IGFBP57
expression. Blue stain (hematoxylin) shows cell nuclei. ‘Str’ designates stromal tissue.
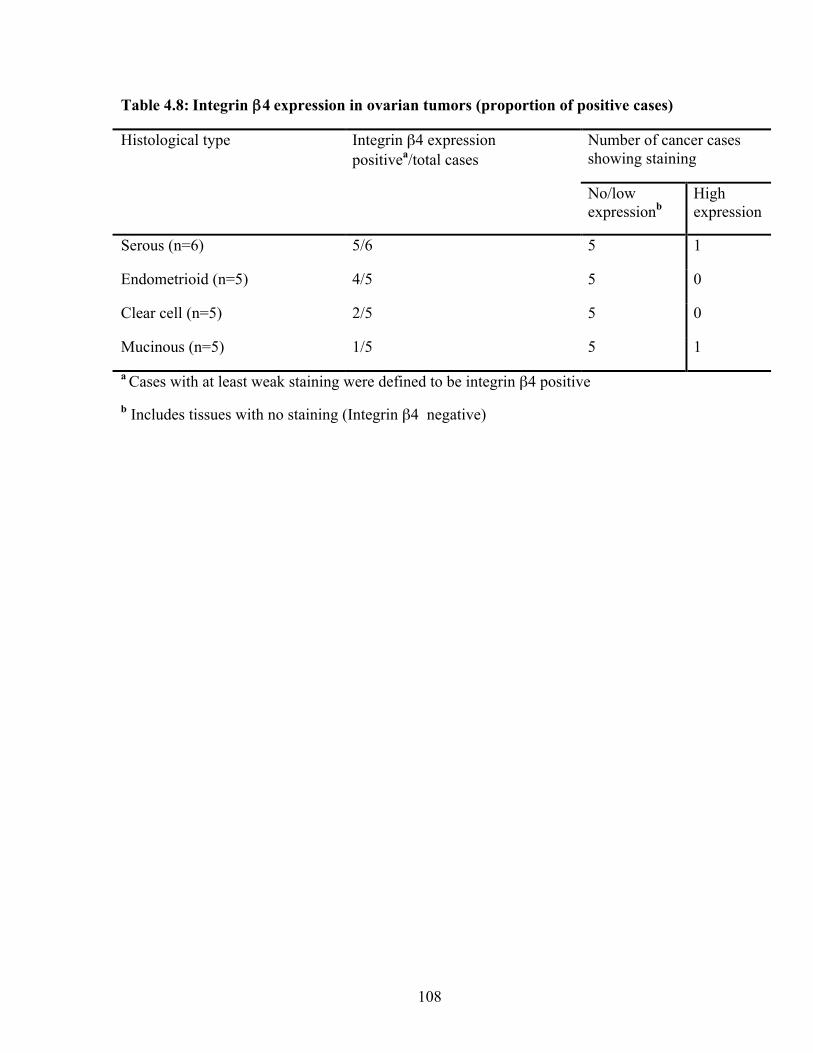
108
Table 4.8: Integrin β4 expression in ovarian tumors (proportion of positive cases)
Histological type Integrin β4 expression positivea/total cases
Number of cancer cases showing staining
No/low expressionb
High expression
Serous (n=6) 5/6 5 1
Endometrioid (n=5) 4/5 5 0
Clear cell (n=5) 2/5 5 0
Mucinous (n=5) 1/5 5 1
a Cases with at least weak staining were defined to be integrin β4 positive b Includes tissues with no staining (Integrin β4 negative)
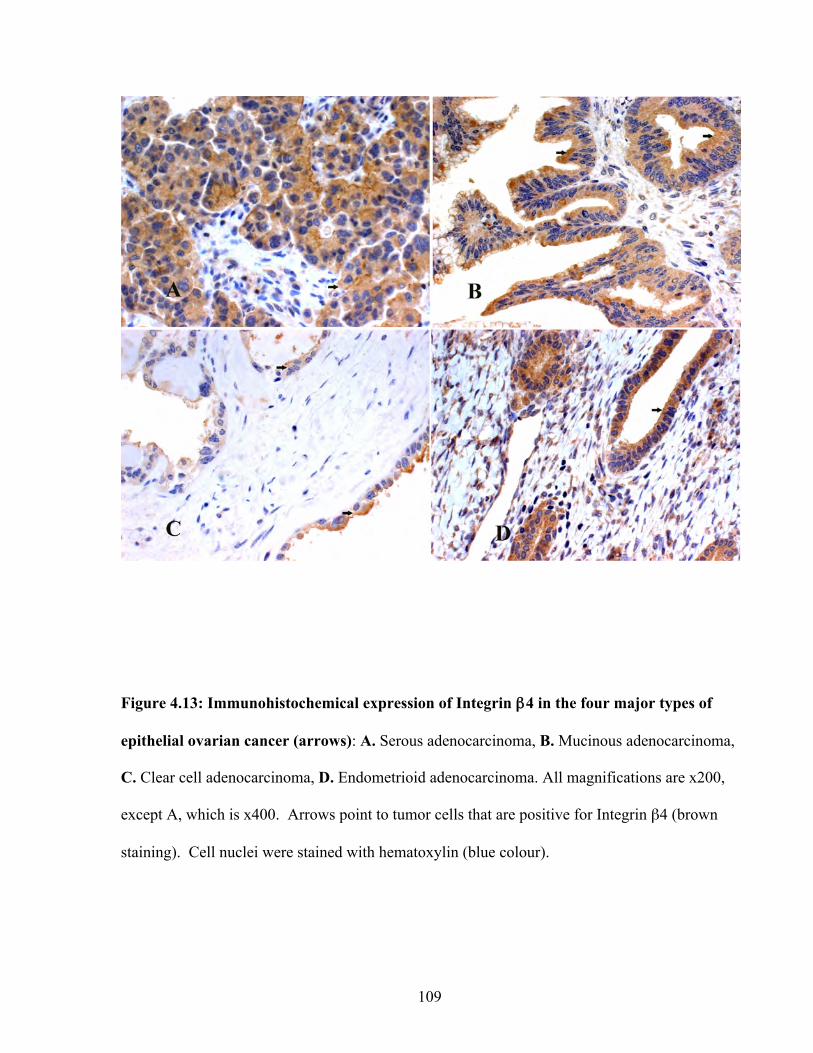
109
Figure 4.13: Immunohistochemical expression of Integrin β4 in the four major types of
epithelial ovarian cancer (arrows): A. Serous adenocarcinoma, B. Mucinous adenocarcinoma,
C. Clear cell adenocarcinoma, D. Endometrioid adenocarcinoma. All magnifications are x200,
except A, which is x400. Arrows point to tumor cells that are positive for Integrin β4 (brown
staining). Cell nuclei were stained with hematoxylin (blue colour).
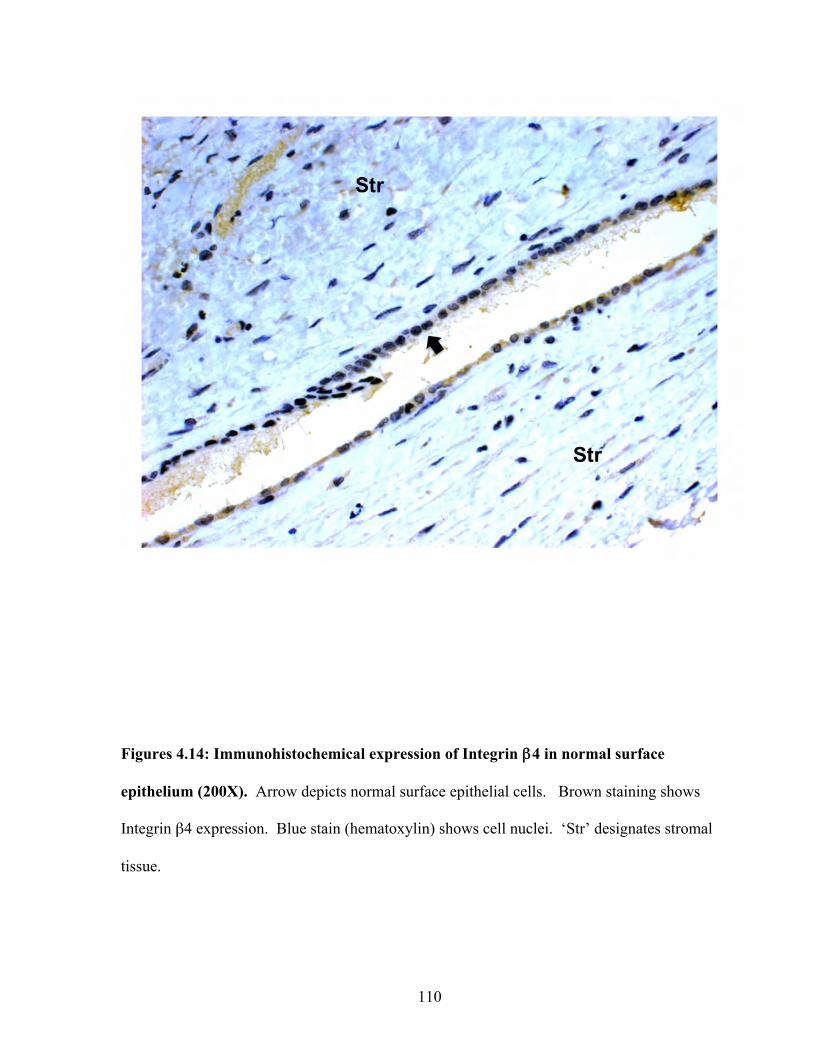
110
Figures 4.14: Immunohistochemical expression of Integrin β4 in normal surface
epithelium (200X). Arrow depicts normal surface epithelial cells. Brown staining shows
Integrin β4 expression. Blue stain (hematoxylin) shows cell nuclei. ‘Str’ designates stromal
tissue.
111
4.4 Discussion
Among gynaecological malignancies, EOC is the most lethal due to the advanced stage
at which the cancer is identified. The typical treatment option is bilateral salpingo-
oopherectomy and hysterectomy followed by taxane-based and platinum-based chemotherapy.
However, chemotherapy is confounded by the highly toxic side effects and some cases do not
respond to current chemotherapeutic strategies. Thus, identifying EOC specific proteins or
proteins that are overexpressed in EOC can lead to novel therapeutic strategies that are less toxic
and improve patient prognosis.
We studied seven potential EOC biomarkers, of which four (Clusterin, IGFBP5,
IGFBP6, and EPCR) were selected based on the criteria shown in the preceding chapter. That
is, these proteins were common to both the cell culture supernatants and ascites fluid from EOC
cases (93). The other three (ADAM15, Integrin β4, and ICAM5) were selected from the list of
extracellular and membrane proteins extracted from the discovery data set (see chapter 2).
These proteins were not found in the ascites study (93), presumably because the ascites study
focused on the sub-30 kDa proteome. ADAM15 is over 100 kDa (106), Integrin β4 is 150-250
kDa (87), and ICAM5 is over 100 kDa (163).
ADAM15 is a member of a disintegrin and metalloproteinase family (115). There are
two clearly defined biological roles for ADAM5, proteolysis and cell adhesion. As a protease,
one of the major proteins cleaved by ADAM15 is E-cadherin (118). Using breast cancer cell
lines, Najy et al. showed that the cleaved form of E-cadherin transactivated HER2/HER3, thus
resulting in increased migration and proliferation. The importance of E-cadherin in ovarian
tumors has been discussed by several investigators(103, 158). It remains to be seen if E-
112
cadherin is a substrate for ADAM15 in ovarian tumors. ADAM15 and its role in metastasis has
been documented before in prostate cancer. The loss of ADAM15 decreased metastasis to the
bone (117).
In the present study, we did not see a difference in ADAM15 expression between
healthy ovarian surface epithelial tissue and cancer tissue. However, an important point to note
is that the sample size (n=21 cancer tissues) was small in this study. Therefore whether or not
there was a statistically significant difference between healthy and cancerous tissue could not be
determined. Nevertheless, some of the cancerous tissue showed high expression of ADAM15,
especially in clear-cell tumors. Clear-cell tumors of the ovary are notoriously chemoresistant.
It remains to be seen whether or not ADAM15 is a suitable therapeutic target in ovarian cancer.
Another question that needs to be addressed is whether or not ADAM15 is more active in
ovarian cancer tissue compared to healthy tissue.
EPCR is a member of the protein C anticoagulant pathway (47). EPCR and its ligand,
activated protein C (aPC), have been implicated in tumor metastasis. However, these reports
have been contradictory. Bezuhly et al. demonstrated in murine melanoma metastasis models
that EPCR overexpressing mice were more resistant to metastatic disease compared to wild-type
mice(20). In addition, treatment of wild-type mice with recombinant aPC showed a 44%
reduction in lung metastases. In contrast, Beaulieu et al. showed that chemotaxis and invasion
increased with breast cancer cell lines as concentrations of aPC were increased (14). In
addition, blocking antibodies to EPCR, attenuated chemotaxis. It is unclear whether or not
EPCR plays a role in ovarian cancer metastasis. In the present study, EPCR was expressed in
both cancerous and normal tissue. However, we did not check for aPC status in cancer and
healthy ovarian tissue. It is possible that EPCR status remains the same in cancer and healthy
113
tissue, but the amount of aPC may be different. This needs to be addressed. To our knowledge,
this is the first report of EPCR expression in ovarian cancer tissue.
Clusterin’s role in ovarian cancer biology is unclear and it is only recently that its role
has been discussed in the literature. We found high clusterin expression in a majority of the
ovarian cancer cases, but expression did not correlate with tumor grade. Normal healthy tissue
expressed variable amounts of clusterin, and this is not a surprise as clusterin is a highly
abundant protein (71). The soluble (secreted) form of clusterin has been implicated in
chemoresistance and is prosurvival, whereas the nuclear form of this molecule is pro-apoptotic
(149). In our study, clusterin expression in ovarian cancer took a granular cytoplasmic
distribution. We hypothesize that some of this may be soluble clusterin contained in secretory
vesicles. Clusterin was also distributed around the plasma membrane. Again, this may be the
soluble form of clusterin.
The association between metastasis and integrin β4 has been revealed mostly by studies
in breast cancer models. Integrin β4 is associated with breast tumors originating from basal
cells, which demonstrate a more aggressive phenotype (132). Individuals that express both
integrin β4 and laminin-5 in their primary tumors have the poorest prognosis among breast
cancer patients (160). Tumors residing in lymph nodes that originated from integrin
β4−negative primary breast cancers are positive for integrin β4 (120). The connection between
integrin β4 and cancer metastasis is not limited to breast cancers. Integrin β4 expression is
found at the invasive front of gastric cancers (161) and is associated with lymph node metastasis
in papillary thyroid cancers (89). However, very little data has been shown for ovarian cancer.
One study showed that transformed epithelial cells isolated from ascites fluid from patients with
serous ovarian carcinoma had low expression of integrin β4 (151). The authors hypothesized
114
that this low expression may be a mechanism for tumor cell release. In this study, integrin β4
was found in all cancer subtypes, but with low expression. Normal tissue showed variable
expression. Since the sample sizes were small, a conclusion with supporting statistical analysis
could not be made regarding differences between cancerous and healthy tissue. To our
knowledge, this is the first report of integrin β4 reported in the other subtypes of ovarian cancer.
Given that integrin β4 is expressed and that it is an adhesion molecule that seems important to
cancer metastasis (as seen in other cancers), its role in the metastatic process of EOC needs to be
explored further.
The role of IGFBP5 in ovarian cancer is a relatively unexplored area. IGFBPs either
inhibit or enhance the actions of IGFs. Depending on the physiological/pathological status,
IGFBPs either stimulate or suppress cell proliferation. In the case of ovarian cancer, Wang et
al. showed that IGFBP5 expression was higher in high-grade serous carcinomas relative to low-
grade serous carcinomas, serous borderline tumors, benign cysts, and normal surface epithelium
(170). Similarly in our study, from a qualitative perspective, IGFBP5 expression was higher in
the cancer tissue compared to normal surface epithelium. Although we did not have a
sufficiently large sample size to obtain statistical power, in contrast to Wang et al., our study
showed that mucinous and clear-cell carcinomas showed high expression of IGFBP5. This may
be due to a difference in tumor grade between Wang’s mucinous and clear-cell carcinoma sets
and ours. In this study, grade I and grade II mucinous and clear-cell carcinoma samples were
used. It was unclear as to the grade/stage of the mucinous and clear-cell samples used by Wang
et al.
115
The role of IGFPB7 in ovarian cancer is also unclear. However, several studies have
hinted at a role for IGFBP7 in cancer. IGFBP7 binds preferentially to type IV collagen and
appears to be co-expressed in tumor-associated endothelium in colorectal carcinoma (155).
Some have hypothesized that IGFBP7 is a tumor suppressor (84, 92). In breast cancer cell lines,
Burger et al. reported the allelic loss of heterozygosity on chromosome 4q which is the location
of IGFBP7 (24). In the same study, invasive breast tumors were negative for IGFBP7 whereas
normal and benign samples showed strong IGFBP-7 expression using immunohistochemistry.
In contrast, in our study, normal surface epithelium showed no staining or very mild staining at
best, whereas all tumor samples (especially clear cell and endometrioid) showed higher
expression than the healthy tissue. It is possible that the biological function of IGFBP7 is
different in ovarian cancer compared to breast cancer.
ICAM5 in ovarian tumors was variable in that some tissues showed low expression and
others showed high expression. Overall, the cancer tissues expressed ICAM5 at higher levels
than healthy normal surface epithelium. A literature review combining ICAM5 and cancer as
the search terms showed only one study that indicated a role for ICAM5 in neoplasia (109). In
that study, ICAM-5 transcripts were detected in cell lines established from primary head and
neck, colon, thyroid, cervical, pancreatic, skin, and adenoid cystic carcinomas. Downregulation
of ICAM-5 using siRNA inhibited cell proliferation. In addition, primary squamous carcinomas
of oral mucosa showed higher expression of ICAM-5 relative to the matched normal healthy
tissue. Carcinomas with high ICAM-5 expression had higher incidences of perineural invasion.
Given that ICAM-5 may play a role in invasion and that it is indeed an adhesion molecule, it is
possible that ICAM-5 may contribute to the metastatic potential of ovarian carcinomas. This is

116
speculative and more experiments need to be conducted to explore a relationship between
ICAM5 and variables including tumor grade, invasiveness, and tumor subtype.
In summary, normal healthy surface epithelium showed low expression relative to the
cancer samples for all proteins except ADAM15 and EPCR. Although normal tissue showed
equivalent expression of ADAM15 and EPCR, we cannot rule out roles for these two proteins in
ovarian cancer. Given that ADAM15 is a part of a large superfamily of proteins that have been
implicated in other cancers, one needs to also explore the other ADAMs , such as ADAM17 and
ADAM 10, in the context of ovarian cancer. To our knowledge, this study is the first one
showing ADAM15, EPCR, IGFBP7, and ICAM5 protein expression in ovarian cancer.
Furthermore we also showed integrin β4 protein expression in clear-cell, mucinous, and
endometrioid carcinomas, which have not been documented in the literature. Given that these
proteins are indeed expressed in ovarian cancer and that the expression is qualitatively higher in
cancer compared to normal, correlative studies looking at protein expression, tumor grade, and
tumor subtype using a sufficiently large sample set to achieve statistical power are warranted.

117
Chapeter 5: Antibody Production and Immunoassay Development
for NPC2
118
5.1 Introduction
NPC2 (Niemann-Pick disease type C2 protein), also known as HE1 (epididymal
secretory protein E1), is a small soluble 151 amino-acid glycoprotein. It contains a 19 amino
acid signal peptide and was first characterized as a major secretory protein in the human
epididymis (88). The NPC2 gene has been mapped to chromosome 14q24.3 and is 13.5kb long.
The gene itself contains five exons that range from 78 to 342 bp in size (121).
The protein has been identified in secretory fluids such as milk, bile, and epididymal
fluid (88, 91, 121). NPC2 is more known for its role in Niemann-Pick Type C disease where a
mutation in the gene leads to an autosomal-recessive lipid storage disease (121). This storage
disease appears to be related to intracellular cholesterol homeostasis. Along with NPC1
(Niemann-Pick disease type C1 protein), NPC2 works to maintain cholesterol homeostasis (29,
110, 167, 179). NPC2 has an affinity for cholesterol in the micromolar range and binds with a
1:1 stoichiometry (176). The majority of cases of Niemman-Pick involve the mutation of the
NPC1 gene whereas 5% of the cases involve NPC2. In Niemann-Pick disease, an abnormal
accumulation of cholesterol is seen in cells, presumably due to problems with cholesterol
trafficking.
The primary structure of NPC2 contains three potential glycosylation sites at Asn-19,
Asn-39, and Asn-116. Asn-19 appears to remain unglycosylated whereas Asn-39 is linked to an
endo H-sensitive oligosaccharide, and Asn-116 may remain unglycosylated, but if glycosylated
then its either an endo-H resistant or sensitive oligosaccharide (101). The glycosylation pattern
is heterogeneous and appears tissue specific (152).

119
In using our integrated approach to biomarker discovery (see Chapter 3), NPC2 was one
of our final 51 candidates. It was expressed by the four cell lines studied and was also found in
ascites fluid (63). Therefore, we hypothesized that NPC2 may be candidate biomarker for
ovarian cancer. The aim of this study was to see if NPC2 is indeed a suitable biomarker.
120
5.2 Materials and Methods
5.2.1 Biological specimens
Semen was obtained from patients of the fertility clinic. The collection was performed with
informed consent and approval by the Institutional Review Boards of Mount Sinai Hospital and
the University Health Network. Samples were stored at -80oC until use.
5.2.2 NPC2 purification from seminal plasma
Approximately 100 ml of seminal plasma was centrifuged at 10,000 xg for 20 minutes.
The supernatant was collected and dialyzed against HEPES buffer (20 mM HEPES, 100 mM
NaCl, pH 7.0) overnight. The sample was dialyzed twice against HEPES buffer to ensure that
the sample is at a pH was 7.
Two Tricorn 10/100 columns (GE Healthcare, Baie d’Urfe, PQ, Canada) were packed
with either SP sepharose™ fast flow (GE Healthcare) or Q sepharose™ fast flow (GE
Healthcare). Column packing was performed according to the manufacturer’s instructions. The
two columns were arranged in tandem, with the Q sepharose™ column leading into the SP
sepharose™ column. The tandem column was then installed on an ÄKTA™ FPLC System (GE
Healthcare).
The tandem column was first washed with 5 column volumes of 20 mM HEPES buffer
(pH 7.0) containing 100 mM NaCl followed by 5 column volumes of 20 mM HEPES buffer (pH
7.0) containing 1M NaCl. The column was then re-equilibrated with 20 mM HEPES buffer (pH
7.0) containing 100 mM NaCl. The aforementioned procedure was conducted to “activate” the
column. The dialyzed seminal plasma sample was injected into the tandem column at flow rate
121
of 1.0 ml/min and the flow-through was collected. The column was washed with an additional 2
column volumes of 20 mM HEPES containing 100 mM NaCl. The wash was combined with
the flow-through. Bound proteins were eluted using 20 mM HEPES buffer (pH 7.0) containing
1M NaCl and kept for later analysis.
The flow-through was then dialyzed against 12.5 mM ammonium acetate (pH 4.7)
overnight with two buffer exchanges to ensure that the sample was equilibrated well. A
prepacked SP sepharose™ fast flow column with a volume of 5 ml (GE Healthcare) was first
washed with 5 column volumes of 12.5 mM ammonium acetate (pH 4.7), then washed with 5
column volumes of 1M ammonium acetate (pH 4.7), and finally equilibrated with 10 column
volumes of 12.5 mM ammonium acetate (pH 4.7). The dialyzed sample was injected into the
column at a flow rate of 1.0 ml/minute. The column was washed with 2 column volumes of
12.5 mM ammonium acetate (pH 4.7). Column washes were kept for later analysis.
Sample elution was performed on the benchtop, using step gradients of 50 mM, 100 mM
150 mM, 200 mM, 250 mM, 300 mM, 350 mM, 400 mM, and 1M ammonium acetate. Three to
five fractions of each gradient were collected (one column volume per fraction). Each fraction
was separated by SDS-PAGE to see the purity. The gel-region between 20-27 kDa was excised
and processed for mass spectrometric analysis to determine which fractions contained NPC2.
5.2.3 In-Gel Digestion
Each excised gel band was first cut into small cubes (1 mm3) and placed in 1.5 ml
microcentrifuge tubes containing 100 µl of 50 mM ammonium bicarbonate. The ammonium
bicarbonate was aspirated and 100 µl of neat acetonitrile was added and incubated for 10
minutes at room temperature. The gel pieces were then centrifuged using a benchtop
122
microcentrifuge and the liquid was aspirated. Approximately 50 µl of 10 mM DTT (in 50 mM
ammonium bicarbonate) was then added and incubated in a water bath for 30 minutes at 56 0C.
Gel-pieces were then centrifuged and the DTT solution was aspirated. The microcentrifuge
tubes were then chilled to room temperature and 100 µl of neat acetonitrile was added and
incubated for 10 minutes. The gel-pieces were then centrifuged and the acetonitrile was
aspirated. Approximately 50 µl of 50 mM iodoacetamide (in 100 mM ammonium bicarbonate)
was added to the gel pieces and incubated for 20 minutes at room temperature in the dark.
Iodoacetamide was removed and 100 µl of neat acetonitrile was added to shrink the gel pieces.
Once the gel pieces were shrunk, approximately 75 µl of trypsin solution (20 µg trypsin
dissolved in 1 ml of 50 mM ammonium bicarbonate) was added and incubated overnight at
370C.
5.2.4 Mass spectrometric analysis
Supernatants from digested gel pieces were loaded onto a ZipTip C18 pipette tip
(Millipore; catalogue number ZTC18S096) and eluted in 4µl of Buffer B (90% acetonitrile
(ACN), 0.1% formic acid, 10% water, 0.02% Trifluoroacetic acid (TFA)). The eluate was
mixed with 80 µl of Buffer A, and 40 µl were injected via an autosampler into an Agilent 1100
series HPLC. The peptides were first injected onto a 2-cm C18 trap column (inner diameter,
200 µm), and then eluted from the trap column into a resolving 5-cm analytical C18 column
(inner diameter, 75 µm) with an 8 µm tip (New Objective). The LC setup was coupled online to
a 2-D linear ion trap (LTQ, Thermo Inc.) mass spectrometer using a nano-ESI source in data-
dependent mode. Each fraction was run on a 35-minute gradient. The eluted peptides were
subjected to MS/MS. DTAs were created using the Mascot Daemon (version 2.22) and
extract_msn. We used the following parameters for DTA creation: minimum mass, 300 Da;
123
maximum mass, 4000 Da; automatic precursor charge selection; minimum peaks, 10 per
MS/MS scan for acquisition; and minimum scans per group, 1.
For the product ion monitoring (PIM) assay, tryptic peptides were separated on a 2 cm
C18 trap column (inner diameter 200 µm). The peptides were eluted from the trap column onto
a resolving 5 cm analytical C18 column (inner diameter 75 µm) with a 15 µm tip (New
Objective). The LC setup was coupled online to a 2-D linear ion trap (LTQ, Thermo Inc.) mass
spectrometer using a nanoelectrospray ionization source (nano-ESI). Buffer A contained 0.1%
formic acid, 5% ACN, and 0.02% TFA in an aqueous water solution, and buffer B contained
90% ACN, 0.1% formic acid, and 0.02% TFA in water. The eluted peptides were analyzed by
tandem mass spectrometry (MS/MS) for identification purposes and by PIM to identify NPC2
specifically in positive-ion mode. A linear gradient was used with an injection volume of 40 µL,
which was loaded onto the column via an Agilent 1100 Cap-LC series autosampler. A 25 min
method was developed with a 5 min gradient and used for all experiments.
5.2.5 PIM assay design
LC-MS/MS analysis of semi-purified NPC2 was performed and the major ions observed
were further analyzed by MS/MS using the LTQ. The peptides showing the greatest signal
intensity were noted. To assist in the determination of single reaction monitoring (SRM)
transitions, the Global Proteome Machine database (33) was used to select the peptides of NPC2
that are frequently identified. Furthermore, an extensive search of the literature for mass
spectrometric data on NPC2 was performed to further assist in identifying the proteotypic
peptides of NPC2. Using single reaction monitoring (SRM) transitions that were available from
LC-MS/MS proteomic survey data and extensive testing of all parent peptides of NPC2, PIM
assays were developed for the precursor-fragment ion transition of the:
124
1. Doubly charged intact proteotypic peptide with m/z 922 (EVNVSPCPTQPCQLSK) to m/z
732 (PCQLSK), m/z 1315 (PCPTQPCQLSK), and m/z 1402 (SPCPTQPCQLSK).
2. Triply charged intact proteotypic peptide wit m/z 811
(AVVHGILMGVPVPFPIPEPDGCK) to the doubly charged m/z 628 (PFPIPEPDGCK),
doubly charged m/z 726 (PVPFPIPEPDGCK), and m/z (AVVHGILMGVPV)
A scan range of 250-2000 was used with a full scan type. A collision energy of 21% was used
for MS/MS. The results were searched with Mascot (Matrix Science) to confirm the identity of
the moiety.
5.2.6 Rabbit immunization
One female rabbit was immunized with 500 µg of NPC2 purified from seminal plasma.
Prior to immunization, a sample of pre-immune blood was taken for controls. A boost was
given 4 weeks after initial inoculation. The second boost was given 4 weeks after that and the
first titre check was performed within one week. Rabbit serum was confirmed for anti-NPC2
antibodies by direct ELISA and then was exsanguinated .
5.2.7 Antibody purification
Antibodies were purified from rabbit sera by protein A affinity purification. Protein A
purification was performed using the kit system, MAPS (Bio-Rad Laboratories, Hercules, CA,
USA), according to the manufacturer’s instructions. Antibody concentration was determined to
be 0.6 mg/ml by absorbance at 280 nm.
125
5.2.8 Western Blotting
Western blots for NPC2 were performed using our in-house purified rabbit polyclonal
antibody (Gunawardana Ab). A second rabbit anti-NPC2 polyclonal antibody (Lobel Ab) was
also used in western blots (a gift from Dr. Peter Lobel). Membranes were blocked for 1 hr at
room temperature using 5% BSA in PBS-tween (0.1% v/v). Antibodies were diluted 1:1000 in
PBS containing 0.1% Tween and the membranes were incubated overnight at 4oC. Membranes
were washed using PBS-Tween (0.1% v/v). Goat anti-rabbit antibodies coupled to alkaline
phosphatase (1:10000 dilution in PBS containing 0.1% Tween and 5% BSA) was used as the
secondary antibody. Signals were developed and captured on X-ray film (GE Healthcare Life
Sciences) by using a chemiluminescent substrate (Diagnostics Product Corporation, Los
Angeles, CA, USA).
5.2.9 Biotinylation of detection antibody
Approximately 50 ng of polyclonal anti-NPC2 antibody was incubated with 50 ng of biotin in
0.5 M NaHC03 for 1 h. This was used as the detection antibody for the NPC2 assay.
5.2.10 Immunoassays
Sandwich-type ELISAs were constructed in-house using the polyclonal antibody for
antigen capture and a biotinylated polyclonal antibody for detection. White polystyrene
microtitre plates were coated with either 500ng/100µl polyclonal antibody in coating buffer
(50mM Tris buffer, 0.05% sodium azide, pH 7.8) and stored at room temperature overnight.
Fifty microlitres of protein calibrators or samples, and 50µl of assay buffer [50mM Tris, 6%
BSA, 0.01% goat IgG, 0.1% bovine IgG (Sigma-Aldrich Inc, St. Louis MO), 0.005% mouse
IgG (Fortron Bio Science Inc, Morrisville, NC), 0.05% sodium azide, pH 7.8] with 0.5M KCl
126
were added to wells and incubated for 90 min with shaking at room temperature. The plates
were washed 6 times with washing buffer (5mM Tris, 150mM NaCl, 0.05% Tween-20, pH 7.8).
Approximately 100µl of biotinylated detection antibody (125ng/ml in assay buffer containing
0.5M KCl) were added to each well and incubated for 1 h at room temperature with shaking.
The plates were then washed six times with the washing buffer. Approximately 100µl
(5ng/well) of alkaline phosphatase-conjugated (ALP) streptavidin (Jackson ImmunoResearch) in
sample buffer (6% BSA, 50 mM Tris, 0.06% sodium azide, pH 7.8) was added to each well and
incubated for 15 min with shaking at room temperature. The plates were washed 6 times with
the wash buffer, and then 100 µL of substrate buffer [0.1 mol/L Tris buffer, pH 9.1, containing
0.5 mmol/L diflunisal phosphate (DFP), 0.1 mol/L NaCl, and 1 mmol/L MgCl2] were added to
each well and incubated for 10 min with shaking at room temperature. Approximately 100µl of
developing solution (1 mol/L Tris base, 0.15 mol/L NaOH, 2 mmol/L TbCl3, 3 mmol/L EDTA)
were added to each well and incubated for 1 min with shaking at room temperature. The
fluorescence was measured with an EnVision™ 2103 time- resolved fluorometer (Perkin
Elmer).
5.2.11 Immunohistochemistry
Immunohistochemical staining was performed on 3µm thick paraffin sections of tissues
fixed in buffered formalin. Staining procedures included deparaffinization in warm xylene for 5
min with two changes of xylene at room temperature, followed by rehydration by transfer
through graded alcohols and then rinsing with distilled water. The Trilogy™ antigen retrieval
system (Cell Marque) was used for one hour in order to expose the antigen epitopes. After 20
min in room temperature and rinsing with distilled water, the sections were put in 3% H2O2 for
10 min in darkness. After washing with tap water, the sections were dipped twice for 5 min in

127
Tris-buffered saline (TBS), incubated with the in-house rabbit polyclonal NPC2 (1:500) for 30
min, rinsed with TBS for 10 min and then incubated with the Envision detection system
peroxidase/DAB+, Rabbit/Mouse (DAKO Cytomation, Denmark) for 30 min. Rinsing with TBS
for 10 min, incubation in diaminobenzidine (DAB) solution for 10 min in room temperature and
rinsing with tap water followed. The sections were then counterstained with haematoxylin,
dehydrated, cleared in xylene and mounted. Negative controls were performed for all tissues by
omitting the primary antibody. Please see section 4.2.4 for evaluation protocol.
128
5.3 Results
5.3.1 Analysis of Cell Culture Supernatants
Mass spectrometric analysis of cell culture supernatants showed that NPC2 was
indentified in the supernatants of all four cell lines described in chapter 3. Table 5.1
summarizes these results. At least 3 unique peptides of NPC2 were found in each replicate in
the HTB-75 cell line; two unique peptides in each replicate of TOV-112D, at least one unique
peptide in the replicates of TOV-21G; and at least 2 unique peptides in each replicate of the
RMUG-S cell line.
5.3.2 Analyzing complex fluids for NPC2
Given that ascites fluid bathes ovarian tumors, we hypothesized that NPC2 would be
found in the fluid. NPC2 was indeed identified by Kuk et al. in ascites fluid using multiple
fractionation steps followed by mass spectrometry (93). We obtained the same sample in which
NPC2 was identified by Kuk and separated 100 µg of protein by SDS-PAGE. Gel bands were
sliced and processed for mass spectrometry analysis. Our initial analysis did not detect NPC2
protein. We hypothesized that the complexity of ascites fluid, even with the crude purification
step of SDS-PAGE, was too great and that this complexity prevented the mass spectrometer
from detecting NPC2.
5.3.2 Development of Product Ion Monitoring Assay for NPC2.
Our previous results indicated that neither the LTQ nor the Orbitrap mass spectrometers
were able to detect NPC2 in a complex fluid using the general identification scan mode.

129
Table 5.1: Number of peptides of NPC2 identified in ovarian cancer cell lines.
Cell Line Replicate No. Number of Unique Peptides
1 4
2 5
HTB-75
3 3
1 2
2 2
TOV-112D
3 2
1 2
2 0
TOV-21G
3 4
1 2
2 3
RMUG-S
3 3
130
To increase the sensitivity of detection we then used the PIM assay as described by Kulasingam
et al. (97). However, Kulasingam’s PIM assay used a purified antibody to immunocapture and
enrich for the particular protein of interest prior to detection by the mass spectrometry. In our
case, we did not have a purified antibody for immunocapture. Thus, we conducted the PIM
assay without this antibody enrichment step. The following steps were used to develop the PIM
assay for NPC2:
1. In the PIM assay, an ion-trap mass spectrometer is set up so that a single tryptic
peptide (parent ion) corresponding to the protein of interest is selected and
fragmented. PIM on an ion-trap mass spectrometer is very similar to single reaction
monitoring (SRM) or multiple reaction monitoring (MRM) performed on triple-quad
instruments (3, 90). The resulting product ions are used to identify the protein.
These peptides are selected carefully such that:
i. The peptide (parent ion) is specific to the protein of interest and only
to that protein. Long peptides are preferable as they are more likely to
be specific to a protein of interest.
ii. The peptide is ionisable and can be detected clearly in the initial MS
scan prior to sequencing.
iii. A clear fragmentation spectrum can be obtained by MS/MS
2. NPC2-specific peptides identified in ascites fluid (60, 93), seminal plasma
(unpublished work), and cell culture supernatants were examined (Table 5.2) to
select the peptides that are repeatedly identified (proteotypic peptides (104)).
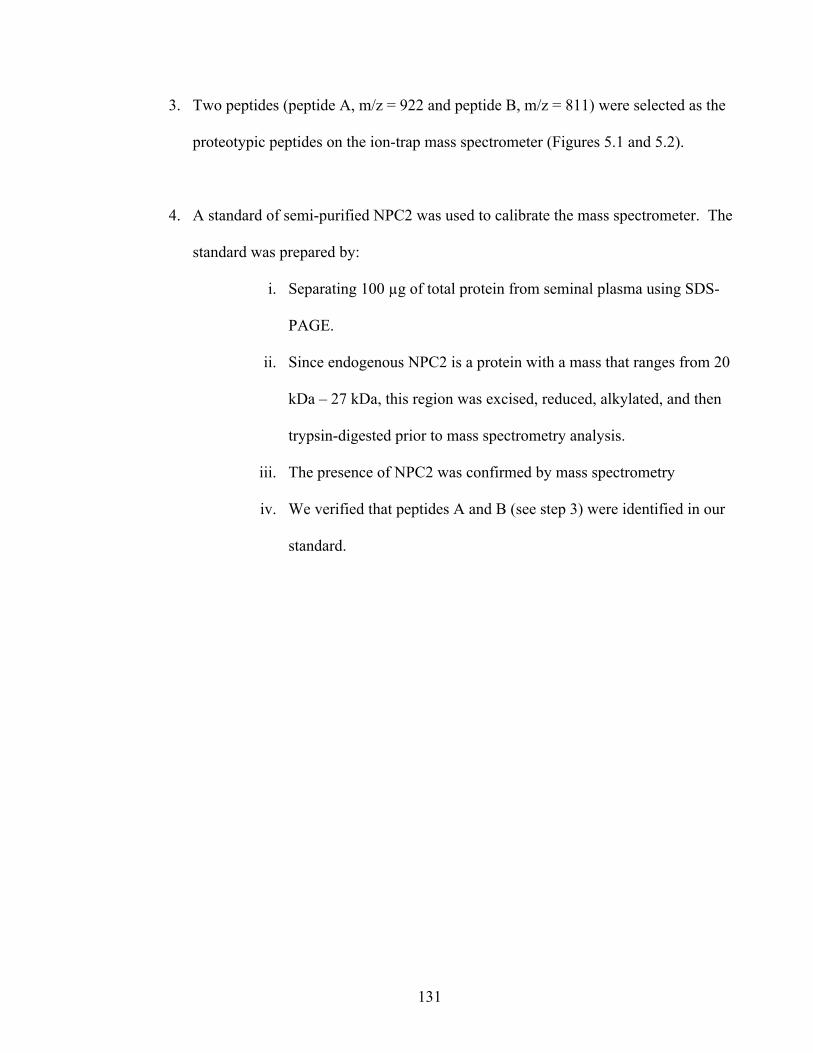
131
3. Two peptides (peptide A, m/z = 922 and peptide B, m/z = 811) were selected as the
proteotypic peptides on the ion-trap mass spectrometer (Figures 5.1 and 5.2).
4. A standard of semi-purified NPC2 was used to calibrate the mass spectrometer. The
standard was prepared by:
i. Separating 100 µg of total protein from seminal plasma using SDS-
PAGE.
ii. Since endogenous NPC2 is a protein with a mass that ranges from 20
kDa – 27 kDa, this region was excised, reduced, alkylated, and then
trypsin-digested prior to mass spectrometry analysis.
iii. The presence of NPC2 was confirmed by mass spectrometry
iv. We verified that peptides A and B (see step 3) were identified in our
standard.
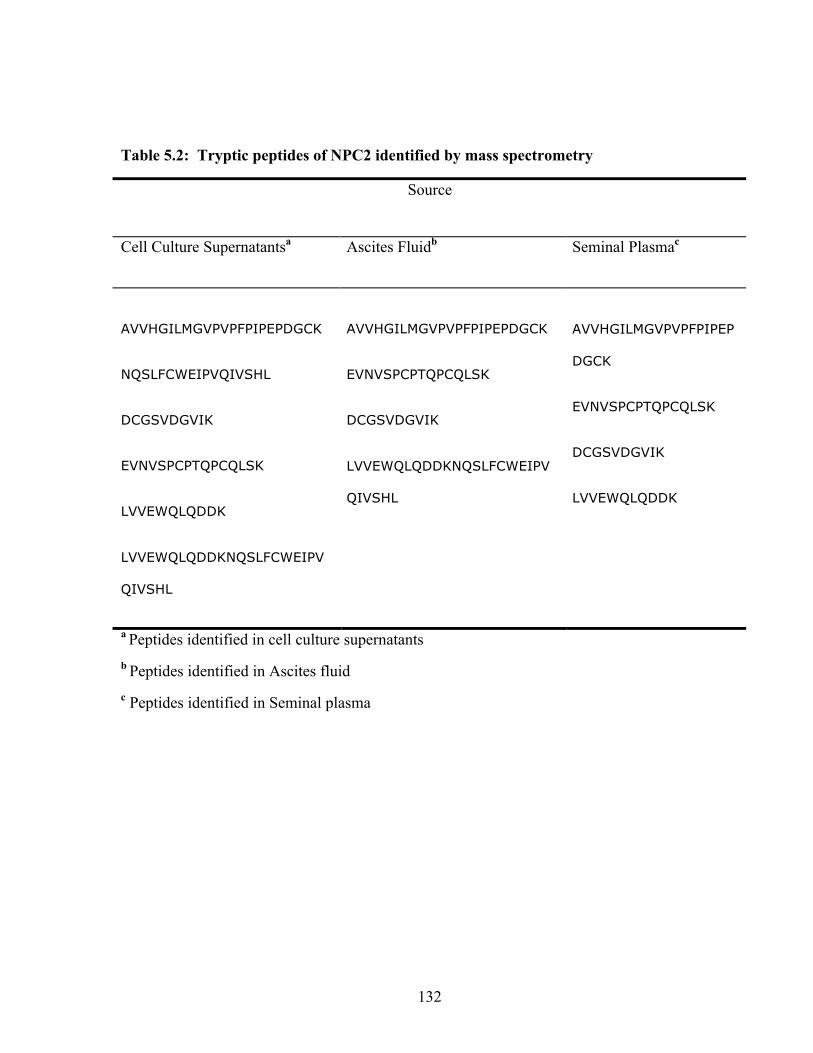
132
Table 5.2: Tryptic peptides of NPC2 identified by mass spectrometry
Source
Cell Culture Supernatantsa
Ascites Fluidb Seminal Plasmac
AVVHGILMGVPVPFPIPEPDGCK
NQSLFCWEIPVQIVSHL
DCGSVDGVIK
EVNVSPCPTQPCQLSK
LVVEWQLQDDK
LVVEWQLQDDKNQSLFCWEIPV
QIVSHL
AVVHGILMGVPVPFPIPEPDGCK
EVNVSPCPTQPCQLSK
DCGSVDGVIK
LVVEWQLQDDKNQSLFCWEIPV
QIVSHL
AVVHGILMGVPVPFPIPEP
DGCK
EVNVSPCPTQPCQLSK
DCGSVDGVIK
LVVEWQLQDDK
a Peptides identified in cell culture supernatants b Peptides identified in Ascites fluid c Peptides identified in Seminal plasma
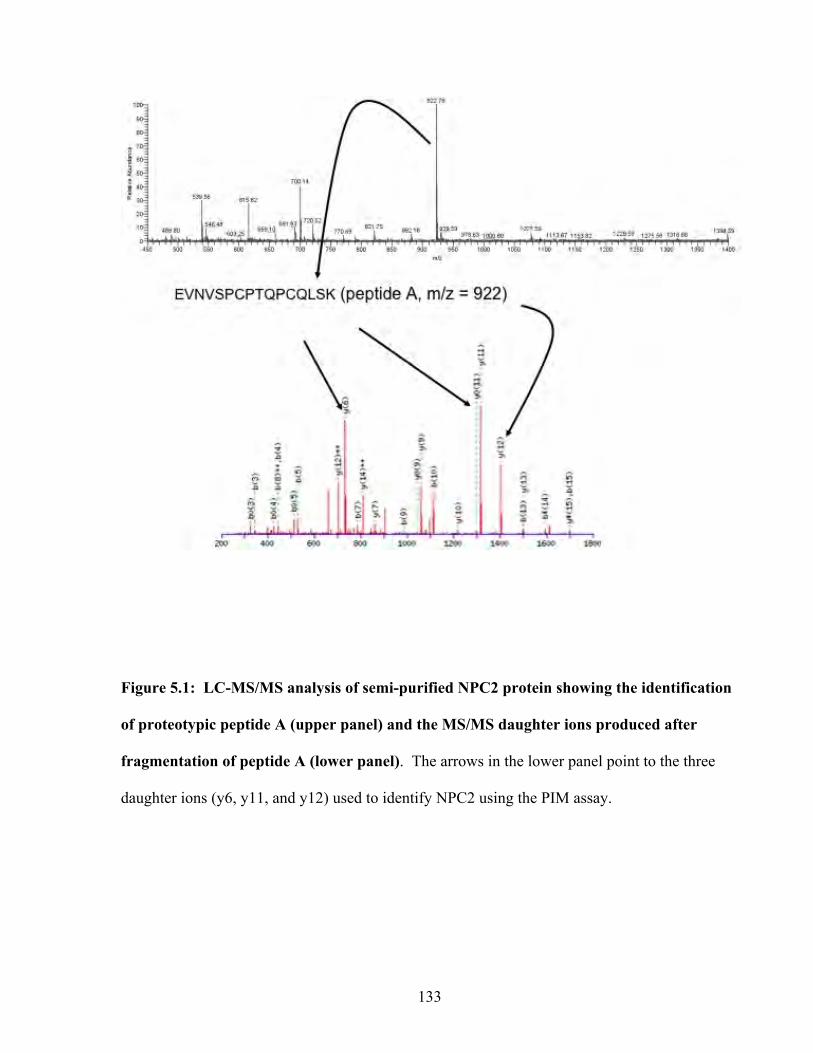
133
Figure 5.1: LC-MS/MS analysis of semi-purified NPC2 protein showing the identification
of proteotypic peptide A (upper panel) and the MS/MS daughter ions produced after
fragmentation of peptide A (lower panel). The arrows in the lower panel point to the three
daughter ions (y6, y11, and y12) used to identify NPC2 using the PIM assay.
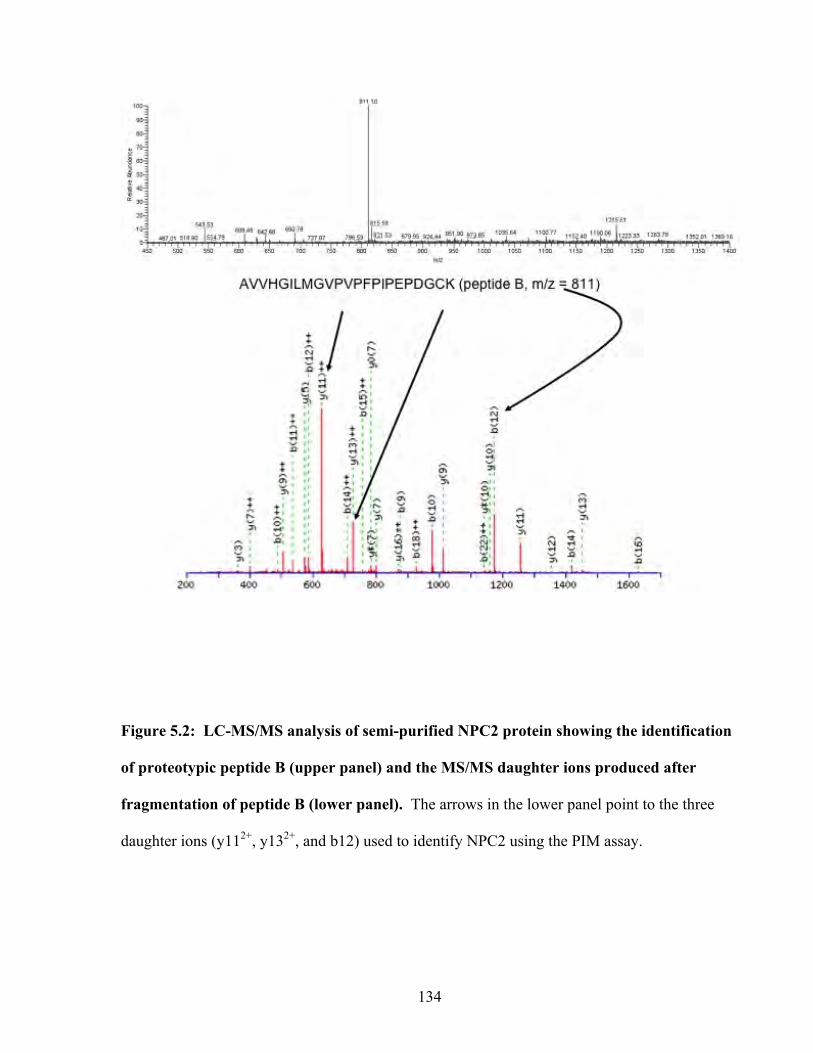
134
Figure 5.2: LC-MS/MS analysis of semi-purified NPC2 protein showing the identification
of proteotypic peptide B (upper panel) and the MS/MS daughter ions produced after
fragmentation of peptide B (lower panel). The arrows in the lower panel point to the three
daughter ions (y112+, y132+, and b12) used to identify NPC2 using the PIM assay.
135
5.3.3 Optimizing the PIM assay for complex biological fluids
Seminal plasma was first fractionated using gel filtration chromatography.
Approximately 500 µl of seminal plasma was separated by gel filtration using a 60-minute
fractionation run. Fractions were collected from the 21-minute mark till the end of the run at.
To detect NPC2 in the fractions, we constructed a direct ELISA by coating each fraction on a
96-well plate. A polyclonal rabbit anti-NPC2 (a gift from Dr. Peter Lobel) was used as the
primary antibody, and a goat anti-rabbit monoclonal conjugated to alkaline phosphatase as the
secondary. Two peaks were observed, suggesting that there are two major species of NPC2 in
seminal plasma (Figure 5.3). The first peak elutes between fractions 32-36 and the second peak
elutes between fractions 39-43. These fractions were pooled, lyophilized, and resuspended in
PBS buffer. An aliquot of the sample was then separated by SDS-PAGE and gel bands were
excised from the 20-27 kDa region and processed for mass spectrometry. NPC2 was detected
by mass spectrometry using a general scan. It was not necessary to apply the PIM assay for this
sample as the levels of NPC2 in seminal plasma are relatively high.
We then separated 500 µl of ascites fluid by gel filtration chromatography. Fractions
32-36 and fractions 39-43 were pooled, lyophilized and resuspended in PBS buffer for SDS-
PAGE separation. Gel bands were cut from the 20-27 kDa region and processed for mass
spectrometry. We then used the PIM assay to detect NPC2. The NPC2 PIM standard was first
run to verify the elution times and fragmentation pattern for NPC2 peptides A and B (Figure
5.4). The elution time of peptide A was approximately 11.65 minutes and that of peptide B was
approximately 18.47 minutes. The daughter ions of peptide A (y6, y11, and y12) and peptides B
( y112+, y132+, and b12) were verified.
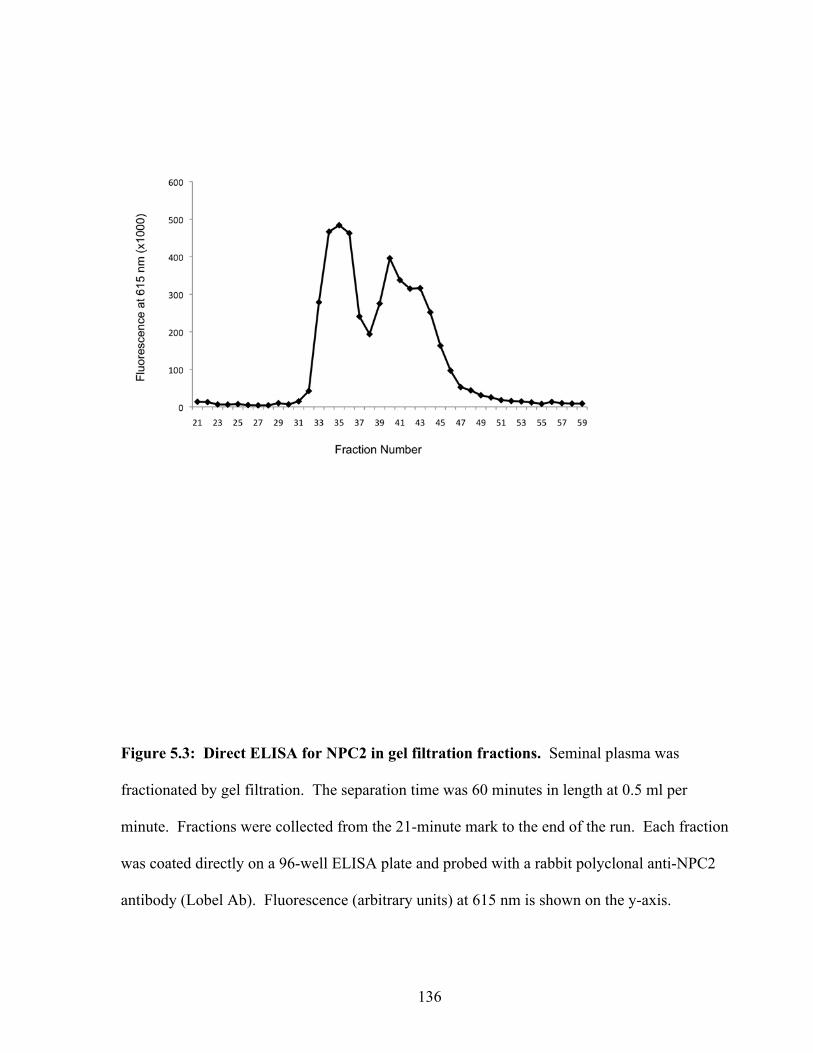
136
Figure 5.3: Direct ELISA for NPC2 in gel filtration fractions. Seminal plasma was
fractionated by gel filtration. The separation time was 60 minutes in length at 0.5 ml per
minute. Fractions were collected from the 21-minute mark to the end of the run. Each fraction
was coated directly on a 96-well ELISA plate and probed with a rabbit polyclonal anti-NPC2
antibody (Lobel Ab). Fluorescence (arbitrary units) at 615 nm is shown on the y-axis.
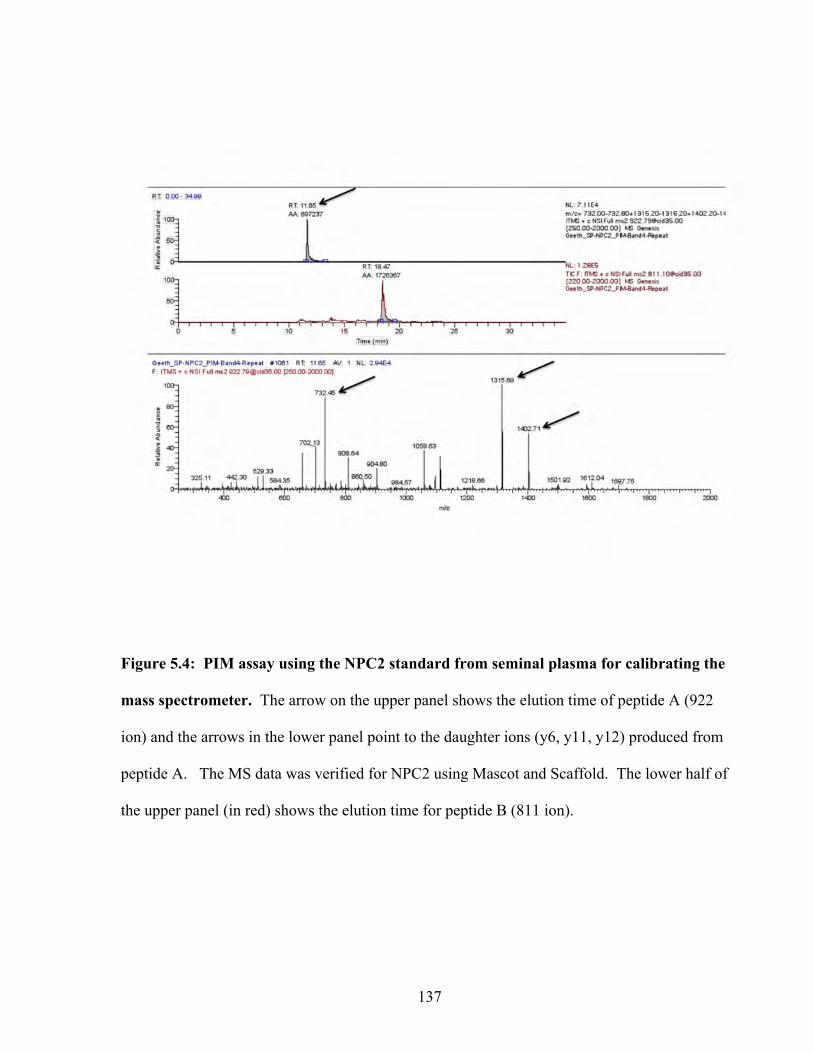
137
Figure 5.4: PIM assay using the NPC2 standard from seminal plasma for calibrating the
mass spectrometer. The arrow on the upper panel shows the elution time of peptide A (922
ion) and the arrows in the lower panel point to the daughter ions (y6, y11, y12) produced from
peptide A. The MS data was verified for NPC2 using Mascot and Scaffold. The lower half of
the upper panel (in red) shows the elution time for peptide B (811 ion).
138
The gel bands from the first ascites were then analyzed by PIM. Indeed, peptide A (elution time
of 11.2 minutes) and the corresponding y6, y11, and y12 daughter ions were detected, thus
confirming the presence of NPC2 in this sample of ascites fluid (Figure 5.5). We did not detect
peptide B at the elution time corresponding to the standard. There was a peak for a peptide with
an 811 m/z ratio eluting at approximately 15.2 minutes. However, the y112+, y132+, and b12
daughter ions were not seen for this peptide, thus suggesting that this was not peptide B of
NPC2.
PIM assay was repeated on four additional malignant ascites samples from ovarian
cancer patients. Samples were processed as mentioned above. Peptide A and the daughter
fragments were detected in all four ascites samples confirming the presence of NPC2 (Figure
5.5-5.9). Note, the elution time for peptide A is 11.6 minutes (± 0.4 seconds), which is
acceptable. Searching raw spectra against the MASCOT database followed by analysis of the
Mascot report using Scaffold verified the presence of NPC2 in all four ascites. Interestingly,
peptide B was not detected by the PIM assay. We suspect several reasons for this (see
Discussion).
5.3.4 Development of a high-throughput screening assay for NPC2.
Although our method was successful in detecting NPC2 in a complex biological fluid, the
procedure is not suitable as a high-throughput method for screening for the following reasons:
1. Large volume of sample is needed (500 µl). This becomes problematic when the
volume of valuable patient sera is low.
2. Each sample must be processed separately. This adds variability from sample to
sample. Given that there are several steps (chromatography, SDS-PAGE,
lyophilisation, etc.) with this procedure, sample handling becomes a crucial factor in

139
consistency.
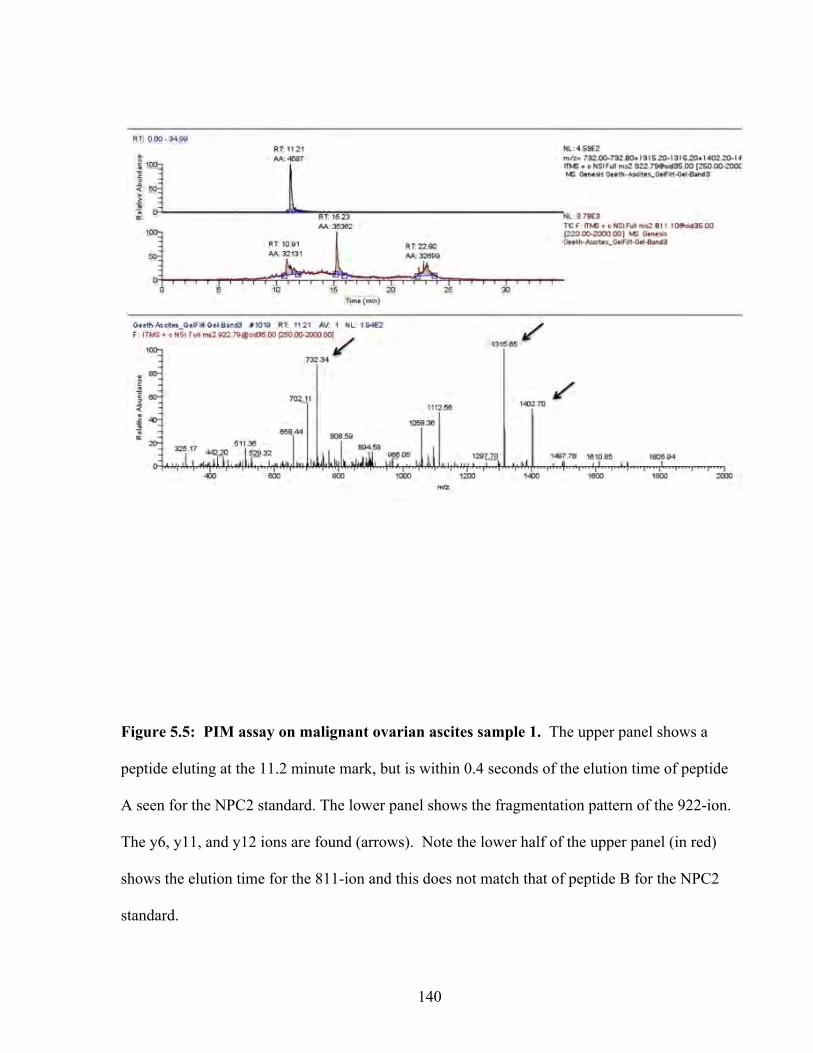
140
Figure 5.5: PIM assay on malignant ovarian ascites sample 1. The upper panel shows a
peptide eluting at the 11.2 minute mark, but is within 0.4 seconds of the elution time of peptide
A seen for the NPC2 standard. The lower panel shows the fragmentation pattern of the 922-ion.
The y6, y11, and y12 ions are found (arrows). Note the lower half of the upper panel (in red)
shows the elution time for the 811-ion and this does not match that of peptide B for the NPC2
standard.
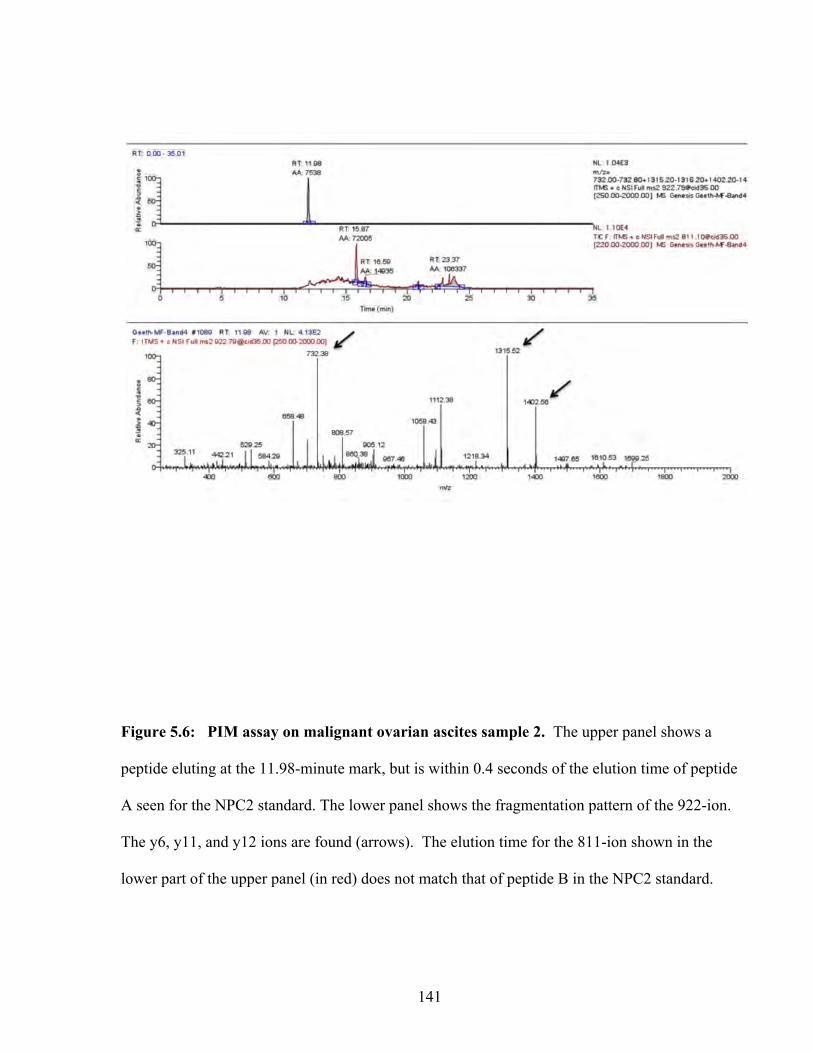
141
Figure 5.6: PIM assay on malignant ovarian ascites sample 2. The upper panel shows a
peptide eluting at the 11.98-minute mark, but is within 0.4 seconds of the elution time of peptide
A seen for the NPC2 standard. The lower panel shows the fragmentation pattern of the 922-ion.
The y6, y11, and y12 ions are found (arrows). The elution time for the 811-ion shown in the
lower part of the upper panel (in red) does not match that of peptide B in the NPC2 standard.
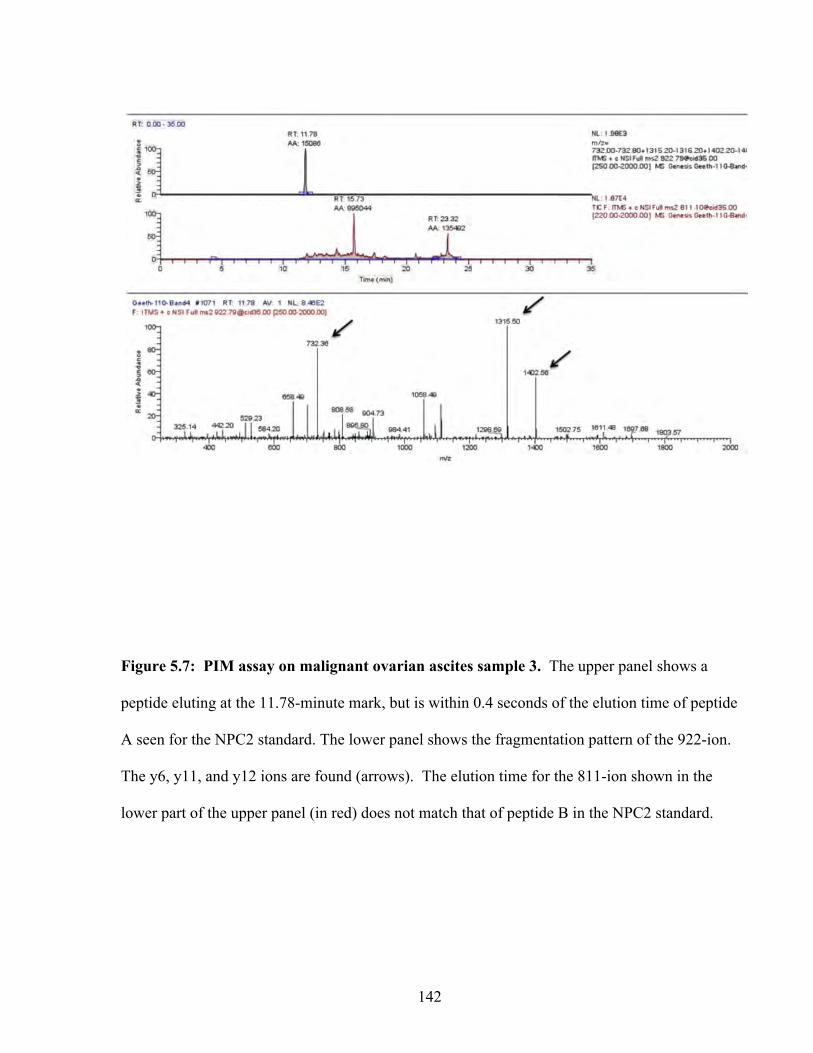
142
Figure 5.7: PIM assay on malignant ovarian ascites sample 3. The upper panel shows a
peptide eluting at the 11.78-minute mark, but is within 0.4 seconds of the elution time of peptide
A seen for the NPC2 standard. The lower panel shows the fragmentation pattern of the 922-ion.
The y6, y11, and y12 ions are found (arrows). The elution time for the 811-ion shown in the
lower part of the upper panel (in red) does not match that of peptide B in the NPC2 standard.
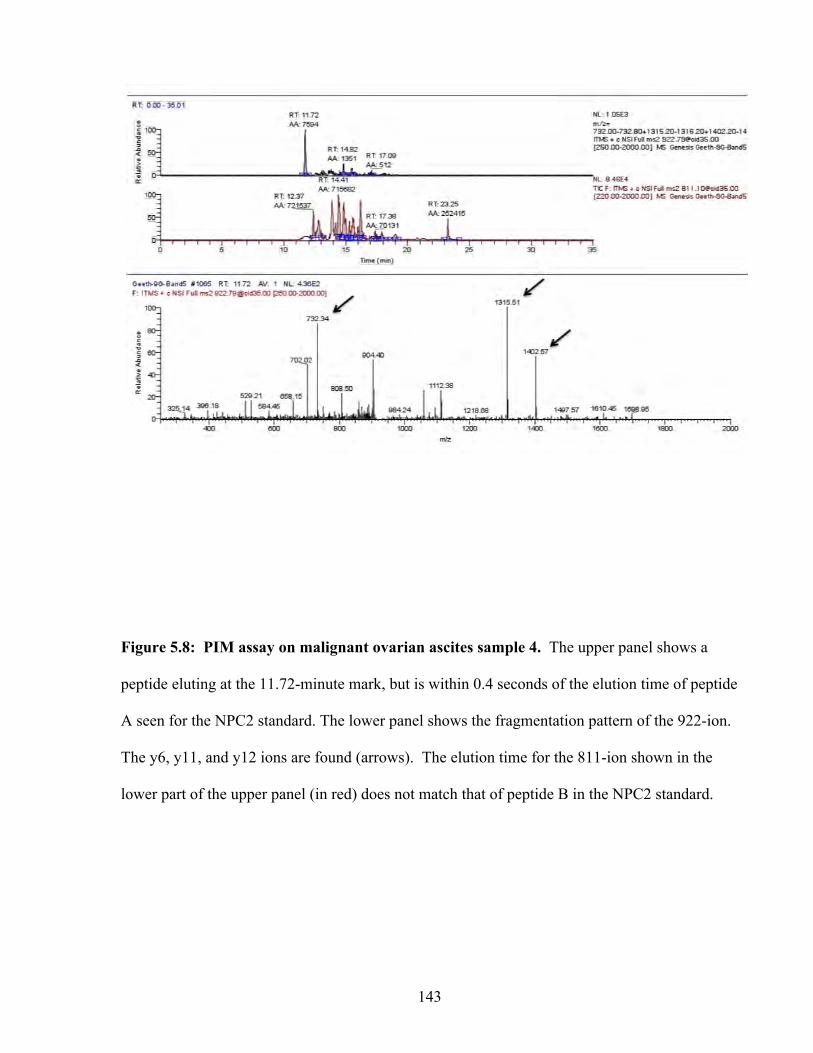
143
Figure 5.8: PIM assay on malignant ovarian ascites sample 4. The upper panel shows a
peptide eluting at the 11.72-minute mark, but is within 0.4 seconds of the elution time of peptide
A seen for the NPC2 standard. The lower panel shows the fragmentation pattern of the 922-ion.
The y6, y11, and y12 ions are found (arrows). The elution time for the 811-ion shown in the
lower part of the upper panel (in red) does not match that of peptide B in the NPC2 standard.
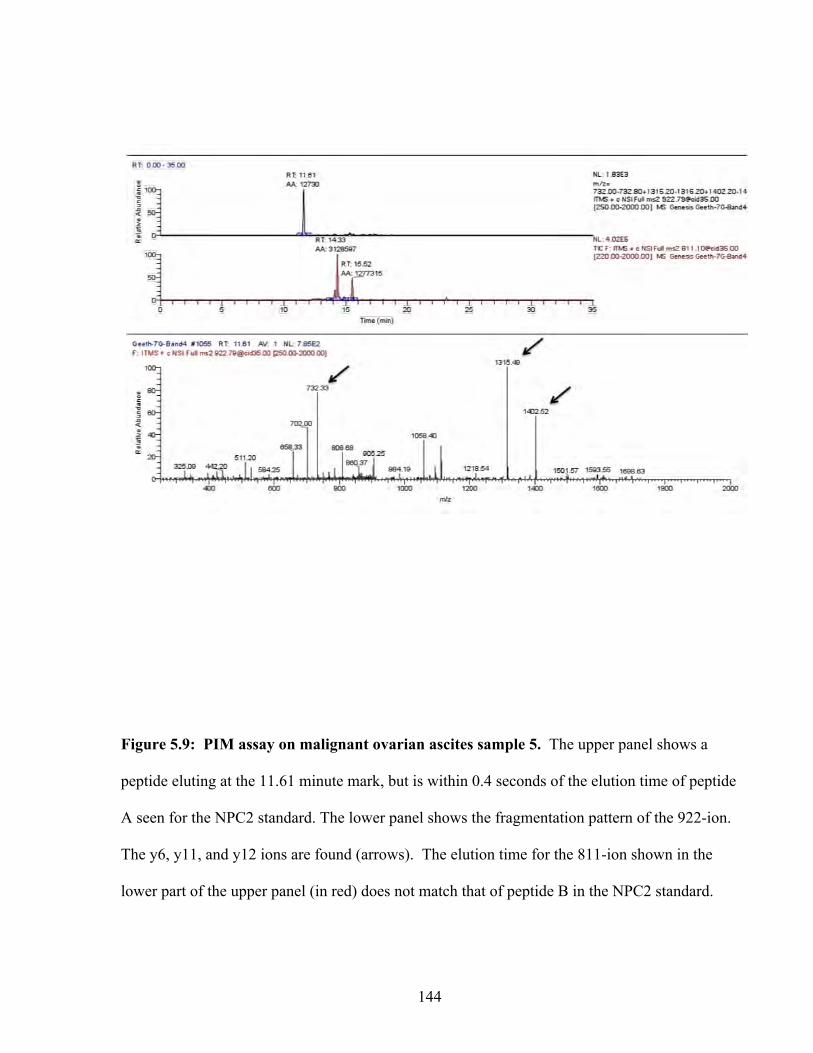
144
Figure 5.9: PIM assay on malignant ovarian ascites sample 5. The upper panel shows a
peptide eluting at the 11.61 minute mark, but is within 0.4 seconds of the elution time of peptide
A seen for the NPC2 standard. The lower panel shows the fragmentation pattern of the 922-ion.
The y6, y11, and y12 ions are found (arrows). The elution time for the 811-ion shown in the
lower part of the upper panel (in red) does not match that of peptide B in the NPC2 standard.

145
3. Procedure is cumbersome since only 5 samples can be processed within 2-3 days for
mass spectrometric analysis.
To screen at least 100 serum samples for NPC2, a more efficient high-throughput tool, such as a
sandwich-type ELISA, is needed. However, there were no commercially available antibodies
nor were there ELISA kits for NPC2. Therefore, we constructed an ELISA using a polyclonal
antibody produced in-house.
5.3.5 Development of Polyclonal anti-NPC2 antibody
To develop a working ELISA, a polyclonal antibody against NPC2 was produced.
Purified NPC2 from seminal plasma was used as the antigen. We used a modified version of
Lobel’s procedure for NPC2 purification (175). Approximately 100 ml of seminal plasma was
dialyzed against 20 mM HEPES buffer (pH 7.0) containing 100 mM NaCl overnight with two
buffer exchanges. The seminal plasma was first purified using a strong anion exchange and
strong cation exchange column in tandem. The columns were equilibrated to pH 7.0 with 20
mM HEPES buffer (pH 7.0) containing 100 mM NaCl. Equilibration of columns to a pH of 7.0
was necessary so that NPC2 would come out in the flow-through fraction whereas most of the
other proteins would bind to the ion-exchange resin. The flow-through fraction was then
dialyzed against 12.5 mM ammonium acetate buffer (pH 4.7) overnight with two buffer
exchanges. The dialyzed fraction was then fractionated using a strong cation exchange column
equilibrated to pH 4.7 using ammonium acetate. A 12.5 mM ammonium acetate buffer (pH 4.7)
was used as the binding buffer. Proteins bound to the resin were eluted in stepwise gradients
starting with 50 mM ammonium acetate. Three fractions were collected for each step gradient.
In all we used the following gradients: 50 mM, 100 mM, 150 mM, 200 mM, 250 mM, 300 mM,
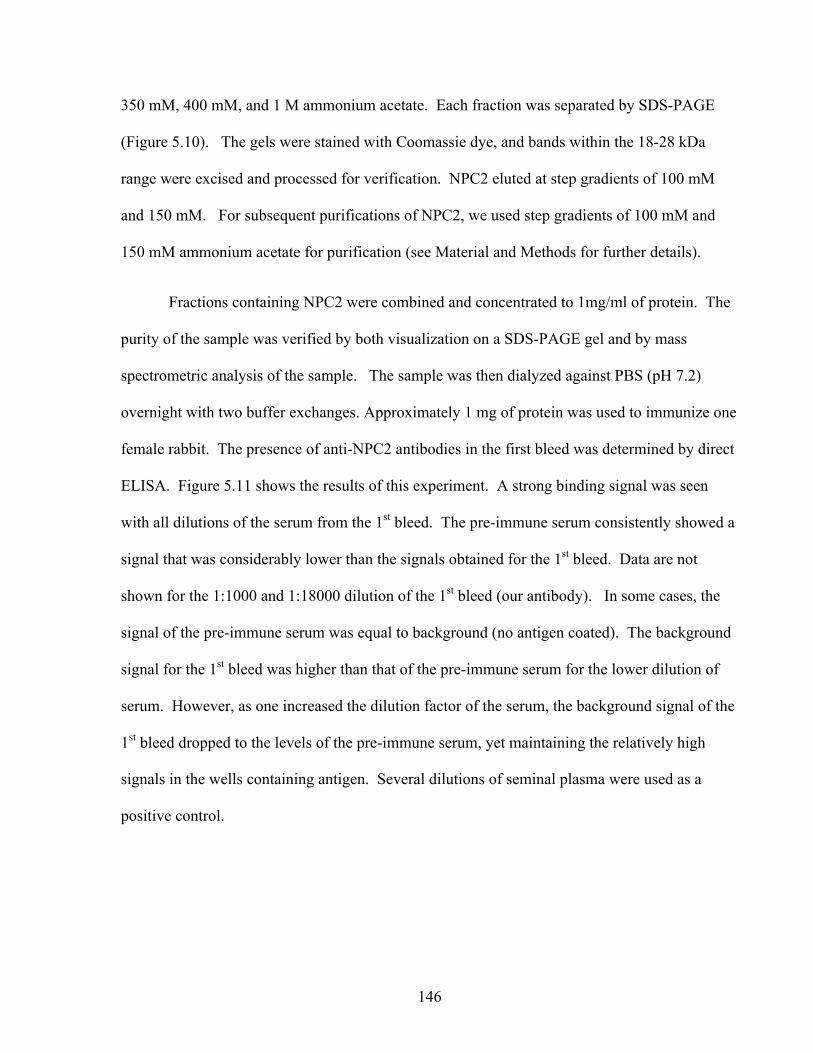
146
350 mM, 400 mM, and 1 M ammonium acetate. Each fraction was separated by SDS-PAGE
(Figure 5.10). The gels were stained with Coomassie dye, and bands within the 18-28 kDa
range were excised and processed for verification. NPC2 eluted at step gradients of 100 mM
and 150 mM. For subsequent purifications of NPC2, we used step gradients of 100 mM and
150 mM ammonium acetate for purification (see Material and Methods for further details).
Fractions containing NPC2 were combined and concentrated to 1mg/ml of protein. The
purity of the sample was verified by both visualization on a SDS-PAGE gel and by mass
spectrometric analysis of the sample. The sample was then dialyzed against PBS (pH 7.2)
overnight with two buffer exchanges. Approximately 1 mg of protein was used to immunize one
female rabbit. The presence of anti-NPC2 antibodies in the first bleed was determined by direct
ELISA. Figure 5.11 shows the results of this experiment. A strong binding signal was seen
with all dilutions of the serum from the 1st bleed. The pre-immune serum consistently showed a
signal that was considerably lower than the signals obtained for the 1st bleed. Data are not
shown for the 1:1000 and 1:18000 dilution of the 1st bleed (our antibody). In some cases, the
signal of the pre-immune serum was equal to background (no antigen coated). The background
signal for the 1st bleed was higher than that of the pre-immune serum for the lower dilution of
serum. However, as one increased the dilution factor of the serum, the background signal of the
1st bleed dropped to the levels of the pre-immune serum, yet maintaining the relatively high
signals in the wells containing antigen. Several dilutions of seminal plasma were used as a
positive control.
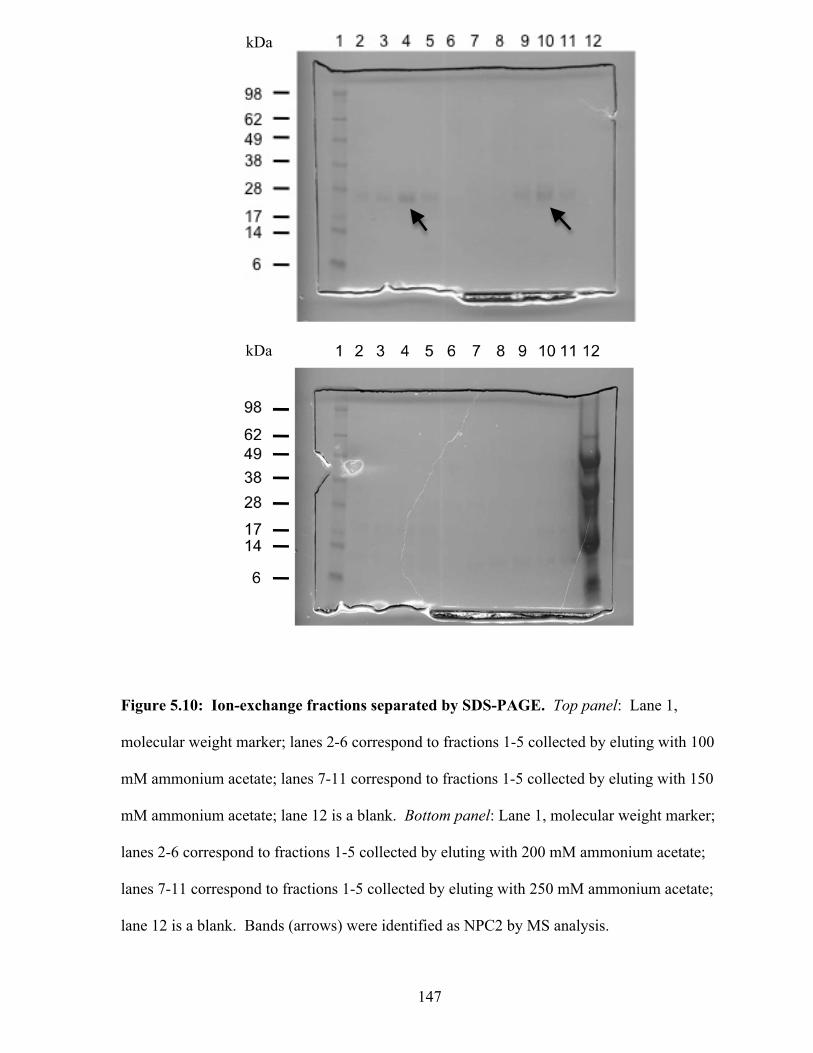
147
Figure 5.10: Ion-exchange fractions separated by SDS-PAGE. Top panel: Lane 1,
molecular weight marker; lanes 2-6 correspond to fractions 1-5 collected by eluting with 100
mM ammonium acetate; lanes 7-11 correspond to fractions 1-5 collected by eluting with 150
mM ammonium acetate; lane 12 is a blank. Bottom panel: Lane 1, molecular weight marker;
lanes 2-6 correspond to fractions 1-5 collected by eluting with 200 mM ammonium acetate;
lanes 7-11 correspond to fractions 1-5 collected by eluting with 250 mM ammonium acetate;
lane 12 is a blank. Bands (arrows) were identified as NPC2 by MS analysis.
kDa
kDa
148
Figure 5.11: Determining the presence of anti-NPC2 antibodies in rabbit antisera.
Ninety-six well plates were coated with varying amounts of purified NPC2 (0, 10, 30, 100 ng).
Rabbit serum from the 1st bleed (our Ab) was used as the primary antibody at varying dilutions.
As a control, pre-immune sera and another anti-NPC2 antibody (Lobel Ab) was used. The
Lobel antibody was not used at 1:4000 dilution. Fluorescence (arbitrary units) at a wavelength
of 615 nm is shown on the y-axis.
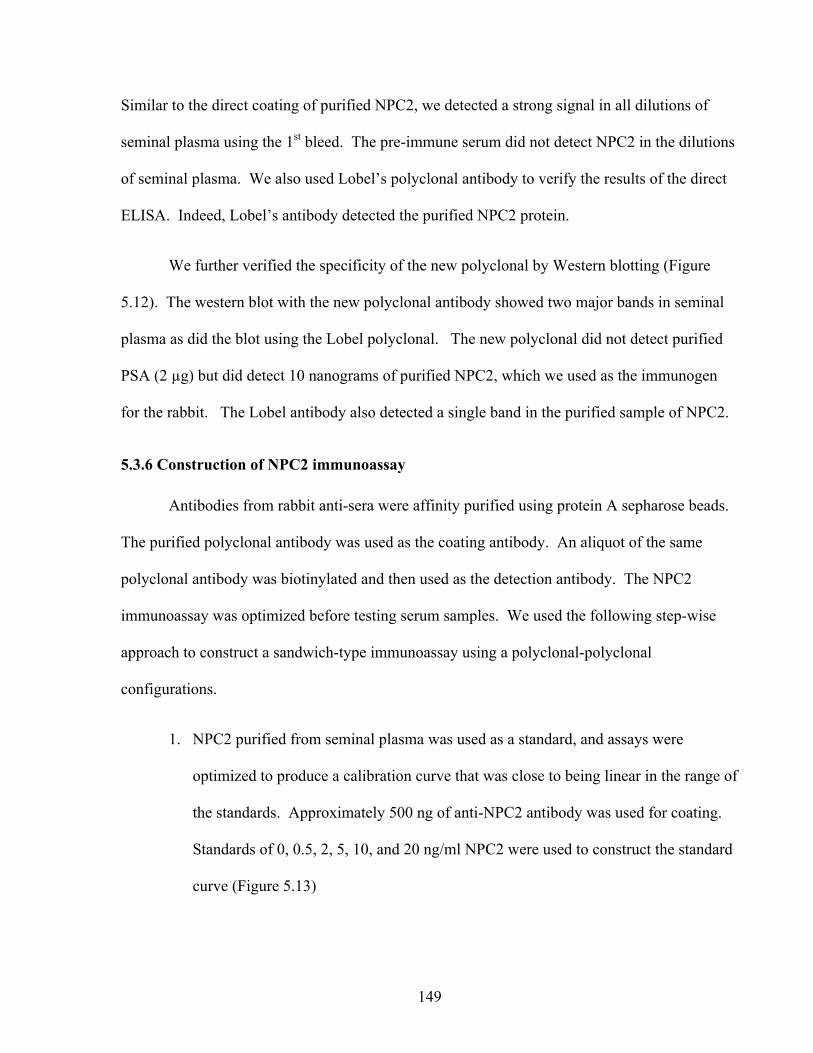
149
Similar to the direct coating of purified NPC2, we detected a strong signal in all dilutions of
seminal plasma using the 1st bleed. The pre-immune serum did not detect NPC2 in the dilutions
of seminal plasma. We also used Lobel’s polyclonal antibody to verify the results of the direct
ELISA. Indeed, Lobel’s antibody detected the purified NPC2 protein.
We further verified the specificity of the new polyclonal by Western blotting (Figure
5.12). The western blot with the new polyclonal antibody showed two major bands in seminal
plasma as did the blot using the Lobel polyclonal. The new polyclonal did not detect purified
PSA (2 µg) but did detect 10 nanograms of purified NPC2, which we used as the immunogen
for the rabbit. The Lobel antibody also detected a single band in the purified sample of NPC2.
5.3.6 Construction of NPC2 immunoassay
Antibodies from rabbit anti-sera were affinity purified using protein A sepharose beads.
The purified polyclonal antibody was used as the coating antibody. An aliquot of the same
polyclonal antibody was biotinylated and then used as the detection antibody. The NPC2
immunoassay was optimized before testing serum samples. We used the following step-wise
approach to construct a sandwich-type immunoassay using a polyclonal-polyclonal
configurations.
1. NPC2 purified from seminal plasma was used as a standard, and assays were
optimized to produce a calibration curve that was close to being linear in the range of
the standards. Approximately 500 ng of anti-NPC2 antibody was used for coating.
Standards of 0, 0.5, 2, 5, 10, and 20 ng/ml NPC2 were used to construct the standard
curve (Figure 5.13)
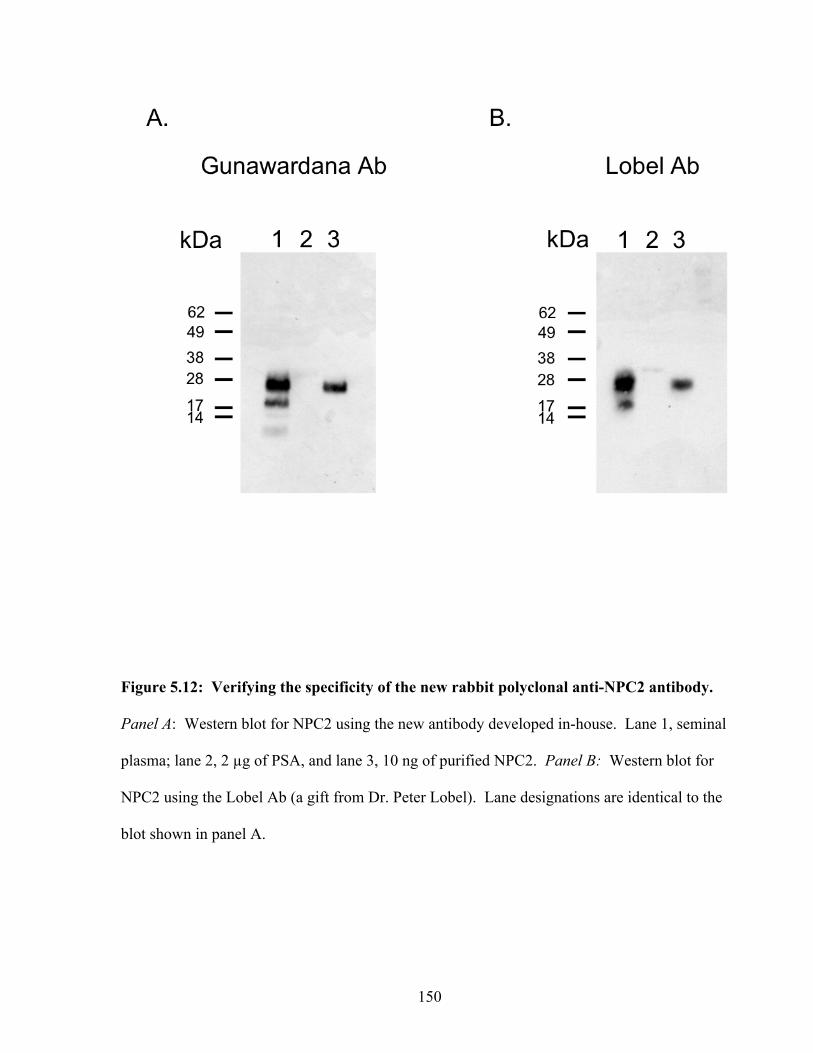
150
Figure 5.12: Verifying the specificity of the new rabbit polyclonal anti-NPC2 antibody.
Panel A: Western blot for NPC2 using the new antibody developed in-house. Lane 1, seminal
plasma; lane 2, 2 µg of PSA, and lane 3, 10 ng of purified NPC2. Panel B: Western blot for
NPC2 using the Lobel Ab (a gift from Dr. Peter Lobel). Lane designations are identical to the
blot shown in panel A.
151
Figure 5.13: NPC2 calibration curve for the NPC2 sandwich-type ELISA. The new
polyclonal antibody was used as both the capture and detection antibody. Approximately 500
ng of antibody was used to capture antigen. The calibration standards were as follows: 0, 0.5,
2, 5, 10, and 20 ng/ml of NPC2. The y-axis shows fluorescence at a wavelength of 615 nm
(arbitrary units). R2 = 1.00. The experiment was performed three times and the graph is a
representation of one such experiment.
152
2. The ELISA was next tested for its efficacy in detecting endogenous protein. We
used ascites fluid that was positive for NPC2 as the test sample. Mass spectrometric
analysis verified the presence NPC2 in this ascites as described previously.
3. Lastly, we measured each analyte in serial dilutions of serum to examine the
relationship between the signal measured and the corresponding dilution.
4. We noted that the assay was very sensitive at the low end of the standard curve. That
is, the difference between background and the next highest standard (0.5 ng/ml
NPC2) was large.
5.3.5 Measuring NPC2 in serum
Serum levels of NPC2 were measured using NPC2 ELISA. Our initial measurement of
serum NPC2 indicated a high concentration of NPC2 in both normal serum and serum from
ovarian cancer patients. There was no difference between the two cases (data not shown). The
new polyclonal antibody is suitable for a sandwich type ELISA when using purified or a semi-
purified sample. However, the assay may not be suitable for a complex fluid such as serum
where the serum matrix may interfere with antibody binding. To address this issue, we lessened
the complexity of serum by fractionating samples by gel filtration prior to measuring NPC2
levels by ELISA. Serum from ovarian cancer patients (n=5) and normal healthy individuals
(n=5) were fractionated by gel-filtration chromatography. As positive controls, seminal plasma
and supernatants from CHO cells expressing recombinant NPC2 were also fractionated.
Fractions were collected starting at the 20-minute mark of the run to the 60-minute mark, at a
minute per fraction. NPC2 was measured in each fraction using the poly-poly sandwich-type
ELISA. Maximum amount of NPC2 was detected at approximately the 36-minute mark (Figure
5.14) in seminal plasma and then decreased towards the end of the run.
153
Figure 5.14: Levels of NPC2 in sera from patients with ovarian cancer and healthy
individuals. Five serum samples from ovarian cancer patients were fractionated by gel
filtration. Fractions were collected from the 20-minute mark untill the end of the run at the 60-
minute mark (middle graph). As controls, five serum samples from healthy individuals were
also fractionated (top graph). The x-axis shows fraction number and the y-axis shows the
concentration of NPC2 in each fraction. The bottom graph shows the fractionation runs of
seminal plasma and CHO supernatants containing secreted recombinant NPC2. For this graph,
the y-axis shows fluorescence at 615 nm (arbitrary units).
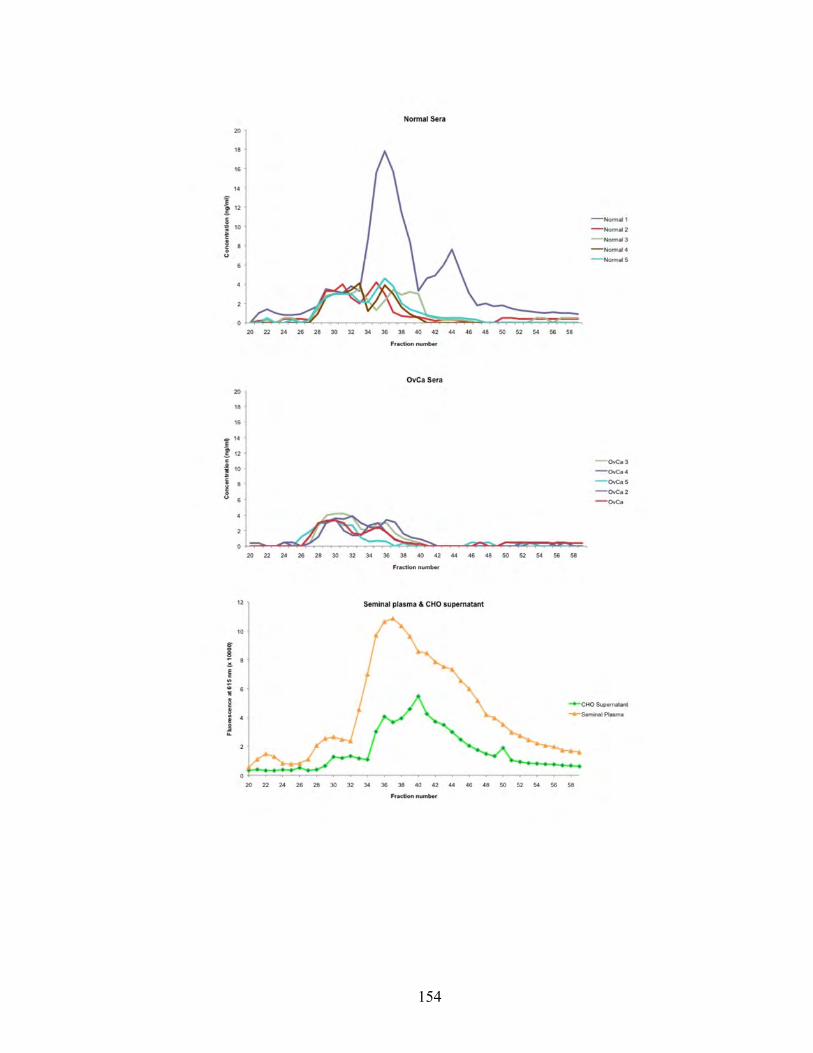
154
155
We suspect that the broadness of the peak is due to the large amounts of NPC2 present in
seminal plasma. Supernatants from CHO cells expressing recombinant NPC2 showed a similar
peak at the 36-minute mark but also showed a peak at the 40-minute mark. The NPC2 elution
profile of ovarian cancer sera and normal sera were very similar to each other and to that of the
CHO supernatants and seminal plasma. Indeed a peak at the 36-minute mark can be seen in
serum samples from both cancer and healthy cases. Although the peaks were greater in seminal
plasma and CHO supernatants, the general shape of the curves were same. The result of the
western blots (Figure 5.12) and the aforementioned ELISA indicates that our polyclonal
antibody is indeed detecting NPC2. There was no significant difference in NPC2 levels
between normal serum and ovarian cancer serum, although one normal serum sample showed a
relatively high amount of NPC2. However, the sample size is small and the ELISA needs to be
repeated with a larger set of samples.
Expression of NPC2 in ovarian cancer tissue by immunohistochemistry.
NPC2 protein was detected in all serous carcinomas by immunohistochemistry (Table
5.2), three of which showed high expression. Four mucinous carcinomas expressed low
amounts of NPC2 protein with one having no expression. All clear-cell carcinomas expressed
NPC2, with three showing high expression. All five endometrioid carcinoma specimens stained
positive for NPC2 with three showing high expression. No expression was seen in normal
surface epithelium. Representative samples from each EOC subtype and normal surface
epithelium showing NPC2 expression are illustrated in Figures 5.15 and 5.16. Epididymal
tissue was used as a positive control (data not shown). Expression followed a cytoplasmic
distribution pattern, but the staining appeared granular and dot-like. A correlation between
tumor stage and expression levels could not be established, as sample size was low.
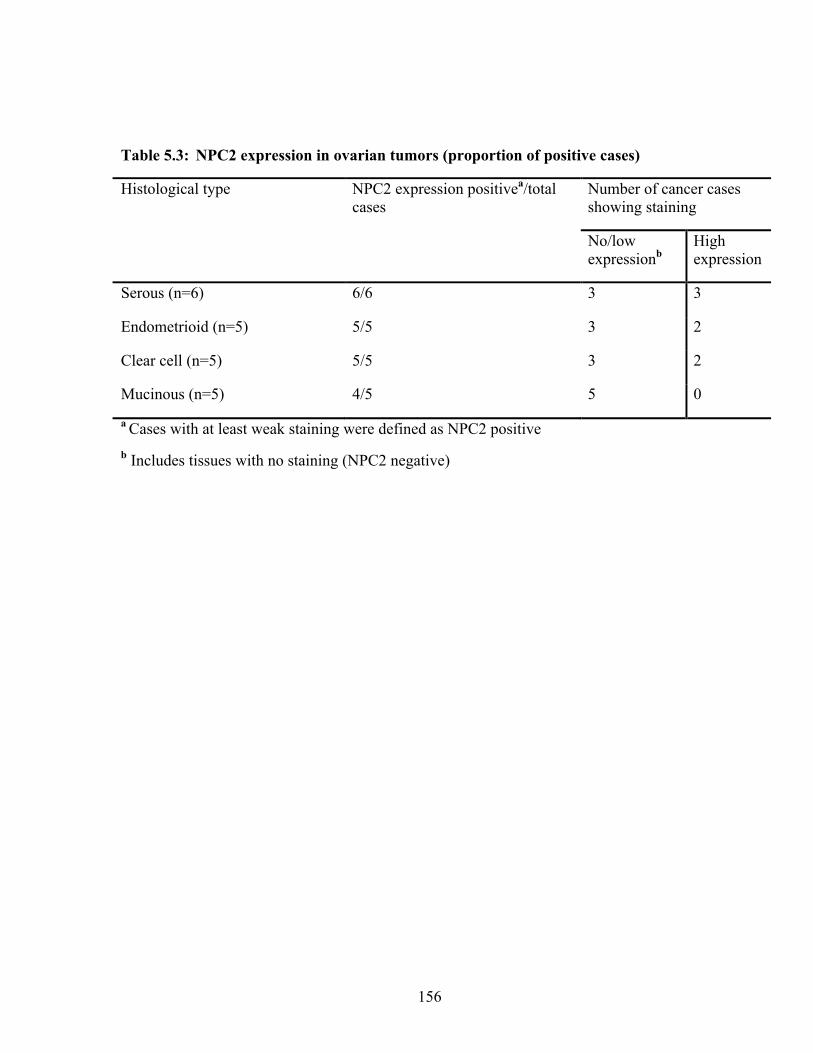
156
Table 5.3: NPC2 expression in ovarian tumors (proportion of positive cases)
Histological type NPC2 expression positivea/total cases
Number of cancer cases showing staining
No/low expressionb
High expression
Serous (n=6) 6/6 3 3
Endometrioid (n=5) 5/5 3 2
Clear cell (n=5) 5/5 3 2
Mucinous (n=5) 4/5 5 0
a Cases with at least weak staining were defined as NPC2 positive b Includes tissues with no staining (NPC2 negative)

157
Figure 5.15: Immunohistochemical expression of NPC2 in the four major types of
epithelial ovarian cancer (arrows): A. Serous adenocarcinoma (x200), B. Mucinous
adenocarcinoma (x200), C. Clear cell adenocarcinoma (x400), D. Endometrioid
adenocarcinoma (x400). Arrows point to tumor cells that are positive for NPC2 (brown
staining). Cell nuclei were stained with hematoxylin (blue colour).
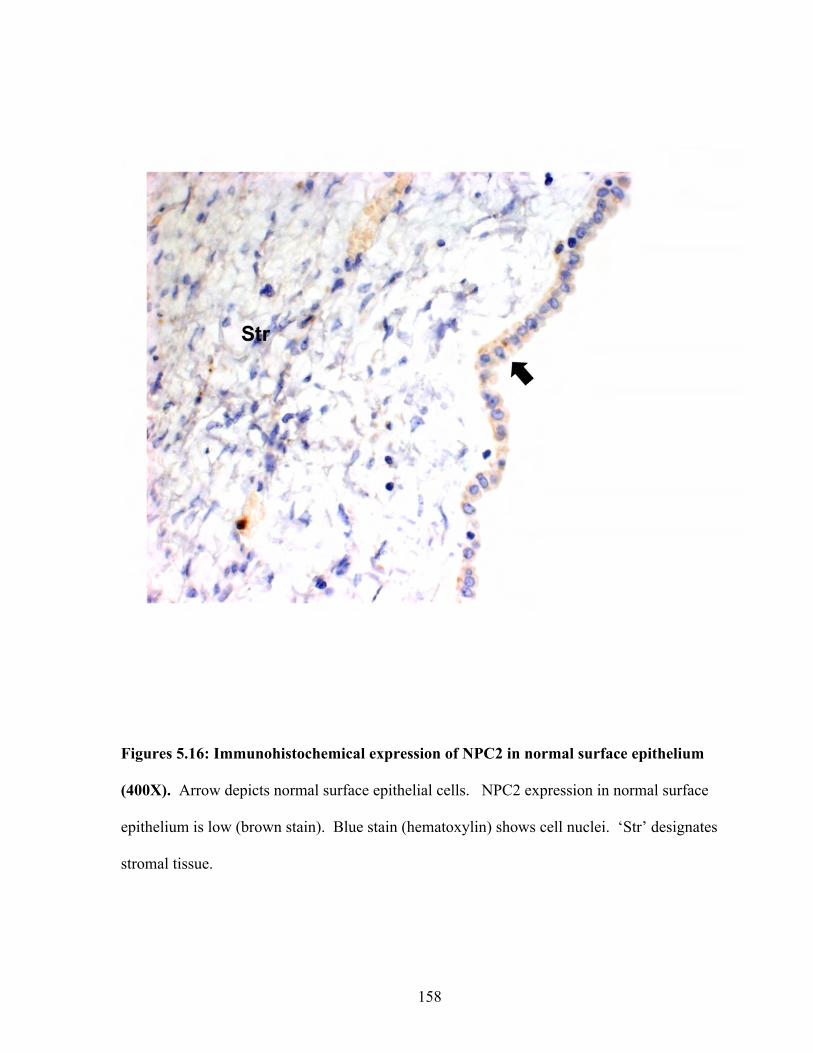
158
Figures 5.16: Immunohistochemical expression of NPC2 in normal surface epithelium
(400X). Arrow depicts normal surface epithelial cells. NPC2 expression in normal surface
epithelium is low (brown stain). Blue stain (hematoxylin) shows cell nuclei. ‘Str’ designates
stromal tissue.

159
Reliable statistical results could not be established to compare expression differences between
the various EOC subtypes, as the number of samples was low. However, given that the normal
surface epithelium stains negative, qualitatively there is a difference between cancer tissue and
controls. Other ovarian tissue that stained positive for NPC2 were stromal and endothelial
tissue, and inflammatory cells.
160
5.4 Discussion
NPC2 is a 20-28 kDa glycoprotein that is involved in cholesterol homeostasis (101,
121). The only report of NPC2 in relation to cancer was in thyroid papillary carcinoma, where
its expression was upregulated (6). In the same study, the investigators found that NPC2
appeared to be specific to papillary carcinoma and not other forms of thyroid cancer as its
expression was localized to the papillary projections. The authors concluded that NPC2 plays a
role in forming the papillary shape.
In our study, all four ovarian cancer cell lines expressed NPC2. More than one peptide
of this protein was detected by the mass spectrometer, suggesting that this protein is not
produced in extremely low amounts by malignant ovarian cells. Others have found NPC2 in
malignant ascites fluid taken from ovarian cancer patients (60, 93). We confirmed these
findings in five ascites fluid samples using the PIM assay. Peptide A with m/z 922
(EVNVSPCPTQPCQLSK) was the best proteotypic peptide among the two chosen in this study.
This particular peptide ionised well and was always detected when NPC2 was present regardless
of the complexity of the sample used. Peptide B (triply charged) with m/z 811
(AVVHGILMGVPVPFPIPEPDGCK) was not suitable, as it was not detected in ascites fluid
even though NPC2 was present. On further examination of MS results, we saw that peptide B
had a doubly charged state with an m/z of 1215 as well. Therefore, the peptide is divided
between the two charge states. It is possible that in these experiments, the concentration of
peptide B was divided between the m/z 811 and m/z 1215 variants. Consequently, the
concentration of peptide B with m/z 811 was too low for the mass spectrometer to detect and
hence not seen in the ascites samples. In spite of only peptide A working in the PIM assay, the
161
assay was successful in identifying NPC2 in malignant ascites fluid. These initial results
suggested that NPC2 was a good candidate for further study as a biomarker for ovarian cancer.
The PIM assay, though suitable for screening a few (5-10) samples, is cumbersome for a
screening study using a large set (>30) of samples. There were no commercial antibodies to
NPC2 available to construct a sensitive ELISA against NPC2. Therefore, we produced an in-
house rabbit polyclonal antibody against NPC2. The advantage of our technique was that we
used endogenous NPC2 protein purified from seminal plasma as the antigen, instead of a
recombinant protein. The polyclonal antibody was specific to NPC2 as seen in the western
blots. Using the in-house developed antibody, a poly-poly sandwich-type ELISA was
constructed. The assay showed linearity in the range of 0.5 ng/ml to 10 ng/ml of NPC2.
We measured NPC2 levels in sera from ovarian cancer and sera from healthy
individuals. We prefractionated the serum samples prior to testing the samples by ELISA. The
elution profile of NPC2 in the sera (cancer and normal) matched the elution profile of NPC2 in
seminal plasma and the recombinant NPC2 protein in CHO cell-supernatants. However, there
was no significant difference between healthy and cancer sera. Thus, the preliminary results
suggest that NPC2 is not a good serum-based biomarker to detect ovarian cancer. However, a
few points to remember are:
1. A larger sample size is necessary for a proper screening method. Therefore, a
conclusion with reliable statistical results cannot be made at this time.
2. The serum samples needed to be prefractionated before the ELISA. The purpose of
constructing an ELISA was to avoid the cumbersome prefractionation and sample
preparation steps involved with the PIM assay. This suggest that our antibody is not
162
robust for measuring NPC2 levels in serum, though it is very good for use in less
complex fluids such as cell culture supernatants, and for use in Western blots.
3. NPC2 is a protein with multiple isoforms (most likely due to glycosylation). The
elution profile shows two peaks and the Western blots also show two bands. At this
stage, one cannot determine if there is a particular species of NPC2 that is specific to
cancer.
Some of the aforementioned points can be addressed with the development of a better antibody,
preferably a monoclonal antibody. Such an antibody can be used to develop a new ELISA.
Glycoform specific antibodies can address the question of whether or not there is a species of
NPC2 that is specific to cancer.
As mentioned previously, some candidate proteins may be better markers for prognosis,
determining tumor grade/stage, or differentiating histological type. Whether or not NPC2 is
good for these cannot be determined yet. However, immunohistochemical analysis indicated
that NPC2 is expressed highly in EOC. We saw no expression in normal surface epithelium.
These results indicate that the presence of NPC2 is biologically relevant in EOC. These results,
however promising, are preliminary, and the role of NPC2 in EOC will be examined further.

163
Chapter 6: Summary and Future Directions
164
6.1 Summary
A proteomic platform using an integrated approach (combining multiple datasets) was
used to identify novel biomarkers to epithelial ovarian cancer. Overall, this thesis has provided
potential candidate proteins that may be used as either serological markers or
immunohistochemical markers to EOC. Below is a summary of the key findings of this study.
6.1.1 Key Findings
1. Chapter 2: Proteomic screen of cell culture supernatants
a. Two-dimensional liquid chromatography-tandem mass spectrometry (2D-LC-
MS/MS) approach was used to analyze the secretome of 4 ovarian cancer cell
lines. Each cell line represented a cancer of a particular histological type of
ovarian carcinoma (serous, mucinous, clear-cell, and endometrioid).
b. Over 2000 proteins were found in total, 420 proteins being extracellular or
plasma membrane proteins.
c. Known biomarkers of EOC including CA-125, HE4, KLK6, osteopontin, and
mesothelin were found using our strategy
2. Chapter 3: Selecting candidate proteins and verification of candidates (Figure 6.1)
a. A stringent set of criteria was used to select candidates. The list of 420
extracellular and plasma membrane proteins was narrowed down to a list of 51
proteins.

165
Figure 6.1: Flow chart representing the criteria used for candidate selection. See chapter 3,
section 3.3.1 for detailed explanation of criteria.

166
b. On the basis of antibody availability, nine proteins were selected from the list of
51 candidates. Immunoassays were constructed for 8 of the 9 candidates
i. Clusterin
ii. IGFBP4, -5, -6, and 7
iii. EPCR
iv. βIG-H3
v. Vasorin
c. Serum samples from patients with ovarian cancer and healthy individuals were
tested by ELISA for the 8 candidates. Clusterin and IGFBP6 showed a
difference in concentration between cancer and normals, with clusterin being
almost three times higher in cancer cases relative to healthy normals.
3. Chapter 4: The study of protein expression in EOC tissue by immunohistochemistry
a. Six proteins were studied for protein expression in ovarian cancer tissue:
i. Clusterin
ii. IGFBP5, and -7
iii. EPCR
iv. ICAM5
167
v. Integrin β4
b. A tissue set consisting of 6 serous, 5 mucinous, 5 clear-cell, and 5 endometrioid
ovarian carcinomas was used in combination with normal ovarian tissue
c. All proteins were expressed in ovarian carcinomas. Many of the candidates have
not been studied in ovarian cancer.
4. Chapter 5: NPC2
a. NPC2 was found in all four ovarian cancer cell lines and NPC2 was identified in
malignant ascites fluid from ovarian cancer patients.
b. A robust product ion monitoring (PIM) assay was developed to detect NPC2 in
complex fluids.
c. A rabbit polyclonal anti-NPC2 antibody was developed and an ELISA was
constructed
d. There was no difference in NPC2 levels in ovarian cancer sera compared to
normal sera.
e. NPC2 is expressed in high amounts in EOC tissue. No NPC2 expression was
seen in normal surface epithelium.
6.1.2 Proof of Hypothesis
1. Proteins secreted or shed by ovarian cancer cell lines are similar to those
secreted or shed by primary ovarian tumours.
168
We identified proteins such as CA-125, HE4, and KLK6 in the cell culture
supernatants. These proteins are also shed (CA-125) or secreted (e.g. HE4 and
KLK6) by primary ovarian tumours. Thus our approach shows that some proteins
that are shed/secreted by ovarian cancer cell lines are indeed similar to those that
are shed/secreted by primary tumours
2. These proteins can be identified by two-dimensional liquid chromatography-
coupled mass spectrometry (2D-LC MS).
We identified proteins such as CA-125, HE4, Mesothelin, and KLK6 by 2D-LC MS.
These proteins are well-studied biomarkers of ovarian cancer. Therefore the
approach presented in this study is a valid approach for biomarker discovery.
3. These proteins can be measured in biological fluids such as serum using
antibody based immunoassays and/or mass spectrometry-based single
reaction monitoring/multiple reaction monitoring assays.
Candidate proteins such as IGFBP4, -6, -7, Vasorin, Clusterin, and EPCR were first
identified in cell culture supernatants by 2D-LC MS and then identified in serum by
sandwich ELISA. Thus we showed that some proteins can be identified in serum
using sensitive immunoassays. We also showed that proteins (e.g. NPC2) can be
measured in biological fluids using product ion monitoring assays which are
identical to single reaction monitoring/multiple reaction monitoring assays.
4. Some proteins may serve as biomarkers for early detection or prognosis of
ovarian cancer.

169
Although we did not identify a good early detection marker, results from our
immunohistochemistry work and work shown in the literature suggests that certain
proteins such as NPC2 and clusterin may play a role in the pathological processes of
ovarian cancer and may therefore be markers for prognosis.
170
6.2 Future Directions
We have presented 51 proteins that may be potential biomarkers. In total, 9 proteins
were tested. NPC2 was a promising candidate. Although it seems to be a poor serological
marker, its expression in ovarian cancer tissue and absence in normal ovarian surface epithelium
suggests that NPC2 is biologically relevant to cancer. This aspect of NPC2 in relation to
ovarian cancer needs to be evaluated. Currently, with the exception of a study conducted in
papillary thyroid carcinoma, no studies have been done regarding NPC2 and cancer. This
protein should be tested in other cancers as well. We constructed a polyclonal-polyclonal
sandwich-type ELISA that needs further refinement. However the ideal ELISA would be one
that utilizes two highly specific monoclonal antibodies. These monoclonal antibodies need to be
developed for NPC2. A robust ELISA that is engineered for measuring serum levels of NPC2
will give a more solid answer to whether or not NPC2 is a good serological marker for ovarian
cancer.
As mentioned previously, 51 candidate proteins were found in this study. None of these
proteins has been evaluated in ovarian cancer. The reason for this is the lack of suitable
immunological reagents such as monoclonal and polyclonal antibodies and recombinant
proteins. Therefore, monoclonal and polyclonal antibodies need to be developed to measure the
serum levels of the remaining candidates in cancer and normal cases.
With respect to screening, some of the candidates studied in this thesis cannot be
dismissed yet. To draw a conclusion backed up with solid statistical power, one needs a large
sample set. Based on power analysis, a sample set containing at least 100 patient samples will
suffice. Proteins such as clusterin and NPC2 need to be evaluated using such a large sample set.

171
Furthermore, many of the candidates were indeed expressed in ovarian carcinoma. The
biological relevance of this expression needs to be studied in detail. Clues to their biological
significance can give hints as to which pathways or proteins can be used as therapeutic targets.

172
References

173
1. Akhmedkhanov A, Toniolo P, Zeleniuch-Jacquotte A, Kato I, Koenig K, and Shore R. Aspirin and epithelial ovarian cancer. Prev Med 33: 682-687, 2001. 2. Ammar H, and Closset J. Clusterin activates survival through the phosphatidylinositol 3-kinase/Akt pathway. J Biol Chem 283: 12851-12861, 2008.
3. Anderson L, and Hunter C. Quantitative mass spectrometric multiple reaction monitoring assays for major plasma proteins. Mol Cell Proteomics 5: 573-588, 2006.
4. Anderson N, and Anderson N. The human plasma proteome: history, character, and diagnostic prospects. Mol Cell Proteomics 1: 845-867, 2002.
5. Arai M, Utsunomiya J, and Miki Y. Familial breast and ovarian cancers. Int J Clin Oncol 9: 270-282, 2004.
6. Asakawa J, Kodaira M, Ishikawa N, Hirai Y, Nagataki S, Moatamed F, and Sugawara M. Two-dimensional complementary deoxyribonucleic acid electrophoresis revealing up-regulated human epididymal protein-1 and down-regulated CL-100 in thyroid papillary carcinoma. Endocrinology 143: 4422-4428, 2002.
7. Auersperg N, Edelson M, Mok S, Johnson S, and Hamilton T. The biology of ovarian cancer. Semin Oncol 25: 281-304, 1998.
8. Bast RJ. Status of tumor markers in ovarian cancer screening. J Clin Oncol 21: 200s-205s, 2003.
9. Bast RJ, Klug T, St John E, Jenison E, Niloff J, Lazarus H, Berkowitz R, Leavitt T, Griffiths C, Parker L, Zurawski VJ, and Knapp R. A radioimmunoassay using a monoclonal antibody to monitor the course of epithelial ovarian cancer. N Engl J Med 309: 883-887, 1983.
10. Bast RJ, and Knapp R. Use of the CA 125 antigen in diagnosis and monitoring of ovarian carcinoma. Eur J Obstet Gynecol Reprod Biol 19: 354-356, 1985.
11. Bast RJ, Siegal F, Runowicz C, Klug T, Zurawski VJ, Schonholz D, Cohen C, and Knapp R. Elevation of serum CA 125 prior to diagnosis of an epithelial ovarian carcinoma. Gynecol Oncol 22: 115-120, 1985.
12. Bast RJ, Urban N, Shridhar V, Smith D, Zhang Z, Skates S, Lu K, Liu J, Fishman D, and Mills G. Early detection of ovarian cancer: promise and reality. Cancer Treat Res 107: 61-97, 2002.
174
13. Bast RJ, Xu F, Yu Y, Barnhill S, Zhang Z, and Mills G. CA 125: the past and the future. Int J Biol Markers 13: 179-187, 1998.
14. Beaulieu LM, and Church FC. Activated protein C promotes breast cancer cell migration through interactions with EPCR and PAR-1. Exp Cell Res 313: 677-687, 2007.
15. Bell K, and Kurman R. A clinicopathologic analysis of atypical proliferative (borderline) tumors and well-differentiated endometrioid adenocarcinomas of the ovary. Am J Surg Pathol 24: 1465-1479, 2000.
16. Bell R, Petticrew M, Luengo S, and Sheldon T. Screening for ovarian cancer: a systematic review. Health Technol Assess 2: i-iv, 1-84, 1998.
17. Bengtsson S, Krogh M, Szigyarto C, Uhlen M, Schedvins K, Silfversward C, Linder S, Auer G, Alaiya A, and James P. Large-scale proteomics analysis of human ovarian cancer for biomarkers. J Proteome Res 6: 1440-1450, 2007.
18. Berglund L, Bjorling E, Oksvold P, Fagerberg L, Asplund A, Szigyarto CA, Persson A, Ottosson J, Wernerus H, Nilsson P, Lundberg E, Sivertsson A, Navani S, Wester K, Kampf C, Hober S, Ponten F, and Uhlen M. A genecentric Human Protein Atlas for expression profiles based on antibodies. Mol Cell Proteomics 7: 2019-2027, 2008.
19. Bettuzzi S, Davalli P, Astancolle S, Carani C, Madeo B, Tampieri A, and Corti A. Tumor progression is accompanied by significant changes in the levels of expression of polyamine metabolism regulatory genes and clusterin (sulfated glycoprotein 2) in human prostate cancer specimens. Cancer Res 60: 28-34, 2000.
20. Bezuhly M, Cullen R, Esmon C, Morris S, West K, Johnston B, and Liwski R. Role of activated protein C and its receptor in inhibition of tumor metastasis. Blood 113: 3371-3374, 2009.
21. Bhoola S, and Hoskins W. Diagnosis and management of epithelial ovarian cancer. Obstet Gynecol 107: 1399-1410, 2006.
22. Blobel C. ADAMs: key components in EGFR signalling and development. Nat Rev Mol Cell Biol 6: 32-43, 2005.

175
23. Borgono C, Kishi T, Scorilas A, Harbeck N, Dorn J, Schmalfeldt B, Schmitt M, and Diamandis E. Human kallikrein 8 protein is a favorable prognostic marker in ovarian cancer. Clin Cancer Res 12: 1487-1493, 2006.
24. Burger A, Zhang X, Li H, Ostrowski J, Beatty B, Venanzoni M, Papas T, and Seth A. Down-regulation of T1A12/mac25, a novel insulin-like growth factor binding protein related gene, is associated with disease progression in breast carcinomas. Oncogene 16: 2459-2467, 1998.
25. Campbell I, Russell S, Choong D, Montgomery K, Ciavarella M, Hooi C, Cristiano B, Pearson R, and Phillips W. Mutation of the PIK3CA gene in ovarian and breast cancer. Cancer Res 64: 7678-7681, 2004.
26. Cannistra S. Cancer of the ovary. N Engl J Med 351: 2519-2529, 2004.
27. Cao D, Ji H, and Ronnett B. Expression of mesothelin, fascin, and prostate stem cell antigen in primary ovarian mucinous tumors and their utility in differentiating primary ovarian mucinous tumors from metastatic pancreatic mucinous carcinomas in the ovary. Int J Gynecol Pathol 24: 67-72, 2005.
28. Castellino F, Liang Z, Volkir S, Haalboom E, Martin J, Sandoval-Cooper M, and Rosen E. Mice with a severe deficiency of the endothelial protein C receptor gene develop, survive, and reproduce normally, and do not present with enhanced arterial thrombosis after challenge. Thromb Haemost 88: 462-472, 2002.
29. Chang T, Chang C, Ohgami N, and Yamauchi Y. Cholesterol sensing, trafficking, and esterification. Annu Rev Cell Dev Biol 22: 129-157, 2006.
30. Chayka O, Corvetta D, Dews M, Caccamo A, Piotrowska I, Santilli G, Gibson S, Sebire N, Himoudi N, Hogarty M, Anderson J, Bettuzzi S, Thomas-Tikhonenko A, and Sala A. Clusterin, a haploinsufficient tumor suppressor gene in neuroblastomas. J Natl Cancer Inst 101: 663-677, 2009.
31. Chu C, and Rubin S. Screening for ovarian cancer in the general population. Best Pract Res Clin Obstet Gynaecol 20: 307-320, 2006.
32. Colombo N, Van Gorp T, Parma G, Amant F, Gatta G, Sessa C, and Vergote I. Ovarian cancer. Crit Rev Oncol Hematol 60: 159-179, 2006.
176
33. Craig R, Cortens JP, and Beavis RC. Open source system for analyzing, validating, and storing protein identification data. J Proteome Res 3: 1234-1242, 2004.
34. Cramer D, and Welch W. Determinants of ovarian cancer risk. II. Inferences regarding pathogenesis. J Natl Cancer Inst 71: 717-721, 1983.
35. Cravatt B, Simon G, and Yates Jr. The biological impact of mass-spectrometry-based proteomics. Nature 450: 991-1000, 2007.
36. Dauplat J, Hacker N, Nieberg R, Berek J, Rose T, and Sagae S. Distant metastases in epithelial ovarian carcinoma. Cancer 60: 1561-1566, 1987.
37. Diamandis E. Analysis of serum proteomic patterns for early cancer diagnosis: drawing attention to potential problems. J Natl Cancer Inst 96: 353-356, 2004.
38. Diamandis E. Mass spectrometry as a diagnostic and a cancer biomarker discovery tool: opportunities and potential limitations. Mol Cell Proteomics 3: 367-378, 2004.
39. Diamandis E, Yousef G, Soosaipillai A, and Bunting P. Human kallikrein 6 (zyme/protease M/neurosin): a new serum biomarker of ovarian carcinoma. Clin Biochem 33: 579-583, 2000.
40. Drapkin R, von Horsten H, Lin Y, Mok S, Crum C, Welch W, and Hecht J. Human epididymis protein 4 (HE4) is a secreted glycoprotein that is overexpressed by serous and endometrioid ovarian carcinomas. Cancer Res 65: 2162-2169, 2005.
41. Duffy M. Clinical uses of tumor markers: a critical review. Crit Rev Clin Lab Sci 38: 225-262, 2001.
42. Duffy M, McKiernan E, O'Donovan N, and McGowan P. Role of ADAMs in cancer formation and progression. Clin Cancer Res 15: 1140-1144, 2009.
43. Edwards D, Handsley M, and Pennington C. The ADAM metalloproteinases. Mol Aspects Med 29: 258-289, 2008.
44. Einhorn N, Bast RJ, Knapp R, Tjernberg B, and Zurawski VJ. Preoperative evaluation of serum CA 125 levels in patients with primary epithelial ovarian cancer. Obstet Gynecol 67: 414-416, 1986.

177
45. Einhorn N, Sjovall K, Knapp R, Hall P, Scully R, Bast RJ, and Zurawski VJ. Prospective evaluation of serum CA 125 levels for early detection of ovarian cancer. Obstet Gynecol 80: 14-18, 1992.
46. Enomoto T, Weghorst C, Inoue M, Tanizawa O, and Rice J. K-ras activation occurs frequently in mucinous adenocarcinomas and rarely in other common epithelial tumors of the human ovary. Am J Pathol 139: 777-785, 1991.
47. Esmon C. The endothelial protein C receptor. Curr Opin Hematol 13: 382-385, 2006.
48. Etzioni R, Urban N, Ramsey S, McIntosh M, Schwartz S, Reid B, Radich J, Anderson G, and Hartwell L. The case for early detection. Nat Rev Cancer 3: 243-252, 2003.
49. Faca V, Ventura A, Fitzgibbon M, Pereira-Faca S, Pitteri S, Green A, Ireton R, Zhang Q, Wang H, O'Briant K, Drescher C, Schummer M, McIntosh M, Knudsen B, and Hanash S. Proteomic analysis of ovarian cancer cells reveals dynamic processes of protein secretion and shedding of extra-cellular domains. PLoS One 3: e2425, 2008.
50. Fathalla M. Incessant ovulation--a factor in ovarian neoplasia? Lancet 2: 163, 1971.
51. Feeley K, and Wells M. Precursor lesions of ovarian epithelial malignancy. Histopathology 38: 87-95, 2001.
52. Foster D, and Davie E. Characterization of a cDNA coding for human protein C. Proc Natl Acad Sci U S A 81: 4766-4770, 1984.
53. Gagne J, Ethier C, Gagne P, Mercier G, Bonicalzi M, Mes-Masson A, Droit A, Winstall E, Isabelle M, and Poirier G. Comparative proteome analysis of human epithelial ovarian cancer. Proteome Sci 5: 16, 2007.
54. Gahmberg C, Tian L, Ning L, and Nyman-Huttunen H. ICAM-5--a novel two-facetted adhesion molecule in the mammalian brain. Immunol Lett 117: 131-135, 2008.
55. Geisler J, Buller E, and Manahan K. Estrogen receptor alpha and beta expression in a case matched series of serous and endometrioid adenocarcinomas of the ovary. Eur J Gynaecol Oncol 29: 126-128, 2008.
178
56. Giuntoli Rn, Rodriguez G, Whitaker R, Dodge R, and Voynow J. Mucin gene expression in ovarian cancers. Cancer Res 58: 5546-5550, 1998.
57. Glish G, and Vachet R. The basics of mass spectrometry in the twenty-first century. Nat Rev Drug Discov 2: 140-150, 2003.
58. Goff B, Mandel L, Muntz H, and Melancon C. Ovarian carcinoma diagnosis. Cancer 89: 2068-2075, 2000.
59. Goldberg J, Piver M, Jishi M, and Blumenson L. Age at onset of ovarian cancer in women with a strong family history of ovarian cancer. Gynecol Oncol 66: 3-9, 1997.
60. Gortzak-Uzan L, Ignatchenko A, Evangelou A, Agochiya M, Brown K, St Onge P, Kireeva I, Schmitt-Ulms G, Brown T, Murphy J, Rosen B, Shaw P, Jurisica I, and Kislinger T. A proteome resource of ovarian cancer ascites: integrated proteomic and bioinformatic analyses to identify putative biomarkers. J Proteome Res 7: 339-351, 2008.
61. Griffiths C. Surgical resection of tumor bulk in the primary treatment of ovarian carcinoma. Natl Cancer Inst Monogr 42: 101-104, 1975.
62. Gu J, Crawley J, Ferrell G, Zhang F, Li W, Esmon N, and Esmon C. Disruption of the endothelial cell protein C receptor gene in mice causes placental thrombosis and early embryonic lethality. J Biol Chem 277: 43335-43343, 2002.
63. Gunawardana C, Kuk C, Smith C, Batruch I, Soosaipillai A, and Diamandis E. Comprehensive Analysis of Conditioned Media from Ovarian Cancer Cell Lines Identifies Novel Candidate Markers of Epithelial Ovarian Cancer. J Proteome Res 2009.
64. Gwinn M, Lee N, Rhodes P, Layde P, and Rubin G. Pregnancy, breast feeding, and oral contraceptives and the risk of epithelial ovarian cancer. J Clin Epidemiol 43: 559-568, 1990.
65. Hayes D, Bast R, Desch C, Fritsche HJ, Kemeny N, Jessup J, Locker G, Macdonald J, Mennel R, Norton L, Ravdin P, Taube S, and Winn R. Tumor marker utility grading system: a framework to evaluate clinical utility of tumor markers. J Natl Cancer Inst 88: 1456-1466, 1996.
66. Heintz A, Odicino F, Maisonneuve P, Beller U, Benedet J, Creasman W, Ngan H, Sideri M, and Pecorelli S. Carcinoma of the ovary. J Epidemiol Biostat 6: 107-138, 2001.
179
67. Hellstrom I, Raycraft J, Hayden-Ledbetter M, Ledbetter J, Schummer M, McIntosh M, Drescher C, Urban N, and Hellstrom K. The HE4 (WFDC2) protein is a biomarker for ovarian carcinoma. Cancer Res 63: 3695-3700, 2003.
68. Helzlsouer K, Bush T, Alberg A, Bass K, Zacur H, and Comstock G. Prospective study of serum CA-125 levels as markers of ovarian cancer. JAMA 269: 1123-1126, 1993.
69. Herbst A. The epidemiology of ovarian carcinoma and the current status of tumor markers to detect disease. Am J Obstet Gynecol 170: 1099-1105; discussion 1105-1097, 1994.
70. Hoffman B, Katsaros D, Scorilas A, Diamandis P, Fracchioli S, Rigault de la Longrais I, Colgan T, Puopolo M, Giardina G, Massobrio M, and Diamandis E. Immunofluorometric quantitation and histochemical localisation of kallikrein 6 protein in ovarian cancer tissue: a new independent unfavourable prognostic biomarker. Br J Cancer 87: 763-771, 2002.
71. Hortin G, Sviridov D, and Anderson N. High-abundance polypeptides of the human plasma proteome comprising the top 4 logs of polypeptide abundance. Clin Chem 54: 1608-1616, 2008.
72. Hough C, Cho K, Zonderman A, Schwartz D, and Morin P. Coordinately up-regulated genes in ovarian cancer. Cancer Res 61: 3869-3876, 2001.
73. Hwang H, Quenneville L, Yaziji H, and Gown A. Wilms tumor gene product: sensitive and contextually specific marker of serous carcinomas of ovarian surface epithelial origin. Appl Immunohistochem Mol Morphol 12: 122-126, 2004.
74. Hynes R. Integrins: versatility, modulation, and signaling in cell adhesion. Cell 69: 11-25, 1992.
75. Ichikawa Y, Nishida M, Suzuki H, Yoshida S, Tsunoda H, Kubo T, Uchida K, and Miwa M. Mutation of K-ras protooncogene is associated with histological subtypes in human mucinous ovarian tumors. Cancer Res 54: 33-35, 1994.
76. Isonishi S. [Biomarker in gynecologic malignancies]. Gan To Kagaku Ryoho 31: 1003-1007, 2004.
77. Jacobs I, and Bast RJ. The CA 125 tumour-associated antigen: a review of the literature. Hum Reprod 4: 1-12, 1989.

180
78. Jacobs I, Skates S, MacDonald N, Menon U, Rosenthal A, Davies A, Woolas R, Jeyarajah A, Sibley K, Lowe D, and Oram D. Screening for ovarian cancer: a pilot randomised controlled trial. Lancet 353: 1207-1210, 1999.
79. Jacobs I, Stabile I, Bridges J, Kemsley P, Reynolds C, Grudzinskas J, and Oram D. Multimodal approach to screening for ovarian cancer. Lancet 1: 268-271, 1988.
80. Jarjanazi H, Savas S, Pabalan N, Dennis J, and Ozcelik H. Biological implications of SNPs in signal peptide domains of human proteins. Proteins 70: 394-403, 2008.
81. Jemal A, Siegel R, Ward E, Hao Y, Xu J, and Thun M. Cancer statistics, 2009. CA Cancer J Clin 59: 225-249, 2009.
82. Jurisicova A, Jurisica I, and Kislinger T. Advances in ovarian cancer proteomics: the quest for biomarkers and improved therapeutic interventions. Expert Rev Proteomics 5: 551-560, 2008.
83. Kabawat S, Bast RJ, Bhan A, Welch W, Knapp R, and Colvin R. Tissue distribution of a coelomic-epithelium-related antigen recognized by the monoclonal antibody OC125. Int J Gynecol Pathol 2: 275-285, 1983.
84. Kanemitsu N, Kato M, Miki T, Komatsu S, Okazaki Y, Hayashizaki Y, and Sakai T. Characterization of the promoter of the murine mac25 gene. Biochem Biophys Res Commun 279: 251-257, 2000.
85. Karlan B, Jones J, Slamon D, and Lagasse L. Glucocorticoids stabilize HER-2/neu messenger RNA in human epithelial ovarian carcinoma cells. Gynecol Oncol 53: 70-77, 1994.
86. Kim J, Skates S, Uede T, Wong K, Schorge J, Feltmate C, Berkowitz R, Cramer D, and Mok S. Osteopontin as a potential diagnostic biomarker for ovarian cancer. JAMA 287: 1671-1679, 2002.
87. Kim S, Bachman N, Nair T, Goldsmith S, Liebert M, Grossman H, Lomax M, and Carey T. Beta 4 integrin transfection of UM-UC-2 (human bladder carcinoma) cells: stable expression of a spontaneous cytoplasmic truncation mutant with rapid loss of clones expressing intact beta 4. Cancer Res 57: 38-42, 1997.
88. Kirchhoff C, Osterhoff C, and Young L. Molecular cloning and characterization of HE1, a major secretory protein of the human epididymis. Biol Reprod 54: 847-856, 1996.
181
89. Kitajiri S, Hosaka N, Hiraumi H, Hirose T, and Ikehara S. Increased expression of integrin beta-4 in papillary thyroid carcinoma with gross lymph node metastasis. Pathol Int 52: 438-441, 2002.
90. Kitteringham N, Jenkins R, Lane C, Elliott V, and Park B. Multiple reaction monitoring for quantitative biomarker analysis in proteomics and metabolomics. J Chromatogr B Analyt Technol Biomed Life Sci 877: 1229-1239, 2009.
91. Klein A, Amigo L, Retamal M, Morales M, Miquel J, Rigotti A, and Zanlungo S. NPC2 is expressed in human and murine liver and secreted into bile: potential implications for body cholesterol homeostasis. Hepatology 43: 126-133, 2006.
92. Komatsu S, Okazaki Y, Tateno M, Kawai J, Konno H, Kusakabe M, Yoshiki A, Muramatsu M, Held W, and Hayashizaki Y. Methylation and downregulated expression of mac25/insulin-like growth factor binding protein-7 is associated with liver tumorigenesis in SV40T/t antigen transgenic mice, screened by restriction landmark genomic scanning for methylation (RLGS-M). Biochem Biophys Res Commun 267: 109-117, 2000.
93. Kuk C, Kulasingam V, Gunawardana C, Smith C, Batruch I, and Diamandis E. Mining the ovarian cancer ascites proteome for potential ovarian cancer biomarkers. Mol Cell Proteomics 8: 661-669, 2009.
94. Kulasingam V, and Diamandis E. Proteomics analysis of conditioned media from three breast cancer cell lines: a mine for biomarkers and therapeutic targets. Mol Cell Proteomics 6: 1997-2011, 2007.
95. Kulasingam V, and Diamandis E. Strategies for discovering novel cancer biomarkers through utilization of emerging technologies. Nat Clin Pract Oncol 5: 588-599, 2008.
96. Kulasingam V, and Diamandis E. Tissue culture-based breast cancer biomarker discovery platform. Int J Cancer 123: 2007-2012, 2008.
97. Kulasingam V, Smith C, Batruch I, Buckler A, Jeffery D, and Diamandis E. "Product ion monitoring" assay for prostate-specific antigen in serum using a linear ion-trap. J Proteome Res 7: 640-647, 2008.
98. Kupryjanczyk J, Thor A, Beauchamp R, Merritt V, Edgerton S, Bell D, and Yandell D. p53 gene mutations and protein accumulation in human ovarian cancer. Proc Natl Acad Sci U S A 90: 4961-4965, 1993.
182
99. Lau S, Sham J, Xie D, Tzang C, Tang D, Ma N, Hu L, Wang Y, Wen J, Xiao G, Zhang W, Lau G, Yang M, and Guan X. Clusterin plays an important role in hepatocellular carcinoma metastasis. Oncogene 25: 1242-1250, 2006.
100. Liotta L, and Kohn E. The microenvironment of the tumour-host interface. Nature 411: 375-379, 2001.
101. Liou H, Dixit S, Xu S, Tint G, Stock A, and Lobel P. NPC2, the protein deficient in Niemann-Pick C2 disease, consists of multiple glycoforms that bind a variety of sterols. J Biol Chem 281: 36710-36723, 2006.
102. Luo L, Soosaipillai A, Grass L, and Diamandis E. Characterization of human kallikreins 6 and 10 in ascites fluid from ovarian cancer patients. Tumour Biol 27: 227-234, 2006.
103. Maines-Bandiera S, and Auersperg N. Increased E-cadherin expression in ovarian surface epithelium: an early step in metaplasia and dysplasia? Int J Gynecol Pathol 16: 250-255, 1997.
104. Mallick P, Schirle M, Chen S, Flory M, Lee H, Martin D, Ranish J, Raught B, Schmitt R, Werner T, Kuster B, and Aebersold R. Computational prediction of proteotypic peptides for quantitative proteomics. Nat Biotechnol 25: 125-131, 2007.
105. Marcotte E. How do shotgun proteomics algorithms identify proteins? Nat Biotechnol 25: 755-757, 2007.
106. Martin J, Eynstone L, Davies M, Williams J, and Steadman R. The role of ADAM 15 in glomerular mesangial cell migration. J Biol Chem 277: 33683-33689, 2002.
107. Martin V. Ovarian cancer. Semin Oncol Nurs 18: 174-183, 2002.
108. Martin V. Straight talk about ovarian cancer. Nursing 35: 36-41; quiz 42, 2005.
109. Maruya S, Myers J, Weber R, Rosenthal D, Lotan R, and El-Naggar A. ICAM-5 (telencephalin) gene expression in head and neck squamous carcinoma tumorigenesis and perineural invasion! Oral Oncol 41: 580-588, 2005.
183
110. Maxfield F, and Menon A. Intracellular sterol transport and distribution. Curr Opin Cell Biol 18: 379-385, 2006.
111. McIntosh M, Liu Y, Drescher C, Urban N, and Diamandis E. Validation and characterization of human kallikrein 11 as a serum marker for diagnosis of ovarian carcinoma. Clin Cancer Res 13: 4422-4428, 2007.
112. Meyer T, and Rustin G. Role of tumour markers in monitoring epithelial ovarian cancer. Br J Cancer 82: 1535-1538, 2000.
113. Moretti R, Marelli M, Mai S, Cariboni A, Scaltriti M, Bettuzzi S, and Limonta P. Clusterin isoforms differentially affect growth and motility of prostate cells: possible implications in prostate tumorigenesis. Cancer Res 67: 10325-10333, 2007.
114. Moss E, Hollingworth J, and Reynolds T. The role of CA125 in clinical practice. J Clin Pathol 58: 308-312, 2005.
115. Murphy G. The ADAMs: signalling scissors in the tumour microenvironment. Nat Rev Cancer 8: 929-941, 2008.
116. Nagele F, Petru E, Medl M, Kainz C, Graf A, and Sevelda P. Preoperative CA 125: an independent prognostic factor in patients with stage I epithelial ovarian cancer. Obstet Gynecol 86: 259-264, 1995.
117. Najy A, Day K, and Day M. ADAM15 supports prostate cancer metastasis by modulating tumor cell-endothelial cell interaction. Cancer Res 68: 1092-1099, 2008.
118. Najy A, Day K, and Day M. The ectodomain shedding of E-cadherin by ADAM15 supports ErbB receptor activation. J Biol Chem 283: 18393-18401, 2008.
119. Nasca P, Greenwald P, Chorost S, Richart R, and Caputo T. An epidemiologic case-control study of ovarian cancer and reproductive factors. Am J Epidemiol 119: 705-713, 1984.
120. Natali P, Nicotra M, Botti C, Mottolese M, Bigotti A, and Segatto O. Changes in expression of alpha 6/beta 4 integrin heterodimer in primary and metastatic breast cancer. Br J Cancer 66: 318-322, 1992.
184
121. Naureckiene S, Sleat D, Lackland H, Fensom A, Vanier M, Wattiaux R, Jadot M, and Lobel P. Identification of HE1 as the second gene of Niemann-Pick C disease. Science 290: 2298-2301, 2000.
122. Ness R, and Cottreau C. Possible role of ovarian epithelial inflammation in ovarian cancer. J Natl Cancer Inst 91: 1459-1467, 1999.
123. Norris H, and Jensen R. Relative frequency of ovarian neoplasms in children and adolescents. Cancer 30: 713-719, 1972.
124. Obata K, Morland S, Watson R, Hitchcock A, Chenevix-Trench G, Thomas E, and Campbell I. Frequent PTEN/MMAC mutations in endometrioid but not serous or mucinous epithelial ovarian tumors. Cancer Res 58: 2095-2097, 1998.
125. Olayioye M, Neve R, Lane H, and Hynes N. The ErbB signaling network: receptor heterodimerization in development and cancer. EMBO J 19: 3159-3167, 2000.
126. Omenn G, States D, Adamski M, Blackwell T, Menon R, Hermjakob H, Apweiler R, Haab B, Simpson R, Eddes J, Kapp E, Moritz R, Chan D, Rai A, Admon A, Aebersold R, Eng J, Hancock W, Hefta S, Meyer H, Paik Y, Yoo J, Ping P, Pounds J, Adkins J, Qian X, Wang R, Wasinger V, Wu C, Zhao X, Zeng R, Archakov A, Tsugita A, Beer I, Pandey A, Pisano M, Andrews P, Tammen H, Speicher D, and Hanash S. Overview of the HUPO Plasma Proteome Project: results from the pilot phase with 35 collaborating laboratories and multiple analytical groups, generating a core dataset of 3020 proteins and a publicly-available database. Proteomics 5: 3226-3245, 2005.
127. Otsuka J, Okuda T, Sekizawa A, Amemiya S, Saito H, Okai T, Kushima M, and Tachikawa T. K-ras mutation may promote carcinogenesis of endometriosis leading to ovarian clear cell carcinoma. Med Electron Microsc 37: 188-192, 2004.
128. Ozols R, Bookman M, Connolly D, Daly M, Godwin A, Schilder R, Xu X, and Hamilton T. Focus on epithelial ovarian cancer. Cancer Cell 5: 19-24, 2004.
129. Palacios J, and Gamallo C. Mutations in the beta-catenin gene (CTNNB1) in endometrioid ovarian carcinomas. Cancer Res 58: 1344-1347, 1998.
130. Park D, Yeo S, Wilson M, Yerbury J, Kwong J, Welch W, Choi Y, Birrer M, Mok S, and Wong K. Clusterin interacts with Paclitaxel and confer Paclitaxel resistance in ovarian cancer. Neoplasia 10: 964-972, 2008.
185
131. Partridge E, and Barnes M. Epithelial ovarian cancer: prevention, diagnosis, and treatment. CA Cancer J Clin 49: 297-320, 1999.
132. Perou C, Sorlie T, Eisen M, van de Rijn M, Jeffrey S, Rees C, Pollack J, Ross D, Johnsen H, Akslen L, Fluge O, Pergamenschikov A, Williams C, Zhu S, Lonning P, Borresen-Dale A, Brown P, and Botstein D. Molecular portraits of human breast tumours. Nature 406: 747-752, 2000.
133. Provencher D, Lounis H, Champoux L, Tetrault M, Manderson E, Wang J, Eydoux P, Savoie R, Tonin P, and Mes-Masson A. Characterization of four novel epithelial ovarian cancer cell lines. In Vitro Cell Dev Biol Anim 36: 357-361, 2000.
134. Redondo M, Villar E, Torres-Munoz J, Tellez T, Morell M, and Petito C. Overexpression of clusterin in human breast carcinoma. Am J Pathol 157: 393-399, 2000.
135. Rhodes DR, Yu J, Shanker K, Deshpande N, Varambally R, Ghosh D, Barrette T, Pandey A, and Chinnaiyan AM. ONCOMINE: a cancer microarray database and integrated data-mining platform. Neoplasia 6: 1-6, 2004.
136. Rifai N, Gillette M, and Carr S. Protein biomarker discovery and validation: the long and uncertain path to clinical utility. Nat Biotechnol 24: 971-983, 2006.
137. Risch H. Hormonal etiology of epithelial ovarian cancer, with a hypothesis concerning the role of androgens and progesterone. J Natl Cancer Inst 90: 1774-1786, 1998.
138. Rizzi F, and Bettuzzi S. Targeting Clusterin in prostate cancer. J Physiol Pharmacol 59 Suppl 9: 265-274, 2008.
139. Robertson D, Pruysers E, and Jobling T. Inhibin as a diagnostic marker for ovarian cancer. Cancer Lett 249: 14-17, 2007.
140. Roland I, Yang W, Yang D, Daly M, Ozols R, Hamilton T, Lynch H, Godwin A, and Xu X. Loss of surface and cyst epithelial basement membranes and preneoplastic morphologic changes in prophylactic oophorectomies. Cancer 98: 2607-2623, 2003.
141. Rose P, Piver M, Tsukada Y, and Lau T. Metastatic patterns in histologic variants of ovarian cancer. An autopsy study. Cancer 64: 1508-1513, 1989.
186
142. Rosen D, Wang L, Atkinson J, Yu Y, Lu K, Diamandis E, Hellstrom I, Mok S, Liu J, and Bast RJ. Potential markers that complement expression of CA125 in epithelial ovarian cancer. Gynecol Oncol 99: 267-277, 2005.
143. Roth L, Emerson R, and Ulbright T. Ovarian endometrioid tumors of low malignant potential: a clinicopathologic study of 30 cases with comparison to well-differentiated endometrioid adenocarcinoma. Am J Surg Pathol 27: 1253-1259, 2003.
144. Sakayori M, Nozawa S, Udagawa Y, Chin K, Lee S, Sakuma T, Iizuka R, Wada Y, Yoshida S, and Takeda Y. [Biological properties of two newly established cell lines (RMUG-S, RMUG-L) from a human ovarian mucinous cystadenocarcinoma]. Hum Cell 3: 52-56, 1990.
145. Sardana G, Jung K, Stephan C, and Diamandis E. Proteomic analysis of conditioned media from the PC3, LNCaP, and 22Rv1 prostate cancer cell lines: discovery and validation of candidate prostate cancer biomarkers. J Proteome Res 7: 3329-3338, 2008.
146. Sato N, Tsunoda H, Nishida M, Morishita Y, Takimoto Y, Kubo T, and Noguchi M. Loss of heterozygosity on 10q23.3 and mutation of the tumor suppressor gene PTEN in benign endometrial cyst of the ovary: possible sequence progression from benign endometrial cyst to endometrioid carcinoma and clear cell carcinoma of the ovary. Cancer Res 60: 7052-7056, 2000.
147. Schildkraut J, Schwingl P, Bastos E, Evanoff A, and Hughes C. Epithelial ovarian cancer risk among women with polycystic ovary syndrome. Obstet Gynecol 88: 554-559, 1996.
148. Shan S, Scorilas A, Katsaros D, Rigault de la Longrais I, Massobrio M, and Diamandis E. Unfavorable prognostic value of human kallikrein 7 quantified by ELISA in ovarian cancer cytosols. Clin Chem 52: 1879-1886, 2006.
149. Shannan B, Seifert M, Leskov K, Willis J, Boothman D, Tilgen W, and Reichrath J. Challenge and promise: roles for clusterin in pathogenesis, progression and therapy of cancer. Cell Death Differ 13: 12-19, 2006.
150. Shih I, Salani R, Fiegl M, Wang T, Soosaipillai A, Marth C, Muller-Holzner E, Gastl G, Zhang Z, and Diamandis E. Ovarian cancer specific kallikrein profile in effusions. Gynecol Oncol 105: 501-507, 2007.
151. Skubitz A, Bast RJ, Wayner E, Letourneau P, and Wilke M. Expression of alpha 6 and beta 4 integrins in serous ovarian carcinoma correlates with expression of the basement membrane protein laminin. Am J Pathol 148: 1445-1461, 1996.
187
152. Sleat D, Wiseman J, El-Banna M, Price S, Verot L, Shen M, Tint G, Vanier M, Walkley S, and Lobel P. Genetic evidence for nonredundant functional cooperativity between NPC1 and NPC2 in lipid transport. Proc Natl Acad Sci U S A 101: 5886-5891, 2004.
153. Slotman B, and Rao B. Ovarian cancer (review). Etiology, diagnosis, prognosis, surgery, radiotherapy, chemotherapy and endocrine therapy. Anticancer Res 8: 417-434, 1988.
154. Soslow R. Histologic subtypes of ovarian carcinoma: an overview. Int J Gynecol Pathol 27: 161-174, 2008.
155. St Croix B, Rago C, Velculescu V, Traverso G, Romans K, Montgomery E, Lal A, Riggins G, Lengauer C, Vogelstein B, and Kinzler K. Genes expressed in human tumor endothelium. Science 289: 1197-1202, 2000.
156. Steen H, and Mann M. The ABC's (and XYZ's) of peptide sequencing. Nat Rev Mol Cell Biol 5: 699-711, 2004.
157. Subramanian A, Sharma A, and Mokbel K. Insulin-like growth factor binding proteins and breast cancer. Breast Cancer Res Treat 107: 181-194, 2008.
158. Sundfeldt K, Piontkewitz Y, Ivarsson K, Nilsson O, Hellberg P, Brannstrom M, Janson P, Enerback S, and Hedin L. E-cadherin expression in human epithelial ovarian cancer and normal ovary. Int J Cancer 74: 275-280, 1997.
159. Suzuki K, and Hayashi T. Protein C and its inhibitor in malignancy. Semin Thromb Hemost 33: 667-672, 2007.
160. Tagliabue E, Ghirelli C, Squicciarini P, Aiello P, Colnaghi M, and Menard S. Prognostic value of alpha 6 beta 4 integrin expression in breast carcinomas is affected by laminin production from tumor cells. Clin Cancer Res 4: 407-410, 1998.
161. Tani T, Karttunen T, Kiviluoto T, Kivilaakso E, Burgeson R, Sipponen P, and Virtanen I. Alpha 6 beta 4 integrin and newly deposited laminin-1 and laminin-5 form the adhesion mechanism of gastric carcinoma. Continuous expression of laminins but not that of collagen VII is preserved in invasive parts of the carcinomas: implications for acquisition of the invading phenotype. Am J Pathol 149: 781-793, 1996.
162. Teneriello M, Ebina M, Linnoila R, Henry M, Nash J, Park R, and Birrer M. p53 and Ki-ras gene mutations in epithelial ovarian neoplasms. Cancer Res 53: 3103-3108, 1993.

188
163. Tian L, Lappalainen J, Autero M, Hanninen S, Rauvala H, and Gahmberg C. Shedded neuronal ICAM-5 suppresses T-cell activation. Blood 111: 3615-3625, 2008.
164. Tonin P, Hudson T, Rodier F, Bossolasco M, Lee P, Novak J, Manderson E, Provencher D, and Mes-Masson A. Microarray analysis of gene expression mirrors the biology of an ovarian cancer model. Oncogene 20: 6617-6626, 2001.
165. Tornos C, Silva E, Ordonez N, Gershenson D, Young R, and Scully R. Endometrioid carcinoma of the ovary with a prominent spindle-cell component, a source of diagnostic confusion. A report of 14 cases. Am J Surg Pathol 19: 1343-1353, 1995.
166. Tuxen M, Soletormos G, and Dombernowsky P. Tumor markers in the management of patients with ovarian cancer. Cancer Treat Rev 21: 215-245, 1995.
167. Vance J. Lipid imbalance in the neurological disorder, Niemann-Pick C disease. FEBS Lett 580: 5518-5524, 2006.
168. Vang R, Gown A, Barry T, Wheeler D, and Ronnett B. Immunohistochemistry for estrogen and progesterone receptors in the distinction of primary and metastatic mucinous tumors in the ovary: an analysis of 124 cases. Mod Pathol 19: 97-105, 2006.
169. Vang R, Gown A, Barry T, Wheeler D, Yemelyanova A, Seidman J, and Ronnett B. Cytokeratins 7 and 20 in primary and secondary mucinous tumors of the ovary: analysis of coordinate immunohistochemical expression profiles and staining distribution in 179 cases. Am J Surg Pathol 30: 1130-1139, 2006.
170. Wang H, Rosen D, Wang H, Fuller G, Zhang W, and Liu J. Insulin-like growth factor-binding protein 2 and 5 are differentially regulated in ovarian cancer of different histologic types. Mod Pathol 19: 1149-1156, 2006.
171. Wang Y, Wu R, Cho K, Shedden K, Barder T, and Lubman D. Classification of cancer cell lines using an automated two-dimensional liquid mapping method with hierarchical clustering techniques. Mol Cell Proteomics 5: 43-52, 2006.
172. Whittemore A. Characteristics relating to ovarian cancer risk: implications for prevention and detection. Gynecol Oncol 55: S15-19, 1994.
189
173. Williams T, Toups K, Saggese D, Kalli K, Cliby W, and Muddiman D. Epithelial ovarian cancer: disease etiology, treatment, detection, and investigational gene, metabolite, and protein biomarkers. J Proteome Res 6: 2936-2962, 2007.
174. Wulfkuhle J, Liotta L, and Petricoin E. Proteomic applications for the early detection of cancer. Nat Rev Cancer 3: 267-275, 2003.
175. Xie M, Motoo Y, Su S, Mouri H, Ohtsubo K, Matsubara F, and Sawabu N. Expression of clusterin in human pancreatic cancer. Pancreas 25: 234-238, 2002.
176. Xu S, Benoff B, Liou H, Lobel P, and Stock A. Structural basis of sterol binding by NPC2, a lysosomal protein deficient in Niemann-Pick type C2 disease. J Biol Chem 282: 23525-23531, 2007.
177. Yin B, Dnistrian A, and Lloyd K. Ovarian cancer antigen CA125 is encoded by the MUC16 mucin gene. Int J Cancer 98: 737-740, 2002.
178. Young R, Prat J, and Scully R. Ovarian endometrioid carcinomas resembling sex cord-stromal tumors. A clinicopathological analysis of 13 cases. Am J Surg Pathol 6: 513-522, 1982.
179. Yu L. The structure and function of Niemann-Pick C1-like 1 protein. Curr Opin Lipidol 19: 263-269, 2008.
180. Zhang L, Ying W, Mao Y, He H, Liu Y, Wang H, Liu F, Wang K, Zhang D, Wang Y, Wu M, Qian X, and Zhao X. Loss of clusterin both in serum and tissue correlates with the tumorigenesis of esophageal squamous cell carcinoma via proteomics approaches. World J Gastroenterol 9: 650-654, 2003.
181. Zhu Y, Wu R, Sangha N, Yoo C, Cho K, Shedden K, Katabuchi H, and Lubman D. Classifications of ovarian cancer tissues by proteomic patterns. Proteomics 6: 5846-5856, 2006.
182. Zurawski VJ, Orjaseter H, Andersen A, and Jellum E. Elevated serum CA 125 levels prior to diagnosis of ovarian neoplasia: relevance for early detection of ovarian cancer. Int J Cancer 42: 677-680, 1988.