discrete choice modeling for bundled automobile insurance policies
TRANSCRIPT

DISCRETE CHOICE MODELING FOR BUNDLED AUTOMOBILE INSURANCE POLICIES
Chieh-Hua WEN Chairman and Associate Professor Department of Traffic and TransportationEngineering and Management Feng Chia University 100, Wenhwa Rd., Seatwen, Taichung, Taiwan40724, R.O.C. Fax: +886-4-2452-0678 Email: [email protected]
Ming-Jyh WANG Instructor (Corresponding Author) Department of Insurance Chaoyang University of Technology, Taiwan Ph.D. Candidate Institute of Traffic and Transportation, National Chiao Tung University, Taiwan Fax: +886-2-2349-4953 Email: [email protected]
Lawrence W. LAN Professor Institute of Traffic and Transportation National Chiao Tung University, Taiwan Fax: +886-2-2349-4953 E-mail: [email protected]
Abstract: This paper develops a multinomial logit (MNL) model to identify important factors affecting the selection of automobile insurance policies (AIPs), which are characterized with high similarity among the bundled alternatives. Various nested logit (NL) model specifications are attempted to elucidate the choice behaviors for these highly similar auto insurance products. Some 3,000 voluntary automobile insurance records, randomly drawn from a non-life insurance company in Taiwan, are used to conduct the empirical study. The estimation result of the preferred MNL model shows that vehicle usage, engine capacity, imported/domestic vehicle, and number of claims are significant factors influencing one’s selection of AIPs. Owners of newer vehicles, of larger engine capacities, of imported vehicles, and of more insurance claims tend to purchase wider coverage of insurance packages. The NL models confirm that the bundled AIPs are similar and highly correlated products. The empirical results also provide evidence of adverse selection in automobile insurance market -- the wider the insurance coverage, the less motivation the insured would reduce the number of claims (or equivalently, prevent the accidents). Key Words: automobile insurance policies, asymmetric information, adverse selection, discrete choice models 1. INTRODUCTION The potential risks of using an automobile involve damage to one's own and others’ vehicles and properties in collision, vandalism, theft and related loss, and injuries to driver, passengers and the third parties. Car owners often purchase appropriate automobile insurance policies (AIPs) to cover such potential risks so as to reduce the personal worry or stress incurred by the consequences of any traffic accident. In compliance with the law, the auto owners in many countries are required to purchase compulsory AIPs to protect themselves from lawsuits when involving damage and injuries (Murray et al., 1994). The insured in essential just expect their
Journal of the Eastern Asia Society for Transportation Studies, Vol. 6, pp. 1914 - 1928, 2005
1914
insurance to cover what is supposed to do. Namely, the car owners normally desire a policy that can provide protection through the reimbursement to their claims and that is accompanied with good service at reasonable price. They do not seem to care about the details of the insurance policies; instead, they very likely rely on others (e.g., the dealers) to make the selection decisions for them, or at least to provide recommendations on such issues as limits, deductibles and other coverage. The information of AIP market is asymmetric -- the insurers may understand the “terms and conditions” much better than the insured; but the insured certainly understand the “real risk of their own driving behaviors” much better than the insurers. Compared with the insurers, the insured may not have sufficient knowledge about the AIP products and they may even misunderstand the exact protection offered by the policies. Although the AIP products themselves are completely visible, certain aspects such as policy clauses, calculation of premiums, and degrees of coverage do require professional knowledge to understand. This asymmetric information frequently leads to an “adverse selection” phenomenon (from insurers’ perspectives), which further complicates the insurance provision (Jee, 1989; Landsberger and Meilijson, 1994; Lewis and Sappington, 1995; Ligon and Thistle, 1996; Inderst and Wambach, 2001; Ania et al., 2002; Theilen, 2003). By definition, more risk-averse persons demand for more insurance coverage. Adverse selection is the tendency of persons with higher-than-average chance of loss to seek insurance at standard rates, which, if not controlled by underwriting, would result in higher-than-expected loss levels. The high-risk drivers would choose for auto insurance at lower (standard) rates; a driver with higher loss probability or higher degree of risk aversion would choose for lower deductible; these are two good examples of adverse selection of AIPs (Smith and Head, 1978; Schlesinger, 1981; Dahlby and Riley, 1983; Dellaert, et al., 1990; Dionne and Doherty, 1994; Venezia, 1998; Artis et al., 2002;). Another example of adverse selection was found where either a tort system or a no-fault system of compensation being provided, the high-risk drivers would prefer to choose the no-fault system, which was associated with higher levels of uninsured motorists (Carr, 1989; Ma and Schmit, 2000; Devlin, 2002; Schmit and Yeh, 2003). The AIPs in many countries are characterized with complicated designs, most of which are in bundled packages. Different bundled packages provide different degrees of protection (coverage). New policies and new extended coverage are often provided by the insurers. The bundled AIP alternatives have high degrees of similarity, it is therefore essential to develop appropriate models that can explain the purchasing behaviors of similar bundled products. Most previous studies of automobile insurance have employed simple statistical methods to deal only with the insurance sold as a single policy. Little has been devoted to the choices when the insured are confronted by similar bundled packages. Sherden (1984) examined the effect of price, income, and perceived risk on the demand for automobile insurance and found that price and income were generally inelastic. Murray et al. (1994) found price was the most important factor in choosing the AIPs. Consumers may be aware of several factors that either increase their premiums or be available for potential discounts. However, there still exist some coverage factors of which they are unaware and these factors could have significantly decreased the insurance costs (e.g., deductibles, stacking, uninsured motorist coverage options). Most studies agree that the AIP decisions are affected by risk perceptions (Slovic, 1987, 1992;
Journal of the Eastern Asia Society for Transportation Studies, Vol. 6, pp. 1914 - 1928, 2005
1915

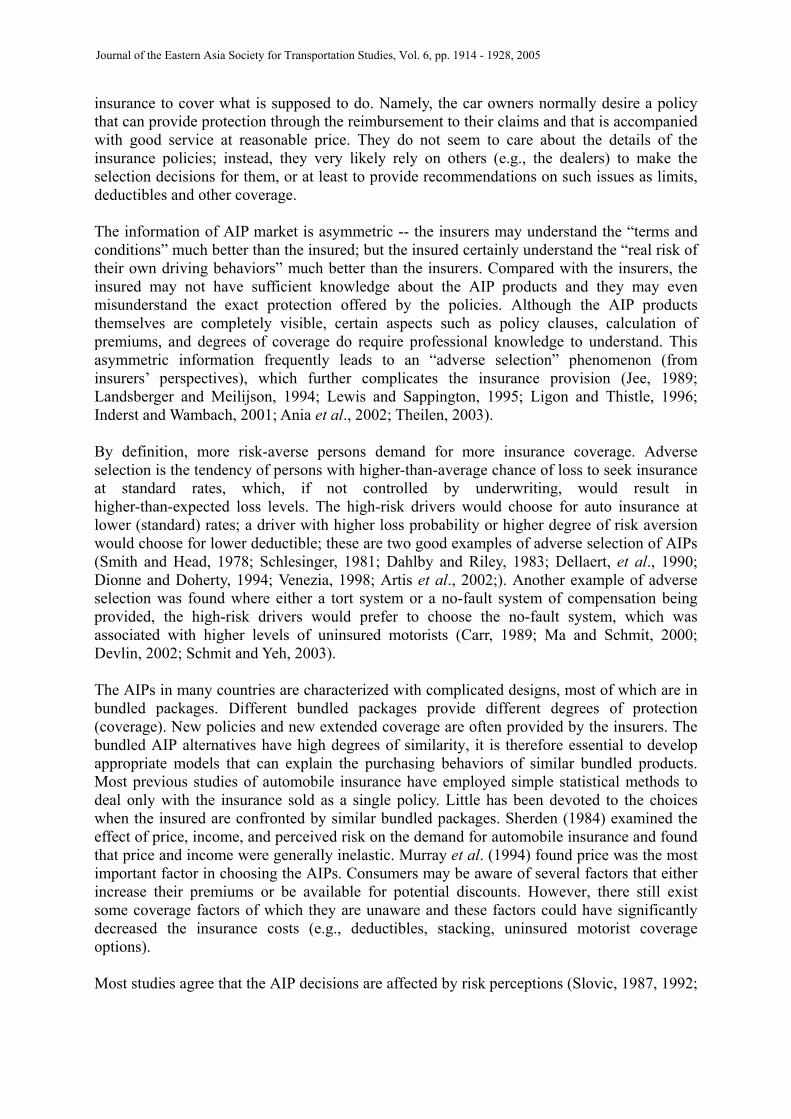
Teigen et al., 1988; Keown, 1989; Bastide et al., 1989; Wildavsky and Dake, 1990; Mechitov and Rebrik, 1990; Kleinhesselink and Rosa, 1991; Hinman et al., 1993; Rohrmann, 1994; Murray et al., 1994; Rundmo, 1996). The relationship between an individual’s attitude toward risk and the insurance decision can be partially explained in terms of expected utility theory. People are willing to purchase insurance, thereby paying a risk premium, in order to eliminate the possibility of a large loss in the future. Schlesinger (1981) and Hayakawa (2000) found that insurance demand and risk aversion were positively correlated. It is still not generally clear that what factors would really affect ones’ selection of AIP bundles and that whether adverse selection phenomenon is existent in a complicated voluntary automobile insurance market. To gain deeper insights, this paper attempts to develop appropriate econometric models to identify the important factors affecting the selection of AIPs and to elucidate the choice behaviors in purchasing the AIP bundles, which are characterized with asymmetric information and high similarity. The present paper focuses only on voluntary insurance for passenger cars. Compulsory automobile liability insurance is not addressed. Section 2 introduces the current practices of automobile insurance. Section 3 depicts the choice modeling. Section 4 conducts an empirical study. Section 5 presents the estimation results. Some policy implications and discussions follow. 2. THE PRACTICES OF AUTOMOBILE INSURANCE Automobile insurance represents nearly 50 percent of property/liability insurance premium volume in many countries (Ma and Schmit, 2000). Two different systems of automobile insurance are commonly in practice: compulsory and voluntary systems. Since automobile accident reparation is an important issue from social security perspectives, many governments have promulgated laws on the “compulsory” automobile insurance to provide basic compensation to person(s) injured in traffic accidents. For instance, the Massachusetts State passed the first U.S. Compulsory Automobile Insurance Law in 1927. Today, 43 States and the District of Columbia mandate some versions of compulsory automobile insurance, while the remaining seven States have financial responsibility laws (Pataki and Serio, 2004). In Japan, compulsory automobile liability insurance (CALI) has been implemented since 1955 under the Automobile Liability Security Law. The CALI covers only liability for bodily injury and the law specifies the limit of liability for death, grades of permanent disability and bodily injury (NLIRO, 2004). Automobile insurance in Taiwan is still a regulated market in which the rates, clauses and new policies are subject to approved by the government. Figure 1 depicts the current practices of AIPs in Taiwan, which also comprises voluntary and compulsory systems. In July 1996, the government announced a major change in voluntary automobile insurance by dividing the voluntary AIPs into six policies, including physical damage type A, type B, type C, theft loss coverage, third party liability, and passenger liability. For the compulsory automobile liability insurance, however, it was not implemented until 1998 when the Compulsory Automobile Liability Insurance Law went into enforcement. The compulsory insurance only covers liability for bodily injury; most car owners therefore also purchase voluntary AIPs with coverage of other liability and vehicle damage. The voluntary AIPs in general offer a multitude of optional coverage policies. In some
Journal of the Eastern Asia Society for Transportation Studies, Vol. 6, pp. 1914 - 1928, 2005
1916

countries, these include “comprehensive coverage” offering the protection without regard to fault for damage to one’s own car from all causes other than collision, such as theft (of the car itself or its parts), fire, flood, windstorm, glass breakage, vandalism, hitting or being hit by an animal, or by falling or flying objects. In Taiwan, however, comprehensive coverage as such does not exist; instead, a menu of bundles with combinations of liability insurance and vehicle damage insurance can be chosen. Liability insurance covers harm to others and their property caused by a vehicle when the driver is at fault. This liability coverage protects the owner (and anyone driving the car with the owner's permission) if a claim is made against the driver by another person, alleging the driver who is negligent at fault. Physical damage insurance, on the other hand, contain physical damage type A, type B, type C, theft loss coverage, and others.
Auto Insurance
、
Voluntary Auto
Insurance
Compulsory Liability Insurance
Extended Coverage:
Drivers’ personal injury
Vehicle Damage
Insurance
Liability
Insurance Passenger Liability
Extended Coverage
Physical Damage Type A
Physical Damage Type B
Physical Damage Type C
Theft Loss
Bodily Injury and Property Damage Liability
Extended Coverage
Figure 1. Current practices of AIPs in Taiwan
Figure 2 further depicts the coverage of each type of physical damage. Type A covers the vehicle damage including collision, fire, lightning, struck by lightning, explode, missiles or fall objects, malicious mischief or vandalism and others factors excluding theft loss. Type B covers the vehicle damage almost the same as type A except for vandalism and loss. Type C covers only collision with another vehicle (damage from other objects and accidents not involving other vehicles are excluded). Therefore, the car owners in Taiwan desiring to transfer all possible risks of vehicle losses or damage should buy the bundle of physical damage type A plus theft loss coverage, which is roughly equivalent to the “comprehensive coverage” in U.S.
Journal of the Eastern Asia Society for Transportation Studies, Vol. 6, pp. 1914 - 1928, 2005
1917

丙 式
車碰車
Type CCollision
Type B1. Collision2. Fire3. Lightning, thunder
stroke (struck by lightning)
4. Explode5. Missiles or falling
objects
Type A1. Collision2. Fire3. Lightning , thunder
stroke (struck by lightning)
4. Explode5. Missiles or falling
objects6. Malicious mischief or
vandalism7. Others
Figure 2. Three types of physical damage coverage for voluntary AIPs in Taiwan
3. THE METHODOLOGIES In many marketing situations, consumers are able to customize a product or service by selecting individual features or items from a menu. An alternative is defined as any possible combination for features that could be selected from the menu. Thus, the total number of alternatives (i.e. possible outcomes of the decision process) may be very large. Theoretically, if the number of items on the menu is N, the number of possible combinations of those items (including the choice of none of them) is 2N. Discrete choice modeling techniques, which explicitly capture the full range of the alternatives from the menu, have been utilized (Ben-Akiva and Gershenfeld, 1998). Discrete choice models are derived under an assumption of utility-maximizing behavior by the decision-maker. Venezia (1984) used utility function approach to model the choice of a deductible and a claim policy for the risk adverse drivers. Artis et al. (2002) developed multinomial logit (MNL) and nested logit (NL) models to estimate the influence of the insured and claim characteristics on the probability of committing fraud. In this paper, we apply disaggregate choice modeling to identify important variables influencing the consumers’ choices for bundled AIPs. A rational consumer is assumed to choose an alternative with the highest utility. The utility of AIP bundled alternative i for the individual n is expressed as: in in in inU V Xε β ε′= + = + (1) where inV represents the observable components of alternative i by individual n; inε is unobservable (or error) components of alternative i by individual n; X is a vector of attributes (e.g., socioeconomic, vehicle and regional characteristics); β is a vector of unknown parameters reflecting the importance of X.
Journal of the Eastern Asia Society for Transportation Studies, Vol. 6, pp. 1914 - 1928, 2005
1918

The MNL model is employed in this study to identify important factors influencing the selection of AIP bundles, which is expressed as:
∑∈
=
n
jn
in
Cj
V
V
in eeP (2)
where inP denotes the probability of choosing alternative i in choice set nC by individual n. Notice that the independence from irrelevant alternatives (IIA) property of the MNL model will lead to erroneous prediction if the alternatives are highly correlated. In consideration of the high similarity of bundled AIPs, this paper therefore further uses the NL models to elucidate the choice behaviors. Consider a general two-level NL model with M groups of alternatives and Nm alternatives in each group. The probability that alternative i in group m is chosen is:
∑ ∑
∑
∑
×=×=
∈
∈
∈′
′
′
′
m Ni
V
Ni
V
Ni
V
V
mmii m
m
m
i
m
m
m
i
m
m
i
m
i
e
e
e
ePPP µ
µ
µ
µ
µ
µ
'
'
/ (3)
where /i mP is the probability of choosing alternative i conditional on choosing nest m; mP is the marginal probability of choosing nest m of which i is a member; Vi is the utility associated with alternative i in nest m; Nm is the set of all alternatives included in nest m; mµ is the logsum parameter of nest m. The NL model is consistent with utility maximization if the conditions 0 < mµ ≤ 1 are satisfied for all mµ . If all the logsum parameters are equal to one, the NL model collapses to the MNL (Daly and Zachary, 1978; McFadden, 1978; Williams, 1977). 4. THE EMPIRICAL DATA The data set comprises 3,000 insured records drawn from a non-life insurance company in Taiwan in 2003. The insured records are selected randomly based on the national IDs of individuals who purchase the six voluntary AIPs including third party liability (TPL), passenger liability (PL), physical damage type A (PD(A)), physical damage type B (PD(B)), physical damage type C (PD(C)), and theft loss coverage (TC); thus in theory, the number of possible combinations of alternatives is 64. Because many bundled alternatives are not provided, or the bundles have too few or no buyers, this paper only analyzes the top nine mostly popular alternatives, which contain 1,780 individuals. Table 1 presents the sample distribution, of which 50.39% are female, about 85% age between 30 and 59, 76% are single, and 87% have no claim records. The major purchase channel is from auto dealers (83%). 31% are imported automobiles. 11% use new cars (less than one
Journal of the Eastern Asia Society for Transportation Studies, Vol. 6, pp. 1914 - 1928, 2005
1919

year) while 65% use old cars (more than 4 years). Table 1. Sample distribution
Characteristics Insured Percentage female 897 50.39%
Gender male 883 49.61% 20-29 139 7.81% 30-39 513 28.82% 40-49 541 30.39% 50-59 452 25.39% 60-69 107 6.01% 70-79 16 1.57%
Age
80-89 12 0.67% married 427 23.99%
Marital Status single 1353 76.01%
no claim 1549 87.02% 1 claim 180 10.11% 2 claims 44 2.47% 3 claims 5 0.28%
Claim record
3+ claims 2 0.11% Northern Taiwan 550 30.90% central Taiwan 778 43.71% Region
Southern Taiwan 452 25.39% auto dealer 1471 82.64%
Insurance broker 97 5.45% Channel of purchasing other 212 11.91%
domestic 1227 68.93% Imported or domestic Vehicle
imported 553 31.07% 0-1 year 198 11.12% 1-2 year 159 8.93% 2-3 year 125 7.02% 3-4 year 140 7.87%
Vehicle usage
4+ year 149 65.06% The frequency distribution of nine alternatives is presented in Table 2. Note that the top one (51.52%) is alternative 1 -- the third party liability (TPL), which provides the basic protection for bodily injured/property damage liability and this is the only single policy not in bundled form. The top two (13.99%) is alternative 4, which is bundled by three AIPs: third party liability, passenger liability and theft loss coverage. Due to data availability, the explanatory variables in this study are limited to age, gender, marital status, claim record, region, vehicle age, engine capacity, deductible and channel of purchasing. Other personal attributes (such as name, address, telephone number, income, education, occupation, religion, etc.) are confidential by law and not permitted to access. The definitions of the explanatory variables are summarized in Table 3.
Journal of the Eastern Asia Society for Transportation Studies, Vol. 6, pp. 1914 - 1928, 2005
1920

Table 2. Nine bundled AIP alternatives analyzed in this study Bundled AIP Alternatives Number of individuals Percentage 1. TPL 917 51.52 2. TPL + PL 164 9.21 3. PL + TC 127 7.13 4. TPL + PL + TC 249 13.99 5. TPL + TC + PD(C) 33 1.85 6. TPL + PL + TC + PD(C) 43 2.42 7. TPL + TC + PD(B) 60 3.37 8. TPL + PL + TC + PD(B) 139 7.81 9. TPL + PL + TC + PD(A) 48 2.70 Total 1,780 100.00 Notations: third party liability (TPL), passenger liability (PL), physical damage type A (PD(A)), physical damage type B (PD(B)), physical damage type C (PD(C)), and theft loss coverage (TC) Table 3. Definitions of explanatory variables
Characteristics Variables Definitions Gender 1 = male, 0 = female
Marital status 1 = single, 0 =married Age a continuous variable
Claim record 0 claim 1 claim
2+ claims
Reference group
1 = one claim record, 0 = otherwise 1= two or above claim record, 0 = otherwise
Socioeconomics
Channel of purchasing 1 = auto dealer, 0 = otherwise Vehicle usage
0-1 year 1-2 year 2-3 year 3-4 year 4+ year
1 = 0-1 year, 0 = otherwise 1 = 1-2 years, 0 = otherwise 1 = 2-3 years, 0 = otherwise 1 = 3-4 years, 0 = otherwise
Reference group Imported or domestic
vehicle 1 = imported, 0 = domestic
Vehicles
Engine capacity a continuous variable
Regions
Northern Taiwan Central Taiwan
Southern Taiwan
1 = north, 0 = otherwise 1 = central, 0 = otherwise
Reference group 5. THE ESTIMATION RESULTS The estimation result of the preferred MNL model is presented in Table 4. It indicates that vehicle usage, engine capacity, imported/domestic vehicle and number of claims are significant factors affecting the choice of bundled AIPs. Age, gender and marital status are insignificant. Owners of newer cars, of larger engine capacities, of imported cars tend to purchase the bundles with physical damage type A or B, which provides wider coverage. The same result is also found in the number of claims. The insured with more claims tend to purchase the bundles with physical damage type A or B, suggesting that the high-risk insured are likely to demand more insurance coverage than the low-risk ones. This provides evidence of adverse selection phenomenon -- the wider the insurance coverage, the less motivation for the insured attempt to reduce the number of claims (or prevent the accidents). We attempt all the two-level and three-level NL models and only yield eleven models, as
Journal of the Eastern Asia Society for Transportation Studies, Vol. 6, pp. 1914 - 1928, 2005
1921

shown in Figures 3 and 4, which have reasonable logsum parameters and significantly reject the MNL model at a high level of significance. Table 4 illustrates the estimation results for three selected NL models. The results of NL models confirm that bundled AIP alternatives are very similar and highly correlated. Table 4. The estimation results of the MNL and NL models
NL Model 1 (Two nests)
NL Model 2 (Two nests)
NL Model 3 (One nest) Variables MNL Model
(27),(1345689) (237),(145689) (12389) Alternative specific constants
TPL + PL -2.49 (-8.36)
-2.38 (-7.91)
-1.78 (-5.97)
-0.178 (-1.18)
TPL + TC -0.37 (-2.19)
-0.25 (-2.18)
-0.44 (-2.84)
0.35 (1.01)
TPL+PL+ TC -1.43 (-18.48)
-0.92 (-6.96)
-0.91 (-6.66)
-1.80 (-20.38)
TPL + TC + PD(C) -3.68 (-17.06)
-2.38 (-6.76)
-2.32 (-6.45)
-4.02 (-17.98)
TPL + PL +TC + PD(C) -3.31 (-18.38)
-2.13 (-6.81)
-2.09 (-6.46)
-3.67 (-18.75)
TPL + TC + PD(B) -4.13 (-16.15)
-3.29 (-8.91)
-2.89 (-7.93)
-4.26 (-15.67)
TPL +PL + TC + PD(B) -5.28 (-12.85)
-3.47 (-6.48)
-3.43 (-6.30)
-0.51 (-1.20)
TPL +PL + TC + PD(A) -7.81 (-12.25)
-5.10 (-6.46)
-5.01 (-6.24)
-0.72 (-1.20)
Vehicle usage (0-1 year)
TPL+ TC + PD(B) 3.06 (9.28)
2.07 (5.15)
2.04 (6.27)
2.39 (6.86)
TPL + PL + TC + PD(B) 2.60 (9.70)
1.68 (5.84)
1.65 (5.70)
0.34 (1.20)
TPL + PL + TC + PD(A) 2.19 (5.79)
1.43 (4.54)
1.41 (4.51)
0.29 (1.19)
Vehicle usage (1-2 year)
TPL + TC + PD(C) 2.31 (5.93)
1.47 (4.59)
1.41 (4.42)
1.84 (4.78)
TPL + PL + TC +PD(C) 1.93 (5.22)
1.23 (4.23)
1.17 (4.03)
1.51 (4.15)
TPL + TC + PD(B) 2.56 (6.42)
1.54 (3.87)
1.81 (5.57)
1.95 (4.68)
TPL + PL +TC + PD(B) 2.90 (10.23)
1.88 (6.04)
1.82 (5.82)
0.35 (1.20)
Vehicle usage (2-3 year)
TPL + TC -0.67 (2.07)
-0.40 (-1.83)
-0.71 (-2.90)
-0.11 (-1.14)
TPL + PL +TC 1.19 (5.59)
0.78 (4.38)
0.75 (4.29)
1.18 (5.69)
Vehicle usage (3-4 year)
TPL + PL 0.87 (2.80)
0.72 (2.40)
0.27 (0.99)
0.02 (0.65)
TPL + TC -2.14 (-10.03)
-1.37 (-5.83)
-1.50 (-7.07)
-0.27 (-1.20)
Imported vehicle
Journal of the Eastern Asia Society for Transportation Studies, Vol. 6, pp. 1914 - 1928, 2005
1922

TPL + TC -0.63 (-2.55)
-0.40 (-2.37)
-0.42 (-2.62)
-0.06 (-1.09)
TPL + PL + TC + PD(B) 0.49 (-2.16)
0.31 (2.01)
0.32 (2.06)
0.46 (1.00)
TPL + PL + TC + PD(A) 1.60 (3.84)
1.02 (3.29)
1.00 (3.26)
0.15 (1.15)
Engine capacity
TPL + PL + TC + PD(B) 0.78 (4.60)
0.005 (4.16)
0.005 (4.16)
0.001 (1.15)
TPL + PL + TC + PD(A) 0.13 (5.87)
0.009 (4.70)
0.009 (4.68)
0.001 (1.18)
Claim record (1 claim)
TPL + TC + PD(B) 2.11 (6.66)
1.48 (4.67)
1.22 (4.15)
1.34 (4.67)
TPL + PL + TC + PD(B) 2.69 (10.88)
1.75 (6.11)
1.70 (5.95)
0.27 (1.20)
TPL + PL + TC + PD(A) 2.78 (7.58)
1.82 (5.40)
1.77 (5.27)
0.27 (1.19)
Claim record (2+ claims)
TPL + PL + TC + PD(B) 2.81 (7.76)
2.11 (6.06)
2.11 (5.85)
0.45 (1.21)
TPL + PL + TC + PD(A) 2.73 (4.88)
1.99 (4.16)
1.97 (4.12)
0.39 (1.20)
Logsum parameter (t-value versus 1)
(27), (237), or (12389) nest 1.0 0.62 (3.22)
0.63 (4.07)
0.11 (9.32)
0.64 (4.09)
0.53 (4.52)
Log-likelihood value At zero -3911.06 -3911.06 -3911.06 -3911.06
At market share -2847.30 -2847.30 -2847.30 -2847.30 At convergence -2452.93 -2446.46 -2444.97 -2396.81
Likelihood ratio index Vs. zero 0.3728 0.3745 0.3749 0.3872 Vs. market share 0.1385 0.1401 0.1413 0.1582
Journal of the Eastern Asia Society for Transportation Studies, Vol. 6, pp. 1914 - 1928, 2005
1923

3 7 1 2 4 5 6 8 9
2 3 7 1 4 5 6 8 9
2 5
2 7
2 8 1 3 4 5 6 7 9
1 3 4 5 6 8 9
1 3 4 6 7 8 9
2 5 9 1 3 4 6 7 8
2 3 8 1 4 5 6 7 9
LL(ß)= -2448.49
LL(ß)= -2447.32
LL(ß)= -2444.97
LL(ß)= -2446.46
LL(ß)= -2446.79
LL(ß)= -2451.34
LL(ß)= -2447.99
Figure 3. The NL models with two nests
Journal of the Eastern Asia Society for Transportation Studies, Vol. 6, pp. 1914 - 1928, 2005
1924

6. POLICY IMPLICATIONS AND DISCUSSIONS Traditionally, some voluntary automobile insurance buyers in Taiwan have wrongly believed that paying the premiums without receiving money back from claims is a waste of money. This problem is especially serious associated with purchases of the bundled package containing physical damage type A. Consequently, the loss ratio of automobile insurance due to “malicious mischief or vandalism of vehicles” exceeds 130% in the bundle with physical damage type A. Due to the increasing insurance expense, consumers behave in two different ways. One group values their vehicles very much and makes no claims, while the other group applies for claims, mostly caused by vandalism, in which the vehicle owners typically file a claim in collaboration with a repair workshop near the end of the insurance period. Our study
1 2 3 5 7 8 9 4 6
LL(ß)= -2419.14
LL(ß)= -2413.17
LL(ß)= -2414.54
LL(ß)= -2398.63
1 2 3 7 8 9
1 2 3 7 8
1 2 3 8 9
4 5 6
4 5 6 7
4 5 6 9
Figure 4. The NL models with one nest
Journal of the Eastern Asia Society for Transportation Studies, Vol. 6, pp. 1914 - 1928, 2005
1925

indicate that the adverse selection phenomenon exhibit in Taiwan automobile insurance market -- the wider the insurance coverage, the lower the motivation for the insured to try to reduce the number of claims. Age, gender, marital status, purchase channel, and regional variables are insignificant in this study. The insignificant gender factor may be ascribed to the insurance rating system in Taiwan, in which a male can evade higher costs by purchasing auto insurance under his spouse or daughter’ s name. In Taiwan, auto dealers also sell the insurance policies and over 70% of the consumers have obtained the voluntary AIPs from the dealers. Consumers normally do not care from what source they obtain the AIPs and this is demonstrated by the fact that the purchase channel variable is not significant. Finally, Taiwan is a narrow, small island country with little regional variance. Naturally the regional variable is of little significance. Of the large number of possible combinations of the six voluntary AIPs currently practiced in Taiwan, many bundled packages are still not provided or purchased. Our study methodologies may provide useful tools in predicting the patronage of any new bundled AIP packages. The results by various NL specifications have confirmed that the bundled AIPs alternatives have high degrees of similarity in nature. A paired combinatorial logit (PCL) modeling technique proposed by Koppelman and Wen (2000) might be promising in the future study of choice behaviors for similar bundled AIPs alternatives. In this paper, 3,000 insured records are tested. A larger sample size can be explored in the future study.
Journal of the Eastern Asia Society for Transportation Studies, Vol. 6, pp. 1914 - 1928, 2005
1926

