discrete vernier tuning in terahertz quantum cascade ...eprints.whiterose.ac.uk/79584/1/kundu et al...
TRANSCRIPT

Discrete Vernier tuning in terahertz quantum cascade lasers using coupled cavities
Iman Kundu,* Paul Dean, Alexander Valavanis, Li Chen, Lianhe Li, John E. Cunningham, Edmund H. Linfield, and A. Giles Davies
School of Electronic and Electrical Engineering, University of Leeds, Leeds LS2 9JT, UK *[email protected]
Abstract: Discrete Vernier frequency tuning of terahertz quantum cascade lasers is demonstrated using a device comprising a two-section coupled-cavity. The two sections are separated by a narrow air gap, which is milled after device packaging using a focused ion beam. One section of the device (the lasing section) is electrically biased above threshold using a short current pulse, while the other section (the tuning section) is biased below threshold with a wider current pulse to achieve controlled localized electrical heating. The resulting thermally-induced shift in the longitudinal cavity modes of the tuning section is engineered to produce either a controllable blue shift or red shift of the emission frequency. This discrete Vernier frequency tuning far exceeds the tuning achievable from standard ridge lasers, and does not lead to any corresponding change in emitted power. Discrete tuning was observed over bandwidths of 50 and 85 GHz in a pair of devices, each using different design schemes. Interchanging the lasing and tuning sections of the same devices yielded red shifts of 20 and 30 GHz, respectively.
©2014 Optical Society of America
OCIS codes: (140.5965) Semiconductor lasers, quantum cascade; (140.3600) Lasers, tunable.
References and links 1. R. Köhler, A. Tredicucci, F. Beltram, H. E. Beere, E. H. Linfield, A. G. Davies, D. A. Ritchie, R. C. Iotti, and F.
Rossi, “Terahertz semiconductor-heterostructure laser,” Nature 417(6885), 156–159 (2002). 2. L. Li, L. Chen, J. Zhu, J. Freeman, P. Dean, A. Valavanis, A. G. Davies, and E. H. Linfield, “Terahertz quantum
cascade lasers with >1 W output powers,” Electron. Lett. 50(4), 309–311 (2014). 3. P. H. Siegel, “Terahertz technology,” IEEE Trans. Microw. Theory Tech. 50(3), 910–928 (2002). 4. A. G. Davies, A. D. Burnett, W. Fan, E. H. Linfield, and J. E. Cunningham, “Terahertz spectroscopy of
explosives and drugs,” Mater. Today 11(3), 18–26 (2008). 5. M. S. Vitiello and A. Tredicucci, “Tunable Emission in THz Quantum Cascade Lasers,” IEEE Trans. Terahertz
Sci. Technol. 1(1), 76–84 (2011). 6. Q. Y. Lu, N. Bandyopadhyay, S. Slivken, Y. Bai, and M. Razeghi, “Widely tuned room temperature terahertz
quantum cascade laser sources based on difference-frequency generation,” Appl. Phys. Lett. 101(25), 251121 (2012).
7. Q. Y. Lu, N. Bandyopadhyay, S. Slivken, Y. Bai, and M. Razeghi, “High performance terahertz quantum cascade laser sources based on intracavity difference frequency generation,” Opt. Express 21(1), 968–973 (2013).
8. S. Chakraborty, O. Marshall, C. W. Hsin, M. Khairuzzaman, H. Beere, and D. Ritchie, “Discrete mode tuning in terahertz quantum cascade lasers,” Opt. Express 20(26), B306–B314 (2012).
9. D. Turčinková, M. I. Amanti, F. Castellano, M. Beck, and J. Faist, “Continuous tuning of terahertz distributed feedback quantum cascade laser by gas condensation and dielectric deposition,” Appl. Phys. Lett. 102(18), 181113 (2013).
10. S. P. Khanna, M. Salih, P. Dean, A. G. Davies, and E. H. Linfield, “Electrically tunable terahertz quantum-cascade laser with a heterogeneous active region,” Appl. Phys. Lett. 95(18), 181101 (2009).
11. L. A. Coldren, G. A. Fish, Y. Akulova, J. S. Barton, L. Johansson, and C. W. Coldren, “Tunable semiconductor lasers: a tutorial,” J. Lightwave Technol. 22(1), 193–202 (2004).
12. T. S. Mansuripur, S. Menzel, R. Blanchard, L. Diehl, C. Pflügl, Y. Huang, J.-H. Ryou, R. D. Dupuis, M. Loncar, and F. Capasso, “Widely tunable mid-infrared quantum cascade lasers using sampled grating reflectors,” Opt. Express 20(21), 23339–23348 (2012).
#210360 - $15.00 USD Received 23 Apr 2014; revised 9 Jun 2014; accepted 19 Jun 2014; published 27 Jun 2014(C) 2014 OSA 30 June 2014 | Vol. 22, No. 13 | DOI:10.1364/OE.22.016595 | OPTICS EXPRESS 16595
13. L. A. Coldren and T. L. Koch, “Analysis and design of coupled-cavity lasers - Part I: Threshold gain analysis and design guidelines,” IEEE J. Quantum Electron. 20(6), 659–670 (1984).
14. L. A. Coldren and T. L. Koch, “Analysis and design of coupled-cavity lasers - Part II: Transient analysis,” IEEE J. Quantum Electron. 20(6), 671–682 (1984).
15. S. Höfling, J. Heinrich, J. P. Reithmaier, A. Forchel, J. Seufert, M. Fischer, and J. Koeth, “Widely tunable single-mode quantum cascade lasers with two monolithically coupled Fabry-Pérot cavities,” Appl. Phys. Lett. 89(24), 241126 (2006).
16. P. Fuchs, J. Seufert, J. Koeth, J. Semmel, S. Höfling, L. Worschech, and A. Forchel, “Widely tunable quantum cascade lasers with coupled cavities for gas detection,” Appl. Phys. Lett. 97(18), 181111 (2010).
17. L. A. Coldren, S. W. Corzine, and M. L. Masanovic, Diode Lasers and Photonic Integrated Circuits, Edition II, Wiley Series in Microwave and Optical Engineering (John Wiley & Sons, 2012).
18. S. Barbieri, J. Alton, H. E. Beere, J. Fowler, E. H. Linfield, and D. A. Ritchie, “2.9 THz quantum cascade lasers operating up to 70 K in continuous wave,” Appl. Phys. Lett. 85(10), 1674–1676 (2004).
19. L. Ajili, G. Scalari, D. Hofstetter, M. Beck, J. Faist, H. Beere, G. Davies, E. Linfield, and D. Ritchie, “Continuous-wave operation of far-infrared quantum cascade lasers,” Electron. Lett. 38(25), 1675–1676 (2002).
20. L. Ajili, J. Faist, H. Beere, D. Ritchie, G. Davies, and E. Linfield, “Loss-coupled distributed feedback far-infrared quantum cascade lasers,” Electron. Lett. 41(7), 419–421 (2005).
21. B. S. Williams, “Terahertz quantum-cascade lasers,” Nat. Photonics 1(9), 517–525 (2007). 22. Z. Yong-Gang, H. You-Jun, and L. Ai-Zhen, “Transient Thermal Analysis of InAlAs/InGaAs/InP Mid-Infrared
Quantum Cascade Lasers,” Chin. Phys. Lett. 20(5), 678–681 (2003). 23. C. A. Evans, D. Indjin, Z. Ikonić, P. Harrison, M. S. Vitiello, V. Spagnolo, and G. Scamarcio, “Thermal
modeling of terahertz quantum-cascade lasers: comparison of optical waveguides,” IEEE J. Quantum Electron. 44(7), 680–685 (2008).
24. H. Li, J. C. Cao, Y. J. Han, Z. Y. Tan, and X. G. Guo, “Temperature profile modelling and experimental investigation of thermal resistance of terahertz quantum-cascade lasers,” J. Phys. Appl. Phys. 42(20), 205102 (2009).
25. M. S. Vitiello, G. Scamarcio, V. Spagnolo, J. Alton, S. Barbieri, C. Worrall, H. E. Beere, D. A. Ritchie, and C. Sirtori, “Thermal properties of THz quantum cascade lasers based on different optical waveguide configurations,” Appl. Phys. Lett. 89(2), 021111 (2006).
26. M. S. Vitiello, G. Scamarcio, and V. Spagnolo, “Time-resolved measurement of the local lattice temperature in terahertz quantum cascade lasers,” Appl. Phys. Lett. 92(10), 101116 (2008).
27. R. Sharma, L. Schrottke, M. Wienold, K. Biermann, R. Hey, and H. T. Grahn, “Effect of stimulated emission on the transport characteristics of terahertz quantum-cascade lasers,” Appl. Phys. Lett. 99(15), 151116 (2011).
1. Introduction
Terahertz-frequency quantum cascade lasers (THz QCLs) are compact solid-state sources of coherent radiation in the 1–5 THz region of the electromagnetic spectrum [1], with output powers in excess of 1 W recently demonstrated [2]. The emission spectra of THz QCLs typically exhibit multiple discrete frequency modes characteristic of Fabry–Pérot (FP) cavities. However, widely-tunable (single-mode) THz QCLs would be ideally suited to many THz-sensing applications, including trace gas detection, atmospheric observations [3], and security screening [4]. Tunable THz QCLs have been demonstrated using various approaches including external cavity configurations [5], difference frequency generation using mid-infrared lasers [6,7], aperiodic grating structures [8], and by depositing nitrogen and dielectric layers onto distributed feedback structures [9]. Yet another approach towards this end has been through engineering of the active region by varying the growth parameters [10]. However, these techniques are limited by either complex experimental arrangements [5], low power emission [6,7], the need for complex design algorithms [8], or slow condensation/evaporation processes [9]. While tunability has also been demonstrated using sampled gratings at optical [11] and mid-infrared frequencies [12], the longer wavelengths in the THz region dictate that such single-cavity devices would scale to be several tens of millimeters long, and would suffer from excessive electrical heating. To date no technique has been demonstrated that enables THz QCLs to be tuned rapidly over a wide bandwidth without loss of output power.
Here we demonstrate discrete Vernier tuning using a simple two-section coupled-cavity geometry, similar to that used previously for both optical [13,14] and mid-IR lasers [15,16]. A monolithic THz QCL ridge cavity was etched using focused ion beam (FIB) milling to create two coupled FP cavities separated by a narrow air gap [Fig. 1(a)]. In this scheme, one of the
#210360 - $15.00 USD Received 23 Apr 2014; revised 9 Jun 2014; accepted 19 Jun 2014; published 27 Jun 2014(C) 2014 OSA 30 June 2014 | Vol. 22, No. 13 | DOI:10.1364/OE.22.016595 | OPTICS EXPRESS 16596

two sections (the ‘lasing section’) is electrically driven above the lasing threshold, while the other section is operated below threshold and acts as a ‘tuning section’. The lengths of the two sections and the air gap are designed such that the longitudinal FP modes of the respective sections coincide at a selected (‘resonant’) frequency [Fig. 1(b)]. The dominant lasing mode of the coupled cavity occurs at this frequency owing to the reduction in gain threshold [17].
A small perturbation to the frequency of the modes in either section of the device will detune the resonance, causing the dominant mode of the coupled-cavity to ‘hop’ to a different frequency [Fig. 1(b)], in a manner analogous to the Vernier effect. By appropriate choice of lengths for the two section, the discrete tuning range can be controlled, as well as the direction of the mode hopping, in order to obtain either a red or blue shift in frequency. In this work, the longitudinal modes of the tuning section are controlled by perturbing its refractive index through current-induced heating. Whilst this coupled-cavity approach can be used to achieve single mode emission with good side mode suppression ratio (SMSR), the intention of this present study is to demonstrate Vernier tuning of the spectral power distribution across closely spaced modes within the narrow gain bandwidth of our THz QCLs.
Fig. 1. (a) Illustration of a coupled cavity device. A long laser ridge has been etched post-packaging using FIB milling. The two laser sections are separately biased enabling independent electrical control of the sections. (b) Simulated normalized transmission in the lasing section (blue) and in the tuning and air gap sections (red) of the device. The length of each section is selected such that the longitudinal modes coincide at a resonant frequency of 2.745 THz (bottom panel). Illustration of the shift in the resonant frequency as the refractive index of the tuning section is perturbed (middle and top panel). The dominant mode of the coupled cavity, indicated by a black arrow in each case, shifts to a higher frequency.
2. Design of coupled cavity geometry
The coupled-cavity devices described in this work were adapted from standard THz QCL structures processed with non-segmented single-plasmon ridge waveguides. After initial processing and characterization of the standard waveguide structures, a transmission-matrix model was used to design the coupled-cavity devices. The standard devices were subsequently etched using FIB milling to form lasing and tuning sections of the precise desired lengths. The following sections describe each step of this process.
2.1 Initial processing and characterization
The devices used in this work were based on the bound-to-continuum active region reported in [18], which was grown using molecular beam epitaxy. Growth started with a 250-nm-thick GaAs buffer layer, and a 300-nm-thick Al50Ga50As etch stop layer grown on a semi-insulating GaAs substrate. A 700-nm-thick n-doped GaAs layer doped with Si at 182 10× cm−3, forming a buried contact layer, was grown next, followed by 90 repetitions of the active-region layers. Growth concluded with an 80-nm-thick n-doped GaAs layer, with Si doping density 185 10× cm−3.
Samples were processed into single-plasmon waveguides as described in [19]. Briefly, 150-µm-wide and 11.6-µm-thick laser ridges were defined using optical photolithography and
#210360 - $15.00 USD Received 23 Apr 2014; revised 9 Jun 2014; accepted 19 Jun 2014; published 27 Jun 2014(C) 2014 OSA 30 June 2014 | Vol. 22, No. 13 | DOI:10.1364/OE.22.016595 | OPTICS EXPRESS 16597

wet chemical etching using an etchant solution of H2SO4, H2O2 and H2O. Ohmic contacts (formed from a eutectic alloy of Au/Ge/Ni) and metallic (Ti/Au) cladding layers were deposited using optical lithography and vacuum thermal evaporation. Following substrate thinning, samples were cleaved into 4.8-mm-long ridges and mounted on a copper block with indium. The tops of the ridges were wire-bonded to two separate and thermally isolated ceramic pads to enable independent electrical connection to the segmented cavities after FIB milling.
The non-segmented devices were mounted in a continuous-flow helium-cooled cryostat and were driven by a train of 2-µs-long current pulses at a repetition rate of 10 kHz. The current pulses were gated at 165 Hz to match the optimum modulation frequency of the detector. Radiation was collimated and coupled into a Brucker IFS66/V Fourier transform infrared (FTIR) spectrometer and detected using a cryogenically-cooled Ge:Ga bolometer. The emission spectra of devices were acquired for a range of heat-sink temperatures from 4 to 80 K.
The QCLs used in this work lased between ~2.70–2.85 THz [Fig. 2], with a gain bandwidth in the range of 80–130 GHz and a maximum temperature of operation ~81 K in pulsed mode at 2% duty cycle. The group refractive index of each device (n = 3.61) was obtained from the measured mode spacing in the emission spectra. The temperature tuning of individual lasing modes d df T ( d dTλ ) was found to be linear with respect to temperature
and was calculated to be 63 MHz/K (2.74 nm/K), corresponding to a 4-GHz red shift as the heat-sink temperature was varied from 7 K to 70 K [Fig. 2]. This tuning coefficient agrees well with that reported in [20]. The corresponding change in refractive index with temperature, based on the measured value of d dTλ and using the relationship
( ) ( ) ( ) ( )1 d d 1 d dn n T Tλ λ= , was calculated to be d dn T = 59.5 10−× K–1.
Fig. 2. Normalized spectra exhibiting multiple Fabry–Pérot modes obtained from a reference device at a laser drive current of 1.96 A. Red shifting of the modes by about 4 GHz is observed as the heat-sink temperature is increased from 7 K to 70 K.
2.2 Modeling using scattering and transmission matrices
The coupled-cavity geometry was designed using the physical model illustrated in Fig. 3(a). Propagation of the THz electric field through the coupled-cavity structure was simulated using appropriate scattering and transmission matrices representing the lasing, tuning and air gap sections, based on the approach described in [17]. In this manner, the reflection amplitudes at the interfaces between each section were accounted for, as well as the phase incurred from the optical path length of each section. Owing to a lowering of the threshold, lasing in such coupled cavities is favored at frequencies for which the longitudinal FP modes of the individual sections coincide. The specific length of the tuning section was therefore selected in each case such that it exhibited maximum reflectivity at a frequency corresponding to that of a longitudinal FP mode of the lasing section. In our structures this resonance was
#210360 - $15.00 USD Received 23 Apr 2014; revised 9 Jun 2014; accepted 19 Jun 2014; published 27 Jun 2014(C) 2014 OSA 30 June 2014 | Vol. 22, No. 13 | DOI:10.1364/OE.22.016595 | OPTICS EXPRESS 16598

designed to occur at ~2.75 THz—the center of the gain spectrum of the structure. The section lengths were constrained to multiples of half of the corresponding wavelength, resλ , in order
to better control the emission frequency that can be expected in the absence of a tuning current. In our devices, an air gap width of 8resλ was used.
Fig. 3. (a) Schematic of the model of a generic coupled-cavity geometry used to simulate transmission characteristics. Two FP etalons of lengths L1 and L2 are separated by an air gap of length Lg. The refractive indices n1 and n2 depend on Joule heating in the respective section. To maintain design flexibility, the front and rear sections were modeled as lasing or tuning sections interchangeably. The emitted field was computed as that transmitted through the facet marked with an arrow. The amplitude reflection coefficient of each interface is denoted as r1–r4. (b) Cross-sectional profile of the optical mode (in-plane with the facet), simulated using finite element modeling. The penetration of the waveguide mode into the substrate is typical for THz QCLs with single-plasmon waveguides [21].
The real part of the effective refractive index for the fundamental waveguide mode ( 3.62n = ) was obtained by finite element modeling (FEM) using COMSOL Multiphysics®, [Fig. 3(b)], and was found to be in good agreement with the value obtained from the measured FP mode spacing ( 3.61n = ). This enabled calculation of the Fresnel reflection coefficients (r) used in the model, as well as the optical path lengths of each section. In order to predict how the emission of coupled-cavity devices varies with electrical input power delivered to the tuning section, a bulk thermal model was used. The steady-state temperature change during the tuning pulse can be estimated from Th t tT R V IΔ = [22], where RTh is the thermal resistance,
and Vt and It are the voltage and current pulse amplitudes supplied to the tuning section, respectively. Normalized thermal resistance was calculated from area (A) and thickness (d) of QCL ridge as *
Th ThR R A d= × [23]. The normalized thermal resistance for our devices was
calculated by studying the variation of emission power as a function of duty cycle following the procedure reported in [24]. In our case, a value * 31.7ThR ≈ KcmW−1 is obtained which
agrees well with a reported value in [25]. For a given electrical power the temperature change in the tuning section can thus be predicted, enabling the resulting change in refractive index to be obtained using the value 5d d 9.5 10n T −= × K−1 measured for the unetched device (see
section 2.1). By inputting this variation of refractive index into the transmission matrix model, the spectral behavior of the coupled-cavity devices can thus be simulated for varying electrical powers supplied to the tuning section.
2.3 Device design
Various device geometries were simulated using the transmission-matrix model described above. The normalized transmission spectra for each section of the device were multiplied together to predict the transmission spectrum for the complete device. The maximum transmission occurs at the frequency for which there is maximum alignment between the longitudinal modes of the two sections, consequently indicating also the frequency with the lowest lasing threshold. This simple design paradigm enables flexibility in designing the range and direction of the frequency tuning. Two variations of the coupled geometry were designed.
#210360 - $15.00 USD Received 23 Apr 2014; revised 9 Jun 2014; accepted 19 Jun 2014; published 27 Jun 2014(C) 2014 OSA 30 June 2014 | Vol. 22, No. 13 | DOI:10.1364/OE.22.016595 | OPTICS EXPRESS 16599

In the first design (design 1), the lengths of the lasing and tuning sections differed by only a few half wavelengths, yielding a very similar FP mode spacing for each section. As such, multiple lasing modes can be expected within the narrow gain bandwidth of our devices. The emission frequency of the coupled cavity device is then predicted to hop progressively between adjacent modes of the lasing section as the tuning section temperature changes [Fig. 4(a)]. This scheme therefore provides a discrete-tuning resolution equal to the FP mode spacing of the lasing section, although precise control over the electrical heating is required to obtain the desired mode transitions. Furthermore, the direction of the frequency hopping can be changed by swapping the function of the lasing and tuning sections. The chosen design consists of a 2.30-mm-long tuning section, a 2.45-mm-long lasing section, and an air gap of 13 µm. The free spectral ranges (FSR) of the lasing and tuning sections are estimated to be 16.9 GHz and 18 GHz, respectively. From the measured normalized thermal resistance, a value 9.92ThR ≈ KW−1 is obtained for this geometry, corresponding to a temperature change
TΔ ~50 K for an input power of 5 W supplied to the tuning section. Simulations predict a blue shift in frequency from ~2.74 THz to ~2.81 THz with a mode spacing of ~15 GHz, as the shorter section is heated by ~5.5 W [Fig. 4(a)]. A red shift from ~2.75 THz to ~2.70 THz is predicted when the shorter section serves as the lasing section [Fig. 4(b)]. In this device, the two sections being of comparable lengths results in a similar mode spacing under these two configurations, since the two sections have a similar FSR.
Fig. 4. Simulated transmission spectra of coupled-cavity devices as a function of heat-induced shift of longitudinal modes in one of the sections only. (a, c) Blue shifts induced by heating the shorter sections in designs 1 and 2, respectively. (b, d) Red shifts induced by heating the longer sections in the same devices.
In the second design (design 2), the length of the lasing section (3.4 mm, FSR: 12.2 GHz) was chosen to be almost twice that of the tuning section (1.5 mm, FSR: 27.7 GHz). Hence, the modes of the tuning section are designed to coincide with alternate modes of the lasing section, and the emission frequency of the coupled-cavity device was predicted to hop accordingly as the electrical power delivered to the tuning section was varied [Fig. 4(c)]. As
#210360 - $15.00 USD Received 23 Apr 2014; revised 9 Jun 2014; accepted 19 Jun 2014; published 27 Jun 2014(C) 2014 OSA 30 June 2014 | Vol. 22, No. 13 | DOI:10.1364/OE.22.016595 | OPTICS EXPRESS 16600
such, a greater tuning range is predicted for this design, but with an increased frequency spacing between lasing modes. As shown in Fig. 4(c), the simulated emission frequency hops from ~2.75–2.83 THz in ~25 GHz steps as the shorter section is heated. A red shift from 2.77 THz to 2.70 THz is predicted when the longer section serves as the tuning section [Fig. 4(d)]. As for design 1, the measured normalized thermal resistance * 31.7ThR ≈ KcmW−1 was used in
these simulations. It should be noted that the simulated transmission spectra shown in Fig. 4 do not imply
that all available modes will lase simultaneously, owing to the presence of mode competition effects. Furthermore, experimental devices may be susceptible to intra-pulse mode hopping effects leading to degradation of the SMSR.
2.4 Coupled-cavity device fabrication and measurement
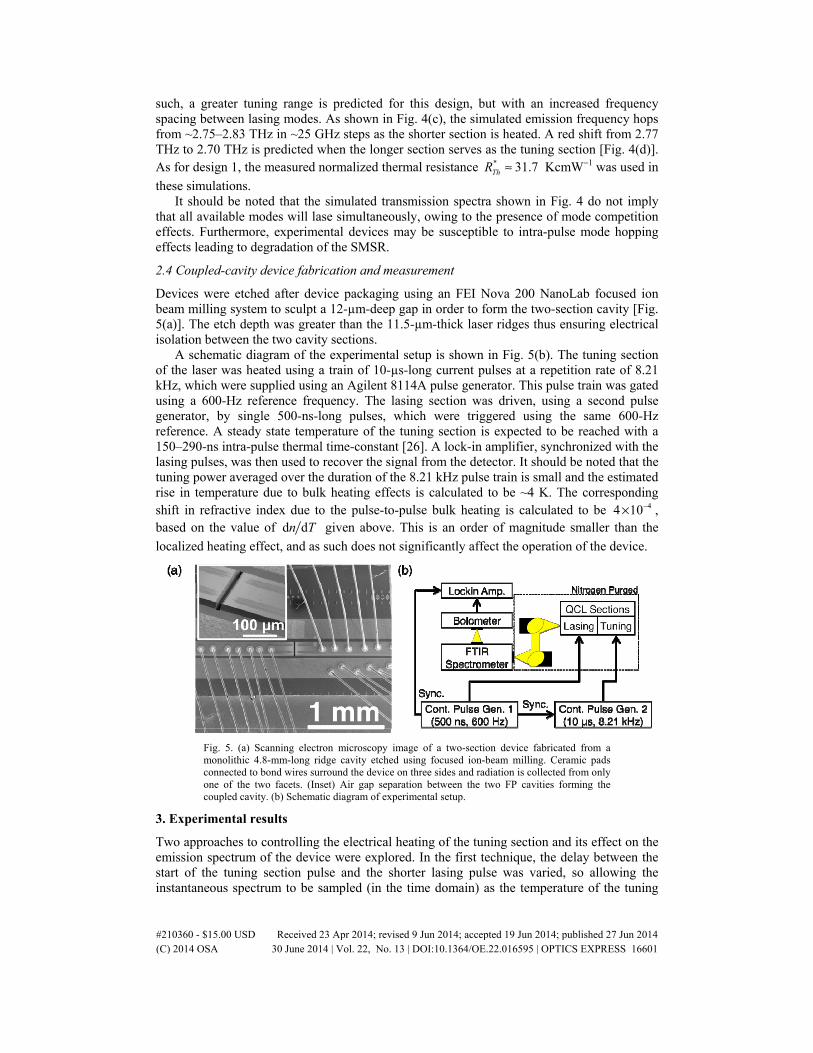
Devices were etched after device packaging using an FEI Nova 200 NanoLab focused ion beam milling system to sculpt a 12-µm-deep gap in order to form the two-section cavity [Fig. 5(a)]. The etch depth was greater than the 11.5-µm-thick laser ridges thus ensuring electrical isolation between the two cavity sections.
A schematic diagram of the experimental setup is shown in Fig. 5(b). The tuning section of the laser was heated using a train of 10-µs-long current pulses at a repetition rate of 8.21 kHz, which were supplied using an Agilent 8114A pulse generator. This pulse train was gated using a 600-Hz reference frequency. The lasing section was driven, using a second pulse generator, by single 500-ns-long pulses, which were triggered using the same 600-Hz reference. A steady state temperature of the tuning section is expected to be reached with a 150–290-ns intra-pulse thermal time-constant [26]. A lock-in amplifier, synchronized with the lasing pulses, was then used to recover the signal from the detector. It should be noted that the tuning power averaged over the duration of the 8.21 kHz pulse train is small and the estimated rise in temperature due to bulk heating effects is calculated to be ~4 K. The corresponding shift in refractive index due to the pulse-to-pulse bulk heating is calculated to be 44 10−× , based on the value of d dn T given above. This is an order of magnitude smaller than the
localized heating effect, and as such does not significantly affect the operation of the device.
Fig. 5. (a) Scanning electron microscopy image of a two-section device fabricated from a monolithic 4.8-mm-long ridge cavity etched using focused ion-beam milling. Ceramic pads connected to bond wires surround the device on three sides and radiation is collected from only one of the two facets. (Inset) Air gap separation between the two FP cavities forming the coupled cavity. (b) Schematic diagram of experimental setup.
3. Experimental results
Two approaches to controlling the electrical heating of the tuning section and its effect on the emission spectrum of the device were explored. In the first technique, the delay between the start of the tuning section pulse and the shorter lasing pulse was varied, so allowing the instantaneous spectrum to be sampled (in the time domain) as the temperature of the tuning
#210360 - $15.00 USD Received 23 Apr 2014; revised 9 Jun 2014; accepted 19 Jun 2014; published 27 Jun 2014(C) 2014 OSA 30 June 2014 | Vol. 22, No. 13 | DOI:10.1364/OE.22.016595 | OPTICS EXPRESS 16601

section varied. In the second approach, the amplitude of the tuning section pulse was varied below the lasing threshold, while the delay between the lasing and tuning pulses was kept constant. Through these two approaches both the dynamic and steady-state thermal response of the device could be investigated.
3.1 Device 1: Hopping between adjacent laser modes
Device 1 was characterized, initially with the shorter section serving as the tuning section, and the longer section as the lasing section. After FIB milling, the emission bandwidth was found to be reduced to 2.75–2.80 THz (compared with 2.70–2.85 THz in the single-ridge device). This reduction is likely to be caused by increased mirror losses arising from the roughened facets of the milled gap [27].
The amplitudes of the tuning and lasing pulses were initially set as 800 mA (corresponding to a tuning power of 3.85 W) and 1.53 A, respectively. Under these conditions, as the lasing pulse is delayed relative to the rising edge of the tuning pulse, the emission is observed to hop from 2.755 THz to 2.770 THz, before reaching a steady-state value of 2.785 THz for delays greater than ~100 ns [see Fig. 6(a)]. When the lasing pulse is delayed beyond the trailing edge of the tuning pulse, the emission hops back to 2.755 THz. The weighted average of the emission frequency, revealing the mean power distribution amongst the lasing modes, plotted as a function of the delay, maps these spectral transitions, as shown in Fig. 6(b). The observed behavior is due the dynamic heating and cooling of the tuning section in response to the heating pulse, which results in a temporal variation of refractive index. As can be seen, a short thermal equilibration time (>100 ns) is observed, which is consistent with intra-pulse thermal time-constants in the range of 150–290 ns previously reported for THz QCL active regions [26].
In the second approach, the amplitude of the tuning pulse was varied, while the time-delay was fixed at 8 µs to ensure thermal equilibration of the tuning section. Single-mode emission with an SMSR of 15 dB was observed at 2.755 THz by applying a current of 1.53 A to the lasing section only [see Fig. 6(c)]. A second mode appears at ~2.770 THz when the tuning power increases above ~600 mW, with the power distribution shifting progressively to the higher frequency mode as the tuning power is increased. At higher tuning power, further modes at 2.785 THz and 2.800 THz are observed. This observed hopping between modes spaced by 15 GHz, over a ~50-GHz bandwidth, matches closely the simulated behaviour [see Fig. 4(a)]. The weighted average of the measured emission frequency is shown to increase monotonically with respect to tuning power in Fig. 6(d). From a linear fit to this data, a value of d df P = 8.3 GHz/W is obtained. Based on the normalized thermal resistance for this
device ( * 31.7ThR ≈ KcmW−1) this corresponds to a value d df T = 840 MHz/K. For
comparison, the frequency tuning expected for the lasing section alone is calculated to be only d df T = 63 MHz/K. Hence it can be seen that by exploiting the Vernier tuning mechanism
in our coupled-cavity devices the tuning range has been greatly enhanced.
#210360 - $15.00 USD Received 23 Apr 2014; revised 9 Jun 2014; accepted 19 Jun 2014; published 27 Jun 2014(C) 2014 OSA 30 June 2014 | Vol. 22, No. 13 | DOI:10.1364/OE.22.016595 | OPTICS EXPRESS 16602

Fig. 6. Experimental data (heat sink temperature of 5 K) obtained from device 1, with tuning power applied to the short front section. (a) Spectral evolution and (b) weighted mean of spectral power density (SPD), as a function of the delay between the lasing and tuning pulses, as the former is scanned through the wider tuning pulse. The horizontal line in (b) shows the mean SPD when no current is applied to the tuning section, and serves as a reference. (c) Spectral evolution as tuning power amplitude varies. (d) Weighted mean of the SPD as a function of tuning power. Error bars in the experimental data correspond to weighted standard deviation.
An important aspect of our coupled-cavity approach is that the emitted power remains constant as the tuning power is varied, as shown in Fig. 7. In conventional devices, the change in lasing frequency is accomplished through control of the laser driving current, which also leads to significant changes in the emitted power. Conversely, in our coupled-cavity devices the tuning is accomplished through adjusting the bias on the tuning-section while the lasing section bias is kept constant. As such, the effect on the gain of the device is very weak.
Fig. 7. (a) Light–current characteristics of the lasing section, acquired at a heat sink temperature of 5 K. (b) Variation of emitted power from lasing section as a function of current in the tuning section.
#210360 - $15.00 USD Received 23 Apr 2014; revised 9 Jun 2014; accepted 19 Jun 2014; published 27 Jun 2014(C) 2014 OSA 30 June 2014 | Vol. 22, No. 13 | DOI:10.1364/OE.22.016595 | OPTICS EXPRESS 16603

A similar spectral characterization by varying the amplitude of the tuning pulse was performed using an alternative configuration, with the short and long sections serving as the lasing and tuning sections, respectively. In this case, a dominant emission peak at 2.780 THz and additional peaks at 2.795 THz and 2.765 THz are observed when no tuning power is applied [Fig. 8(a)]. These additional peaks might indicate the presence of intra–pulse mode hopping. However, this could not be investigated further due to limitations of the setup. As the power in the tuning section is increased, the spectral power distribution red-shifts towards the 2.765 THz mode, and single mode emission with an SMSR of 10 dB at this frequency is attained at a tuning power of ~2.3 W. The weighted average of the emission frequency is shown in Fig. 8(b), revealing a red shift in frequency as the tuning power increases. For tuning powers greater than 1 W, a tuning coefficient d df T = ~–805 MHz/K is obtained
from this data. The observed red-shifting behavior is consistent with that predicted from the simulations [see Fig. 4(b)], although the size of the measured red shift is lower than the simulated range.
Fig. 8. Experimental data (heat sink temperature of 5 K) obtained from Device 1 when the tuning power is applied to the longer rear section. (a) Spectral evolution with applied power at the tuning section. (b) Weighted mean SPD plotted as a function of tuning power. Error bars correspond to weighted standard deviation.
3.2 Device 2: hopping between alternate laser modes
Device 2 was characterized following identical procedures to those described above. Initially, the long section (3.4 mm) was used as the lasing section and the short section (1.5 mm) as the tuning section. The frequency spacing between the longitudinal modes of the tuning section in this configuration (27 GHz) was almost twice that of device 1 (18 GHz), and more than twice the mode spacing (12 GHz) expected for the 3.4 mm long lasing section alone. As shown in Fig. 9(a), mode hopping from 2.740 THz (with no applied tuning power) to 2.825 THz was observed as the tuning power was increased, with intermediate emission peaks at 2.770 THz and 2.800 THz. From this data, the SMSR reaches a value of 13 dB for the emission at 2.825 THz. This hopping observed between modes spaced by ~30 GHz over a range of ~85 GHz agrees well with simulations, which reveal hopping between alternate longitudinal modes of the lasing section as the tuning power is increased [see Fig. 4(c)]. This increase in frequency spacing arises from the >2 ratio of the section lengths in this design. A value of d df P = 12.5
GHz/W was calculated from the linear fit to weighted mean SPD [Fig. 9(b).]. By alternating the lasing and tuning sections, a red shift of 30 GHz from 2.825 THz (SMSR of 16 dB) to 2.795 THz (SMSR of 15 dB) was observed as the tuning power was increased [Fig. 9(c) and 9(d)]. It has been observed experimentally that devices with lengths shorter than ~1.5 mm lased predominantly at higher frequencies (~2.78–2.85 THz) for this wafer. Thus, the red-shift tuning range predicted by the simulations (2.77 THz to 2.70 THz) may be misrepresentative, with the actual red-shift being observed only within the lasing range of the shorter section (i.e.
#210360 - $15.00 USD Received 23 Apr 2014; revised 9 Jun 2014; accepted 19 Jun 2014; published 27 Jun 2014(C) 2014 OSA 30 June 2014 | Vol. 22, No. 13 | DOI:10.1364/OE.22.016595 | OPTICS EXPRESS 16604

~2.78–2.85 THz). Reversal of tuning direction could be better evaluated in a wafer with a broad emission range.
Fig. 9. Experimental data (heat sink temperature of 5 K) obtained from device 2. (a) Blue shift of spectrum and (b) the mean SPD as a tuning power is applied to the shorter section. (c) Red shift of spectrum and (d) the corresponding mean SPD as a tuning power is applied to the longer section of the same device. Error bars indicate weighted standard deviation of the spectral distribution.
4. Conclusion
We have demonstrated discrete Vernier tuning in coupled-cavity THz QCL devices. Two different designs have been demonstrated, in which the laser cavity was split into two sections with approximate length ratios of either 1:1 or 2:1. These devices have been shown to yield discrete blue shifts in their emission frequency over bandwidths of 50 GHz and 80 GHz, respectively, as the shorter section of the device was electrically heated. Additionally, a red shift over bandwidths of 20 GHz and 30 GHz was obtained from the same devices by swapping the lasing and tuning sections. This discrete Vernier frequency tuning far exceeds the tuning achievable from standard ridge lasers, and does not lead to any significant change in emitted power. A comprehensive physical model of these coupled-cavity devices has also been presented, based on a transmission matrix approach coupled with a bulk thermal model, which is shown to agree well with experiment. This simple methodology enables design flexibility to engineer the tuning direction, tuning range and frequency step-size. It is anticipated that further design optimization could lead to enhanced tuning over a broader frequency range, as well as an improved SMSR by increasing the difference in FSR between the lasing and tuning sections.
Acknowledgments
Authors acknowledge the support from: the Engineering and Physical Sciences Research Council (EPSRC), UK (COTS programme EP/J017671/1, and EP/J002356/1); the ERC (NOTES and TOSCA programmes); the Royal Society; and, the Wolfson Foundation.
#210360 - $15.00 USD Received 23 Apr 2014; revised 9 Jun 2014; accepted 19 Jun 2014; published 27 Jun 2014(C) 2014 OSA 30 June 2014 | Vol. 22, No. 13 | DOI:10.1364/OE.22.016595 | OPTICS EXPRESS 16605