discrimination-aware data miningdidawiki.di.unipi.it/lib/exe/fetch.php/mds/lbi/lbi.11.weka.pdfweka...
TRANSCRIPT

BUSINESS INTELLIGENCE LABORATORY
Reminds on Data MiningSalvatore Ruggieri & Anna Monreale
Computer Science Department, University of Pisa
Business Informatics Degree
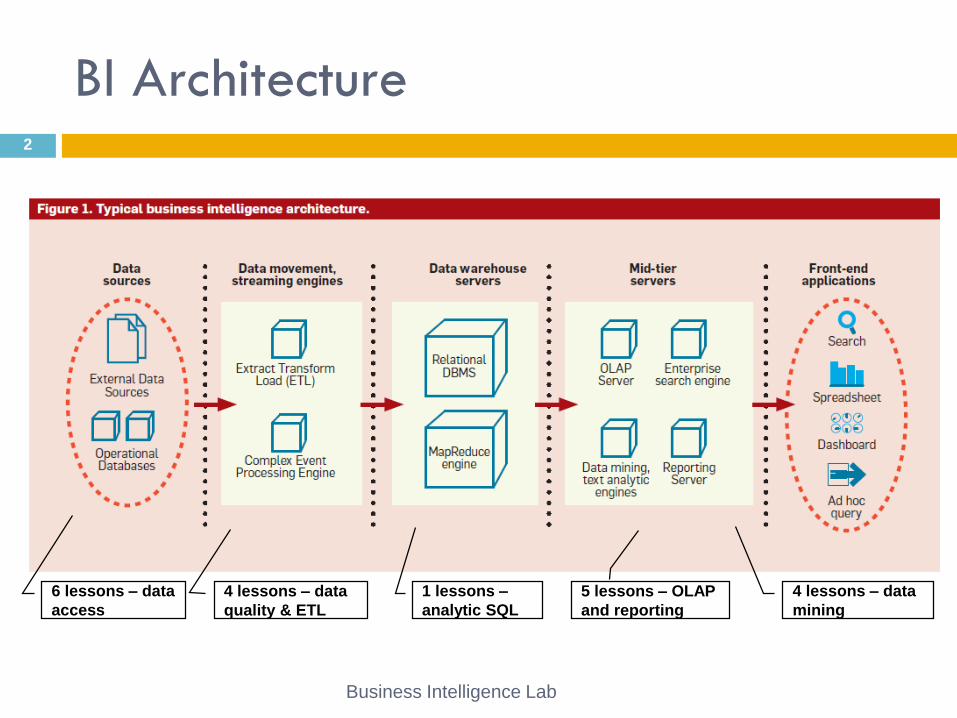
BI Architecture
Business Intelligence Lab
2
6 lessons – data
access
4 lessons – data
quality & ETL
4 lessons – data
mining
5 lessons – OLAP
and reporting
1 lessons –
analytic SQL

Data Mining Techniques
Classification/Regression
Association Rule Discovery
Clustering
Sequential Pattern Discovery
Deviation Detection
Text Mining
Web Mining
Social Network Analysis
…
3
Pre
pro
cess
ing
and
visu
aliz
ation
Business Intelligence Lab

Tools for data mining
From DBMS SQL Server Analysis Services
Oracle Data Miner
IBM DB2 Intelligent Miner (discontinued)
From Statistical analysis IBM Modeler (formerly SPSS Clementine)
SAS Miner
From Machine-Learning Knime
Weka
An updated list
http://www.kdnuggets.com/software/index.html
4

Standards
XML representation of data mining models Predictive Modelling Markup Language: PMML
API for accessing data mining services Microsoft OLE DB for DM
Java JDM
SQL Extensions for data mining Standard SQL/MM Part 6 Data Mining
Oracle, DB2 & SQL Server have non-standard extensions SSAS DMX query language and Data Mining queries
Business Intelligence Lab
5

Weka6
Business Intelligence Lab
Weka
Suite for machine learning / data mining
Developed in Java Distributed with a GNU GPL licence
Since 2006 it is part of the BI Pentaho suite
References “Data Mining” by Witten & Frank, 3rd ed., 2011
On line docs http://www.cs.waikato.ac.nz/ml/weka/index.html
Features / limits: A complete set of tools for pre-processing,
classification, clustering, association rules, visualization
Extensible (documented APIs)
Not very efficient / scalable (data are maintained in main memory)
Business Intelligence Lab
7
Weka versions
Download: http://www.cs.waikato.ac.nz/~ml/weka
May 2015, Weka 3.7.12 (developer version)
Patch distribuited by the teacher
To be copied in the Weka installation directory
It includes setting for:
Larger memory occupation (Java default is 80Mb)
Data types for SQL Server RDBMS
Driver JDBC
Weka Light
Minimal version 3.7.12, patch already included
Business Intelligence Lab
8

Weka interfaces
GUI chooser and console with errors/warnings
9
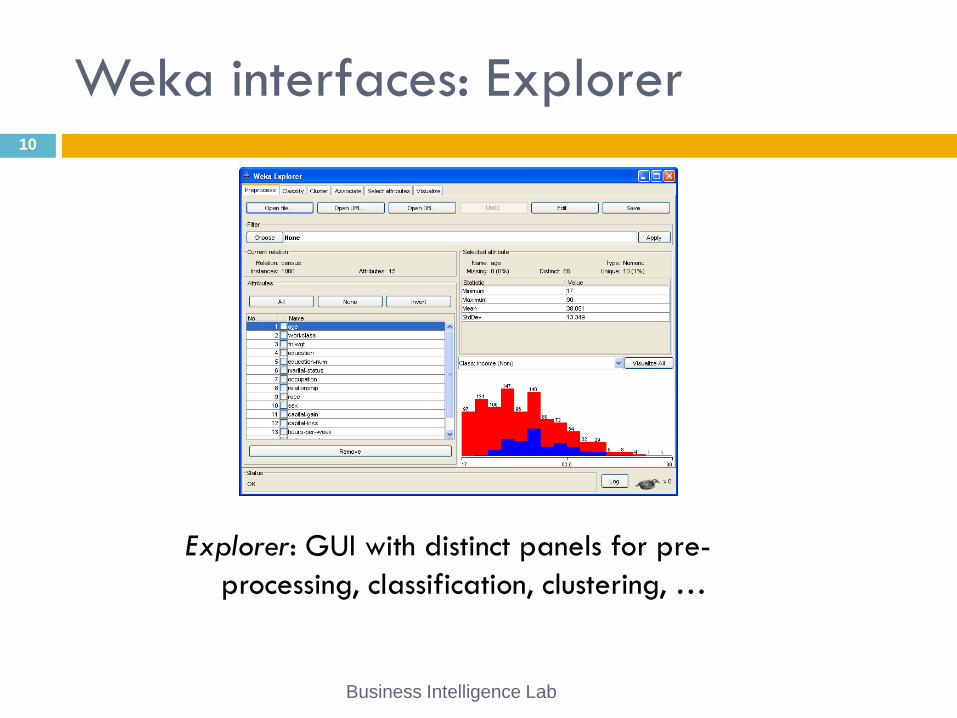
Weka interfaces: Explorer
Business Intelligence Lab
10
Explorer: GUI with distinct panels for pre-
processing, classification, clustering, …

Weka interfaces: KnowledgeFlow
Business Intelligence Lab
11
KnowledgeFlow: GUI with data flow
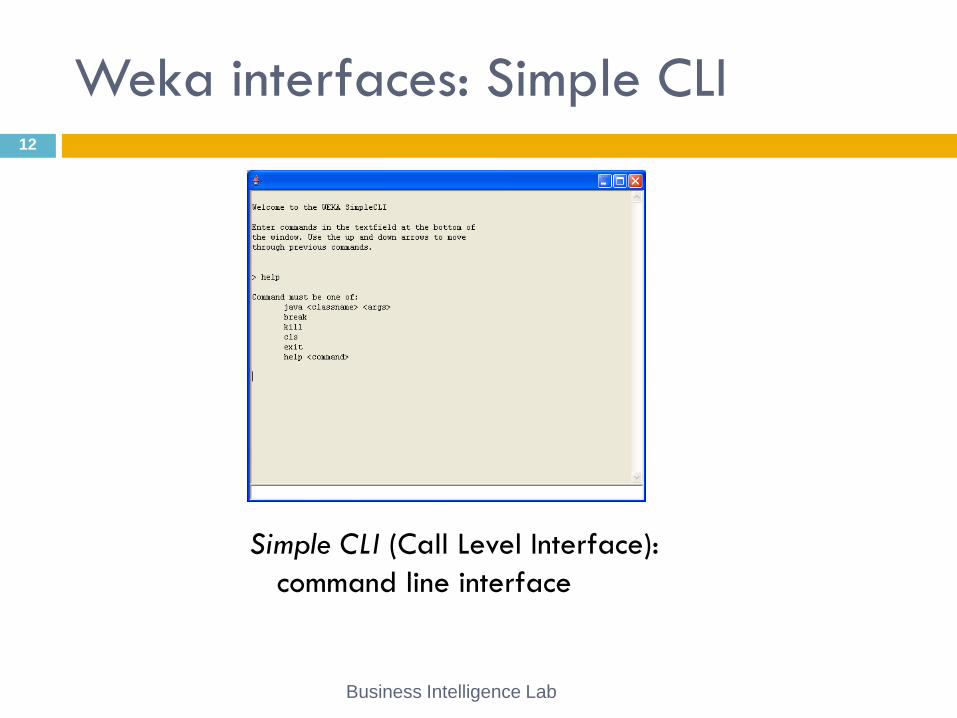
Weka interfaces: Simple CLI
Business Intelligence Lab
12
Simple CLI (Call Level Interface):
command line interface
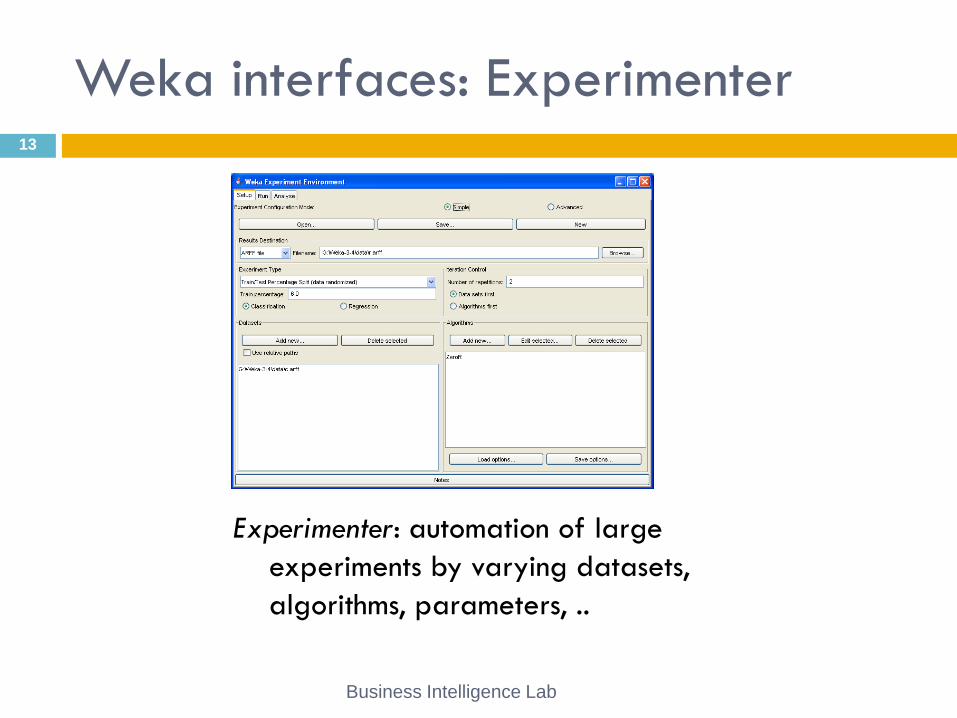
Weka interfaces: Experimenter
Business Intelligence Lab
13
Experimenter: automation of large
experiments by varying datasets,
algorithms, parameters, ..
Details
Weka manual
Installation directory, or at the
weka website
Business Intelligence Lab
14

Filters
Conversions
MakeIndicator, NominalToBinary,
NumericToBinary, NumericToNominal
Selections
RemovePercentage, RemoveRange,
RemoveWithValues,
SubSetByExpression
Sampling
Resample, SpreadSubSample,
StratifiedRemoveFolds
Transformation
Add, AddExpression, AddNoise,
AddValues
Business Intelligence Lab
15
Normalization
Center, Normalize, Standardize
Discretization
Discretize
Cleaning
NumericCleaner, Remove,
RemoveByType, RemoveUseless
Missing Values
ReplaceMissingValues

Reminds on classification16
Business Intelligence Lab

Age >= 38
NVisits > 20
Age <= 26
0
5
10
15
20
25
30
35
20 25 30 35 40 45 50
Eta'
Vis
ite
Molti_Acquisti Pochi_Acquisti
… given their age and frequency of visit !
Good customers = top buyers, buy more than X, …
Who are my best customers?17
Good Bad
Age
NV
isit
s
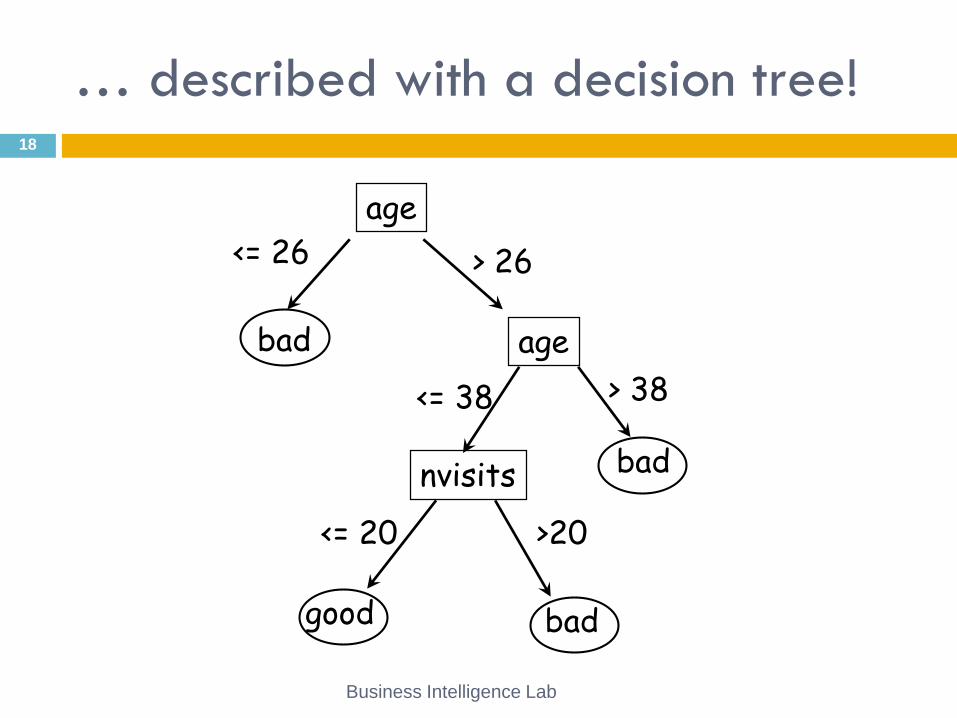
… described with a decision tree!
Business Intelligence Lab
18
age
nvisits
age
<= 26
good bad
bad
bad
> 26
<= 20 >20
<= 38 > 38

Classification: input
A set of examples (or instances or cases) which described a concept or event (class) given predictive attributes (or features)
Attributes can be either continuous or discrete (maybe discretized)
The class is discrete
19
outlook temperature humidity windy class
sunny 85 85 false Don't Play
sunny 80 90 true Don't Play
overcast 83 78 false Play
rain 70 96 false Play
rain 68 80 false Play
rain 65 70 true Don't Play
overcast 64 65 true Play
sunny 72 95 false Don't Play
sunny 69 70 false Play
rain 75 80 false Play
sunny 75 70 true Play
overcast 72 90 true Play
overcast 81 75 false Play
rain 71 80 true Don't Play

Classification: output
A function f(sample) = class, called a classification model, that describes/predict the class value given the feature values of a sample obtained by generalizing the samples of the training set
Usage of a classification model:
descriptively Which customers have abandoned?
predictively Over a score set of samples with unknown class value
Which customers will respond to this offer?
20

How to evaluate a class. model?
Holdout method Split the available data into two sets
Training set is used to build the model
Test set is used to evaluate the interestingness of the model
Typically, training is 2/3 of data and test is 1/3
LSA – Data Mining
21
Quality measureModel exctraction
How good is a classification model?
Stratified holdout
Available data is divided by stratified sampling wrt class distribution
(Stratified) n-fold cross-validation
Available data divided into n parts of equal size
For i=1..n, the i-th part is used as test set and the rest as training set for building a classifier
The average quality measure of the n classifiers is statistically more significative than the holdout method
The FINAL classifier is the one training from all the available data
Cross-validation is useful when data is scarce or attribute distributions are skewed
22

Quality measures: accuracy
Accuracy: percentage of cases in the test set that is correctly predicted by the model
E.g., accuracy of 80% means that in 8 cases out of 10 in the test set the predicted class is the same of the actual class
Misclassification % = (100 – accuracy)
Lower bound on accuracy: majority classifier A trivial classifier for which f(case) = majority class value
Its accuracy is the percentage of the majority class
E.g., two classes: fraud 2% legal 98%
Its hard to beat the 98% accuracy
23

Quality measures: confusion matrix24
Predicted class
Misclassified cases
Actual class
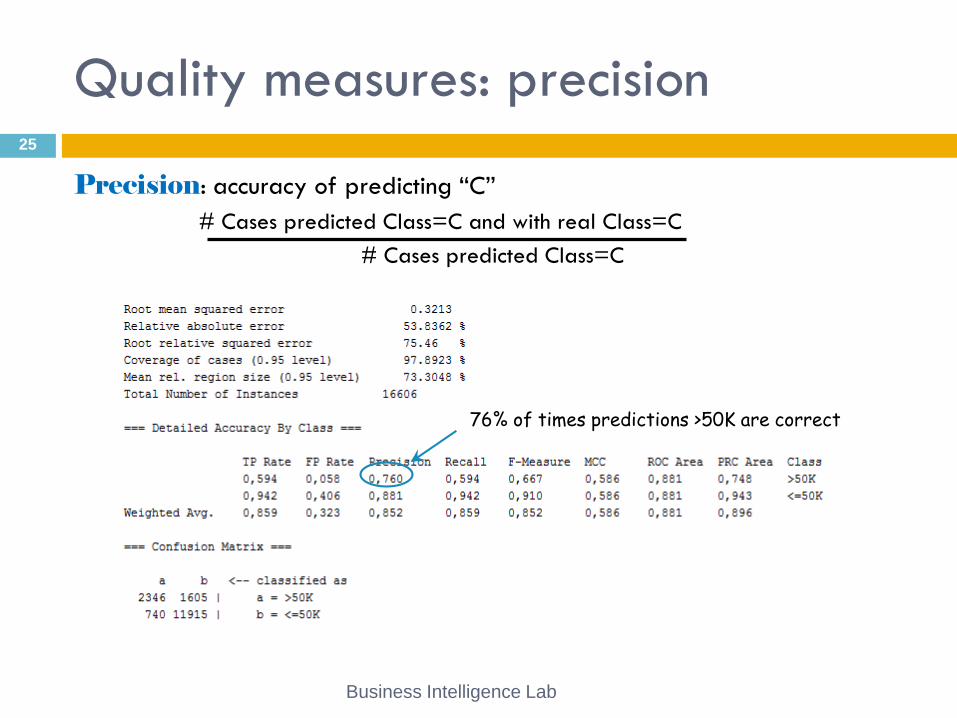
Precision: accuracy of predicting “C”
# Cases predicted Class=C and with real Class=C
# Cases predicted Class=C
Quality measures: precision
Business Intelligence Lab
25
76% of times predictions >50K are correct

Recall: coverage of predicting “C”
# Cases predicted Class=C and with real Class=C
# Cases with real Class=C
Quality measures: recall
Business Intelligence Lab
26
59,4% of real class >50K are found by predictions

Measures: lift chart
Classifier: f(sample, class) = confidence
and then f(sample) = argmaxclass f(sample, class)
E.g., f(sample, play) = 0.3 f(sample, don’t play) = 0.7
Samples in the test set can be ranked according to a fixed class
Rank customers on the basis of the classifier confidence they will respond to an offer
Lift chart X-axis: ranked sample of the test set
Y-axis: percentage of the total cases in the test set with the actual
class value included in the ranked sample of the test set (i.e., recall)
Plots: performance of a classifier vs random ranking
Useful when resources (e.g., budget) are limited
27

Business Intelligence Lab
28
Lift Chart
0102030405060708090
100
% customers according to some order
% c
us
tom
ers
wh
o r
es
po
nd
ed
Ranking
Random
Contacting only 50% of customer will reach
80% of those who respond. Lift = 80/50 = 1.6
Lift Chart - variants
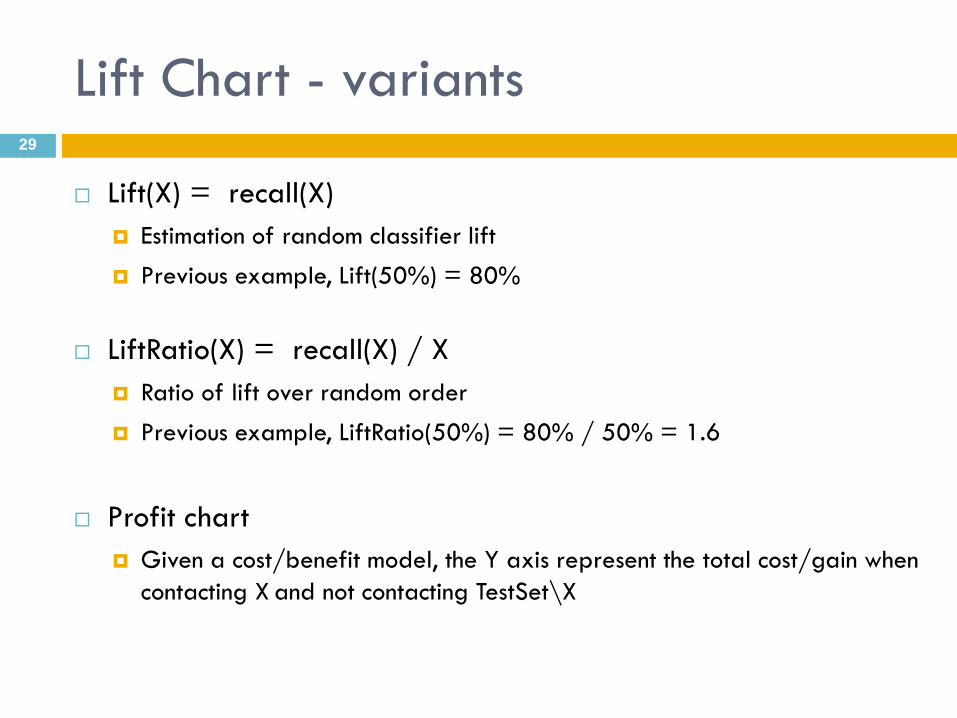
Lift(X) = recall(X)
Estimation of random classifier lift
Previous example, Lift(50%) = 80%
LiftRatio(X) = recall(X) / X
Ratio of lift over random order
Previous example, LiftRatio(50%) = 80% / 50% = 1.6
Profit chart
Given a cost/benefit model, the Y axis represent the total cost/gain when
contacting X and not contacting TestSet\X
29
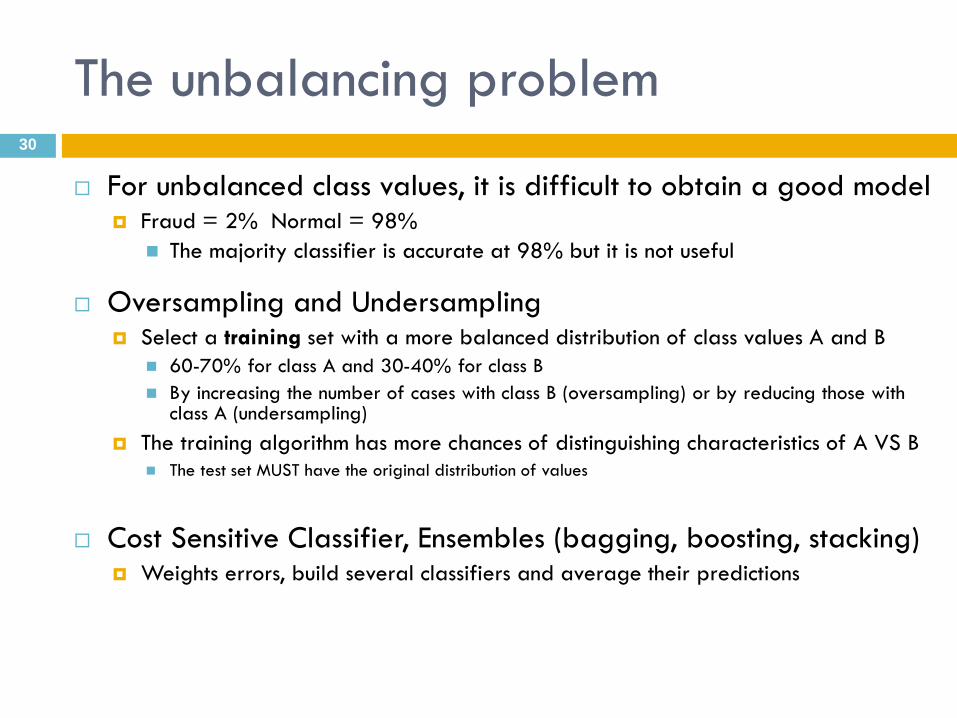
The unbalancing problem
For unbalanced class values, it is difficult to obtain a good model Fraud = 2% Normal = 98%
The majority classifier is accurate at 98% but it is not useful
Oversampling and Undersampling Select a training set with a more balanced distribution of class values A and B
60-70% for class A and 30-40% for class B
By increasing the number of cases with class B (oversampling) or by reducing those with class A (undersampling)
The training algorithm has more chances of distinguishing characteristics of A VS B The test set MUST have the original distribution of values
Cost Sensitive Classifier, Ensembles (bagging, boosting, stacking) Weights errors, build several classifiers and average their predictions
30
Rule based classification31
Business Intelligence Lab

Rule-Based Classifier
Classify records by using a collection of
“if…then…” rules
Rule: (Condition) y
where
Condition is a conjunctions of attributes
y is the class label
LHS: rule antecedent or condition
RHS: rule consequent
Examples of classification rules:
(Blood Type=Warm) (Lay Eggs=Yes) Birds
(Taxable Income < 50K) (Refund=Yes) Evade=No
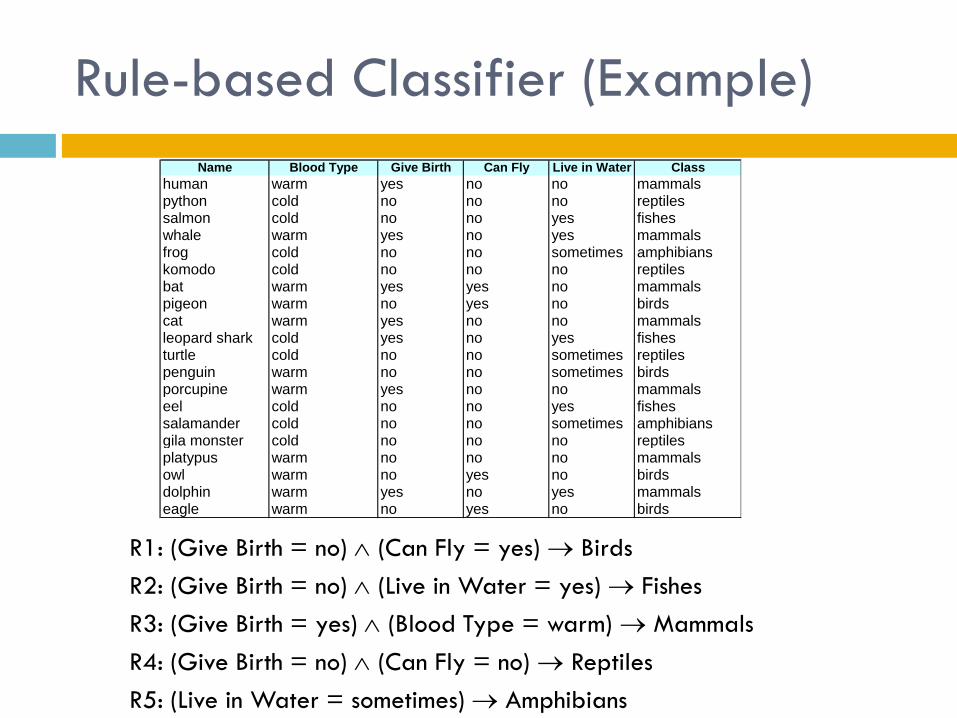
Rule-based Classifier (Example)
R1: (Give Birth = no) (Can Fly = yes) Birds
R2: (Give Birth = no) (Live in Water = yes) Fishes
R3: (Give Birth = yes) (Blood Type = warm) Mammals
R4: (Give Birth = no) (Can Fly = no) Reptiles
R5: (Live in Water = sometimes) Amphibians
Name Blood Type Give Birth Can Fly Live in Water Class
human warm yes no no mammalspython cold no no no reptilessalmon cold no no yes fisheswhale warm yes no yes mammalsfrog cold no no sometimes amphibianskomodo cold no no no reptilesbat warm yes yes no mammalspigeon warm no yes no birdscat warm yes no no mammalsleopard shark cold yes no yes fishesturtle cold no no sometimes reptilespenguin warm no no sometimes birdsporcupine warm yes no no mammalseel cold no no yes fishessalamander cold no no sometimes amphibiansgila monster cold no no no reptilesplatypus warm no no no mammalsowl warm no yes no birdsdolphin warm yes no yes mammalseagle warm no yes no birds
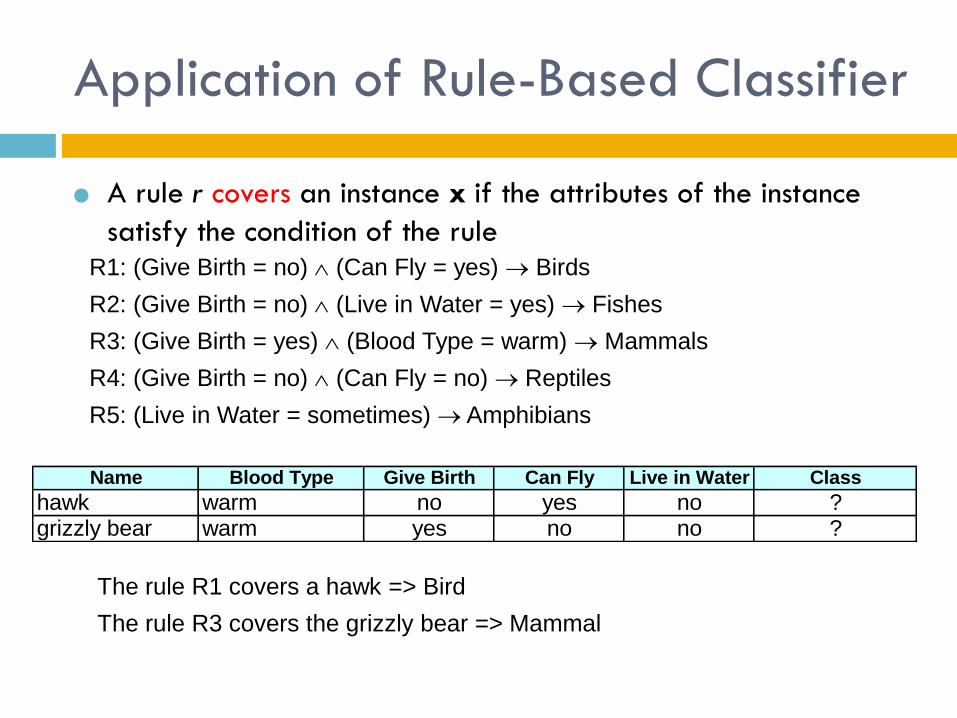
Application of Rule-Based Classifier
A rule r covers an instance x if the attributes of the instance
satisfy the condition of the ruleR1: (Give Birth = no) (Can Fly = yes) Birds
R2: (Give Birth = no) (Live in Water = yes) Fishes
R3: (Give Birth = yes) (Blood Type = warm) Mammals
R4: (Give Birth = no) (Can Fly = no) Reptiles
R5: (Live in Water = sometimes) Amphibians
The rule R1 covers a hawk => Bird
The rule R3 covers the grizzly bear => Mammal
Name Blood Type Give Birth Can Fly Live in Water Class
hawk warm no yes no ?grizzly bear warm yes no no ?
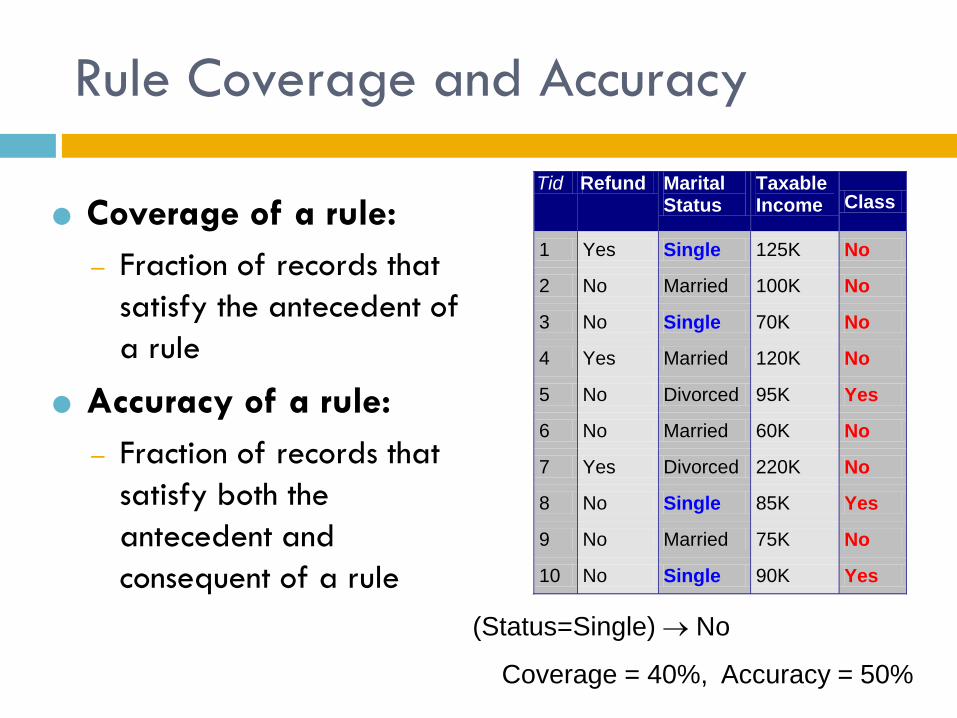
Rule Coverage and Accuracy
Coverage of a rule:
– Fraction of records that
satisfy the antecedent of
a rule
Accuracy of a rule:
– Fraction of records that
satisfy both the
antecedent and
consequent of a rule
Tid Refund Marital Status
Taxable Income Class
1 Yes Single 125K No
2 No Married 100K No
3 No Single 70K No
4 Yes Married 120K No
5 No Divorced 95K Yes
6 No Married 60K No
7 Yes Divorced 220K No
8 No Single 85K Yes
9 No Married 75K No
10 No Single 90K Yes 10
(Status=Single) No
Coverage = 40%, Accuracy = 50%

How does Rule-based Classifier Work?
R1: (Give Birth = no) (Can Fly = yes) Birds
R2: (Give Birth = no) (Live in Water = yes) Fishes
R3: (Give Birth = yes) (Blood Type = warm) Mammals
R4: (Give Birth = no) (Can Fly = no) Reptiles
R5: (Live in Water = sometimes) Amphibians
A lemur triggers rule R3, so it is classified as a mammal
A turtle triggers both R4 and R5
A dogfish shark triggers none of the rules
Name Blood Type Give Birth Can Fly Live in Water Class
lemur warm yes no no ?turtle cold no no sometimes ?dogfish shark cold yes no yes ?

Characteristics of Rule-Based Classifier
Mutually exclusive rules
– Classifier contains mutually exclusive rules if the rules
are independent of each other
– Every record is covered by at most one rule
Exhaustive rules
– Classifier has exhaustive coverage if it accounts for
every possible combination of attribute values
– Each record is covered by at least one rule

From Decision Trees To Rules
YESYESNONO
NONO
NONO
Yes No
{Married}{Single,
Divorced}
< 80K > 80K
Taxable
Income
Marital
Status
Refund
Classification Rules
(Refund=Yes) ==> No
(Refund=No, Marital Status={Single,Divorced},
Taxable Income<80K) ==> No
(Refund=No, Marital Status={Single,Divorced},
Taxable Income>80K) ==> Yes
(Refund=No, Marital Status={Married}) ==> No
Rules are mutually exclusive and exhaustive
Rule set contains as much information as the
tree

Rules Can Be Simplified
YESYESNONO
NONO
NONO
Yes No
{Married}{Single,
Divorced}
< 80K > 80K
Taxable
Income
Marital
Status
RefundTid Refund Marital
Status Taxable Income Cheat
1 Yes Single 125K No
2 No Married 100K No
3 No Single 70K No
4 Yes Married 120K No
5 No Divorced 95K Yes
6 No Married 60K No
7 Yes Divorced 220K No
8 No Single 85K Yes
9 No Married 75K No
10 No Single 90K Yes 10
Initial Rule: (Refund=No) (Status=Married) No
Simplified Rule: (Status=Married) No

Effect of Rule Simplification
Rules are no longer mutually exclusive
A record may trigger more than one rule
Solution?
Ordered rule set
Unordered rule set – use voting schemes
Rules are no longer exhaustive
A record may not trigger any rules
Solution?
Use a default class
Building Classification Rules
Direct Method:
Extract rules directly from data
e.g.: RIPPER, CN2, Holte’s 1R
Indirect Method:
Extract rules from other classification models (e.g.
decision trees, neural networks, etc).
e.g: C4.5rules