discrimination in the irish labour market: nationality ... · 1 discrimination in the irish labour...
TRANSCRIPT
UCD GEARY INSTITUTE
DISCUSSION PAPER SERIES
Discrimination in the Irish labour market:
nationality, ethnicity and the recession
Gillian Kingston
Economic and Social Research Institute
Department of Sociology,
Trinity College Dublin
Frances McGinnity
Economic and Social Research Institute
Department of Sociology,
Trinity College Dublin
Philip J O’Connell
UCD Geary Institute,
University College Dublin
Geary WP2013/23
December 2013
UCD Geary Institute Discussion Papers often represent preliminary work and are circulated to encourage
discussion. Citation of such a paper should account for its provisional character. A revised version may be
available directly from the author.
Any opinions expressed here are those of the author(s) and not those of UCD Geary Institute. Research
published in this series may include views on policy, but the institute itself takes no institutional policy
positions.

1
Discrimination in the Irish Labour Market: Nationality, Ethnicity
and the Recession
Abstract
Previous research shows that immigrants, in common with other groups that suffer
disadvantage in the labour market, are more vulnerable during recession (Hoynes et al.,
2012; McGinnity et al., 2013; Sierminska and Takhtamanova, 2010). However, little research
has focused on the impact of the Great Recession on work-related discrimination. We
examine the extent to which discrimination varies across different national-ethnic groups,
and whether discrimination increased between 2004, during an economic boom, and 2010,
in the midst of a severe recession. Our analysis draws on two large-scale nationally
representative surveys on the experience of labour market discrimination. We find that
overall immigrants do experience higher rates of work based discrimination, however
discrimination does not increase with the recession. We find substantial variation in
discrimination across national-ethnic groups, and indicate that ethnicity plays an important
influence on the experience of discrimination.
Keywords
Discrimination, recession, nationality, ethnicity, labour market
JEL Classification: J61, J71
Corresponding Author: [email protected]
2
Introduction
A growing body of research shows that immigrants suffer multiple disadvantages in the Irish
labour market, with lower employment, higher unemployment and lower wages than Irish
natives (Barrett and Duffy, 2008; O’Connell and McGinnity, 2008). The deep recession, which
has affected Ireland since 2008, has led to a dramatic deterioration in the labour market. In
general, immigrants are more exposed to the consequences of economic downturns, and
this is clearly the experience in Ireland (McGinnity et al., 2013). Against this backdrop of
disadvantage experienced by immigrant groups, we investigate whether immigrants are
more likely to report experience of discrimination in the labour market; whether such
discrimination differs by nationality and ethnicity; and whether the incidence of
discrimination has increased in the adverse labour market conditions of the recession.
Our analysis draws on two large-scale nationally representative surveys that collected self-
reports of the experience of discrimination conducted by Ireland’s Central Statistics Office
(CSO). The first was conducted in 2004 in the midst of an economic and employment boom
accompanied by substantial inward migration, then a novel episode in Irish demography.
The second was conducted in 2010 in the midst of an economic, fiscal and employment crisis
of unprecedented severity. In addition to self-reports of discrimination, both surveys
collected detailed information on nationality, ethnicity and a range of labour market and
socio demographic indicators (CSO, 2005, 2011).
Previous research shows that immigrants, in common with other groups that suffer
disadvantage in the labour market, are more vulnerable during recession in Ireland
(McGinnity et al., 2013) as elsewhere (Hoynes et al., 2012; Sierminska and Takhtamanova,
2010). However, little research has focused on the impact of the Great Recession on work-
related discrimination. We recognise that self-reports, in common with other methods of
measuring discrimination, are not without their limitations. Self reports may be biased
upwards or downwards, and are unlikely to pick up indirect discrimination (OECD, 2013).
However, we employ robust data in our analysis, we acknowledge that reports of
discrimination on their own cannot unambiguously establish the prevalence of labour
market disadvantage, and we argue that the analysis of discrimination complements the
results of other approaches to discrimination, including field experiments and statistical
analysis of ethnic penalties in labour market outcomes.
This paper contributes to the literature on discrimination in a number of ways. First, it
assesses the extent of discrimination experienced by immigrants in the Irish labour market.
Second, it develops a novel classification of national and ethnic groups in the Irish labour
market and population, and examines the extent to which the experience of discrimination
varies between these groups. This may contribute to more rigorous and nuanced
approaches to the analysis of nationality and ethnicity in future Irish research. Third, this is
the first paper, to our knowledge, to shed light on labour market discrimination and the
business cycle, comparing the experience of discrimination in boom and recession, and
complementing previous research on objective indicators of immigrants’ experiences in tight
and slack labour markets.
3
In the next section we outline the context for our research, focusing on recent trends in
migration, the labour market and the economy in Ireland. We then discuss the theoretical
framework that drives our research, and the research questions deriving from that
framework. Then we discuss our data sources and the measurement of discrimination. The
results of the analysis are then presented, followed by a discussion of the findings and their
implications.
Changing Migration Patterns and Ireland’s Boom and Bust
Ireland represents an interesting case because it combines large-scale immigration into a
small labour market that was almost exclusively White and Irish, with a sudden and deep
recession immediately following the peak of immigration.
Ireland, historically a country of net emigration, experienced significant inward migration
between the mid-1990s and 2008, during a period of rapid growth in the economy and
employment. The number of foreign residents increased from 6 percent of the total
population in 2002 to 12.8 percent in 2008, before falling back to 12 percent in the wake of
the economic crisis. Following EU enlargement in 2004 and 2007 there was substantial
immigration from the New Member States (NMS)i so that by 2008, NMS nationals were the
single largest group of immigrants, accounting for 5.5 percent of the total population.
Nationals of the older EU statesii, including the UK, accounted for less than 4 percent of the
population, and those from the rest of the world, accounted for another 3.5 percent
(O’Connell and Joyce, 2013). So, about three quarters of all immigrants in the latter years of
the last decade were Europeans, and mostly White, while about one in four were of more
diverse nationality and ethnicity.
The Irish economy moved into a deep and prolonged recession in 2008, following two
decades of rapid growth. The crisis was multi-dimensional, entailing the bursting of a
property bubble; a banking collapse; contraction in economic activity (Gross National
Product shrank by 3.5 percent in 2008, and almost 10 percent in 2009); state fiscal crisis; and
mass unemployment (O’Connell, 2013). Total employment fell by 13 percent between the
end of 2007 and 2011, but it fell by 21 percent among non-Irish nationals. The national
unemployment rate increased from about 4 percent of the labour force in early 2007 to
almost 15 percent at the end of 2012. In 2012 the unemployment rate was 14.5 percent
among Irish nationals but 17.7 percent among non-Irish nationals. Unemployment varied
between immigrant groups: UK nationals and NMS nationals were particularly hard hit, with
unemployment rates of about 20 percent in 2012; nationals of the older EU countries, with
an unemployment rate of less than 9 percent, fared better than the indigenous labour force
(McGinnity et al., 2013). Economic collapse was accompanied by substantial migratory
flows, but by a rather modest decline in the immigrant population because substantial
outmigration of the non-national population was offset by substantial in-migration: those
who had been displaced from the collapsing sectors/occupations appear to have been
replaced by others with different, more marketable skills. As a result of these migrations,
the non-national population declined by just 1 percentage point, from 13 percent to 12
percent between 2008 and 2012.

4
Theoretical Approaches and Research Questions
Theoretical perspectives on discrimination typically distinguish two perspectives. Becker
(1957), in his groundbreaking theory of discrimination, postulates that some employers and
economic agents have a ‘taste for discrimination’; this taste or preference is associated with
some persons or groups instead of others. Becker reasons that discrimination exists due to
employers exercising a personal prejudice, or taste, against a particular group. Disadvantage
can arise from taste-based discrimination when employers favour the population without a
migration background. Taste based discrimination against minorities’ stems from ethnic
and/or racial prejudice (OECD, 2012); prejudices are a preconceived judgement of, or
preference for a certain group. Some groups may experience higher rates of discrimination
as they are more visibly and/or culturally different. Schneider (2008) finds that the non-
western origin adds to the average level of perceived ethnic threat in European countries.
European evidence suggests that immigrants from Sub-Saharan Africa are most likely to
perceive discrimination followed by immigrants from North Africa, Latin America and Asia
(see OECD, 2012). Another variant of preference-based discrimination emphasises less
conscious psychological processes of in-group favouritism which refers to a tendency to
treat in-group and out-group members differently, which may be manifested in preferential
treatment of the in-group in resource allocation (e.g. in recruitment or promotion decisions)
(Brekke and Mastekaasa, 2008; McGinnity and Lunn, 2011; Quillian, 2006).
Statistical discrimination challenges the notion that prejudice is at the root of discrimination.
This perspective posits that differential outcomes for immigrant groups are due to
information problems. ‘Statistical discrimination is based on rational decisions by maximising
agents who are guided by empirically informed assessments of productivity and risk’
(Baumle and Fossett, 2005: 1252). Decisions result from insufficient information on the part
of employers about minority groups, and this informational deficiency can be expected to be
most acute at labour market entry (Brekke and Mastekaasa, 2008). While preference-based
discrimination relies on the presence of prejudice, statistical discrimination occurs due to
employer’s lack of information about a minority group: employers use race or migration as a
heuristic guide to evaluate job applicants, and their potential productivity, in the absence of
adequate information (Pager et al., 2009). Therefore when choosing a person for a role,
employers will choose a candidate who they believe to be of the highest quality, or are of
the least risk, which in a large pool of potential candidates tend to be people of similar
background (Cornell and Welch, 1996). Discrimination may be reduced over time if
employers gain more information about immigrant or other minority groups, and encounter
such groups more often, and the groups gain labour market experience in a country.
Different perspectives on discrimination also differ in their understanding of the impact of
social and economic context. From an intergroup contact perspective (Blau, 1977; Kanter,
1977), as the presence of minority groups in the workplace increases, workers will have
more opportunities to interact with members of other racial and ethnic groups. Such
interaction allows workers from all racial groups to acquire information about each other,
and gain personal experience with them, making them less likely to indulge in racial
stereotypes and biases. Whereas the former imposes a cost on prejudiced employers, the
latter may be a rational strategy under imperfect information (OECD, 2013). Statistical
5
discrimination could also decline over time as employers gain information about groups that
may over-ride previously-held expectations. Preference based approaches to discrimination
may be less sanguine about the impact of a growth in the proportion of immigrants in a
country. Researchers focusing on anti-immigrant attitudes of majority populations argue
that an increase in the share of immigrants can lead to intensified perceptions of ethnic
threat due to increased economic competition and identity-based cultural conflict
(Manesvka and Achterberg, 2013; Schneider, 2008). Ethnic competition approaches would
that suggest that perceived competition between social groups for scarce resources such as
jobs and housing, may lead to attempts at exclusion of one group by another, which could
provide an underlying rationale for discriminatory behaviour (Coenders and Scheepers,
1998; Olzak, 1992).
There is little previous research on the impact of recession on discrimination in the labour
market, although there is evidence that immigrants, in common with other groups that
suffer disadvantage in the labour market were hit hard by the Great Recession and
elsewhere (Hoynes et al., 2012; Sierminska and Takhtamanova, 2010) and in Ireland
(McGinnity et al., 2013). In a deep recession, with increased competition for scarce
resources, immigrants would be especially likely to be perceived as competing with
members of the host society (Esses et al., 2001). Individuals may perceive more threat and
competition from minorities particularly if the economic context entails competitive
conditions (Schneider, 2008). Coenders et al., (2008) found that support for ethnic
discrimination became more widespread in periods of high immigration and when the
unemployment level had risen strongly. These findings suggest that recession, entailing
greater scarcity of resources, especially jobs, particularly when it coincides with increased
immigration, may give rise to increased perceived competition and to increased support for
discrimination among the indigenous population. However, it should be noted that support
for discrimination in the population in general does not necessarily translate into
discriminatory behaviour on the part of employers.
Measuring Discrimination and Previous Research
Most definitions regard discrimination as differential or unequal treatment of the members
of a group on the basis of their group membership (Levin and Levin, 1982; Pager and
Shepherd, 2008). There is a substantial body of evidence pointing to persistent inequalities
between immigrant or minority groups and natives in the labour market, though variation
exists between immigrant groups. Unemployment has been shown to be consistently higher
among immigrants than natives in Europe (Fleischmann and Dronkers, 2010) and in Ireland
(McGinnity et al., 2013). Immigrants and other minorities also tend to be over-educated:
employed at occupational levels below their skill level in the UK (Heath and Cheung, 2007;
Rafferty, 2012) and in Ireland (Barrett et al., 2006; Barrett and Duffy, 2008, O’Connell and
McGinnity, 2008; Turner, 2010). There is also evidence of substantial wage penalties,
whereby immigrants earn less than Irish natives after taking account of other influential
factors such as age, gender and education (Barrett and McCarthy, 2008; Barrett et al., 2012).
6
While much of the international research on unequal treatment among immigrants focuses
on both nationality and ethnicity (Dustmann and Fabbri, 2005; Rafferty, 2012), most Irish
research has focused on nationality. For example, Barrett and McCarthy (2008) show that
the wage penalty in Ireland is substantially higher among NMS migrants than other migrant
groups, and Barrett et al., (2006) and Turner (2010) show that occupational downgrading is
particularly severe among NMS migrants. Irish evidence on the impact of ethnicity is more
limited, although O’Connell and McGinnity (2008) show that Black immigrants are more
likely to experience unemployment and lower level occupations, even when other factors
are controlled for.
Most of these studies of unequal labour market outcomes among immigrants take account
of differences in other factors, such as gender, education, age and experience. The question
remains as to whether the unexplained residual differences in labour market outcomes
between immigrant and natives can be attributed to discrimination. The difficulty with such
residual approaches, however, is that other influential human capital differences may not be
captured in the data, resulting in inaccurate, and potentially inflated, estimates of possible
discrimination (Pager and Shepherd, 2008). One alternative strategy is to measure
discrimination directly through field experiments. Field experiments of recruitment entail
submitting job applications from fictitious applicants from the majority population and a
minority group/s, matched across a range of relevant characteristics. A field experiment in
Ireland found that candidates with Irish names were more than twice as likely to be called to
interview than candidates with clearly non-Irish names but otherwise equivalent CVs,
however there were no differences within the migrant group (McGinnity and Lunn, 2011).
This method provides powerful evidence of discrimination but is limited to certain sectors
and occupations, and the groups under study at a particular point in time.
Self-report studies ask respondents about their experience of discrimination and can be
collected in large-scale representative surveys, which allow for comparison between the
experience of minority and majority populations. This method has played an important part
in tracking change and stability in discrimination over time (Bond et al., 2010). However, self-
reports are subjective, relying on the assessment of the individual, which may vary
depending on the perspective of the respondents, their expectations and the information
available to them (Blank et al., 2004; Russell et al., 2008). Strong survey design can minimise
this weakness. As discussed below, all questions relating to experiences of discrimination in
the survey used in this article are designed to limit chances of bias in response, the questions
focus on a specific time period and a specific situation.
Previous research using self-reports in Ireland found higher rates of reported discrimination
among immigrants than among White Irish in 2004, in both looking for work and in the
workplace- Black respondents reported particularly high levels of discrimination (O’Connell
and McGinnity, 2008). This echoes findings by McGinnity et al., (2006) on the experience of
racism and discrimination in a range of settings in 2005, including the workplace, where
Black Africans reported the most discrimination of the immigrant groups studied.
7
Research Questions
A major advantage of this article is that it is based on two national surveys that collected
detailed information about the experience of discrimination, as well as a range of relevant
socio demographic indicators, during a booming economy and in the midst of a deep
economic crisis. The data allow us to address a series of research questions comparing
different types of discrimination experienced by Irish natives and immigrants at different
phases of the business cycle.
A key first question is whether immigrants experience higher rates of discrimination in the
labour market than Irish natives. In the light of the theoretical discussion and previous
research on discrimination in Ireland and internationally, our first hypothesis is that
immigrants experience higher rates of labour market discrimination than Irish natives both
while looking for work and in the workplace. Secondly we expect to find variation in the
extent of discrimination between groups. Preference based approaches to discrimination
would suggest that visibly different immigrants, Black Africans and Asians, and non-White
Europeans experience greater discrimination. However, approaches that emphasise
economic competition and in-group favouritism might suggest that NMS nationals would
also experience discrimination, particularly while looking for work, as they constituted the
largest group of immigrants in the labour market during the period in question. Furthermore
this group tend to have lower levels of educational attainment than other migrants, and
many have been competing for low-skilled jobs.
Our third set of questions relates to change over time. Here we encounter uncertainty
because, between 2004 and 2010, the number and proportion of immigrants in the labour
market increased substantially and Ireland experienced a deep recession. Given the severity
of the economic shock and the deterioration in the labour market, our first expectation is
that discrimination against immigrants increased. With applications far exceeding vacancies,
employers can ‘afford’ to select candidates on the basis of nationality/ethnicity. This would
be consistent with in-group favouritism and economic competition approaches. It would also
be consistent with a decline in openness to immigration and in willingness to accept
immigrants of different race/ethnicity, and from poorer countries, observed in the Irish
population between 2006 and 2010 (McGinnity et al., 2013). However, these negative
tendencies might have been offset to the extent that, over time, employers became more
familiar with immigrants – as suggested by statistical discrimination approaches. Whether
such familiarity was sufficient to counteract the impact of in-group favouritism and
increased conflict over resources is unclear. Moreover, it might be noted that discrimination
does entail costs for employers: using ethnicity or nationality as a basis for recruiting or
rewarding workers, rather than productivity differences, is an inefficient use of human
resources - a luxury that employers may not be able to afford in an economic crisis.
Methodology
8
In this study we use self-reports of discrimination to measure the experience of
discrimination while looking for work, and in the workplace in Ireland. We draw on two
large-scale nationally representative surveys on the experiences of discrimination in Ireland,
carried out by the Central Statistics Office (CSO) in 2004 and 2010. These surveys were
collected as special modules of the Quarterly National Household Survey (QNHS), which is
the official source of labour market indicators for Ireland, and includes a wide range of
measures of individual characteristics. The Equality modules asked individuals whether they
had experienced discrimination across a range of life domains over the previous two years.
Respondents were informed that when the term discrimination is used it refers to this legal
definition only (CSO, 2011).
Our analysis focuses specifically on two questions relating to self-reports of work-based
discrimination.
In the past two years, have you personally felt discriminated against
in the workplace?
• Yes
• No
• Not applicable (don’t work, haven’t been working in the past 2 years)
• Don’t know.
And
In the past two years, have you personally felt discriminated against
while looking for work?
• Yes
• No
• Not applicable (don’t work, haven’t been looking for work in the past 2
years)
• Don’t know.
We restrict the analysis to the working population aged 18-64. All analysis is based on the
eligible population: we exclude respondents who answered ‘not applicable’ to the question
in order to exclude those who were not at work, or had not been looking for work.
In 2012 the CSO released a more detailed nationality breakdown in the QNHS micro data
than is typically available in standard releases. The more detailed nationality breakdown
allows us to further disaggregate non-EU nationalities, an extremely heterogeneous group of
countries whose populations would have very different labour market access and
trajectories. Previous research on discrimination in the Irish labour market (e.g. O’Connell
and McGinnity, 2008) has focused on a very broad nationality groups (Irish and English vs.
non-English speaking countries). The new more detailed breakdown allows us to disentangle
the experience of discrimination by looking more specifically at the experience of nationality
groupings that were not previously identified. The Equality modules are particularly useful
for our purposes because, unusually in Irish official statistics, they also collect information on
ethnicity.iii

9
This analysis combines nationality and ethnicity to form national-ethnic groups. iv
These
groups were created on the grounds that they would be comparable, and had similar access
to the Irish labour market and exhibited similar labour market trajectories.v Merging
ethnicity with nationality results in eight main national-ethnic groups: White Irish, White UK,
White EU-13vi, White New Member State (NMS), White non-EU, Black African, Asian, and
Minority Ethnicity EU.vii
The ‘White non-EU’ category refers to people of White ethnicity
from a range of countries outside the EU, including North America, Australia, New Zealand
and Asia; this group are most are likely to be English-speaking, and can be expected to share
similar labour market experiences. The ‘Minority Ethnicity EU’ group consists of all non-
White Europeans, including Black, Asian and ‘Other’ Irish nationals.viii
Table 1 outlines the
national-ethnic groups and their distribution across the two samples.
Table 1 National Ethnic Groups, 2004 and 2010
National-Ethnic Groups 2004 2010
n % n %
White:
Irish 23,047 93.6 15,095 89.7
UK 475 1.9 355 2.1
EU-13 188 0.8 147 0.9
EU NMS 161 0.7 644 3.8
Non-EU 275 1.1 150 0.9
Black African 97 0.4 111 0.7
Asian 100 0.4 104 0.6
Minority Ethnicity EU 144 0.6 119 0.7
Subtotal 24,487 99.5 16,725 99.4
Unallocated residual 114 0.5 82 0.5
Ethnicity Missing 9 0.0 14 0.1
Total 24,610 100 16,821 100
Source: QNHS Equality Module, 2004 and 2010.
Our primary objective in this study is to evaluate the association between discrimination and
ethnicity, nationality, and recession. We examine whether if given the same characteristics
as the White Irish group, immigrants report labour market discrimination at higher rates
than natives. We use binary logistic regression models for our analysis, separate models are
run for 2004 and 2010, and interaction models are used to test for significant differences
over time.
Dependent Variables
Discrimination when looking for work and discrimination in the workplace are the
dependent variables of our study. The dummy is coded 1 if the person has experienced
discrimination in the said domain, and 0 if they have not. All analysis is based on the
10
population ‘at risk’ of discrimination. As such the population at risk of discrimination while
looking for work is those aged 18-64 who are employed and unemployed, and those
currently inactive. The analysis of discrimination in the workplace is confined to the smaller
group who were employees at the time of the survey.ix
Independent Variables
Our key focus is on differences in the experience of discrimination across national-ethnic
groups. Our models control for gender, age, education, and duration of residence in country
as they are all considered potentially influential covariates, and there is an extensive
research literature indicating that these are key factors in labour market outcomes.
We expect newly arrived immigrants to experience higher unemployment rates regardless of
the recession (Dustmann et al., 2003; Wheatley Price, 2001). This disadvantage is also
expected to decline as immigrants gain more knowledge and experience of, and establish
networks in, new labour markets (Brekke and Mastekaasa, 2008; Chiswick, 1997). However,
we note that Irish research has not found evidence of occupational assimilation as a function
of time spent in the country (Barrett and Duffy, 2008). We measure duration of residence in
country by including a dummy variable coded 1 if the individual has been resident in Ireland
for two years or less, and 0 if they have been resident for longer.x
Aside from the control for duration, all control variables included are for the entire working
population aged 18-64, so any effects in age, gender etc. will be based on the full sample, of
whom the majority are White Irish nationals. In the models of discrimination in the
workplace we control for sector employed in, as working conditions may affect the
experiences of discrimination. xi
Measuring Change over Time
An interaction model between the two years was run on pooled data, in order to test for
significant differences over time. The interaction terms provide estimates of the effects of
both underlying trends and original predictor variables. If we find significant interaction
effects we know that discrimination has increased or decreased for a national-ethnic group
between 2004 and 2010.
By controlling for certain characteristics we can evaluate how work based discrimination
varies, and assess which groups are more vulnerable to discrimination. The models allow for
us to investigate the effects of combinations of these characteristics, ensuring that some
possible influences, net of discrimination, are controlled for. Crucially, they allow
comparisons with Irish natives. However this is not a dedicated survey of migrants, so it does
not include all relevant variables in the analyses like host language proficiency, ethnically
constrained social networks and declining work motivation due to expectations of
discrimination, all of which have been linked to migrants’ experience in the labour market
(Perreira et al., 2007). It is important to note that rates of discrimination reported in this
module are based on the perception of the respondents, as discussed above.
11
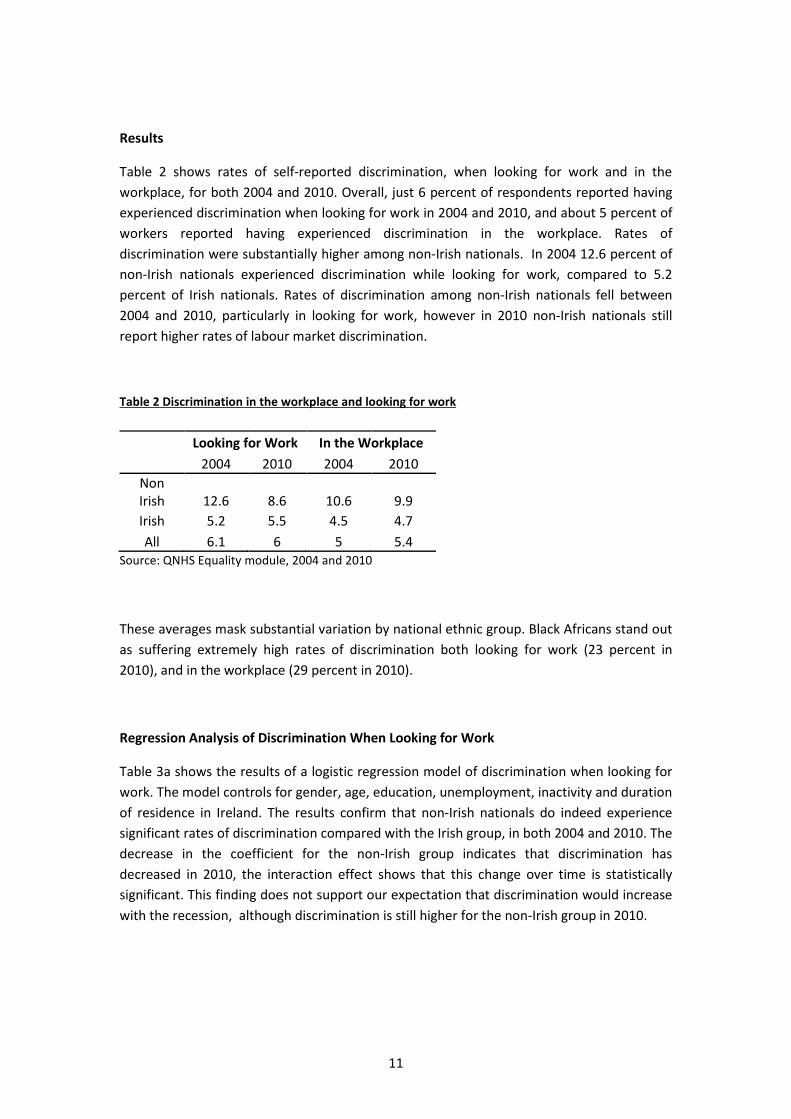
Results
Table 2 shows rates of self-reported discrimination, when looking for work and in the
workplace, for both 2004 and 2010. Overall, just 6 percent of respondents reported having
experienced discrimination when looking for work in 2004 and 2010, and about 5 percent of
workers reported having experienced discrimination in the workplace. Rates of
discrimination were substantially higher among non-Irish nationals. In 2004 12.6 percent of
non-Irish nationals experienced discrimination while looking for work, compared to 5.2
percent of Irish nationals. Rates of discrimination among non-Irish nationals fell between
2004 and 2010, particularly in looking for work, however in 2010 non-Irish nationals still
report higher rates of labour market discrimination.
Table 2 Discrimination in the workplace and looking for work
Looking for Work In the Workplace
2004 2010 2004 2010
Non
Irish 12.6 8.6 10.6 9.9
Irish 5.2 5.5 4.5 4.7
All 6.1 6 5 5.4
Source: QNHS Equality module, 2004 and 2010
These averages mask substantial variation by national ethnic group. Black Africans stand out
as suffering extremely high rates of discrimination both looking for work (23 percent in
2010), and in the workplace (29 percent in 2010).
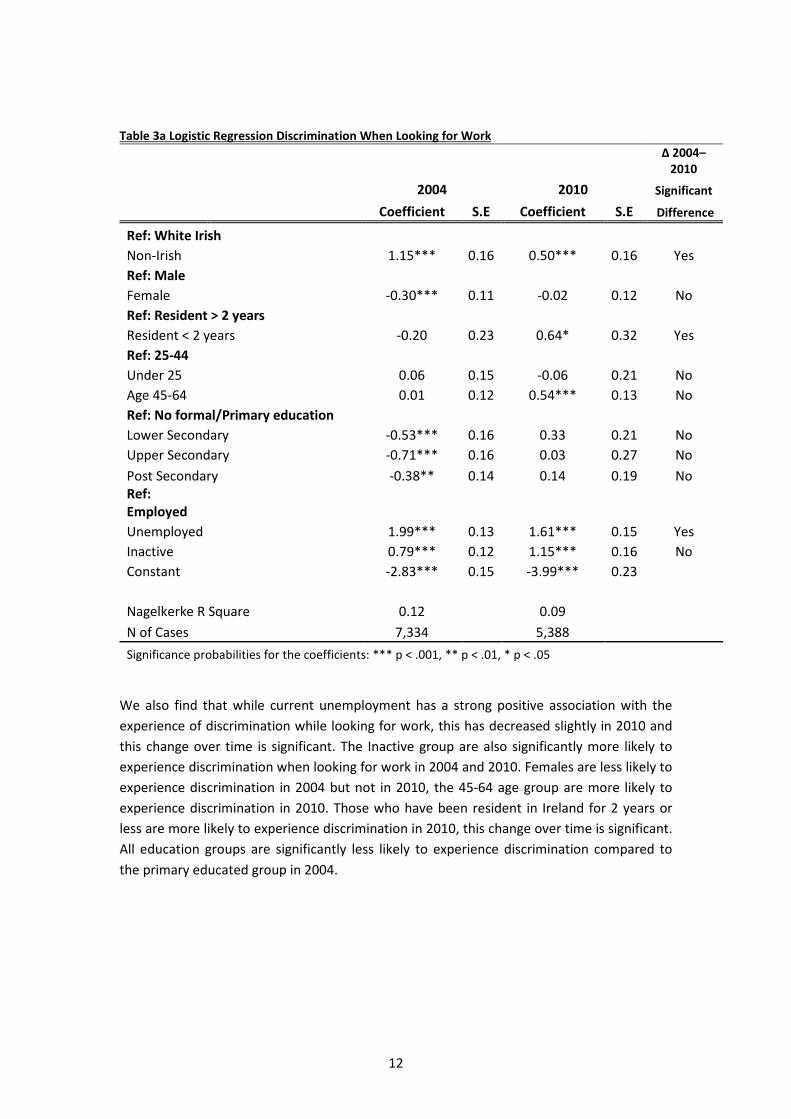
Regression Analysis of Discrimination When Looking for Work
Table 3a shows the results of a logistic regression model of discrimination when looking for
work. The model controls for gender, age, education, unemployment, inactivity and duration
of residence in Ireland. The results confirm that non-Irish nationals do indeed experience
significant rates of discrimination compared with the Irish group, in both 2004 and 2010. The
decrease in the coefficient for the non-Irish group indicates that discrimination has
decreased in 2010, the interaction effect shows that this change over time is statistically
significant. This finding does not support our expectation that discrimination would increase
with the recession, although discrimination is still higher for the non-Irish group in 2010.
12
Table 3a Logistic Regression Discrimination When Looking for Work
2004 2010
Δ 2004–
2010
Significant
Coefficient S.E Coefficient S.E Difference
Ref: White Irish
Non-Irish 1.15*** 0.16 0.50*** 0.16 Yes
Ref: Male
Female -0.30*** 0.11 -0.02 0.12 No
Ref: Resident > 2 years
Resident < 2 years -0.20 0.23 0.64* 0.32 Yes
Ref: 25-44
Under 25 0.06 0.15 -0.06 0.21 No
Age 45-64 0.01 0.12 0.54*** 0.13 No
Ref: No formal/Primary education
Lower Secondary -0.53*** 0.16 0.33 0.21 No
Upper Secondary -0.71*** 0.16 0.03 0.27 No
Post Secondary -0.38** 0.14 0.14 0.19 No
Ref:
Employed
Unemployed 1.99*** 0.13 1.61*** 0.15 Yes
Inactive 0.79*** 0.12 1.15*** 0.16 No
Constant -2.83*** 0.15 -3.99*** 0.23
Nagelkerke R Square 0.12 0.09
N of Cases 7,334 5,388
Significance probabilities for the coefficients: *** p < .001, ** p < .01, * p < .05
We also find that while current unemployment has a strong positive association with the
experience of discrimination while looking for work, this has decreased slightly in 2010 and
this change over time is significant. The Inactive group are also significantly more likely to
experience discrimination when looking for work in 2004 and 2010. Females are less likely to
experience discrimination in 2004 but not in 2010, the 45-64 age group are more likely to
experience discrimination in 2010. Those who have been resident in Ireland for 2 years or
less are more likely to experience discrimination in 2010, this change over time is significant.
All education groups are significantly less likely to experience discrimination compared to
the primary educated group in 2004.
13
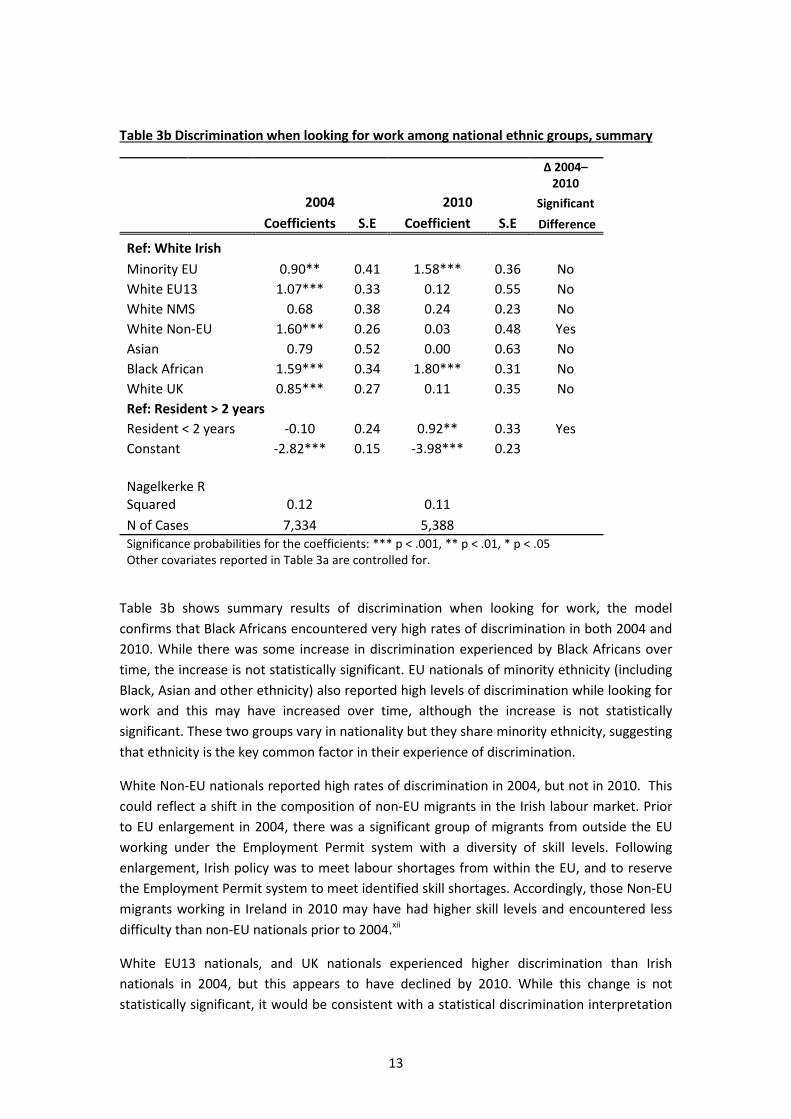
Table 3b Discrimination when looking for work among national ethnic groups, summary
2004 2010
Δ 2004–
2010
Significant
Coefficients S.E Coefficient S.E Difference
Ref: White Irish
Minority EU 0.90** 0.41 1.58*** 0.36 No
White EU13 1.07*** 0.33 0.12 0.55 No
White NMS 0.68 0.38 0.24 0.23 No
White Non-EU 1.60*** 0.26 0.03 0.48 Yes
Asian 0.79 0.52 0.00 0.63 No
Black African 1.59*** 0.34 1.80*** 0.31 No
White UK 0.85*** 0.27 0.11 0.35 No
Ref: Resident > 2 years
Resident < 2 years -0.10 0.24 0.92** 0.33 Yes
Constant -2.82*** 0.15 -3.98*** 0.23
Nagelkerke R
Squared 0.12 0.11
N of Cases 7,334 5,388
Significance probabilities for the coefficients: *** p < .001, ** p < .01, * p < .05
Other covariates reported in Table 3a are controlled for.
Table 3b shows summary results of discrimination when looking for work, the model
confirms that Black Africans encountered very high rates of discrimination in both 2004 and
2010. While there was some increase in discrimination experienced by Black Africans over
time, the increase is not statistically significant. EU nationals of minority ethnicity (including
Black, Asian and other ethnicity) also reported high levels of discrimination while looking for
work and this may have increased over time, although the increase is not statistically
significant. These two groups vary in nationality but they share minority ethnicity, suggesting
that ethnicity is the key common factor in their experience of discrimination.
White Non-EU nationals reported high rates of discrimination in 2004, but not in 2010. This
could reflect a shift in the composition of non-EU migrants in the Irish labour market. Prior
to EU enlargement in 2004, there was a significant group of migrants from outside the EU
working under the Employment Permit system with a diversity of skill levels. Following
enlargement, Irish policy was to meet labour shortages from within the EU, and to reserve
the Employment Permit system to meet identified skill shortages. Accordingly, those Non-EU
migrants working in Ireland in 2010 may have had higher skill levels and encountered less
difficulty than non-EU nationals prior to 2004.xii
White EU13 nationals, and UK nationals experienced higher discrimination than Irish
nationals in 2004, but this appears to have declined by 2010. While this change is not
statistically significant, it would be consistent with a statistical discrimination interpretation

14
in which employers become increasingly familiar with European workers and their
qualifications and skills.
Duration of residence had no impact in 2004, but those who had been resident for less than
2 years in 2010 were more likely to report experiencing discrimination, the increase over
time is significant. Given that those with less than 2 years residence in 2010 had arrived
after the onset of the Recession, we know that there was substantial inward and outward
migration in 2008-2010, so many of the new arrivals may have migrated to take jobs in
relatively buoyant sectors, while those who had been displaced form contracting sectors,
particularly construction, sales and hospitality, may have encountered greater difficulty in
finding work and been more exposed to discrimination.
Table 4a Logistic Discrimination in the Workplace
2004 2010
Δ 2004–
2010
Significant
Coefficients S.E Coefficients S.E Difference
Non-
Irish 0.82*** 0.17 0.77*** 0.15 No
Female 0.36*** 0.10 0.52*** 0.13 No
Resident >2 years -0.05 0.27 -0.37 0.45 No
Under
25 -0.14 0.17 -0.18 0.27 No
Age 45-64 -0.09 0.10 -0.01 0.12 No
Lower Secondary -0.40** 0.20 0.01 0.27 No
Upper Secondary -0.17 0.17 -0.34 0.24 No
Post Secondary 0.20 0.15 0.06 0.22 No
Constant -3.15*** 0.19 -3.37*** 0.26
NagelKerke R squared 0.03 0.06
N of Cases 9,987 6,428
Significance probabilities for the coefficients: *** p < .001, ** p < .01, * p < .05
We now look at reports of discrimination in the workplace, table 4a confirms that non-Irish
nationals are more likely to experience significant rates of discrimination in the workplace in
2004 and 2010. The coefficients for non-Irish nationals demonstrate that discrimination in
the workplace has dropped marginally in 2010, but remains fairly constant over time and the
change is not statistically significant. Again this does not support the expectation that
discrimination among non-Irish nationals would increase with a recession. We also find that
females experience high rates of discrimination at work throughout the period, and this has
increased slightly over time, however the increase is not significant.
15
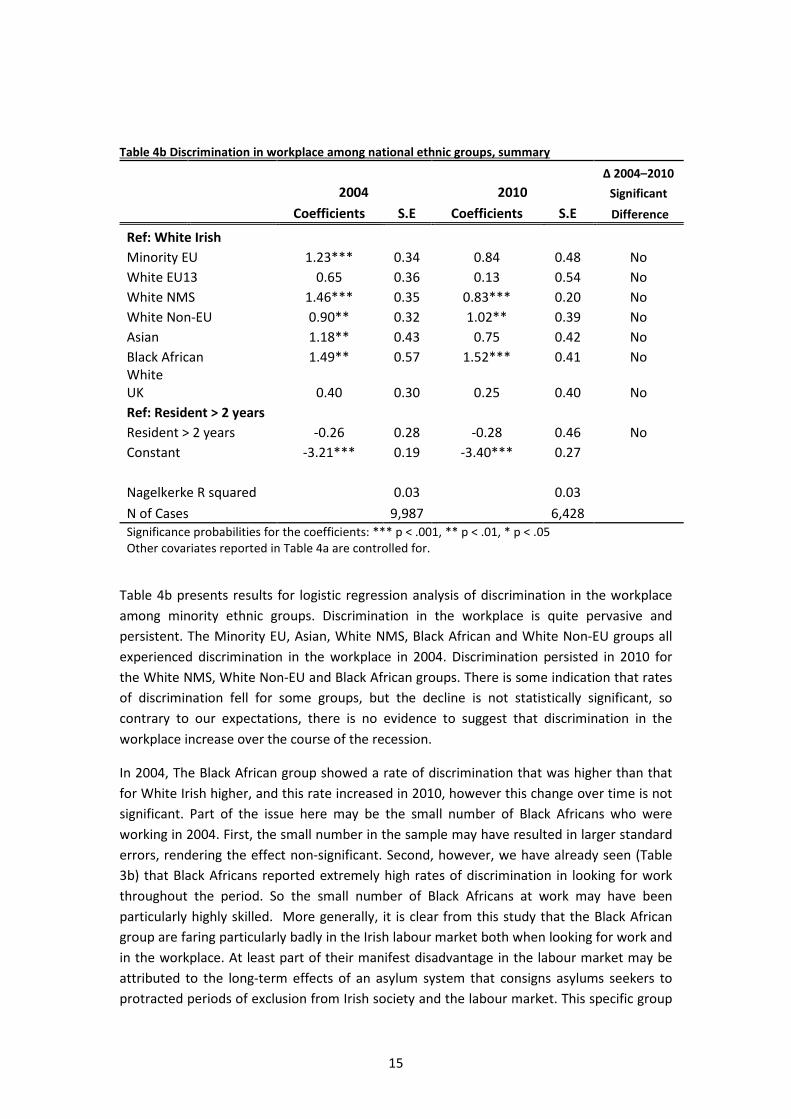
Table 4b Discrimination in workplace among national ethnic groups, summary
2004 2010
Δ 2004–2010
Significant
Coefficients S.E Coefficients S.E Difference
Ref: White Irish
Minority EU 1.23*** 0.34 0.84 0.48 No
White EU13 0.65 0.36 0.13 0.54 No
White NMS 1.46*** 0.35 0.83*** 0.20 No
White Non-EU 0.90** 0.32 1.02** 0.39 No
Asian 1.18** 0.43 0.75 0.42 No
Black African 1.49** 0.57 1.52*** 0.41 No
White
UK 0.40 0.30 0.25 0.40 No
Ref: Resident > 2 years
Resident > 2 years -0.26 0.28 -0.28 0.46 No
Constant -3.21*** 0.19 -3.40*** 0.27
Nagelkerke R squared 0.03 0.03
N of Cases 9,987 6,428
Significance probabilities for the coefficients: *** p < .001, ** p < .01, * p < .05
Other covariates reported in Table 4a are controlled for.
Table 4b presents results for logistic regression analysis of discrimination in the workplace
among minority ethnic groups. Discrimination in the workplace is quite pervasive and
persistent. The Minority EU, Asian, White NMS, Black African and White Non-EU groups all
experienced discrimination in the workplace in 2004. Discrimination persisted in 2010 for
the White NMS, White Non-EU and Black African groups. There is some indication that rates
of discrimination fell for some groups, but the decline is not statistically significant, so
contrary to our expectations, there is no evidence to suggest that discrimination in the
workplace increase over the course of the recession.
In 2004, The Black African group showed a rate of discrimination that was higher than that
for White Irish higher, and this rate increased in 2010, however this change over time is not
significant. Part of the issue here may be the small number of Black Africans who were
working in 2004. First, the small number in the sample may have resulted in larger standard
errors, rendering the effect non-significant. Second, however, we have already seen (Table
3b) that Black Africans reported extremely high rates of discrimination in looking for work
throughout the period. So the small number of Black Africans at work may have been
particularly highly skilled. More generally, it is clear from this study that the Black African
group are faring particularly badly in the Irish labour market both when looking for work and
in the workplace. At least part of their manifest disadvantage in the labour market may be
attributed to the long-term effects of an asylum system that consigns asylums seekers to
protracted periods of exclusion from Irish society and the labour market. This specific group
16
of immigrants usually has less favourable labour market outcomes due to a less positive
selection processes, and greater difficulties in adapting to a new environment resulting from
stressful experiences surrounding their migration (Fleischmann and Dronkers, 2010).
Unfortunately, the QNHS does not provide information on the visa/residency status of non-
Irish nationals, so we cannot measure how many Black African individuals are refugees, nor
attribute the respondents’ experience of discrimination to their residency status. It could
also be however that employers assume that Black Africans were asylum seekers and had
long periods out of the labour market, even if this is not the case, a process known as
stereotyping.
The White UK and EU13 groups differ from the general trend insofar as they do not differ
from the White Irish in reported experience of discrimination. These individuals have had
access to the Irish labour market for a very long time and therefore may be less likely to
experience discrimination in the workplace because they are more integrated. Moreover,
while we cannot measure this, many of those classified as UK nationals may be from
Northern Ireland, and might expect to receive similar treatment in the workplace as
nationals of the Irish Republic.
We can reject the expectation that ethnic competition led to an increase in discrimination,
as reports of discrimination in the workplace have remained relatively stable over time, or
decreased for some groups. Discrimination in the workplace has increased for the Black
African group, this supports the expectation that groups already facing labour market
disadvantage would be more likely to face additional problems when the economy is
unstable.
Discussion
In this article we examined the experience of discrimination in the labour market in Ireland.
We examined the extent to which discrimination varies across different national ethnic
groups, and whether discrimination increased between 2004, during an economic boom,
and 2010, in the midst of a severe recession.
We find that overall immigrants do experience higher rates of discrimination in looking for
work and in the workplace in both boom and recession. We find substantial variation in
discrimination across national-ethnic groups. In looking for work, ethnicity is particularly
important, and we find that Black Africans and EU nationals of minority ethnicity were
particularly likely to experience this form of discrimination. In the workplace, we find that
most national-ethnic groups, apart from the White UK, and White EU13 groups are more
likely than White Irish to experience discrimination in 2004. By 2010 the Black African, White
NMS and White Non-EU groups experience more discrimination than White Irish nationals.
The finding that immigrants experience higher rates of discrimination than natives is
consistent with previous research on immigrants experience of discrimination in Ireland
(McGinnity et al., 2006; McGinnity and Lunn, 2011; O’Connell and McGinnity, 2008).

17
Contrary to our expectations we do not find that discrimination has increased significantly in
a context of recession and a growing immigrant population. In looking for work, the gap
between immigrants and White Irish actually falls between 2004 and 2010. In the workplace
the gap between immigrants and White Irish remains stable. We can thus reject the
hypothesis that a labour market crisis and an increase in the proportion of immigrants in the
population, leads to an increase in perceived ethnic competition for jobs and thus to an
increase in discrimination against immigrants. As far as we are aware, this is the first
research to examine the impact of economic crisis on the experience of discrimination in the
labour market.
Why do reports of discrimination in recruitment among most minority groups fall? In 2004
Ireland was a relatively new country of immigration, and employers may not have had
experience with migrant groups. By 2010 this will have changed. The fall in discrimination
while looking for work provides some support for a statistical discrimination approach. Over
time, for most groups, discrimination while looking for has decreased, and this may be
because employers are better able to identify the work-related characteristics of immigrant
job applicants. As we are not using panel data we cannot tell, for example, if any patterns of
improved outcomes are the result of integration, cohort effects, selective out-migration, or
changing immigrant (self) selection (Barrett and Duffy, 2008).
However, this is not true of all groups: visibly different ethnic groups, Black African and
Minority ethnicity EU groups report very high rates of discrimination when looking for work.
Discrimination may have fallen for other groups, but not these two. This is consistent with
discrimination based on racial prejudice, and a preference for White immigrants. It may also
be that negative stereotypes of Black African migrants have developed in Ireland, linked to a
large proportion of African migrants coming to Ireland as asylum seekers. Employers may
assume that individuals have spent long periods of time out of work, whether or not this is
true. Whatever the explanation this, combined with high rates of unemployment and low
rates of employment among these groups suggest these groups are particularly vulnerable
and of policy concern.
18
References
Barrett A, Bergin A and Duffy D (2006) The labour market characteristics and labour market
impacts of immigrants in Ireland. The Economic and Social Review 37(1): 1–26.
Barrett A and Duffy D (2008) Are Ireland’s immigrants integrating into its labour market?
International Migration Review, 42(3): 597–615.
Barrett A and McCarthy Y (2008) Immigrants and welfare programmes: exploring the
interactions between immigrant characteristics, immigrant welfare dependence and welfare
policy. Oxford Review of Economic Policy, 24(3): 543–560.
Barrett A, McGuinness S and O’Brien M (2012) The immigrant earnings disadvantage across
the earnings and skills distributions: the case of immigrants from the EU’s new member
states. British Journal of Industrial Relations, 28(1): 99–111.
Baumle A and Fossett M.A. (2005) Statistical Discrimination in Employment: Its Practice,
Conceptualization, and Implications for Public Policy. American Behavioral Scientist, 48(9):
1250-1274.
Becker G (1957, 1971) The Economics of Discrimination. Chicago: The University of Chicago
Press, 2nd
Edition.
Blank R, Dabady M and Citro C (eds) (2004) Measuring Racial Discrimination. Washington
DC: The National Academies Press.
Blau P.M. (1977) Inequality and Heterogeneity: A primitive theory of social structure. New
York: Freepress.
Bond L, McGinnity F and Russell H (eds) (2010) Making Equality Count: Irish and
International Research Measuring Equality and Discrimination. Dublin: Equality Authority.
Brekke I and Mastekaasa A (2008) Highly educated immigrants in the Norwegian labour
market: permanent disadvantage?. Work Employment and Society 22(3): 507-526.
Coenders M and Scheepers P (1998) Support for Ethnic Discrimination in the Netherlands
1979–1993: Effects of Period, Cohort, and Individual Differences. European Sociological
Review 14(4): 405-422.
Coenders M, Lubbers M, Scheepers P and Verkuyten M (2008) More than two decades of
changing ethnic attitudes in the Netherlands. Journal of Social Issues 64(2): 269-285
Cornell B and Welch I (1996) Culture, Information and Screening Discrimination. Journal of
Political Economy 104(3): 542-571.
CSO (2005) Quarterly National Household Survey: Equality, Quarter 4 2004. Dublin: Central
Statistics Office.
19
CSO (2011) Quarterly National Household Survey: Equality, Quarter 4 2010. Dublin: Central
Statistics Office.
Dustmann C and Fabbri F (2005) Immigrants in the British labour market. Fiscal Studies 26(4):
423-470.
Esses VM, Dovidio JF, Jackson, LM and Armstrong TL (2001) The immigration dilemma: The
role of perceived group competition, ethnic prejudice, and national identity. Journal of Social
Issues, 57(3): 389-412
Heath AF and Cheung SY (Eds.) (2007) Unequal Chances: Ethnic Minorities in Western Labour
Markets. Oxford: British Academy/Oxford University Press.
Hoynes H, Miller D and Schaller J (2012) Who Suffers During Recession?. NBER Working
Paper 17951.
Fleischmann F and Droenkers J (2010) Unemployment among immigrants in European
labour markets: an analysis of origin and destination effects. Work, Employment and Society
24(2): 337-354.
Kanter, RM (1977) Some effects of proportions on group life: Skewed sex rations and
responses to token women. American Journal of Sociology 82 (5): 965-90.
Levin J, and Levin W (1982) The functions of discrimination and prejudice (2nd ed.). New
York: Harper and Row.
Manevska K and Achterberg P (2013) Immigration and Perceived Ethnic Threat: Cultural
Capital and Economic Explanations. European Sociological Review 29 (3): 437-449.
McGinnity F, O’Connell P, Quinn E and Williams J (2006) Migrants’ Experience of Racism and
Discrimination in Ireland. Dublin: ESRI.
McGinnity F and Lunn P (2011) Measuring discrimination facing ethnic minority job
applicants: an Irish Experiment. Work, Employment and Society, 25 (4): 693-708.
McGinnity F, Quinn E, Kingston G and O’Connell P (2013) Annual Monitoring Report on
Integration 2012. Dublin: The Integration Centre/ESRI.
O’Connell P and McGinnity F (2008) Immigrants at Work: Ethnicity and Nationality in the
Irish Labour Market. Dublin: Equality Authority.
O’Connell P (2013) Cautious Adjustment in a Context of Economic Collapse: The Public
Sector in the Irish Crisis. In: Vaughan-Whitehead D (ed.) Public Sector Shock: The Impact of
Policy Retrenchment in Europe. Cheltenham: Edward Elgar, 337-370.
O’Connell P and Joyce C (2013) International Migration in Ireland, 2012. Geary Working
Paper 2013/04. Dublin: UCD Geary Institute.

20
Olzak S (1992) The Dynamics of Ethnic Competition and Conflict. Stanford: Stanford
University Press.
OECD (2012) Settling In: Indicators of Immigrant Integration. Paris: OECD Publishing.
OECD (2013) International Migration Outlook 2013. Paris: OECD Publishing.
Pager D and Shepherd H (2008) The sociology of discrimination: racial discrimination in
employment, housing, credit, and consumer markets. Annual Review of Sociology 34: 181–
209.
Pager D, Western B and Bonikowski B (2009) Discrimination in a Low Wage Labor Market: A
Field Experiment. American Sociological Review 74: 777-799.
Quillian L (2006) New approaches to understanding racial prejudice and discrimination.
Annual Review of Sociology 32: 299–328.
Rafferty A (2012) Ethnic penalties in graduate level over-education, unemployment and
wages: evidence from Britain. Work, Employment and Society, 26(6): 987-1006.
Russell H, Quinn E, King O’Riain R and McGinnity F (2008) The Experience of Discrimination in
Ireland: Analysis of the QNHS Equality Module. Dublin: Equality Authority and ESRI.
Schneider S (2008) Anti-Immigrant Attitudes in Europe: Outgroup Size and Perceived Ethnic
Threat. European Sociological Review 24(1): 53-67.
Sierminska, E and Takhtamanova Y (2010) Job Flows, Demographics and the Great Recession.
DIW Discussion Paper 1042. Berlin: Deutsches Institut fur Wirtschaftsforshung.
Turner T (2010) The jobs immigrants do: issues of displacement and marginalisation in the
Irish labour market. Work, Employment and Society 24(2): 318–336.
i EU New Member States (NMS) refers to States that acceded in 2004 and 2007: Bulgaria, Cyprus,
Czech Republic, Estonia, Hungary, Latvia, Lithuania, Malta, Poland, Romania, Slovakia, and Slovenia.
Bulgarians and Romanians were defined as the ‘Rest of Europe’ in 2004 and as EU NMS in 2010,
following their accession in 2007. ii ‘Older EU States refers to the ‘Old’ EU15 Member States including Ireland and the UK.
iii Ethnicity has been collected in the Census since 2006, but it is not collected routinely in the QNHS.
iv As a robustness check we ran all models with ethnicity and nationality as separate categories.
v Some of the national-ethnic groups are still somewhat ethnically diverse, however the groups are
comparable in terms of their labour market experience and cultural background. vi EU 13 refers to the ‘Old’ EU15 Member States excluding Ireland and the UK: Austria, Belgium,
Denmark, Finland, France, Germany, Greece, Italy, Luxembourg, Netherlands, Portugal, Spain, and
Sweden. vii
Bulgarians and Romanians, who tend to have lower skill levels, on average, were in the White Non-
EU group in 2004 but the White NMS group in 2010. viii
A small and diverse unallocated residual group of a combination of minority ethnicity that did not
lend itself to a meaningful classification was excluded (0.5% sample). ix We exclude the self employed from the analysis.
x Further analysis on duration spent in country was tested, results are available on request.
xi The latter coefficients are not reported in the tables, results are available on request.

21
xii
Bulgarians and Romanians were in the White Non-EU group in 2004, and in the White NMS group in
2010.