discussion paper no. 14-16 - sapir.tau.ac.il · i eran yashiv - the eitan berglas school of...
TRANSCRIPT
THE PINHAS SAPIR CENTER FOR DEVELOPMENT
TEL AVIV UNIVERSITY
“The Labor Market of Arab Israeli Men”
Eran Yashivi
Discussion Paper No. 14-16
September 2016
Thanks to The Pinhas Sapir Center for Development, Tel Aviv University for their
financial support.
I thank Nadav Kunievsky and especially David Eliezer for research assistance. Any errors are my
own.
i Eran Yashiv - The Eitan Berglas School of Economics, Tel Aviv University. Email: [email protected]
Abstract
Arab men in Israel have lower labor market involvement and poorer outcomes
relative to Jews, especially after the age of 40. The paper examines this state of
affairs using a model of labor force participation and retirement from work.
Key results indicate, inter alia, that: education and high-skills promote
participation; education, in and of itself, does not alleviate poverty; and
residency location and household composition are important for these labor
market patterns.
The Labor Market of Arab Israeli Men
1 Introduction
The patterns of labor force involvement of Arab men in Israel show sub-
stantial differences w.r.t. Jewish men and norms in advanced economies.
This paper sets out to determine the causes for this situation. The paper
examines this state of affairs using a model of labor force participation
and retirement from work. Key results indicate, inter alia, that: education
and high-skills promote participation; education, in and of itself, does not
alleviate poverty; and residency location and household composition are
important for these labor market patterns. The paper is structured as fol-
lows: Section 2 briefly reviews the literature and Section 3 presents and
discusses the key facts. Section 4 delineates a relevant model. Section 5
presents the empirical work, including the data and the results. Section
6 analyzes the implications of the empirical findings, including those for
policy. Section 7 concludes.
2
2 Literature
A small literature has characterized the significant gaps between the labor
market outcomes of Arabs and Jews in Israel.
Asali (2006) examined the topic of wage discrimination. In his study
he documented the differentials between the wages of Jewish men and the
wages of Arab men in the period 1990-2003 and estimated a wage regres-
sion in order to study the reasons for the wage differential. The observed
wage differentials were decomposed into three components: differentials
originating in differences in human capital, differentials originating in dis-
crimination in occupation, and differentials originating in discrimination
in wages. The study’s findings attest to the existence of wage discrimina-
tion and its intensification in the course of the sample period.
Cohen and Haberfeld (2007), who studied the effect of the growth in
income inequality on the Israeli labor market during the years 1975-2001,
found that the discrimination toward workers from the Arab sector did
not diminish from 1992 onward and perhaps even intensified.
Miari, Nevuani and Hatab (2011) found that during the years 1997-
2009 distinctive wage discrimination remained constant throughout, its
level fluctuating in accordance with changes in the economy, e.g., waves
of immigration, the intifada, the number of foreign workers, etc.
3
Yashiv and Kasir (2011) examined the patterns of labor force partici-
pation among Israeli Arabs through the estimation of participation equa-
tions. There are two main findings: an atypical pattern of participation
over the life cycle among Arab men, i.e., a sharp drop in participation
at a relatively early age, and a low average rate of participation among
women, with a large degree of variation.
Regarding the former issue, the literature in general typically focuses
on early retirement relative to the mandatory retirement age (typically 65
or 67). For reviews see Krueger and Meyer (2002) and Tatsiramos and van
Ours (2014). While for Arab men retirement starts much earlier, some of
the explanatory factors may be the same: health problems, attrition due to
work in physical jobs, the provision of disability insurance, the provision
of unemployment benefits and/or social assistance, and the existence of
inter-generational transfers.
Yashiv and Kasir (2015) point out the similarities and differences be-
tween the situation of Arab Israelis and Muslim minorities in Europe. The
differences relate to the fact the former group is a native minority, while
the latter is the result of immigration over decades. Israel has conflictual
relations with the Arab world surrounding it, which impact the relations
of the Jewish majority and its Muslim minority. This is not the case for
Moslems in Europe. But there are also important similarities. In both cases
4
these are Muslim minorities in advanced economies that are economically
disadvantaged; claims of discrimination are prevalent; cultural issues are
important for labour market outcomes; and policy is lacking in both cases.
Hence, there is some room to learn from the Israeli experience in the Eu-
ropean case.
3 Key Facts
To introduce the relevant issues consider the stylized facts that come out of
Figures 1-8. The data are taken from the Labor Force Survey of the Central
Bureau of Statistics and are outlined in more detail below.
Figures 1-8
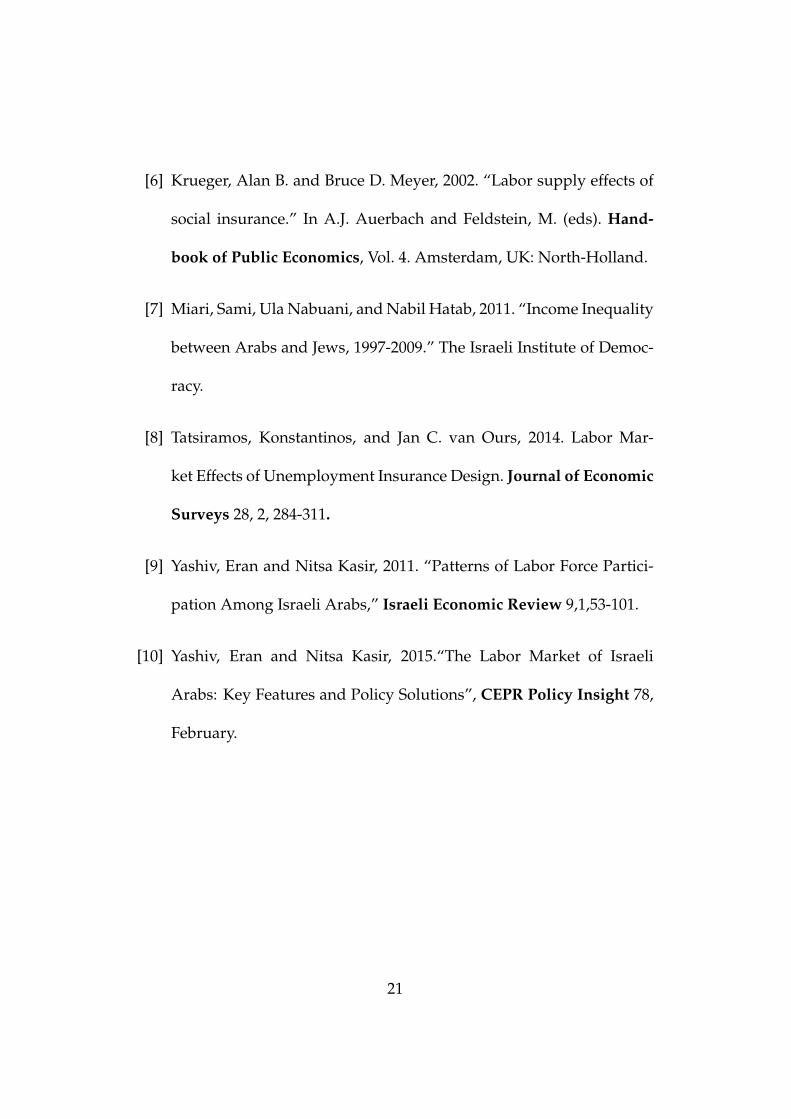
Figure 1 shows that Jewish men participate at higher rates than Arab
men except at very young ages; the most striking differential is in the 40-64
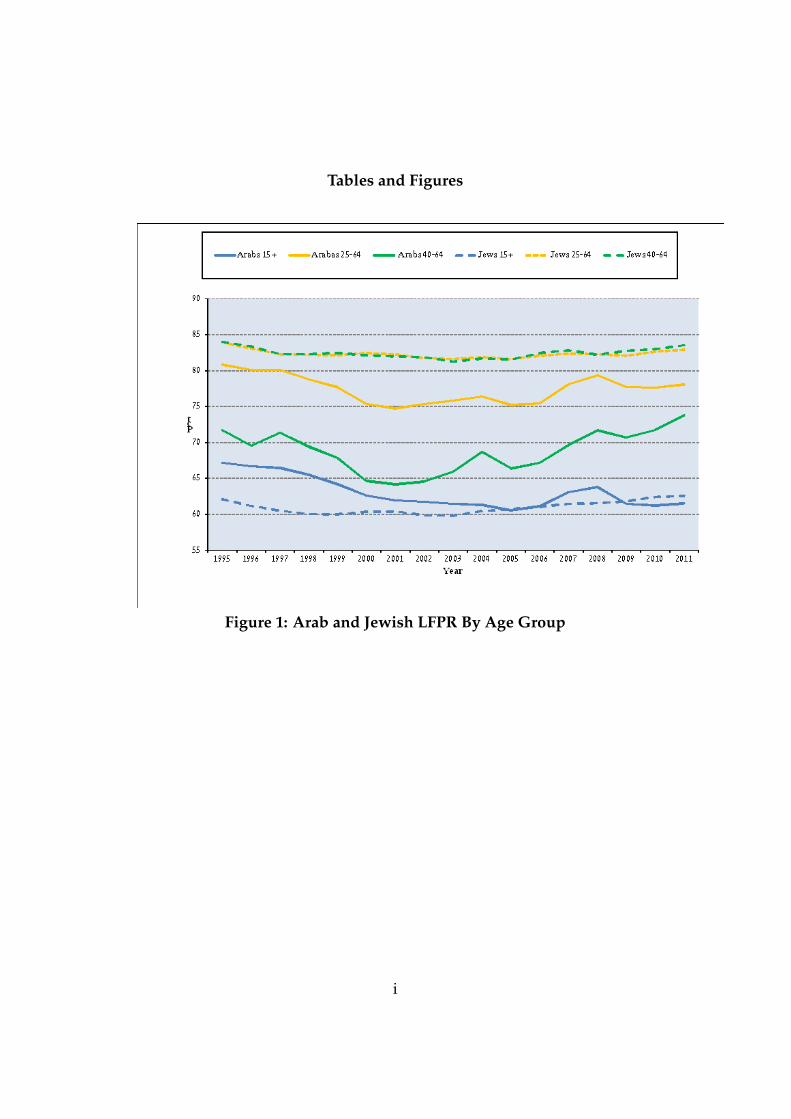
age group. Figure 2 looks deeper at age groups participation for the Arabs.
The top participating age groups are men between 21 and 53; over 54 there
is a marked drop. The young aged 15-20 have non-negligible participation
but lower than prime age men and it is declining over the years. Figure 3
shows the life cycle of Arab vs. Jewish male participation rates. It is strik-
ing that by the age group of 38-42 participation rates of Arab men start
5
declining, while it is so at 58-62 for Jewish men, i.e., 20 years later. Figure
4 shows this life cycle pattern across religions among Israeli Arab men.
The shape and level are broadly similar across groups, but Christians par-
ticipate more and retire later than average, and Druze men participate less
and retire earlier. Figure 5 does the same comparison across five Moslem
countries; Arab men in Israel participate less and retire earlier in this com-
parison. Figure 6 looks at the life cycle by education group, comparing
Arabs to Jews. Interestingly the pattern of early retirement is true also for
the Arab group with 13 and more years of education, though it is more
pronounced for the lower educated groups.
Figures 7 and 8 look at the job/occupations distributions across time
and over the life cycle. Arab men work in low- and medium-skill occupa-
tions far more than Jews, with the differential growing over time. This is
also true across age groups, with very high concentrations of Arab men in
low-skill occupations at all age groups. Note, in particular, the green col-
ored segments at the bottom of the skill distribution of Arab men, where
there is heavy concentration.
These stylized facts call attention to the links between age, skill level
and labor force participation. On these dimensions, Arab men have markedly
different patterns from Jews in Israel.
6
4 The Model
Given the stylized facts the relevant model is a model of the two key labor
supply decisions: participation in the labor force and retirement from it.
4.1 Participation
Consider the standard model of labor supply. Blundell and Powell (2004),
Blundell, Macurdy and Meghir (2007), and Blundell and Macurdy (2008)
offer reviews. I follow their notation.
Maximization problem. Each period the individual i solves the following
maximization problem
maxl
U(ci,+
li+
, vi) (1)
s.t.
ci = yi + wihi (2)
where U is a quasi-concave utility function increasing in consumption c
and leisure l; w are wages, y is non-labor income, and h are hours of work.
The vector vi represents the individual’s characteristics. Its elements affect
preferences through observed characteristics and unobserved ones. These
7
include, for example, demographic variables and skills. These can vary
across individuals and over time.
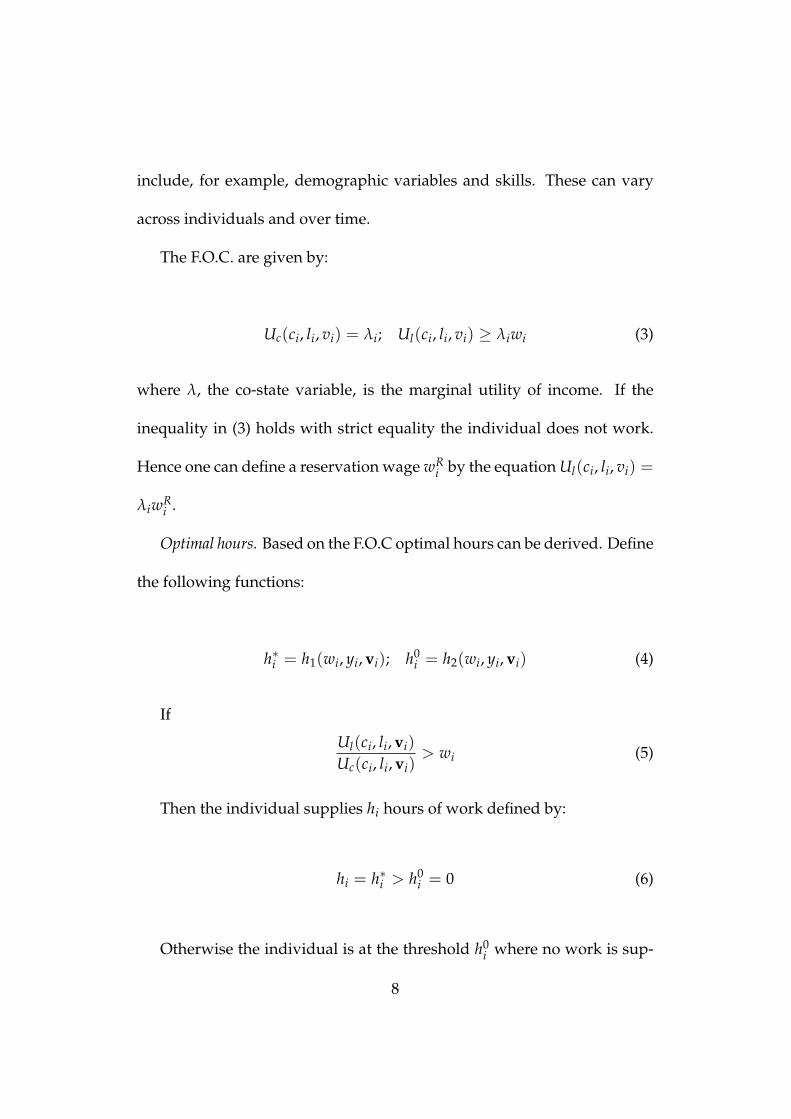
The F.O.C. are given by:
Uc(ci, li, vi) = λi; Ul(ci, li, vi) λiwi (3)
where λ, the co-state variable, is the marginal utility of income. If the
inequality in (3) holds with strict equality the individual does not work.
Hence one can define a reservation wage wRi by the equation Ul(ci, li, vi) =
λiwRi .
Optimal hours. Based on the F.O.C optimal hours can be derived. Define
the following functions:
hi = h1(wi, yi, vi); h0i = h2(wi, yi, vi) (4)
If
Ul(ci, li, vi)
Uc(ci, li, vi)> wi (5)
Then the individual supplies hi hours of work defined by:
hi = hi > h0i = 0 (6)
Otherwise the individual is at the threshold h0i where no work is sup-
8
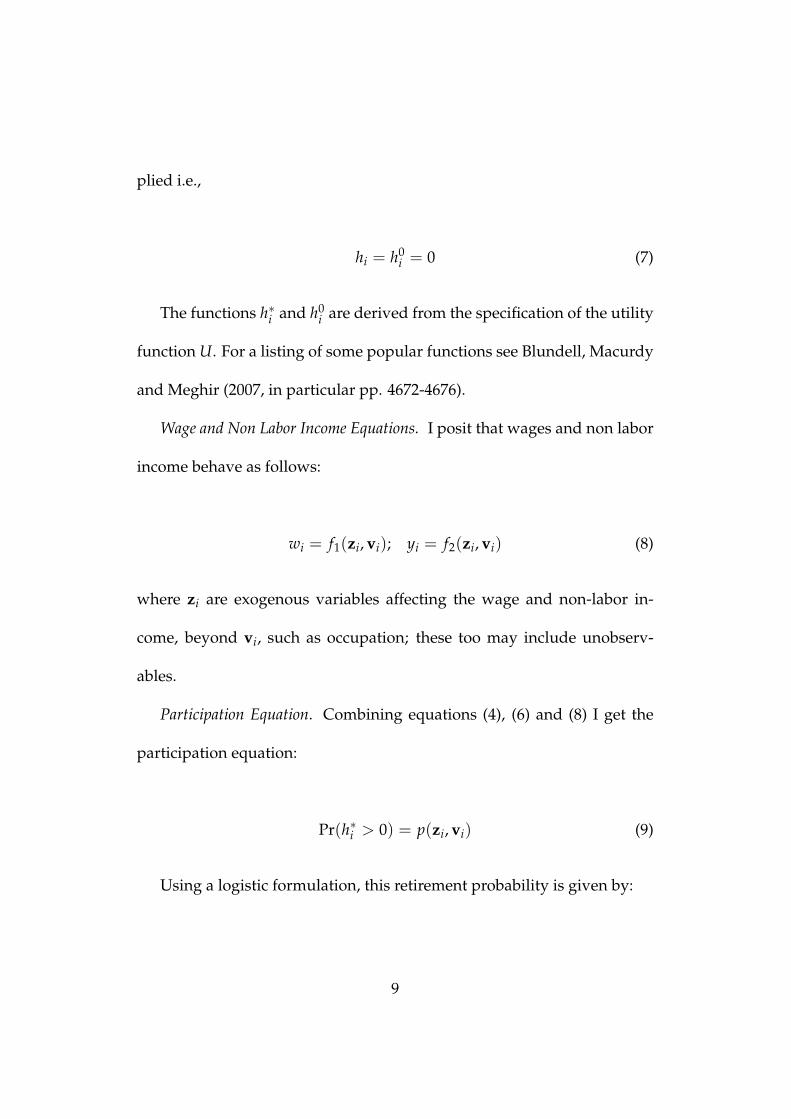
plied i.e.,
hi = h0i = 0 (7)
The functions hi and h0i are derived from the specification of the utility
function U. For a listing of some popular functions see Blundell, Macurdy
and Meghir (2007, in particular pp. 4672-4676).
Wage and Non Labor Income Equations. I posit that wages and non labor
income behave as follows:
wi = f1(zi, vi); yi = f2(zi, vi) (8)
where zi are exogenous variables affecting the wage and non-labor in-
come, beyond vi, such as occupation; these too may include unobserv-
ables.
Participation Equation. Combining equations (4), (6) and (8) I get the
participation equation:
Pr(hi > 0) = p(zi, vi) (9)
Using a logistic formulation, this retirement probability is given by:
9
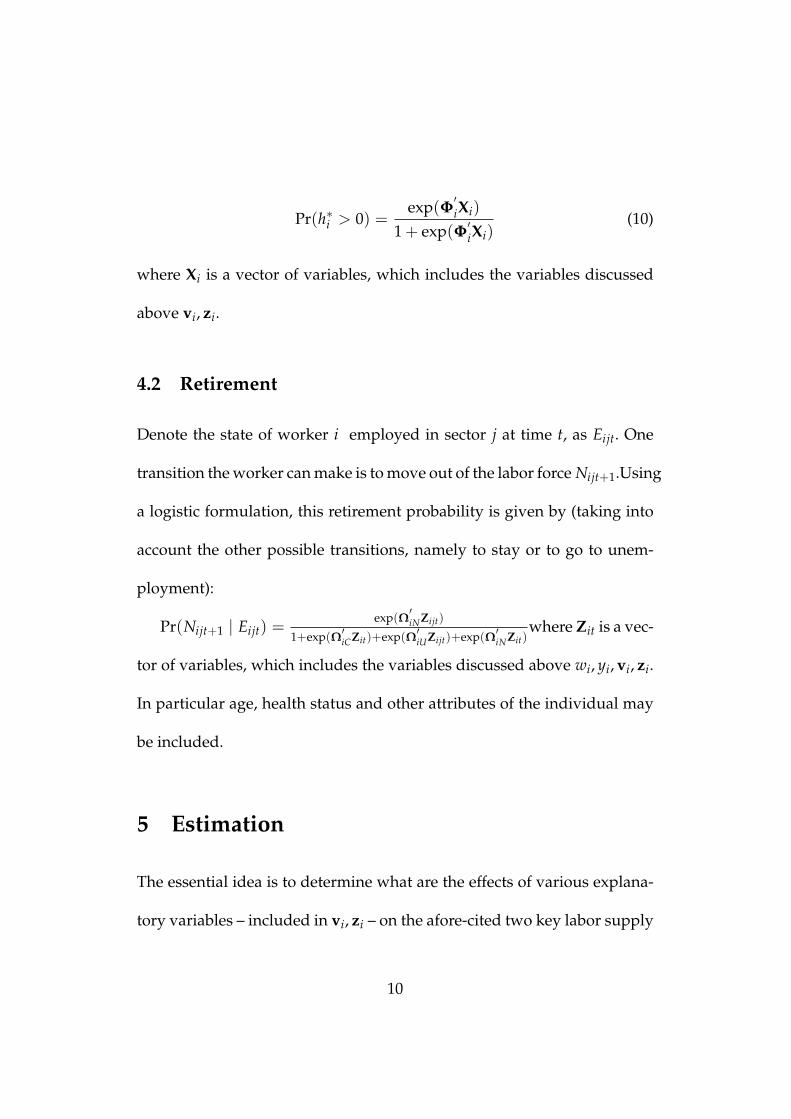
Pr(hi > 0) =exp(Φ
0iXi)
1+ exp(Φ0iXi)
(10)
where Xi is a vector of variables, which includes the variables discussed
above vi, zi.
4.2 Retirement
Denote the state of worker i employed in sector j at time t, as Eijt. One
transition the worker can make is to move out of the labor force Nijt+1.Using
a logistic formulation, this retirement probability is given by (taking into
account the other possible transitions, namely to stay or to go to unem-
ployment):
Pr(Nijt+1 j Eijt) =exp(Ω
0iNZijt)
1+exp(Ω0iCZit)+exp(Ω0
iUZijt)+exp(Ω0iNZit)
where Zit is a vec-
tor of variables, which includes the variables discussed above wi, yi, vi, zi.
In particular age, health status and other attributes of the individual may
be included.
5 Estimation
The essential idea is to determine what are the effects of various explana-
tory variables – included in vi, zi – on the afore-cited two key labor supply
10
decisions, participation and retirement. Then the idea is to see how these
variables affect outcomes by looking at their effects on the probability of
being poor. Two major explanatory variables are age and education, espe-
cially given the stylized facts described above. Beyond those, I use marital
status, health status, number of children, number of earners in the house-
hold, residency location, and occupation as explanatory variables.
5.1 The Data
The data on Arab and Jewish men are taken from repeated cross-sections
of the Labor Force Survey (LFS) and the Income Survey (IS) of the Israeli
Central Bureau of Statistics (CBS). For the participation and transition re-
gressions I use LFS data dating 2004 to 2011; for the poverty regression
I use the IS 2011 cross-section. The transitions regressions use the panel
aspect of the survey, with transitions across labor market states between
adjacent quarters.
The sample ends in 2011, as in 2012 there was a major change in the LFS
(and IS) sampling framework and frequency, so comparisons are difficult.
Moreover, data of the kind used here are available only for 2012 and in
some cases for 2013 only.
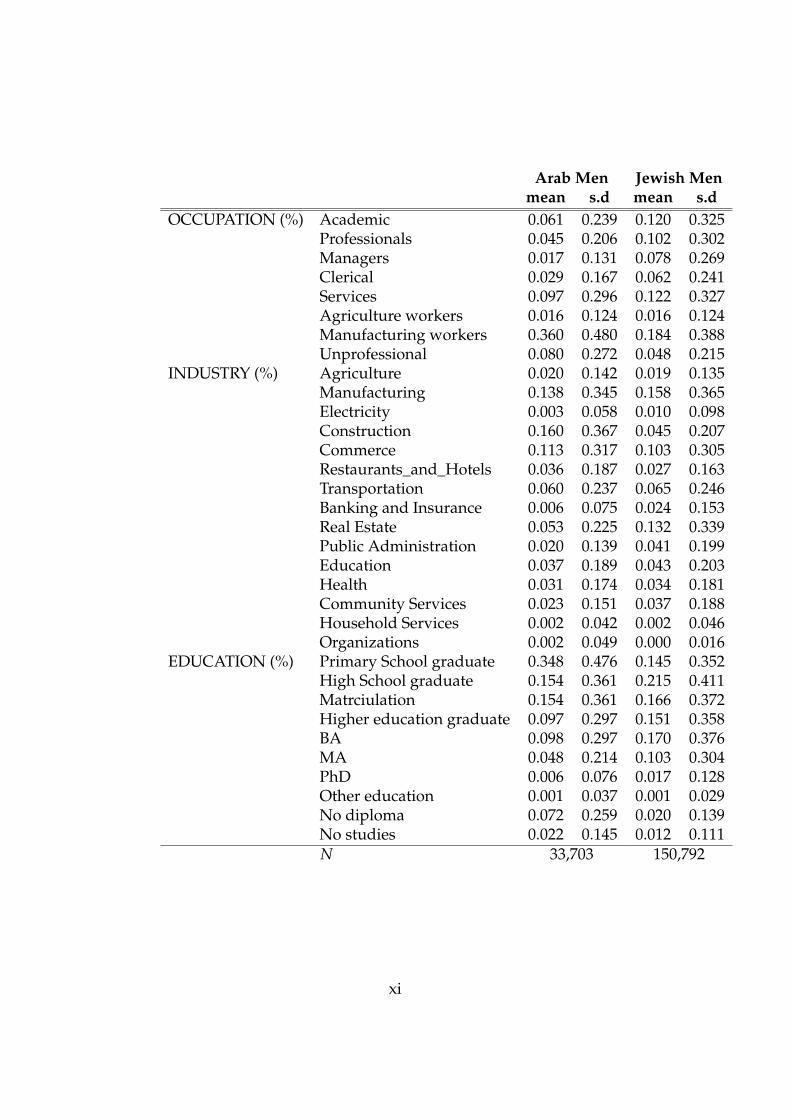
Table 1 provides sample statistics.
11
Table 1
Sample Statistics
The table shows some additional facts of interest: Arab men are – on
average – younger than the Jewish males, less educated, have more chil-
dren, are married in higher percentages, have lower health status, live pre-
dominantly in small urban areas (as compared to the Jews who are heavily
concentrated in big and medium size cities) and, as seen above, are more
heavily concentrated in low skill occupations.
5.2 Results
5.2.1 Participation Regressions
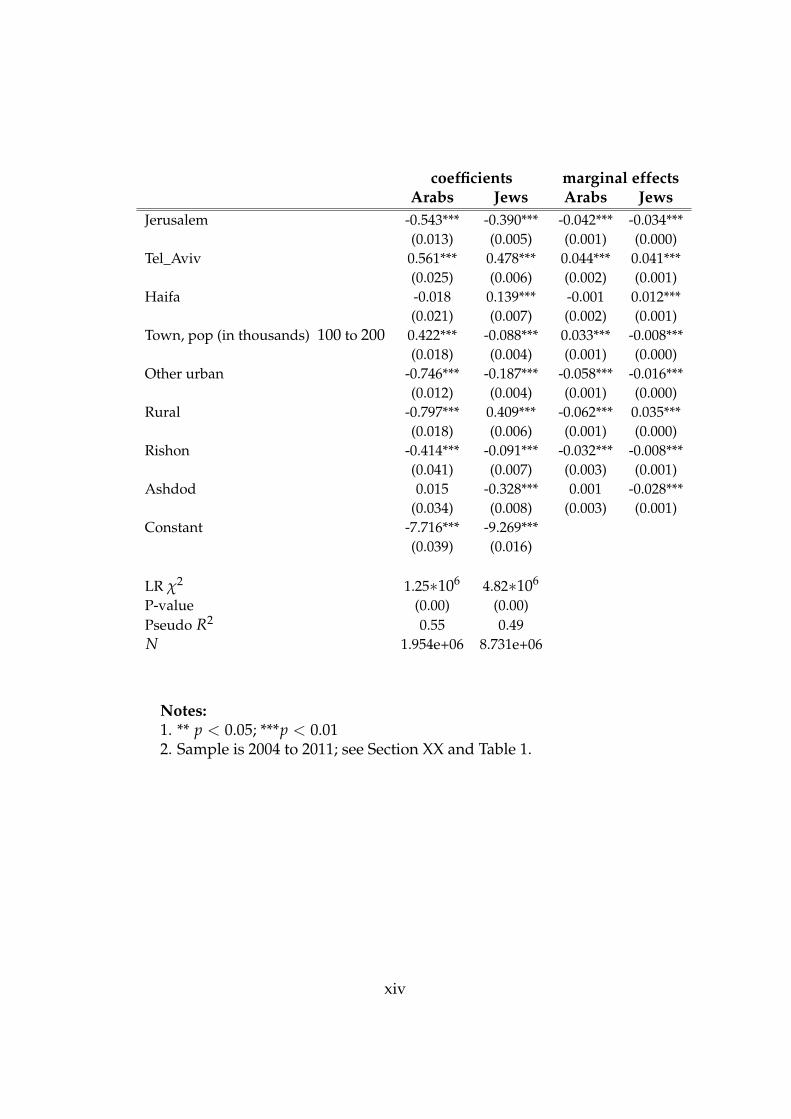
Table 2 shows the results of the logit participation regressions according to
equation (10). It is the probability of being in the labor force regressed on
linear-quadratic age and education and on marital status, number of chil-
dren under 14, number of earners in the household, health, and residency
location. The table reports the regression coefficients and their standard
errors and the marginal effects and their standard errors, for Arab men
and for Jewish men. Figures 9 and 10 plot the marginal effects for age and
for education.
Table 2 and Figures 9 and 10
12
The table and figures reveal that:
(i) In terms of marginal effects, participation rises with age, education,
number of earners, and residency in the bigger towns; it falls with the
number of young children and with ill health. Being married has a positive
effect in the Arab population and a negative effect in the Jewish one.
(ii) The marginal age effect is increasing and concave for both groups,
and is stronger for Arab men. Though it is concave, there is no hump
shape as in the raw data of Figure 3. It should be recalled that this is the
marginal effect, controlling for other variables such as education, which is
an indicator for skills, and health status. Thus the effects of physical jobs
is at least partially controlled for. Note, though, that the decline in slope
of the marginal effect is more pronounced for the Arabs than for the Jews,
starting from the age of 45.
(iii) The marginal education effect has a profile which is less concave
than the age profile, and is, again, stronger for the Arabs.
5.2.2 Transition Regressions
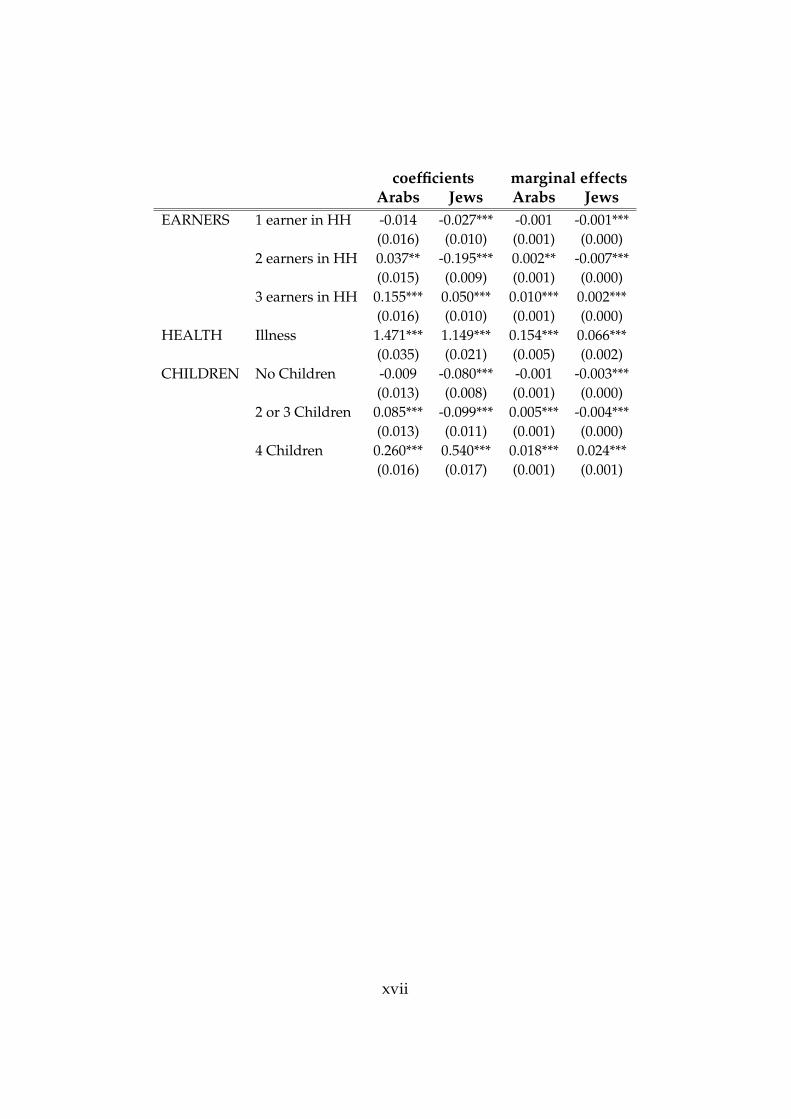
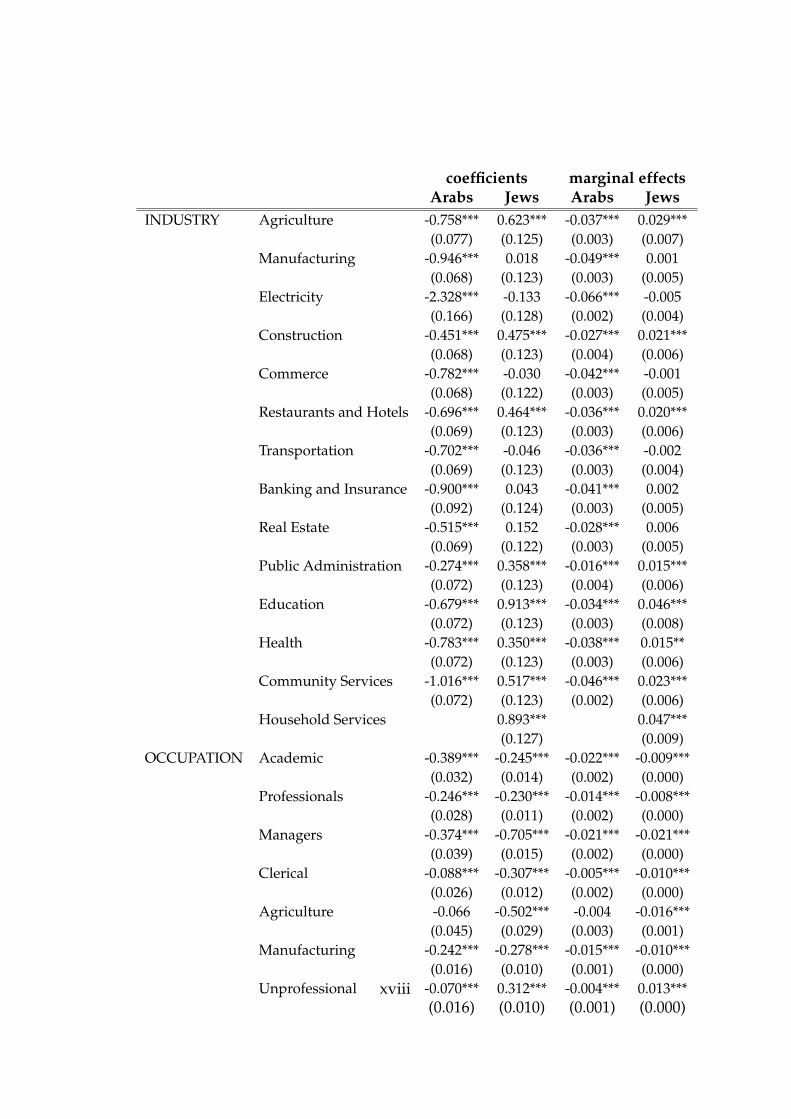
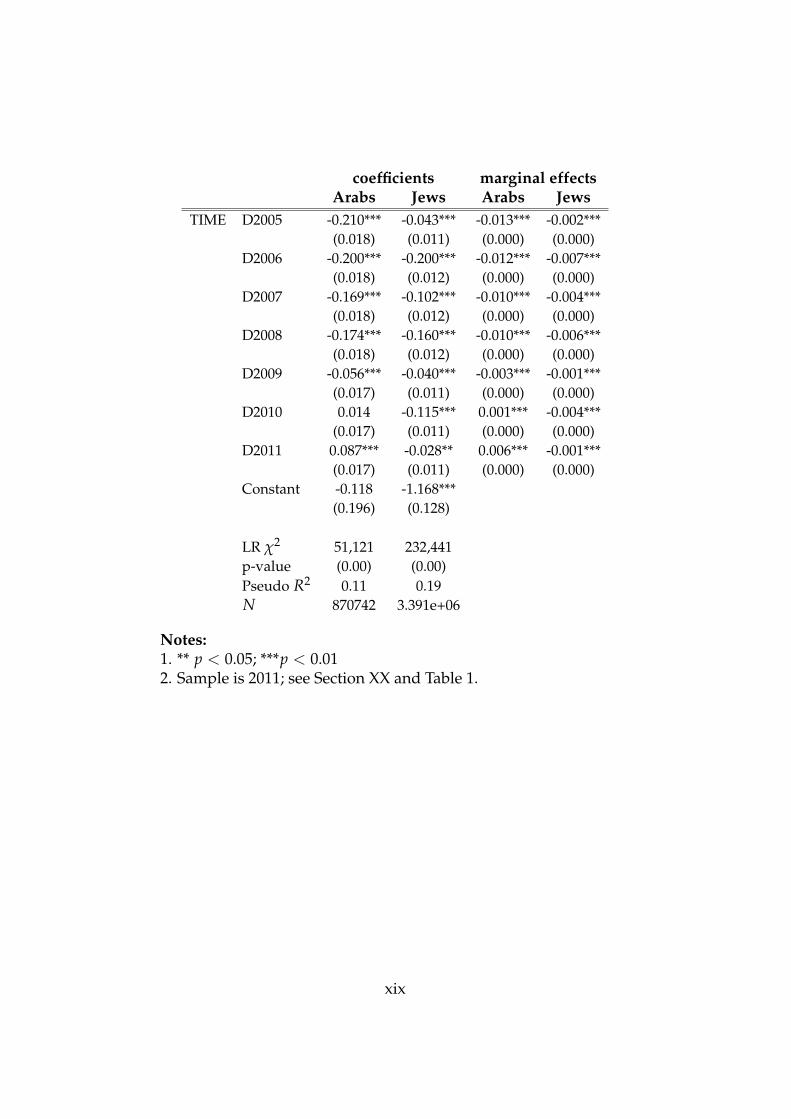
Table 3 shows the results of the logit regressions according to equation (??).
It is the probability of moving from employment to out of the labor force,
i.e., probability of retirement, on age, marital status, education, number of
children, number of earners in the household, health status, industry, and
13
occupation. It includes time dummies. The table reports the regression
coefficients and their standard errors and the marginal effects and their
standard errors, for Arab men and for Jewish men. Figures 11 and 12 plot
the marginal effects for age and for education.
Table 3 and Figures 11 and 12
The table and figures reveal that:
(i) In terms of marginal effects, the probability of retiring from employ-
ment is U shaped in terms of age, and rises with ill health and with more
children.
(ii) The marginal age effect is U shaped for both groups. It starts to
rise much earlier for the Arabs – when going from the age of 40 to 45, as
compared to going from the 50s to the 60s. Hence, even though these are
marginal effects, after controlling for occupation, industry, education, and
health status, age still does play some role.
(iii) The marginal education effect is as follows: no studies or no diploma
increases the retirement probability a lot; primary school education in-
creases it but less than the latter; university graduates feature the lowest
retirement effect.
14
5.2.3 Poverty Regressions
To assess outcomes one measure to examine is the percentage of persons
under the poverty line. This line in Israel, computed by the National
Insurance Institute, is defined as half the median household income per
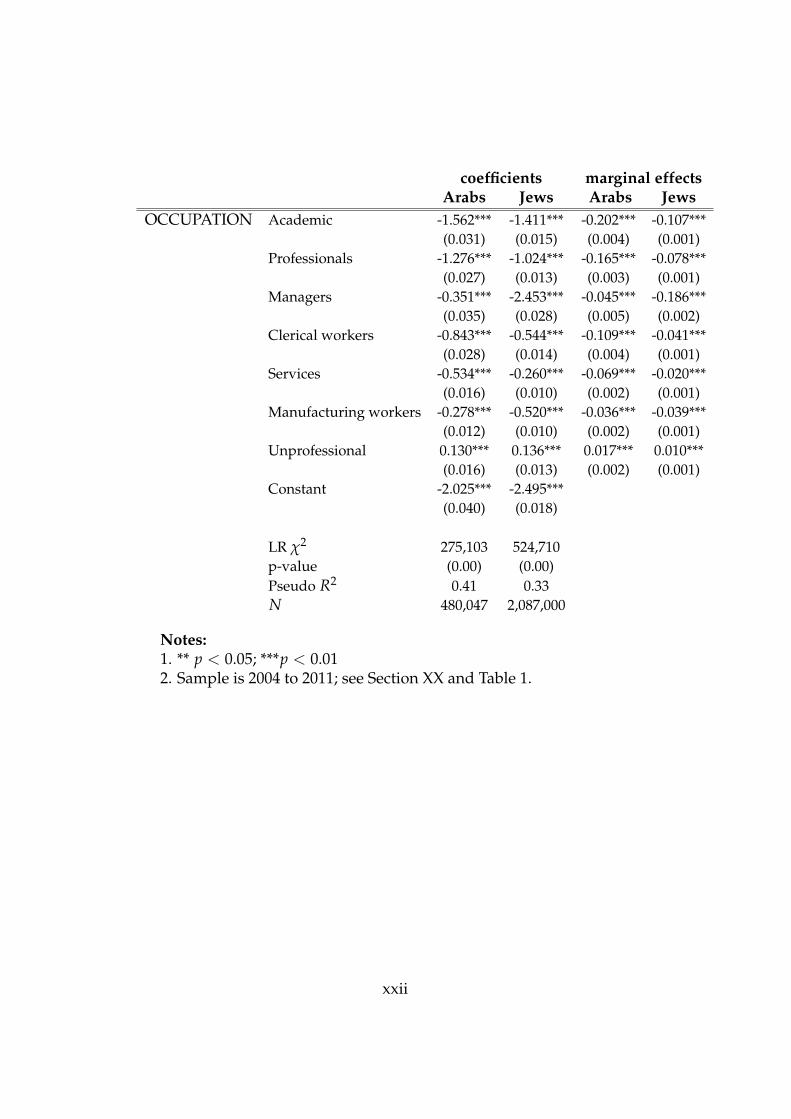
“standardized individual” (using equivalence scales). Table 4 shows logit
regressions of the probability of being below the poverty line regressed
on linear-quadratic age and education and on marital status, number of
children, number of earners in the household, residency location and oc-
cupation. The table reports the regression coefficients and their standard
errors and the marginal effects and their standard errors, for Arab men
and for Jewish men. Figures 13 and 14 plot the marginal effects for age
and for education.
Table 4 and Figures 13 and 14
The table and figures reveal that:
(i) In terms of marginal effects, the probability of being below the poverty
line rises with age, with the number of children, a lower number of earn-
ers, rural residency, and work in lower skill occupations. Being married
has a negative effect on poverty in the Arab population and a positive ef-
fect in the Jewish one.
15
(ii) The marginal age effect is linear for both groups and is much stronger
for the Arabs. It seems to be rising for the Arabs somewhat from the age
of 50.
(iii) The marginal education effect is flat at about 50% for the Arabs and
is negative for the Jews.
6 Implications
The marginal effects of age are complicated. Note, again, that these are
obtained after controlling for education, health status, and occupation. In
terms of participation, age has a positive, though diminishing, effect, un-
like the raw (non marginal) hump shape of Figure 3. In terms of retire-
ment, though all controls are in place, Arab men retire more as they grow
older, starting at the ages of 40-45, about two decades before Jewish men.
Poverty also rises with age, again using the relevant controls.
The marginal effects of education are involved too: the effects on par-
ticipation are very similar across groups, Arabs and Jews, rising with ed-
ucation; the effects on retirement are generally similar and as expected
(less retirement with higher education) but in the ‘no studies’ category the
Arabs retire much more; and there is a big gap between the two groups
when it comes to poverty – the poverty rate declines with education for
16
the Jews while it is essentially higher and flat across education levels for
the Arabs.
There are results which were to be expected ex-ante (in terms of mar-
ginal effects): (i) ill health reduces participation and increases the probabil-
ity of retirement; (ii) living in larger, urban centers promotes participation
and lowers poverty; the one exception is Jerusalem, where it is the reverse;
(iii) low-skill occupation raises the probability of retirement and increases
the probability of poverty.
But there are also results which are far less obvious, and even surpris-
ing:
(i) A rise in the number of children operates to decrease participation,
increase retirement, and increase poverty. This is surprising in light of the
fact that the sample is restricted to men. One would expect that higher
family consumption needs and higher prospects for poverty would lead
to an increase in labor market involvement.
(ii) Marital status has different effects for Arab men and for Jewish men.
For Arabs being married increases participation, decreases retirement, and
results in less poverty. For Jews, being married decreases participation,
decreases retirement as well, and results in less poverty.
Other results are that more income-earners in the household leads to
higher participation, higher retirement, and less poverty. The last result in
17

to be expected. The first two are somewhat contradictory. The explanation
may lie in the idea that there could be both complementarity and substi-
tutability effects of labor force involvement within the household and that
these express themselves differentially.
Policy-relevant conclusions that can be drawn are as follows:
(i) Education and high skills promote participation; the results quan-
tify these effects. Thus, Table 2 and Figure 10 provide estimates of the
contribution of the marginal year of education to the rate of labor force
participation.
(ii) Health status is important, so health care policies, including health
in the work place, play a role in the labor market.
(iii) Education does not alleviate poverty in the Arab men population,
other things being equal. Thus, education, in and of itself, “is not enough.”
(iv) Residency is important, indicating a possible role for issues of phys-
ical access to employment.
(v) There are issues to be further explored concerning the effect of chil-
dren. This may impact child-care policies.
18
7 Conclusions
Given the findings, the challenge is to understand the pre-labor market
barriers, which lead to lower education, and thus lower skills, for Arab
men. Barriers may also be relevant in the geographical distribution of this
population. Current research, in progress, attempts to do this using a Roy
model of occupational choice, which recognizes human capital acquisition
barriers, as well as labor market barriers.
19
References
[1] Asali, Muhammad, 2006. “Why Do Arabs Earn Less than Jews in Is-
rael?” Falk Institute Economic Research Discussion Paper No. 06.03.
[2] Blundell, Richard W. and Thomas, Macurdy, 1999, “Labor Supply: A
Review of Alternative Approaches” Chapter 27 in O.Ashenfelter and
D. Card (eds). Handbook of Labor Economics, 3A, 1560–1695, North
Holland.
[3] Blundell, Richard W. and Thomas MaCurdy, 2008. “Labour Supply”
in S.N. Durlauf and L.E. Blume. (eds.) The New Palgrave Dictionary
of Economics. Second Edition, Palgrave Macmillan.
[4] Blundell, Richard W., Thomas Macurdy, and Costas Meghir, 2007.
“Labor Supply Models: Unobserved Heterogeneity, Non Participa-
tion and Dynamics,” Chapter 69 in J. Heckman and E. Leamer (eds.)
Handbook of Econometrics, 6A, 4667-4775, North-Holland.
[5] Blundell, Richard W. and James L. Powell, 2004. “Endogeneity in
Semiparametric Binary Response Models,” Review of Economic
Studies 71, 655-679.
20
[6] Krueger, Alan B. and Bruce D. Meyer, 2002. “Labor supply effects of
social insurance.” In A.J. Auerbach and Feldstein, M. (eds). Hand-
book of Public Economics, Vol. 4. Amsterdam, UK: North-Holland.
[7] Miari, Sami, Ula Nabuani, and Nabil Hatab, 2011. “Income Inequality
between Arabs and Jews, 1997-2009.” The Israeli Institute of Democ-
racy.
[8] Tatsiramos, Konstantinos, and Jan C. van Ours, 2014. Labor Mar-
ket Effects of Unemployment Insurance Design. Journal of Economic
Surveys 28, 2, 284-311.
[9] Yashiv, Eran and Nitsa Kasir, 2011. “Patterns of Labor Force Partici-
pation Among Israeli Arabs,” Israeli Economic Review 9,1,53-101.
[10] Yashiv, Eran and Nitsa Kasir, 2015.“The Labor Market of Israeli
Arabs: Key Features and Policy Solutions”, CEPR Policy Insight 78,
February.
21
Tables and Figures
Figure 1: Arab and Jewish LFPR By Age Group
i
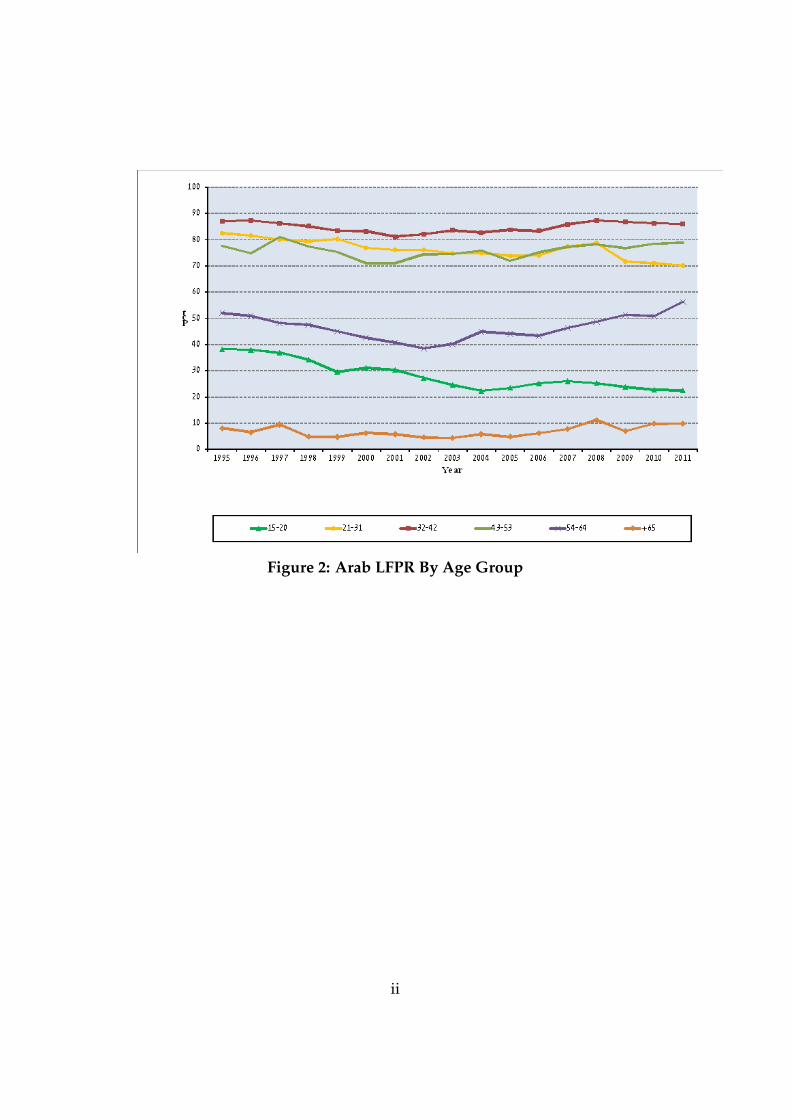
Figure 2: Arab LFPR By Age Group
ii
Figure 3: Life Cycle LFPR
iii
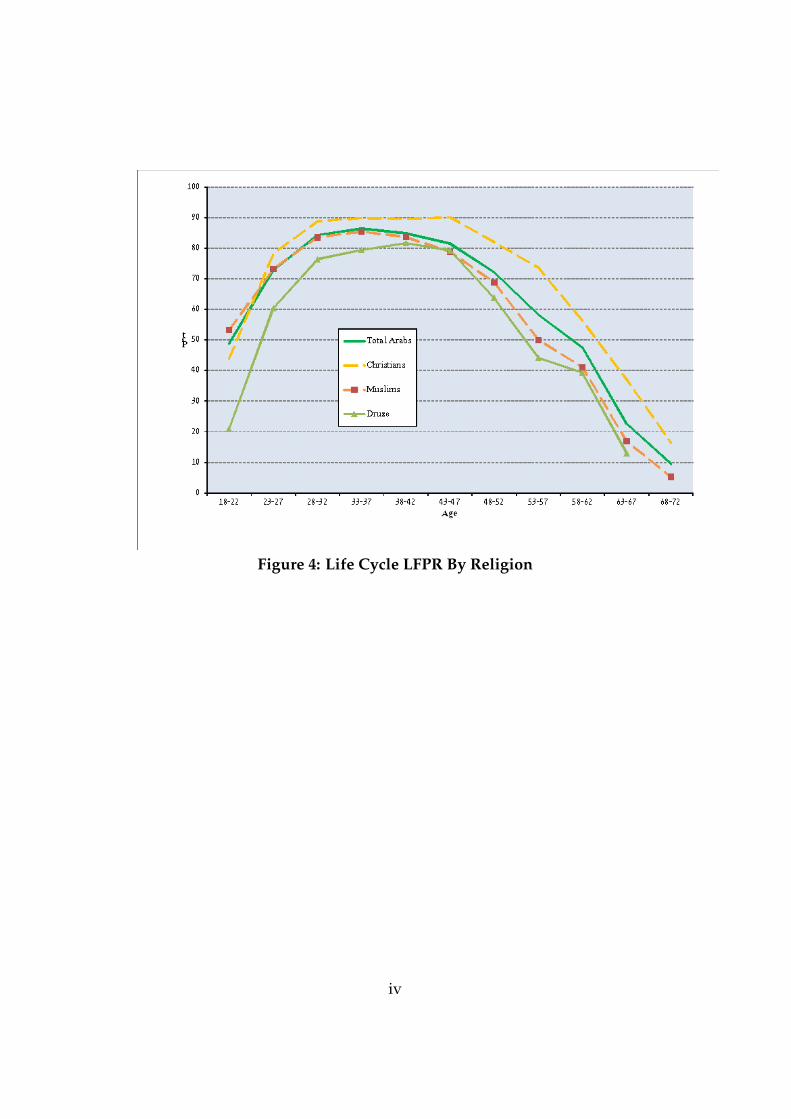
Figure 4: Life Cycle LFPR By Religion
iv
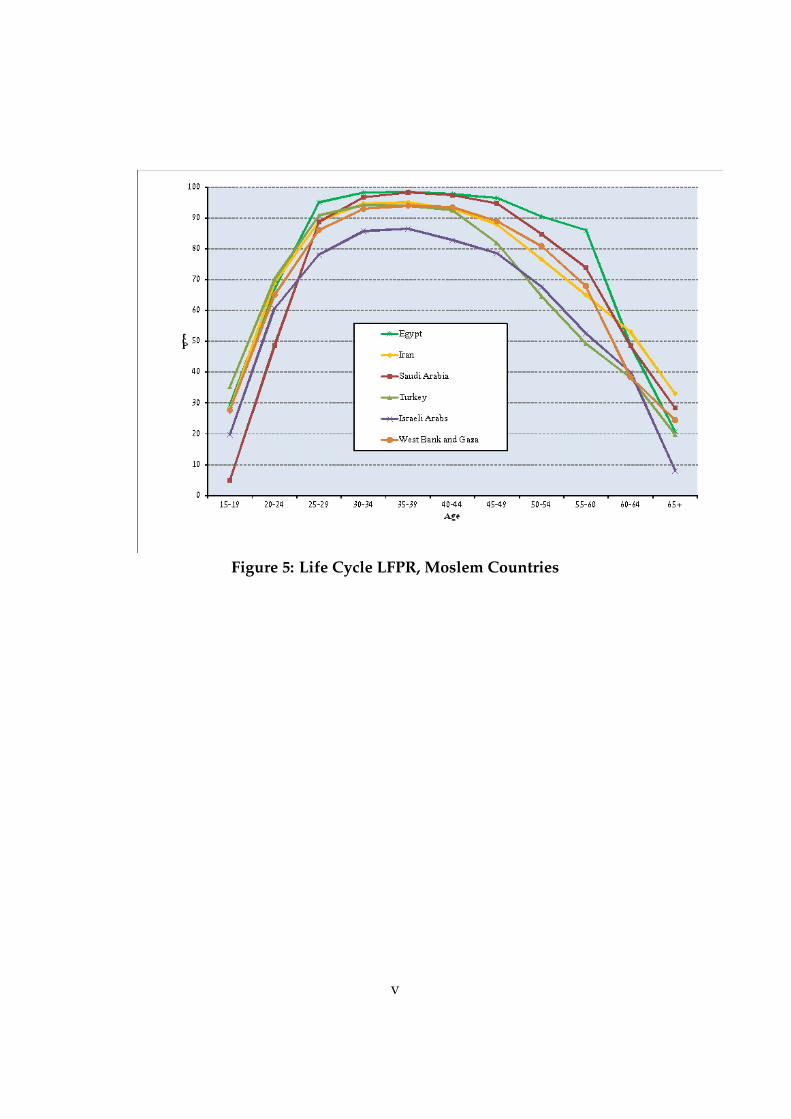
Figure 5: Life Cycle LFPR, Moslem Countries
v
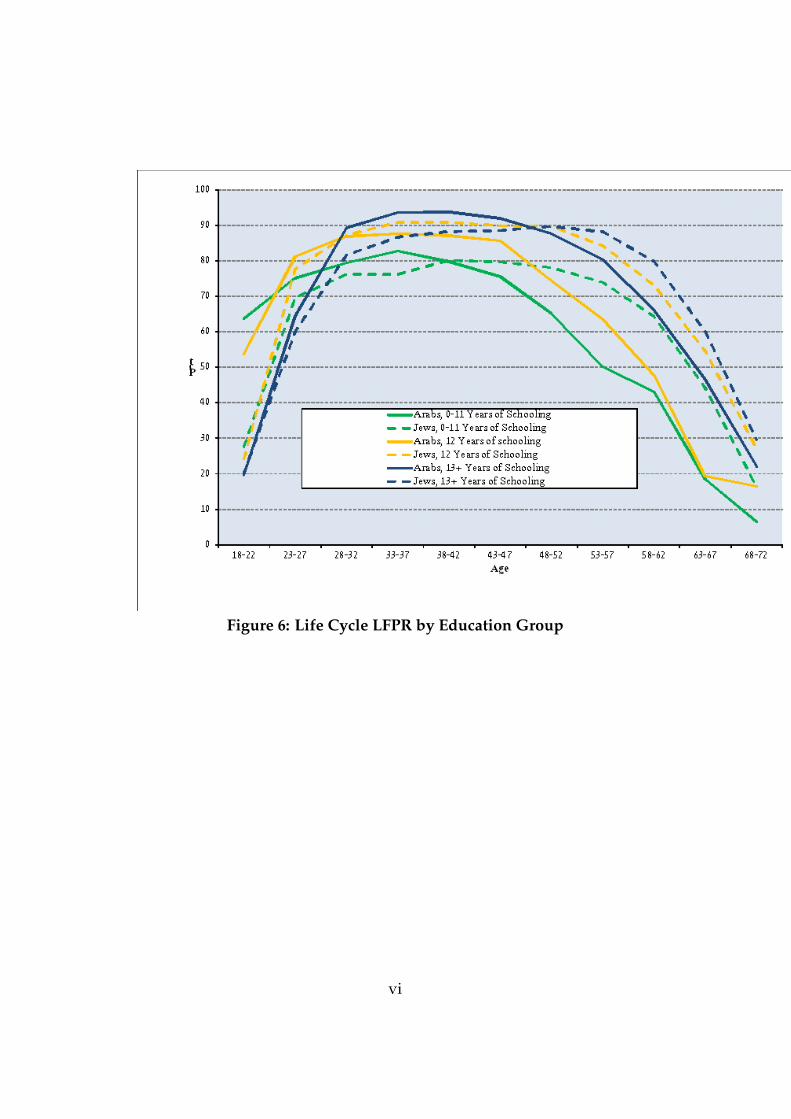
Figure 6: Life Cycle LFPR by Education Group
vi
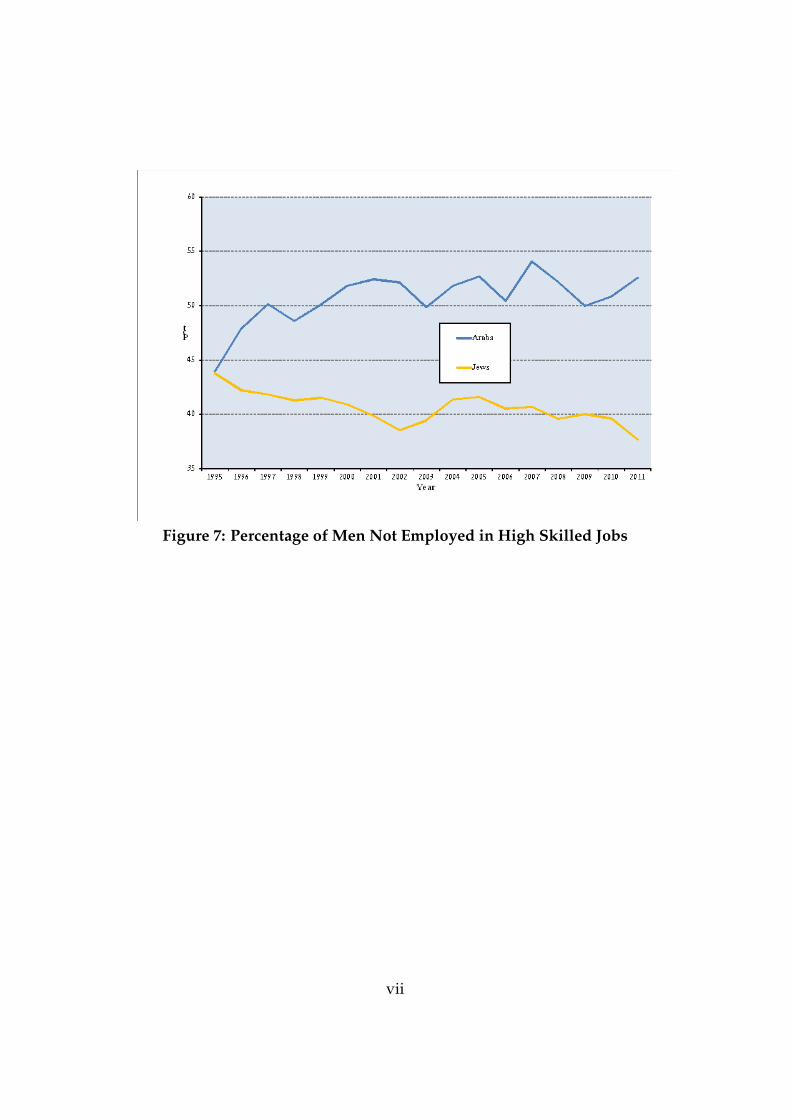
Figure 7: Percentage of Men Not Employed in High Skilled Jobs
vii
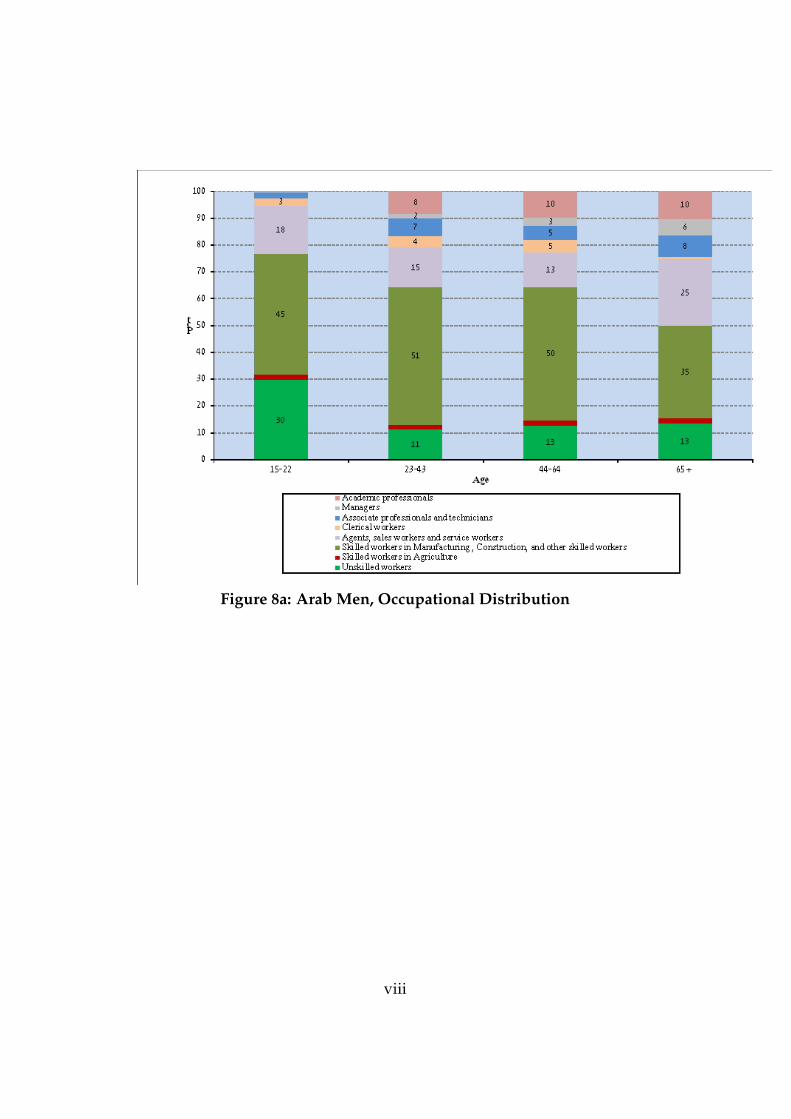
Figure 8a: Arab Men, Occupational Distribution
viii
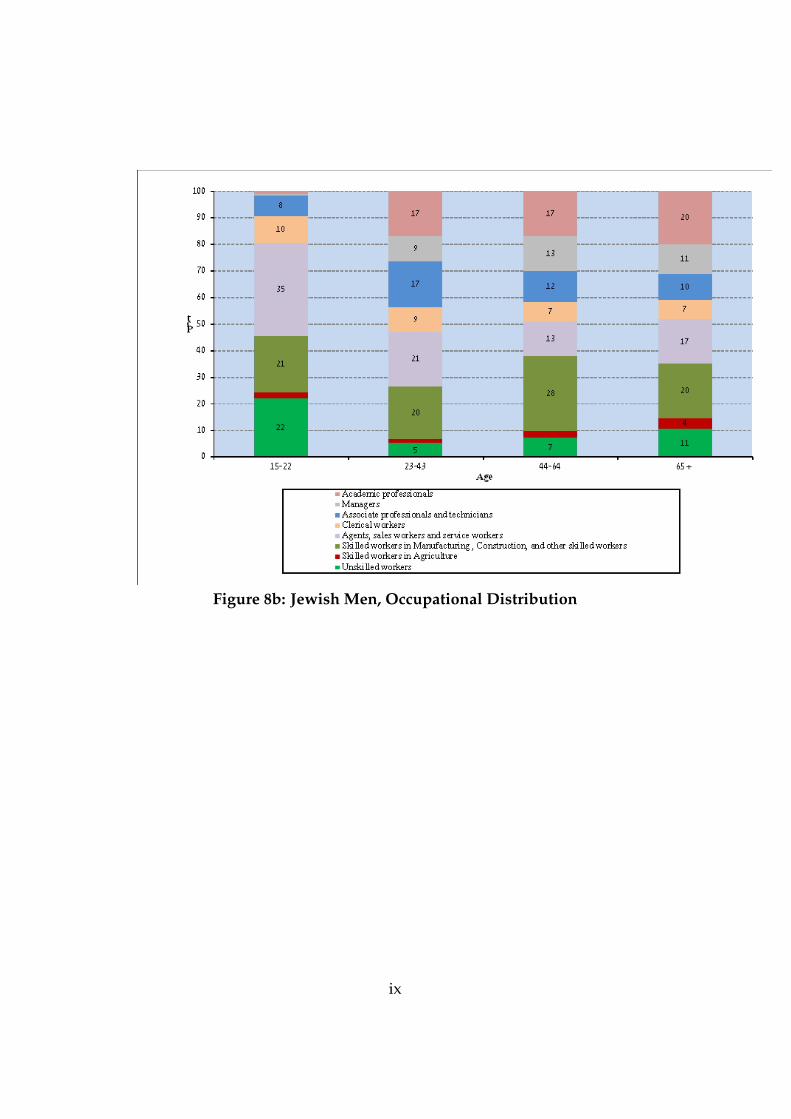
Figure 8b: Jewish Men, Occupational Distribution
ix
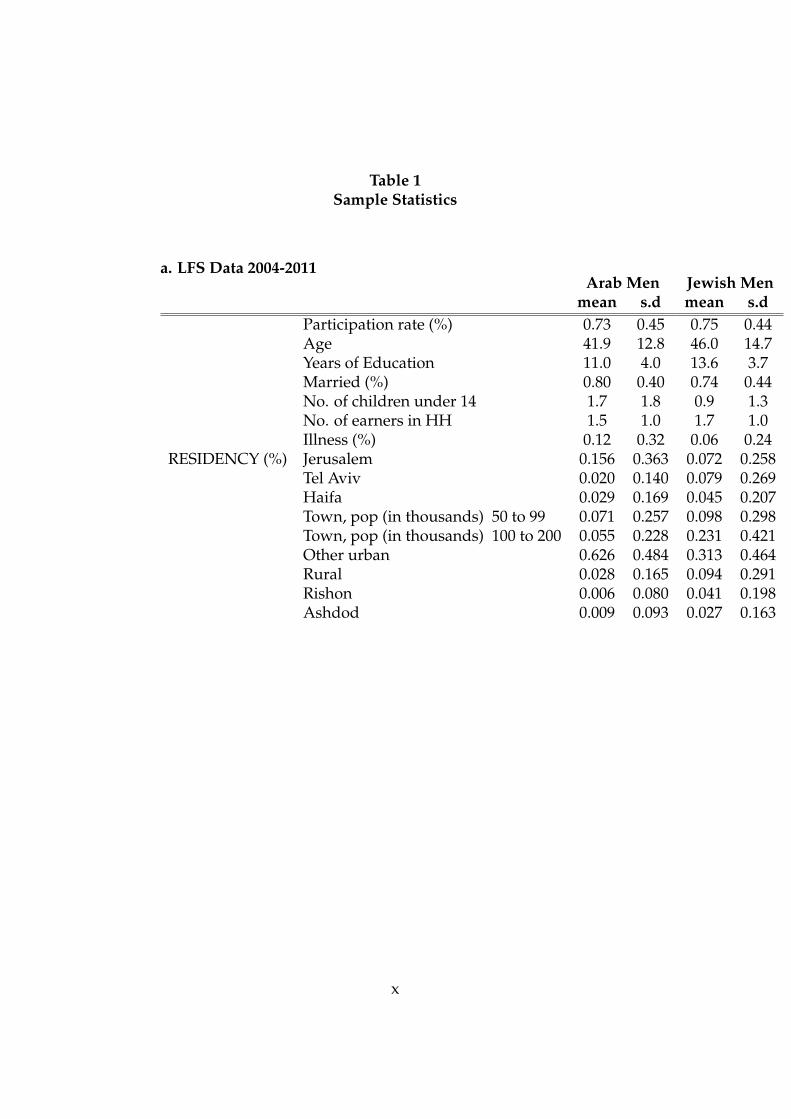
Table 1Sample Statistics
a. LFS Data 2004-2011Arab Men
mean s.dParticipation rate (%) 0.73 0.45Age 41.9 12.8Years of Education 11.0 4.0Married (%) 0.80 0.40No. of children under 14 1.7 1.8No. of earners in HH 1.5 1.0Illness (%) 0.12 0.32
RESIDENCY (%) Jerusalem 0.156 0.363Tel Aviv 0.020 0.140Haifa 0.029 0.169Town, pop (in thousands) 50 to 99 0.071 0.257Town, pop (in thousands) 100 to 200 0.055 0.228Other urban 0.626 0.484Rural 0.028 0.165Rishon 0.006 0.080Ashdod 0.009 0.093
Jewish Menmean s.d0.75 0.4446.0 14.713.6 3.70.74 0.440.9 1.31.7 1.00.06 0.24
0.072 0.2580.079 0.2690.045 0.2070.098 0.2980.231 0.4210.313 0.4640.094 0.2910.041 0.1980.027 0.163
x
Arab Menmean s.d
OCCUPATION (%) Academic 0.061 0.239Professionals 0.045 0.206Managers 0.017 0.131Clerical 0.029 0.167Services 0.097 0.296Agriculture workers 0.016 0.124Manufacturing workers 0.360 0.480Unprofessional 0.080 0.272
INDUSTRY (%) Agriculture 0.020 0.142Manufacturing 0.138 0.345Electricity 0.003 0.058Construction 0.160 0.367Commerce 0.113 0.317Restaurants_and_Hotels 0.036 0.187Transportation 0.060 0.237Banking and Insurance 0.006 0.075Real Estate 0.053 0.225Public Administration 0.020 0.139Education 0.037 0.189Health 0.031 0.174Community Services 0.023 0.151Household Services 0.002 0.042Organizations 0.002 0.049
EDUCATION (%) Primary School graduate 0.348 0.476High School graduate 0.154 0.361Matrciulation 0.154 0.361Higher education graduate 0.097 0.297BA 0.098 0.297MA 0.048 0.214PhD 0.006 0.076Other education 0.001 0.037No diploma 0.072 0.259No studies 0.022 0.145N 33,703
Jewish Menmean s.d0.120 0.3250.102 0.3020.078 0.2690.062 0.2410.122 0.3270.016 0.1240.184 0.3880.048 0.2150.019 0.1350.158 0.3650.010 0.0980.045 0.2070.103 0.3050.027 0.1630.065 0.2460.024 0.1530.132 0.3390.041 0.1990.043 0.2030.034 0.1810.037 0.1880.002 0.0460.000 0.0160.145 0.3520.215 0.4110.166 0.3720.151 0.3580.170 0.3760.103 0.3040.017 0.1280.001 0.0290.020 0.1390.012 0.111
150,792
xi
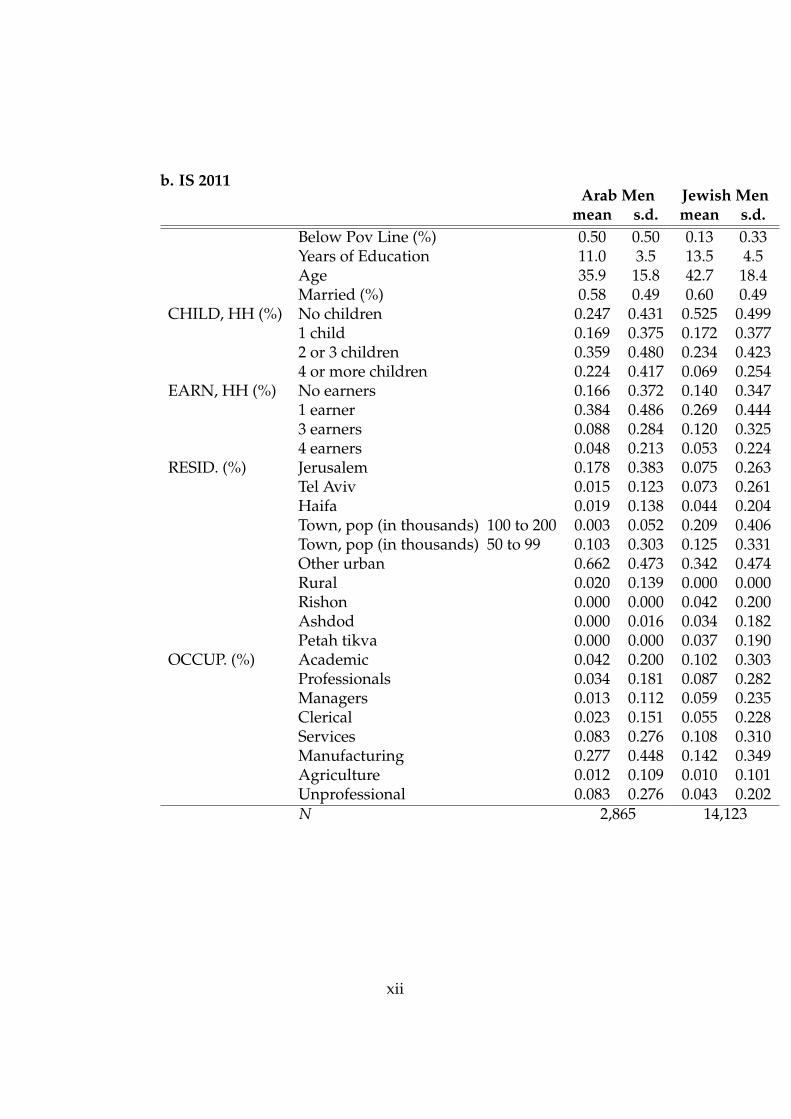
b. IS 2011Arab Men
mean s.d.Below Pov Line (%) 0.50 0.50Years of Education 11.0 3.5Age 35.9 15.8Married (%) 0.58 0.49
CHILD, HH (%) No children 0.247 0.4311 child 0.169 0.3752 or 3 children 0.359 0.4804 or more children 0.224 0.417
EARN, HH (%) No earners 0.166 0.3721 earner 0.384 0.4863 earners 0.088 0.2844 earners 0.048 0.213
RESID. (%) Jerusalem 0.178 0.383Tel Aviv 0.015 0.123Haifa 0.019 0.138Town, pop (in thousands) 100 to 200 0.003 0.052Town, pop (in thousands) 50 to 99 0.103 0.303Other urban 0.662 0.473Rural 0.020 0.139Rishon 0.000 0.000Ashdod 0.000 0.016Petah tikva 0.000 0.000
OCCUP. (%) Academic 0.042 0.200Professionals 0.034 0.181Managers 0.013 0.112Clerical 0.023 0.151Services 0.083 0.276Manufacturing 0.277 0.448Agriculture 0.012 0.109Unprofessional 0.083 0.276N 2,865
Jewish Menmean s.d.0.13 0.3313.5 4.542.7 18.40.60 0.490.525 0.4990.172 0.3770.234 0.4230.069 0.2540.140 0.3470.269 0.4440.120 0.3250.053 0.2240.075 0.2630.073 0.2610.044 0.2040.209 0.4060.125 0.3310.342 0.4740.000 0.0000.042 0.2000.034 0.1820.037 0.1900.102 0.3030.087 0.2820.059 0.2350.055 0.2280.108 0.3100.142 0.3490.010 0.1010.043 0.202
14,123
xii
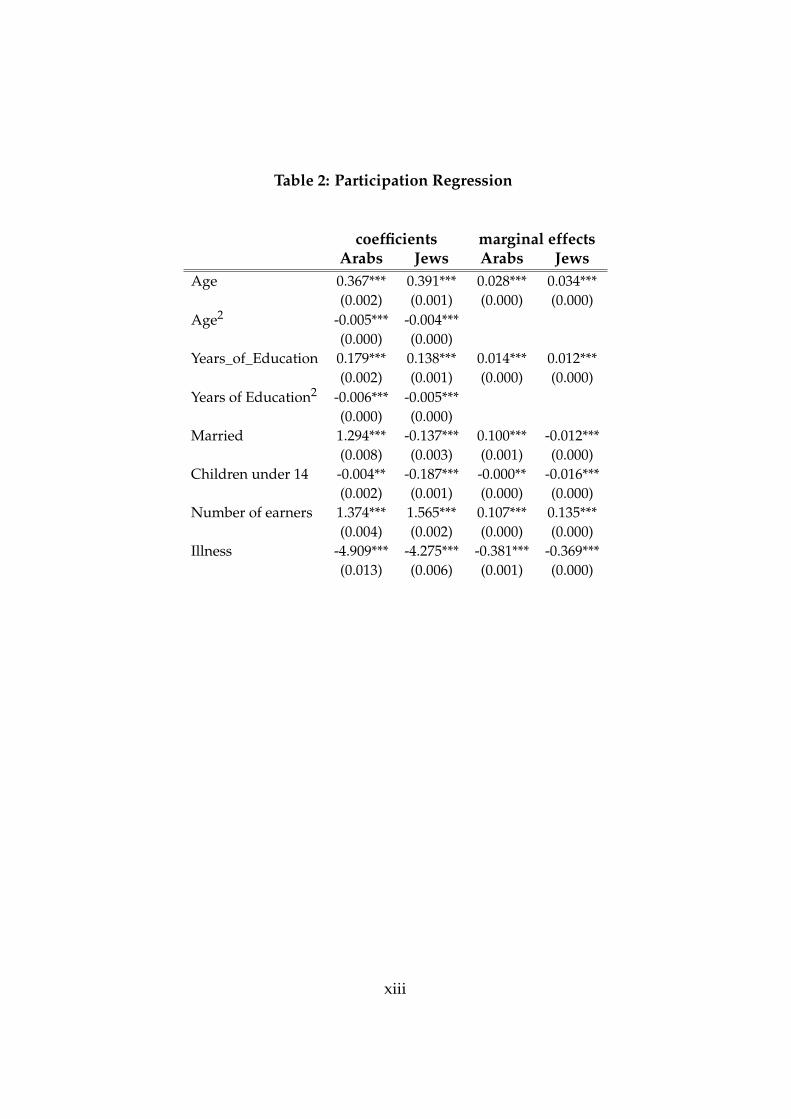
Table 2: Participation Regression
coefficients marginal effectsArabs Jews Arabs Jews
Age 0.367*** 0.391*** 0.028*** 0.034***(0.002) (0.001) (0.000) (0.000)
Age2 -0.005*** -0.004***(0.000) (0.000)
Years_of_Education 0.179*** 0.138*** 0.014*** 0.012***(0.002) (0.001) (0.000) (0.000)
Years of Education2 -0.006*** -0.005***(0.000) (0.000)
Married 1.294*** -0.137*** 0.100*** -0.012***(0.008) (0.003) (0.001) (0.000)
Children under 14 -0.004** -0.187*** -0.000** -0.016***(0.002) (0.001) (0.000) (0.000)
Number of earners 1.374*** 1.565*** 0.107*** 0.135***(0.004) (0.002) (0.000) (0.000)
Illness -4.909*** -4.275*** -0.381*** -0.369***(0.013) (0.006) (0.001) (0.000)
xiii
coefficients marginal effectsArabs Jews Arabs Jews
Jerusalem -0.543*** -0.390*** -0.042*** -0.034***(0.013) (0.005) (0.001) (0.000)
Tel_Aviv 0.561*** 0.478*** 0.044*** 0.041***(0.025) (0.006) (0.002) (0.001)
Haifa -0.018 0.139*** -0.001 0.012***(0.021) (0.007) (0.002) (0.001)
Town, pop (in thousands) 100 to 200 0.422*** -0.088*** 0.033*** -0.008***(0.018) (0.004) (0.001) (0.000)
Other urban -0.746*** -0.187*** -0.058*** -0.016***(0.012) (0.004) (0.001) (0.000)
Rural -0.797*** 0.409*** -0.062*** 0.035***(0.018) (0.006) (0.001) (0.000)
Rishon -0.414*** -0.091*** -0.032*** -0.008***(0.041) (0.007) (0.003) (0.001)
Ashdod 0.015 -0.328*** 0.001 -0.028***(0.034) (0.008) (0.003) (0.001)
Constant -7.716*** -9.269***(0.039) (0.016)
LR χ2 1.25106 4.82106
P-value (0.00) (0.00)Pseudo R2 0.55 0.49N 1.954e+06 8.731e+06
Notes:1. ** p < 0.05; ***p < 0.012. Sample is 2004 to 2011; see Section XX and Table 1.
xiv
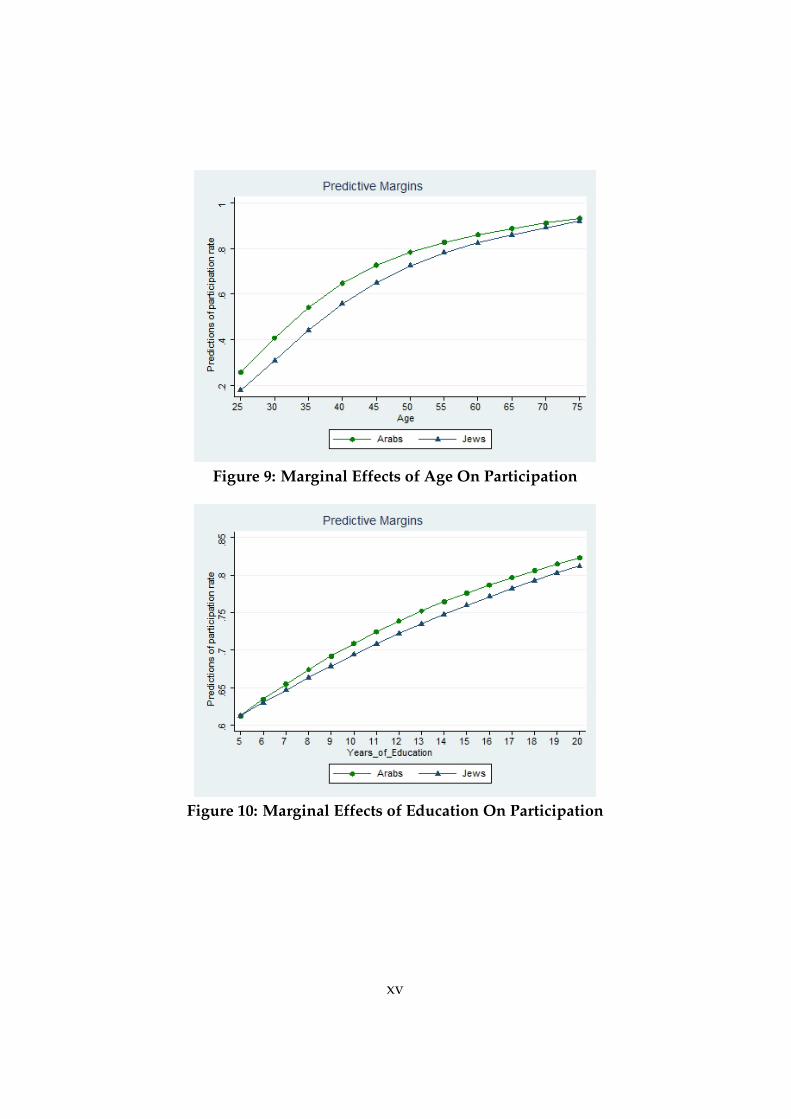
Figure 9: Marginal Effects of Age On Participation
Figure 10: Marginal Effects of Education On Participation
xv
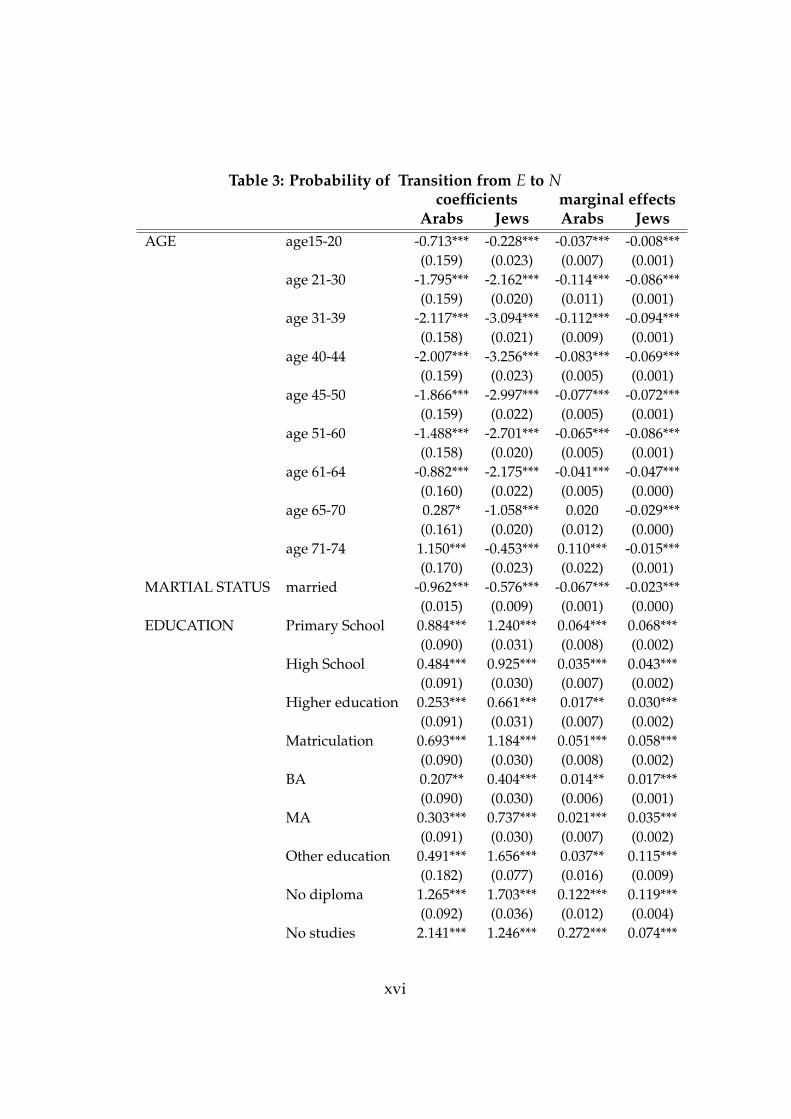
Table 3: Probability of Transition from E to Ncoefficients marginal effects
Arabs Jews Arabs JewsAGE age15-20 -0.713*** -0.228*** -0.037*** -0.008***
(0.159) (0.023) (0.007) (0.001)age 21-30 -1.795*** -2.162*** -0.114*** -0.086***
(0.159) (0.020) (0.011) (0.001)age 31-39 -2.117*** -3.094*** -0.112*** -0.094***
(0.158) (0.021) (0.009) (0.001)age 40-44 -2.007*** -3.256*** -0.083*** -0.069***
(0.159) (0.023) (0.005) (0.001)age 45-50 -1.866*** -2.997*** -0.077*** -0.072***
(0.159) (0.022) (0.005) (0.001)age 51-60 -1.488*** -2.701*** -0.065*** -0.086***
(0.158) (0.020) (0.005) (0.001)age 61-64 -0.882*** -2.175*** -0.041*** -0.047***
(0.160) (0.022) (0.005) (0.000)age 65-70 0.287* -1.058*** 0.020 -0.029***
(0.161) (0.020) (0.012) (0.000)age 71-74 1.150*** -0.453*** 0.110*** -0.015***
(0.170) (0.023) (0.022) (0.001)MARTIAL STATUS married -0.962*** -0.576*** -0.067*** -0.023***
(0.015) (0.009) (0.001) (0.000)EDUCATION Primary School 0.884*** 1.240*** 0.064*** 0.068***
(0.090) (0.031) (0.008) (0.002)High School 0.484*** 0.925*** 0.035*** 0.043***
(0.091) (0.030) (0.007) (0.002)Higher education 0.253*** 0.661*** 0.017** 0.030***
(0.091) (0.031) (0.007) (0.002)Matriculation 0.693*** 1.184*** 0.051*** 0.058***
(0.090) (0.030) (0.008) (0.002)BA 0.207** 0.404*** 0.014** 0.017***
(0.090) (0.030) (0.006) (0.001)MA 0.303*** 0.737*** 0.021*** 0.035***
(0.091) (0.030) (0.007) (0.002)Other education 0.491*** 1.656*** 0.037** 0.115***
(0.182) (0.077) (0.016) (0.009)No diploma 1.265*** 1.703*** 0.122*** 0.119***
(0.092) (0.036) (0.012) (0.004)No studies 2.141*** 1.246*** 0.272*** 0.074***
xvi
coefficients marginal effectsArabs Jews Arabs Jews
EARNERS 1 earner in HH -0.014 -0.027*** -0.001 -0.001***(0.016) (0.010) (0.001) (0.000)
2 earners in HH 0.037** -0.195*** 0.002** -0.007***(0.015) (0.009) (0.001) (0.000)
3 earners in HH 0.155*** 0.050*** 0.010*** 0.002***(0.016) (0.010) (0.001) (0.000)
HEALTH Illness 1.471*** 1.149*** 0.154*** 0.066***(0.035) (0.021) (0.005) (0.002)
CHILDREN No Children -0.009 -0.080*** -0.001 -0.003***(0.013) (0.008) (0.001) (0.000)
2 or 3 Children 0.085*** -0.099*** 0.005*** -0.004***(0.013) (0.011) (0.001) (0.000)
4 Children 0.260*** 0.540*** 0.018*** 0.024***(0.016) (0.017) (0.001) (0.001)
xvii
coefficients marginal effectsArabs Jews Arabs Jews
INDUSTRY Agriculture -0.758*** 0.623*** -0.037*** 0.029***(0.077) (0.125) (0.003) (0.007)
Manufacturing -0.946*** 0.018 -0.049*** 0.001(0.068) (0.123) (0.003) (0.005)
Electricity -2.328*** -0.133 -0.066*** -0.005(0.166) (0.128) (0.002) (0.004)
Construction -0.451*** 0.475*** -0.027*** 0.021***(0.068) (0.123) (0.004) (0.006)
Commerce -0.782*** -0.030 -0.042*** -0.001(0.068) (0.122) (0.003) (0.005)
Restaurants and Hotels -0.696*** 0.464*** -0.036*** 0.020***(0.069) (0.123) (0.003) (0.006)
Transportation -0.702*** -0.046 -0.036*** -0.002(0.069) (0.123) (0.003) (0.004)
Banking and Insurance -0.900*** 0.043 -0.041*** 0.002(0.092) (0.124) (0.003) (0.005)
Real Estate -0.515*** 0.152 -0.028*** 0.006(0.069) (0.122) (0.003) (0.005)
Public Administration -0.274*** 0.358*** -0.016*** 0.015***(0.072) (0.123) (0.004) (0.006)
Education -0.679*** 0.913*** -0.034*** 0.046***(0.072) (0.123) (0.003) (0.008)
Health -0.783*** 0.350*** -0.038*** 0.015**(0.072) (0.123) (0.003) (0.006)
Community Services -1.016*** 0.517*** -0.046*** 0.023***(0.072) (0.123) (0.002) (0.006)
Household Services 0.893*** 0.047***(0.127) (0.009)
OCCUPATION Academic -0.389*** -0.245*** -0.022*** -0.009***(0.032) (0.014) (0.002) (0.000)
Professionals -0.246*** -0.230*** -0.014*** -0.008***(0.028) (0.011) (0.002) (0.000)
Managers -0.374*** -0.705*** -0.021*** -0.021***(0.039) (0.015) (0.002) (0.000)
Clerical -0.088*** -0.307*** -0.005*** -0.010***(0.026) (0.012) (0.002) (0.000)
Agriculture -0.066 -0.502*** -0.004 -0.016***(0.045) (0.029) (0.003) (0.001)
Manufacturing -0.242*** -0.278*** -0.015*** -0.010***(0.016) (0.010) (0.001) (0.000)
Unprofessional -0.070*** 0.312*** -0.004*** 0.013***(0.016) (0.010) (0.001) (0.000)
xviii
coefficients marginal effectsArabs Jews Arabs Jews
TIME D2005 -0.210*** -0.043*** -0.013*** -0.002***(0.018) (0.011) (0.000) (0.000)
D2006 -0.200*** -0.200*** -0.012*** -0.007***(0.018) (0.012) (0.000) (0.000)
D2007 -0.169*** -0.102*** -0.010*** -0.004***(0.018) (0.012) (0.000) (0.000)
D2008 -0.174*** -0.160*** -0.010*** -0.006***(0.018) (0.012) (0.000) (0.000)
D2009 -0.056*** -0.040*** -0.003*** -0.001***(0.017) (0.011) (0.000) (0.000)
D2010 0.014 -0.115*** 0.001*** -0.004***(0.017) (0.011) (0.000) (0.000)
D2011 0.087*** -0.028** 0.006*** -0.001***(0.017) (0.011) (0.000) (0.000)
Constant -0.118 -1.168***(0.196) (0.128)
LR χ2 51,121 232,441p-value (0.00) (0.00)Pseudo R2 0.11 0.19N 870742 3.391e+06
Notes:1. ** p < 0.05; ***p < 0.012. Sample is 2011; see Section XX and Table 1.
xix
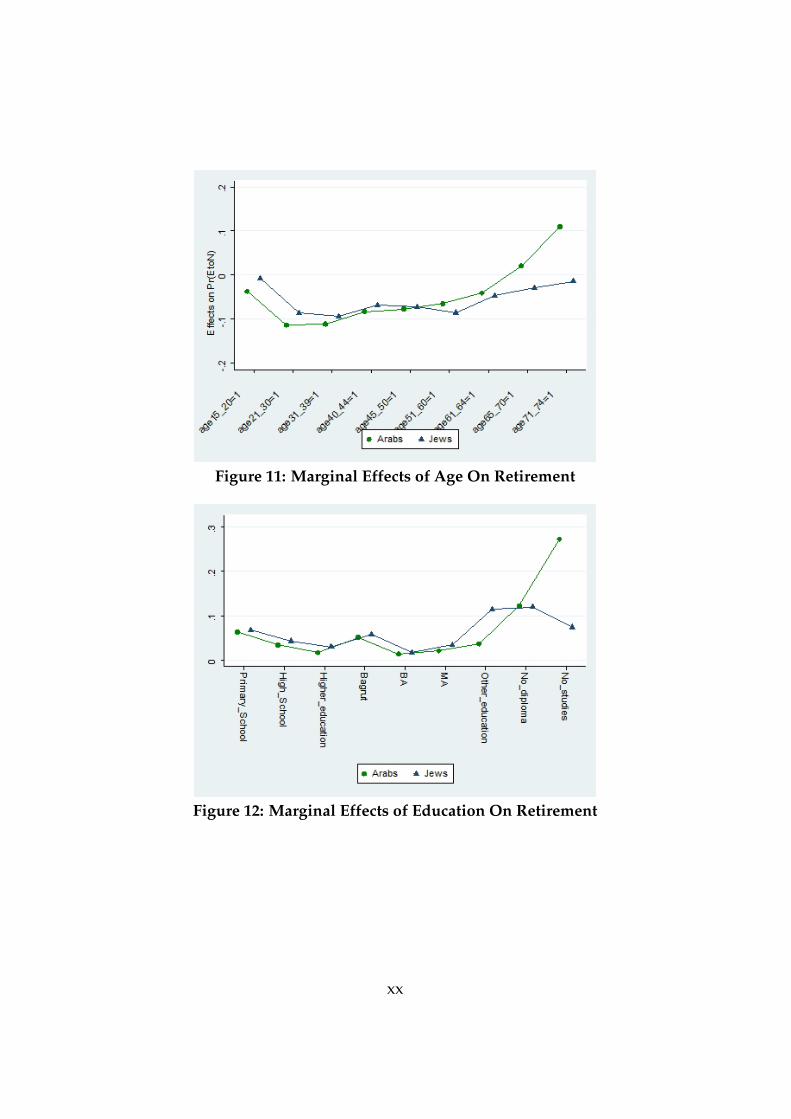
Figure 11: Marginal Effects of Age On Retirement
Figure 12: Marginal Effects of Education On Retirement
xx
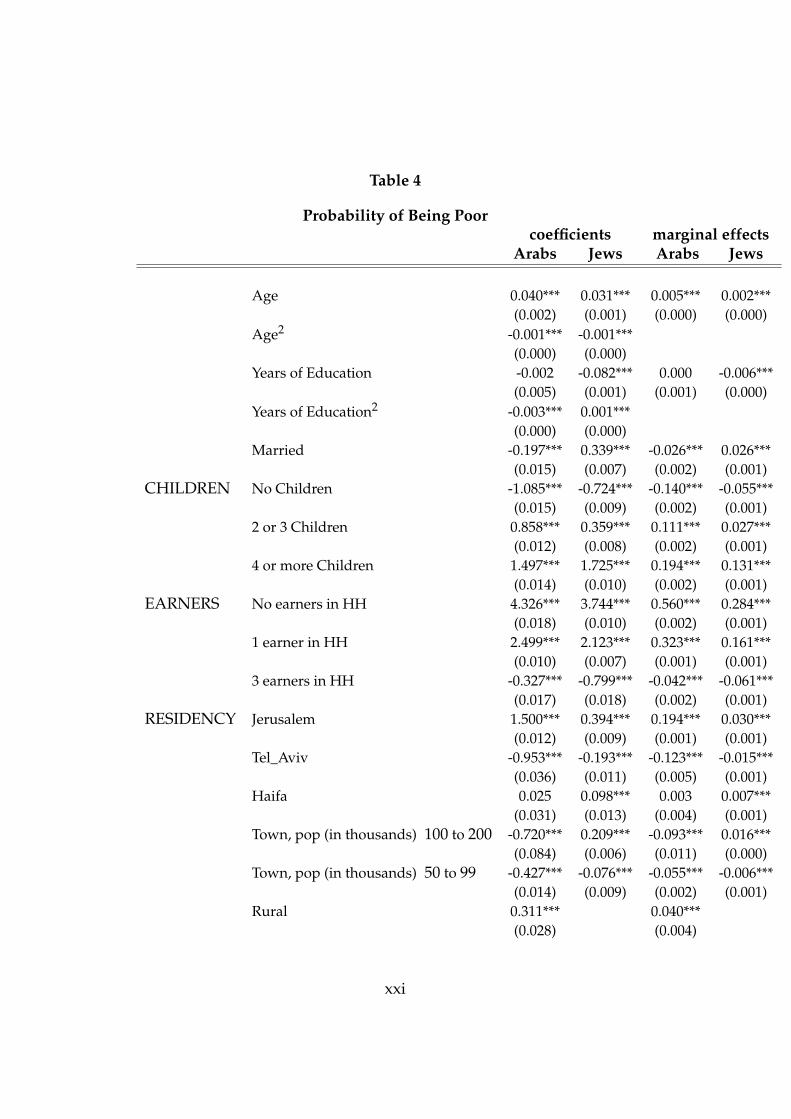
Table 4
Probability of Being Poorcoefficients marginal effects
Arabs Jews Arabs Jews
Age 0.040*** 0.031*** 0.005*** 0.002***(0.002) (0.001) (0.000) (0.000)
Age2 -0.001*** -0.001***(0.000) (0.000)
Years of Education -0.002 -0.082*** 0.000 -0.006***(0.005) (0.001) (0.001) (0.000)
Years of Education2 -0.003*** 0.001***(0.000) (0.000)
Married -0.197*** 0.339*** -0.026*** 0.026***(0.015) (0.007) (0.002) (0.001)
CHILDREN No Children -1.085*** -0.724*** -0.140*** -0.055***(0.015) (0.009) (0.002) (0.001)
2 or 3 Children 0.858*** 0.359*** 0.111*** 0.027***(0.012) (0.008) (0.002) (0.001)
4 or more Children 1.497*** 1.725*** 0.194*** 0.131***(0.014) (0.010) (0.002) (0.001)
EARNERS No earners in HH 4.326*** 3.744*** 0.560*** 0.284***(0.018) (0.010) (0.002) (0.001)
1 earner in HH 2.499*** 2.123*** 0.323*** 0.161***(0.010) (0.007) (0.001) (0.001)
3 earners in HH -0.327*** -0.799*** -0.042*** -0.061***(0.017) (0.018) (0.002) (0.001)
RESIDENCY Jerusalem 1.500*** 0.394*** 0.194*** 0.030***(0.012) (0.009) (0.001) (0.001)
Tel_Aviv -0.953*** -0.193*** -0.123*** -0.015***(0.036) (0.011) (0.005) (0.001)
Haifa 0.025 0.098*** 0.003 0.007***(0.031) (0.013) (0.004) (0.001)
Town, pop (in thousands) 100 to 200 -0.720*** 0.209*** -0.093*** 0.016***(0.084) (0.006) (0.011) (0.000)
Town, pop (in thousands) 50 to 99 -0.427*** -0.076*** -0.055*** -0.006***(0.014) (0.009) (0.002) (0.001)
Rural 0.311*** 0.040***(0.028) (0.004)
xxi
coefficients marginal effectsArabs Jews Arabs Jews
OCCUPATION Academic -1.562*** -1.411*** -0.202*** -0.107***(0.031) (0.015) (0.004) (0.001)
Professionals -1.276*** -1.024*** -0.165*** -0.078***(0.027) (0.013) (0.003) (0.001)
Managers -0.351*** -2.453*** -0.045*** -0.186***(0.035) (0.028) (0.005) (0.002)
Clerical workers -0.843*** -0.544*** -0.109*** -0.041***(0.028) (0.014) (0.004) (0.001)
Services -0.534*** -0.260*** -0.069*** -0.020***(0.016) (0.010) (0.002) (0.001)
Manufacturing workers -0.278*** -0.520*** -0.036*** -0.039***(0.012) (0.010) (0.002) (0.001)
Unprofessional 0.130*** 0.136*** 0.017*** 0.010***(0.016) (0.013) (0.002) (0.001)
Constant -2.025*** -2.495***(0.040) (0.018)
LR χ2 275,103 524,710p-value (0.00) (0.00)Pseudo R2 0.41 0.33N 480,047 2,087,000
Notes:1. ** p < 0.05; ***p < 0.012. Sample is 2004 to 2011; see Section XX and Table 1.
xxii
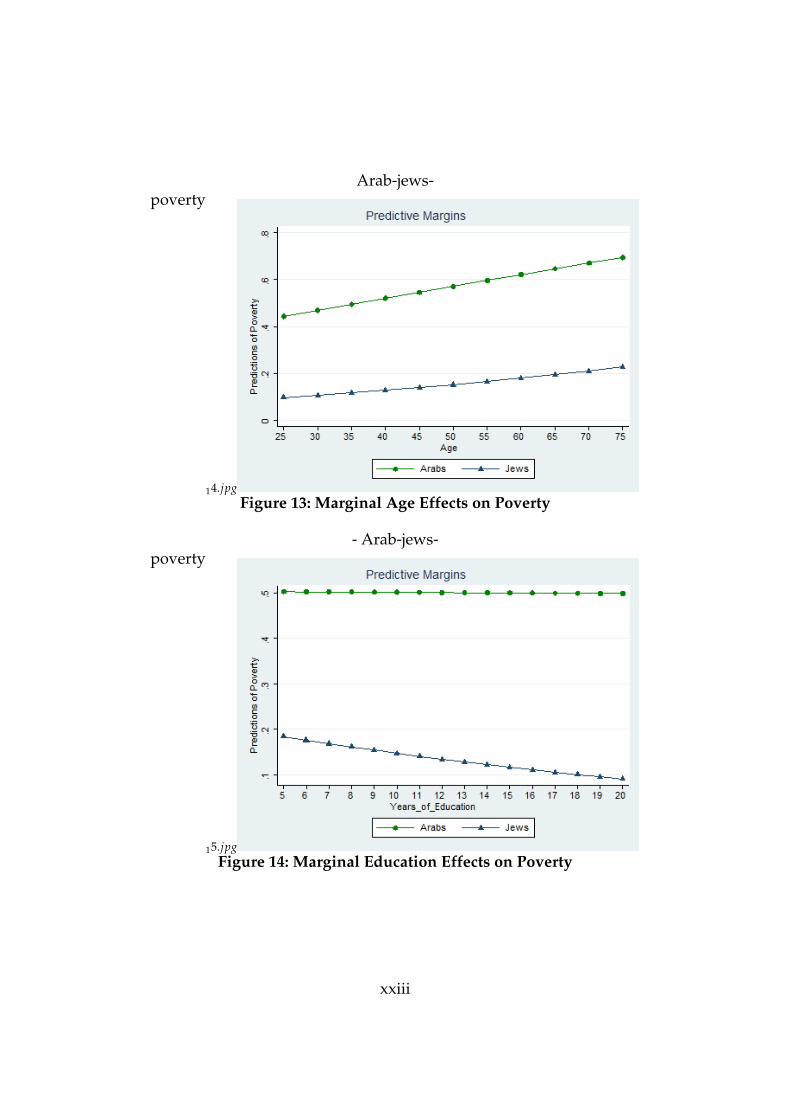
Arab-jews-poverty
14.jpgFigure 13: Marginal Age Effects on Poverty
- Arab-jews-poverty
15.jpgFigure 14: Marginal Education Effects on Poverty
xxiii