discussion paper no. 2007-5 december 2007
TRANSCRIPT

JOINT TRANSPORT RESEARCH CENTRE
Discussion Paper No. 2007-5December 2007
The Performance of Brazilian Biofuels:
An Economic, Environmental and Social Analysis
Edmar Fagundes DE ALMEIDA, Jose Vitor BOMTEMPOCarla Maria DE SOUZA E SILVA
Federal University of Rio de JaneiroRio de Janeiro, Brazil

E. De Almeida, J. Bomtempo et al. 2
TABLE OF CONTENTS EXECUTIVE SUMMARY ...................................................................................... 5 INTRODUCTION ................................................................................................ 13 1 – PERFORMANCE OF THE BRAZILIAN ETHANOL ...................................... 13
1.1 – The Economic Dimension ....................................................................... 16 1.1.1 – Ethanol Competitiveness as Compared to Gasoline ........................ 17 1.1.2 – Evolution of Ethanol's Production Costs ........................................... 20
1.1.2.1 – Current Production Costs ........................................................... 23 1.2.1.2 – The Impact of Bagasse-based Power Generation ..................... 27
1.1.3 – Brazilian Ethanol as Compared Ethanol in Other Countries ............ 28 1.1.4 – Direct and Indirect Subsidies to Ethanol .......................................... 31 1.1.5 – Prospects for Ethanol Costs' Evolution ............................................ 32
1.2 – The Environmental Dimension ............................................................... 35 1.2.1 – Ethanol's Impact on GHG Emissions ............................................... 35 1.2.2 – Deforestation and GHG Emissions in Brazil ..................................... 39 1.2.3 – Land Availability ................................................................................ 41 1.2.2 – Ethanol's Local Environmental Impacts ............................................ 43
1.3 – The Social Dimension ............................................................................. 46 1.4 – The Energy Security Dimension ............................................................. 48
1.4.1 – Ethanol's Contribution to Energy Security in Brazil .......................... 48 1.4.2 – Brazil as a World Class Ethanol Exporter ........................................ 50
2 – BIODIESEL ................................................................................................... 60 2.1 – Economic Performance .......................................................................... 61
2.1.1 - The biodiesel feedstock economics .................................................. 62 2.1.2 - Biodiesel Plant Technology ............................................................... 67 2.1.3 – Brazilian Biodiesel as Compared to Other Countries ....................... 71 2.1.4 - Biodiesel Competitiveness as Compared to Diesel .......................... 72 2.1.5 – Direct and Indirect Subsidies to Biodiesel ........................................ 75
2.2 – Environmental Performance ................................................................... 77 2.2.1 – Other Environmental Impacts ........................................................... 80 2.2.2 - Environmental Impacts of Mineral Diesel Replacement ................... 82
2.3 – Brazil as a World Class Biodiesel's Exporter .......................................... 83 4 – REFERENCES ............................................................................................. 86 List of Figures Figure 1 – Timeline of Ethanol Program in Brazil (Pro-alcool) .......................... 14 Figure 2 - Evolution of Ethanol Production in Brazil .......................................... 15 Figure 3 – Evolution of Ethanol Exports – Brazil ............................................... 16 Figure 4 - Brazil Exports 2006 ........................................................................... 16 Figure 5 - Evolution of Gasoline and Hydrated Ethanol Prices in Brazil ........... 17 2001 - 2007 ........................................................................................................ 17

3 E. De Almeida, J. Bomtempo et al.
Figure 6- Ethanol/Gasoline Relative Prices to End Consumers ........................ 18 Figure 7 – Comparison of Ethanol and Gasoline Prices Excluding Taxes ........ 19 Figure 8 – Evolution of Ethanol Prices in Different Regions/States .................. 20 Figure 9 - Evolution of Sugarcane Production and Productivity in Brazil .......... 21 Figure 10- Experience Curve of Brazilian Ethanol (1980-2005) ........................ 22 Figure 11 – Ethanol Producer’s prices .............................................................. 23 Figure 12 - Sugarcane Market Price – US$/Ton ............................................... 25 Figure 13 - Electricity Generation Using Bagasse as fuel in Brazil - GWh ....... 28 Figure 14 - Ethanol Production Costs without Subsidies .................................. 30 Figure 15 – Fuels Added Value Taxes in Brazil (ICMS Tax) ............................. 32 Figure 16 - Energy flows in Ethanol Production ................................................ 36 Figure 17 - Location of the sugarcane plantation in Brazil ................................ 41 Figure 18 – Evolution of Cropland by Type of Crop .......................................... 42 Figure 19 – Value of the Avoided Imports of Oil and Oil Products
due to Ethanol Consumption ........................................................... 49 Figure 20 - Expected Ethanol Production in Brazil ............................................ 52 Figure 21 –Ethanol Demand Scenarios for Brazil ............................................. 53 Figure 22 - Ethanol Exports Scenarios for Brazil .............................................. 54 Figure 23 – Light Vehicles Fleet Evolution and Estimation – Brazil .................. 55 Figure 24 – Evolution and Estimated Light Vehicles Sales in Brazil 2000-201556 Figure 25 - Evolution of the Composition of Light Vehicle Fleet in Brazil ......... 57 Figure 26 - Ethanol Import Duties in Different Countries ................................... 58 Figure 27 - Evolution of Vegetal Oils price in the International Market ............. 67 Figure 28 - Evolution of Biodiesel Price in the ANP´s First Auctions ................ 73 Figure 29 – Estimated Biodiesel Production Costs According to
Feedstock and Producing Regions - 2005 (40,000 tons/year) ....... 74 Figure 30 – Subsidies to Biodiesel Production in Brazil (US$ per liter) ............ 77 List of Tables Table 1 – Ethanol Production Cost in Brazil ...................................................... 24 Table 2 - Cost of Production in a Standard Ethanol Project in Brazil ................ 26 Table 3 – Ethanol Estimated Production Costs in Different Countries .............. 29 Table 4 - Expected Gains in Productivity in Ethanol Production ....................... 33 Table 5 - Impacts of Hydrolysis on Ethanol Productivity
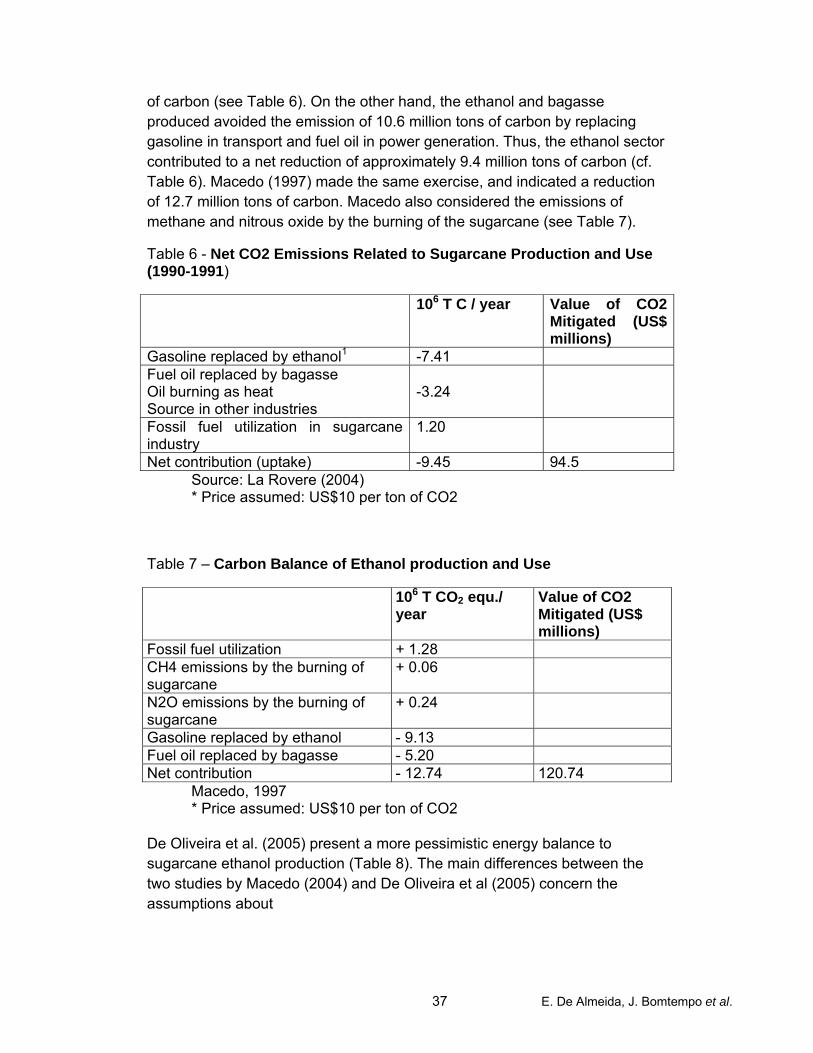
(Hydrolysis of Bagasse and Straw) ..................................................... 34 Table 6 - Net CO2 Emissions Related to Sugarcane Production
and Use (1990-1991) ......................................................................... 37 Table 7 – Carbon Balance of Ethanol production and Use ............................... 37 Table 8 – Worse Case Scenario of Ethanol Energy Balance in Brazil (GJ) ...... 38 Table 9 - Land Use in Brazil .............................................................................. 42 Table 10 – Emissions Related to the Straw Burning for Harvesting ................. 45 Table 12 – Economic Characteristics of main Source of Feedstocks
for Biodiesel in Brazil ........................................................................ 66 Table 13 - Comparing biodiesel and Hbio ......................................................... 68 Table 14 – Brazilian Biodiesel Producers Authorized by the
National Petroleum Agency ............................................................. 70 Table 15 - Energy Balance for Different type of Biodiesel Feedstock ............... 79 Table 16 – Emission Limits for Heavy Duty Diesel Vehicles in Europe - g/kWh 83 Table 17 - Brazilian Biodiesel Production – A Speculative Scenario ................ 84

E. De Almeida, J. Bomtempo et al. 4

5 E. De Almeida, J. Bomtempo et al.
EXECUTIVE SUMMARY
The increase in the oil price and the worsening of climate change are fostering biofuels programs around the world. Brazil has a long tradition in biofuels. The country is a large-scale producer of ethanol since the 1970s. In 2006, ethanol was responsible for 17% of all vehicle fuel supply in the Brazil. Brazil’s ethanol production from sugarcane is also recognized by its economic performance. In 2005, Brazilian government has launched a biodiesel program.
The aim of this report is to make a critical review of Brazilian ethanol and biodiesel programs. It provides lessons about the potential competitiveness of biofuels vis a vis traditional fuels. The document also presents the potential social and environmental impacts of the biofuels in Brazil. The analysis made in this report has been based on an extensive literature review on the subject of biofuels in Brazil. Interviews with experts have also been made in order to clarify some particular issues.
The report is divided in two parts: the first is focused on ethanol program and the second to the biodiesel. The first part of the report is divided into the following sections: i) economic performance; ii) the environmental performance; iii) the social performance; iv)energy security performance; v) Brazil as a world-class ethanol exporter. The second part of the report is divided into the following sections: i) economic performance; ii) the environmental performance; iii) Brazil as a world-class biodiesel exporter.
ETHANOL
Brazilian ethanol market is experiencing a phase of rapid expansion stimulated by the development of FFVs. FFVs can use any mix of gasoline and hydrated ethanol, and drivers can choose the fuel based on the relative pump prices. This technology has transformed the ethanol market, as it eliminates the risk of ethanol shortage with no additional cost in relation to gasoline-only cars. By 2006, 80% of Brazilian car sales were FFVs. About 2.8 million FFVs were sold in Brazil since the beginning of 2003. According to our estimate, at this pace, FFVs could reach 27% of the Brazilian car fleet in 2010 and 43% in 2015.
In 2006, ethanol production in Brazil was estimated at 17.3 billions liters. About 80% of this production was consumed domestically. Ethanol exports

E. De Almeida, J. Bomtempo et al. 6
are also increasing at a rapid pace, since 2003. In 2006, Brazil exported some 3.5 billion liters, being the United States the main destination.
Competitiveness
Fuel prices liberalization in Brazil was completed in 2002. Due to the difference in energy content, in order to be competitive to end-consumers, ethanol prices should be at most 70% of the gasoline prices at the pump. Over the last 5 years, ethanol prices have been attractive to end consumers, with few exceptions moments. This is a result of ethanol tax exemptions offered to ethanol producers. Total federal taxes charged over gasoline is US$ 0.26/liter compared to US$ 0.01/liter for ethanol. The second kind of tax exemption is the difference in the VAT charged over gasoline and over ethanol in the different states. We have estimated the amount of overall tax incentives to ethanol at US$ 977 million per year.
Regarding the economic attractiveness of ethanol production, we have estimated the production cost for new ethanol projects, including a fair remuneration for the capital, at US$0.37 per liter. The current ethanol producer price is about US$0.40 per liter. Therefore, currently ethanol prices are above the marginal expansion cost.
Environmental performance
The literature on the GHG emissions impact of the ethanol production in Brazil points out that sugarcane ethanol has by far the highest potential for GHG emissions reduction. Sugarcane ethanol can contribute for reducing more than 80% the GHG emissions, while ethanol generated from other types of feedstock can reach 50% in the best case. Macedo et al. (2004) estimate that for each MJ of fossil fuel used in the process of growing collecting and processing sugar cane 8.3 to 10.2 MJ of ethanol are produced.
However, there remain some concerns about indirect impacts on GHG emissions. About 75% of Brazilian emissions of CO2 are related to deforestation. Sugarcane plantations are concentrated in the Southeast and Northeast regions, which are far from the Amazon forest region. Nevertheless, the research made so far about the change in land use induced by sugarcane expansion and its indirect deforestation impact is still inconclusive. Further studies on this subject are necessary condition to foster Brazilian ethanol exports in a context of increasing questioning of biofuels sustainability.
Concerning water management, the discharge of the acidic residue (vinasse) in rivers was the most important source of water pollution in ethanol production zones in Brazil. This practice is now prohibited. Nowadays, a common practice in ethanol industry is the use of recycled vinasse as a

7 E. De Almeida, J. Bomtempo et al.
fertilizer in the sugarcane plantations. As a result, the use of fertilizers in Brazilian sugarcane plantations has been stable since the 1970s. Another important initiative regarding water resources is the legislation put in place that promote water preservation through the stimulus of reforestation of rivers margins.
The main local environmental impact is related to the sugarcane harvesting practice. The large majority of sugarcane producers still employ manual harvesting. Sugarcane leaves and straw makes the manual harvesting process arduous and slow1. So, to increase harvesting productivity, sugarcane straw is burned before harvesting. These burnings produce a large concentration of smoke and particulates in the cities nearby. Local pollution has created an important political reaction against sugarcane burning by local stakeholders.
Sao Paulo state law n. 11.241 of 2002 created a schedule for a progressive introduction of mechanized harvesting and progressive elimination of burnings. This schedule varies according to the characteristics of the land used. For flat areas, all harvesting should be mechanized by 2021.
Social impacts
The social impacts are one of the main reasons behind government support to ethanol industry. Sugar and ethanol production represents about 3% of GDP. Jobs created in the industry are estimated at 700 thousand of direct jobs and 200 thousand of indirect jobs. The ratio “jobs per energy unit” is estimated to be 100 times greater than in oil production.
These figures hide important issues regarding the quality of the jobs created. The majority of jobs created are for sugarcane plantation and harvesting activities, which are low quality jobs, since they involve insalubrious activities (manual harvesting). Another problem of the sugarcane plantation is the seasonality of the production process. Therefore, a large part of the workers dedicated to the sugarcane harvesting work only 7 months per year. The Ministry of Labor has strengthened the regulation on the working conditions. Although working conditions have improved considerably in the last decades it is still a controversial subject.
The mechanization of harvesting is expected to improve working conditions. Harvesting machines will replace unskilled temporary workers. The average productivity and salary tend to rise. However, the labor intensity of ethanol production will decrease, with a substantial impact on the unemployment rate.
1 Sugarcane leaf can cut the workers. Burning is also useful to "clean" the area from
dangerous animals and makes cutting and transporting the sugarcane easer.

E. De Almeida, J. Bomtempo et al. 8
Contribution to Energy Security in Brazil
The Pro-Alcohol program contributed to increase the country's energy security. After 1980, ethanol production in Brazil was equivalent to 10% of all oil products consumed in the country. Thus, the program reduced the burden on the Balance of payments due to the imports of oil. The annual value of the avoided imports fluctuated between US$ 500 million and one billion dollars in the 1980s and 1990s, and shoot up after 2002 due to the increase of the oil price and the level of ethanol production.
Today, macroeconomic restrictions related to oil imports are no longer relevant. In 2006, Brazil reached self-sufficiency in oil production. Energy security then has become an issue related to the long-term sustainability of energy supply in Brazil. Biofuels are seeing as a secure path for guaranteeing long-term energy supply in a context of increasing environmental restrictions.
Brazil as a World Class Ethanol Exporter
The role of Brazil in the world ethanol market will depend on the evolution of three main factors: i) the Brazilian ethanol production; ii) the domestic ethanol demand; iii) the development of an international ethanol market.
We have estimated ethanol production in Brazil based on a scenario of sugarcane production elaborated by producers' representatives (UNICA). According to this scenario, Brazil is expected to reach 570 million tons of sugarcane production in 2010 and 731 millions tons in 2015. We assumed that 60% of sugarcane will be directed toward ethanol production, given that most of the mills under construction or planned are ethanol-dedicated. In addition, we assumed that industrial productivity will increase from current 80 l/ton to 90 l/ton. In this scenario, we expect that ethanol production will reach 39 billion liters in 2015.
We projected three scenarios for ethanol consumption in Brazil in the period between 2007 and 2015. In the first one, we assumed that ethanol prices at the pump in Brazil would be less than 70% of gasoline prices and all Brazilian FFVs fleet would run only on ethanol. In the second scenario, we assumed ethanol prices to be unattractive and that the entire FFV fleet would run on gasoline. None of these two extremes scenarios is very likely. So, in the third scenario, we defined an intermediate and more likely context: we assumed that part of the FFVs fleet will consume ethanol, despite the fact that ethanol prices in the international market push prices higher than 70%. Based on this third scenario, Brazilian ethanol exports would reach 17 billion liter in 2015.
We have analyzed the obstacles for the development of an international ethanol market and emphasized the following obstacles: i) the high

9 E. De Almeida, J. Bomtempo et al.
concentration of the export capacity in Brazil raises security of supply issues; ii) trade barriers and subsidies to domestic production in Europe and the US; iii) doubts/questioning regarding the environmental impacts Brazilian ethanol.
A necessary condition for the large-scale exports of Brazilian ethanol will be the environmental certification process. An important research effort is still to be done for subsidizing the market organization and the development of a certification process.
BIODIESEL
In 2004, Brazilian government launched the National Program for Production and Use of Biodiesel - NPPUB. In 2005, the government enacted the law 11.097 mandating a blend of 2% of biodiesel in the mineral diesel for 2008 (B2) and 5% for 2013 (B5), for the diesel sold to the transportation sector. This mandatory blend will require a production of 1 billion liters in 2008 and 2.4 billion liters in 2013.
There are two political motivations for the NPPUB: fuel supply diversification and social development. The government is expecting to create 200,000 new jobs with incentives for the biodiesel production by small farmers. The decree 5297 created the Social Fuel Certificate: only producers that have this certificate are qualified to sell Biodiesel to the government with favorable conditions, such as tax exemptions and access to cheap financing by the BNDES (National Development Bank) and the PRONAF (National Program for Family-based Agriculture).
Currently, there are 14 biodiesel plants operating with a production capacity of 600,000 ton/year. B2 diesel is offered by 2,000 gas stations, and some local experiences using B30 (30% biodiesel) diesel by bus fleets are under development. About 60 projects for new biodiesel plants have been announced. Government and private agents expects to achieve the same technological and economic performance of ethanol production.
Economic Performance
Brazilian biodiesel industry is in the initial phase of its life cycle. Several technological options are in competition for a dominant design that could bring the industry to a cost reduction trajectory. Therefore, the analysis of the current performance of biodiesel in Brazil cannot reveal automatically its potential for development.

E. De Almeida, J. Bomtempo et al. 10
A large set of sources of feedstock is under consideration. The most important ones are: soybean, castor beans, palm tree, Jatropha and oil from animal source (tallow). In this context, plant feedstock flexibility is an important source of competitiveness.
Palm is by far the feedstock with the largest oil productivity in Brazil, being 8 to 10 times higher than other feedstock options. This high productivity seems to be insufficient to cope with the lack of agronomical experience. However, Brazil has a huge potential for production of several types of palm trees varieties for oil production.
When we compare the alternative feed stocks, we must also analyze the market value of its byproducts. Soybean and cotton-seeds presents high valued byproducts. It is not the case of castor, jatropha and sunflower, which will have to present higher oil productivity to compete with soybean as a feedstock. Currently, soybean seems to be the best option for biodiesel production in Brazil: oil productivity is comparable to castor and sunflower, but the high value of the soybean flour reduces the cost of oil production. In addition, there is a large availability of soybean oil all over the country.
The vegetal oil opportunity cost for biodiesel production is its international price. Today castor oil has the highest opportunity cost: its international price has increased for the highest level in 5 years, making uneconomical its use for biodiesel. Currently, most of castor oil originally produced for biodiesel purposes in Brazil is being exported.
Biodiesel price has been established by the auctions organized by the National Petroleum Agency – (ANP). ANP has promoted 5 biodiesel auctions where a total of 885 million liters has been acquired until February 2007. ANP auctions are a temporary incentive: after 2008 distributors will buy the biodiesel directly from producers. The price paid in the auctions varied between R$1.75 and R$1.9 per liter. The average pump price in Brazil is R$1.80. Therefore, biodiesel is not competitive with mineral diesel, even in the cases when biodiesel is totally exempt from taxes.
According to CEPEA, biodiesel production costs in Brazil vary from US$ 0.34 to US$ 0.85 (40,000 tons/year plant). Comparing biodiesel production cost estimations to the ANP auctions prices, we can conclude that Brazilian biodiesel is an attractive business. In some cases, the auction prices (US$ 0.83 to US$ 0.9 per liter) have been more than 100% higher than biodiesel production costs. This attractiveness is driving a biodiesel rush in Brazil. Investors from the soybean segment have been active in this field, motivated by the opportunity of improving their profitability, but not necessarily committed to the biodiesel long-term development.

11 E. De Almeida, J. Bomtempo et al.
Currently, biodiesel production in Brazil is strongly subsidized. In addition to higher prices paid in the public auctions, several levels of tax incentives are offered to biodiesel producers according to the type of feedstock and place of production. Currently, mineral diesel pays a total federal tax of approximately $0.10 per liter. The government offers 31% tax reduction to biodiesel produced from castor or palm oils and from agribusiness producers in North, Northeast or “Semi-arid” areas. Small farm producers in any country region with any oilseed are granted a 68% tax reduction. Small farmers that produce with castor/palm oils or are located in North, Northeast or “Semi-arid regions” are totally exempted from federal taxes.
Environmental Performance
Similarly to ethanol, Biodiesel global environmental performance depends on the energy balance of biodiesel production in a life-cycle basis. This result varies according to the type of feedstock.
Few studies have been dedicated to the analysis of biodiesel environmental performance in Brazil. Most of studies on biodiesel energy balance are dated. Neto et al. (2004) studied the energy balance of castor oil biodiesel in Brazil and found an energy balance ranging from 2 to 2.9. Martins and Teixeira (1985) found an energy balance of 5.63 to palm oil biodiesel in Brazil while Costa at al. (2005) found a more optimistic figure, ranging from 7 to 10. Finally, energy balance for Jatropha oil biodiesel has been estimated in range from 5 to 6.
Concerning other environmental impacts, the potential contribution of biodiesel production to deforestation should be studied carefully. Particularly, soybean production in Brazil has expanded to areas recently deforested in the Amazon, which indicates an association between deforestation and soybean production in Brazil. As far as castor bean and jatropha are concerned, potential contribution for deforestation can be considered less important. Castor and Jatropha are cultivated in semi-arid zones with few remaining forest areas.
Several varieties of palm trees are native in the humid zones of Brazil, where most of remaining forest are located. The objective is not to replace forest by palm tree plantation, but to create an alternative for already deforested areas. Nevertheless, it is not clear at this point what threats palm oil biodiesel could represent for the Amazon forest.
Few studies have been done regarding the contribution of biodiesel to air quality in large cities in Brazil. EPA (2002) shows that the emissions reduction is directly proportional to the share of biodiesel in the mineral diesel. Petrobio (2006) has estimated the potential benefits for using B5 diesel in Brazilian

E. De Almeida, J. Bomtempo et al. 12
large cities. This study found significant reduction in emissions and estimated the social avoided cost at US$ 75 millions.
Brazil as a World Class Biodiesel's Exporter
The attractiveness of biodiesel production in Brazil will depend on vegetal oil cost. In order to make the vegetal oil production economically sustainable, investments in the feedstock production should be of an order of magnitude of the biodiesel plants. At this point, it is not clear how biomass production investments will evolve, and what impacts on productivity it will have.
Brazil still has about 90 million hectares unused farmland not covered with forest. In addition, about 200 million hectares are dedicated to cattle raising with small average productivity rates. We can conclude that there is no major restriction for expanding vegetal oil growing for biodiesel production. Based on this assumption, we have built the following scenario: Brazil would dedicate the same area currently dedicated to sugarcane (6 million hectares) to new types of biodiesel feedstocks (castor, palm, sunflower, jatropha) at equal area distribution (1.5 million hectares each). In addition, about 20% of current soybean production would be dedicated to biodiesel. Based on these assumptions Brazilian biodiesel production could reach about 11 billion liters per year.
Based on quite reasonable production assumptions, we can conclude that Brazil could produce biodiesel enough to supply current domestic demand, even with a B10 blend (about 5 billion liters), and export expressive amounts of biodiesel (about 5 billion liters). It is clear that Brazil has a potential for exporting significant amounts of Biodiesel within 5 years.
The mandatory biofuels standards in Europe represent an important market potential for Brazil. Nevertheless, Brazilian biodiesel exports will depend on how production costs will evolve. Without increasing alternative feedstock production in Brazil (palm oil, Jatropha and castor), an increasing international demand for soybean oil could jeopardize the Brazilian biodiesel economics. In addition, significant trade obstacles should be faced. Biodiesel specification is not yet on place for allowing the development of international market. Similarly to ethanol, biodiesel programs emphasize domestic production and have not been conceived to allow biodiesel consumption based on imports.

13 E. De Almeida, J. Bomtempo et al.
INTRODUCTION
The increase in the oil price since 2000 and the worsening of climate change associated to energy use are fostering biofuels programs around the world. Brazil´s biofuels program is one of the most advanced in the world, not only in terms of volume of biofuels produced, but also in terms of the economic performance. Brazil is a large scale producer of ethanol since the 1970s and, in 2006, ethanol was responsible for 17% of all vehicle fuel supply in the Brazil. Recently, a biodiesel program has been launched.
The objective of this report is to make a critical review of the performance of Brazilian ethanol and biodiesel programs. This analysis tries to provide lessons about the potential competitiveness of biofuels vis a vis traditional fuels. In addition, the report tries to analyze the potential social and environmental impacts of the biofuels program in Brazil.
The primary focus of the report is on ethanol produced from sugarcane. Nevertheless, the report analyses Brazil´s recent experience with Biodiesel program, and speculates about the potential evolution of this program. The report reviews the Brazilian and international literature on the performance of Brazilian biofuels and has completed the analysis with interviews with experts.
The first part of the report is dedicated to the ethanol market. The second part analyses the biodiesel program. The first part of the report is divided into the following sections: i) economic performance; ii) the environmental performance; iii) the social performance; iv) energy security performance; v) Brazil as an world class ethanol exporter. The second part of the report is divided into the following sections: i) economic performance; ii) environmental performance; iii) Brazil as a world class biodiesel exporter.
1 – PERFORMANCE OF THE BRAZILIAN ETHANOL
Brazil has a history of 500 years of sugarcane plantation for sugar production. Since the 1930s, sugarcane is also used for producing ethanol to be used as fuel in transportation. Until the first oil shock, ethanol was blended into

E. De Almeida, J. Bomtempo et al. 14
gasoline at 5% rate on average2. However, in 1975, the Brazilian government launched the Pro-Alcohol Program to mitigate the macroeconomic impacts of the price increase of imported oil. This program created a set of incentives to boost ethanol production and turned mandatory ethanol blending at 10% rate.
After the second oil crisis, a new set of incentives to both car makers and car buyers allowed the development of an ethanol-dedicated car market. Since 1979, about 5.4 million ethanol fueled cars were produced and, in 1988, almost 100% of passenger cars produced were ethanol-dedicated3. However, the fall of oil prices during the second half of the 1980s and the ethanol price cap at 60% of gasoline price affected the economics of hydrated ethanol production. In 1988, as the international sugar prices soared, while domestic ethanol price was capped, ethanol producers re-oriented their sugarcane feedstock to sugar production and ethanol-dedicated cars experienced a fuel shortage. This fact had an important effect on the credibility of the ethanol program. Ethanol-dedicated car sales almost ceased in the 1990s (see Figure 1).
Figure 1 – Timeline of Ethanol Program in Brazil (Pro-alcool)
As shown in Figure 2, the decadence of the ethanol-dedicated car market after 1988 contributed to put an end to the expansion of ethanol production in Brazil. After 1988, the ethanol market experienced a period of significant volatility. Ethanol prices and ethanol demand became very much influenced by the sugar and gasoline markets. However, ethanol production entered in a new phase of expansion after 2001. This expansion is related three factors: the oil price increase, the development of an international ethanol market and the recovering of the Brazilian ethanol market. 2 From 1934 to 1973, the proportion between ethanol and gasoline consumption varied
between 4% and 6% (Dias Leite, 1997). 3 These ethanol-dedicated cars were not flex-fuel; i.e. they could only burn ethanol. There are
two types of ethanol: FFVs or ethanol-dedicated cars runs on hydrated ethanol; anhydrous ethanol is mixed with gasoline in a variable proportion up to 25%.
1975 1980 1990 2003
Program begins: Increase of the blending to 20%
Blending + Dedicated cars (100% Hydrated ethanol use)
Blending - End of government support to dedicated cars
Blending + FFVs

15 E. De Almeida, J. Bomtempo et al.
Figure 2 - Evolution of Ethanol Production in Brazil
0
2000
4000
6000
8000
10000
12000
14000
16000
18000
1975
1977
1979
1981
1983
1985
1987
1989
1991
1993
1995
1997
1999
2001
2003
2005
Mill
ions
of l
iters
Source: Petrobras, 2005 and Unica.
The main driver for the recent expansion of the domestic ethanol market was the development of flex-fuel vehicles (FFVs). FFVs can use any mix of gasoline and ethanol, so drivers can chose the fuel based on the relative pump prices. This technology has changed radically the context of the hydrated ethanol market in Brazil, as it eliminates the risk of ethanol shortage, with no additional cost in relation to gasoline-only cars. Due to the increase of international oil prices, ethanol prices became attractive to end-consumers, and by 2006 80% of Brazilian car sales were FFVs. About 2.8 million FFVs were sold in Brazil since the beginning of 2003. According to our estimate, at this pace, FFVs could reach 27% of the Brazilian car fleet in 2010 and 43% in 2015.
In 2006, ethanol production in Brazil was estimated at 17.3 billions liters (Ministry of Agriculture, 2007). Domestic consumption accounted for 80% of total production. In 2005, ethanol was responsible for 17% of all vehicle fuel supply in the Brazil. Ethanol exports are also increasing at a rapid pace (Figure 3). Brazil exports ethanol to several countries in the world, the United States being the most important destination. In 2006, ethanol sales to the United States represented more than 60% of total exports. A significant share of these exports reaches the US through the Caribbean Basin Initiative – CBI (Figure 4). Ethanol is exported to the Central America or Caribbean countries and, from there, re-exported to the US without paying imports taxes (ethanol sold directly from Brazil to the US has to pay a US$0.54 tax per gallon).

E. De Almeida, J. Bomtempo et al. 16
Figure 3 – Evolution of Ethanol Exports – Brazil
-500,00
1.000,001.500,002.000,00
2.500,003.000,003.500,004.000,00
2001 2002 2003 2004 2005 2006
mill
ions
m3
Brazil Ethanol Exports
Source: Unica (2007) and Ministry of Agriculture
Figure 4 - Brazil Exports 2006
UNITED STATES; 52%
SWEDEN; 6%
SOUTH KOREA; 3%
OTHERS; 9%
CBI; 14%
NETHERLANDS; 10%
JAPAN; 7%
Source: Ministry of Agriculture CBI = Caribbean Basin Initiative
1.1 – The Economic Dimension
The sugar and ethanol production in Brazil represents an important economic sector, responsible for about 3.6 millions jobs and 3.5% of the GDP. In 2005-06, Brazil produced 25% of the world's sugarcane (about 440 millions tons) using about 6 millions hectares. Roughly half of this sugarcane is converted to sugar and the other half to ethanol. About 70% of sugarcane is cultivated directly by the 370 sugar and ethanol mills that currently operate in Brazil. The remaining 30% is produced by around 70,000 independent farmers who sell their production to the mills.

17 E. De Almeida, J. Bomtempo et al.
1.1.1 – Ethanol Competitiveness as Compared to Gasoline
Until 1997, the government controlled ethanol prices and established a fixed relation between gasoline and ethanol price. The 1997 liberalization of the fuel market in Brazil gradually extinguished all price controls, and, since 2002, ethanol price relative to gasoline price fluctuates freely. As shown in Figure 5, hydrated ethanol price has followed gasoline price in Brazil. Since the fuel market's total liberalization, domestic gasoline price follows the international market. The increase in oil prices after 2004 opened the way to increasing ethanol prices. The booming investment in ethanol production expansion is directly related to oil price evolution.
Figure 5 - Evolution of Gasoline and Hydrated Ethanol Prices in Brazil 2001 - 2007
0
0,2
0,4
0,6
0,8
1
1,2
1,4
jul/01
out/0
1jan
/02ab
r/02
jul/02
out/0
2jan
/03ab
r/03
jul/03
out/0
3jan
/04ab
r/04
jul/04
out/0
4jan
/05ab
r/05
jul/05
out/0
5jan
/06ab
r/06
jul/06
out/0
6jan
/07
US$
/l
ethanol (US$/l) Gasoline (US$/l)
Source: National Petroleum Agency Note: prices include taxes
The increase in gasoline prices does not mean that ethanol is becoming more competitive for FFVs drivers. Because of the difference in energy content and motor efficiency, in order to be competitive with gasoline, the price per liter of hydrated ethanol should not be higher than 70% that of a liter of gasoline. As shown in Figure 6, this price relationship has been unfavorable to ethanol twice in the period of 2001-2007. Every time this has happened, government has suffered strong political pressure to interfere in the ethanol market.

E. De Almeida, J. Bomtempo et al. 18
Figure 6- Ethanol/Gasoline Relative Prices to End Consumers
50%
55%
60%
65%
70%
75%
80%
jul/01
set/0
1
nov/0
1jan
/02
mar/02
mai/02
jul/02
set/0
2
nov/0
2jan
/03
mar/03
mai/03
jul/03
set/0
3
nov/0
3jan
/04
mar/04
mai/04
jul/04
set/0
4
nov/0
4jan
/05
mar/05
mai/05
jul/05
set/0
5
nov/0
5jan
/06
mar/06
mai/06
jul/06
set/0
6
nov/0
6jan
/07
Source: National Petroleum Agency
Ethanol receives two kinds of government incentives in the form of tax exemptions. The first one concerns the difference between the value federal taxes charged over gasoline ex-refinery and hydrated ethanol hydrous ex-mill. Federal taxes include the excise tax (CIDE) and social contributions. First of all, ethanol has been exempted from excise tax since 2004. In addition, social contributions are higher in gasoline than in ethanol. Total federal taxes charged over gasoline amount to US$0.26/liter compared to US$0.01/liter. The second kind of tax exemption is the difference in the VAT charged over gasoline and over ethanol in the different states.
In order to access the role of tax exemptions on ethanol economics, we have compared the price of ethanol ex-mill without taxes to gasoline ex-refinery without taxes (Figure 7). The pump prices will depend also on other factors such as: percentage blend between gasoline and anhydrous ethanol, on the VAT charged over the different fuels, transportation cost and the distribution margin. However, we can expect that if ethanol was charged at the same level as gasoline, both on federal and on state levels, the same pattern of relative price identified on the producers level would remain at end-users-price.
Comparing the prices for the state of São Paulo, the main ethanol producer, we can see that relative prices of ethanol / gasoline would frequently fail the 0,7 condition. In 2006, ethanol was more expensive than gasoline, even in absolute terms. We can conclude that current competitiveness of ethanol in Brazil is anchored in indirect subsidies through different level of taxation.

19 E. De Almeida, J. Bomtempo et al.
Figure 7 – Comparison of Ethanol and Gasoline Prices Excluding Taxes
0,00
0,10
0,20
0,30
0,40
0,50
0,60
jan/02
mar/02
mai/02
jul/02
set/0
2
nov/0
2jan
/03
mar/03
mai/03
jul/03
set/0
3
nov/0
3jan
/04
mar/04
mai/04
jul/04
set/0
4
nov/0
4jan
/05
mar/05
mai/05
jul/05
set/0
5
nov/0
5jan
/06
mar/06
mai/06
jul/06
set/0
6
nov/0
6jan
/07
US$
/l
0%
20%
40%
60%
80%
100%
120%
140%
160%
180%
rela
tive
pric
e (h
ydro
us/g
asol
ine)
gasoline price ex-refinery hydrated ethanol price ex-mill relative price (excluding federal taxes)
Source: Own Elaboration Based on National Petroleum Agency
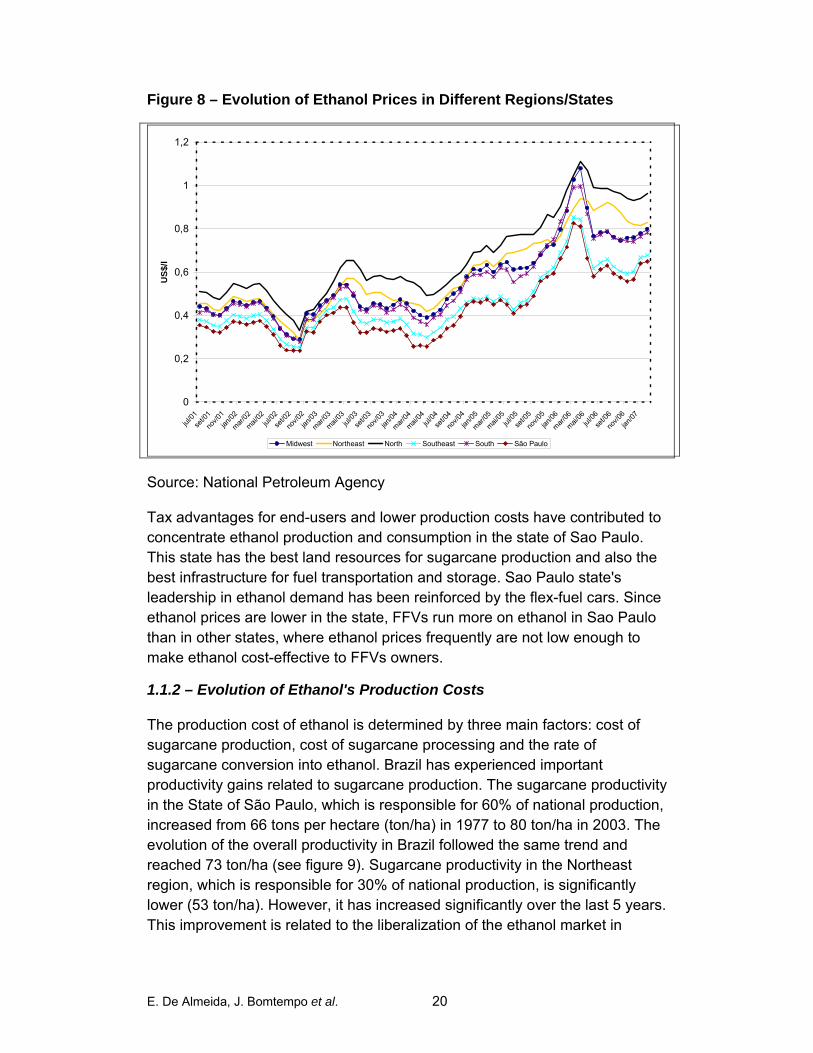
It is important to consider that ethanol end-users price and its competitiveness as compared to gasoline vary significantly in each Brazilian state. Figure 8 shows that differences in ethanol's consumer price in different region/states can be as large as 60%. These variations are related to tax differences, but also to the difference in the cost of logistics for ethanol storage and supply. These costs are much cheaper in the ethanol-producing states.
E. De Almeida, J. Bomtempo et al. 20
Figure 8 – Evolution of Ethanol Prices in Different Regions/States
0
0,2
0,4
0,6
0,8
1
1,2
jul/01
set/0
1
nov/0
1jan
/02
mar/02
mai/02
jul/02
set/0
2
nov/0
2jan
/03
mar/03
mai/03
jul/03
set/0
3
nov/0
3jan
/04
mar/04
mai/04
jul/04
set/0
4
nov/0
4jan
/05
mar/05
mai/05
jul/05
set/0
5
nov/0
5jan
/06
mar/06
mai/06
jul/06
set/0
6
nov/0
6jan
/07
US$
/l
Midwest Northeast North Southeast South São Paulo
Source: National Petroleum Agency
Tax advantages for end-users and lower production costs have contributed to concentrate ethanol production and consumption in the state of Sao Paulo. This state has the best land resources for sugarcane production and also the best infrastructure for fuel transportation and storage. Sao Paulo state's leadership in ethanol demand has been reinforced by the flex-fuel cars. Since ethanol prices are lower in the state, FFVs run more on ethanol in Sao Paulo than in other states, where ethanol prices frequently are not low enough to make ethanol cost-effective to FFVs owners.
1.1.2 – Evolution of Ethanol's Production Costs
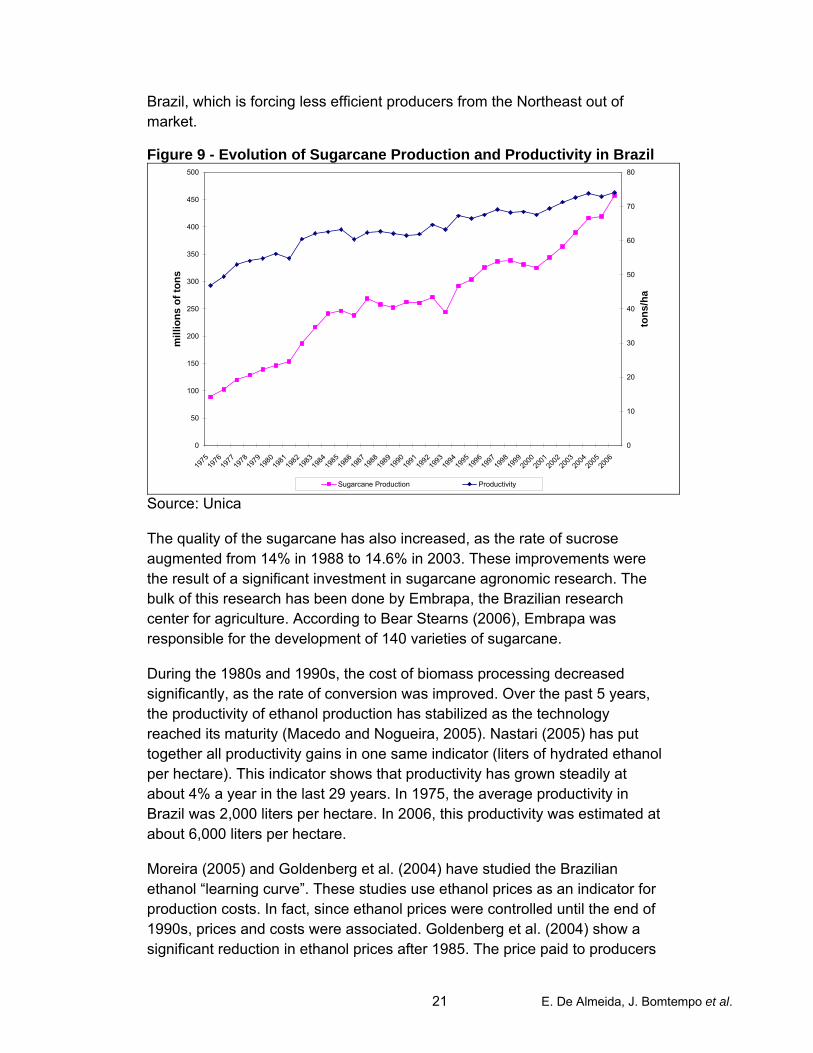
The production cost of ethanol is determined by three main factors: cost of sugarcane production, cost of sugarcane processing and the rate of sugarcane conversion into ethanol. Brazil has experienced important productivity gains related to sugarcane production. The sugarcane productivity in the State of São Paulo, which is responsible for 60% of national production, increased from 66 tons per hectare (ton/ha) in 1977 to 80 ton/ha in 2003. The evolution of the overall productivity in Brazil followed the same trend and reached 73 ton/ha (see figure 9). Sugarcane productivity in the Northeast region, which is responsible for 30% of national production, is significantly lower (53 ton/ha). However, it has increased significantly over the last 5 years. This improvement is related to the liberalization of the ethanol market in
21 E. De Almeida, J. Bomtempo et al.
Brazil, which is forcing less efficient producers from the Northeast out of market.
Figure 9 - Evolution of Sugarcane Production and Productivity in Brazil
0
50
100
150
200
250
300
350
400
450
500
1975
1976
1977
1978
1979
1980
1981
1982
1983
1984
1985
1986
1987
1988
1989
1990
1991
1992
1993
1994
1995
1996
1997
1998
1999
2000
2001
2002
2003
2004
2005
2006
mill
ions
of t
ons
0
10
20
30
40
50
60
70
80
tons
/ha
Sugarcane Production Productivity Source: Unica
The quality of the sugarcane has also increased, as the rate of sucrose augmented from 14% in 1988 to 14.6% in 2003. These improvements were the result of a significant investment in sugarcane agronomic research. The bulk of this research has been done by Embrapa, the Brazilian research center for agriculture. According to Bear Stearns (2006), Embrapa was responsible for the development of 140 varieties of sugarcane.
During the 1980s and 1990s, the cost of biomass processing decreased significantly, as the rate of conversion was improved. Over the past 5 years, the productivity of ethanol production has stabilized as the technology reached its maturity (Macedo and Nogueira, 2005). Nastari (2005) has put together all productivity gains in one same indicator (liters of hydrated ethanol per hectare). This indicator shows that productivity has grown steadily at about 4% a year in the last 29 years. In 1975, the average productivity in Brazil was 2,000 liters per hectare. In 2006, this productivity was estimated at about 6,000 liters per hectare.
Moreira (2005) and Goldenberg et al. (2004) have studied the Brazilian ethanol “learning curve”. These studies use ethanol prices as an indicator for production costs. In fact, since ethanol prices were controlled until the end of 1990s, prices and costs were associated. Goldenberg et al. (2004) show a significant reduction in ethanol prices after 1985. The price paid to producers
E. De Almeida, J. Bomtempo et al. 22
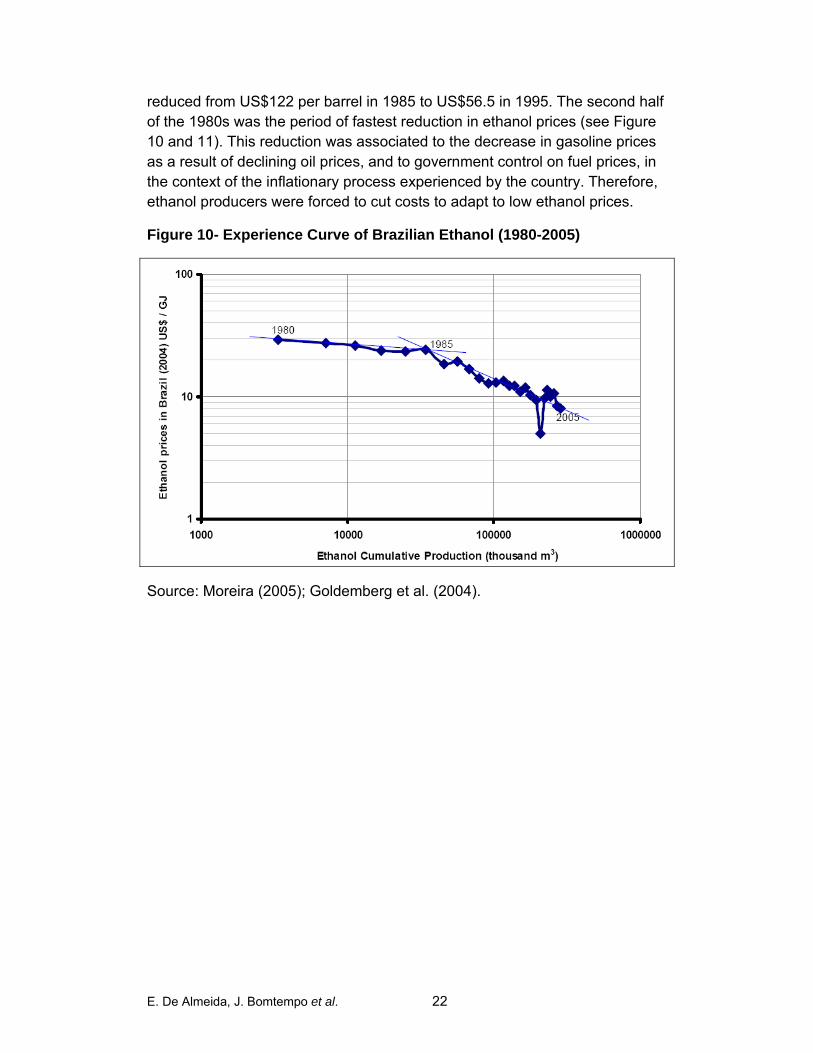
reduced from US$122 per barrel in 1985 to US$56.5 in 1995. The second half of the 1980s was the period of fastest reduction in ethanol prices (see Figure 10 and 11). This reduction was associated to the decrease in gasoline prices as a result of declining oil prices, and to government control on fuel prices, in the context of the inflationary process experienced by the country. Therefore, ethanol producers were forced to cut costs to adapt to low ethanol prices.
Figure 10- Experience Curve of Brazilian Ethanol (1980-2005)
Source: Moreira (2005); Goldemberg et al. (2004).

23 E. De Almeida, J. Bomtempo et al.
Figure 11 – Ethanol Producer’s prices
0
20
40
60
80
100
120
140
160
180
1978
1980
1982
1984
1986
1988
1990
1992
1994
1998
*20
0020
0220
0420
06
US$
/bar
rel
Price paid to producers Source:CEPEA and Unica
1.1.2.1 – Current Production Costs
Until 1997, the price of ethanol was controlled by the government. In order to determine the fair price for the sector, costs of production were scrutinized by an independent research institution (Getulio Vargas Foundation). After the liberalization of ethanol prices, cost estimations were not made systematically. Few studies have been made on this subject and most of cost analysis on Brazilian ethanol makes reference to one same study.
The Brazilian Ministry of Science and Technology (MC&T) has estimated the average ethanol costs in 1990 at about $0.23 per liter with the cost structure described in Table 1 (MC&T, 2002). This study was used as reference in the International Energy Agency's study on Biofuels (IEA, 2004). After that, most references on the cost of ethanol in Brazil point to the same value, despite significant variations in exchange rates, costs of sugarcane, cost of oil products and other important cost items.
Macedo and Nogueira (2005) updated the same cost structure presented by Ministry of Science and Technology's study and estimated the ethanol cost in the Center-South region of Brazil (the most efficient region) at $0.21 per liter. According to the authors, at this price ethanol is competitive with oil products produced with oil at $24 per barrel. The World Bank also pointed to average

E. De Almeida, J. Bomtempo et al. 24
production cost in Brazil in the range $0.23-0.29 per liter (Kojima and Johnson, 2006). These studies all suggest that in average Brazilian ethanol is competitive with the oil prices at about $30 per barrel.
Table 1 – Ethanol Production Cost in Brazil
Average Costs (1990 US$ per liter)
Operating costs $ 0.167 Labour $ 0.006 Maintenance $ 0.004 Chemicals $ 0.002 Energy $ 0.002 Other $ 0.004 Interest payments on working capital
$ 0.022
Feedstock (cane) $ 0.127 Fixed costs $ 0.062
Capital at 12% depreciation rate $ 0.051 Other $ 0.011
Total $ 0.23 Source: C&T (2002)
Indeed, estimating the current cost of ethanol production in Brazil is quite a difficult task. First, it is important to mention that this cost vary significantly in different production areas, given the differences in productivity and cost of sugarcane production. Not only does the productivity vary, but also the cost of sugarcane production changes according to the harvest and transportation technologies. Second, estimating the cost of the sugarcane is crucial to the ethanol cost estimation. Most studies on Brazilian ethanol have estimated sugarcane production cost at $10 dollars per ton, which gives a cost of roughly $0.10 per liter of ethanol. However, this cost is likely to be underestimated. A recent study by the consulting firm IDEA, which is specialized on sugarcane production, shows that the cost of sugarcane production is as high as R$33 per ton. At current exchange rates, this represents US$15.70 per ton and $0.18 per liter of ethanol, considering a productivity rate of 85 liters per ton of sugarcane.
It is also important to take into consideration the opportunity cost of sugarcane feedstock. Ethanol producers acquire about 30% of their sugarcane at market prices. Sugarcane market prices vary significantly according to the sugar and ethanol market conditions. Currently, the price of sugarcane in Sao Paulo state is about $23 per ton or $0.27 per liter of ethanol (see Figure 12). If we add the other costs shown in Table 1, today's real cost of ethanol in Brazil can be estimated at about US$0.40 per liter.

25 E. De Almeida, J. Bomtempo et al.
Given the fact that the mills produce most of their sugarcane feedstock, most of studies on ethanol costs have considered a vertically-integrated plant as a reference for the cost calculations. However, in most case ethanol producers organize their sugarcane supply as follows: 1/3 of the sugarcane is directly produced in the ethanol producers' land; another 1/3 is planted on rented land; and 1/3 is bought from farmers. Therefore, when the sugarcane price goes up, the price of land rent also increases, inflating the cost of sugarcane supply. Another factor to be taken into consideration is the fact that 77% of Brazilian ethanol mills also produce sugar (Souto, 2006). Since mills can shift to sugar production4, one should consider the sugarcane value instead of its production cost.
For all these reasons, we can conclude that the sugarcane opportunity cost should not be disregarded in cost estimations. If sugar prices increases more rapidly than ethanol prices, the sugarcane opportunity costs also increases.
Figure 12 - Sugarcane Market Price – US$/Ton
0
5
10
15
20
25
30
Mai/20
01 Ago Nov Fev
Mai/20
02 Ago Nov Fev
Mai/20
03 Ago Nov Fev
Mai/20
04 Ago Nov Fev
Mai/20
05 Ago Nov Fev
Mai/20
06 Ago Nov
Source: Unica
Recently, Unicamp (2006) tried to estimate the ethanol production cost of new ethanol projects being implemented in Brazil. This study assessed the capital and operational cost of a standard project. Based on these data, we estimated the production cost for new ethanol production in Brazil. Our aim was to estimate at what price ethanol would remain attractive for new investors. For
4 The ethanol and sugar flexibility is not 100%. The maximum sugar production is 75%, since
it is important to produce ethanol with the molasses produced in the sugar process in order to increase the mill's efficiency.
E. De Almeida, J. Bomtempo et al. 26
this calculation, we considered both the capital opportunity cost5 and the sugarcane opportunity cost.
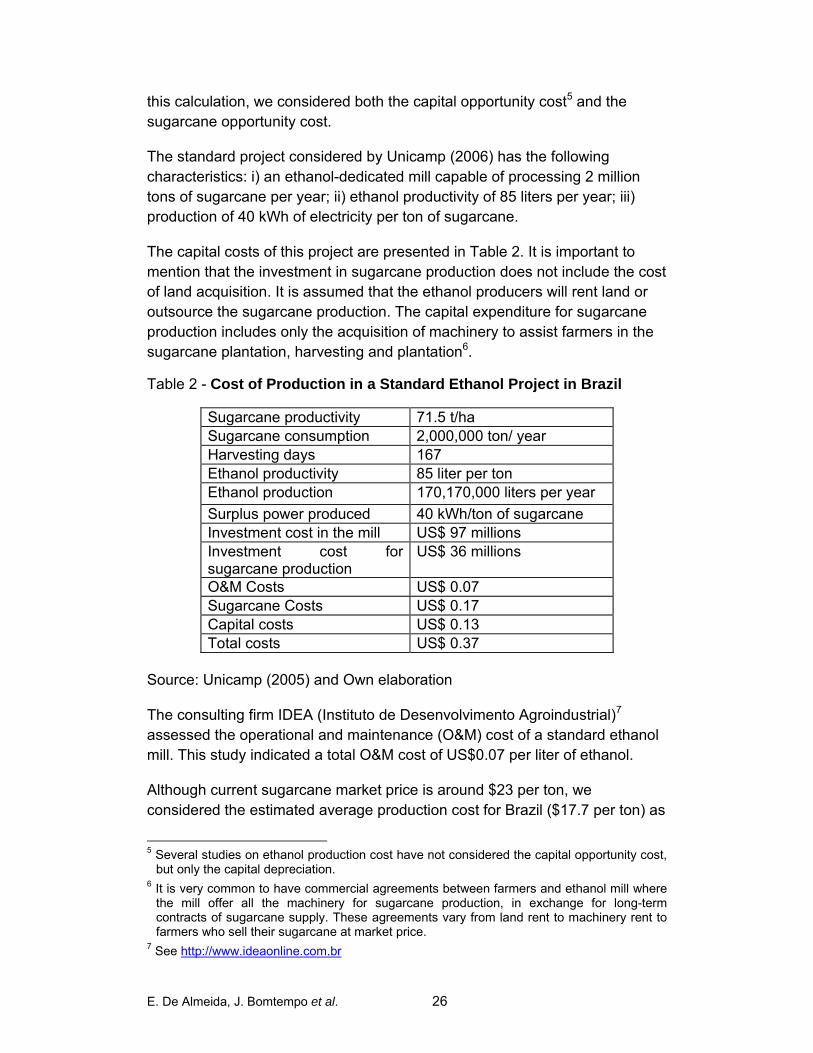
The standard project considered by Unicamp (2006) has the following characteristics: i) an ethanol-dedicated mill capable of processing 2 million tons of sugarcane per year; ii) ethanol productivity of 85 liters per year; iii) production of 40 kWh of electricity per ton of sugarcane.
The capital costs of this project are presented in Table 2. It is important to mention that the investment in sugarcane production does not include the cost of land acquisition. It is assumed that the ethanol producers will rent land or outsource the sugarcane production. The capital expenditure for sugarcane production includes only the acquisition of machinery to assist farmers in the sugarcane plantation, harvesting and plantation6.
Table 2 - Cost of Production in a Standard Ethanol Project in Brazil
Sugarcane productivity 71.5 t/ha Sugarcane consumption 2,000,000 ton/ year Harvesting days 167 Ethanol productivity 85 liter per ton Ethanol production 170,170,000 liters per year Surplus power produced 40 kWh/ton of sugarcane Investment cost in the mill US$ 97 millions Investment cost for sugarcane production
US$ 36 millions
O&M Costs US$ 0.07 Sugarcane Costs US$ 0.17 Capital costs US$ 0.13 Total costs US$ 0.37
Source: Unicamp (2005) and Own elaboration
The consulting firm IDEA (Instituto de Desenvolvimento Agroindustrial)7 assessed the operational and maintenance (O&M) cost of a standard ethanol mill. This study indicated a total O&M cost of US$0.07 per liter of ethanol.
Although current sugarcane market price is around $23 per ton, we considered the estimated average production cost for Brazil ($17.7 per ton) as
5 Several studies on ethanol production cost have not considered the capital opportunity cost,
but only the capital depreciation. 6 It is very common to have commercial agreements between farmers and ethanol mill where
the mill offer all the machinery for sugarcane production, in exchange for long-term contracts of sugarcane supply. These agreements vary from land rent to machinery rent to farmers who sell their sugarcane at market price.
7 See http://www.ideaonline.com.br

27 E. De Almeida, J. Bomtempo et al.
a good estimate for the sugarcane cost of new ethanol mills. Most of these projects are located in areas with lower sugarcane opportunity cost. In addition, these new producers are mostly ethanol dedicated. Finally, we estimated the cost of capital considering the following assumptions: an internal rate of return of 12%; a debt/equity ratio of 50% with 8% interest rate; and the selling of the surplus power at $57 per MWh. Based on these assumptions, we estimated the capital cost at $0.13 per liter of ethanol. Therefore, we estimate that the average cost of production of new ethanol projects in Brazil is $0.37 per liter of ethanol. Based on this estimation, we can say that currently Brazilian ethanol is competitive with an oil barrel at $42, disregarding tax incentives for ethanol.
1.2.1.2 – The Impact of Bagasse-based Power Generation
The use of bagasse for producing energy is an important feature of the Brazilian ethanol cost of production. Ethanol mills consume significant amounts of electricity (12 kWh/ton of sugarcane processed), mechanical energy (16 kWh/ton) and heat (330 kWh/t). Currently, the mills produce almost all the energy they need through bagasse based co-generation power plants. Each ton of sugarcane crop produces 280 kg of bagasse and 90% of this bagasse is used as fuel for power generation8. In addition, about 160 kg of straw is produced per ton of sugarcane. This part of the biomass produced has no economic use at this moment.
According to the Brazilian electricity regulatory agency (ANEEL), there are 226 electricity producers in Brazil that use bagasse as fuel. They are responsible for 2.7 GW of generation capacity (about 3% of the country's total). The use of bagasse for electricity generation has increased rapidly in the last 10 years. As shown in Figure 13, bagasse-based electricity generation increased almost 4-fold between 1995 and 2005. The main reasons for this growth are: i) the power sector liberalization allowing the utilities to buy sugar and ethanol mill's surplus of electricity generation; ii) the important increase in the price of electricity in Brazil; iii) and the government incentives for renewable power generation.
8 The rest is sold as cattle livestock feed or burned.

E. De Almeida, J. Bomtempo et al. 28
Figure 13 - Electricity Generation Using Bagasse as fuel in Brazil - GWh
0
1000
2000
3000
4000
5000
6000
7000
8000
9000
1970
1972
1974
1976
1978
1980
1982
1984
1986
1988
1990
1992
1994
1996
1998
2000
2002
2004
GW
h
Source: Brazilian Energy Balance - 2006
The growing use of bagasse for power generation has contributed significantly for the reduction of ethanol production costs. The use of more efficient generation technologies9 has allowed not only to supply the mills' requirements but also to sell significant amounts of power in the market. A large number of ethanol producers have invested in high steam pressure generation equipments which allow them to produce about 40 kWh of surplus power per ton of sugarcane for selling in the market (Macedo and Nogueira, 2005). In the last electricity bidding organized by the Brazilian government, 119 MW of bagasse-based generation capacity were sold for delivery from 2009 onwards10 (CCEE, 2006).
1.1.3 – Brazilian Ethanol as Compared Ethanol in Other Countries
It is widely accepted that Brazil produces the cheapest ethanol in the world. All studies on compared ethanol costs indicate that Brazil has the highest competitiveness. The main reason for the lower cost of Brazilian ethanol is the feedstock cost. Brazil has the world highest productivity in sugarcane production. Moreover, the cost of sugarcane is also low because of the fact
9 In the last few years, a growing number of ethanol producers have replaced old 22-bars
boilers with others with 60 bars pressure. This has allowed improving the thermodynamic efficiency of generation systems to 85%.
10 Brazil recently reformed its electricity sector regulatory framework. According to the model, all power distribution companies must buy electricity through a bidding process organized by the government. This bidding process has reduced significantly the transaction costs for small electricity producers.

29 E. De Almeida, J. Bomtempo et al.
that almost no irrigation is necessary in Brazil. Kojima and Johnson (2006) compared the cost of sugar production in different countries that uses sugarcane as feedstock. They estimated the sugar production cost in Brazil at $140 per ton, while other important producers, such as Australia, Thailand, and India have costs in the range of $200-250 per ton.
When we compare the sugarcane-based ethanol with ethanol produced with other feedstock (corn, wheat or beat), the Brazilian advantage is even more important. Several studies have been done on a comparative cost analysis. The most cited study was done by the consulting group F. O. Lichts in 2004 (see Table 3). Using the same costs analysis methodology, this study estimated the cost of sugarcane at between US$0.10 to 0.12 per liter of ethanol, while the cost of beat or corn is estimated at $0.20-0.35 per liter of ethanol (no opportunity cost considered)11. Other costs items like labor and machinery were also estimated to be cheaper Brazil than in Europe or USA.
Table 3 – Ethanol Estimated Production Costs in Different Countries
USA Germany Brazil Corn
(Euro/hl) Wheat (Euro/hl)
Beet (Euro/hl)
Sugar Cane (Euro/hl)
Buildings 0.39 0.82 0.82 0.21 Equipments 3.40 5.30 5.30 1.15 Labor 2.83 1.40 1.40 0.52 Insurance, rates and others
0.61 1.02 1.02 0.48
Raw material 20.93 27.75 35.10 9.80 Operational Costs Others
11.31 18.68 15.93 2.32
Total Production Costs 39.48 54.96 59.57 14.48 By products sales -6.71 -6.80 -7.20 - Federal and State Subsidies
7.93 - - -
Net Production Costs 24.84 48.16 52.37 14.48 Source: F.O.LICHTS (2004).
It is important to mention that the labor cost is an important factor for the competitiveness of Brazil ethanol. As we can see in table 3, labor cost in Brazil is much cheaper in the ethanol manufacturing phase. However, since sugarcane plantation in Brazil is more intensive in labor, the cheaper labor cost has an important role for reducing the cost of sugarcane production.
11 Bear Stearns (2006) shows that, if we compare US corn ethanol with Brazil sugarcane
ethanol, for the same amount of ethanol production corn-based ethanol requires 66% more land.

E. De Almeida, J. Bomtempo et al. 30
Recently, another study by F. O. LICHTS analyzed the comparative cost of ethanol production in different countries/regions, indicating the Brazilian ethanol as the cheaper option (Figure 14).
Figure 14 - Ethanol Production Costs without Subsidies
0
10
20
30
40
50
60
Europe (
Wheat/B
eet)
Brazil (
Cane)
USA (Can
e)
Australi
a (Can
e)
Thailan
d (Can
e)
China (Can
e)
Country (Feedstock)
Cos
ts (e
uroc
ents
per
lite
r)
Gross Production Costs Net Production Costs Feedstock Costs
Source: Henniges, O. and Zeddies, J. (2006)
We think that the studies that compare cost of production have two types of problems. They clearly underestimate the opportunity cost of sugarcane production, exaggerating its cost advantage. In addition, the aspects related to the logistics to bring ethanol to the market have not been considered. In this regard, it is important to mention important differences in ethanol production processes. Sugarcane ethanol has an important disadvantage due to the fact that it is not possible to store sugarcane. Ethanol production is limited to the harvesting season. Therefore, in order to secure ethanol supply during the whole year, important storage capacity should be build adding significant cost to the ethanol supply. On the other hand, corn-based ethanol can be produced the whole year, using the existing infrastructure for corn storage. Note that in the corn-based ethanol process there is a co-product - "Distillers Dry Grains with Solubles" (DDGS) – that can be used as livestock, and has

31 E. De Almeida, J. Bomtempo et al.
significant market value. Therefore, producing ethanol during all seasons helps the retail DDGS livestock market12.
Although we see some problems in the way comparative cost analysis have been carried out, we still think Brazilian sugarcane-based ethanol is more competitive, if we do not consider subsidies to the other types of ethanol.
1.1.4 – Direct and Indirect Subsidies to Ethanol
Ethanol production in Brazil was heavily subsidized in the 1970 and 1980. Direct subsidies were given for the investment in mills and sugarcane plantation, through official credit at subsidized interest rates. In addition, price supports were given to producers in order to secure a fixed return on investment, in a context of ethanol price fixed at 60% of gasoline price. Significant tax incentives were given to car makers to induce the production of ethanol-dedicated cars. Property tax cuts to ethanol cars were also very significant. Petrobras, the state owned oil company, had an important role on making viable the diffusion of ethanol by investing in storage, transportation and retail of ethanol, with significant share of costs not recovered. The consulting firm Datagro estimated that subsidies through loans and price support totalled some $16 billion (in 2005 dollars) from 1979 to the mid 1990s, when this type of subsidy was phased out (Bear Stearns, 2006)13.
Nowadays, there are no specific direct subsidies for ethanol production. However, sugarcane production and ethanol storage have access to subsidized credit lines available for Brazilian agriculture. Similarly, long-term credit lines are offered by the National Bank of Social and Economic Development (BNDES) to industrial investments in general, including ethanol projects. These credit lines are significantly cheaper than credit available in private banks. As a matter of fact, Brazil's capital market has important specificities and distortions. As the interest rates in the country are very high, the government has special credit lines for financing agriculture and long-term investments. Government interference in Brazilian capital market has been investigated in various disputes at the World Trade Organization (WTO). In general, these credit lines were not considered subsidies since the level of interest rates practiced was not lower than international average.
12 We could not find a study that estimates the cost impact of the seasonal production of
sugarcane-based ethanol. 13 The impact of these subsidies in the national budged was subject of intense political struggle in the country. Even though the practice of direct subsidy has ended in the 1990s, ethanol producers´ image in Brazilian society is quite negative until today. Public in general sees ethanol producers as a privileged class of entrepreneurs.

E. De Almeida, J. Bomtempo et al. 32
However, Brazilian ethanol benefits from some indirect subsidies. One of them is related to the lower level of tax that ethanol enjoys vis-à-vis gasoline. In Brazil, hydrated ethanol is not charged in excise tax, while excise tax on gasoline is R$ 0.21 per liter (~US$0.13 per liter). In addition to federal taxes, fuels are charged with VAT, the level of which is decided at State-level. Some states, like São Paulo, Paraná and Rio de Janeiro set a much lower VAT than for ethanol than for gasoline (See Figure 15). The tax advantage of ethanol varies significantly from state to state. The largest advantage is in São Paulo state, where taxes represent 47% of gasoline end-user price as compared to 22% of ethanol price. In Rio de Janeiro state, the fiscal advantage of ethanol is significantly lower: the level of taxes in the gasoline end-price is estimated at 50% compared to 36% for ethanol (Cavalcanti, 2006). We estimated the amount of overall tax incentives to ethanol at US$ 977 million per year.
Figure 15 – Fuels Added Value Taxes in Brazil (ICMS Tax)
0%
5%
10%
15%
20%
25%
30%
35%
North - Pará Northeast - Pernambuco /
Paraiba
Midwest -Goias
Southeast -Espirito Santo
Southeast -Rio de Janeiro
Southeast -São Paulo
Southeast -Paraná
gasoline Et. Anhydrous Et. Hydrous In all others states the VAT is 25% for the three fuels. Source: Cavalcanti (2006)
Other indirect subsidies relate to the federal tax paid on vehicles (IPI). Currently, FFVs pay a lower IPI tax than gasoline vehicles. FFVs with 1000 to 2000 cylinders pay 11% while gasoline counterparts pay 13%. The difference is more significant for cars above 2000 cc: FFVs pay 18% while gasoline cars pay 25%.
1.1.5 – Prospects for Ethanol Costs' Evolution
As mentioned before, ethanol costs depend basically on the cost/price of feedstock and on the cost of processing it. As far as the feedstock’s

33 E. De Almeida, J. Bomtempo et al.
processing is concerned, the conventional fermentation can be considered a mature technology. Currently, there are few perspectives for substantial efficiency gains in the sugarcane processing technology. Industrial efficiency in conversion is currently about 85%. Unicamp (2006) expects this efficiency to increase to 90% in 2015 and stabilize at this level.
The most significant productivity growth can be obtained at the sugarcane production stage. Sugarcane productivity is expected to grow from current 70 ton/ha to 82 ton/ha in 2015 and 96 ton/ha in 2025. The quality of sugarcane is also expected to increase, with the sucrose content growing from 14.5% to 15.9% in 2015 and 17.3% in 2025. All productivity gains together could allow an increase in the production of ethanol from 6,000 liter/ha to 8,200 liter/ha in 2015 and 10,400 liter/ha in 2025 (see table 4).
Table 4 - Expected Gains in Productivity in Ethanol Production
2005 2015 2025 Sugarcane productivity (t/ha) 70 82 96
Pol (%) Sugarcane 14.5 15,9 17.3
Conversion efficiency (%) 83.5 90.0 90.0
Liters per ton of sugarcane 85 100 109
Liters of ethanol per hectare 6,000 8,200 10,400
Source: Unicamp (2006)
It is important to note that the productivity gains mentioned above do not depend on radical technological changes. However, some radical innovations could contribute to further reducing ethanol costs. The most important potential innovation is the use of biomass residues (bagasse and sugarcane straw) to produce ethanol through the hydrolysis process. The hydrolysis process allows the conversion of cellulose to fermentable sugars. Recent technological development allows the production of about 100 liters of ethanol per ton of bagasse. According to Macedo and Nogueira (2005), the conversion of 50% of the straw to ethanol by advanced hydrolysis processes would allow the increase the mill's revenues by 30%.
The vegetal structure is composed by three main components: cellulose, hemicellulose and lignin. These three polymers are deeply associated and the percentage of each in the vegetal structure will depend on the type of the vegetal. Sugarcane bagasse composition is as follows (in percentage of dry material) : 11-25% lignin, 38-40% cellulose and 23-34 % hemicellulose (Ballerini and Alazard-Toux, 2006). In actual state of the art, lignin is not

E. De Almeida, J. Bomtempo et al. 34
fermentable into ethanol. Therefore, even after the hydrolysis process there would be a residue after fermentation that can be mechanically or chemically separated to be used in cogeneration and to produce electricity (Ballerini, Alazard-Toux, 2006).
Unicamp (2006) also estimated the impact of hydrolysis on ethanol productivity. According to this study, hydrolysis of the bagasse and straw could add 14 liters of ethanol per ton of sugarcane in 2015 and 37 liters/ton in 2025. This technology, together with other improvements in sugarcane production yield and in conventional ethanol technology, would increase total ethanol productivity by 55% in 2015 and by 130% in 2025 (see Table 5). Considering this latter level of productivity, it would be possible to increase current ethanol production from 17 billion liters to 100 billion liters by only increasing the area of sugarcane plantation for ethanol from approximately 3 million hectares to 7.2 million hectares. Note that this area expansion (4.2 million hectares) represents only 1/5 of the area currently occupied by soybean in the country (21 million hectares), and a small fraction (2%) of the area dedicated to cattle raising (see Section 1.2.1 for more detail).
Table 5 - Impacts of Hydrolysis on Ethanol Productivity (Hydrolysis of Bagasse and Straw)
2005 2015 2025 Technology l/ton of
sugarcanel/ha l/ton of
sugarcanel/ha l/ton of
sugarcane l/ha
Conventional 85 6,000 100 8,200 109 10,400Hydrolysis --- ---- 14 1,100 37 3,500Total 85 6,000 114 9,300 146 13,900
Source: Unicamp (2005)
Another significant innovation is the use of more advanced power generation technologies such as condensing turbo-generators with steam extraction; and bagasse and straw gasification and Combined Cycle Gas Turbines (CCGT). The use of turbo-generators would allow reaching 100-150 kWh/ton of surplus electricity production, with electricity generation during the whole year. This generation technology is already available in the market. However, important technology innovation would be necessary in order to allow the use of sugarcane straw as fuel. Currently, straw is burned in the field before the harvesting of sugarcane. In order to use the straw as a biomass fuel in power generation, it is necessary to develop new harvesting, storage and transportation technologies. With the adoption of harvesting innovations it would be economic feasible to recover 40% to 50% of the straw produced (Macedo and Nogueira, 2005).

35 E. De Almeida, J. Bomtempo et al.
The use of gasification technologies and CCGT would allow surplus electricity production to increase to 200-300 kWh per ton of sugarcane. Assuming the sale of 140 kWh per ton of sugarcane and considering current electricity price in Brazil (R$150 per MWh), ethanol producers could increase their revenues by 25%. Therefore, surplus electricity generation has also an important potential to contribute to the attractiveness of ethanol production.
1.2 – The Environmental Dimension
1.2.1 – Ethanol's Impact on GHG Emissions
The reduction of GHG emissions is one of the main drivers behind the new trend of biofuels programs around the world. Several studies (De Oliveira et al., 2005; Macedo and Leal, 2002, Macedo et al., 2003; among others) have estimated the potential reduction on GHG emissions with the use of ethanol. These studies compare the full fuel production and use cycle and show an important potential for GHG reductions14. If we compare these studies, results vary substantially due to methodology differences in emission assessment. However, all studies show clearly that sugarcane ethanol has by far the highest potential for GHG emissions reduction. Sugarcane ethanol can contribute for reducing more than 80% the GHG emissions, while ethanol generated from other feedstock can reach 50% in the best case.
Comparing different fuels' well-to-wheel emissions can be a very tricky task. In order to calculate the net emissions, it is necessary to study all energy processes involved in the fuel production, transport and consumption. This analysis should take into consideration three level of energy consumption: i) the direct use of fuel and electricity in the production process; ii) the energy used for the production of the feedstock (fertilizers, lime, herbicides, pesticides, lubricants, seeds, etc); iii) energy used for the production and maintenance of equipments, machines and installations
It is important to note that if no fossil fuel is involved in the biofuel production, its consumption (burning) does not contribute to CO2 emissions, since it will be captured by new growth of the biomass. However, it is important to take into consideration not only CO2 emissions, but also the emissions of other gases that contribute to the greenhouse effect (IEA, 2004).
14 See Macedo and Leal (2002). Concerning ethanol from corn, the majority of the studies
presents negative net energy balance (Morris 2005). For a example of these pessimistic analysis is Pimentel (2003). There are other studies such as Morris (2005) and Farrel et al. (2006) that criticize the restricted approach adopted by Pimentel (2003). The main critics concerns the use of old data and not considering the value of co-products.

E. De Almeida, J. Bomtempo et al. 36
As far as the CO2 emission is concerned, the most important indicator for the net emissions calculation is the energy balance in the process. In other words, the amount of fossil fuel used for each unit of biofuel produced. Macedo et al. (2004) estimate that for each MJ of fossil fuel used in the process of growing collecting and processing sugar cane 8.3 to 10.2 MJ of ethanol are produced (and we can assume that all of the carbon dioxide released in its combustion is absorbed from the atmosphere as the cane grew) (see Figure 16). The authors sustain that, in the best cases, this value can reach 1215. These number shows that the amount of renewable energy obtained for each unit of fossil fuel used is by far the highest in the world biofuel industry. Currently, the number widely accepted for corn-ethanol produced in the USA is 1.3416. Energy balance for wheat or beat-based ethanol is estimated at 2, a little better than corn.
Figure 16 - Energy flows in Ethanol Production
Source: Macedo et al. (2004)
La Rovere (2004) made an analysis of the net CO2 emissions of the sugarcane ethanol for Brazil and concluded that the use of fossil fuels for ethanol production in 1991-1992 contributed to the emission of 1.2 million tons 15 Differences in sugarcane productivity are one of the factors that can explain energy balance
variations. If the productivity is higher, less fossil fuel will be consumed for each unit of ethanol produced.
16 IEA (2004) and Andress (2002) summarizes all relevant research papers on the energy balance of corn-ethanol and show that energy balance estimates vary from 0.73 to 1.4. However, recent studies have given support to the 1.4 figure (cf. Shapouri, 2002).
37 E. De Almeida, J. Bomtempo et al.
of carbon (see Table 6). On the other hand, the ethanol and bagasse produced avoided the emission of 10.6 million tons of carbon by replacing gasoline in transport and fuel oil in power generation. Thus, the ethanol sector contributed to a net reduction of approximately 9.4 million tons of carbon (cf. Table 6). Macedo (1997) made the same exercise, and indicated a reduction of 12.7 million tons of carbon. Macedo also considered the emissions of methane and nitrous oxide by the burning of the sugarcane (see Table 7).
Table 6 - Net CO2 Emissions Related to Sugarcane Production and Use (1990-1991)
106 T C / year Value of CO2 Mitigated (US$ millions)
Gasoline replaced by ethanol1 -7.41 Fuel oil replaced by bagasse Oil burning as heat -3.24 Source in other industries Fossil fuel utilization in sugarcane industry
1.20
Net contribution (uptake) -9.45 94.5 Source: La Rovere (2004) * Price assumed: US$10 per ton of CO2
Table 7 – Carbon Balance of Ethanol production and Use
106 T CO2 equ./ year
Value of CO2 Mitigated (US$ millions)
Fossil fuel utilization + 1.28 CH4 emissions by the burning of sugarcane
+ 0.06
N2O emissions by the burning of sugarcane
+ 0.24
Gasoline replaced by ethanol - 9.13 Fuel oil replaced by bagasse - 5.20 Net contribution - 12.74 120.74
Macedo, 1997 * Price assumed: US$10 per ton of CO2
De Oliveira et al. (2005) present a more pessimistic energy balance to sugarcane ethanol production (Table 8). The main differences between the two studies by Macedo (2004) and De Oliveira et al (2005) concern the assumptions about

E. De Almeida, J. Bomtempo et al. 38
• ethanol yield (the first considers productivity of 85 liters per hectare, while the latter uses 80 liters per hectare);
• the diesel heating value (lower heating value compared to higher heating value); and
• the quantity of fertilizer used in agriculture (Macedo considers the use of distillation residues, "vinhoto", as fertilizer, while De Oliveira assumes a much higher use of chemical fertilizers).
De Oliveira et al. make a sensibility analysis of their energy balance results. By changing the values of some variables (yield, energy per ton of fertilizer and efficiency on ethanol conversion) the input/ output rate can fall to 3.14 in the worst case. The authors have made an assessment of the energy balance for corn-based ethanol in the US, pointing to an input/output ratio of from 1.12 to 1.03. De Oliveira's life cycle analysis shows that the net contribution of CO2 from the sugarcane agro-industry to the atmosphere is 3.12 tons of CO2 equivalent per ha. We can conclude that, even in the worst case, the energy balance of sugarcane-based ethanol is still more favorable that ethanol from other feedstock
Table 8 – Worst Case Scenario of Ethanol Energy Balance in Brazil (GJ)
Energy required Energy produced Agricultural sector 35.98 Ethanol 150.4 Bagasse burning 3.63 5.17 Distribution 2.87 Total 42.43 155.57 Input/output 3.7
Source: De Oliveira et al (2005)
The studies on GHG emissions made for sugarcane-based ethanol do not generally consider the emissions related to the burning of the sugarcane straw before harvesting17. The reason is that the resulting CO2 emissions are re-captured by sugarcane growth. However, Neto (2005) calls the attention to the fact that straw burn also liberates other GHGs. About 0.35 kg of methane and 0.015 kg of nitrous oxide are emitted for each ton of sugarcane straw burned for harvesting. Therefore, if part of the straw were recovered and used for ethanol production or electricity generation, there would be important improvements in the reduction of GHG emissions.
17 Neto (2005) estimates that 12 kg of CO2 are emitted for each ton of sugarcane burned
before harvesting.

39 E. De Almeida, J. Bomtempo et al.
1.2.2 – Deforestation and GHG Emissions in Brazil
Brazil is responsible for about 3% of the global emissions of GHG. According to Neto (2005), 75% of Brazilian emissions of CO2 are related to deforestation, mostly in the Amazon region, while fossil fuels consumption contributes with 23%. Therefore, it is important to analyze the contribution of the sugarcane plantation to the ongoing deforestation process in Brazil.
There is no direct relation between the expansion of the sugarcane production and the deforestation process in Brazil. The sugarcane plantations are located in the Southeast and Northeast regions, far from the North region where the Amazon forest is located (see Figure 17). The main economic activities which are causing deforestation in the Amazon area are timber exploration and cattle raising (Nepstad et al., 2006).
Currently, about 20% of the Brazilian cattle are raised in the North Region, were the Amazon forest is located. The area dedicated to cattle raising in the Amazon has tripled between 1990 and 2005, as the number of cattle increased from 13 million heads to 41 million in 2005. If we consider that the average productivity in Brazilian cattle raising is 0.9 animals per hectare, we can estimate that cattle raising alone was responsible for the loss of about 30 million hectares of forest in the Amazon between 1990 and 200518.
More recently, soybean plantations are also contributing, albeit indirectly, to deforestation of the Amazon. According to Morton (2006) intensive mechanized agriculture (mainly soybean) in the Brazilian Amazon region grew by 3.6 million hectares during 2001-04. Soybean expansion is responsible for the increase in the price of the land, thus cattle raisers sell their land for soybean plantation and then tend to reinvest in new forest areas exploring timber and preparing new land for cattle raising through burning.
Between 2000 and 2005, the loss in forest land in Brazil has being estimated in approximately 3 million hectares per year (The Economist, 2007). If we assume this rate of deforestation as the average between 1988 and 2004, we can estimate that Brazil lost about 45 million hectares in forest in this period. Soybean area expansion in Brazil in the same period was approximately 10 million hectares. Pasture area expanded 33 million hectares, from 177 million hectares to 210 million between 1988 and 2005. The number of cattle in Brazil increased from 135 million to 195 millions in the same period.
The studies on the process of expansion of cattle raising and soybean in Brazil are not conclusive concerning the role of the sugarcane expansion in
18 It can be considered conservative to consider the productivity in the Amazon area the same
as Brazilian average.
E. De Almeida, J. Bomtempo et al. 40
the southern part of the country. In fact, if we consider the area related to soybean and pasture area expansion, it is hard to associate ethanol with the Amazon deforestation in Brazil. In fact, sugarcane plantation uses only 9% of total harvest area in Brazil and increased from 3.8 million hectares to 5.8 million hectares between 1988 and 2004. Only half of this area is related to ethanol.
The pace of cattle raising expansion in Brazil is a process related to the low expansion cost and to the land availability in the country. It is important to mention that the investment required for land preparation for cattle raising is much smaller than for other types of crops. In addition, cattle raising productivity in Brazil is very small (extensive pasture), making the availability of cheap land the main factor for the expansion of this activity. When a farmer buys land in the Amazon, timber sales (in general illegally) is enough to finance all necessary investments for pasture preparation. Currently, there is a federal law that limits deforestation to 20% of the farm area. But, once again, the government has not been able to enforce the application of this law.
This expansion has occurred through the replacement of other traditional crops (orange19, beans, and pasture, for example), mainly in the state of Sao Paulo, and, to a lesser extent, in Minas Gerais and Parana states. Another expansion frontier is the replacement cattle raising in the Brazilian savanna (Central part of Brazil) (see Unicamp, 2006).
It is important to mention that ethanol production requires the existence of an adequate infrastructure for storage and transportation. This infrastructure is very scarce in the regions near to the Amazon forest. Most of Brazilian refineries and distribution bases are located near consumer centers. Transportation infrastructure is also insufficient, making non-economic to produce ethanol in isolated areas.
The association between the expansion of the sugarcane plantation in the Southern part of the country and the Amazon deforestation process is still an open research question. The studies on the Amazon deforestation have focused on the direct deforestation vectors (timber, cattle raising and soybean). Additional studies on the potential impacts of sugarcane on deforestation will be a necessary step to foster Brazilian ethanol exports. Without these studies, ethanol tends to face questioning from environmental organizations in OECD countries regarding its environmental advantages.
.
19 Orange plantation in Brazil is encountering obstacles for its expansion. The USA, the main
market for Brazilian orange juice, has imposed import importation taxes that reduced the competitiveness of Brazil.
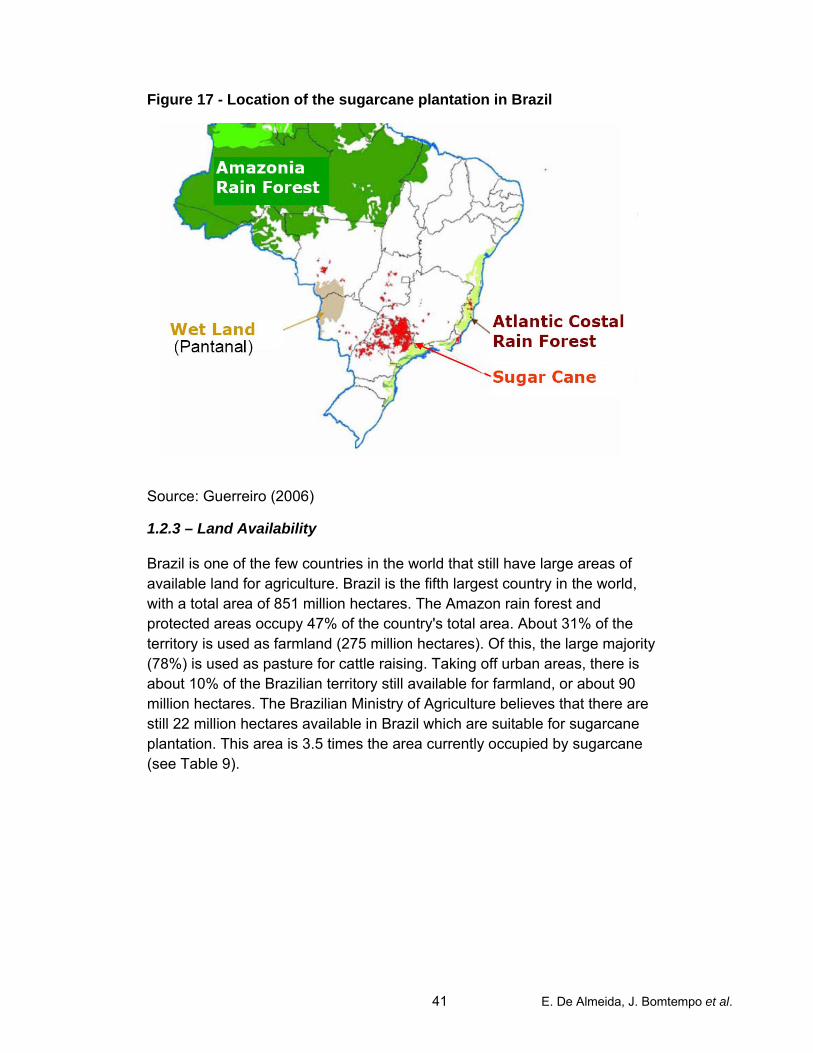
41 E. De Almeida, J. Bomtempo et al.
Figure 17 - Location of the sugarcane plantation in Brazil
Source: Guerreiro (2006)
1.2.3 – Land Availability
Brazil is one of the few countries in the world that still have large areas of available land for agriculture. Brazil is the fifth largest country in the world, with a total area of 851 million hectares. The Amazon rain forest and protected areas occupy 47% of the country's total area. About 31% of the territory is used as farmland (275 million hectares). Of this, the large majority (78%) is used as pasture for cattle raising. Taking off urban areas, there is about 10% of the Brazilian territory still available for farmland, or about 90 million hectares. The Brazilian Ministry of Agriculture believes that there are still 22 million hectares available in Brazil which are suitable for sugarcane plantation. This area is 3.5 times the area currently occupied by sugarcane (see Table 9).

E. De Almeida, J. Bomtempo et al. 42
Table 9 - Land Use in Brazil
ha % of total Amazon forest and protected areas 405 47% Farmland 275 31% - pasture 210 24% - agriculture 65 8% Cities, towns, lakes 20 2% Land available for agriculture 90 10% Land available for sugarcane 22 3% Other uses 60 7% total 851 100%
Source: EPE (2006) and Unicamp (2006)
Sugarcane occupies 9% of the cropland in Brazil. Soybean, on the other hand, uses 33% of the total harvest area today. The total harvest area occupied by soybean increased from 10.4 million hectares in 1988 to 21.4 million hectares (See Figure 18).
Figure 18 – Evolution of Cropland by Type of Crop
0%
10%
20%
30%
40%
50%
60%
70%
80%
90%
100%
1988 2004
Other CropsOrangeCassavaCottonCoffeeWheatSugarcaneRiceBeanSoya Corn
Source: CENBIO - Centro Nacional de Referencia em Biomassa
Environmental performance in Brazil is far from being a question of laws and business rules. As a matter of fact, Brazil has a very modern environmental regulatory framework regarding the use of land and deforestation. Nevertheless, Brazilian environmental performance is still poor due to the weak law enforcement capacity of the government. It is important to note that this law enforcement capacity varies from sector to sector. This capacity is
43 E. De Almeida, J. Bomtempo et al.
poor for sectors with a large number of producers, such as cattle, corn, soybean etc. These producers can easily sell their products disregarding licenses/authorizations, or other form of governmental controls. This is not the case for sectors with fewer, larger players, which are more easily controllable, such as the ethanol, power and sugar industries. Here, producers have to respect government regulations in order to be able to produce and sell their products. Large projects such as sugarcane mills require a good relationship with governmental institutions (financial institutions, Petrobras, Ministry of Agriculture, Ministry of Mines and Energy, etc) in order to make the project viable.
The weak institutional capacity to enforce environmental regulations in sectors with a large number of producers, such as soybean, cattle raising and timber exploration, can be considered the main reason of deforestation in Brazil.
According to Mr. da Silva, an agronomist engineer from Embrapa (Brazilian Company to Agricultural Research) and specialist on land management, 30% of land dedicated to pasture in Brazil (63 million ha) are depredated and the productivity land is low - about 0,5 animal per ha. This means that if sugarcane expansion occurs in depredated pasture areas, a positive carbon balance can be obtained. Depredated pasture has lower green biomass than sugar cane culture that would replace it. In addition, sugarcane expansion can occurs simultaneously to an increase in the productivity of cattle raising.
In fact, there is a possibility that the change in land use from pasture to sugarcane results in a positive carbon balance. This effect deserves a more detailed analysis, in particular in quantifying these impacts.
1.2.2 – Ethanol's Local Environmental Impacts
In general, local environmental impacts of ethanol production are being tackled by the Brazilian government and agents of the sector. Currently, there are about 50 laws, decrees and norms specifically dedicated to the control of local environmental impacts of ethanol production.
The reduction of the impacts of the sugarcane plantations and ethanol production on the water resources is an important source of concern in Brazil. The sugar and ethanol production was traditionally associated to important levels of water pollution. The discharge of acidic distillation residues (vinhoto) in rivers was the most important source of water pollution in ethanol production zones in Brazil. This practice is now prohibited across the country. Today, it is quite common to neutralize the acidic residue with lime and recycle it as fertilizers in the sugarcane plantations. This practice is contributing to the reduction of the use of mineral fertilizers. Macedo and

E. De Almeida, J. Bomtempo et al. 44
Nogueira (2005) show that the rate of use of fertilizers in Brazilian sugarcane plantations has been stable since the 1970s.
Ethanol´s potential impacts in water resources are fostering legislation to protect water resources. One of important initiatives is the recovering of rivers margins by reforestation. Sugarcane producers are being induced by legislation to promote activities for water preservation through reforestation.
Most of Brazilian sugarcane production is rain fed. However, water is consumed in the ethanol production process. According to Walter (2007), new legislation and technological innovation are promoting the reduction of water collection. Water consumption in ethanol production has been reduced from 5.6 m3/t cane in the 1990s to 1.83 m3/t in 2005 at São Paulo´s mills. Walter believes that new technologies will allow a further reduction to less than 1 m3/t cane water collection and (close to) zero effluent release rates, through reuse of water.
Usually, ethanol producers do not pay for the water used in the production process. Legislation on water charge for rural users is new and its application is not yet widespread. In fact, each river basin should create a committee that is in charge of establishing a tariff for the water usage according to the water opportunity cost. The few cases where water has been charged, the cost has not been significant.
The cost of water can vary significantly from each river basin. In Sao Paulo and Rio de Janeiro states, the rivers basins committees have fixed the cost of non treated water collected from major rivers at around R$0.01 per cubic meter. If we apply this water price for all sugar mills in Brazil, the total water cost would be around US$4.5 million per year. The water cost for a typical mill would be around US$40,000 per year. In addition, it has been created a tariff for polluted water discharges at between R$0.07 and R$0.1 per kilo. This tariff make cheaper to treat the polluted water before discharge.
Another source of local environmental impacts is the use of herbicides in the sugarcane plantation. Again, the use of herbicides has been reduced by the development of new breeds of sugarcane more resistant to pests. Currently, about 4.6 kg of herbicides is used per hectare of sugarcane. Agriculture research has been an important source of pest control, through the development of more resistant sugarcane breeds. It is important to note that the restrictions on sugarcane burn for harvesting are a source of concern regarding pest control. The annual straw burn was a source of pest control and it is not clear what the impacts of mechanical harvesting would be in terms of the development of more resistant pest.

45 E. De Almeida, J. Bomtempo et al.
Another source of local environmental impacts is the use of herbicides in the sugarcane plantation. Again, the use of herbicides has been reduced by the development of new breeds of sugarcane more resistant to pests. Currently, about 0.36 kg of herbicides is used per hectare of sugarcane. Agriculture research has been an important source of pest control, through the development of more resistant sugarcane breeds. It is important to note that the restrictions on sugarcane burn for harvesting are a source of concern regarding pest control. The annual straw burn was a source of pest control and it is not clear what the impacts of mechanical harvesting would be in terms of the development of more resistant pest.
Nowadays, the main local environmental impact of ethanol production is related to the sugarcane harvesting process used in Brazil. The large majority of mills still employ manual harvesting in Brazil. In order to increase harvesting productivity, sugarcane straw is burned before harvesting. Sugarcane leaves and straw makes the manual harvesting process arduous and slow20. The plantation burn produces a large concentration of smoke and particulates in the cities nearby (See Table 10). This problem has created an important political reaction against sugarcane burning by local stakeholders.
Table 10 – Emissions Related to the Straw Burning for Harvesting
Emission Grams per kg of dry straw
Kg/ton of sugarcane
Thousand tons per year *
CH4 0.41 0.05 15 CO 25.48 3.19 917,280 Nox 1.4 0.18 50,400 SO2 0.62 0.08 22,320 Particulates 5.60 0.7 201,600 Particulates 10 5.4 0.69 194,400 Particulates 2,5 5 0.63 180,000 N2O 0.12 0.015 4,320 * Considering the production of 360 million of tons of sugarcane. Source: Neto (2005).
The local movement against the sugarcane burn has result in new legislation on this topic in the state of Sao Paulo. Initially, new legislation introduced restrictions for the burning of plantation located near urban areas. Later on, legislation changed to a progressive replacement of manual harvesting by mechanized harvesting without burning. Sao Paulo state law n. 11.241 of 2002 created a schedule for a progressive introduction of mechanized harvesting. This schedule varies according to the characteristics of the land 20 Sugarcane leaf can cut the workers. Burning is also useful to "clean" the area from
dangerous animals and makes cutting and transporting the sugarcane easer.

E. De Almeida, J. Bomtempo et al. 46
used. For flat areas, all harvesting should be mechanized by 2021. For the non-flat areas, the deadline was fixed for 2031. Producers should increase the mechanized areas by 20% each 5 years. This legislation is restricted to the state of Sao Paulo. There are no such requirements in other parts of the country. Currently, about 35% of the harvesting in São Paulo state is already mechanized. This rate is about 30% for the Center-South region. In the Northeast, however, the rate of mechanization is very low.
It is important to note that mechanized harvesting does not automatically eliminate straw burning. In Sao Paulo, only 25% of the crops do not employs burning process. Therefore, in about 10% of the area, mechanization is employed and straw burning remains. Burning can increase the mechanized harvesting efficiency by 30%. In order to allow high productivity mechanized harvesting without burning, it is necessary to replant the sugarcane every year21.
On the positive side, it is important to mention that use of ethanol has contributed to the reduction of the local pollution related to gasoline consumption. This contribution was particularly important in the 1980s, when the quality of the Brazilian gasoline was still very poor. The blending of ethanol in the gasoline allowed the elimination of the use of plumb in the gasoline; the elimination of 100% of sulfur oxide and carbon particulates, and reduction of about 20% of carbon monoxide. According to Nogueira and Macedo (2005), the reductions in local emissions were associated to avoided social costs of about $500 million dollars per year.
1.3 – The Social Dimension
The social impacts of ethanol production in Brazil are huge. This dimension is certainly one of the main reasons behind government support for the ethanol industry. Sugar and ethanol production are an important sector of the Brazilian economy, representing about 3% of GDP. The number of jobs created in the ethanol industry is estimated at 700 thousand of direct jobs and 200 thousand of indirect jobs (La Rovere, 2004 and Macedo and Nogueira, 2005). The number of jobs per energy unit is estimated to be 100 times greater than in oil production.
The figures above, while impressive, hide important questions regarding the quality of the jobs created. The great majority of the jobs created are for sugarcane plantation and harvesting. These jobs can be considered low quality jobs, since they employ unskilled workers and involve insalubrious activities (manual harvesting). Another problem of the sugarcane plantation is
21 Sugarcane does not need to be planted every year. Once planted, it can grow for several
years.

47 E. De Almeida, J. Bomtempo et al.
the seasonality of the production process. The harvesting takes place only 6 to 7 months a year. Therefore, a large number of the workers dedicated to sugarcane harvesting do not work during the whole year.
This fact is at the origin of a series of social problems. A large share of the temporary workers in Sao Paulo comes from other regions of the country. About 200,000 workers in Sao Paulo sugarcane plantations are estimated to come from outside the state. In general they leave the family in their state of origin and, in order to save money, accept degrading housing and work conditions. Workers payments are associated to harvesting productivity in tons per day. In order to maximize payment some workers chose very long working hours (10 to 15 hours per day), during which they can harvest as much as 30 tons a day. There are reports of workers taking drugs to support them during their long working hours. The heat during the harvesting season and the straw burn22 are also associated to health problems.
The Ministry of Labour has strengthened the regulation on the working conditions in ethanol production. Working conditions have improved considerably in the last decades; however, there is still a lot of controversy around this subject. Producers argue that the working conditions and benefits are better than in other agriculture sectors. According to the producers' representatives, 92% of the workers in São Paulo are formally hired, while the average in Brazil is 46%23. Sugarcane worker can be considered well paid when compared to other activities requiring the same level of skills. According to Macedo and Nogueira (2005), sugarcane workers earn more than 85% of the rural workers in the country.
Although workers unions and non-governmental organizations still denounce the sector for poor labor performance, this type of job is still welcomed by the Brazilian government. Jobs creation is one of the main justifications for the government support to the ethanol sector. Considering the higher labor intensity of the sugarcane production, the sector can create a higher number of jobs per dollar invested.
It is important to mention that the social performance of the ethanol industry is not the same all over the country. Ethanol producers in the Northeast region employ a lower level of technology in the production process. As mentioned before, the harvesting is still almost totally manual. Therefore, this region employs a higher proportion of unskilled workers.
22 The straw burn causes breath diseases due to ash production. 23 Workers formally hired have benefits such as vacations, unemployment insurance, food
stamps, and health care.

E. De Almeida, J. Bomtempo et al. 48
The introduction of mechanized harvesting is expected to improve working conditions. Harvesting machines will replace unskilled temporary workers. The average productivity and salary will rise. However, the labour intensity of ethanol production will decrease significantly, with a substantial impact on the unemployment rate. This impact is the justification given by ethanol producers to phase-out the introduction of mechanical harvesting.
Macedo and Nogueira (2005) have estimated the employment impacts of mechanization and productivity for the next 10-15 years. According to this study, if we consider a 20% increase in sugarcane productivity in manual or mechanized harvesting and, considering a scenario of mechanization diffusion of 50% in the Northeast and 80% in the Center-South regions, employment level would be reduced by 290,000. However, this employment reduction can be compensated by the sector's expansion. According to the authors, for each 100 million tons expansion in sugarcane production, 125,000 direct and 136,000 indirect jobs will be created. Therefore, if current sugarcane for ethanol production increases from current 250 to 400 million tons, current employment level could be maintained, with substantial increase in jobs quality.
1.4 – The Energy Security Dimension
1.4.1 – Ethanol's Contribution to Energy Security in Brazil
The Pro-Alcohol program contributed significantly to increase the country's energy security. After 1980, ethanol production in Brazil was equivalent to 10% of all oil products consumed in the country. Thus, ethanol production and consumption contributed to reduce the hard currency expenses related to the importation of oil and gasoline. The annual value of the avoided imports varies according to the oil price and the level of ethanol production. As can be seen in Figure 19, this value fluctuated between US$ 500 million and one billion dollars in the 1980s and 1990s, and shoot up after 2002 due to the increase of the oil price and the level of ethanol production. This number considers the country opportunity cost for producing ethanol. We estimated the amount of oil and oil products avoided imports and multiplied by the value actually paid to these imports.

49 E. De Almeida, J. Bomtempo et al.
Figure 19 – Value of the Avoided Imports of Oil and Oil Products due to Ethanol Consumption
0
500
1000
1500
2000
2500
3000
3500
4000
4500
5000
5500
6000
1980
1981
1982
1983
1984
1985
1986
1987
1988
1989
1990
1991
1992
1993
1994
1995
1996
1997
1998
1999
2000
2001
2002
2003
2004
Cur
rent
US$
mill
ions
Source: Own Elaboration based on National Energy Balance Data.
Rodrigues (2005) argues that the ethanol program allowed Brazil to reduce imports of US$69 billion. Rodrigues did not considered the opportunity cost but the market value of gasoline in the international market. However, Rodrigues’ analysis cannot be considered accurate since Brazil would not import gasoline but oil if there was no ethanol production. The country has enough refining capacity to supply the country with gasoline. As a matter of fact, since the 1980s Brazil exports large amounts of gasoline due to its surplus production, given the displacement of gasoline demand by ethanol.
Currently, energy security has a very different meaning for Brazil. Macroeconomic restrictions related to oil and oil products imports are no longer relevant. On the one hand, Brazil reached self-sufficiency in oil production in 2006. On the other hand, Brazil's trade balance surplus has been around $40 billion in the last three years. This level of trade surplus is provoking the evaluation of the Brazilian currency with negative impacts for the level of economic activity.
Energy security has become an issue related to the long-term sustainability of energy supply in Brazil. Biofuels are seeing as a secure path for guaranteeing long-term energy supply in a context of increasing environmental restrictions. In addition, one important objective of the Brazilian energy policy is to promote oil self-sufficiency. In this context, the reduction of oil demand through the development of biofuel market can contribute to this objective.

E. De Almeida, J. Bomtempo et al. 50
It is important to say that although GHG issues are mentioned as an important justification for the ethanol program in Brazil, the first priority of consumers is the reduction of energy costs. Since the FFVs have been launched in Brazil, ethanol prices have been below gasoline prices most of the time in the relevant markets of the Southeast region. In November 2005, ethanol prices in Brazil increased substantially due to soaring demand. Public reaction was immediate and government was asked to interfere in ethanol market. Government tried to negotiate with ethanol producers conditions to reduce ethanol prices. As prices stopped to increase, this negotiation did not result in changes in the market rules.
The political struggle about ethanol prices in Brazil showed clearly that FFVs owners are not ready to accept high ethanol prices for long periods of time. This brings us to conclude that the availability of cheap ethanol will be seen as a security of supply issue. This can create serious obstacles to ethanol exports. In a context of low oil prices, ethanol price in Brazil could be higher than gasoline price driven by exports (taking into consideration energy content). In this scenario, political pressure could arise demanding the imposition of restrictions to exports (tax or quotas).
1.4.2 – Brazil as a World Class Ethanol Exporter
The role of Brazil in the world ethanol market will depend on the evolution of three main factors: i) the Brazilian ethanol production; ii) the domestic ethanol demand; iii) the development of an international ethanol market. Each of these questions has significant uncertainties.
In 2005, the Brazilian government asked the University of Campinas to coordinate a comprehensive study on Brazilian ethanol production potential (Unicamp, 2006). Unicamp carried out an assessment of land availability for ethanol production. This assessment indicated 12 zones with high potential for ethanol production. Based on this assessment, Unicamp elaborated a production scenario where Brazilian ethanol could supply 5% of all gasoline demand by 2025. In this scenario, 1.2 billion tons of sugarcane would be necessary to reach a production of 104.5 billion liters of ethanol. Considering current best productivity levels, the study indicates that the area required for sugarcane production would be 21.5 million hectares, 7 times the current area occupied by sugarcane for ethanol production (Unicamp, 2006).
Unicamp also estimated the overall investment required at about $4 billion per year (for mills, sugarcane plantation and logistics). This expansion in ethanol production would allow the generation of 50 TWh per year, which is equivalent to 15% of the country's total power generation in 2005. In addition, the ethanol sector alone would create about 5 million direct and indirect jobs and ethanol export would reach US$ 31 billion.

51 E. De Almeida, J. Bomtempo et al.
This potential for ethanol production expansion is currently attracting the interest of national and international investors. New ethanol production capacity under construction or planned represents 20% of existing capacity. About 25 new mills will come on stream in 2007 and about 90 projects have been announced for the period of 2008-2014. Recently, a series of new international investment funds dedicated to ethanol were created (Valor, 2007). The most important one was announced by the ex-president of Petrobras, Henri Philippe Reichstul, who claims to represent international investors with initial capital of US$ 2 billion. George Soros's company Adeco is investing US$900 million in sugarcane mills in Mato Grosso do Sul and Minas Gerais states.
We have estimated ethanol production in Brazil based on a scenario of sugarcane production elaborated by producers' representatives (UNICA). According to this scenario, Brazil is expected to reach 570 million tons of sugarcane production in 2010 and 731 million tons in 2015. We assumed that 60% of sugarcane will be directed toward ethanol production, a higher proportion than the actual one given that most of the mills under construction or planned are ethanol-dedicated. In addition, we assumed that industrial productivity will increased from current 80 l/ton to 90 l/ton24. Based on these assumptions, we expect that ethanol production will reach 39 billion liters in 2015 (Figure 20).
This production scenario assumes that ethanol prices will remain attractive for Brazilian producers, given the evolution of ethanol demand and oil prices (above 50 dollars per barrel). Our supply estimate is consistent with the production scenarios elaborated by the producers and by the government. Most of these scenarios are based on the extrapolation into the future of the ethanol production growth rate of the period 2000-05.
24 This productivity increase assumption is also adopted by Unicamp (2006).

E. De Almeida, J. Bomtempo et al. 52
Figure 20 - Expected Ethanol Production in Brazil
-
5.000
10.000
15.000
20.000
25.000
30.000
35.000
40.000
45.000
2000 2001 2002 2003 2004 2005 2006 2007 2008 2009 2010 2011 2012 2013 2014 2015
mill
ions
lite
rs
Source: Own elaboration.
While there is substantial convergence regarding the medium-term projection for ethanol projection in Brazil, a lot of uncertainties remain regarding how much ethanol Brazil will be able to export. This is a complicated question because the scenarios on Brazilian ethanol consumption depend on a set of different price relations (gasoline, sugar and ethanol).
We projected three scenarios for ethanol consumption in Brazil. In the first scenario, we assumed that ethanol prices in Brazil would be attractive (less than 70% of gasoline prices) and all Brazilian FFVs fleet would run only with ethanol in the period 2007-2015. In the second scenario, we assumed ethanol prices to be unattractive to FFVs and that all FFVs would run on gasoline between 2007-2015. Of course these are two extreme scenarios, none of which is very likely. In the third scenario, we tried to define an intermediary and more likely domestic ethanol demand. In this scenario, we assumed that part of the FFVs fleet will consume ethanol, despite the fact that ethanol prices in the international market tend to be higher than 70%25. We think that fiscal incentives will make ethanol cheaper than 70% of gasoline prices in the state of Sao Paulo. Given the growing importance of FFVs in Brazil, projected
25 Note that Brazil is the only market were FFVs are relevant. Most of ethanol consumers use
ethanol mixed with gasoline. If you mix ethanol up to 10% in the gasoline, vehicles performance is not affected. Therefore, ethanol value is equivalent to gasoline in these markets. However, mandatory ethanol consumption tends to make ethanol prices even higher than gasoline.

53 E. De Almeida, J. Bomtempo et al.
ethanol demand in 2015 could vary between 8,5 and 32 billion liters (Figure 21).
Figure 21 –Ethanol Demand Scenarios for Brazil
-
5.000
10.000
15.000
20.000
25.000
30.000
35.000
2006 2007 2008 2009 2010 2011 2012 2013 2014 2015
mill
ions
lite
rs
Ethanol Maximum ConsumptionMinimum Ethanol ConsumptionMost probable scenario (SP fleet only)
Source: Own Elaboration
Note: SP = Sao Paulo
This demand gap represents how much Brazilian ethanol exports can could vary, depending on the evolution of gasoline and ethanol relative prices. As shown in Figure 22, Brazilian export can vary from 3.3 and 27 billion liters per year. Our analysis shows that if the Brazilian ethanol-gasoline price ratio remains lower than 70%, there will be no room for increasing exports until 2015, because domestic demand will increase at a rapid pace in response to the diffusion of FFVs. However, we believe it is more likely that Brazilian ethanol exports will follow the intermediate scenario, due to the increase of ethanol prices in the international market, reaching 17 billion liter in 2015.

E. De Almeida, J. Bomtempo et al. 54
Figure 22 - Ethanol Exports Scenarios for Brazil
-
5.000
10.000
15.000
20.000
25.000
30.000
2006 2007 2008 2009 2010 2011 2012 2013 2014 2015
mill
ions
lite
rs
Maximum ExportsMinimum ExportsMost probable scenario
Source: Own elaboration
Demand Estimation Methodology
It is important to note that currently FFVs are responsible for half of domestic ethanol consumption. This consumption depends on the competitiveness of ethanol vis-à-vis gasoline. Therefore, in order to forecast domestic ethanol demand, we need to analyze the evolution of FFVs sales in Brazil and explore different scenarios for ethanol and gasoline prices.
We estimated the evolution of FFVs fleet in Brazil using available data for the current fleet, projected sales and vehicles performance. The National Transport Department (Denatran) provides fleet data from 1998 to 2005. Over this period, light vehicle fleet grew at an average rate of 6.3% per year. Based on this data, we made a simple trend model (y = � + �t) estimated by Least Square Method. This model was used to project the light vehicle fleet from 2006 until 2015 (Figure 23).

55 E. De Almeida, J. Bomtempo et al.
Figure 23 – Light Vehicles Fleet Evolution and Estimation – Brazil
y = 1051,8x + 13151R2 = 0,998
10.000
15.000
20.000
25.000
30.000
35.000
1998 1999 2000 2001 2002 2003 2004 2005 2006 2007 2008 2009 2010 2011 2012 2013 2014
light vehicle data Linear (light vehicle data)
Source: Own Elaboration Based on Denatran Data
In order to assess the light vehicle fleet composition by fuel type, we estimated light vehicles sales over the period. The sales estimate was based GDP growth assumptions. We adopted a GDP growth assumption of 3.3% per year over the projection period (IEA's World Energy Outlook - reference scenario). Based on historical data about vehicles sales and GDP growth from 1969 until 2005, we estimated sales relation to GDP by the following equation: y= 827,8x – 89984 (r2 = 0.665; t = 8.15). Using this equation, we projected the evolution of car sales in Brazil in Figure 24.

E. De Almeida, J. Bomtempo et al. 56
Figure 24 – Evolution and Estimated Light Vehicles Sales in Brazil 2000-2015
1000
1200
1400
1600
1800
2000
2200
2400
2000 2001 2002 2003 2004 2005 2006 2007 2008 2009 2010 2011 2012 2013 2014 2015
1000
veh
icle
s
Source: Own elaboration based and Anfavea.
In order to estimate the evolution of FFVs fleet, we assumed that FFVs will represent 75% of total cars shares between 2007 and 2015. We also assumed that the ethanol dedicated fleet, which represents 13% of current light vehicle fleet26, will progressively disappear, given that this fleet is already old (9 years in average). Finally, we assumed that the fleet of compressed natural gas (CNG) vehicles will continue to grow at an annual rate of 10% in the period, which is less than the actual annual growth rate of 25%. Based on these assumptions, we projected the future composition of national light cars fleet (Figure 25).
26 Sindipeças (2006).
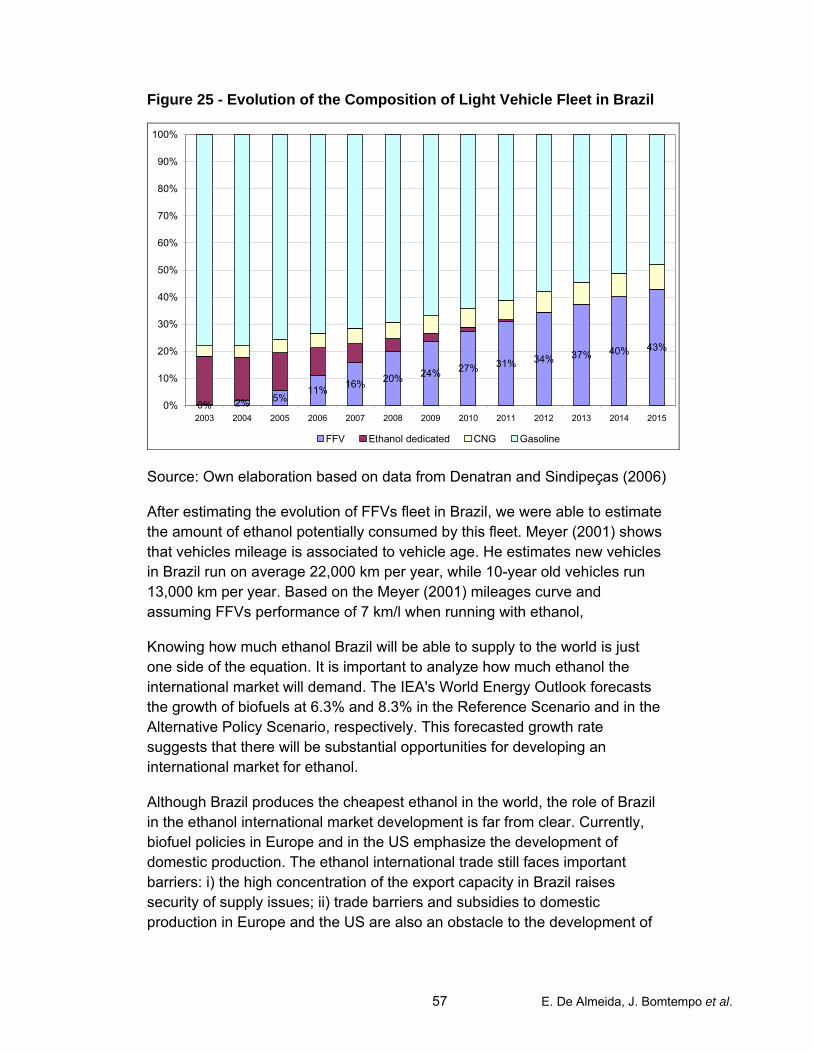
57 E. De Almeida, J. Bomtempo et al.
Figure 25 - Evolution of the Composition of Light Vehicle Fleet in Brazil
0% 2% 5%11% 16% 20% 24% 27% 31% 34% 37% 40% 43%
0%
10%
20%
30%
40%
50%
60%
70%
80%
90%
100%
2003 2004 2005 2006 2007 2008 2009 2010 2011 2012 2013 2014 2015
FFV Ethanol dedicated CNG Gasoline
Source: Own elaboration based on data from Denatran and Sindipeças (2006)
After estimating the evolution of FFVs fleet in Brazil, we were able to estimate the amount of ethanol potentially consumed by this fleet. Meyer (2001) shows that vehicles mileage is associated to vehicle age. He estimates new vehicles in Brazil run on average 22,000 km per year, while 10-year old vehicles run 13,000 km per year. Based on the Meyer (2001) mileages curve and assuming FFVs performance of 7 km/l when running with ethanol,
Knowing how much ethanol Brazil will be able to supply to the world is just one side of the equation. It is important to analyze how much ethanol the international market will demand. The IEA's World Energy Outlook forecasts the growth of biofuels at 6.3% and 8.3% in the Reference Scenario and in the Alternative Policy Scenario, respectively. This forecasted growth rate suggests that there will be substantial opportunities for developing an international market for ethanol.
Although Brazil produces the cheapest ethanol in the world, the role of Brazil in the ethanol international market development is far from clear. Currently, biofuel policies in Europe and in the US emphasize the development of domestic production. The ethanol international trade still faces important barriers: i) the high concentration of the export capacity in Brazil raises security of supply issues; ii) trade barriers and subsidies to domestic production in Europe and the US are also an obstacle to the development of
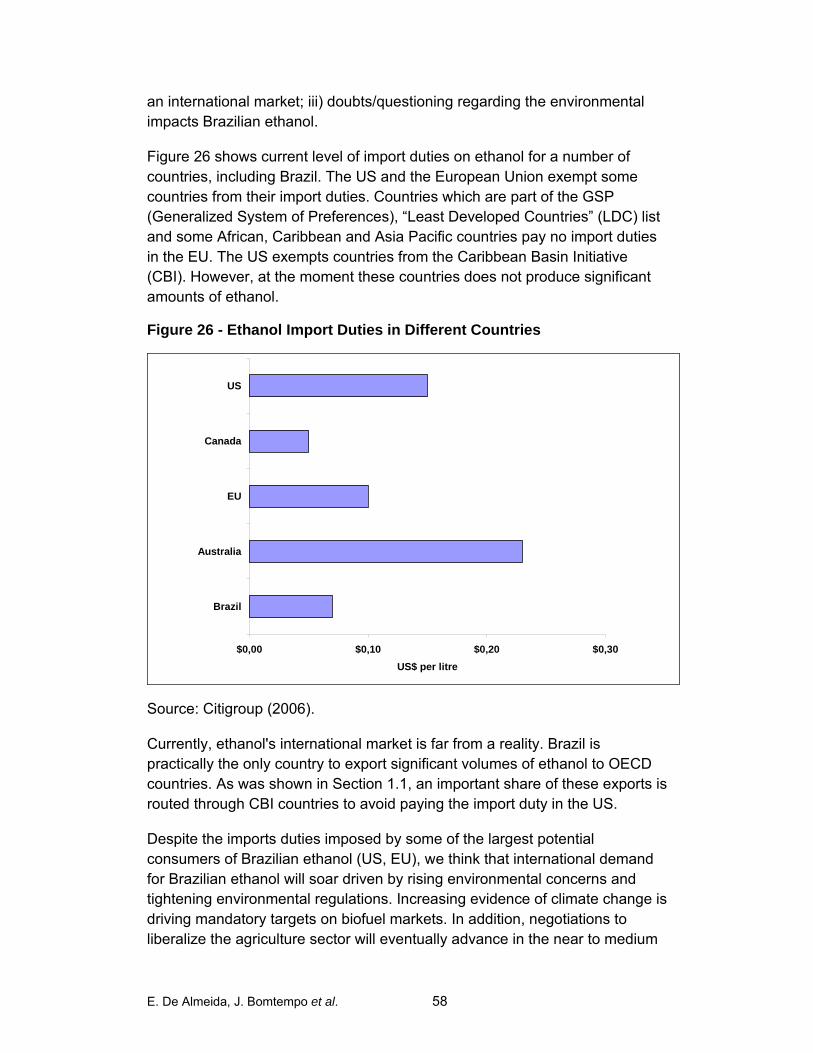
E. De Almeida, J. Bomtempo et al. 58
an international market; iii) doubts/questioning regarding the environmental impacts Brazilian ethanol.
Figure 26 shows current level of import duties on ethanol for a number of countries, including Brazil. The US and the European Union exempt some countries from their import duties. Countries which are part of the GSP (Generalized System of Preferences), “Least Developed Countries” (LDC) list and some African, Caribbean and Asia Pacific countries pay no import duties in the EU. The US exempts countries from the Caribbean Basin Initiative (CBI). However, at the moment these countries does not produce significant amounts of ethanol.
Figure 26 - Ethanol Import Duties in Different Countries
$0,00 $0,10 $0,20 $0,30
Brazil
Australia
EU
Canada
US
US$ per litre
Source: Citigroup (2006).
Currently, ethanol's international market is far from a reality. Brazil is practically the only country to export significant volumes of ethanol to OECD countries. As was shown in Section 1.1, an important share of these exports is routed through CBI countries to avoid paying the import duty in the US.
Despite the imports duties imposed by some of the largest potential consumers of Brazilian ethanol (US, EU), we think that international demand for Brazilian ethanol will soar driven by rising environmental concerns and tightening environmental regulations. Increasing evidence of climate change is driving mandatory targets on biofuel markets. In addition, negotiations to liberalize the agriculture sector will eventually advance in the near to medium
59 E. De Almeida, J. Bomtempo et al.
term. In this context, we argue that protectionism in the biofuels market will be hard to sustain.
Mandatory biofuel consumption levels are being implemented in several OECD countries. The European Union has set a target of 5.75% for the share of biofuels in liquid fuels market by 2010. Nine European countries have already decided on a mandatory biofuel regime for 2008. Japan is planning to mandate a 3% blend of ethanol in its gasoline. In the US, the 2005 Energy Policy Act sets a target of 5% for the share of biofuels by 2012. In addition, the banning of MTBE in some American states is opening a way to an ethanol-based octane booster. The ethyl-tertiary-butyl-ether (ETBE) is produced by blending 47% ethanol and 53% isobutylene. Developing countries like India, China and Colombia have also set mandatory biofuels consumption levels in some areas of their territories.
Most of the countries that are setting mandatory fuel consumption level have small or insufficient potential for producing biofuels. Japan, for instance is seeking to reach an agreement to make Brazil its main ethanol supplier. India and China, European the Union and the US will probably have problems to produce all the ethanol necessary to comply with the mandatory target demand.
In addition, the recent partnership between Brazil and US for promoting ethanol production in third countries represents an important step toward supply diversification in the ethanol international market. Countries in Africa, Central America and Caribbean could have an important role in the supply diversification.
Finally, a necessary condition for the large scale exports of Brazilian ethanol will be the environmental certification process. Since environmental issues is the main motivation for importing Brazilian ethanol, importers should be assured that the ethanol production in Brazil is not associated to significant environmental and social impacts, such as deforestation and poor labor conditions. An important research effort is still to be done for subsidizing the market organization and the development of a certification process.

E. De Almeida, J. Bomtempo et al. 60
2 – BIODIESEL
In the late 1970s, Professor Expedito Parente from the Federal University of Ceara developed the technology for biodiesel production through transesterification. Following this pioneering research effort, Brazilian government launched a program, named Prodiesel, to support a series of research projects on Biodiesel. Between 1980 and 1984, several research projects have tested biodiesel in trucks and planes. About 300,000 liters of biodiesel were produced in the same period (Tecbio, 2006). This program reached promising results for the use of biodiesel blended with mineral diesel (Fonseca, 1982, 1985). Nevertheless, the program was abandoned in 1984, reflecting government's emphasis on the ethanol program.
The increase in oil price and the development of biodiesel technologies in Europe and US have contributed to renew Brazil´s interest in biodiesel. In 2004, Brazilian government launched the National Program for Production and Use of Biodiesel - NPPUB. In 2005, the government enacted the law 11.097 mandating a blend of 2% of biodiesel in the mineral diesel for 2008 and 5% for 2013, for the diesel sold to the transportation sector. This mandatory blend will require a production of 1 billion liters in 2008 and 2.4 billion liters in 2013.
The political motivation for the NPPUB is not only related to fuel supply diversification but also to the social dimension of biodiesel production. The government is expecting to create 200,000 new jobs with incentives for the biodiesel production by small farmers. The decree 5297 created the Social Fuel Certificate. Producers that have this certificate are qualified to sell Biodiesel to the government with favorable conditions, such as tax exemptions and access to cheap financing by the BNDES and the PRONAF (National Program for Family-based Agriculture) (PNPB, 2007).
In 2005, Petrobras announced the development of a new refining process which can produce diesel with biofuel content. This process, named H-Bio, consist basically of adding vegetal oil in the refining stream (hydro treatment), processing this oil together with the mineral oil. The vegetal oil contributes to increase the diesel quality and is an alternative to biodiesel production since it can use the same feedstock. The advantage is related to the use of the existing refineries to process the vegetal oil.
61 E. De Almeida, J. Bomtempo et al.
Currently, there are 14 biodiesel plants operating in Brazil with a production capacity of 600,000 ton/year. B2 (2% biodiesel) diesel is offered by 2,000 gas stations, and some local experiences using B30 (30% biodiesel) diesel by bus fleets are under development. About 60 projects for new biodiesel plants have been announced. The Brazilian ethanol experience has contributed to spread the expectation in the government and other economic agents that biodiesel could have the same technological and economic performance of ethanol. However, Brazilian performance on biodiesel is subject of lot of economic and technological uncertainties. The most important one regards the type of biomass that will predominate. At this moment, a large number of alternatives of oil sources and business model are in competition. This process of competition is incipient making unclear which technological options will be selected by the market as the industry evolves in its life cycle.
2.1 – Economic Performance
Biodiesel can be produced by transesterification of vegetal or animal oils using one type of alcohol (in general methanol) as alkaline solution and alkaline catalyst. This technology was initially commercially developed in Europe using mostly oil from rapeseed . In Brazil, a large number of feedstock has been considered for oil production: soybean; palm, sunflower; castor, Jatropha, peanuts, cotton seeds, tallow etc.
The business model for biodiesel production in Brazil varies not only according to the feedstock chosen. There are uncertainties related to the type of biodiesel plant technology. These plants can be dedicated to one type of feedstock, or capable to process more than one type of oil (flexible). The production process can be continuous or discontinuous. The type of alcohol solution can be methanol or ethanol. The efficient production scale is also not clear. Currently, a plant of 100,000 tons per year can be considered large for Brazilian standards. However, in the US, plants size from 200.000 t/y to 300.000 t/y is frequent and Chevron has announced the construction of a 400.000 t/y plant. We can also verify the presence of different type of investors in the segment: energy companies; soybean producers; meat producers; independent investors, financial groups, etc.
The technological and economic diversity in the biodiesel segment is a characteristic of the low level of maturity of this industry in Brazil. We can say the Brazilian biodiesel industry is in the initial phase of its life cycle. Several technological options are in competition for a dominant design that could bring the industry to a cost reduction trajectory. Therefore, the analysis of the current performance of biodiesel in Brazil can not reveal automatically its potential for development. This report will try to assess the potential for

E. De Almeida, J. Bomtempo et al. 62
Brazilian biodiesel by analyzing the technological alternatives on play, trying to show advantages and disadvantages of each one.
The analysis of the biodiesel production costs has two dimensions: the cost/price of feedstocks and the cost of biomass processing. The processing cost depends basically on the type of plant technology. However, the assessment of the cost of feedstock for biodiesel is even more complex than for sugarcane.
Currently, biodiesel cost is concentrated at the biomass production. The cost of the vegetal oil represents approximately 80% while the transesterification process for biodiesel production represents about 20%. In the transesterification process, capital cost represents only about 25%. This cost structure shows clearly that the most important challenge for biodiesel production today is to reduce the cost of biomass production.
2.1.1 - The biodiesel feedstock economics
As mentioned before, a large set of sources of feedstock is under consideration in Brazil. Currently, the most important sources under experimental or commercial production are: soybean, castor beans, palm tree, Jatropha and oil from animal source (tallow). In this context, plant feedstock flexibility is considered an important source of competitiveness.
Soybean
Soybean has been the feedstock choice for most of biodiesel produced in Brazil. Currently, all projects that have flexible plant technology are operating with soybean given its availability. Brazil is one of the largest soybean producers in the world, with a total production of 51 million tons in 2005. Agronomical research has contributed to increase soybean productivity in Brazil from 1700 ton/hectare in 1990 to 2,200 ton/hectare in 200527. Given this productivity increase, soybean has been pointed as the cheapest feedstock for biodiesel production in Brazil (Barros et al., 2006). However, contrary to sugarcane, soybean is an international commodity and its price varies substantially according to the demand of the alternatives uses, making uncertain its future in the biodiesel business in Brazil28.
27 In fact one of the most important contributions of agronomical research was the
development of new soybeans varieties that can be cultivated in tropical areas. Until the 1980s, Brazilian soybean production was limited to the colder zones in the southern areas of the country.
28 It is important to mention that soybean can be directly sold in the international market. The alternative uses affect directly the price of soybean. In the case of sugarcane, the alternative use affects indirectly the price of sugarcane. In fact, not all mills can process sugarcane into sugar. As a consequence, the sugarcane price can vary significantly in different producing regions, while soybean market is pretty much commoditized.

63 E. De Almeida, J. Bomtempo et al.
Concerning the social dimension, soybean can be seen as the alternative with the poorest performance. Wehrman et al. (2006), points several negative factors to use soybean as biodiesel feedstock in Brazil, such as: i) low labor intensity; ii) social exclusion and migration to large cities; iii) and deforestation.
Castor beans
Castor bean oil has been pointed as the most interesting feedstock for the Brazilian biodiesel program, mainly due to the low technological requirements for its production. Castor can be produced in poor quality lands (low levels of rain and fertility), making it a good option for family-based agriculture in the Brazilian dry Northeast region (poorest part of Brazil). This initial idea has been proved too optimistic as several obstacles emerged to large scale castor production.
Low production levels and lack of agronomical research have contributed to a low castor productivity in Brazil as compared to international levels. India productivity, for instance, is 1.5 times higher than Brazil's. Brazilian castor production is very unstable and, about 168,000 tons/y have been produced in 2005. Another important obstacle to castor-based biodiesel is the current international price for castor oil. Castor oil is currently used as lubricant in cars and planes and also as feedstock in the chemical industry. Current price of castor oil in the international market is higher than the price of biodiesel. For instance, in April 2007 the price of castor oil in Brazil was R$ 2.85 per liter. In the same period, Brazilian government was paying biodiesel at R$ 1.75 per liter. Therefore, current opportunity cost of castor oil production is higher than biodiesel price, requiring a large amount of subsidies to make castor-based biodiesel economic viable.
The Brazilian biodiesel program is subsidizing the castor oil production through the Social Fuel Certificate program. Biodiesel producers receive tax incentives in Biodiesel production if they buy castor oil from small farmers. However, they are not obliged to use the castor oil in the Biodiesel production. Several biodiesel producers have found more interesting to sell the castor oil in the international market and use soybean as feedstock for biodiesel production.
The use of castor oil for large scale biodiesel production will require an important investment in agronomical research and large increase in the current production level. Since castor oil has been quoted higher than biodiesel price in the last years, it seems that subsidy is a necessary but not sufficient condition to expand castor production in Brazil. If significant productivity increase is reached, castor price can be reduced with the expansion of production. Currently, the volumes of castor oil demanded in the

E. De Almeida, J. Bomtempo et al. 64
international market can be considered small (800,000 tons). If Brazil dedicates a small share of its farmland to castor production, Brazilian production will drive castor oil's international price down.
An important technological effort for castor oil processing will be necessary. Some biodiesel producers have encountered technical problems to process castor oil using current plant technology, developed for rapeseed or soybean oils. In addition, there are some technical problems related to the castor-oil viscosity that could represent an obstacle to add more than 2% of biodiesel in the diesel.
Palm oil
The international market for palm oil is as large as soybean oil. Currently, about 25 million tons of palm oil is produced internationally. Palm oil has large scale utilization in the food industry, in particular in Asia. Brazil is a small palm oil producer and consumer at the international level (0.5%). However, the country has an important potential for palm oil production, considering the climate and land quality. The cost of palm oil production in Brazil has been estimated in the range of $ 200 to $ 230 per ton. However, the international oil price is about $ 600 per ton setting a high opportunity cost for biodiesel production.
According to Macedo and Nogueira (2005), Brazil has about 70 million hectares suitable for palm production in the Amazon region. About 40% of this area is highly suitable for palm production. Palm plantation and harvesting is labor intensive, with high potential social impacts.
Brazil has already experimenting biodiesel production using palm oil as feedstock. The Agropalma project is producing biodiesel buying palm nuts from small farmers in the North of Brazil. This project is responsible for the creation of 3,000 direct jobs with 33,000 hectares of palm. Similarly to castor, Brazilian agronomical research on palm oil is incipient. The large scale production of palm oil will require significant investment in research infrastructure.
Jatropha
Recently Jatropha has been pointed as a potential feedstock for biodiesel production. Jatropha is a tree from the same family as castor, with no commercial use at this moment. The Brazilian agronomic research institute (EMBRAPA) has experimented planting Jatropha in dry regions with excellent results. The plant has low levels of land and water requirements, and has good oil content (30% to 40%). One of the most important advantages of this plant is its low production cost. The plant can produce for 40 years without re-

65 E. De Almeida, J. Bomtempo et al.
plantation. Castor, for example, should be re-planted every 2 years. Therefore, Jatropha is being pointed as the future for biodiesel in Brazil.
Tallow
Animal oil from tallow is one of the sources of feedstock considered in Brazil. Since the country is the largest meat producer in the world, large amount of tallow is available in the market. Brazil produces about 1 million tons of tallow per year. This amount would be enough to supply all biodiesel production to reach B2 mandatory standards. However, this product has alternative use such as for soap production.
Currently, some small biodiesel producers are already using tallow as biodiesel feedstock. There is a project for tallow-based biodiesel production with a capacity of 100,000 tons per year (Frigorifico Bertin). The perspective of growing use of tallow for biodiesel production has fostered a rapid increase in tallow's price. Tallow price has increased from R$ 550/t in February 2006 to R$ 1.100/t in January 2007. This price increase is jeopardizing the tallow-based biodiesel economics.
Comparing sources of feedstock
Table 12 synthesizes the main economic characteristics of different feedstock alternatives for biodiesel in Brazil. Palm is by far the feedstock with the largest oil productivity in Brazil. Palm oil productivity is 8 to 10 times higher than other feedstock options. This high productivity seems to be insufficient to cope with the lack of agronomical experience in Brazil. Few projects are going forward with palm tree. However, Brazil has a huge potential for production of several types of palm trees varieties for oil production.
When we compare the other options it is important to note that some produce byproducts with high market value. This is the case of soybean and cotton-seeds. In the case of castor, jatropha and sunflower, by-products of oil production have low market price. In this sense, in order to these options to compete with soybean, it will be necessary an important increase in oil productivity.
Currently, soybean seems to be the best economic option for biodiesel production in Brazil. Oil productivity is comparable to castor and sunflower, but the high value of the soybean flour contributes to reduce the cost of oil production. In addition, there is a large availability of soybean oil all over the country. As shown before, soybean is by far the most important type of agriculture in Brazil.

Table 12 – Economic Characteristics of main Source of Feedstocks for Biodiesel in Brazil
Feedstock Current Availability Level of agronomical research
Potential Social benefit
Oil content % of dry weight
Biomass productivity (tons per hec
Oil productivity (liters per hec)
Brazilian production (1000 tons - 2005)
Soybean Assured High Low 20 2,230 440 51,182
Tallow Significant n. a. Low - - - 1,000
Palm Limited Low High 20 20,000 4,000 151
Jatropha Non existent Low High 30-40 n.a. n.a. 0
Castor Limited Low High 47 730 343 168
Cotton Significant High High 15 3,000 450 3,666
Sunflower Limited High Low 40 1,500 630 23
Source: Own elaboration, based on data from the Ministry of Agriculture - Brazil

67 E. De Almeida, J. Bomtempo et al.
Figure 27 shows the international price of different types of vegetal oil. The international price of vegetal oil sets the opportunity cost for using this oil in biodiesel production. Figure 27 shows clearly that today castor oil has the highest opportunity cost for biodiesel production. Castor oil price has increased for the highest level in 5 years, making uneconomical its use for biodiesel production. Currently, most of castor oil originally produced for biodiesel purposes in Brazil is being exported. Palm oil has the lowest opportunity cost, but its availability in Brazil is limited.
Figure 27 - Evolution of Vegetal Oils price in the International Market
0
200
400
600
800
1000
1200
1400
jan/02
abr/0
2jul
/02ou
t/02
jan/03
abr/0
3jul
/03ou
t/03
jan/04
abr/0
4jul
/04ou
t/04
jan/05
abr/0
5jul
/05ou
t/05
jan/06
abr/0
6jul
/06ou
t/06
jan/07
Pric
e (U
S$/T
on )
sunflower
palm oil
soybean oil
canola oil
castor oil
Source: FAO - www.fao.org
2.1.2 - Biodiesel Plant Technology
Biodiesel technology employs catalytic transesterification of oils using methanol or ethanol. In order to produce 1000 kilos of biodiesel, it is required 993 kilos of vegetal or animal oil, 110 kilos of ethanol (or methanol) and about 5.5 kilos of catalyst. In addition to biodiesel, it is produced about 117 kilos of glycerin (Dedini, 2006).
Most of Biodiesel plants under construction in Brazil are based on technology developed in Europe or US29. The scale of large biodiesel plants in Brazil is about 100,000 tons per year. A biodiesel plant of this size requires an investment of about US$ 16 millions, not considering the vegetal oil
29 The most important suppliers of biodiesel plant technology in Brazil are Dedini/Ballestra,
Crown Iron and Lurgi.

E. De Almeida, J. Bomtempo et al. 68
production unit (grain crashing unit) (Dedini, 2006). A vegetal oil production unit to supply oil for a 100,000 ton per year biodiesel plant would cost an additional US$ 30 million. Nevertheless, depending on the feedstock, biodiesel plant can use current available idle capacity for vegetal oil production. This is the case for most of soybean-based biodiesel plants.
These are technologically sophisticated plants, which operate with continuous process, and use methanol as in the transesterification process. The technology being adopted in Brazil has not been adapted to use ethanol in the transesterification process. This is an important research objective since ethanol can be cheaper and cleaner than methanol produced with fossil fuels. Similarly, the technology has been developed to process soybean oil. It is also important to adapt this technology to process other types of feedstock in Brazil30.
There are other technological options being developed in Brazil base on different technological concepts. These technologies emphasize feedstock flexibility, with smaller plant scale (10,000 a 20,000 tons/year), using ethanol in transesterification, and discontinuous processes.
As mentioned before, an important technological option developed in Brazil for diesel production using vegetal oil is the H-Bio process developed by Petrobras. This process consists of adding vegetal oils in the refining stream for hydro treatment. According to Petrobras this technology represent an economically effective way of producing diesel using vegetal oils as feedstock. According to the company, the cost of processing the vegetal oils is competitive to the biodiesel option. No additional refining investment is required for H-Bio process. The vegetal oils are mixed in refining streams that should be employed in diesel production anyway (see table 13).
Table 13 - Comparing biodiesel and Hbio
Biodiesel Hbio Process Transesterification Hydro treatment Product Biodiesel Mineral diesel with
vegetal oil Efficiency 1 ton of biodiesel for
each 1 ton of vegetal oil oleo
0,9 tons of Hbio for each ton of vegetal oil
Feedstock for treatment
Methanol or ethanol Hydrogen
Source: Petrobras and ECN (2006).
30 Brazilian main biodiesel plant supplier (Dedini) have announced the development of new
plants generation that could run with ethanol. Nevertheless, none of the Brazilian plants today are using ethanol.

69 E. De Almeida, J. Bomtempo et al.
Biodiesel plants in Brazil
Currently, there are 21 biodiesel plants ready to operate in Brazil, with an estimated total production capacity of 780 million liters per year. From this total, there are 5 plants commissioned but still not operating. The total capacity of biodiesel plants currently operating in Brazil is about 600 million liters per year. However, there are 63 projects in different phase of development totaling 800 million dollars in investments. If all these projects come on stream, Brazilian biodiesel capacity will reach about 4 billion liters per year by 2009.
If we consider all projects under construction in Brazil, biodiesel production capacity is already enough to comply with the B2 mandatory consumption in 2008. Currently, Brazilian government is considering anticipating B5 mandatory consumption to 2010.
As we can see in table 14, Brazilian biodiesel plants have been projected to use a very wide range of feedstock. However, most of feedstock flexible plants operating at this moment only use soybean as source of feedstock. Brasil Ecodiesel, the latest biodiesel producer in Brazil, has recently announced a plan to reduce its soybean dependence from approximately 100% to 75% before the end of 2007.

E. De Almeida, J. Bomtempo et al. 70
Table 14 – Brazilian Biodiesel Producers Authorized by the National Petroleum Agency
Company Location Authorized capacity (m³/day
Estimated annual capacity (m³/yr)
Current status
Type of Feedstock
1 Brasil Ecodiesel
Crateús/CE 360 108,000 Operating Castor, soybean, cotton
2 Brasil Ecodiesel
Iraquara/BA 360 108,000 Operating Castor, soybean, and cotton
3 Granol Anápolis/GO 333.3 100,000 Operating Soybean 4 Oleoplan Veranópolis /
RS 327 98,000 Operating Soybean
5 Biocapital Charqueada/SP
186 55,001 Not operating
Total Flexible
6 Barralcóol Barra do Bugres/MT
166.7 50,000 Operating Soybean & sunflower
7 PonTe di Ferro
Manguinhos/RJ
160 48,000 not operating
Tallow
8 Brasil Ecodiesel
Floriano/PI 135 40,001 Operating Castor,soybean, cotton
9 Granol Campinas/SP 133 39,001 Operating Soybean 10 PonTe di
Ferro Taubaté/SP 90 27,000 Not
operating -
11 Agropalma Bélem/PA 80 24,000 Operating Palm oil 12 IBR Simões
Filho/BA 65 19,001 Operating Soybean,
cotton, palm oil and rapeseed
13 Soyminas Cássia/MG 40 12,000 Operating Rapeseed , sunflower
14 Fertibom Catanduva/SP 40 12,000 Operating Tallow 15 Biolix Rolândia/PR 30 9,000 Operating Rapeseed 16 Binatural Formosa/GO 30 9,000 Not
operating soybean, cotton, Jatropha, castor
17 Fusermann Barbacena/MG
30 9,000 Operating Jatropha, soybean sunflower
18 Dhaymers Taboão da Serra/SP
26 7,001 Operating Soybean and tallow
19 Renobras DomAquino/MT
20 6,000 Operating Sunflower
20 Ouro Verde Rolim de Moura/RO
17 5,000 Not operating
Soybean
21 NUTEC Fortaleza/CE 2.4 720 Operating Castor Total 780,724
Source: ANP, www.biodieselBR.com and companies' websites

71 E. De Almeida, J. Bomtempo et al.
2.1.3 – Brazilian Biodiesel as Compared to Other Countries
As mentioned before, the Brazilian biodiesel program tries to innovate significantly compared to the US and European experiences. The most important innovation regards the government efforts to introduce new types of sources of feedstock. Brazilian biodiesel program has been created with a huge concern regarding the program's social impacts. One of the objectives of the program is the development of new types of feedstock that could be cultivated in lands not used today for food production. This political motivation represents an important innovation challenge with significant risks for the investments in the segment.
The attempt to produce new types of biodiesel feedstock at large scale will require not only an important effort on the agronomical research, but also on the development of new forms of production organization. The most important challenge is to reduce the production cost of new commercial crops (palm, babassu31, castor or Jatropha), leaving a role for the family-based agriculture. In fact, the technological trajectory that allowed the cost reduction in the Brazilian agribusiness has been characterized by the large scale production, with no role for family-based agriculture.
The diversity of the feedstock supply in Brazil has significant impacts on the processing technology being developed in Brazil. While the international experience on the transesterification process is based on the use of methanol32, Brazil is trying to develop new technological options for transesterification based on ethanol. In fact, Brazil imports 50% of methanol currently consumed in the country. The high natural gas price in Brazil leaves small room for increasing significantly the domestic production of methanol. Therefore, a significant innovation effort has been dedicated to develop new ethanol based technologies, with timid results so far. Currently, just one project has managed to produce biodiesel with ethanol-based transesterification.
According to ICIS (2006), there were 58 biodiesel plants operating in the world in 2005. The majority of these plants have plant capacity lower than 50,000 tons per year. However, 20% of the plants have capacity above 100,000 tons. ICIS (2006) emphasizes the fact that the plant scale of new projects announced is increasing significantly. From 170 biodiesel projects announced in the world by 2006, 94 have a plant capacity above 100,000 ton per year, 23 plants have announced a capacity around 200,000 tons/year and 3 between 300,000 tons/year and 400,000 tons/year. Therefore, we can say that the exploration of the scale effect has been adopted as an important technological 31 Babassu is a variety of palm tree very common in the Brazilian Amazon region. 32 Usually produced from natural gas.
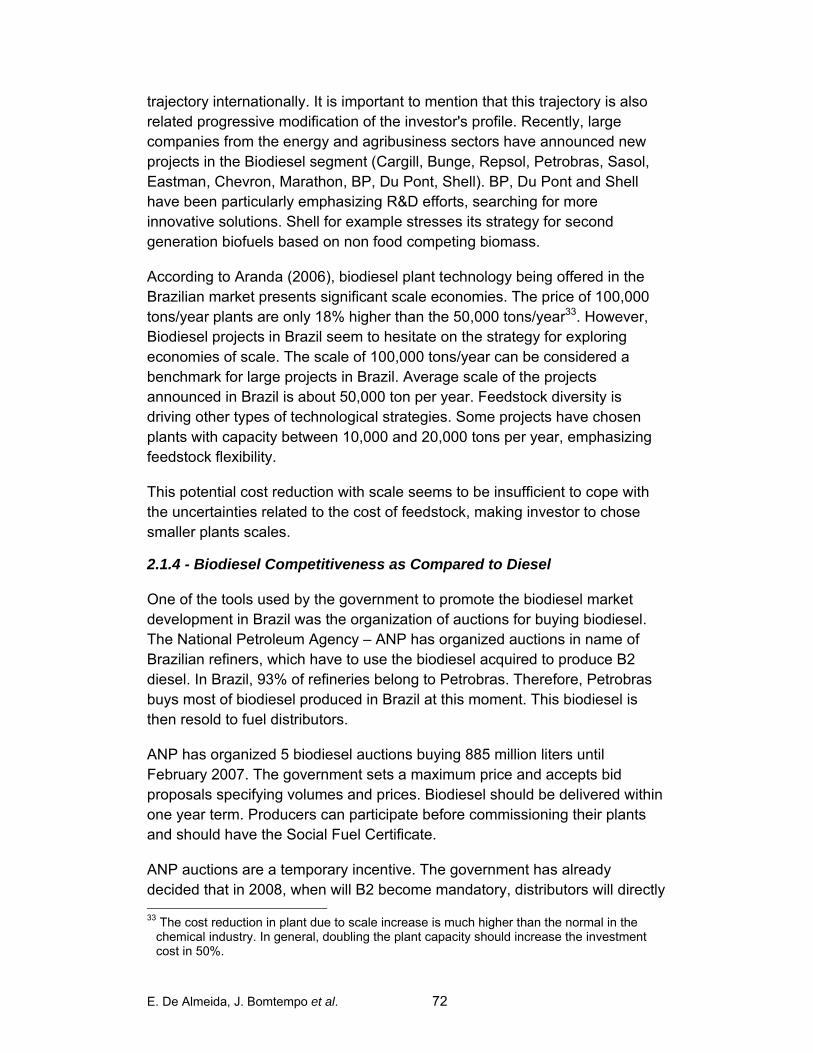
E. De Almeida, J. Bomtempo et al. 72
trajectory internationally. It is important to mention that this trajectory is also related progressive modification of the investor's profile. Recently, large companies from the energy and agribusiness sectors have announced new projects in the Biodiesel segment (Cargill, Bunge, Repsol, Petrobras, Sasol, Eastman, Chevron, Marathon, BP, Du Pont, Shell). BP, Du Pont and Shell have been particularly emphasizing R&D efforts, searching for more innovative solutions. Shell for example stresses its strategy for second generation biofuels based on non food competing biomass.
According to Aranda (2006), biodiesel plant technology being offered in the Brazilian market presents significant scale economies. The price of 100,000 tons/year plants are only 18% higher than the 50,000 tons/year33. However, Biodiesel projects in Brazil seem to hesitate on the strategy for exploring economies of scale. The scale of 100,000 tons/year can be considered a benchmark for large projects in Brazil. Average scale of the projects announced in Brazil is about 50,000 ton per year. Feedstock diversity is driving other types of technological strategies. Some projects have chosen plants with capacity between 10,000 and 20,000 tons per year, emphasizing feedstock flexibility.
This potential cost reduction with scale seems to be insufficient to cope with the uncertainties related to the cost of feedstock, making investor to chose smaller plants scales.
2.1.4 - Biodiesel Competitiveness as Compared to Diesel
One of the tools used by the government to promote the biodiesel market development in Brazil was the organization of auctions for buying biodiesel. The National Petroleum Agency – ANP has organized auctions in name of Brazilian refiners, which have to use the biodiesel acquired to produce B2 diesel. In Brazil, 93% of refineries belong to Petrobras. Therefore, Petrobras buys most of biodiesel produced in Brazil at this moment. This biodiesel is then resold to fuel distributors.
ANP has organized 5 biodiesel auctions buying 885 million liters until February 2007. The government sets a maximum price and accepts bid proposals specifying volumes and prices. Biodiesel should be delivered within one year term. Producers can participate before commissioning their plants and should have the Social Fuel Certificate.
ANP auctions are a temporary incentive. The government has already decided that in 2008, when will B2 become mandatory, distributors will directly 33 The cost reduction in plant due to scale increase is much higher than the normal in the
chemical industry. In general, doubling the plant capacity should increase the investment cost in 50%.

73 E. De Almeida, J. Bomtempo et al.
buy the biodiesel needed to elaborate the B2. Distributors will organize their own trade strategies to acquire biodiesel at the cheapest price. The objective is that biodiesel market follows the structure of ethanol market, where distributors negotiate directly with ethanol producers. Biodiesel price will be set at a competitive basis, but it can remain higher than mineral diesel since it consumption will be mandatory.
Figure 28 presents the maximum price and the average price offered by biodiesel producers in Brazil. As we can see, the price paid in the auctions has varied between R$1.75 and R$1.9 per liter. Current diesel price paid by distributors at the refinery in Brazil is about R$1.14. The average pump price in Brazil is R$1.80. Therefore, biodiesel is not competitive with mineral diesel, even in the cases when biodiesel is totally exempt from taxes.
Figure 28 - Evolution of Biodiesel Price in the ANP´s First Auctions
1,65
1,7
1,75
1,8
1,85
1,9
1,95
nov/0
5
dez/0
5jan
/06fev
/06
mar/06
abr/0
6
mai/06
jun/06
jul/06
ago/0
6se
t/06
out/0
6
nov/0
6
dez/0
6jan
/07fev
/07
R$/
liter Bid average price(R$/Liter)
Maximum reference price(R$/Liter)
Source: National Petroleum Agency (average exchange rate R$2.1 per US$)
A recent study organized by CEPEA (Centro de Estudos Avançados em Economia Aplicada) has estimated biodiesel production cost according to different types of feedstock and producing regions in Brazil (See Barros et al., 2006). This study has compared the same processing technology (ethylic route) in three different production scales: 10 thousand tons/year; 40 thousand tons/year and 100 thousand tons/year. It also considered feedstock's cost in two perspectives: by its production costs and its opportunity cost. The production cost is calculated based on the concept of Total Operational Costs, which includes all variable costs and machinery depreciation. Opportunity costs are represented feedstock market price in the considered region in 2005. This study has considered an integrated biodiesel

E. De Almeida, J. Bomtempo et al. 74
plant, which is a plant composed of a vegetable oil processing unit and a transesterification unit. It considers all the revenues (or costs) obtained with by-products from vegetal oil production and from biodiesel production (glycerin and hydrated ethanol)
In general terms, biodiesel production costs are calculated as follows: raw material (production cost or opportunity cost) plus vegetal processing costs minus by products revenues (calculated based on its market prices) plus biodiesel industrial costs minus by products revenues. According to CEPEA, biodiesel production costs in Brazil vary from US$ 0.34 to US$ 0.85 (40,000 tons/year plant). The most competitive raw source is cotton in Northeast. Figure 29 shows the biodiesel production cost in different regions in Brazil considering the feedstock's production cost and the market price of vegetal oil. As we can see, in some cases, it is cheaper to buy the vegetal oil than to produce the feedstock (soybean in the South, Northeast and North regions; and Sunflower in the South and Southeast regions). However, in most cases, producing the feedstock is the cheaper options. This is particularly true in the case of castor oil.
Figure 29 – Estimated Biodiesel Production Costs According to Feedstock and Producing Regions - 2005 (40,000 tons/year)
0,00
0,20
0,40
0,60
0,80
1,00
1,20
Soybe
an - s
outh
Sunflo
wer - s
outh
Soybe
an - S
outhe
ast
Peann
uts - S
outhe
ast
Sunflo
wer - S
outhe
ast
Soybe
ans -
Midw
est
Sunflo
wer - M
idwes
t
Cotton
-Midw
est
soyb
eans
- Nort
heas
t
Castor
bean
- Nort
heas
t
Cotton
-Nort
heas
t
Soybe
ans -
Nort
h
Palm O
il - N
orth
US$
/lite
r
Production Costs (PC)Oportunity Costs (OC)
Source: Barros et al. (2006)
Comparing biodiesel production cost estimations to the ANP auctions prices, we can conclude that Brazilian biodiesel is an attractive business at this moment. In some cases, the auction prices (US$ 0.83 to US$ 0.9 per liter) have been more than 100% higher than biodiesel production costs. This

75 E. De Almeida, J. Bomtempo et al.
attractiveness is driving a biodiesel rush in Brazil. This profitability is attracting investors from the soybean segment, interested to improve their profitability, but not necessarily committed to the biodiesel long-term development. It is important to note that biodiesel plant investments can be considered modest for large soybean producers, resulting in low entry-exit barriers.
It is important to mention that it is not clear how current attractiveness will evolve. Production cost can vary significantly in a short period of time according the vegetal oil production cost. Similarly, as new production capacity come to stream, competition will increase and potentially affect biodiesel prices. The size of biodiesel domestic market is limited by the mandatory standards. While biodiesel prices remain higher than mineral diesel, it is not reasonable to expect refiners to buy more than the mandatory volumes. These uncertainties contribute to a strategy to invest in plant with modest sizes reducing the barriers of entry-exit.
The prospect for Brazilian biodiesel cost evolution is not clear so far. The Brazilian government and other agents involved in biodiesel in Brazil have the expectation that, similarly to ethanol, biodiesel learning process will drive significant cost reduction in the near future. However, innovation economics shows that this learning process depends on a technological selection process that are still to be done in Brazilian biodiesel. At this point, too many technological alternatives in terms of feedstock and oil processing technologies are in competition. A selection process will be necessary before a cost reduction process takes place. In addition, it is important to consider that technological progress in the agronomical research is time consuming. In the case of sugarcane, when R&D efforts were intensified in the 1970s, Brazil had already a long tradition in sugarcane plantation. In some of the proposed feedstock options (Jatropha, Palm Oil, Castor Bean), Brazilian agronomical research will start from almost zero.
2.1.5 – Direct and Indirect Subsidies to Biodiesel
Currently, Biodiesel production in Brazil is strongly subsidized. Similarly to ethanol, Biodiesel producers have access to cheaper credit lines from the BNDES and PRONAF. However, the most important incentive is the acquisition price paid by ANP's auctions. As shown in figure 29, auctions prices are significantly higher than the mineral diesel prices at the refineries. The mineral diesel and biodiesel price difference is currently absorbed by Petrobras. Since biodiesel is not mandatory at this moment, Petrobras has difficulty to sell B2 diesel at higher prices. However, when B2 become mandatory, the price difference will be directly passed to consumers.
In addition to higher prices, some tax incentives are offered to biodiesel producers aiming at promoting regional development and fostering family-

E. De Almeida, J. Bomtempo et al. 76
based agriculture. Federal taxes applied to conventional diesel comprehend the excise tax (CIDE) and social contributions (PIS/COFINS). Currently, mineral diesel pays a total federal tax of approximately $0.10 per liter. Federal tax incentives for biodiesel are organized as follows:
a. Biodiesel produced in the North and Northeast regions using from castor beans or palm oil is granted a federal fiscal exemption of 31%.
b. Biodiesel production based on raw material produced by family agriculture throughout the country is granted a 68% reduction in Federal taxes. This incentive seeks to sustain small family-based agricultural production.
c. Biodiesel production that meets both aforementioned conditions simultaneously is totally exempted of federal taxes.
These federal taxes are collected at the biodiesel plant. Producers have to present the certificate that guarantees that biodiesel output meet meets some of these conditions. It is worth mention that biodiesel production from soybeans is excluded from this incentive scheme.
Figure 29 shows the average biodiesel price in the five public auctions realized so far by ANP, as compared to average diesel producer’s price without federal taxes (data from 2006). The difference between the auction price and the mineral Diesel price can be considered as the total subsidy given to biodiesel producers in order to develop biodiesel market. Part of this incentive takes the form of fiscal exemption, and part of it takes part of direct revenue transference from Petrobras to biodiesel producers.

77 E. De Almeida, J. Bomtempo et al.
Figure 30 – Subsidies to Biodiesel Production in Brazil (US$ per liter)
0,54 0,54 0,54 0,54 0,54
0,10 0,10 0,10 0,10 0,10
0,26 0,240,19 0,18
0,24
0,00
0,10
0,20
0,30
0,40
0,50
0,60
0,70
0,80
0,90
1,00
1st Auction 2nd Auction 3rd auction 4th auction 5th auction
subsidyFederal Taxes (Cide + Pis/cofins)Average Diesel Producer's Price
0,91 0,89
0,84
0,89
0,83
Fiscal Exemption
Total Incentives to Biodiesel
Source: Own elaboration based on ANP data
Based on this data, we can estimate the amount of subsidies given to Biodiesel producers in Brazil. Without considering the fiscal exemptions, subsidies offered to biodiesel producers totaled US$ 180 million in the ANP auctions, which acquired 885 million liters. The amount of subsidies by tax exemptions is more difficult to estimate due to different levels of exemptions according to the region and type of feedstock. But these exemptions have been at least 68% since participants in ANP auctions should have the Social Fuel Certificate.
If we accept 80% exemption as average, total subsidies offered increase to US$ 250 million. It is important mention that it is not clear that all biodiesel acquired in ANP option will be produced. Some producers that offered biodiesel do not have production capacity yet.
2.2 – Environmental Performance
Similarly to ethanol, Biodiesel global environmental performance depends on the energy balance of biodiesel production, measured by the yield of units of fuel for every unit of fossil fuel consumed in its life-cycle. This energy balance varies according to the type of feedstock.
Contrary to ethanol, few studies have been dedicated to the analysis of biodiesel environmental performance in Brazil. Most of studies on biodiesel

E. De Almeida, J. Bomtempo et al. 78
energy balance are dated. Goldemberg (1982) analyzed the energy balance of soybean biodiesel and found an energy balance of 1.43. Goldemberg has not considered the energy content of the byproducts sold to the food market (soybean flour). NREL (1998), on the other hand, has analyzed the energy balance for soybean biodiesel in the US and found a yield of 3.2 units of fuel for every unit of fossil fuel consumed. Contrary to Godemberg, NREL (1998) has considered the energy value of the soybeans by products. Currently, the yield of 3 is currently widely accepted as a good indication for the soybean biodiesel energy balance.
Neto et al. (2004) studied the energy balance of castor oil biodiesel in Brazil and found an energy balance ranging from 2 to 2.9. This study can be considered optimistic given that assumed a productivity of castor production of 1,800 kilos per hectare. Current productivity in Brazil is less than 1,000 kilos per hectare. As far as the palm oil biodiesel is concerned, Martins and Teixeira (1985) found an energy balance of 5.63 in Brazil. More recently, Costa et al. (2005) also studied the energy balance of palm oil biodiesel in Brazil and found a much more optimistic figure, ranging from 7 to 10. Finally, energy balance for Jatropha oil biodiesel has been estimated in range from 5 to 6 (see table 15).
All figures mentioned above can be seen as a preliminary indication. The energy balance for biodiesel in Brazil will vary significantly not only according to the type of feedstock adopted, but also according to the production conditions for each one. The energy balance can also vary according to the feedstock productivity and type of processing technology.
It is also important to consider that the energy balance will also depend on how non-energy by-products are taken into consideration. One of the main reason sugarcane ethanol has a high energy balance (around 8) is related to the fact that the biomass by-product (bagasse) has an energy use in the process. On the other hand, in the soybean biodiesel production, for example, the biomass by-product (soybean flour) is sold in the market for non-energy use. Even though, the data on energy balance for biodiesel produced in Brazil cannot be considered conclusive, we can say that palm tree biodiesel has the best emissions reduction potential.

79 E. De Almeida, J. Bomtempo et al.
Table 15 - Energy Balance for Different type of Biodiesel Feedstock
Feedstock Energy input/output Soybean 1.5 – 3.2 Palm tree 5 – 10 Jatropha 5-6 Castor beans 2-2.9 Sunflower 3
Source: Own Elaboration, base on the literature quoted above
The impact of Biodiesel on the reduction of CO2 emissions has not yet been studied in the Brazilian context. IEA (2004) presents estimates for net GHG emissions reductions from rapeseed-based biodiesel. Studies on well-to-wheels net CO2 emissions shows a reduction ranging from 40% to 60%. Smith (2004) has made a life-cycle analysis soybean, rapeseed and tallow based biodiesel emissions. He found a reduction in emissions of about 63% for rapeseed and soybean and for about 90% tallow biodiesel. In the case of Brazil, there is a potential for improving the CO2 reduction levels using feedstocks with better energy balance. In addition, if ethanol is used instead of methanol in the transesterification process, significant reduction in emissions can be obtained.
According to La Rovere (2006), each liter of mineral diesel in Brazil emits about 2.7 kg of CO2. If we assume that most of Brazilian biodiesel will come from Soybean (60% reduction in CO2 emissions), the Brazilian biodiesel program will contribute to avoid about 1.3 million tons of CO2 per year in 2008 (B2) and about 3.9 million tons in 2011 (B5). However, as the share of other types of biodiesel feedstocks increases in the Brazilian production, further reduction in CO2 emissions can be obtained.
The energy balance is not the only factor that should be taken into consideration when analyzing the global environmental performance. The potential contribution of biodiesel production to deforestation should be studied carefully. As we mentioned before, soybean production in Brazil has expanded to areas recently deforested in the Amazon. We can easily verify an indirect association between deforestation and soybean production in Brazil.
As far as castor bean and jatropha are concerned, potential contribution for deforestation can be considered less important. Castor and Jatropha are cultivated in semi-arid zones with few remaining forest areas. The objective of the Brazilian biodiesel program is to create an economic alternative for these economic depressed areas of the country.
Several varieties of palm trees are native in the humid zones of Brazil, where most of remaining forest are located. The objective is not to replace forest by

E. De Almeida, J. Bomtempo et al. 80
palm tree plantation, but to create an alternative for already deforested areas. Nevertheless, it is not clear at this point what threats palm oil biodiesel could represent for the Amazon forest.
It is worth mention that palm oil culture is one of the most criticized cultures concerning its impacts on deforestation. This is mainly because it can only be planted in tropical zones (Malaysia, Indonesia, South Africa and now in Brazil) and its expansion can damage eco-sensitive areas like tropical forests. In 2004, an association called “Roundtable on Sustainable Palm Oil” has been created aiming at promoting the growth and use of sustainable palm oil through co-operation within the supply chain and open dialogue with its stakeholders. This association involves a wide range of organizations, such as the W.W.F. (Switzerland), United Plantations (Malaysia), Marks & Spencer (England), Sainsbury’s (England), Unilever (Holland) and MPOA (Malaysia).
After an intense debate, the association members came to a consensus about the principles and criteria that a sustainable palm oil production should attain. Each Principle includes a set of performance and norms that should be followed by those involved in oil palm activities (RPSO, 2005). Agropalma, the Brazilian company that produces biodiesel from palm oil is involved on this pilot phase, and the results will be analyzed by November this year.
2.2.1 – Other Environmental Impacts
As we saw in this report, the biodiesel program is a recent government initiative. In this sense, there is not a detailed research on other environmental issues regarding vegetal oil growing related to biodiesel production. The National Agricultural Research Agency (Embrapa) is implementing a research project to measure environmental impacts of plantations related to biodiesel production. This first project will be focused on 24 oil plant producers in two cities: Catanduva in the state of Sao Paulo and Cassia in the state of Minas Gerais. This research project is based on a simple system that integrates 24 sustainability indicators that is already in use to assess environmental impact of other agricultural activities and technologies in Brazil. This project started in February 2007 and there are not yet available results.
In this context, we decided to make a brief assessment of the main environmental issues related to the main oil plant growing in Brazil: soya. It will also be mentioned some environment issues related to cotton.
Local environmental impacts of Soya Production
The expansion of soybean culture in Brazil raises lots of environmental issues. The first one concerns the deforestation risk. As mentioned before Soybeans production has expanded to the frontiers of Amazon Forest. Grath

81 E. De Almeida, J. Bomtempo et al.
and Diaz (2006) stress that the main impact on deforestation is indirect: soybean producers prefer using area already deforested by cattle raising activity. This is mainly due to the lower cost of preparing the arable land. However, soybean production tends to dislocate cattle raising activity over the forest areas. Another possible impact indirect is on the remaining forest covertures near soybean production. Grath and Diaz (2006) show that soybean production uses firewood to dry the grains: 0,03 m3 of firewood for each ton of soybean. However, the impact of soybean production in Amazon area is an open area of research because it is a recent movement.
Current available assessments of potential risks have analyzed the impacts occurred in the soybean production in savannah areas. The first type of impact regards soil erosion and sand accumulation in rivers. According to Mr. Peres Filho, from Geosciences Institute of the University of Campinas, the expansion of soybean production in Brazilian savannahs and in the border of Amazonian region has occupied soils not adapted to mechanized monoculture (Unicamp, 2003). These are soils composed by less than 15% of argil (they are mainly composed by quartzite sand) and with declivity of more than 2%, which are poor in Calcium and Potassium. In these areas, the substitution of native vegetation to pasture or to soybean production accelerates the soil erosion process. By the action of rain and wind, this eroded material is deposed in rivers canals forming sand banks. This erosion process can be so deep that can jeopardize the groundwater.
Another element that contributes to erosion process is the mechanization, since it compresses the soil which impedes the development of the roots on the underground. In fact, Novaes (2000) and Barreto (2004) estimate an average loss of 10 kgs of soil per kg of soybean produced. The effect of erosion in cotton production is not negligible either: the culture of cotton represents 36 tons of eroded material per hectare/year (Azevedo and Aguiar, 2002).
As the production advances over poorer soils, the use of fertilizer in soybean production is more intense than in other cultures. Macedo (2002) compares the use of Potassium and Phosphorus both in sugarcane production and in soybeans production. The use of Potassium per ton in soybean production is almost twice its use in sugarcane production (805 kgs/ton in soybean production). Concerning the use of Phosphorus, this ratio increases to three times: soybean production requires on average 690 kgs/ton as compared to 202 kgs/ton in sugarcane. It is worth mention that the production of soybeans does not need the addiction of Nitrogen since the vegetal produces it.
The expansion of a monoculture implies in a decrease in biodiversity. In terms of pesticide control, the monoculture leads to the mutation of pests that

E. De Almeida, J. Bomtempo et al. 82
become more resistant to pesticides. The use of pesticides in soybean production is another concern. According to Scorza Junior (2002), a study of the use of pesticides in the state of Mato Grosso showed that among the cultures present in the state (soybean, corn, wheat, tomato, rice) soybean employs the largest amount of pesticide. Dores e Freire (2001) highlights that the use of pesticides in soybean production coincides with the rainy period in the Midwest and increases the risk of water contamination. The reduction in the use of pesticides (mainly herbicides) in soybeans production can be achieved with the introduction of genetically modified soybeans.
2.2.2 - Environmental Impacts of Mineral Diesel Replacement
The local environmental impacts of biodiesel in Brazil should take into consideration not only negative impacts but also potential benefits. Local environmental impacts of Biodiesel production are much less important than ethanol's. The harvesting of biodiesel feedstocks does not require burning and biodiesel production does not produce large amount of process' residues as for sugarcane ethanol. The use of biodiesel, on the other hand, can be associated to significant benefits to local environment.
Diesel consumption is the most important contributor to the poor air quality in Brazilian large cities. Freight and passenger transportation systems in Brazil as based on diesel trucks and buses. Brazilian diesel quality is still poor if we compare with Europe or the US standards. The rate of particulates and sulfur are significantly higher. Two types of diesel are sold in the Brazilian market: the Metropolitan Diesel and Inland Diesel. The specifications for Metropolitan diesel are more restrictive than for Inland Diesel. For instance, while the rate of sulfur accepted in the metropolitan diesel is 0.2%, the Inland Diesel specification tolerates 0.35%.
The standards for Diesel vehicles emissions in Brazil are based on the European standards. Currently, while diesel vehicles in Europe comply with the Euro IV standard since 2005, Brazil will adopt this norm only in 2009 (see table 16).
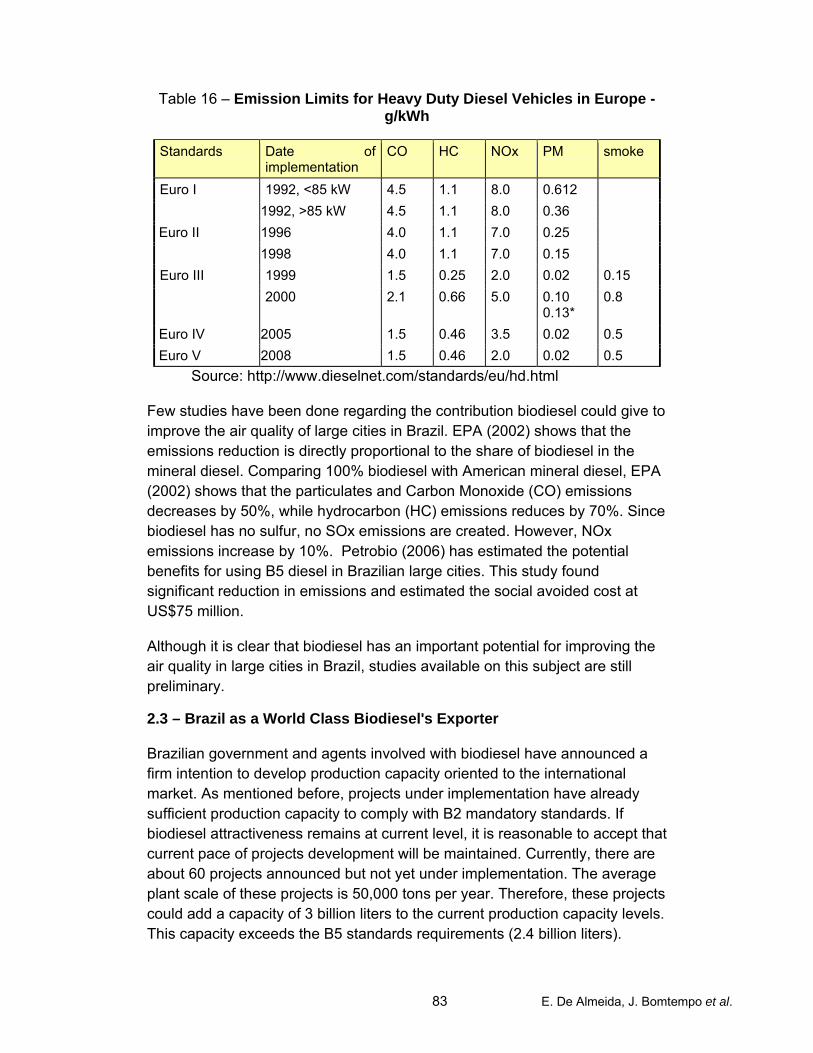
83 E. De Almeida, J. Bomtempo et al.
Table 16 – Emission Limits for Heavy Duty Diesel Vehicles in Europe - g/kWh
Standards Date of implementation
CO HC NOx PM smoke
Euro I 1992, <85 kW 4.5 1.1 8.0 0.612 1992, >85 kW 4.5 1.1 8.0 0.36
Euro II 1996 4.0 1.1 7.0 0.25 1998 4.0 1.1 7.0 0.15
Euro III 1999 1.5 0.25 2.0 0.02 0.15 2000 2.1 0.66 5.0 0.10
0.13* 0.8
Euro IV 2005 1.5 0.46 3.5 0.02 0.5 Euro V 2008 1.5 0.46 2.0 0.02 0.5
Source: http://www.dieselnet.com/standards/eu/hd.html
Few studies have been done regarding the contribution biodiesel could give to improve the air quality of large cities in Brazil. EPA (2002) shows that the emissions reduction is directly proportional to the share of biodiesel in the mineral diesel. Comparing 100% biodiesel with American mineral diesel, EPA (2002) shows that the particulates and Carbon Monoxide (CO) emissions decreases by 50%, while hydrocarbon (HC) emissions reduces by 70%. Since biodiesel has no sulfur, no SOx emissions are created. However, NOx emissions increase by 10%. Petrobio (2006) has estimated the potential benefits for using B5 diesel in Brazilian large cities. This study found significant reduction in emissions and estimated the social avoided cost at US$75 million.
Although it is clear that biodiesel has an important potential for improving the air quality in large cities in Brazil, studies available on this subject are still preliminary.
2.3 – Brazil as a World Class Biodiesel's Exporter
Brazilian government and agents involved with biodiesel have announced a firm intention to develop production capacity oriented to the international market. As mentioned before, projects under implementation have already sufficient production capacity to comply with B2 mandatory standards. If biodiesel attractiveness remains at current level, it is reasonable to accept that current pace of projects development will be maintained. Currently, there are about 60 projects announced but not yet under implementation. The average plant scale of these projects is 50,000 tons per year. Therefore, these projects could add a capacity of 3 billion liters to the current production capacity levels. This capacity exceeds the B5 standards requirements (2.4 billion liters).
E. De Almeida, J. Bomtempo et al. 84
It is important to mention that the additional investment required for creating an important biodiesel production capacity in Brazil can be considered modest. Brazil already is an important producer of soybean. In addition, there is significant available capacity for vegetal oil production in Brazil. Biodiesel plants costs are lower than ethanol plants, especially true in the case of non-integrated biodiesel plant (excluding vegetal oil production unit). As mentioned before, the total investment in the 60 projects announced in Brazil was estimated at about US$800 million. Therefore, if current biodiesel competitiveness is maintained, Biodiesel production capacity investments will face no financing obstacles to advance.
As we have shown in section 2.1, the attractiveness of biodiesel production in Brazil will depend basically on how vegetal oil cost will evolve. In order to make the vegetal oil production economic sustainable, investments in the feedstock production should be of an order of magnitude of the biodiesel plants. At this point, it is not clear how biomass production investments will evolve, and what impacts on productivity it will have.
As mentioned before, Brazil still has about 90 million hectares unused farmland not covered with forest. In addition, about 200 million hectares are dedicated to cattle raising with small average productivity rates. We can conclude that there is no major restriction for expanding farmland area for biodiesel production. Based on this assumption, we have built the following scenario: Brazil would dedicate the same area currently dedicated to sugarcane (6 million hectares) to new types of biodiesel feedstocks (castor, palm, sunflower, jatropha) at equal area distribution (1.5 million hectares each). In addition, about 20% of current soybean production would be dedicated to biodiesel34. Based on these assumptions Brazilian biodiesel production could reach about 11 billion liters per year (see table 17).
Table 17 - Brazilian Biodiesel Production – A Speculative Scenario
Area (million hectares)
Biodiesel Productivity
(l/ha)
Annual production
(million liters ) Castor beans 1.5 556 834 Palmtree 1.5 3,600 5,400 Jatropha 1.5 360 540 Sunflower 1.5 937 1,405 Soybean 4.4 662 2,913 Total 10.4 11,082
Source: Own Elaboration
34 The speculative scenario considers that only a small part of soybean production could be
economically dedicated to biodiesel. The increase in the soybean demand by biodiesel plants would inevitably affect soybean price in the international market. Therefore, we assumed a scenario for soybean consumption equivalent to 20% of current demand.

85 E. De Almeida, J. Bomtempo et al.
Based on quite reasonable production assumptions, we can conclude that Brazil could produce biodiesel enough to supply current domestic demand, even with a B10 blend (about 5 billion liters), and export expressive amounts of biodiesel (about 5 billion liters). It is clear that Brazil has a potential for exporting significant amounts of Biodiesel within 5 years.
The mandatory biofuels standards in Europe represent an important market potential for Brazil. Nevertheless, Brazilian biodiesel exports will depend on how production costs will evolve. Without increasing alternative feedstock production in Brazil (palm oil, Jatropha and castor), an increasing international demand for soybean oil could jeopardize the Brazilian biodiesel economics. In addition, significant trade obstacles should be faced. Biodiesel specification is not yet on place for allowing the development of international market. Similarly to ethanol, biodiesel programs emphasize domestic production and have not been conceived to allow biodiesel consumption based on imports.

E. De Almeida, J. Bomtempo et al. 86
4 – REFERENCES
ANDRESS, D. (2002). Ethanol Energy Balances. Office of Biomass Programs,
Energy Efficiency and Renewable Energy, U.S. Department of Energy.
AZEVEDO, A. MONTEIRO, J.(2002) Análise dos Impactos Ambientais da
Atividade Agropecuária no Cerrado e suas inter-relações com os
Recursos Hídricos na Região do Pantanal. WWF. Available at:
http://assets.wwf.org.br/downloads/wwf_brasil_impactos_atividade_agro
pecuaria_cerrado_pantanal.pdf
BALLERINI, D. ALAZARD-TOUX. N. (2006) Les Biocarburants Etats des
lieux, perspectives et enjeux du developpement. Editions Technip. Paris.
BARRIE, Williams (2001). "Biodiesel in the EU - how to maximize the
potential", 1st World Biofuels Conf, Paris, 3 april, 2001
BARROS G., SILVA A., PONCHIO L., ALVES L., OSAKI M., CENAMO M.
(2006), “Custos de produção do biodiesel no Brasil”, estudo realizado
pelo CEPEA/ESALQ/USP, Revista de Política Agrícola, 15, 3, 36-50.
BEAR STEARNS (2006). Ethanol 201: Beyond Corn. Equity Research. New
York. www.bearstearns.com
BOCKEY, Dieter (2002). Biodiesel production and marketing in Germany,
UFOP.
C&T Brazil (2002) “The Cost of Ethanol”,
http://www.mct.gov.br/clima/ingles/comunic_old/alcohol4.htm
CARVALHO, Luiz Carlos Correia. "Competitividade do Etanol Brasileiro" .
Seminário: Etanol: potencial gerador de divisas e emprego BNDES,
25/08/2003. Rio de Janeiro. Available at http://www.bndes.gov.br .
CITYGROUP (2006). Global overview of the biofuels value chains.
30 November 2006, 144 pages.

87 E. De Almeida, J. Bomtempo et al.
COSTA, R. et. All. (2005). The Energy Balance in the Production of Palm Oil
Biodiesel – Two Case Studies: Brazil and Colômbia. Available at
www.svebio.se/attachments/33/295.pdf
DE OLIVEIRA, M. ; VAUGHAN, B.; RYKIEL Jr, E.. Ethanol as a Fuel: Energy,
Carbon Dioxide Balances and Ecological Footprint. In Bioscience, Vol 55
No 7, July 2005
DORES, E. G. C., FREIRE, E (2001). Contaminação do ambiente aquático
por pesticidas. Estudo de Caso: Águas usadas para consumo humano
em Primavera do leste, Mato Grosso – Análise Preliminar. Revista
Química Nova. V. 24, n. 1, 2001, p 27-36.
ECN, (2006). "Neste Oil cleans up in biofuels". European Chemical News,
15 May.
EPA (2002). A Comprehensive Analysis of Biodiesel Impacts on Exhaust
Emissions. Draft Technical Reports 420-P-01-001 - Oct.
EPE (2006). Plano Nacional de Energia 2030. Estudos da Oferta – Recursos
Energéticos: Combustíveis Líquidos. Empresa de Pesquisa Energética,
Ministério de Minas e Energia. Available at
http://www.epe.gov.br/Lists/Estudos/Attachments/12/PNE-2030-
CombustiveisLiquidos.pdf
F.O.LICHTS (2004), World Ethanol & Biofuels Report .
FARINA, Q. and ZYLBERSZTAJN, D. (1998). "Competitividade no
Agrobusiness Brasileiro: Sistema Agroindustrial da Cana-de-açúcar
Sistema Agroindustrial da Soja". Research Report IPEA, PENSA, USP.
FARREL, A. PLEVIN, R. TURNER, B. JONES, A.. O’HARE, M. KAMMEN, D.
(2006) Ethanol can contribute to Energy and Environmental Goals.
Science 311, 506 . Available at: www.science mag.org
FONSECA. M. A. N. “Pesquisa de óleo vegetal como combustível em
motores diesel Programa OVEG I”, XIII Encontros dos Centros de Apoio
Tecnológico (CAT), Secretaria de Tecnologia Industrial (STI). Brasília,
1985.
FONSECA. M. A. N. (1985) “Pesquisa de óleo vegetal como combustível em
motores diesel Programa OVEG I”, XIII Encontros dos Centros de Apoio
Tecnológico (CAT), Secretaria de Tecnologia Industrial (STI). Brasília,
1985.
E. De Almeida, J. Bomtempo et al. 88
GOLDEMBERG, J et all. (2004). "Ethanol learning curve—the Brazilian
experience". Biomass and Bioenergy, n. 26, 301 – 304.
GOLDEMBERG, J. (1982). Balanço Energético da Produção de Combustíveis
de Óleos Vegetais. Instituto de Física, USP.
GOLDEMBERG, J. (1996). "The evolution of ethanol costs in Brazil". Energy
Policy. Vol. 24, No. 12, pp. 1127-1128.
GRATH, D. DIAZ, MDC (2006). Soja na Amazônia: impactos ambientais e
estratégias de mitigação. Revista Ciência e Ambiente. Available at:
http://www.whrc.org/resources/published_literature/pdf/McGrathetalCien
caAmbien.06.pdf
GUERREIRO, A (2006). "The technological dimension of biofuels".
EPE/Ministry of Mines and Energy. Powerpoint presentation at the
Seminar Expert Meeting on Participation of Developing Countries in New
Dynamic Sectors of World Trade: Review of the Energy Sector Adjusting
to the New Energy Economy. Geneve, UNCTAD.
HENNIGES, O. and ZEDDIES, J. (2005). World Ethanol & Biofuels Report .
Economics Of Biothanol Production in the Asia-Pacific: Australia –
Thailand – China. F.O.LICHTS.
HENNIGES, O. and ZEDDIES, J. (2006). Bioenergy and Agriculture:
Promises and Challenges. International Food Policy Research Institute.
December. Available at
http://www.ifpri.org/2020/focus/focus14/focus14_09.pdf
HIS, Stéphane (2006). Biocarburants : exemples de développement dans le
monde. Institut Français du Petrole. Powerpoint presentation.
IEA (2004). Biofuels for Transport: An International Perspective. Paris.
KOJIMA, M, and JOHNSON T. (2005). "Potential for Biofuels for Transport in
Developing Countries". Energy Sector Management Assistance
Programme (ESMAP). JOINT UNDP / WORLD BANK
KOJIMA, M, and JOHNSON T. (2006). "Potential for Biofuels for Transport in
Developing Countries". ESMAP Knowledge Exchange Series, n.4.
LA ROVERE, Emilio (2004). The Brazilian Ethanol Program. Powerpoint
presentation at International Conference for Renewable Energies, Bonn,
June 1-4.

89 E. De Almeida, J. Bomtempo et al.
LA ROVERE, Emilio (2006). "Aligning Climate Change and Sustainable
Development Objectives in Brazil" Workshop Developing Visions for a
Low a Low-Carbon Society through Sustainable Development. Tokyo,
14th –16th June,
MACEDO, I. C. NOGUEIRA, L. A. H (2005). "Biocombustíveis". Cadernos
NAE, n. 2. Núcleo de Assuntos Estratégicos da Presidência da
República. Brasília.
MACEDO, Isaias (2002). Energia da Cana no Brasil. Unicamp – São Paulo,
2002. Available at :
http://www.cgu.rei.unicamp.br/energia2020/papers/paper_Macedo.pdf
MACEDO, Isaias at al. (2004). Greenhouse Gas Emissions in the production
and use of ethanol in Brazil: present situation (2002). Secretaria de
Meio-Ambiente do Estado de São Paulo.
MARTINS, H. and TEIXEIRA, L. C. (1985). “Balanço Energético da Produção
de Óleos Vegetais Transesterificados”. III Congresso Brasileiro de
Energia. Rio de Janeiro.
MOREIRA, Roberto (2005). "Update of the Production and Use of Ethanol as
a Fuel for Transport in Brazil". Powerpoint presentation at the seminar
"Barriers and Opportunities for Biomass-Based Energy Generation in
Latin America and the Caribbean". Havana, Cuba.
MORRIS, D. (2005) The Carbohydrate Economy, Biofuels and the Net
Energy Debate. Institute for Local Self-Reliance, August 2005. available
at: http://www.newrules.org/agri/netenergyresponse.pdf
MORTON, D. at alli (2007). Cropland expansion changes deforestation
dynamics in the southern Brazilian Amazon. PNAS Early Edition.
Available at Available at www.amazonia.org.br
NASTARI, P. (2006). "Tendências Mundiais para o Uso de Etanol".
Presentation at the Seminar 1975 – 2005 / Etanol Combustível: Balanço
e Perspectivas. Campinas, Brazil.
NASTARI, P. (2006). O Setor Brasileiro de Cana-de-açúcar Perspectivas de
Crescimento. www.datagro.com.
NEPSTAD, D. at all. (2006). Globalização das Industrias de Soja e Gado na
Amazônia: Opportunidades para Conservação. Available at
www.amazonia.org.br

E. De Almeida, J. Bomtempo et al. 90
NETO, André Elia. (2003) "Geração de Energia por Biomassa: Bagasso e
Palha de Cana – Impactos Atmosféricos e Balanço de Carbono". Projeto
BRA/96/G31.
NETO, J.A. et.al, (2004). Energy Balance of Ester Methyl and Ethyl of castor oil plant oil. I Brazilian Congress of Castor Oil Plant, Campina
Grande- Brasil 2004.
NIPE-UNICAMP / CTC-Copersucar (2005) . Available at
http://www.senternovem.nl/mmfiles/135550_tcm24-124345.pdf
NREL (1998). “Life cycle inventory of Biodiesel and Petroleum Diesel for Use
in an Urban Bus”. US Dep of Agriculture and US Dep of Energy.
PERES FILHO, A (2003). Estudo revela efeitos do uso inadequado do solo.
Revista da Unicamp, August. Available at:
http://www.unicamp.br/unicamp/unicamp_hoje/ju/agosto2003/ju226pg11.
html
PERES, J. R. and FREITAS JUNIOR, E. (2003). "Possibilidades de expansão
da fronteira agrícola e inovações tecnológicas". Seminário: Etanol:
potencial gerador de divisas e emprego BNDES, 25/08/2003. Rio de
janeiro. Available at http://www.bndes.gov.br.
PETROBIO (2006) Biodiesel: Aspectos Atuais e Viabilidade de Aplicação.
Available at www.petrobio.com.br
PIMENTEL D. (2003) Ethanol fuels: Energy balance, economics and
environmental impacts are negative.Natural Resources Research 12:
127–134.
PNPB (Programa nacional de produção e uso de biodiesel), disponível em
www.biodiesel.gov.br, 2007
RODRIGUES, Antonio de Pádua (2005). Etanol combustível: Balanço e
Perspectivas. Única. Powerpoint presentation.
SCOPINHO, R. et all. (1999). "Novas tecnologias e saúdo do trabalhador: a
mecanização do corte da cana de açúcar". Cadernos de Saúde Publica
do Rio de Janeiro. Vol 15: 147 – 161.
SCORZA JUNIOR, R. Receituários Agronômicos: Uma importante ferramenta
na análise de risco de contaminação de recursos hídricos. Available at:
http://www.cpao.embrapa.br/Noticias/artigos/artigo3.html

91 E. De Almeida, J. Bomtempo et al.
SHAPOURI, H., DUFFIELD, J.A. and WANG, M., (2002), “The Energy
Balance of Corn Ethanol: An Update”, United States Department of
Agriculture (USDA), Agricultural Economic Report No. 813.
SINDICON (2006) Notícias Sindicom. Ano 2. No 7 December 2006. Available
at: www.sindicom.com.br
SOUTO, João Jose Nora (2006). "Brazil Biofuels Experience". Ministry of
Mines and Energy. Powerpoint presentation, available at www.c-
caa.org/pdf/Brazil%20Presentation.pdf
TECBIO (2006), apresentação em seminário Investimentos em Biodiesel,
realizado no BNDES, em 16/03/2006, disponível em www.bndes.gov.br
TOTTI P., Biodiesel de denê, uma nova esperança, Valor Econômico,
12/04/2007
UNICAMP (2006). “A Expansão do Proalcool como Programa de
Desenvolvimento Nacional”. Powerpoint presentation at Ethanol
Seminar in BNDES.
VALOR ECONOMICO (2007). Nova empresa criada em Oslo investirá US$
340 milhoes em duas usinas. March,22, pg. B22.
VEIGA FILHO, A. A. (2006) Comentários sobre aspectos técnicos e políticos
das queimadas de cana.. Available at:
<http://www.infobibos.com/artigos/queimadas_cana/index.htm>. Acesso
em: 1/2/2007.
WALTER, A. (2007). “Sustainability of Brazilian bio-ethanol”. Paper presented
at the seminar : LA-EU Biofuels Research Workshop, Campinas, Brazil
April, 23-25, 2007.
WEHRMANN M., VIANNA J., DUARTE L., “Biodiesel de soja: política
energética, contribuição das oleaginosas e sustentabilidade”, III
Encontro da Associação Nacional de Pós-graduação e Pesquisa em
Ambiente e Sociedade, Brasília, 23-26/06/2006.