discussion paper series · zimmerman, 2006). levie (2007) found that perceived disadvantage in the...
TRANSCRIPT
Discussion Paper Series
Social capital, entrepreneurship and living standards:
differences between immigrants and the native born
CPD 07/16
Centre for Research and Analysis of Migration
Department of Economics, University College London
Drayton House, 30 Gordon Street, London WC1H 0AX
Matthew Roskruge, Jacques Poot and Laura King
www.cream-migration.org
1
Social capital, entrepreneurship and living standards:differences between immigrants and the native born1
Matthew Roskruge, Jacques Poot and Laura KingNational Institute of Demographic and Economic Analysis (NIDEA), University of Waikato, New Zealand
Abstract
Both migrant entrepreneurship and social capital are topics which have attracted a great deal of
attention. However, relatively little econometric analysis has been done on their interrelationship. In
this paper we first consider the relationship between social capital and the prevalence of
entrepreneurship. We also investigate the relationship between social capital and the living standards
of entrepreneurs. In both cases we ask whether these interrelationships differ between migrants and
comparable native-born people. We utilize unit record data from the pooled 2008, 2010 and 2012
New Zealand General Social Surveys (NZGSS). The combined sample consists of 15,541 individuals who
are in the labour force. Entrepreneurs are defined as those in the sample who obtained income from
self-employment or from owning a business. Social capital is proxied by responses to questions on
social networks, volunteering and sense of community. The economic standard of living is measured
by either personal income or by an Economic Living Standards Index (ELSI) score developed by the
New Zealand Ministry of Social Development. We find significant differences between migrants and
the native born in terms of the attributes of social capital that are correlated with entrepreneurship,
but volunteering matters equally for both groups. The positive association between social capital
attributes and ELSI scores is similar between migrant and natives. Social capital contributes little to
explaining incomes of either group.
JEL Code: F22, J15, L26, Z13
Keywords: migration, social capital, entrepreneurship, income, standard of living
1 April 2016
1 Address for correspondence: Dr Matthew Roskruge, National Institute of Demographic and EconomicAnalysis (NIDEA), University of Waikato, Private Bag 3105, Hamilton, New Zealand 3240. Email:[email protected] This paper is forthcoming as a chapter in the Edward Elgar Handbook on Social Capitaland Regional Development, edited by Hans Westlund and Johan P. Larsson. This study has been supported bythe 2007-2012 Integration of Immigrants Programme (IIP), funded by Foundation for Research, Science andTechnology grant MAUX0605 and the 2014-2020 Capturing the Diversity Dividend of Aotearoa New Zealand(CaDDANZ) programme, funded by Ministry of Business Innovation and Employment grant UOWX1404. Wethank Robert Tanton, other participants at the 61st North American Meetings of the Regional ScienceAssociation International in Washington DC, November 2014, and three anonymous referees for their helpfulcomments. Access to the data used in this study was provided by Statistics New Zealand under conditionsdesigned to keep individual information secure in accordance with requirements of the Statistics Act 1975. Theviews, opinions, findings and conclusions are strictly those of the authors and do not necessarily represent anofficial view of Statistics New Zealand or of the organisations at which the authors are employed.

2
1. Introduction
The topics of migrant entrepreneurship and social capital have been widely discussed in the academic
literature, yet there remains a lack of empirical analysis of the interrelationship between these two topics.
Ethnic social capital, i.e. linkages between actors facilitated in part by a common ethnicity, can be an
economic resource for ethnic entrepreneurship (Tolciu, 2011; Sequeira and Rasheed, 2006). Hence in this
age of ethnically diverse cross-border migration flows we need a better understanding of the potentially
different ways in which social capital can enhance entrepreneurial success among migrants and non-
migrants (Galbraith et al., 2007).
In this paper, we use data from New Zealand to test for differences between the native born and
immigrants in the ways in which social capital is associated with entrepreneurship. Secondly, for those
who are entrepreneurs, we assess the extent to which social capital affects the benefits of
entrepreneurship and, again, whether there are differences between migrants and the native born. We
measure these benefits in terms of an index of living standards and in terms of personal income.
The empirical data for this research consist of the merged 2008, 2010 and 2012 Confidentialised
Unit Record Files (CURFs) of the New Zealand General Social Survey (NZGSS). The NZGSS has not been
specifically designed for studying entrepreneurship, but has the advantage of providing many
characteristics of individuals that may be associated with entrepreneurship.
Our results show a positive partial correlation between some proxies of social capital and the
prevalence of entrepreneurship in the community. Those who do volunteer work are significantly more
likely to be entrepreneurs, and this applies to both the native born and immigrants. In the absence of
suitable instruments, we cannot assess explicitly whether this partial correlation is causal. Nonetheless,
the evidence is supportive of the idea that volunteering is an activity positively associated with
entrepreneurship. This is in line with the finding of Westlund (2011) that entrepreneurship is
multidimensional and that the different types of entrepreneurship may reinforce each other. In the
present context, earning income from self-employment or from running a business may be referred to as
economic entrepreneurship, while volunteering is a form of social entrepreneurship. However, there is
no evidence in our data that volunteering “pays off” to entrepreneurs in a pecuniary sense. The living
standards and incomes of entrepreneurs who engage in volunteering are not higher than those of
entrepreneurs who do not. Instead, strong networks do appear to pay off in the sense that entrepreneurs
who do not feel isolated from others have higher living standards and income.
With respect to comparing immigrants and the native born, we find some significant differences
in terms of the attributes of social capital that determine self-employment and business ownership.
Generally, an immigrant’s propensity to be an entrepreneur increases with years lived in New Zealand.
Ethnicity is also an important determinant of entrepreneurship. Ceteris paribus, people who identify as
3
Māori or Pacific Islander are less likely to be entrepreneurs.2 Additionally, the economic outcomes for
immigrant entrepreneurs who identify as of Pacific Island and/or Asian ethnicity are worse than those of
New Zealand born entrepreneurs of European ethnicity. The impact of social capital on Economic Living
Standards Index (ELSI) scores is very similar between migrant and natives. Social capital contributes little
to explaining incomes of either group.
We begin with a short review of the recent literature on linkages between social capital,
entrepreneurship and immigration. Next, the data and methodology section provides information about
the NZGSS and the econometric techniques utilised. The key results from various regression models
examining the prevalence and outcomes of entrepreneurship, and the role of social capital and migrant
status in these models, are given in Section 4. The final section reflects on these empirical findings, draws
conclusions and suggests areas of future research.
2. Literature Review
In recent decades the world has witnessed rapid growth in the volume and complexity of international
migration flows. At the beginning of 2016, an estimated 250 million people (3.4 percent in the world
population) were living abroad. There is wide consensus in the literature that migrants are more likely to
be entrepreneurs than their native-born counterparts (Fairlie and Lofstrom, 2015; OECD, 2010; Pendakur
and Mata, 1999) and that social capital influences how successful migrant entrepreneurs are (Sequeira
and Rasheed, 2006). Some of the mechanisms by which social capital can contribute to the success of
entrepreneurship have been explored by Westlund and Gawell (2012). They discuss how social capital
facilitates the mobilization of resources through the information and resources held within a social
network, thereby assisting in the operationalization of exploiting business opportunities. Social capital
contributes not only to the success of entrepreneurs but can also explain, along with attitudes to risk and
entrepreneurial capital, why some people choose to undertake new business ventures while others do
not (De Carolis and Saparito, 2006).
Sahin and Ilhan-Nas (2011) split the determinants of ethnic entrepreneurship into two categories:
push factors and pull factors. Migrants may be pushed into entrepreneurship due to difficulties in finding
suitable jobs, for example due to discrimination in the labour market. This is also referred to as ‘necessity
entrepreneurship’ (e.g., Reynolds et al., 2002; Sternberg et al., 2006; Block and Wagner, 2010). Self-
employment may be seen in this case as the only option for socioeconomic improvement (Constant and
Zimmerman, 2006). Levie (2007) found that perceived disadvantage in the UK labour market was one of
2 In the New Zealand population census, respondents can state as many ethnicities as they feel they belong to.About 14 percent of the 2013 census population stated Māori ethnicity and 7.6 percent stated one of the Pacific Island ethnicities.
4
the main reasons for migrants’ entry into entrepreneurship there. Migrants are more likely to report
feeling discriminated in the local labour market when they have insufficient language skills, unrecognized
qualifications and a lack of knowledge about how the host labour market operates. This is supported in
the New Zealand context by Daldy et al. (2013) who found that workplace discrimination is significantly
higher among foreign-born workers than New Zealand-born workers. Discrimination may motivate the
former to start their own businesses, as they may feel that discrimination is a barrier to finding suitable
employment that fits their skills and qualifications (Levie, 2007).
In contrast, pull factors contributing to immigrant entrepreneurship are those that make self-
employment appear more attractive than paid employment, such as the potential to obtain a higher
income (particularly in the long run), alongside greater independence and a more flexible work schedule
(e.g., Shinnar and Young, 2008). Basu and Goswami (1999) discovered that the higher social standing in
the community that entrepreneurs often receive may also act as a significant pull factor. Pull factors are
closely linked to ‘opportunity’ entrepreneurship (Reynolds et al., 2002; Sternberg et al., 2006; Block and
Wagner, 2010). Opportunity entrepreneurship reflects new business ventures which arise from the
identification of an opportunity to be exploited, for example where a gap in an import market is identified.
Hence, in general, necessity entrepreneurship is largely driven by push factors while opportunity
entrepreneurship is largely driven by pull factors.
Further factors that boost migrant entrepreneurship are: (1) knowing someone who has
successfully run a business and can act as a role model (a form of social capital); (2) a perception of new
market opportunities (opportunistic entrepreneurship); (3) a positive attitude toward new business
activity; and (4) easy acquisition of resources for the new business venture (which may in part be
facilitated by social capital). Additionally, migrants may view the world differently and see new market
opportunities that locals have missed, owing to their unique cultural backgrounds and skills developed in
another country (Levie, 2007).
Migrants may also be less risk averse and this attitude to risk taking may be transferred to a host
country which offers a new environment and a chance to start afresh. Entrepreneurship is a form of
experimentation that has a U-shaped density function of returns: a great chance of failure, low average
returns and a chance to make a very large return (Kerr et al., 2014). Hence we would expect the incidence
of entrepreneurship to be somewhat greater among migrants than among the native born given that
migrants are often less risk averse, more optimistic and also attach utility to greater freedom and
independence in the host country than in the country they left behind. All these migrant characteristics
coincide with the attributes that define entrepreneurship (e.g., Åstebro et al., 2014). Acs and Szerb (2007)
find that a higher propensity for migrants to engage in entrepreneurship remains once basic demographic
variables and differences in opportunity perception, risk propensity and experience are controlled for.

5
An important factor influencing migrant entrepreneurship is the ability to acquire the necessary
resources to undertake a new venture. If potential migrant entrepreneurs are unable to access funds
from their family or members of their ethnic group, then they will have to rely on banks and other lending
institutions (Ibrahim and Galt, 2011). Compared with native born entrepreneurs, immigrants are at a
disadvantage in financial markets because they may be unfamiliar with how business is done in the host
country and the regulations and processes involved for starting a new business. They may also face
discrimination in accessing finance. These barriers are especially pronounced for new immigrants who
usually have little collateral to offer formal financial institutions and who have not yet established the
networks within their ethnic group to access pooled ethnic resources. However, there is no consensus
that ethnicity is an important determinant of migrant entrepreneurship. The impact of ethnicity on
entrepreneurship is likely to depend on the ethnic composition of the migrant population and on host
country institutional factors. For example, Ohlsson et al. (2012) find that ethnic context and the economic
environment play only a minor role in explaining differences in self-employment between migrants and
the native born in Sweden.
Necessity and opportunity entrepreneurship are likely to interact with migrant skills. Low-skilled
migrants may have no alternative but to start a business because of a lack of other employment
opportunities (necessity entrepreneurship). Ventures run by migrants with few skills are often small due
to their limited access to financial assets. However, such ventures may provide low cost services to the
native population. In turn, this can enhance economic growth through second order effects (OECD, 2010).
Small businesses can collectively generate substantial economic activity, especially in areas that may
otherwise be experiencing demographic or economic decline.
In contrast, high-skilled migrants are more likely to create firms that are somewhat larger and
can become high-growth ventures, in part because they have access to sufficient resources to exploit
entrepreneurship opportunities. This may result in overall job growth and increased innovation (OECD,
2010). Baycan-Levent and Nijkamp (2009) argue that the entrepreneurial behaviour of numerous migrant
groups has led to a new phenomenon known as ‘migrant entrepreneurship’ or ‘ethnic entrepreneurship’
and that this has become one of the driving forces for economic growth.
For both migrants and the native born, entrepreneurship can be affected by social capital. Social
capital is the stock of a person’s linkages with other actors along which information flows and exchanges
are made (e.g., Roskruge, 2013). The information obtained through social networks can be used to
improve a person’s standard of living and productivity (Roskruge et al, 2012). While this creates an
incentive for an individual to invest in social capital, Putnam (2007) argues that social capital is also a
public good that generates positive externalities for others. Casson and Della (2007) argue that social
6
capital has a much wider impact than most scholars appreciate, with one such impact being the
facilitation of entrepreneurship.
It is important to distinguish between productive social capital, which benefits business directly,
versus the social capital reflected in civil society and social cohesion (e.g., Putnam, 1995), which benefits
business indirectly. Business-focused social capital, such as the proxies used in Westlund et al. (2014), is
likely to provide a clearer impetus to become an entrepreneur.
Several studies have examined how the impact of social capital on entrepreneurship differs
across migrant groups. Turkina and Thai (2013) find that social factors help to explain the varying
prevalence of entrepreneurship across groups, including migrants. Similarly, Shane and Venkataraman
(2000) suggest that entrepreneurship arises out of “the nexus of two phenomena: the presence of
lucrative opportunities and the presence of enterprising individuals” (p.218). Baron and Markman (2003)
argue that social capital can assist entrepreneurs in accessing vital contacts such as venture capitalists
and potential customers. Additionally, migrant entrepreneurs create their own social capital through
connections with other immigrants and the resources generated from these contacts (Kloosterman and
Rath, 2001).
Social capital has an on-going role, not only in the start-up of a business but also in its early life,
through the ways in which it can assist in managing relations with customers, suppliers and employees
(Westlund and Bolton, 2003). Galbraith et al. (2007) suggest a model of ethnic entrepreneurial conduct
in which the potential entrepreneurs enter “an ethnic community seeking employment, then accumulate
resources and progress into a start-up phase that relies primarily upon intra-ethnic business ties which in
turn matures into a third stage of extra-ethnic market expansion” (pg. 44). However, Woolcock (1998)
suggests there is a thin line between utilizing contacts and relying on the social networks of an ethnic
group, which can be both a hindrance and help. This is further confirmed by Nijkamp et al. (2010) who
identify downsides to migrants relying on social capital, given that it may discourage an outreach strategy
to capture wider markets. Finally, Jones and Ram (2011) argue that entrepreneurs may be unwilling to
build social capital that benefits the community, as they do not want to dilute their control and market
position by sharing resources and information.
There are two different types of social capital used by migrants that may be of benefit to migrants
to a host country: bonding and bridging (Eraydin et al., 2010). Bonding social capital is the term used to
describe social capital which is formed within groups of similar people, e.g., amongst migrants from the
same home country or individuals from the same workplace. In contrast, bridging social capital is the
term used to describe social capital networks which are formed between people of different groups. For
example, where a migrant who is part of a home country network and also a workplace network, that
migrant acts as a bridge between the two networks (Kleinhans et al., 2007). Davidsson and Honig (2003)
7
found that bridging social capital becomes increasingly important as the new business develops. Bridging
social capital provides more resources and wider contacts in different social circles than bonding social
capital. The difference between bridging and bonding social capital is important in our entrepreneurship
context. Depending on the focus of a migrant’s new venture, either bonding or bridging social capital may
be comparatively more important. For example, bonding will be important where the potential market is
within the ethnic community. Bridging is important for national and international markets.
It is unclear whether these literature findings can be applied to New Zealand. At the national level,
Cruickshank and Rolland (2006) argue that New Zealanders are traditionally highly entrepreneurial. New
Zealand is a small island nation of only about 4.5 million people who are highly urbanised and
predominantly living in five large cities (with Auckland alone accounting for one third of the total
population). This ensures that people are relatively closely networked and are likely to have, in network
terms, few degrees of separation from other people. Below the national level, there has been little
econometric research into immigrant entrepreneurship in New Zealand. Wang and Maani (2014) focused
on the location choice of immigrants and the effect this has on ethnic entrepreneurship defined by self-
employment. Their key idea is that the behaviour of individual immigrant entrepreneurs is influenced by
that of others of their ethnic group in the same city, i.e. a kind of spatial lag. They find that this network
effect has a positive impact on the self-employment decision. The benefits of migrant entrepreneurship
in New Zealand were explored by De Bruin (1996) who finds that a community entrepreneurship initiative
can create direct employment opportunities that can offset ethnic unemployment in New Zealand.
We are not aware of other research that has applied social capital concepts to ethnic or migrant
entrepreneurship in the New Zealand context. This may be partially due to difficulties in measuring social
capital and also due to a previous lack of suitable micro-data, with the 1996 World Values Survey one of
the few data sources suitable for such research prior to the 2008 General Social Survey. Roskruge et al.
(2012) argue that it is reasonable to believe that the cultural differences among New Zealand’s population
will lead to ethnic variations in social capital formation. In terms of the type of social capital favoured by
migrants in New Zealand, Roskruge (2013) found that migrants are more prone to engage in bonding
activities while the native born are more likely to participate in bridging activities.
In conclusion, although there are extensive international literatures on immigrant
entrepreneurship and on the use of social capital by entrepreneurs, there appears to be a gap in the
literature regarding the relationship between these two phenomena from an economic perspective.
There also does not appear to be consensus as to whether social capital is beneficial to entrepreneurs.
Hence in this paper we use econometric analysis to investigate how social capital used by migrant
entrepreneurs may differ from how it is used by New Zealand born entrepreneurs. Furthermore, our
research contributes to the debate on social capital by providing empirical evidence as to whether social

8
capital is an influential variable when engaging in new business activity. Finally, we explore to what extent
social capital contributes to a discrepancy in economic standard of living between migrant and native
entrepreneurs.
3. Data and Methodology
We use pooled cross-sectional survey data collected from the 2008, 2010 and 2012 waves of the NZGSS.
The NZGSS is an official survey of social outcomes in New Zealand conducted biennially by Statistics New
Zealand. The survey covers information on areas specifically pertaining to the issues of concern in the
present study: culture and identity, income, type of employment and social connectedness (a measure
of social capital). The 2008, 2010, and 2012 basic NZGSS CURFs include 8,721, 8,550 and 8,462 individual
responses respectively. There are therefore a total of 25,733 observations in the merged dataset.
The NZGSS collects information at the household and at the individual level. Statistics New
Zealand recruits participating households by means of a sample selection method that selects 1,200
primary sampling units (PSU) from the Household Survey Frame, which is then narrowed down to eligible
households from the selected PSUs. Eligible individuals (aged over 15 years) are randomly selected to
complete the individual component of the NZGSS from each of the participating households.
Migrant entrepreneurs are defined as people receiving their primary source of income from
either self-employment or from running their own business with employees. The economic standard of
living of entrepreneurs is measured by the Economic Living Standards Index Short Form (ELSI-SF) and by
their personal income. ELSI-SF is a reduced form of the ELSI index developed by the Ministry of Social
Development. It is a measure of New Zealand living standards that includes non-income indicators of the
material standard of living and hardship (Perry, 2009). Although it is clear that income is strongly
correlated with the standard of living, income is only one factor that affects the ELSI and the ELSI-SF
scores.
ELSI-SF contains various items that are indicative of: a household being able to meet basic needs
or not (e.g., having to postpone medical treatment due to cost); the ability to purchase luxuries (e.g.,
overseas holidays); financial or accommodation problems (cannot pay bills, damp house); the ability to
purchase children’s basic items of consumption (e.g., raincoats) in the case of families with children
(Jensen et al., 2006). To include the respondents' self-perception alongside objective items in the ELSI
scale, three self-rated responses are included. These cover: adequacy of income to meet every day needs,
satisfaction with the standard of living, and the standard of living self-rating. The variables are calibrated
to provide a basis for interpreting the ELSI-SF scale, which yields a score between 0-31 (compared to a
scale of 0-60 for the full length ELSI). The range of scores in the ELSI long-form were broken into seven
9
intervals for ease of use, with severe hardship for level 1 through to very good living standards for level
7 (see Table A1 in the Appendix).
The items that make up the ELSI-SF scale are: (1) ownership restrictions (people cannot afford to
own what they would like) for a range of items from basic items to luxury goods; (2) social participation
restrictions (social activities respondents were prevented from engaging in because of the cost; these
range again from basics such as a haircut to more luxury items such as overseas holidays); and (3)
economising behaviour (when facing financial difficulty people will limit or reduce spending on certain
items; see Jensen et al, 2006).
Restricting the data to a sub-sample of those who are labour force participants results in 15,541
individual observations (60.4 percent of the full sample), with 3,180 (20 percent) of this sample reporting
to obtain income from being self-employed or from running a business. Regressions are done for all
labour force participants, for the native born only, and for migrants only.
All regressions were run in Stata 11.2. For each regression, a standard set of control variables are
included, consisting of: (1) demographic characteristics (age, sex, children, etc.); (2) human capital and
employment variables (highest education qualification, occupation, etc.); (3) migrant and ethnicity
variables (country of birth grouped in global regions, years in New Zealand, etc.); (4) geographical
variables (urban, rural, etc.); and (5) dummy variables signalling the year of the survey.3
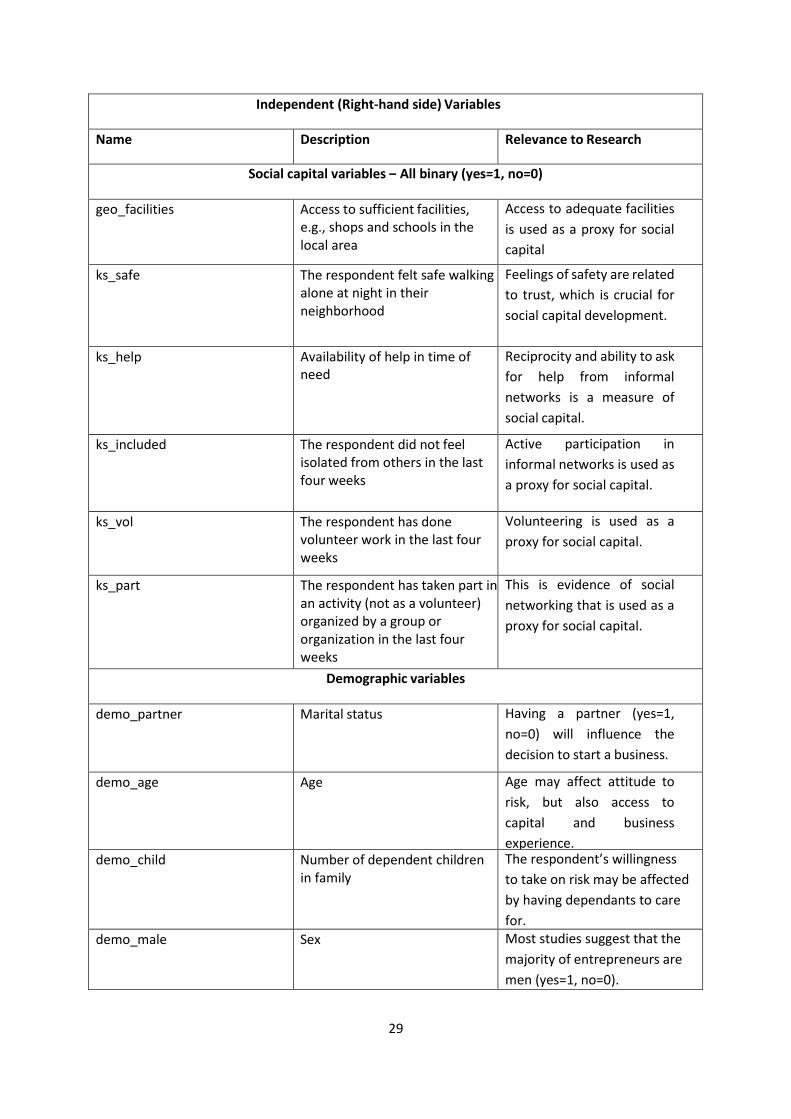
To measure social capital, five proxies are selected. They are: (1) access to community facilities;
(2) feelings of safety within the community; (3) whether an individual can get help from others in times
of need; (4) feelings of social inclusion rather than isolation; (5) active volunteer work; and (6)
participation in a community activity. One drawback of these measures is that they proxy for social capital
in a very broad social cohesion / civil society sense, rather than having a specific relationship to business
activity. While the literature review identified a theoretical relationship between civil measures of social
capital and entrepreneurship, we expect the strength of these relationships to be weaker than what
might be observed with business-focused social capital measures. Regrettably the latter measures are
not available in our data.
Our first regression uses our full range of independent variables to capture the characteristics
that influence whether the respondent is an entrepreneur. Given that the dependent variable is binary
in nature, a standard logit regression model is utilised.4 The second set of regressions identifies the extent
to which the determinants of the economic standard of living differ between New Zealand and foreign-
3 See Table A2 in the Appendix for more details.4 Logit and probit nonlinear regression models are the two models that are commonly applied to binary responsesituations, although the linear probability model (LPM, which is linear regression of a variable with outcomesrestricted to 0 and 1) is also popular and quite adequate for large samples and common outcomes. Manski and Xie(1989) remind us that the results from logit models are mostly very similar to those from the corresponding probitmodels. Hence, the decision between logit and probit regression is largely down to the researcher’s preference.

10
born entrepreneurs. As noted earlier, the economic standard of living is proxied by the seven point
classification of ELSI-SF. Given the nature of ELSI-SF, the ordered logit model was used to examine the
determinants of ELSI-SF. Thirdly, personal income gives an alternative indication of the material quality
of life for both migrants and New Zealand born groups. Massari (2005) argues that, since wellbeing is not
directly observable, many studies use data on income as a proxy measure for the standard of living.
Moreover, using income permits comparisons across time and different countries (Courtois, 2009, p. 12).
Hence, the results from this Mincerian earnings regression can easily be compared with both past and
future international studies.
4. Results
4.1 Determinants of entrepreneurship
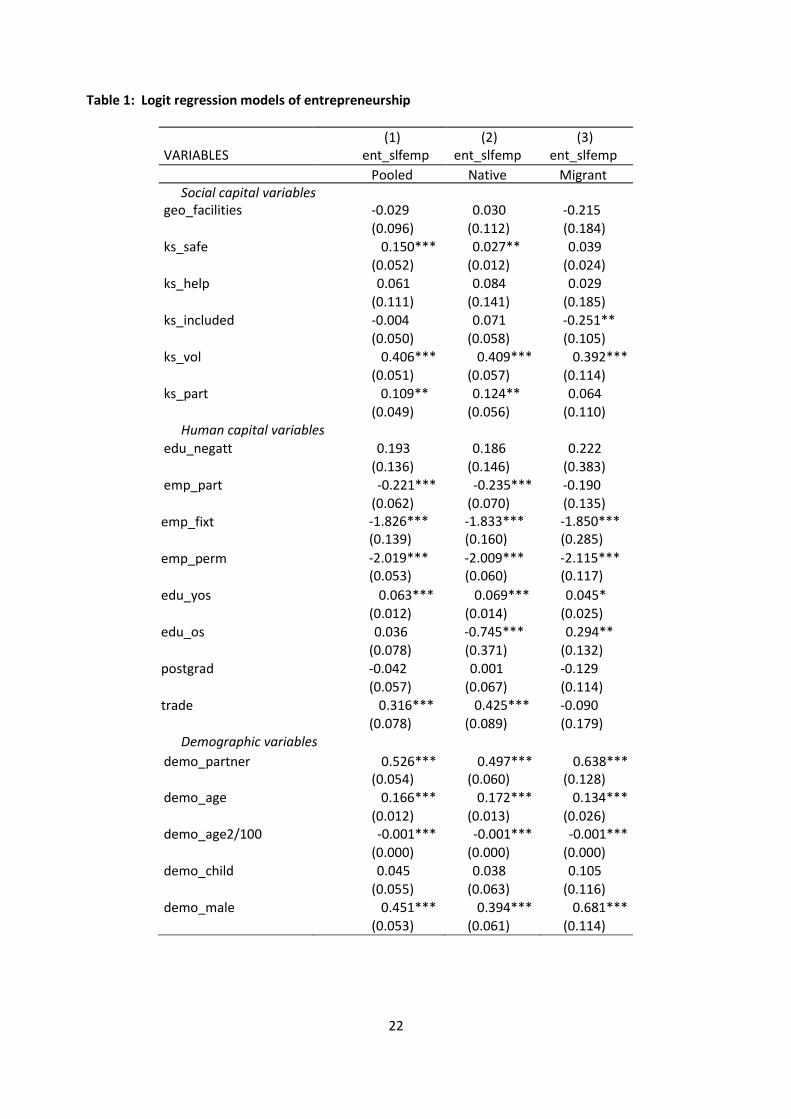
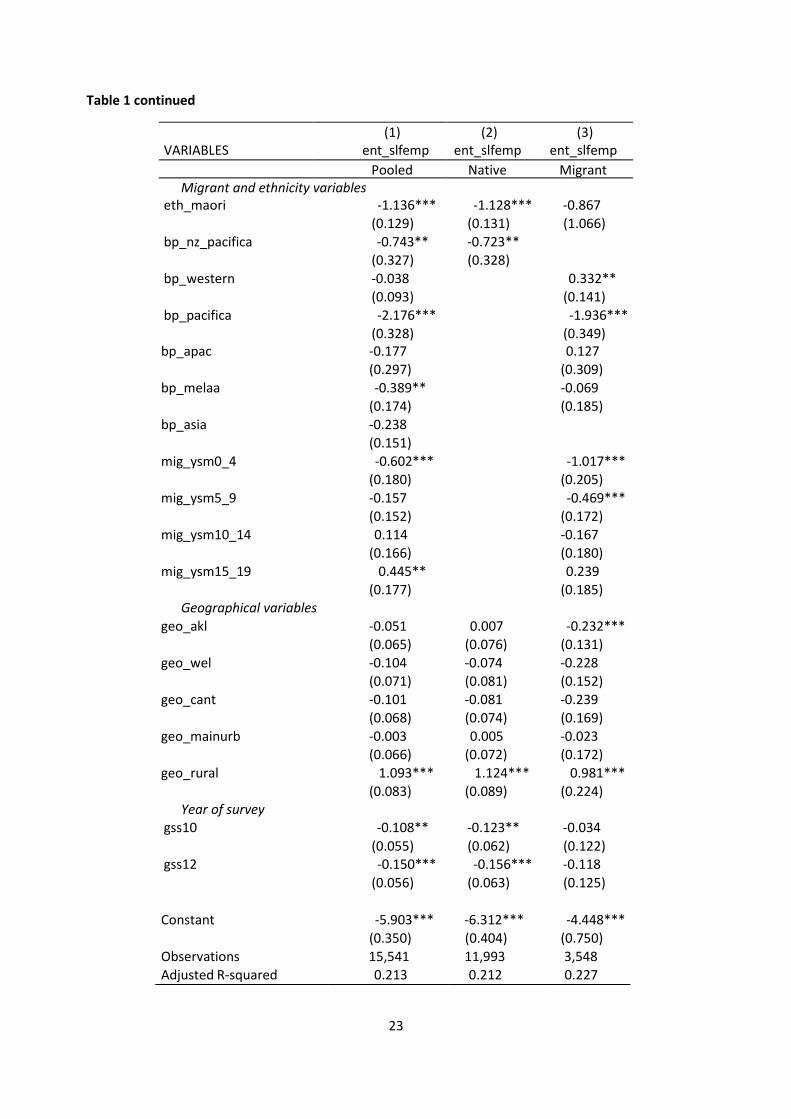
Table 1 reports logit regressions of the prevalence of entrepreneurship as defined as those obtaining
income from self-employment or from running a business. A full description of the variables can be found
in the Appendix. The reported results are robust across a range of specifications.5 The first column uses
a pooled sample of migrants and native-born workers. 6 Columns (2) and (3) test for heterogeneity
between these groups by estimating logit models for the native born and for the foreign born separately.
Table 1 about here
Social capital
The most robust result is a strong partial correlation between the prevalence of entrepreneurship and
volunteering (ks_vol). Those who engage in volunteering work have a higher propensity to be an
entrepreneur. Social networks established by volunteering and the positive reputation from volunteer
work may make entrepreneurs more confident of the likely success of new business ventures in the local
community. Hence economic and social entrepreneurship reinforce each other (Westlund, 2011).
Interestingly, the coefficient is almost identical for the native born and migrants.
There are three social capital factors that operate differently between the migrant and native
born populations: feelings of safety (ks_safe), feeling socially included (ks_included) and taking part in
community and professional activities (ks_part). Feeling safe in their neighbourhood has a statistically
significant and positive effect on survey respondents being entrepreneurs, but this is only the case for
5 Alternative specifications did not yield important additional insights. Details are available from the authors uponrequest.6 All variables are defined for both immigrants and the native born. All “years since migration” variables have thevalue 0 for all native born observations.

11
the native born. Similarly, taking part in a group or organizational activity (not as a volunteer) boosts the
probability of entrepreneurship among the native born. For migrants, respondents who felt included in
the community, i.e. not isolated, the probability of entrepreneurship is lower, possibly because of greater
employment opportunities within their ethnic community reducing the need for necessity
entrepreneurship. Adequate access to local facilities (geo_facilities) and the availability of help in time of
need (ks_help) do not have a statistically significant association with the prevalence of entrepreneurship.
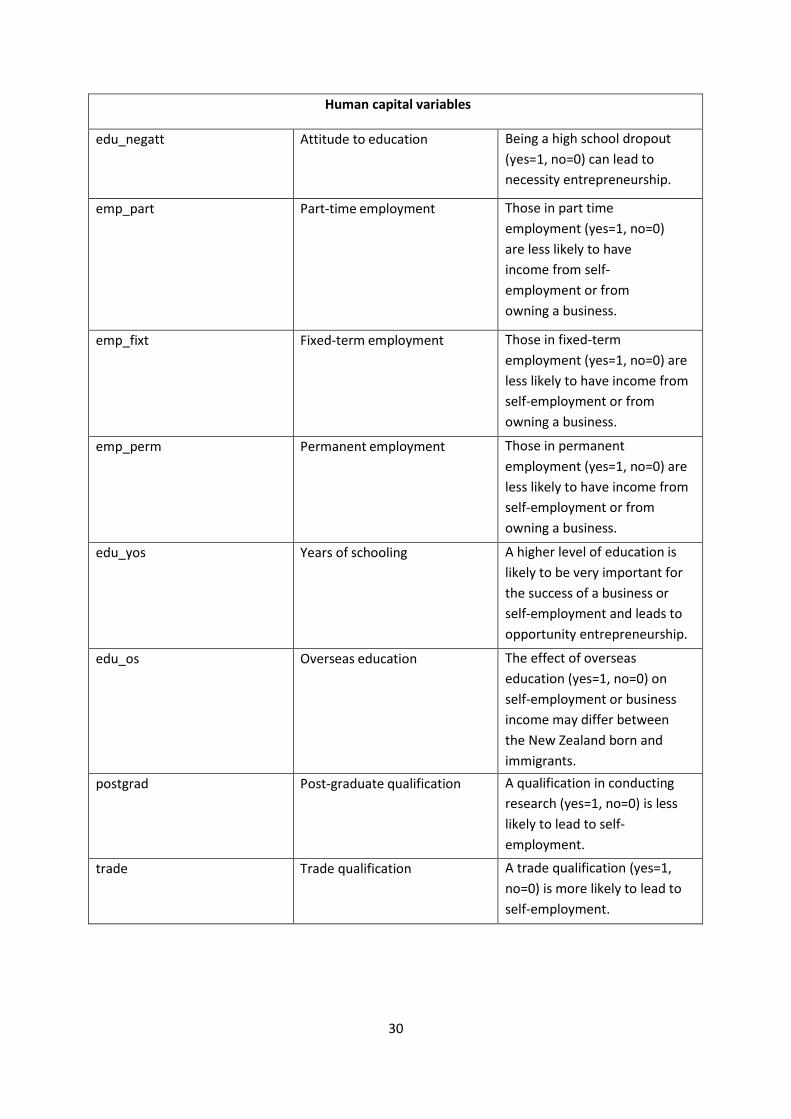
Human capital
Being on fixed-term contracts as employees (emp_fixt), or having a permanent job (emp_perm), is clearly
unlikely to give individuals an opportunity to practice entrepreneurship and therefore strongly reduces
the likelihood of income from self-employment or running a business. This is true for both migrants and
the native born. The years of schooling variable (edu_yos) has a positive association with
entrepreneurship that is significant at the 1 percent level for the native born and at the 10 percent level
for the foreign born. More human capital stimulates opportunity entrepreneurship. However, foreign
education among the New Zealand born (most likely to have been tertiary education) is less likely to lead
to entrepreneurship. This may well be because these workers have a high return to that foreign education
as employees in the New Zealand labour market (Poot and Roskruge, 2013). For immigrants, education
in New Zealand (edu_os=0) lowers the likelihood of immigrants being self-employed or running a business.
Working part-time (emp_part) lowers the likelihood of income from self-employment or running a
business, but the effect is only statistically significant for the native born. In contrast, holding a trade
certificate (trade) is positively related to entrepreneurship among the native born group. A negative
attitude to education (edu_negatt) and the opposite, possessing a postgraduate qualification (postgrad),
are both statistically insignificant variables.
Other variables
All demographic variables are all statistically significant at the 1 percent level for both native and migrant
entrepreneurs, except having dependent children (demo_child). Males (demo_male) are more likely to
be entrepreneurs than females. This gender effect is much stronger among migrants than among the
native born. The age effect is non-linear and concave, indicating that the prevalence of entrepreneurship
increases with age, but at a declining rate. The coefficient of demo_age is smaller for migrants than for
natives. Having a partner (demo_partner) is also an important predictor of entrepreneurship. This
12
variable is more influential for migrants than the native born. This is in line with the international
literature which finds that female partners of ethnic entrepreneurs tend to provide vital, albeit often
unacknowledged, work in the business.
With respect to ethnicity, Table 1 reports that Māori (eth_amori) are less likely to obtain revenue
from self-employment or running a business than non-Māori. This is also true for migrants born in the
Pacific Islands (bp_pacifica) or born in New Zealand, but belonging to the Pacifica ethnic group
(bp_nz_pacifica). Amid the other birthplace variables, only migrants from western countries (bp_western)
have a statistically significant higher probability of entrepreneurship. Migrants born in western cultures
may find it easier to engage in entrepreneurial behaviour in New Zealand than other migrants. Although
New Zealand is culturally diverse, with one quarter of the population foreign born and Māori accounting
for close to one fifth of the New Zealand born, western culture still dominates in business. The coefficients
of the years since migration variables (mig_ysm) show that the prevalence of migrant entrepreneurship
increases with years in New Zealand, up to 10 years of residence (the reference level is 20 years of
residence or more).
The rural variable (geo_rural) has a positive coefficient and is significant at the 1 percent level for
all groups. Respondents from rural areas are relatively more likely to engage in self-employment or run a
business. Most of these rural entrepreneurs are farmers. As migrants tend to be disproportionally located
in cities, the geo_rural coefficient for migrants is smaller than for the New Zealand born. Perhaps
surprisingly, an Auckland location (geo_akl) had a statistically significant – but negative –influence on
migrant entrepreneurship, all else being equal. Migrants’ opportunities for income as paid employees are
much better in New Zealand's largest agglomeration, thereby reducing the need for necessity
entrepreneurship.
4.2 Economic living standards of entrepreneurs
We now turn to ordered logit regressions that suggest determinants of economic living standards (as
measured by ELSI-SF) amongst entrepreneurs. The results are reported in Table 2.
Table 2 about here
Social capital
The social capital variables that relate to the presence of facilities, feelings of safety, access to help and
being included (not feeling isolated) are all significantly and positively related to ELSI-SF at the 1 percent
level. Behavioural social capital factors (volunteering and participation in social activities) are statistically
insignificant. The former social capital variables are indicative of the strength of networks. Stronger
networks are associated with a higher ELSIE-SF score, i.e. a higher living standard. Interestingly, these

13
networks-related social capital variables are of roughly equal importance for both migrant and native-
born entrepreneurs.7
Human capital
Not surprisingly, part-time employment has a significantly negative effect on the economic living
standards for both migrant and native-born entrepreneurs. This can be attributed to such entrepreneurs
not being able to commit to full-time work on their business, which is where they would need to be
spending their time and energy to turn their firm into a major asset. The negative part-time work effect
is much stronger for migrants. Years of schooling exhibit a statistically significant positive effect on living
standards for all groups, which is in line with the huge literature on the positive returns – in terms of
economic living standards – to additional years of education. Entrepreneurs who describe themselves as
doing managerial and professional work have higher living standards than those in other occupations.
This is the case for both migrants and the native born.
Other variables
Having a partner is associated with higher economic living standards, but only for the native born. The
positive effect of a partner on economic living standards is widely recognised in the literature (see e.g.,
Vespa and Painter, 2011). Moreover, there is negative relationship between having children and ELSI-SF
scores of entrepreneurs, with similar coefficient for both migrants and the native born. The inverse
relationship between fertility and the economic standard of living is a fundamental finding in population
economics (e.g., Poot and Siegers, 1992, in the New Zealand context). However, age and gender of the
entrepreneur are mostly not statistically significant in these living standards regressions.
Migrant entrepreneurs born in Pacific countries (bp_pacifica), born in the Pacific but with Asian
ethnic identity (bp_apac, predominantly Fijian Indians), those born in the Middle East, Latin America or
Africa (bp_melaa) and those born in Asia (bp_asia) experience statistically significantly lower ELSI-SF
scores. The western, ethnically European, population has generally a higher standard of living than other
population groups, although the matter is more complex than can be investigated here. There is evidence
of some discrimination in the labour market among non-European groups (Daldy et al., 2013).
The geographic variables related to ELSI-SF are mostly insignificant for both native born and migrant
entrepreneurs. Reported living standards scores were lower in the 2010 and 2012 surveys than in the
2008 survey, but only for native born entrepreneurs. This is likely to be due to the 2008 Global Financial
Crisis which may have subsequently impacted more on native-born entrepreneurs, with immigrants in
New Zealand being on average higher skilled than the native born.
7 This can be confirmed by formal hypothesis testing of the equality of the regression coefficients.

14
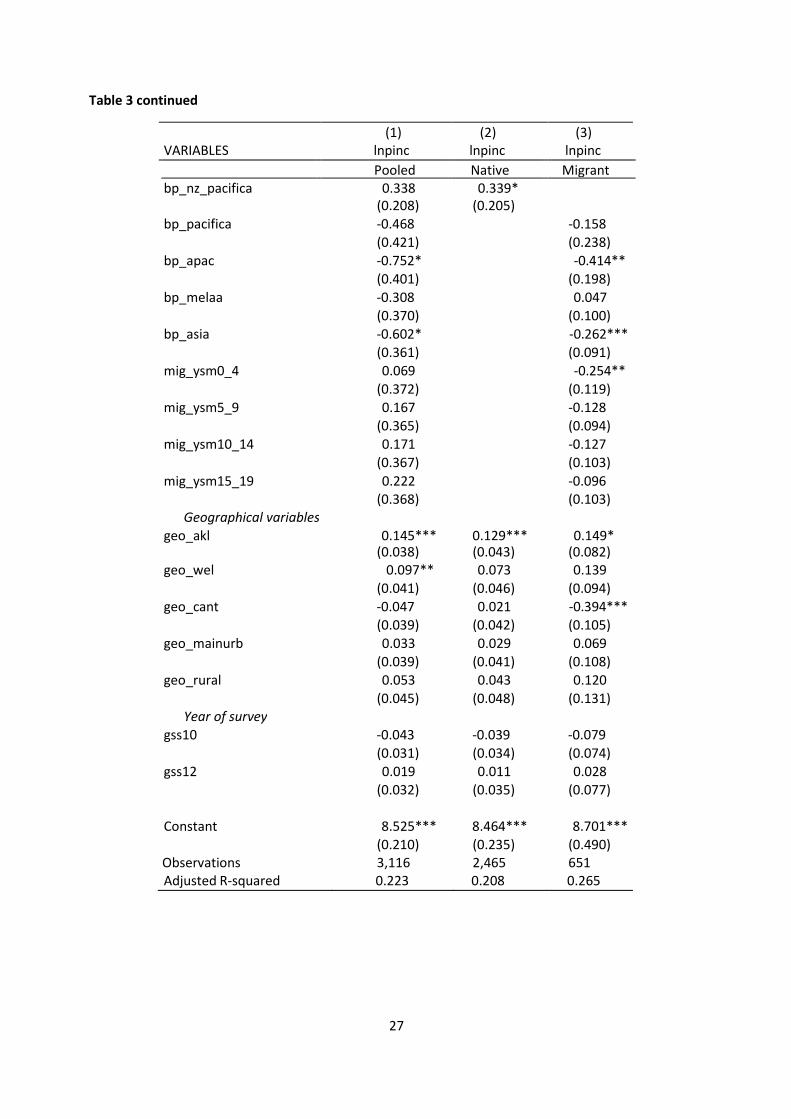
4.3 Income of entrepreneurs
Table 3 reports the results for Mincerian OLS regressions regarding the determinants of the natural
logarithm of personal income of entrepreneurs.
Table 3 about here
Social capital
In contrast to human capital, only a few social capital variables are related to entrepreneurial income.
Participation in activities (ks_part) is significant at the 5 percent level for migrant entrepreneurs, while
feelings of safety (ks_safe) and inclusion (ks_included) are weakly significant for native born
entrepreneurs. It can be argued that the causality runs here in the opposite direction: greater income
facilitates greater participation in community activity as well as residential location in safer and more
inclusive areas. However, assessing the causal nature of this interrelationship, e.g., by instrumental
variables, remains a topic for future research. For both groups there is no evidence that volunteering
(ks_vol), access to help (ks_help) and the accessibility of public facilities (geo_facilities) are related to
income.
Human capital
As is the case with earnings regressions generally, most of the human capital variables have a significant
relationship with personal income. Not surprisingly, attitude to education was not related to personal
income given that current income is a function of past investment in human capital not intentions with
respect to future investment. Years of schooling are a significant determinant at the 1 percent level for
native-born entrepreneurs and at the 10 percent level for migrant entrepreneurs. The rate of return to
an additional year of education is 4.4 percent for native-born entrepreneurs and 3.0 percent for foreign
born entrepreneurs.
The coefficients of the occupational dummies are all as expected, with the highest coefficients
observed for self-employed professional workers or professionals running a business, e.g., doctors and
dentists in private practice. Interestingly, these coefficients are much larger for migrants than for the
native born. This is consistent with the points-based selection system of immigrants in New Zealand,
which gives much weight to professional qualifications and skills.
Other variables
15
The regressions show the usual concave age earnings profile. The gender effect is also as expected. Male
entrepreneurs earn, ceteris paribus, about 30 percent more than female entrepreneurs if they are native
born and 40 percent more if they are foreign born. Having a partner and/or having children does not have
a significant relationship with personal income for both groups of entrepreneurs.
The results of the income regressions with respect to the migration and ethnicity variables are
fairly consistent with those of standard of living regressions. There is a significant negative relationship
with personal income for Asian entrepreneurs, either those born in Asia (bp_asia) or those born in the
Pacific (bp_apac). This suggests that migrants from these origins may be pushed into self-employment,
or necessity entrepreneurship, rather than being attracted to start their own business due to an identified
opportunity. Self-reported workplace discrimination is low on average, but relatively higher among Asian
migrants in New Zealand (e.g., Daldy et al., 2013).
Migrant entrepreneurs who have been in New Zealand less than five years have statistically
significant lower income (about 25 percent less) than those who have been longer in the country (see
also Stillman and Maré, 2009). Native entrepreneurs in New Zealand’s largest agglomeration, Auckland
(which accounts for roughly one third of the country's population of 4.5 million), earn about 13 percent
more than in other parts of the country. For migrants, the relative nominal (there is no adjustment for
inter-urban differences in the cost of living) income gain in the Auckland agglomeration is even greater
(15 percent), but the coefficient is only significant at the 10 percent level. Income of migrant
entrepreneurs in the Canterbury region is 39 percent lower. The Global Financial Crisis and the large
earthquake in Christchurch in February 2011 may have had a relatively large impact on this region. On
average, though, the year of survey dummies are statistically insignificant. Finally, after controlling for
the biggest cities, the other geographical dummies (main urban areas and rural areas are statistically
insignificant.
5 Final reflections
Comparing the three sets of regressions, we find that the association between social capital variables and
entrepreneurship prevalence and returns are rather different between native born and immigrants. The
perception of safety in the local neighbourhood has a positive impact on both the incidence and payoff
of entrepreneurship, but this effect is weaker or absent among migrants. For the latter, trust in others in
their own migrant community may be more important than trust in others in their city generally. We
16
should also note that the positive effect we observe of volunteering on the prevalence of migrant and
native-born entrepreneurship may not be causal, but reflect an unmeasured personal trait that positively
impacts on both.
Although we cannot formerly test the strength of a causal link from volunteering to
entrepreneurship, the existence of such a link is plausible because of the opportunity it provides to
expand the respondents’ networks and contacts through creating interactions with people outside the
individual’s typical social circle. Furthermore, the chance to develop skills that can be transferred to their
own firm is especially important for migrants, who often find it difficult to obtain jobs where they would
normally develop these skills, such as project management and budgeting (Alleyne, 2007). An additional
benefit of volunteering for migrants can be the ability to become familiar with the local community and
understand how it operates, which allows them to integrate so that they can confidently take advantage
of any market opportunities.
However, our regressions do not provide evidence that volunteering “pays off”, in that the living
standards or incomes of entrepreneurs who engage in volunteering are higher than those of
entrepreneurs who do not. Instead, strong networks do appear to pay off in the sense that entrepreneurs
who feel socially included have higher living standards.
Generally, one explanation for the mixed performance of our social capital proxies in predicting
entrepreneurship and its outcomes may be the focus on ‘social cohesion’, i.e. civil social capital, rather
than business-focused social capital which would theoretically have a more direct relationship to business
outcomes (e.g., Westlund et al., 2014). Our focus on civil social capital was necessitated by the data.
Additionally, the likelihood of becoming an entrepreneur and the resulting outcomes are partially
determined by contextual factors beyond the characteristics of the individual that we cannot observe in
our data. As Shane and Venkataraman (2000) noted, entrepreneurship arises when resourceful and
innovative individuals connect with opportunities presented by the market. It is therefore likely that the
opportunities presented by market forces have a greater ability to explain the incidence of migrant
entrepreneurship than social capital variables do. It may also be that the literature on migrant
entrepreneurship places too much emphasis on the social networks used by immigrants. This idea
corroborates with the concept outlined in Van Der Leun and Kloosterman (1999) who argue that in order
to determine the likelihood of engaging in entrepreneurship, researchers need to account not only for
their embeddedness in social networks, but also for the wider socio-economic environment of the host
country. Our present pooled cross-sectional data is not suited to testing such ideas. Instead, the
emergence of the Integrated Data Infrastructure (IDI) in New Zealand, which provides longitudinal
microdata from a mixture of public surveys and administrative systems, offers great promise for future
in-depth study of entrepreneurship (Statistics New Zealand, 2014).

17
There appears to be some heterogeneity in the results with respect to birthplace regions, with
MELAA, Asian and Pacific countries having the relatively most adverse outcomes. Meanwhile, migrants
from Western countries have a greater propensity to engage in entrepreneurial behaviour and have the
greatest economic standard of living. This result may be explained by the fact that New Zealand shares a
similar culture with other Western countries which makes taking advantage of opportunities easier for
migrants with European ethnicity, as they may be more familiar with how New Zealand businesses and
the institutional system operate, and how to access funding and other resources.
Interestingly, we find a gender effect in entrepreneurship prevalence and income but not in the
living standards regressions. Being male increases entrepreneurship prevalence and relates to higher
personal incomes. There are several explanations for this phenomenon in which native and migrant
women share many of the same characteristics (Baycan-Levent, 2010). The issue of gender in
entrepreneurship constitutes a wide branch of literature, but we note three general points here. Firstly,
the time taken off work to raise children often adversely affects the career and salary progression for
females. Secondly, men are more likely to engage in risky behaviour than women (Harris et al., 2006)
which may contribute to their higher probability of becoming an entrepreneur. Thirdly, females often
perceive the entrepreneurial area in less favourable light than their male counterparts and these
perceptions can influence their behaviour (Langowitz and Minniti, 2007).
This study has several shortcomings, including the measurement of entrepreneurial income. The
reported income covers any form of income and not just income derived from self-employment or
running a business. Additionally, to test for differences in risk attitudes between entrepreneurs and
employees, it may be useful to contrast the entire distribution of income for the two groups (see e.g.,
evidence from Denmark by Åstebro et al., 2014).
Our research can be further enhanced by including productive and network social capital variables
which are may be sourced from the Time Use Survey or the Social Indicators Survey from Statistics New
Zealand. Other proxies of the performance of entrepreneurs, for instance patents registered (in the
applicable sectors), could be added to the analysis. Future research can also investigate the demography
and life course of the business start-ups and measure the success of entrepreneurial firms, and the factors
that influence this success, with a particular focus on migrant businesses. As noted above, our available
data did not contain some preferred ‘business focused’ social capital measures. Clearly, a longitudinal
framework (for example, as provided by New Zealand’s IDI) and the construction of exogenous
instruments that enable the assessment of causal effects are promising directions for future empirical
research. Such research may contribute to a better understanding of how immigration policy can enhance
social cohesion, entrepreneurship, and stronger economic growth.

18
ReferencesAcs, Z.J., and Szerb, L. (2007). Entrepreneurship, economic growth and public policy. Small Business
Economics, 28(2), 109-122.
Alleyne, S. (2007). Volunteering helps you, too. Black Enterprise, 37(11), 74.
Åstebro, T., Herz, H., Nanda, R. and Weber, R.A. (2014). Seeking the roots of entrepreneurship: insightsfrom behavioural economics. Journal of Economic Perspectives, 28(3), 49-70.
Baron, R.A., and Markman, G.D. (2003). Beyond social capital: The role of entrepreneurs' socialcompetence in their financial success. Journal of Business Venturing, 18(1), 41-60.
Basu, A., and Goswami, A. (1999). South Asian entrepreneurship in Great Britain: factors influencinggrowth. International Journal of Entrepreneurial Behaviour and Research, 5(5), 251-275.
Baycan-Levent, T. (2010). Migrant women entrepreneurship in OECD countries. In: Open for Business:Migrant Entrepreneurship in OECD Countries, p.227-254. Paris: OECD Publishing.
Baycan-Levent, T., and Nijkamp, P. (2009). Characteristics of migrant entrepreneurship in Europe.Entrepreneurship and Regional Development, 21(4), 375-397.
Block, J. H., and Wagner, M. (2010). Necessity and opportunity entrepreneurs in Germany: Characteristicsand earnings differentials. Schmalenbach Business Review, 62, 154-174.
Casson, M., and Della, G.M. (2007). Entrepreneurship and social capital: Analysing the impact of socialnetworks on entrepreneurial activity from a rational action perspective. International SmallBusiness Journal, 25(3), 220-244.
Constant, A., and Zimmermann, K.F. (2006). The making of entrepreneurs in Germany: Are native menand immigrants alike? Small Business Economics, 26(3), 279-300.
Courtois, R. (2009). Measuring Quality of Life. Region Focus, 13(3), 12-15.
Cruickshank, P., and Rolland, D. (2006). Entrepreneurial success through networks and social capital:Exploratory considerations from GEM research in New Zealand, Journal of Small Business andEntrepreneurship, 19(1), 63-80.
Daldy, B., Poot, J., and Roskruge, M. (2013). Perception of workplace discrimination among immigrantsand native born New Zealanders. Australian Journal of Labour Economics, 16(1), 137-154.
Davidsson, P., and Honig, B. (2003). The role of social and human capital among nascent entrepreneurs.Journal of Business Venturing, 18(3), 301-331.
De Bruin, A. (1996). From cultural to economic capital: Community employment creation in Otara.Retrieved from http://ojs.victoria.ac.nz/LEW/article/view/962/775
De Carolis, D. M., and Saparito, P. (2006). Social capital, cognition, and entrepreneurial opportunities: Atheoretical framework. Entrepreneurship theory and practice, 30(1), 41-56.
Eraydin, A., Tasan-Kok, T., and Vranken, J. (2010). Diversity matters: Immigrant entrepreneurship andcontribution of different forms of social integration in economic performance of cities. EuropeanPlanning Studies, 18(4), 521-543.
Fairlie, R.W. and Lofstrom, M. (2015). Immigration and entrepreneurship. In: B.R. Chiswick and P.W.Miller (eds) Handbook of the Economics of International Migration, Volume 1B. Amsterdam: North-Holland Elsevier.
Galbraith, C.S., Rodriguez, C.L., and Stiles, C.H., (2007). Social capital as a club good: The case of ethniccommunities and entrepreneurship. Journal of Enterprising Communities, 1(1), 38-53.
Harris, C., Jenkins, M., and Glaser, D. (2006). Gender differences in risk assessment: Why do women takefewer risks than men? Judgment and Decision Making Journal, 1(1), 48-63.

19
Ibrahim, G., and Galt, V. (2011). Explaining ethnic entrepreneurship: An evolutionary economics approach.International Business Review, 20(6), 607-613.
Jensen, J., Krishnana, V., Hodgson, R., Sathiyandra, S.G., Templeton, R., Jones, D., Goldstein-Hawes, R.,and Beynon, P. (2006). New Zealand Living Standards 2004. Retrieved fromhttp://www.msd.govt.nz/documents/about-msd-and-our-work/publications-resources/monitoring/living-standards-report.pdf.
Jones, T., and Ram, M. (2011). Ethnic entrepreneurs and urban regeneration. In: A. Southern (ed.)Enterprise, Deprivation and Social exclusion: The Role of Small Business in Addressing Social andEconomic Inequalities. New York: Routledge.
Kerr, W.R., Nanda, R. and Rhodes-Kropf, M. (2014). Entrepreneurship as experimentation. Journal ofEconomic Perspectives, 28(3), 25-48.
Kleinhans, R., Priemus, H., and Engbersen, G. (2007). Understanding social capital in recently restructuredurban neighbourhoods: Two case studies in Rotterdam. Urban Studies, 44(5-6), 1069-1091.
Kloosterman, R., and Rath, J. (2001). Immigrant entrepreneurs in advanced economies: mixedembeddedness further explored. Journal of Ethnic and Migration Studies, 27(2), 189-201.
Langowitz, N., and Minniti, M. (2007). The entrepreneurial propensity of women. EntrepreneurshipTheory and Practice, 31(3), 341-364
Levie, J. (2007). Immigration, in-migration, ethnicity and entrepreneurship in the United Kingdom. SmallBusiness Economics, 28(2/3), 143-169.
Manski, C.F., and Xie, Y. (1989). The logit model and response-based samples. Sociological Methods andResearch, 17(3), 283-302.
Massari, R. (2005). A measure of welfare based on permanent income hypothesis: An application onItalian households budgets. Giornale Degli Economisti e Annali Di Economia, 64(1), 55-91.
Nijkamp, P., Sahin, M., and Baycan-Levent, T. (2010). Migrant entrepreneurship and new urban economicopportunities: Identification of critical success factors by means of qualitative pattern recognitionanalysis. Tijdschrift Voor Economische En Sociale Geografie, 101(4), 371-391.
OECD (2010). Open for business: Migrant Entrepreneurship in OECD Countries. Washington: Organisationfor Economic Cooperation and Development (OECD).
Ohlsson, H., Broomé, P. and Bevelander, P. (2012). Self-employment of immigrants and natives in Sweden– a multilevel analysis. Entrepreneurship & Regional Development, 25(5-6), 405-423.
Pendakur, R., and Mata, F. (1999). Immigration, labor force integration and the pursuit of self-employment. International Migration Review, 33(2), 378-402.
Perry, B. (2009). Non-income measures of material standard of living and hardship: first results from the2008 New Zealand Living Standards Survey, with international comparisons. Working Paper No.01/09. Ministry of Social Development.
Poot, J. and Roskruge, M. (2013). Internationalisation of education and returns in the labour market.Studies in Regional Science, 43(1): 61-78.
Poot, J. and Siegers, J.J. (1992). An economic analysis of fertility and female labour force participation inNew Zealand. New Zealand Economic Papers, 26(2): 219-248.
Putnam, R.D. (2007). E pluribus unum: Diversity and community in the twenty-first century - The 2006Johan Skytte Prize Lecture. Scandinavian Political Studies, 30(2), 137-174.
Putnam, R.D., (1995). Bowling Alone: America’s Declining Social Capital. Journal of Democracy, 6(1), 65-78
20
Reynolds, P. D.,Camp, S. M., Bygrave, W. D., Autio, E. and M. Hay, (2002). Global EntrepreneurshipMonitor. 2001 Executive Report, Babson College, London Business School
Roskruge, M. (2013). Selected Econometric Models of Social Capital Formation in New Zealand. Doctoraldissertation, University of Waikato, New Zealand.
Roskruge, M., Grimes, A., McCann, P., and Poot, J. (2012). Social capital and regional social infrastructureinvestment: Evidence from New Zealand. International Regional Science Review, 35(1), 3-25.
Sahin, K., and Ilhan-Nas, T. (2011). International ethnic entrepreneurship: Antecedents, outcomes andenvironmental context. International Business Review, 20(6), 614-626.
Sequeira, J.M., and Rasheed, A.A. (2006). Start-up and growth of immigrant small businesses: the impactof social and human capital. Journal of Developmental Entrepreneurship, 11(4), 357-375.
Shane, S., and Venkataraman, S. (2000). The promise of entrepreneurship as a field of research. TheAcademy of Management Review, 25(1), 217-226.
Shinnar, R.S., and Young, C.A. (2008). Hispanic immigrant entrepreneurs in the Las Vegas Metropolitanarea: Motivations for entry into outcomes of self-employment. Journal of Small BusinessManagement, 46(2), 242–262.
Statistics New Zealand (2014). Integrated Data Infrastructure. Retrieved fromhttp://www.stats.govt.nz/browse_for_stats/snapshots-of-nz/integrated-data-infrastructure.aspx
Sternberg, R., Brixy, U. and Schlapfner, J. F. (2006). Global Entrepreneurship Monitor. LänderberichtDeutschland 2005. Universität Hannover and IAB.
Stillman, S. and Maré, D.C. (2009). The labour market adjustment of immigrants in New Zealand.Economic Impacts of Immigration Working Paper. Wellington: Department of Labour.
Tolciu, A. (2011). Migrant entrepreneurs and social capital: A revised perspective. International Journalof Entrepreneurial Behaviour & Research, 17(4), 409-427.
Turkina, E., and Thai, M. (2013). Social capital, networks, trust and immigrant entrepreneurship: A cross-country analysis. Journal of Enterprising Communities: People and Places in the Global Economy,7(2), 108-124.
Van Der Leun, J., and Kloosterman, R. (1999). Mixed embeddedness: (in)formal economic activities andimmigrant businesses in the Netherlands. International Journal of Urban and Regional Research,23(2), 252-266.
Vespa, J., and Painter, M. A. (2011). Cohabitation history, marriage, and wealthaccumulation. Demography, 48(3), 983-1004.
Wang, X., and Maani, S. (2014). Ethnic capital and self-employment: a spatially autoregressive networkapproach. IZA Journal of Migration, 3:18.
Westlund, H. (2011). Multidimensional entrepreneurship: theoretical considerations and Swedishempirics. Regional Science Policy & Practice, 3(3), 199-219.
Westlund, H., and Bolton, R. (2003). Local social capital and entrepreneurship. Small Business Economics,21(2), 77-113.
Westlund, H., and Gawell, M. (2012). Building social capital for social entrepreneurship. Annals of Publicand Cooperative Economics, 83(1), 101-116.
Westlund, H., Larsson, J. P., and Olsson, A. R. (2014). Start-ups and local entrepreneurial social capital inthe municipalities of Sweden. Regional studies, 48(6), 974-994.
Woolcock, M. (1998). Social capital and economic development: Toward a theoretical synthesis and policyframework. Theory and Society, 27(2), 151-208.

21
22
Table 1: Logit regression models of entrepreneurship
(1) (2) (3)VARIABLES ent_slfemp ent_slfemp ent_slfemp
Pooled Native MigrantSocial capital variables
geo_facilities -0.029 0.030 -0.215
(0.096) (0.112) (0.184)
ks_safe 0.150*** 0.027** 0.039
(0.052) (0.012) (0.024)
ks_help 0.061 0.084 0.029
(0.111) (0.141) (0.185)
ks_included -0.004 0.071 -0.251**
(0.050) (0.058) (0.105)
ks_vol 0.406*** 0.409*** 0.392***
(0.051) (0.057) (0.114)
ks_part 0.109** 0.124** 0.064
(0.049) (0.056) (0.110)Human capital variables
edu_negatt 0.193 0.186 0.222
(0.136) (0.146) (0.383)
emp_part -0.221*** -0.235*** -0.190
(0.062) (0.070) (0.135)
emp_fixt -1.826***(0.139)
-1.833***(0.160)
-1.850***(0.285)
emp_perm -2.019***(0.053)
-2.009***(0.060)
-2.115***(0.117)
edu_yos 0.063*** 0.069*** 0.045*
(0.012) (0.014) (0.025)
edu_os 0.036 -0.745*** 0.294**
(0.078) (0.371) (0.132)
postgrad -0.042 0.001 -0.129
(0.057) (0.067) (0.114)
trade 0.316*** 0.425*** -0.090
(0.078) (0.089) (0.179)Demographic variables
demo_partner 0.526*** 0.497*** 0.638***(0.054) (0.060) (0.128)
demo_age 0.166*** 0.172*** 0.134***
(0.012) (0.013) (0.026)demo_age2/100 -0.001*** -0.001*** -0.001***
(0.000) (0.000) (0.000)
demo_child 0.045 0.038 0.105
(0.055) (0.063) (0.116)
demo_male 0.451*** 0.394*** 0.681***
(0.053) (0.061) (0.114)
23
Table 1 continued
(1) (2) (3)VARIABLES ent_slfemp ent_slfemp ent_slfemp
Pooled Native MigrantMigrant and ethnicity variables
eth_maori -1.136*** -1.128*** -0.867
(0.129) (0.131) (1.066)
bp_nz_pacifica -0.743** -0.723**
(0.327) (0.328)
bp_western -0.038 0.332**
(0.093) (0.141)
bp_pacifica -2.176*** -1.936***
(0.328) (0.349)bp_apac -0.177 0.127
(0.297) (0.309)
bp_melaa -0.389** -0.069
(0.174) (0.185)
bp_asia -0.238
(0.151)
mig_ysm0_4 -0.602*** -1.017***
(0.180) (0.205)
mig_ysm5_9 -0.157 -0.469***
(0.152) (0.172)
mig_ysm10_14 0.114 -0.167
(0.166) (0.180)
mig_ysm15_19 0.445** 0.239
(0.177) (0.185)Geographical variables
geo_akl -0.051 0.007 -0.232***
(0.065) (0.076) (0.131)
geo_wel -0.104 -0.074 -0.228
(0.071) (0.081) (0.152)
geo_cant -0.101 -0.081 -0.239
(0.068) (0.074) (0.169)
geo_mainurb -0.003 0.005 -0.023
(0.066) (0.072) (0.172)
geo_rural 1.093*** 1.124*** 0.981***
(0.083) (0.089) (0.224)Year of survey
gss10 -0.108** -0.123** -0.034
(0.055) (0.062) (0.122)gss12 -0.150*** -0.156*** -0.118
(0.056) (0.063) (0.125)
Constant -5.903*** -6.312*** -4.448***
(0.350) (0.404) (0.750)
Observations 15,541 11,993 3,548
Adjusted R-squared 0.213 0.212 0.227

24
Table 2: Ordered logit regression models of economic living standards of entrepreneurs
(1) (2) (3)VARIABLES hk_elsi_cat hk_elsi_cat hk_elsi_cat
Pooled Native MigrantSocial capital variables
geo_facilities 0.534*** 0.539*** 0.502*
(0.135) (0.157) (0.266)
ks_safe 0.344*** 0.358*** 0.288*
(0.077) (0.087) (0.171)
ks_help 0.662*** 0.741*** 0.503*
(0.160) (0.200) (0.274)
ks_included 0.872*** 0.847*** 0.972***
(0.075) (0.086) (0.157)ks_vol 0.032 0.079 -0.208
(0.072) (0.081) (0.168)
ks_part -0.034 -0.040 0.052
(0.072) (0.081) (0.163)Human capital variables
emp_part -0.299*** -0.221** -0.606***
(0.084) (0.096) (0.182)
edu_yos 0.103*** 0.098*** 0.132***
(0.017) (0.019) (0.038)
manager 0.425*** 0.388*** 0.533**
(0.115) (0.130) (0.255)
professional 0.444*** 0.414*** 0.472*
(0.129) (0.149) (0.270)
retail_admin 0.188 0.162 0.312
(0.129) (0.146) (0.288)trade_technical 0.018 -0.042 0.217
(0.130) (0.146) (0.287)Demographic variables
demo_partner 0.569*** 0.610*** 0.295(0.082) (0.091) (0.201)
demo_age 0.035* 0.033 0.053
(0.018) (0.021) (0.039)demo_age2/100 -0.000 -0.000 -0.000
(0.000) (0.000) (0.000)
demo_child -0.517*** -0.509*** -0.569***
(0.081) (0.092) (0.177)demo_male -0.051 -0.004 -0.246
(0.079) (0.091) (0.170)Migrant and ethnicity variables
eth_maori 0.012 -0.001 1.448(0.208) (0.210) (1.683)
bp_nz_pacifica 0.335 0.322(0.564) (0.566)
bp_western 0.384
(0.804)

25
Table 2 continued
VARIABLES (1) hk_elsi_cat (2) hk_elsi_cat (3)hk_elsi_cat
Pooled Native Migrantbp_pacifica -1.017 -1.435***
(0.961) (0.545)bp_apac -0.582 -0.936**
(0.910) (0.453)bp_melaa -0.117 -0.461*
(0.831) (0.244)
bp_asia -0.388 -0.821***
(0.805) (0.215)
mig_ysm0_4 -0.212 -0.101(0.840) (0.295)
mig_ysm5_9 -0.385 -0.198(0.816) (0.221)
mig_ysm10_14 -0.027 0.128(0.822) (0.247)
mig_ysm15_19 -0.164 0.057(0.823) (0.244)
Geographical variables
geo_akl 0.063 0.054 0.123
(0.095) (0.111) (0.196)
geo_wel 0.006 -0.044 0.187
(0.105) (0.120) (0.227)
geo_cant 0.002 0.041 -0.160
(0.099) (0.108) (0.255)
geo_mainurb 0.077 0.151 -0.377
(0.098) (0.106) (0.263)
geo_rural 0.146 0.205* -0.351
(0.114) (0.123) (0.315)Year of survey
gss10 -0.177** -0.183** -0.137
(0.079) (0.089) (0.179)gss12 -0.180** -0.201** -0.085
(0.082) (0.092) (0.187)Cut 1 constant -0.007 -0.115 0.100
(0.574) (0.666) (1.197)Cut 2 constant 1.362** 1.440** 1.052
(0.548) (0.629) (1.171)Cut 3 constant 2.454*** 2.560*** 2.066*
(0.544) (0.624) (1.165)Cut 4 constant 3.478*** 3.548*** 3.240***
(0.545) (0.624) (1.168)Cut 5 constant 4.750*** 4.825*** 4.513***
(0.548) (0.628) (1.174)Cut 6 constant 6.800*** 6.849*** 6.709***
(0.554) (0.634) (1.186)
Observations 3,180 2,516 664
r2_p 0.069 0.064 0.093

26
Table 3: OLS regression models of the natural logarithm of personal income of entrepreneurs
(1) (2) (3)VARIABLES lnpinc lnpinc lnpinc
Pooled Native MigrantSocial capital variables
geo_facilities 0.068 0.085 0.007
(0.052) (0.060) (0.111)
ks_safe 0.067** 0.058* 0.094
(0.030) (0.033) (0.070)
ks_help 0.065 0.093 0.019
(0.064) (0.077) (0.116)
ks_included 0.050* 0.061* 0.005
(0.029) (0.033) (0.065)
ks_vol -0.034 -0.031 -0.048
(0.028) (0.031) (0.069)
ks_part 0.052* 0.033 0.136**
(0.028) (0.031) (0.067)Human capital variables
edu_negatt -0.014 -0.008 0.053
(0.078) (0.082) (0.242)
emp_part -0.550*** -0.529*** -0.614***
(0.033) (0.036) (0.076)
edu_yos 0.040*** 0.044*** 0.030*
(0.006) (0.007) (0.015)
manager 0.209*** 0.150*** 0.391***
(0.045) (0.050) (0.106)
professional 0.309*** 0.256*** 0.463***
(0.050) (0.057) (0.110)
retail_admin 0.141*** 0.080 0.332***
(0.051) (0.056) (0.119)
trade_technical 0.076 0.024 0.224*
(0.051) (0.057) (0.121)Demographic variables
demo_partner -0.018 -0.000 -0.094(0.032) (0.035) (0.083)
demo_age 0.042*** 0.043*** 0.035**
(0.007) (0.008) (0.017)
demo_age2/100 -0.000*** -0.000*** -0.000*
(0.000) (0.000) (0.000)
demo_child 0.030 0.017 0.083
(0.032) (0.035) (0.073)
demo_male 0.324*** 0.307*** 0.392***
(0.031) (0.035) (0.071)Migrant and ethnicity variables
eth_maori -0.075 -0.059 -0.866
(0.082) (0.081) (0.780)
bp_western -0.341
(0.361)
27
Table 3 continued
(1) (2) (3)VARIABLES lnpinc lnpinc lnpinc
Pooled Native Migrantbp_nz_pacifica 0.338 0.339*
(0.208) (0.205)
bp_pacifica -0.468 -0.158
(0.421) (0.238)
bp_apac -0.752* -0.414**
(0.401) (0.198)
bp_melaa -0.308 0.047
(0.370) (0.100)
bp_asia -0.602* -0.262***
(0.361) (0.091)
mig_ysm0_4 0.069 -0.254**
(0.372) (0.119)
mig_ysm5_9 0.167 -0.128
(0.365) (0.094)
mig_ysm10_14 0.171 -0.127
(0.367) (0.103)
mig_ysm15_19 0.222 -0.096(0.368) (0.103)
Geographical variables
geo_akl 0.145*** 0.129*** 0.149*(0.038) (0.043) (0.082)
geo_wel 0.097** 0.073 0.139
(0.041) (0.046) (0.094)
geo_cant -0.047 0.021 -0.394***
(0.039) (0.042) (0.105)
geo_mainurb 0.033 0.029 0.069
(0.039) (0.041) (0.108)
geo_rural 0.053 0.043 0.120
(0.045) (0.048) (0.131)Year of survey
gss10 -0.043 -0.039 -0.079
(0.031) (0.034) (0.074)
gss12 0.019 0.011 0.028
(0.032) (0.035) (0.077)
Constant 8.525*** 8.464*** 8.701***
(0.210) (0.235) (0.490)Observations 3,116 2,465 651Adjusted R-squared 0.223 0.208 0.265

28
Appendix
Table A1: ELSI Short Form Score Range
Score ranges for the ELSI Short Form
ELSI Short From score Living standard level Label
0 – 8 1 Severe hardship
9 – 12 2 Significant hardship
13 – 16 3 Some hardship
17 – 20 4 Fairly comfortable
21 – 24 5 Comfortable
25 – 28 6 Good
29 – 31 7 Very good
Source: Jensen et al. (2005)
Table A2: Data Dictionary
Dependent (Left-hand side) Variables
Name Description Relevance to Research
ent_slfemp Sources of personal income
include self-employment or
owning a business
This binary variable (yes=1,
no=0) identifies whether the
respondent is considered an
entrepreneur.hk_elsi_cat Economic Living Standard Index
(Short Form)
This is the selected measure
of economic standard of
living. See Table A1.
lnpinc The natural logarithm ofpersonal income
This measure of income is
that of the person identified
as the entrepreneur (and
may be less than household
income).
29
Independent (Right-hand side) Variables
Name Description Relevance to Research
Social capital variables – All binary (yes=1, no=0)
geo_facilities Access to sufficient facilities,e.g., shops and schools in thelocal area
Access to adequate facilities
is used as a proxy for social
capital
ks_safe The respondent felt safe walkingalone at night in theirneighborhood
Feelings of safety are related
to trust, which is crucial for
social capital development.
ks_help Availability of help in time ofneed
Reciprocity and ability to ask
for help from informal
networks is a measure of
social capital.
ks_included The respondent did not feelisolated from others in the lastfour weeks
Active participation in
informal networks is used as
a proxy for social capital.
ks_vol The respondent has donevolunteer work in the last fourweeks
Volunteering is used as a
proxy for social capital.
ks_part The respondent has taken part inan activity (not as a volunteer)organized by a group ororganization in the last fourweeks
This is evidence of social
networking that is used as a
proxy for social capital.
Demographic variables
demo_partner Marital status Having a partner (yes=1,
no=0) will influence the
decision to start a business.
demo_age Age Age may affect attitude to
risk, but also access to
capital and business
experience.demo_child Number of dependent children
in family
The respondent’s willingness
to take on risk may be affected
by having dependants to care
for.
demo_male Sex Most studies suggest that the
majority of entrepreneurs are
men (yes=1, no=0).
30
Human capital variables
edu_negatt Attitude to education Being a high school dropout
(yes=1, no=0) can lead to
necessity entrepreneurship.
emp_part Part-time employment Those in part time
employment (yes=1, no=0)
are less likely to have
income from self-
employment or from
owning a business.
emp_fixt Fixed-term employment Those in fixed-term
employment (yes=1, no=0) are
less likely to have income from
self-employment or from
owning a business.
emp_perm Permanent employment Those in permanent
employment (yes=1, no=0) are
less likely to have income from
self-employment or from
owning a business.
edu_yos Years of schooling A higher level of education is
likely to be very important for
the success of a business or
self-employment and leads to
opportunity entrepreneurship.
edu_os Overseas education The effect of overseas
education (yes=1, no=0) on
self-employment or business
income may differ between
the New Zealand born and
immigrants.
postgrad Post-graduate qualification A qualification in conducting
research (yes=1, no=0) is less
likely to lead to self-
employment.
trade Trade qualification A trade qualification (yes=1,
no=0) is more likely to lead to
self-employment.

31
manager Self-employed and businessowners in management
Those in management
(yes=1, no=0) are likely to
have higher living standards
and income.
professional Professional self-employed andbusiness owners
Professionals (yes=1, no=0)
are likely to have higher
living standards and
income.retail_admin Self-employed and business
owners in retail oradministration
These types of entrepreneurs
(yes=1, no=0) are likely to
have higher living standards
and income.trade_technical Self-employed and business
owners in trade or technicaloccupations
These types of entrepreneurs
(yes=1, no=0) are likely to
have higher living standards
and income.
Migrant and ethnicity variables
eth_maori Identifies as having the
Māori ethnicity
The cultural characteristics of
this ethnic group (yes=1, no=0)
may influence the decision for
the respondent to become an
entrepreneur.
bp_nz_pacifica Born in New Zealand but
identifies as Pacifica
The cultural characteristics of
this ethnic group (yes=1, no=0)
may influence the decision for
the respondent to become an
entrepreneur.
bp_western Born in Europe, Americas orAustralia
The cultural characteristics of
this ethnic group (yes=1, no=0)
may influence the decision for
the respondent to become an
entrepreneur.
bp_pacifica Born in the Pacific Region The cultural characteristics of
this ethnic group (yes=1, no=0)
may influence the decision for
the respondent to become an
entrepreneur.
bp_apac Pacific Born who identify as
Asian
The cultural characteristics of
this ethnic group (yes=1, no=0)
may influence the decision for
the respondent to become an
entrepreneur.

32
bp_melaa Born in the Middle East or
Africa Regions (this region
also included those who did
not answer the question).
The cultural characteristics of
this ethnic group (yes=1, no=0)
may influence the decision for
the respondent to become an
entrepreneur.
bp_asia Born in the Asian Region.
Made up of those born in
South-East Asia, North-East
Asia and Rest of Asia.
The cultural characteristics of
this ethnic group (yes=1, no=0)
may influence the decision for
the respondent to become an
entrepreneur.
mig_ysm0_4 0-4 years since migration Yes=1, no=0. The longer amigrant has been in the hostcountry the greater theirhuman capital and networksthat benefitentrepreneurship.
mig_ysm5_9 5-9 years since migration Yes=1, no=0. The longer amigrant has been in the hostcountry the greater theirhuman capital and networksthat benefitentrepreneurship.
mig_ysm10_14 10-14 years since migration Yes=1, no=0. The longer amigrant has been in the hostcountry the greater theirhuman capital and networksthat benefitentrepreneurship.
mig_ysm15_19 15-19 years since migration Yes=1, no=0. The longer amigrant has been in the hostcountry the greater theirhuman capital and networksthat benefitentrepreneurship.
Geographical variables
geo_akl Auckland Region Yes=1, no=0.
Locational dummy variables
account for spatial variation in
necessity and opportunity
entrepreneurship. Auckland is
the largest city of New Zealand.
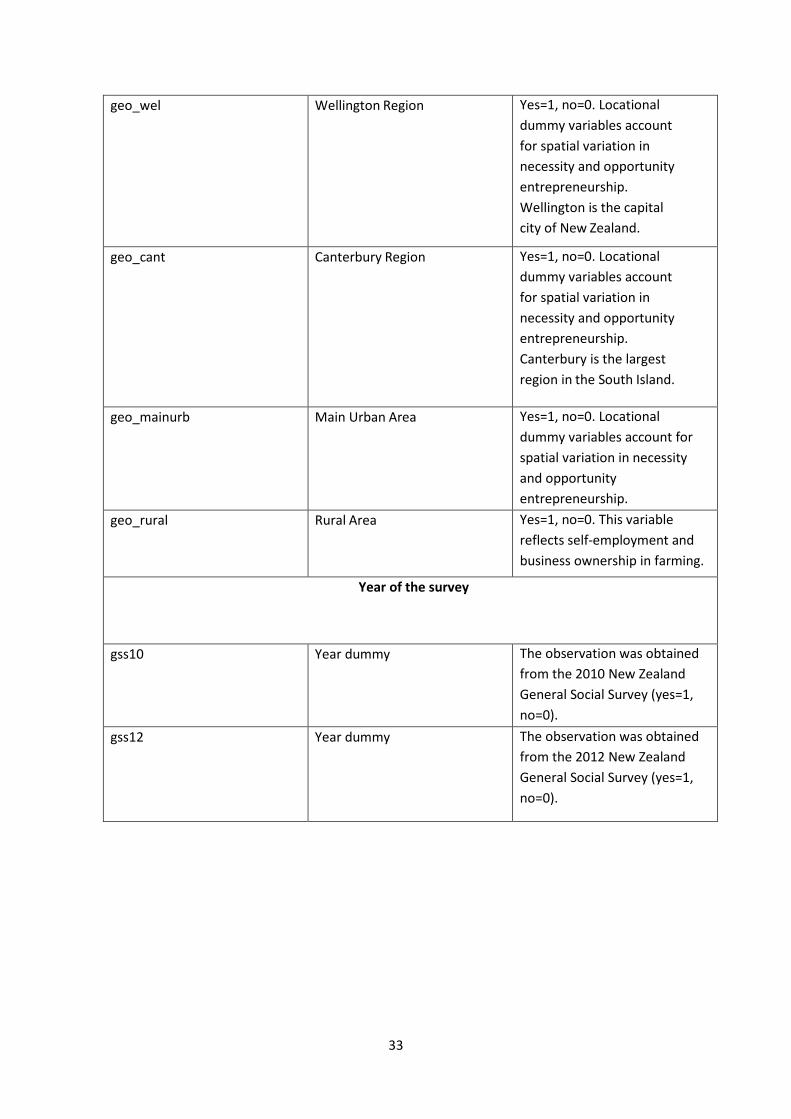
33
geo_wel Wellington Region Yes=1, no=0. Locational
dummy variables account
for spatial variation in
necessity and opportunity
entrepreneurship.
Wellington is the capital
city of New Zealand.
geo_cant Canterbury Region Yes=1, no=0. Locational
dummy variables account
for spatial variation in
necessity and opportunity
entrepreneurship.
Canterbury is the largest
region in the South Island.
geo_mainurb Main Urban Area Yes=1, no=0. Locational
dummy variables account for
spatial variation in necessity
and opportunity
entrepreneurship.
geo_rural Rural Area Yes=1, no=0. This variable
reflects self-employment and
business ownership in farming.
Year of the survey
gss10 Year dummy The observation was obtained
from the 2010 New Zealand
General Social Survey (yes=1,
no=0).
gss12 Year dummy The observation was obtained
from the 2012 New Zealand
General Social Survey (yes=1,
no=0).