discussion papers in economics by amjad ali m. ali choudhary
TRANSCRIPT

Discussion Papers in Economics
Department of Economics University of Surrey
Guildford Surrey GU2 7XH, UK
Telephone +44 (0)1483 689380 Facsimile +44 (0)1483 689548 Web www.econ.surrey.ac.uk
ISSN: 1749-5075
BANK LENDING AND MONETARY SHOCKS: AN EMPIRICAL INVESTIGATION
By Amjad Ali
(State Bank of Pakistan) M. Ali Choudhary
(State Bank of Pakistan and University of Surrey) Shah Hussain
(State Bank of Pakistan) &
Vasco J. Gabriel (University of Surrey)
DP 02/12

Bank Lending and Monetary Shocks: an Empirical In-vestigation
AMJAD ALI,† M. ALI CHOUDHARY,!1 SHAH HUSSAIN,‡ and VASCO J. GABRIEL§
†Research Department, State Bank of Pakistan, I.I. Chundrigar Road, Karachi 74000, Pakistan (e-mail:[email protected])!Research Department, State Bank of Pakistan, I.I. Chundrigar Road, Karachi 74000, Pakistan and Univer-sity of Surrey, Guildford, Surrey GU2 7XH, UK (e-mail: [email protected])‡Research Department, State Bank of Pakistan, I.I. Chundrigar Road, Karachi 74000, Pakistan (e-mail:[email protected])§School of Economics, University of Surrey, Guildford, Surrey GU2 7XH, UK(e-mail: [email protected])
January 20122
Abstract
This paper provides a systematic empirical study of the role of credit market frictions in the transmissionof monetary shocks. First, using macro data for a developing economy (Pakistan), we show that bankingspreads are countercyclical, even when we control for credit risk, monetary policy and potential maturitymismatches. Moreover, we find that this anticyclical nature is accentuated in the presence of government asan active participant in the private credit market. Then, using a unique dataset on corporate loan agreementsfor the period 2006-2011, we find evidence that, in times of tight monetary conditions, there is an overallincrease in the pass-through of policy impulses to individual loans rates. Furthermore, our evidence suggestthat the impact of these shocks is disproportionately felt by borrowers and is especially biased towards lessestablished firms. Moreover, small (weak) banks change their loan conditions the most in tight conditions.Thus, our findings support the view that the existence of a credit channel is particularly relevant for emergingeconomies, hence emphasizing the need for appropriate stabilization policies.
Keywords: Bank Margins; Credit Channel; Monetary Policy.
JEL Classification: E5, F4, O1.
1Corresponding Author2This research would not have been possible without the help of Inayat Hussain, Mohsin Rashid, Syed Ali, Ja!ar
Abdi and Muhammad Saleem. We are grateful to Riaz Riazuddin, Mushtaq Khan, Azizullah Khattak, NadeemAftab, Farooq Pasha, Amna Saeed, Hassan Abbas and Syed Aamir Ali Bhkhari for comments. Syed Kalim Hyderand Jahanzeb Malik provided assistance with bootstrapping.
1

1 Introduction
There is now a largely consensual view regarding the importance of financial propagation mechanisms foraggregate activity. Indeed, research on the ‘credit channel’ of monetary transmission has focused on boththe role of banks’ asset composition e!ects (the ‘bank lending channel’) or, alternatively, the existence ofborrowers’ balance sheet e!ects (the ‘balance sheet channel’) - see Bernanke and Gertler (1995), Cecchetti(1995), Meltzer (1995), Mishkin (1995) and, more recently, Hubbard (2000) for reviews.
In the first case, a monetary contraction induces a fall in bank reserves, thus decreasing bank credit supply,especially when it is costly for banks to use other funds and/or for borrowers to find alternative financingsources. The balance sheet channel, on the other hand, emphasizes that, in the presence of creditworthinessmonitoring costs, an adverse shock to borrowers’ net worth (due to a decline in cash-flows or a shock tothe value of collateralizable assets) raises the premium on external finance. Higher borrowing costs thenlead to reductions in spending and production, thus amplifying the e!ect of the original shock.3 Thise!ect is expected to be more pronounced for smaller firms, with a more restricted access to alternativefinance. Therefore, when the market is tight, such firms are disproportionally a!ected, facing punitivelending conditions and thus leading to severe and protracted economic swings.
The credit channel rely on two assumptions: (i) borrowers (including the state) are bank-dependent and(ii) banks find access to outside finance more expensive than the traditional deposit mobilization.4 Theseconditions, however, have been subject to much criticism in the context of developed economies. Financialmarket innovations such as secondary markets, investment banking, the ability for banks to issue equity andimprovements in financial depth are key objections (see for example Edwards and Mishkin, 1995, Meltzer,1995 and Bernanke and Gertler, 1995).
Nonetheless, such financial innovations are less relevant for the developing world. In such economies, com-mercial banks are the dominant form of intermediaries, access to international capital markets is limited andthe tax-to-GDP ratio is low (see Agenor and Montiel, 2008). It is precisely in developing economies whereconditions for the existence of the credit channels may be ripe.
Understanding the relevance of monetary impulses and their propagation mechanisms is of crucial importancefor the design of stabilization policies. We argue that a credit view of monetary policy transmission is likelyto be more prominent and relevant in emerging market economies such as Pakistan. In fact, the alternativemoney view of the transmission mechanism relies on monetary impulses impacting output through realinterest-sensitive spending. In this regard, infrequency of price changes plays a pivotal role. However, thisargument is less potent for developing economies, where the degree of price stickiness may be lower, whichin turn reduces the real impact of monetary policy actions (Choudhary et al., 2011, for example, provide thefirst survey-based evidence on this fact).
Thus, this paper empirically evaluates the extent to which credit market frictions in Pakistan play a rolein exacerbating financial and monetary shocks. In order to undertake this task, we adopt a comprehensiveapproach. In a first stage, we use quarterly aggregate data to study the countercyclical nature of price-costmargins in banking, which is a necessary condition for the existence of a financial accelerator mechanism(see Bernanke and Gertler, 1989, Bernanke and Gertler, 1995 and Bernanke, Gertler and Gilchrist, 1994 and1998). We employ the VAR forecast error methodology of den Haan (2000) to measure the comovementbetween banking spreads and aggregate activity, controlling for credit risk, changes in the slope of yieldcurve and monetary policy interventions, as in Aliaga-Dı́az and Olivero (2010). However, we introduce anovel aspect in this exercise, by also taking into account the role played by financing of the governmentbudget deficit, an issue largely ignored in the literature.5 This is an important factor, as it may alter the
3This mechanism is also known as the ‘financial accelerator’.4Bank-dependent borrowers arise if credit markets function as ‘customer-markets’ of Phelps and Winter (1970) and Okun
(1981), in which customers are held-up with their loan supplier because of information monopoly on credit history, switchingcosts of clients, formation of habit or a simple lack of an alternative avenue of financing.
5This is, perhaps, because most of the literature concentrates on developed economies, where state financing is de-linked
2

asset composition of banks’ balance sheets and, thus, create a ’contraction’-like environment for the privateeconomy. To explain, if the government’s financing-gap is met by commercial banks (a scenario more likelyin a developing economy), a monetary contraction ensues, in the sense that government paper may crowdout private lending. This further exacerbates the bank lending channel we discussed earlier.
In the second stage, we use a unique micro-level dataset on actual loans rates, borrower and bank informationelectronically reported to the Central Bank by commercial banks under monthly regulatory requirements,from April 2006 to April 2011. We analyze data on fresh loans before and after Sept 2008 BOP shock. Aftercontrolling for loan characteristics and macroeconomic conditions, loan pricing conditions are identified withrespect to interest shocks engineered by the Central Bank. This will allow us to test the key predictionthat when liquidity is tight, loan rate sensitivities to policy impulses increase overall and increase more forheld-up customers and for whom information asymmetries are likely to be high. Another way to interpretthis is that the interest rate pass-through will di!er across borrowers and banks. Furthermore, these e!ectswould be further reinforced by a weak fiscal position of the state, as argued before.
Our findings lend substantive support to the credit view enunciated above. Indeed, we confirm that the co-movement between business cycle fluctuations and banking price-cost margins are countercyclical. Moreover,the intensity of the cyclical nature of the interest-rate spread is influenced by the asset portfolio compositionof banks, i.e. the greater the share of government paper the more countercyclical the interest rate spread.
On the other hand, the borrower-level analysis reveals that, in tough times, (i) there is an increase inoverall policy pass-through; (ii) policy impulses are unequally distributed and positively biased towards lessestablished firms; (iii) overall lending rate concessions are biased towards more established firms following aliquidity shock and (iv) smaller banks pass-through policy shocks to weaker borrowers to a greater extent.
Thus, our main contribution to the literature is that, using a rich individual loan database with actualindividual loan rates, we uncover how monetary shocks filter down to banks and their borrowers. Indeed,the distributional e!ects of a policy impulse for fresh loans are significant. Furthermore, we show that banks’willingness to lend also depends on the debt situation of the country, as argued in Bernanke (1983a). Aweak fiscal position reinforces the e!ects of the credit channel, in that banks’ balance sheets tilt in favor ofinterest-inelastic government, which increase the overall interest-rate spreads in the economy.
The spirit of our work is closest to Hubbard, Kuttner and Palia (2002) and Khwaja and Mian (2008). Theformer employ a matched sample of individual loans, borrowers and banks, finding that bank clients tendto be ‘sticky’ and weak banks (from a capitalization viewpoint) o!er higher loan rates. Khawaja and Mian(2008), on the other hand, is of direct relevance in that it concentrates on the bank lending channel inPakistan during a unique credit-crunch that followed the nuclear blast in 1998. As in Hubbard et al. (2002),they match the universe of individual loan data of firms that maintain multiple bank accounts with bankinformation for the period of 1997-1999, largely confirming the predictions of the credit view. However,unlike Hubbard et al. (2002) and the current paper, they do not have information on loan prices.
Other related work exploring cross-sectional bank-borrowers heterogeneity include Kashyap and Stein (1994and 2000), which assess the role of bank size and liquidity in explaining behavior, using U.S quarterlydata. Peek and Rosengren (1992) and Kishan and Opeila (2000), on the other hand, investigate the role ofcapitalization, finding that smaller and least well-capitalized banks are more sensitive to monetary impulses.These results are important, as they suggest a tension between increasing the soundness of the bankingsystem with capital requirements and the e!ectiveness of monetary policy actions.
This paper proceeds as follows. Sections 2 and 3 discuss data, the empirical methodologies and macro andmicro results on the credit channels, respectively. Section 4 discusses some caveats of our study, while thefinal section concludes.
from private credit. However, Bernanke (1983b, p. 266) cites the example of Canada, that entered the great depression witha large foreign currency external debt with the consequence that banks shifted away from loans towards safer assets as thecurrency devalued and the economy deflated. In Bernanke’s words, ”debt crisis should be added to the banking crises as apotential source of disruption of the credit system”.
3

2 Macro Evidence on Countercyclical Banking Spreads
As suggested above, developing countries such as Pakistan provide the ideal backdrop to study the lendingmechanisms of the credit channel. An informal assessment in Table 1 suggests that financial markets andaggregate output fluctuations have become increasingly intertwined. Indeed, there is evidence of a fourfoldincrease in Pakistan’s real GDP volatility in the past three decades. This period coincides with the deregu-lation of the financial sector. Also, we observe a stronger correlation of real GDP with cyclical componentsof key financial indicators.
Furthermore, in 2005 commercial banks accounted for 70% of financial sector assets, share of total depositin bank liabilities stood at 84%, the stock market is only accessible to very large registered corporations, asecondary market for commercial paper is non-existent and banks have restricted access to overseas capital.Moreover, the 2008 balance of payments crisis initially reduced liquidity in credit markets and sent Pakistanto its largest IMF programme to date. Taken all together, these should prove good conditions carriers forthe credit channel, especially as the economy transitioned to a tight money period.
Thus, below we outline the methodology for assessing the cyclical direction and the strength of bank marginsusing the VAR method proposed by den Haan (2000), used in this context by Aliaga-Dı́az and Olivero(2010) for the US case. This method is useful because, unlike standard regression analysis, it capturesimportant information on temporal features of the comovement between variables. Also, results encompassany combination of stationary processes or integration processes of any arbitrary order. Therefore, datatransformation requirements are minimal.
2.1 Empirical Methodology
The methodology developed in den Haan (2000) relies on correlations of the VAR forecast errors at di!erenthorizons. The empirical model used is given by the following VAR
Xt = !+ µ1t+L!
l=1
"tXt"l + #t (1)
where Xt is a vector of variables containing measures of banking margins, business cycle indicators and othercontrol variables, t denotes a time trend and L is lag dimension of the VAR.6
The procedure involves estimating (1) and obtaining values for K-period forecasts for variables in Xt. Theseare, subsequently, used to obtain K-period forecast errors which are net of actual values Xt and in-sampleforecast values. Finally, correlations between forecast errors of variables in Xt are obtained.
The above procedure is used in four di!erent ways. First, a simple bivariate VAR is estimated where thevector Xt matrix includes alternative banking margins and business cycle variables. However, this VAR maybe misspecified if relevant variables are omitted, as factors such as credit risk, the term structure of interestrates and monetary policy may independently a!ect the cyclicality of banking margins. Consequently, in thesecond step, we estimate a multivariate VAR. In this case, vector Xt includes the slope of the yield curveand credit risk measures, in addition to the margins and business cycle indicators used earlier. Third, therobustness of estimated correlations are verified by bootstrapping the estimated VAR with 2500 replications(more precisely, we use a moving block bootstrap). This is important, as the sample size is limited. Finally,the above three points are repeated using the share of government paper in total bank assets as an explanatoryvariable to explain the degree of cyclicality of margins, as discussed next.7
6We restrict the minimum number of lags to two using Schwarz’s Bayesian information criterion, which helps us preservedata length.
7This methodology was first successfully applied in an early part of this project in Hussain et al. (2011)
4

2.2 The Role of Government Debt
An innovative feature in our study is that we argue that the government has a role to play in explainingbanking spreads and, therefore, we also control for fluctuations in the financing needs of the government,using the aggregate demand composition idea of Gali (1994). According to Gali (1994), during bad timesthe share of government expenditure in aggregate output increases. Because this expenditure tends to beless price elastic, the total demand elasticity faced by representative firms falls. As a result, price-markupsexperienced during recessions tend to be higher. This is then reflected in the composition of assets in thebanking system. In an economy with precarious external debt and weak fiscal position, the share of lending-to-the-state in total credit increases during bad times. The assumptions are that government has limitedoptions in the short-run and its demand for money is less interest-rate sensitive. The result is that totaldemand elasticity for credit falls, increasing spreads for all borrowers.
2.3 Data
We use quarterly asset(loans)-weighted margin averages across all banks, constructed from bank-level datafor 2002-2010. This data is obtained from detailed bank balance sheets submitted to the State Bank ofPakistan (the Central Bank). The balance sheets also provide the share of public sector borrowing for eachbank, which we then aggregate. High quality data from this source is unavailable prior to 2002 since reportingrequirements di!ered.
Three alternative definitions of margins are drawn from Aliaga-Dı́az and Olivero (2006). Margin 1 is definedas the net of interest income on advances and interest expense on deposits. Margin 2 is defined as ratio ofinterest income and interest costs to total loans. Whereas the first two margins are closely linked to thedefinition of net-interest margins, the third margin, Margin 3, which is calculated as the di!erence betweenlending and deposit rates, measures the banking spread. Net-interest margin is distinct from banking spreadin that it is computed as the ratio of the di!erence between the interest revenues and interest expenses toassets (loans), while the latter is calculated as the di!erence between lending and deposit rates.8
For business cycle indicators, we use data on industrial production, inflation and stock market growth, inline with the literature on business cycles (see Chen, Higgins and Mason, 2005). GDP figures for Pakistanare not available on a quarterly basis, however the growth rate of Industrial Production Index (a quarterlyindex for the manufacturing industry in Pakistan) can be used as a proxy for aggregate activity. Indeed, thecorrelation between annualized industrial production index and annual GDP growth rate during 1985-2009is 0.6. Inflation and stock market series (KSE-100 index) in Pakistan are also good indicators of economichealth. The correlations with annual GDP growth using annualized data is 0.4 and 0.6 for the periods of1985-2009 and 1996-2009 respectively. These have also been used elsewhere in the literature (see for exampleStock and Watson, 1998).
In the multivariate VAR, we include measures of credit/default risk and we use data on nonperforming loansobtained from the balance sheets, defined as the value of non-performing loans minus provision for loanlosses. As Angelini and Cetorelli (2003) point out, interest rates on deposits exhibit more rigidity than theinterest rates for lending. Therefore, it is important to include monetary policy as a control variable inthis type of analysis. Furthermore, we use the slope of the yield curve, which is measured as the di!erencebetween the ten year and one year rate. This is also used in Bernanke and Blinder (1992) and Aliaga-Dı́azand Olivero (2006 and 2010) as a proxy for monetary policy. Moreover, the slope of the yield curve is alsoused as a measure for maturity mismatch in assets and liabilities of banks’ balance sheets, which is anotherfactor that can a!ect cyclicality of margins. This is especially true if bank assets are of longer maturity thantheir liabilities. In recessions, when the short term rates are typically driven down more than their long termrates, the fall in bank expenses exceeds earnings. This in turn leads to higher margins during recessions,since these margins are calculated as the di!erence between bank income and expenses.
8For the sake of brevity, the results for the third margin are not reported, but are available on request.
5

2.4 Results
Simple unconditional correlations between the margins and business cycle indicators defined above are pre-sented in Table 2a. All values are negative and significant, indicating some degree of countercyclicality inmargins. Introducing other control variables that might a!ect the counter-cyclicality of margins allow us toarrive at conditional correlations.
Results for both bivariate and multivariate VARs are presented in Tables 2a and 2c. For the bivariate VAR,purified correlations of forecast errors are negative across all definitions of our business cycle indicators. Themultivariate VAR, on the other hand, controls for term structure of interest rates and credit risk e!ects.The direction and significance of the coe"cients of countercyclicality do not di!er, confirming that there arefactors other than our control variables which drive the cyclicality of banking spreads.
We now turn to the role of government debt. As explained earlier, when the government participates in thecredit markets, spreads should increase more as the composition of the bank balance sheet tilts towards adominant interest-inelastic player - a straightforward application of Gali (1994) to credit markets. For thispurpose, we repeat exercises in Tables 2b, by including the share of government papers on banks’ balancesheets as an explanatory variable in bivariate and multivariate models. The results are reported in Tables 2band 2d. The correlations of forecast errors show that the degree of anticyclical spreads increases a great dealfor both the bivariate and multivariate cases, as the bootstrapping shows that all results, without exception,fall within the 95% confidence interval. This finding strengthens the case for the role of a weak fiscal positionin developing economies in generating financial accelerator type e!ects through bank balance sheets.
Thus, we have established that interest rate spreads are generally countercyclical and even more so when theshare of government on banks’ balance-sheets is introduced as an explanatory variable. Taking this aspectinto account worsens overall loan conditions in the economy and complements the importance of the balancesheet and lending channels of policy transmission; a task we turn to next, using micro-level data.
3 Micro Evidence of the Credit Channel
In this Section we examine the extent to which monetary impulses disproportionately pass-through to actualloan rates o!ered to corporate borrowers, after controlling for borrower peculiarities and economy-wideconditions. We use a variation of the empirical model proposed by Hubbard et al. (2002) and Rosenwald(1998). The model application is done in two stages, by first tracing how policy shocks are distributed acrossdi!erent types of borrowers and then across banks. As discussed above, evidence on asymmetric distributionof policy impulses would strengthen the two channels of the credit view.
3.1 The Empirical Methodology
The textbook price of loans is given by the short run marginal cost of banks for raising funds and a borrower-specific risk premium. Competitive pressures will ensure that any other costs that are particular to banks arenot borne by customers, for they can always switch suppliers. In the real world, however, credit markets areimperfect. Frictions such as intermediation costs, evaluation of borrowers’ true intentions and the formationof bank-borrower relationships can cause banks to exploit their existence by heavily discriminating on priceand even rationing credit across borrowers. The implication is that the impact of an unanticipated shock,leading to a higher overall cost of borrowing to the banking system that is not preceded by a period ofmonetary contraction, should be unequally distributed across di!erent types of borrowers and banks, onceborrower and loan peculiarities have been taken into consideration.
The following basic empirical model captures linkages between actual loans prices, policy decisions, the role
6

of banks and borrower characteristics,
Yi,b,t = !+ $0Interbanki,b,t + % #Zj,t + & #Pp,t + '#Mk,t + (#Nl,t + )#Lm,t + #i (2)
where Yi,b,t and Interbanki,b,t are the annualized rates on the individual loan by borrower i at bank b attime t and the relevant annualized interbank rates of relevant maturity on the date the loan was agreed withthe borrower. The vector Zj,t is composed of macro variables, namely: year-on-year inflation of the month inwhich the loan agreement took place, the nominal exchange rate on the day of the loan agreement. The vectorPj,t contains, loan size and its maturity as control variables. It contains three separate dummy variablesset to one for when loans are secured, funded and agreed with private parties. Furthermore, it also controlsfor the interest-rate corridor with the variable Corridor. This is a dummy variable set to 1 for all loanstransactions for which the corridor was in operation. The idea behind the introduction of the corridor wasto reduce overnight market-rate volatility. The variables Yi,b,t, interbanki,b,t, exchange rate, CPI inflation,loan size, maturity (tenor in days) are in log form. The error term #i is assumed to be uncorrelated with allthe right-hand-side variables. All these variables appear in the top nine rows of Tables 9-11.
The remaining vectors of (2) are as follows: Mk,t contains bank size dummies, Nl,t is used to capturesixteen borrower type dummies, while Lm,t consists of fifty loan type dummies. These vectors are key to ourexercise to tease out the credit channel. They essentially control for bank and borrower types and facilityspecifications, which we discuss next.
First, in line with literature that followed the work of Bernanke and Blinder (1992) and that is summarizedin Hubbard (2000), we assume that the policy stance of the central bank is captured by the discount rate,known as the repo-rate in Pakistan. Second, this repo rate, in turn, determines the price of money in theinterbank market, which is the main policy variable Interbanki,b,t. The justification for using the interbankrate to proxy for policy impulses is that the unconditional correlation between the discount rate and thesix-month Karachi Interbank O!ered Rate (KIBOR/interbank) is close to 0.90 (see also Figure 1 in theAppendix), i.e. the interbank rate tracks the policy stance one for one. Moreover, the advantage of usinginterbank rates is that, unlike the discount rate, the interbank rate is a continuous variable. Our confidencein the interbank rates as a policy transmitter to individual loans is reinforced by the State Bank of Pakistan(SBP) circulars (BPD Circular No.1 of 21st January 2004 and BPD Circular Letter No. 04 of 2006), whichstipulate that all credit providers would benchmark loan pricing with the relevant tenor (maturity) of theInterbank.9
Each loan transaction is matched with the size of the crediting intermediary. There are three bank sizecategories: small, medium and large and is captured by Big Bank, Medium Bank and Small banks dummies.Each size has a separate dummy set to 1 for the respective category and captured in vector Mk,t. Theclassification of bank size is based on the average of daily excess liquidity positions with the central bankand its consistency is checked by using each bank’s asset size in the banking sector for the period of ouranalysis. The choice of variable to depict individual bank size does not a!ect the rank of the banks duringthe period of our analysis. Bank size is meant to capture the ability of banks to absorb shocks which, inturn, reflect their cost of funding, cost of intermediation and customers-mix. Therefore, policy pass-throughto loan transactions should di!er by bank type, which would provide evidence on the financial intermediariesbeing a non-neutral agent during business swings.
We control for borrower type in vector Nl,t using a uniform definition set by the Central Bank on the basisof corporate borrower status with SECP (a regulatory organization for firms). Banks slot borrowers into 16categories at the time loan applications are being processed.10 The top five categories of borrowers are: (1)firms listed in the stock market (2) registered general firms (3) public sector firms (4) large, but non listed,
9This policy marks a shift towards a more transparent and consistent credit market making in the country, understandableand appreciable given the lack of neat market-making transpired in the study of Khawaja and Mian (2005), which documentsthe use of unfair market practices (e.g. the use of political ties) for credit allocation, during the period 1996-2000.
10These borrower types are Autonomous body, Bank/DFIs, Federal Government, Foreign Constituents, Listed company,Local Body, Modaraba, Multilateral development bank (IBRD, IFC, ADB, AfID, EBRD, IADB, EIB, EIF, NIB, CDB, IDB,CEDB), Non-Bank Finance Company (NBFC), Non-listed company-other than SME, Partnership-other than SME, Provincial
7
firms and (5) small and medium sized firms as defined in the prudential regulation. Knowledge of borrowertype allows to assess switching costs, as well as intermediation costs of borrowers. Finally, we also controlfor the type of facilities, of which there are 51 types in Lm,t.11 The facility type is captured by 50 dummyvariables. Overall, in (2) we have three types of controls namely: bank size (in the particular bigger banks),borrower and loan types. The use for each of these are highlighted in Table 9, 10 and 11.
This empirical setup is similar in the spirit of Hubbard et al. (2002), with subtle di!erences. There, theobjective is to study spreads and their linkages with bank health and borrower type. Here, the focus ison the response of actual loan rates to policy shocks by bank and borrower type. We are able to do thisexercise because, unlike other studies, we have access to actual loan rates for a large number of transactions.For example, in the context of loan rates by size during a period of tightening, Ronsewald (1998) uses asimilar specification to ours. Moreover, our focus on loan rates, rather than spreads, is also importantinsofar as information on loan application fees and charges related to loan disbursement are not disclosed.Furthermore, deposits rates in Pakistan are non-market determined, as there is a fixed floor on these ratesset by the Central Bank.
Our identification strategy of gauging the impact of shocks is very much in the spirit of Khawaja and Mian(2008) and it consists of examining individual loan transactions, before and after the balance of paymentsshock of Sept 2008. Therefore, (2) is estimated for the periods of April 2006-Aug 2008 and Sept 2008-April2011 separately (see Figure 1). While the former period is a relatively stable period, the latter is recessionary,as Pakistan signed up to an IMF program in Sept 2008, having revised discount rates and, hence, banks’short run cost of funding, nine times. This event is interesting, in that as part of the package, and giventhat fiscal reform was a medium term objective, the financing of government deficit was shifted away fromthe central bank to commercial banks. This shift created a de facto monetary contraction, in the sense thatonly a fraction of the banks deposits were available for sale.
3.2 Data Description
Our database is drawn from the universe of corporate loans during the period of April 2006-April 2011. Theinformation on these loans is reported to the State Bank of Pakistan by commercial banks. The databasehelps banks assess the creditworthiness of firms on a historical basis.
Data has sensitive borrower information and, therefore, is not publicly available. We focus on fresh, as wellas repriced corporate loans agreements, across all types of various loan facilities o!ered by commercial banks.This enables us to extract contemporaneous e!ects of policy shocks. Table 3 in the Appendix shows thevarious stages of our data cleaning. Removing transactions of subsidized facilities and for those where loanand borrower information are incomplete, leaves us with 37,481 observations from a population of 141,902of bank transactions (we dropped subsidized products to focus on policy transmission on market products).
We further restrict our sample to non negative interest-rate spreads in view of central banks circulars. This
Government, Public Sector Enterprise, Securities/Brokerage Firm, SME (as defined in the Prudential Regulations for SME),and Other.
11The top facilities are working capital, running finance, overdraft, project finance, term finance, commodity finance, let-ter of credit and foreign bills; others include Agricultural-Production Loans, Agricultural-Development Loans, Agricultural-Non farm credits, Auto Loan/Car Ijara, Balance Transfer Facility, Consumer durable Loans, Credit Card-Corporate, Creditcard-Consumer, Diminishing Musharika, Foreign Bills Purchased, Ijara- Equipment, Ijara-Plant and Machinery, Ijara-other,Import Bills Purchased, Inland Bills Purchased, Istesna Finance, Lease facility, Letter of Credit, Letter of Guarantee, MicroCredit Other, Micro Credit-Live Stock, Mortgage Loan/House, Loan/Diminishing Musharika, Mudaraba Finance, MurabahaFinance, Musawah finance, Musharika Finance, OD (Running Finance),Other Islamic mode of finance, Other Non-fund basedfacility, Other working Capital Loans, Personal Loan, Project Finance-Individual, Project Finance-Corporate, Project Finance-SME, Object Finance-Individual, Object Finance-Corporate, Object Finance-SME, Commodity finance-Corporate, Commod-ity finance-Individual, Commodity finance-SME, Income-producing real estate financing-Corporate, High-volatility commer-cial real estate financing-Corporate, Running Finance/Cash line, Salam finance, Syndication Mudaraba, Term Loan/Finance,Loan/Finance against Foreign/Local Bills, Import Loan/Finance (other than LC and LG), Consumer Loan/Finance for Vehicles,Consumer Loan/Finance for House, Other Agricultural Loan.
8
implies a further removal of 18% of the observations, which is unevenly distributed across borrowers types.We also lose some observations because the loan tenor was not reported. Clearly, this loss of observationshighlights weaknesses in data reporting to the central bank in a developing economy. The final sample isdistributed across of 4,715 unique borrowers, holding 29,908 individual loans from 35 banks during 2006-2011.
A valid question about the representativeness of our sample comes to the fore. Table 4 shows that a largemajority of these loans are based on products that are distributed across mainly five types of identifiableborrowers. The interesting point in Table 4 (Columns 1 and 2) is that the borrower distribution of loansmoving from the universe to our final sample is not too di!erent. In fact, there is a correlation of 0.95.In subsequent columns, we show the same holds true when we further disaggregate the data by bank size.Thus, we are confident that our sample is a good representative of the population of transactions for theperiod we study.
For the interested reader, in Tables 5, 6, 7 and 8 we present the summary statistics of our loan data bybanks, volume, borrowers and a mixture of these three, respectively. It is clear that our sample is su"cientlyrich with observations across borrowers and banks. A few important features deserve mention. First, thelion share of loan transactions are conducted by large banks. A large proportion of facilities have a valuebelow PKR 20 mln ($0.23 mln) and the average maturity is close to one year. Most loans are securitized.Moreover, the largest average spread, defined as the di!erence of interest rate on loan and interbank rate,is found to belong to small and medium sized firms category and is 342 basis points. Finally, and perhapssurprisingly, on average, spreads are fairly similar across banks of di!erent size. Nevertheless, medium sizebanks tend to be slightly on the higher side. However, as we discover later, these similarities appear to maskbehavioral di!erences.
3.3 Results
3.3.1 General Regressions
In Table 9 we present the OLS estimation of (2). The first column has no controls and shows that thesensitivity of all loans types to policy shocks is positive (0.454) and statistically significant. This resultvalidates our use of the interbank rate as a transporter of policy decision to individual loan rates.
Five results deserve mention. First, inflation and nominal exchange rates, which capture domestic andexternal uncertainties, respectively, tend to raise loan rates. In terms of point estimates, the depreciation ofthe exchange is the second most important factor that raises individual loan prices after policy rates. Thissuggests that the macroeconomic situation, in particular external, a!ects loan pricing. Second, loan collateralmatters. Indeed, unfunded and unsecured loans are costlier, which is intuitive, and the coe"cients capturethat. Third, the estimated coe"cient on loan maturity is negative and significant in most specifications.This is an unexpected result, but it is quite possible that better borrowers get better rates and get moretime to pay back their dues. Forth, the estimated coe"cient on loan size is negative and significant in allspecifications, implying that the larger the amount borrowed, the lower the price, which is intuitive. Five,the introduction of an interest-rate corridor - captured by the dummy variable Corridor and set to one forloan transaction after 2009 - has generally resulted in marginally pushing down all loans rates, but this e!ectis small. This is due to increased market rate certainty of banks on returns on excess liquidity.
In column two, we add facility type. As explained earlier, this amounts to adding 50 dummy variablesThe results for each dummy is not reported, however, but it is plain that this addition does not createsignificant changes in the estimated coe"cients.12 In column three, we control for overall bank size and thepass-through of policy decisions by bank size. First, the dummy BigBank is a bank size dummy and is setto one for big banks. The result is that, generally, loan agreements with bigger banks tend to have lower
12The top five products have positive and statistically significant coe!cients, however, for the sake of completeness we includefacility type as a control variable in the estimations, henceforth.
9
prices. This result is true for any specification. This strong-bank e!ect is consistent with both the idea thatbetter banks work with better borrowers (reference) and have lower cost of funds. Second, we answer thequestion of whether or not bigger banks respond more to policy decisions, when compared with other banks.The interaction dummy ‘Big Bank interaction with Interbank rate’ (the product of BigBank and Interbankvariables) modifies the e!ect of policy decisions and bank-size considered individually. The result is that thepass-through coe"cient of 0.078 is small, but statistically significant. Overall, our results show that banksize is likely to be an important variable in terms of policy pass-through and pricing of individual loans.
The purpose of column four is to document lending behavior and policy pass-through by type of borrower.There are sixteen borrower categories. Tabular logistics imply that in Table 9 we only report the resultof top five borrower types: (i) listed firms, (ii) public sector enterprizes (PSEs), (iii) non-listed firms, (iv)general firms, and (v) small and medium sized firms (SMEs). First, controlling for borrower type changessubstantially the estimated coe"cient on the interbank rate, which tells us that borrower type is an importantvariable in our study. Second, the bank-borrower interaction is also going to be key, because when we alsocontrol for bank size together with borrower type, as in column 5, the estimated coe"cients change again.Therefore, it is preferable to analyze borrowers and banks together and not separately. At this point weturn to the last column in Table 9, which takes into consideration bank size, borrower type and facility.Including facility type is important, as can be observed when we move from results in Column 5 to Column6. Therefore, we control for this in the remaining regressions.
The result on pass-through of policy decisions by borrower type are given by the interaction of borrower typewith the interbank rate in the last column of Table 9. The result are striking. For example, the pass-throughe!ect to small and medium sized enterprises (SME-interbank) is strong (0.0917) and significant, compared toany other category of firms. For the general firm category (gen-interbank), the pass-through is negative andsignificant, while for all other categories it is insignificant. Therefore, this is the first evidence that policypass-through is unequally distributed across borrowers.
The results of individual pure borrower-type e!ects (a level e!ect) on loans are mixed. Less risky firms (listedfirms) are generally o!ered loan rates lower than riskier ones (general or non listed firms). These e!ects arealso significant, while the former are not. However, the SME sector, a risky sector, also gets concessions,while public sector firms (PSEs) pay more. We resolve this issue by considering who is lending to whom andat what point in time. For example, a SME firm with a big bank can potentially get a lower loan price thanan SME firm with a weak bank. There are many such cases in our database implying that one would obtainthe type of results we just described (see Table 4).
To summarize, we have found that bank size and borrower type e!ects matter considerably in determiningloan prices. Also, there is initial evidence that bigger banks o!er better rates and have small, but positive,pass-through, and policy pass through is largely biased towards small and medium sized firms. Therefore,we observe evidence of bank and borrower balance sheets e!ects on loan pricing.
3.3.2 The Regime E!ect
In our opening exercise, we do not say anything about aspects of the credit view between regimes, i.e. beforeand after sharp monetary contractions. This is now explored in Table 10, where we split the data before andafter September 2008 BOP crisis, which was followed by a marked rise in interest rates.
In the post-monetary tightening scenario, there is a considerable rise in loan price elasticities with respectto policy decisions. This implies that a 1% change in policy rate raises individual loans rates by moreduring a period of monetary contractions. Indeed, after controlling for heterogeneities the pure transmissione!ect increase from 0.357 to 0.574 (See Table 10, last two columns). This supports the macro evidence onanticyclical spreads we saw in Section 2.
Noticeably, we also find that, after controlling for facility and borrower type, big banks switch their behavior
10
towards policy pass-through between regimes. Indeed, in bad times the estimated policy pass-throughcoe"cient of big banks (Big Bank-interbank) is negative, small and insignificant. This is probably becausetheir own cost of funding and borrower mix is better than smaller and medium sized banks, which allowsthem to absorb policy shocks. This ‘strong bank’ e!ect is in line in with Hubbard et al. (2002).
The monetary policy pass-through e!ect by borrower carries important lessons. This e!ect is captured byadding the coe"cients of overall policy pass-through and the dummy of interaction between borrower typeand our policy decision variable. For example, take the post crisis period (Column 8): the pass-through tothe weakest borrower - the small and medium sized firms - is the strongest (0.57-0.06), while it is the weakestfor listed firms (0.57-0.25). This e!ect holds for all categories of borrowers and is quite significant.
Thus, the results clearly demonstrate that after controlling for loan, borrower and bank-type heterogeneities,policy shocks are unequally distributed between borrowers, a result that bodes especially well with the ideaof the balance-sheet channel. These findings are in line with the credit view literature, which show that wellestablished firms face better loan conditions following monetary impulses (see, for example, Hubbard et al.,2002 and Gertler and Ghilcrist, 1994).
Overall, results from our sample provide evidence that (i) loan conditions are, in general, unevenly peggedwith the policy decisions across borrowers, (ii) borrowers get an uneven distribution of policy treatments and(iii) bigger banks tend to absorb policy shocks. The results continue to hold after we control for borrower,product and loan characteristics.
3.3.3 The Bank-Borrower Relationship
Thus far, we have assessed how the impact of policy di!ers by bank size, borrower type and regime. Wenow further probe how these attributes interact. This would allow us to capture, to a certain extent, howbank-borrower relations operate for di!erent regimes and banks.
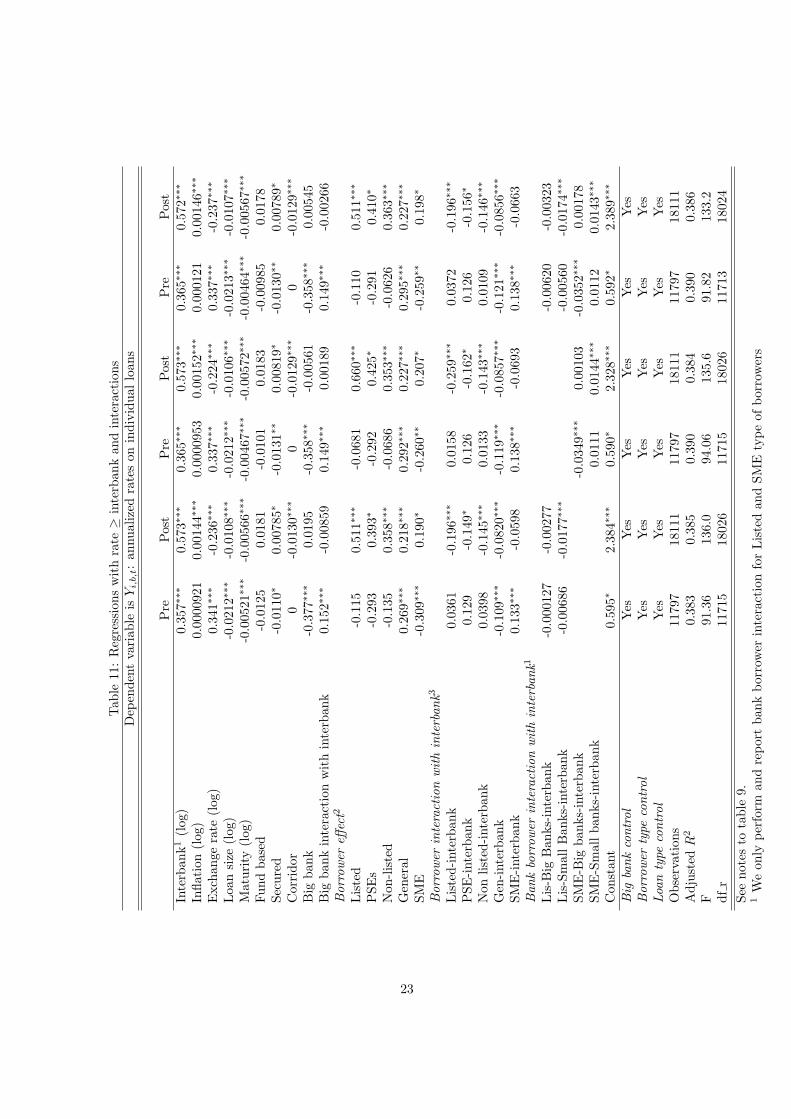
These e!ects are captured by comparing policy transmission of weak and strong borrowers in weak andstrong banks. For this, we create a three way dummy variable. For example, to work out the extent of policypass-through of small banks to weak borrowers - which are SMEs here - in a recession, we create a newinteractive dummy variable defined as the product of dummies of SME and weak bank with the interbankrates SME ! SmallBanks! Interbank. This variable is then used in pre and post-crisis regressions of (2).
The results in Table 11, last two columns, are remarkable. Indeed, during a contractionary period, weakborrowers at weak banks have higher transmission (0.0143), while weak borrowers at strong banks (SME-BigBank-Interbank) are una!ected by policy shocks. Similarly, in a tight period, strong borrowers - listed firms-at strong banks (Listed-Big Bank-Inter Bank) have low pass-through (-0.003) relative to strong borrowersat weak banks, which, in fact, have a negative and statistically significant coe"cient of -0.0174.
This like-for-like borrower comparison shows supporting evidence for the bank-lending channel, where therole of banks in intermediation is a non-neutral one. Similar loan clients being treated di!erently is evidenceof customer-market e!ects in the banking system discussed earlier. Furthermore, smaller banks respondingstrongly to policy decisions also implies that their balance-sheets are relatively more fragile. One can arguethat this e!ect could also be due to the borrower mix of smaller banks. However, in Table (4) we also showthat the borrower mix of a small bank is not too di!erent from that of a bigger bank. This puts emphasison the existence of a pure bank lending channel.
As striking as these results are, the actual impact of weak bank balance-sheets on firms is likely to beunderestimated, in that our data does not take into consideration those firms which were turned down bythe banks.
11
4 Caveats
Literature discussing the credit channel raises three important concerns. First, the identification strategiesto tease out a purely supply-driven reduction of credit may be questionable. Second, small banks tend toattract weaker borrowers and, therefore, will punish them more in times of trouble. However, the questionof whether or not large banks smooth deposit outflows (by issuing debt to ensure a steady loan growth) isof significance (see Ashcraft, 2006 in relation to this). Third, within the context of the credit view, a cleanidentification strategy to distinguish the lending-channel with the balance sheet channel remains important.Hubbard et al. (2002) and Khawaja and Mian (2008) are examples of good identification schemes, but datarequirements remain an important obstacle.
This study is, naturally, subject to some caveats. The main one is the extent to which our sample - repre-senting 20% observations of the universe - is a good representative of the fresh individual loan transactionsand, hence, credit markets. As explained earlier, observations had to be removed due the unavailability ofcertain types of key information. However, we can draw comfort from the fact there is a similarity betweenthe population and our sample in terms of borrower type and bank size, as shown by Table (4).
Another caveat is that the information on borrowers is limited when compared with similar work of Hubbardet al. (2002). However, our data set is richer in information on loan characteristics, type of borrower (whichis assigned by the banks) and the size of banks. Controlling for these thoroughly helps mitigating theweakness on lack of borrower information. The same may be said about the information on banks’ balancesheets. Again, ideally, we would like to match loan information with banks’ balance sheets on the day theindividual loan was agreed. However, such high frequency bank balance sheet is simply not available inPakistan. Nevertheless, this issue is mitigated by controlling for borrower and bank heterogeneities.
Finally, the main criticism in this literature, which also applies to this paper, is that it is not possible todistinguish between demand and supply shocks in the credit market. This is important, in that the bank-lending channel is a pure supply-side phenomenon, while the firm balance-sheet is a demand side one. First,we have tried to address this issue within our data constraints and by using broad categories of bank andborrower types. Second, instead of concentrating on volumes lent, we have looked at loan pricing conditions.
5 Conclusion
We find uncontroversial evidence that banking margins are countercyclical and the overall pass-through ofpolicy decisions to borrowers is greater during monetary contractions. We also show that the distributionof these policy decisions is disproportionate and biased towards the weaker borrower. Furthermore, whilebetter banks stay more muted in terms of policy impulses, weaker banks pass them on, keenly. Also, weakborrowers at better banks get better loan conditions than similar borrowers at weak banks. These resultssuggest that there are customer hold-up e!ects, as well as di!erences in borrower creditworthiness, both ofwhich serve to amplify shocks. Finally, bank lending to the state, an interest inelastic party, also moves toamplify shocks by making overall banking spreads even more anticyclical as the asset of banks’ balance sheettilt towards government paper.
Indeed, our findings generally bode well with Khwaja and Mian (2008), but there the evidence relates tothe quantum of credit, while here the emphasis is on the loan pricing not available to them at that time.Their study on lending volume was based on exceptional circumstances of the 1998 nuclear test. The blastcreated a panic, draining liquidity out of the banking system and encouraged rationing of remaining credittowards borrowers with firmer bank-firm relationships. Although, their database did not have informationon loan-rates, they concluded, using aggregate proxies, that loan rates remain una!ected during the crunch.That is to be expected, as in this period rationing of private credit was an important policy measure.
Our evidence also highlights the importance of the role of banks in developing economies. Research tends to
12
be scarce for such economies (see Agenor and Montiel, 2008 for an overview), but there are a few exceptions,such as the work of Khawaja and Mian’s (2008) discussed above or the paper by Turgutlu (2010) analysinganticyclical banking spreads in Turkey. Furthermore, work on developing countries is gaining importance inthe light of the role which developed economies are expected to play in world economic growth. These makethe subject of this paper a deserving research topic.
Also, our results concentrate on the direction of the pass-through of policy decisions by borrower, banksand the government. However, the potential impact of these results and their respective importance for themacroeconomy are omitted. The objective of this study has been to discover the transmission channels ofpolicy impulses. The extent of their relative importance is left for future work and we think this would bebest studied in a general equilibrium framework. Nonetheless, there is some macroeconomic evidence, suchas in Qayyum, Khan and Khawaja (2005) and Agha et al. (2005), that monetary policy has real e!ects onthe economy.
To conclude, we find that monetary policy decisions have important distributional aspects that simplycannot be addressed within the narrow money-view within the traditional IS/LM setting. These aspects areamplified by the presence of the government as a borrower from the banking sector. Moreover, smaller andfaster growing enterprises disproportionately share the burden of a shock. Thus, because these firms arelikely to be the ones with the higher potential profits and innovation, welfare losses are important. This is,therefore, an important issue for the design of robust stabilization policies.
13

A Figures
Figure 1: Kibor and Discount Rate Relationship
14

B Tables
Table 1: Financial Indicators and GDP
Period
1980s 1990s 2000s
Volatility in Real GDP relative to 1980’s – 2.82 4.25
Financial Assets/GDP 12.27 36.75 69.65
Detrended Financial Asset Correlation with GDP !0.32 0.42 0.60
Detrended M2 Correlation with GDP !0.26 0.42 0.87
Detrended Private Credit Correlation with GDP !0.42 0.07 0.90
Share of Commercial Banks in Financial Sector Assets – 64 (1995) 70 (2005)
Share of Total Deposits in Commercial Bank liabilities – 81 (1995) 84 (2005)
Source: Annual data from the State Bank of Pakistan, financial sector stability
and various financial sector assessment reports for SBP
Table 3a: Bootstrapped and Estimated Correlations for Bivariate VAR
M1-IPI M2-IPI M1-CPI M2- CPI M1-KSEI M2-KSEIUnconditional Correlations -0.690 -0.685 -0.096 -0.110 -0.076 -0.117Estimated Correlation -0.22* -0.24* -0.14* -0.13* -0.14* -0.168*Lower Limit* -0.280 -0.272 -0.375 -0.363 -0.360 -0.360Upper Limit* 0.305 0.343 0.381 0.371 0.366 0.366Table 3b: Bootstrapped and Estimated Correlations for Bivariate VAR with PS**
M1-IPI M2-IPI M1-CPI M2- CPI M1-KSEI M2-KSEIEstimated Correlation -0.578* -0.584* -0.15* -0.16* -0.15* -0.169*Lower Limit* -0.423 -0.0435 -0.363 -0.371 0.373 -0.372Upper Limit* -0.738 -0.740 0.360 0.367 0.321 0.328Table 3c: Bootstrapped and Estimated Correlations for Multivariate VAR
M1-IPI M2-IPI M1-CPI M2- CPI M1-KSEI M2-KSEIEstimated Correlation -0.203* -0.208* -0.112* -0.118* -0.142* -0.161*Lower Limit* -0.273 -0.253 -0.369 -0.364 -0.388 -0.389Upper Limit* 0.351 0.353 0.380 0.371 0.387 0.364Table 3d: Bootstrapped and Estimated Correlations for Multivariate VAR with PS**
M1-IPI M2-IPI M1-CPI M2- CPI M1-KSEI M2-KSEIEstimated Correlation -0.444* -0.467* -0.15* -0.16* -0.18* -0.19*Lower Limit* -0.596 -0.620 -0.384 -0.379 -0.384 -0.374Upper Limit* -0.289 -0.298 0.371 0.374 0.371 0.379*for 95% significance level, M1=Margin 1, M2=Margin 2**PS: Share of Pubic Sector Credit in Total Credit by Scheduled Banks; IPI: Growth of Industrial Production Index:CPI: Year-on-Year Inflation; KSEI: Growth in Karachi Stock Exchange 100 Index
15

Table 3: Data span (April 2006-April2011)
Only Bank Transactions Total Universe % age of Total UniverseTotal Volume of loans (PKR Million) 7,100,528 7,215,633 98.4%No of Observations 140,526 152,872 91.9%No of Borrowers 21,991 23,491 93.6%Number of Banks 43 - -Number of all financial institutions/lenders - 94 -
Loan information (interest rate, size of loan) and removing of subsidized products loansTotal Volume of loans (PKR Million) 1,900,380 1,981,800 95.9%No of Observations 37,481 45,702 82.0%No of Borrowers 10,199 12,155 83.9%Number of Banks 35 - -Number of all financial institutions/lenders - 70
Loan information (interest rate, size of loan) and removing of subsidized products loans andapplying restriction of rate " kbr
Total Volume of loans (PKR Million) 1,462,608 1,540,113 95.0%No of Observations 30,964 39,021 79.4%No of Borrowers 9,044 11,061 81.8%Number of Banks 35 - -Number of all financial institutions/lenders - 70 -
Loan information (interest rate, size of loan) and removing of subsidized products loans andapplying restriction of rate " kbr & tenorlog*
Total Volume of loans (PKR Million) 1,311,670 1,386,059 94.6%No of Observations 29,908 37,866 79.0%No of Borrowers 4,715 5,876 80.2%Number of Banks 35 - -Number of all financial institutions/lenders - 70 -*Loans used for a day are dropped from the sample
16

Tab
le4:
Loa
nsdistribution
byborrower
typean
dban
ktype(%
)by
borrower
type
Ban
kUniverse
Sam
ple
Ban
kUniverse
Sam
ple
Ban
kuniverse
Sam
ple
Borrower
type
Total
Universe
Sam
ple
BB
BB
MB
MB
SB
SB
Autonom
ousbod
y1.9
1.1
2.9
2.0
0.2
0.0
0.6
0.4
Ban
ks/D
Fis
0.2
0.1
0.2
0.1
0.0
0.1
0.0
0.1
Fed
eral
Government
1.4
1.4
2.0
2.4
0.4
0.5
0.1
0.0
Foreign
Con
stituents
1.0
0.1
1.5
0.3
0.1
0.0
0.0
0.0
ListedCom
pan
y19
.510
.217
.79.6
23.0
8.5
22.2
15.9
Local
Bod
y0.3
0.0
0.4
0.0
0.3
0.0
0.0
0.0
Mod
arab
a0.0
0.0
0.1
0.0
0.0
0.1
0.0
0.0
MDB
10.0
0.0
0.0
0.0
0.2
0.0
0.0
0.0
NBFC
20.2
0.1
0.2
0.2
0.2
0.1
0.0
0.0
Non
-listed3
13.6
16.8
9.3
16.3
18.8
12.6
23.4
27.0
Gen
eral
33.1
35.4
35.5
25.4
36.7
59.7
16.4
16.5
Partnership
40.9
0.7
0.2
0.2
3.0
0.9
0.7
1.7
Provincial
Government
2.0
2.7
2.8
4.3
0.4
0.6
1.1
1.9
PublicSectorEnterprise
7.4
11.9
10.8
22.8
1.6
1.0
2.8
0.7
Securities/B
rokerage
Firm
0.6
2.6
0.1
0.6
2.1
6.8
0.0
0.1
SME5
2.3
3.4
2.4
5.7
3.1
1.1
0.4
1.0
Unclassifiied
15.6
13.4
13.9
10.1
9.7
8.0
32.2
34.6
subtotal
100.0
100.0
100
100
100.0
100
100
100
Noof
observations(for
calculation
ofpercentag
es)
152,87
229
,908
140,52
629
,908
140,52
629,908
140,526
29,908
BB
stan
dsforBig
Ban
k,MB
forMed
ium
andSB
forSmallBan
k;1Multilateral
develop
mentban
k;2Non
-Ban
kFinan
ceCom
pan
y;3,4other
than
SMEs;
5Asdefi
ned
inthePrudential
Regulation
sforSME
17

Table 5: Share of Top 5 borrower type in the Total Volume of loans by Banks (29908 observations)
Corporate Borrower type Big Banks Medium Banks Small Banks SubtotalListed 4.8% 2.8% 2.6% 10.2%Non Listed 8.2% 4.2% 4.4% 16.8%SME 2.9% 0.4% 0.2% 3.4%General (other) 15.2% 20.0% 2.4% 37.5%PSEs 11.5% 0.3% 0.1% 11.9%Subtotal 43% 28% 10% 80%
Table 6: Loan characteristics by loan size
Loan Size (PKR Million) Number of facilities Mean Loan Maturity (days) Average spread* Fraction Secured# 20 11482 509 3.20 0.7820# 50 5224 252 3.27 0.9650#125 3768 276 3.04 0.96125#500 5370 271 2.67 0.96500#1000 1739 298 2.20 0.97>1000 2325 396 1.98 0.94All 29908 371 2.94 0.89
*spread between benchmark interest rate and interest rate on loan
18

Tab
le7:
Loa
ncharacteristicsby
borrower
type
Borrower
type
Noof
facilities
MeanLoa
nMaturity
(day
s)Average
interest
rate
Average
Interban
kAverage
spread
*FractionSecured
Autonom
ousbod
y45
128
815
.24
13.09
2.15
0.54
Ban
ks/D
Fis
1,10
420
714
.07
12.34
1.72
0.19
Fed
eral
Government
4141
113
.34
11.23
2.11
0.39
Foreign
Con
stituents
1243
015
.18
13.54
1.64
1.00
ListedCom
pan
y1,65
326
814
.95
12.36
2.59
0.99
Local
Bod
y1
203
11.00
10.20
0.80
1.00
Mod
arab
a7
363
13.29
10.36
2.93
1.00
MDB
17
178
15.41
12.41
3.00
1.00
NBFC
222
580
13.83
11.86
1.97
0.95
Non
-listed3
3,34
527
914
.68
12.17
2.51
0.97
Gen
eral
12,469
370
15.44
12.40
3.04
0.89
Partnership
443
523
715
.57
12.35
3.22
0.96
Provincial
Government
6520
115
.18
12.89
2.29
0.98
PublicSectorEnterprise
666
268
14.78
11.98
2.80
0.80
Securities/B
rokerage
Firm
330
244
15.13
12.64
2.49
0.96
SME5
3,81
935
615
.15
11.73
3.42
0.90
Unclassifiied
5,48
154
315
.63
12.51
3.12
0.98
All
29,908
371
15.25
12.31
2.94
0.89
*spread
betweenben
chmarkinterest
rate
andinterest
rate
onloan
,1Multilateral
develop
mentban
k,2Non
-Ban
kFinan
ceCom
pan
y,3,4other
than
SMEs
5Asdefi
ned
inthePrudential
Regulation
sforSME
19

Tab
le8:
Loa
ncharacteristicsby
Borrower
type&
Ban
ktype
Noof
facilities
MeanMaturity
(day
s)Average
interest
rate
Average
interban
kAverage
spread
*FractionSecured
Borrower
type
BB
MB
SB
BB
MB
SB
BB
MB
SB
BB
MB
SB
BB
MB
SB
BB
MB
SB
Autonom
ousbod
y21
214
225
352
585
210
16.12
14.90
14.44
13.28
12.59
12.95
2.85
2.31
1.49
0.97
1.00
0.11
Ban
ks/D
Fis
44
1096
686
312
205
12.92
11.49
14.08
12.12
10.78
12.35
0.80
0.71
1.73
1.00
1.00
0.18
Fed
eral
Government
383
040
154
513
.19
15.18
11.09
12.92
2.10
2.26
0.34
1.00
Foreign
Con
stituents
92
144
555
943
14.60
16.70
17.41
13.55
14.08
12.39
1.05
2.26
5.02
1.00
1.00
1.00
ListedCom
pan
y57
473
334
630
921
730
615
.07
14.99
14.68
12.60
12.06
12.58
2.47
2.92
2.10
0.99
1.00
1.00
Local
Bod
y1
203
11.00
10.20
12.75
0.80
4.66
1.00
Mod
arab
a2
41
618
254
288
11.80
13.00
17.41
9.72
10.08
2.08
2.92
1.00
1.00
1.00
MDB
17
017
815
.41
12.41
3.00
2.52
1.00
NBFC
27
132
305
782
231
11.66
14.85
14.77
10.95
12.29
12.25
0.71
2.56
2.41
0.86
1.00
1.00
Non
-listed3
1,38
71,38
457
426
829
028
015
.31
14.26
14.21
12.76
11.72
11.80
2.54
2.53
2.51
0.93
1.00
1.00
Gen
eral
4,04
86,56
318
,58
320
423
289
15.45
15.71
14.50
12.34
12.56
11.99
3.11
3.15
3.27
0.93
1.00
0.43
Partnership
414
025
243
268
177
485
15.40
15.79
14.83
12.29
12.52
11.56
3.11
3.28
1.95
0.89
1.00
1.00
PG
552
310
131
771
396
15.31
14.34
14.75
12.94
12.31
12.80
2.37
2.03
5.03
0.98
1.00
1.00
PSEs6
615
3813
249
526
428
14.72
14.98
17.07
11.96
12.30
12.05
2.76
2.68
2.25
0.78
1.00
1.00
Securities/B
rokerage
2730
03
193
249
247
13.24
15.31
13.90
10.78
12.82
11.65
2.46
2.50
4.32
0.67
0.99
1.00
SME7
3094
377
348
335
350
546
14.92
15.61
16.76
11.71
11.23
13.43
3.20
4.38
2.70
0.88
0.99
0.97
Unclassifiied
2410
2,00
51,06
625
597
038
915
.24
16.45
14.96
12.19
13.03
12.25
3.04
3.42
2.44
0.99
1.00
0.92
All
12,619
11,703
5,58
630
147
730
715
.20
15.60
14.63
12.21
12.47
12.19
3.00
3.13
0.92
1.00
0.60
BB
stan
dsforBig
Ban
k,MB
forMed
ium
andSB
forSmallBan
k,*spread
betweenben
chmarkinterest
rate
andinterest
rate
onloan
,1Multilateral
develop
mentban
k,2Non
-Ban
kFinan
ceCom
pan
y,3,4other
than
SME,5Provincial
Government,6PublicSectorEnterprise
7Asdefi
ned
inthePrudential
Regulation
sforSME,
20

Tab
le9:
Mainregression
controllingfordi!erentcharacteristicsan
dwithrestrictionrate
"interban
kDep
endentvariab
leis
Yi,b,t:
annu
alized
rateson
individual
loan
s
Interban
k1(log
)0.45
4!!!
0.47
6!!!
0.41
9!!!
0.47
3!!!
0.44
8!!!
0.45
9!!!
Inflation(log
)0.00
168!
!!0.00
0885
!!!
0.00
158!
!!0.00
145!
!!0.00
142!
!!0.00
0648
!!
Exchan
gerate
(log
)0.30
0!!!
0.28
3!!!
0.30
1!!!
0.31
9!!!
0.31
4!!!
0.27
3!!!
Loa
nsize
(log
)-0.013
5!!!
-0.016
0!!!
-0.013
6!!!
-0.013
5!!!
-0.013
4!!!
-0.014
8!!!
Maturity
(log
)-0.001
03!
-0.004
50!!
!-0.000
741
-0.001
32!!
-0.001
38!!
-0.005
71!!
!
Private
-0.009
20!!
!-0.009
53!!
!
Fundbased
-0.044
5!!!
-0.003
69-0.043
3!!!
-0.030
3!!!
-0.032
7!!!
-0.001
84Secured
0.07
57!!
!-0.006
41!
0.07
50!!
!0.04
95!!
!0.05
02!!
!-0.008
19!!
Corridor
-0.038
6!!!
-0.037
3!!!
-0.038
0!!!
-0.038
6!!!
-0.037
9!!!
-0.036
8!!!
Big
ban
k-0.192
!!!
-0.221
!!!
-0.245
!!!
Big
ban
kintereaction
withInterban
k0.07
83!!
!0.08
67!!
!0.09
50!!
!
Borrower
e!ect2
Listed
-0.098
4-0.092
9-0.198
!!!
PSEs
0.01
760.15
0!0.07
10Non
-listed
-0.109
!-0.117
!!-0.188
!!!
Gen
eral
0.19
2!!!
0.21
7!!!
0.19
2!!!
SMEs
-0.209
!!!
-0.103
!-0.199
!!!
Borrower
interactionwithInterban
k3
Listed-interban
k0.02
970.02
680.07
35!!
PSE-interban
k-0.003
40-0.056
0-0.0257
Non
listed
-interban
k0.03
210.03
430.06
58!!
!
Gen
-interban
k-0.076
8!!!
-0.087
1!!!
-0.073
3!!!
SME-interban
k0.09
18!!
!0.04
94!!
0.09
17!!
!
Con
stan
t0.47
4!!!
0.46
4!!!
0.56
0!!!
0.36
1!!!
0.44
6!!!
0.54
7!!!
Big
Ban
kcontrol
No
No
Yes
No
Yes
Yes
Borrower
type
control
No
No
No
Yes
Yes
Yes
Loantype
control
No
Yes
No
No
No
Yes
Observations
2990
829
908
2990
829
908
2990
829
908
Adjusted
R2
0.47
10.50
60.47
20.49
60.49
70.52
4F
2957
.256
7.9
2432
.575
4.4
721.3
379.9
dfm
954
1139
4187
dfr
2989
829
853
2989
629
868
2986
629
820
Eve
ryregression
reportmodelsresu
ltsof
only
ban
kstran
sactions
!p<
0.05
,!!
p<
0.01
,!!
!p<
0.00
11Interban
kis
therelevant
interban
kinterest
rate
2,3
Weon
lyreporttopfive
borrower
types
21

Tab
le10
:Regressionswithrate
"interban
kan
dPre
andPostBalan
ceof
Payments
Crisis
Dep
endentvariab
leis
Yi,b,t:
annu
alized
rateson
individual
loan
s
Pre
Post
Pre
Post
Pre
Post
Pre
Post
Interban
k(log
)0.39
7!!!
0.48
2!!!
0.25
6!!!
0.49
0!!!
0.29
1!!!
0.63
8!!!
0.35
7!!!
0.574!
!!
Inflation(log
)0.00
0048
30.00
159!
!!0.00
0661
0.00
280!
!!0.00
0381
0.00
227!
!!0.00
00618
0.00150!
!!
Exchan
gerate
(log
)0.34
3!!!
-0.253
!!!
0.43
8!!!
-0.378
!!!
0.47
6!!!
-0.292
!!!
0.34
4!!!
-0.223
!!!
Loa
nsize
(log
)-0.023
2!!!
-0.011
7!!!
-0.017
9!!!
-0.011
6!!!
-0.016
5!!!
-0.011
7!!!
-0.021
3!!!
-0.0107!
!!
Maturity
(log
)-0.002
83!
-0.005
38!!
!0.00
253!
-0.000
542
-0.000
832
-0.001
51!!
-0.005
20!!
!-0.00572
!!!
Private
-0.006
81-0.003
72-0.013
9!!!
-0.001
17-0.013
3!!
-0.007
45!!
Fundbased
-0.011
90.01
64-0.094
4!!!
0.01
39!!
!-0.092
6!!!
0.03
12!!
!-0.012
40.0185
Secured
-0.012
8!!
0.01
22!!
0.05
06!!
!0.10
3!!!
0.04
16!!
!0.06
47!!
!-0.011
0!0.00822!
Corridor
0-0.011
3!!!
0-0.006
54!
0-0.011
3!!!
0-0.0131!
!!
Big
ban
k-0.451
!!!
0.08
27-0.531
!!!
0.19
0!!!
-0.377
!!!
0.00853
Big
ban
kintereaction
withinterban
k0.18
8!!!
-0.028
70.21
7!!!
-0.071
1!!!
0.15
2!!!
-0.00411
Borrower
e!ect
Listed
-0.064
10.89
1!!!
-0.136
0.658!
!!
PSEs
-0.265
0.54
6!!
-0.293
0.408!
Non
-listed
-0.104
0.50
9!!!
-0.133
0.349!
!!
Gen
eral
0.35
1!!!
0.38
8!!!
0.27
0!!!
0.217!
!!
SME
-0.196
!0.24
3!!
-0.309
!!!
0.201!
Borrower
interactionwithinterban
kListed-interban
k0.01
08-0.349
!!!
0.04
34-0.258
!!!
PSE-interban
k0.11
3-0.209
!!0.12
9-0.155
!
Non
listed
-interban
k0.02
62-0.202
!!!
0.03
92-0.141
!!!
Gen
-interban
k-0.147
!!!
-0.147
!!!
-0.109
!!!
-0.0819!
!!
SME-interban
k0.08
56!
-0.078
5!0.13
2!!!
-0.0640
Con
stan
t0.50
7!2.70
2!!!
0.50
6!3.22
4!!!
0.28
72.50
1!!!
0.58
6!2.321!
!!
Big
Ban
kcontrol
No
No
Yes
Yes
Yes
Yes
Yes
Yes
Borrower
type
control
No
No
No
No
Yes
Yes
Yes
Yes
Loantype
control
Yes
Yes
No
No
No
No
Yes
Yes
Observations
1179
718
111
1179
718
111
1179
718
111
1179
718111
Adjusted
R2
0.36
10.36
60.32
20.29
80.34
60.33
50.38
30.384
F13
1.6
202.4
560.0
700.8
169.8
229.2
93.66
138.4
dfm
5152
1011
3740
7982
dfr
1174
518
058
1178
618
099
1175
918
070
1171
718028
See
notes
toTab
le9.
22
Tab
le11
:Regressionswithrate
"interban
kan
dinteractions
Dep
endentvariab
leis
Yi,b,t:
annu
alized
rateson
individual
loan
s
Pre
Post
Pre
Post
Pre
Post
Interban
k1(log
)0.35
7!!!
0.57
3!!!
0.36
5!!!
0.57
3!!!
0.36
5!!!
0.572!
!!
Inflation(log
)0.00
0092
10.00
144!
!!0.00
0095
30.00
152!
!!0.00
0121
0.00
146!
!!
Exchan
gerate
(log
)0.34
1!!!
-0.236
!!!
0.33
7!!!
-0.224
!!!
0.33
7!!!
-0.237
!!!
Loa
nsize
(log
)-0.021
2!!!
-0.010
8!!!
-0.021
2!!!
-0.010
6!!!
-0.021
3!!!
-0.0107!
!!
Maturity
(log
)-0.005
21!!
!-0.005
66!!
!-0.004
67!!
!-0.005
72!!
!-0.004
64!!
!-0.00567
!!!
Fundbased
-0.012
50.01
81-0.010
10.01
83-0.009
850.0178
Secured
-0.011
0!0.00
785!
-0.013
1!!
0.00
819!
-0.013
0!!
0.00
789!
Corridor
0-0.013
0!!!
0-0.012
9!!!
0-0.0129!
!!
Big
ban
k-0.377
!!!
0.01
95-0.358
!!!
-0.005
61-0.358
!!!
0.00545
Big
ban
kinteractionwithinterban
k0.15
2!!!
-0.008
590.14
9!!!
0.00
189
0.14
9!!!
-0.00266
Borrower
e!ect2
Listed
-0.115
0.51
1!!!
-0.068
10.66
0!!!
-0.110
0.511!
!!
PSEs
-0.293
0.39
3!-0.292
0.42
5!-0.291
0.410!
Non
-listed
-0.135
0.35
8!!!
-0.068
60.35
3!!!
-0.062
60.363!
!!
Gen
eral
0.26
9!!!
0.21
8!!!
0.29
2!!!
0.22
7!!!
0.29
5!!!
0.227!
!!
SME
-0.309
!!!
0.19
0!-0.260
!!0.20
7!-0.259
!!0.198!
Borrower
interactionwithinterban
k3
Listed-interban
k0.03
61-0.196
!!!
0.01
58-0.259
!!!
0.03
72-0.196
!!!
PSE-interban
k0.12
9-0.149
!0.12
6-0.162
!0.12
6-0.156
!
Non
listed
-interban
k0.03
98-0.145
!!!
0.01
33-0.143
!!!
0.01
09-0.146
!!!
Gen
-interban
k-0.109
!!!
-0.082
0!!!
-0.119
!!!
-0.085
7!!!
-0.121
!!!
-0.0856!
!!
SME-interban
k0.13
3!!!
-0.059
80.13
8!!!
-0.069
30.13
8!!!
-0.0663
Ban
kborrow
erinteractionwithinterban
k1
Lis-B
igBan
ks-interban
k-0.000
127
-0.002
77-0.006
20-0.00323
Lis-SmallBan
ks-interban
k-0.006
86-0.017
7!!!
-0.005
60-0.0174!
!!
SME-B
igban
ks-interban
k-0.034
9!!!
0.00
103
-0.035
2!!!
0.00178
SME-Smallban
ks-interban
k0.01
110.01
44!!
!0.01
120.0143
!!!
Con
stan
t0.59
5!2.38
4!!!
0.59
0!2.32
8!!!
0.59
2!2.389!
!!
Big
bankcontrol
Yes
Yes
Yes
Yes
Yes
Yes
Borrower
type
control
Yes
Yes
Yes
Yes
Yes
Yes
Loantype
control
Yes
Yes
Yes
Yes
Yes
Yes
Observations
1179
718
111
1179
718
111
1179
718
111
Adjusted
R2
0.38
30.38
50.39
00.38
40.39
00.386
F91
.36
136.0
94.06
135.6
91.82
133.2
dfr
1171
518
026
1171
518
026
1171
318
024
See
notes
totable
9.1Weon
lyperform
andreportban
kborrower
interactionforListedan
dSME
typeof
borrowers
23
References
[1] Agha, A. I., Ahmed, N., Mubarik, Y. and Shah, H. (2005), Transmission mechanism of monetary policyin Pakistan, SBP working paper 09, State Bank of Pakistan.
[2] Aliaga-Dı́az, R. and Olivero, M. P. (2006), The cyclical behavior of banks price-cost margins, DrexelUniversity Faculty Research and Publications (Economics and International Business), November.
[3] Aliaga-Dı́az, R. and Olivero, M. P. (2010), Is there a financial accelerator in US banking? Evidencefrom the cyclicality of banks’ price-cost margins, Economics Letters, 108, 167-171.
[4] Angelini, P. and Cetorelli, N. (2003), The E!ects of Regulatory Reform on Competition in the BankingIndustry, Journal of Money, Credit and Banking, 35, 663-684.
[5] Ashcraft, A. B. (2006), New Evidence on the Lending Channel, Journal of Money, Credit and Banking,38, 751-775.
[6] Agenor, P. and Montiel, P. J. (2008), Development Macroeconomics, 3rd edition, Princeton UniversityPress.
[7] Choudhary, M. A., S. Memood, A. F., Hanif, N. and Pasha, F. (2011), Price Discoveries: Results fromStructured Interviews, University of Surrey, Working paper no 1011.
[8] Bernanke, B. S. (1983a), Credit in the macroeconomy, Quarterly Review, Federal Reserve Bank of NewYork, 18, 50-70.
[9] Bernanke, B. S. (1983b), Nonmonetary E!ects of the Financial Crisis in the Propagation of the GreatDepression, American Economic Review, 73, 257-276.
[10] Bernanke, B. S. and Blinder, A. S. (1992), The Federal Funds Rate and the Channels of MonetaryTransmission, American Economic Review, 82, 901-921.
[11] Bernanke, B. S. and Gertler, M. (1989), Agency Costs, Net Worth, and Business Fluctuations, AmericanEconomic Review, 79, 14-31.
[12] Bernanke, B. S. and Gertler, M. (1995), Inside the Black Box: The Credit Channel of Monetary PolicyTransmission, Journal of Economic Perspectives, 9, 27-48.
[13] Bernanke, B. S., Gertler, M. and Gilchrist, S. (1996), The Financial Accelerator and the Flight toQuality, Review of Economics and Statistics, 78, 1-15.
[14] Bernanke, B. S., Gertler, M. and Gilchrist, S. (1998), The Financial Accelerator in a QuantitativeBusiness Cycle Framework, NBER Working Papers 6455, National Bureau of Economic Research.
[15] Cecchetti, S. G. (1995), Distinguishing Theories of the Monetary Transmission Mechanism, FederalReserve Bank of St. Louis Review, 77, 83-97.
[16] Chen, Y., Higgins, E. and Mason, J. (2005), Is Bank E"ciency Cyclical? The Relationship BetweenEconomic and Financial Market Conditions and Bank Performance, Drexel University working paper,January.
[17] den Haan, Wouter J. (2000), The comovement between output and prices, Journal of Monetary Eco-nomics, 46, 3-30.
[18] Edwards, F. R. and Mishkin, F. S. (1995), The Decline of Traditional Banking: Implications for FinancialStability and Regulatory Policy, NBER Working Papers 4993, National Bureau of Economic Research.
[19] Gali J. (1994), Monopolistic Competition, Business Cycles, and the Composition of Aggregate Demand,Journal of Economic Theory, 63, 73-96.
24

[20] Gertler, M. and Gilchrist, S. (1994), Monetary Policy, Business Cycles, and the Behavior of SmallManufacturing Firms, Quarterly Journal of Economics, 109, 309-340.
[21] Hubbard, R. G. (2000), Capital-Market Imperfections, Investment, and the Monetary TransmissionMechanism, mimeograph, Columbia University.
[22] Hubbard, R. G., Kuttner, K. and Palia, D. (2002), Are There Bank E!ects in Borrowers’ Costs ofFunds? Evidence from a Matched Sample of Borrowers and Banks, Journal of Business, 75, 559-581.
[23] Hussein, S., Saeed, A. and Hassan, A. (2011), The Finanical Accelerator: An Emerging Market Story,State Bank of Pakistan, Working Paper 41.
[24] Kashyap, A. K. and Stein, J. C. (1994), Monetary Policy and Bank Lending, in N. Gregory Mankiw(ed.), Monetary Policy, 221-56, University of Chicago Press, Chicago.
[25] Kashyap, A. K., and Stein, J. C. (2000), What Do a Million Observations on Banks Say about theTransmission of Monetary Policy?, American Economic Review, 90, 407-428.
[26] Khwaja, A. I. and Mian, A. (2005), Do lenders favor politically connected firms? Rent provision in anemerging financial market, Quarterly Journal of Economics, 120, 1371-1411.
[27] Khwaja, A. I. and Mian, A. (2008), Tracing the Impact of Bank Liquidity Shocks: Evidence from anEmerging Market, American Economic Review, 98, 1413-1442.
[28] Kishan, R. P. and Opiela, T. P. (2000), Bank Size, Bank Capital, and the Bank Lending Channel,Journal of Money, Credit and Banking, 32, 121-141.
[29] Meltzer, A. H. (1995), Monetary, Credit and (Other) Transmission Processes: A Monetarist Perspective,Journal of Economic Perspectives, 9, 49-72.
[30] Mishkin, F. S. (1995), Symposium on the Monetary Transmission Mechanism, Journal of EconomicPerspectives, 9, 3-10.
[31] Okun, A. M. (1981), Prices and Quantities, A Macroeconomic Analysis, Basil Blackwell, Oxford.
[32] Peek, J. and Rosengren, E. S. (1992), Crunching the recovery: bank capital and the role of bank credit,Conference Series; [Proceedings], Federal Reserve Bank of Boston, 151-186.
[33] Stock, J. H. and Watson, M. W. (1998), Business Cycle Fluctuations in U.S. Macroeconomic TimeSeries, in J. B. Taylor and M. Woodford (eds.), Handbook of Macroeconomics, Vol. 1, 3-64, Elsevier.
[34] Phelps, E. S. and Sidney, G. W. Jr. (1970), Optimal Price Policy under Atomistic Competition, inEdmund. S. Phelps, Microeconomic Foundations of Employment and Inflation Theory, Norton, NewYork.
[35] Qayyum, A., Khan, S. and Khawaja, I, 2005. Interest Rate Pass-through in Pakistan: Evidence fromTransfer Function Approach, The Pakistan Development Review, 44, 975-1001.
[36] Rosenwald, F. (1998), Cout du credit et montant des prets: une interpretation en terme de canal largedu credit, Revue Economique, 49, 1103-1127.
[37] State Bank of Pakistan, 1990-2000. Financial Sector Assessment, The State Bank of Pakistan.
[38] State Bank of Pakistan, 2001-2002. Financial Sector Assessment, The State Bank of Pakistan.
[39] State Bank of Pakistan, 2005. Financial Sector Assessment, The State Bank of Pakistan.
[40] State Bank of Pakistan 2006. Financial Stability and Risk Assessment Financial Stability Review, TheState Bank of Pakistan.
25

[41] State Bank of Pakistan 2006, Executive Summary: Financial Stability and Risk Assessment, FinancialStability Review, The State Bank of Pakistan, i-iv.
[42] Taylor, J. B. (1995), The Monetary Transmission Mechanism: An Empirical Framework, Journal ofEconomic Perspectives, 9, 11-26.
[43] Turgutlu, E. (2010), Cyclical behavior of price-cost margins in the Turkish banking industry, EconomicModelling, 27, 368-374.
26