disease progress models diane r mould projections research inc phoenixville pa
TRANSCRIPT

Disease Progress Models
Diane R Mould
Projections Research IncPhoenixville PA
Clinical Pharmacology=
Disease Progress + Drug Action*
*It also follows that “Drug Action” = Drug Effect + Placebo Effect
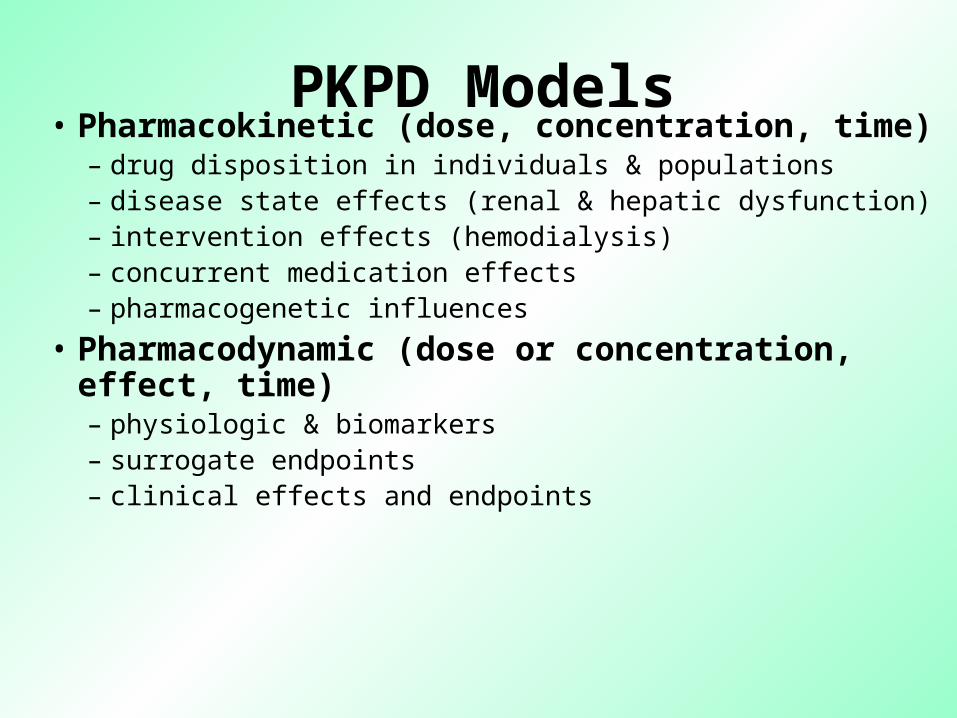
PKPD Models• Pharmacokinetic (dose, concentration, time)
– drug disposition in individuals & populations – disease state effects (renal & hepatic dysfunction)– intervention effects (hemodialysis)– concurrent medication effects– pharmacogenetic influences
• Pharmacodynamic (dose or concentration, effect, time)– physiologic & biomarkers– surrogate endpoints– clinical effects and endpoints
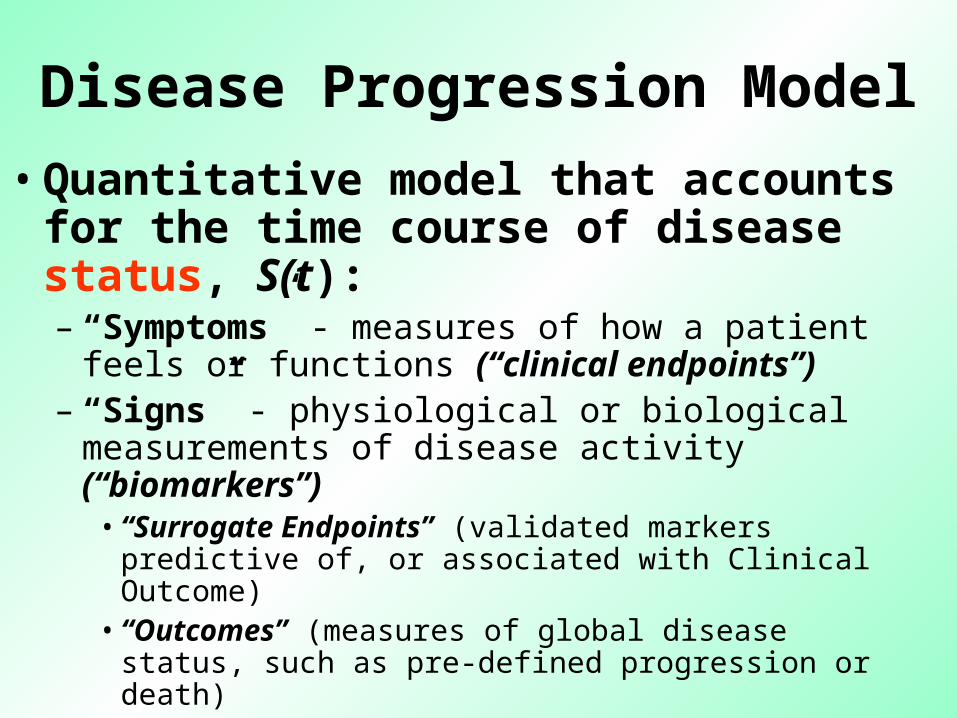
Disease Progression Model
•Quantitative model that accounts for the time course of disease status, S(t):– “Symptoms” - measures of how a patient
feels or functions (“clinical endpoints”)– “Signs” - physiological or biological
measurements of disease activity (“biomarkers”) •“Surrogate Endpoints” (validated markers
predictive of, or associated with Clinical Outcome) •“Outcomes” (measures of global disease status,
such as pre-defined progression or death)
Motivations for Disease Progression Models
• Visualization of the time course of disease in
treated and untreated conditions
• Evaluation of various disease interventions
• Simulation of possible future courses of
disease
• Simulation of clinical trials
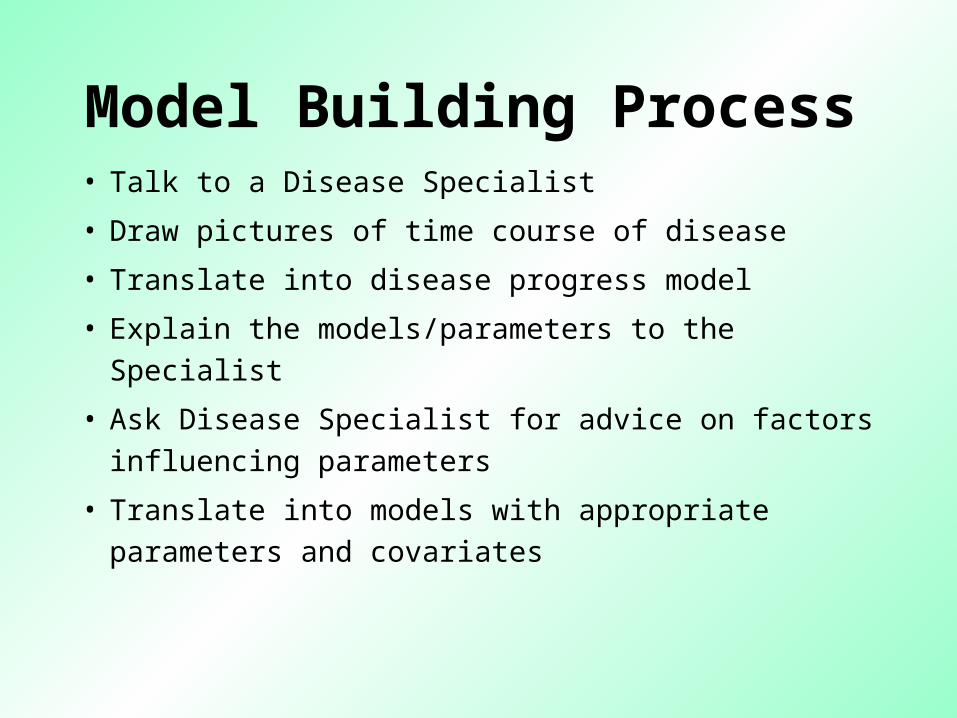
Model Building Process• Talk to a Disease Specialist
• Draw pictures of time course of disease
• Translate into disease progress model
• Explain the models/parameters to the Specialist
• Ask Disease Specialist for advice on factors influencing parameters
• Translate into models with appropriate parameters and covariates
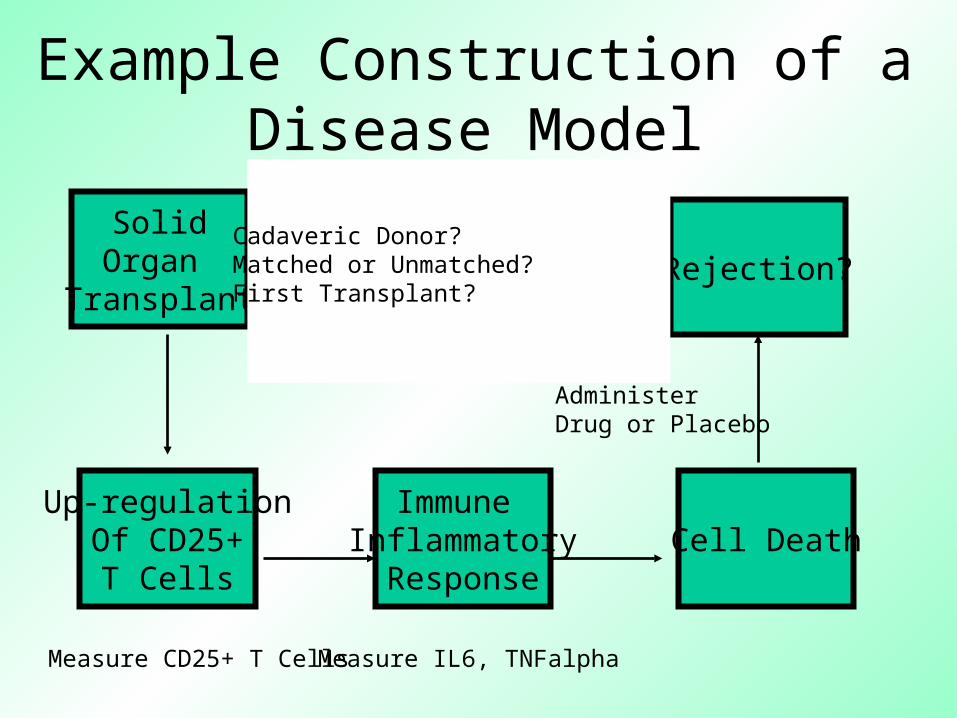
Example Construction of a Disease Model
SolidOrgan
TransplantRejection?
Administer Drug or PlaceboCadaveric Donor?Matched or Unmatched?First Transplant?
Up-regulationOf CD25+
T Cells
Measure CD25+ T Cells
Immune Inflammatory
Response
Measure IL6, TNFalpha
Cell Death
Administer Drug or Placebo
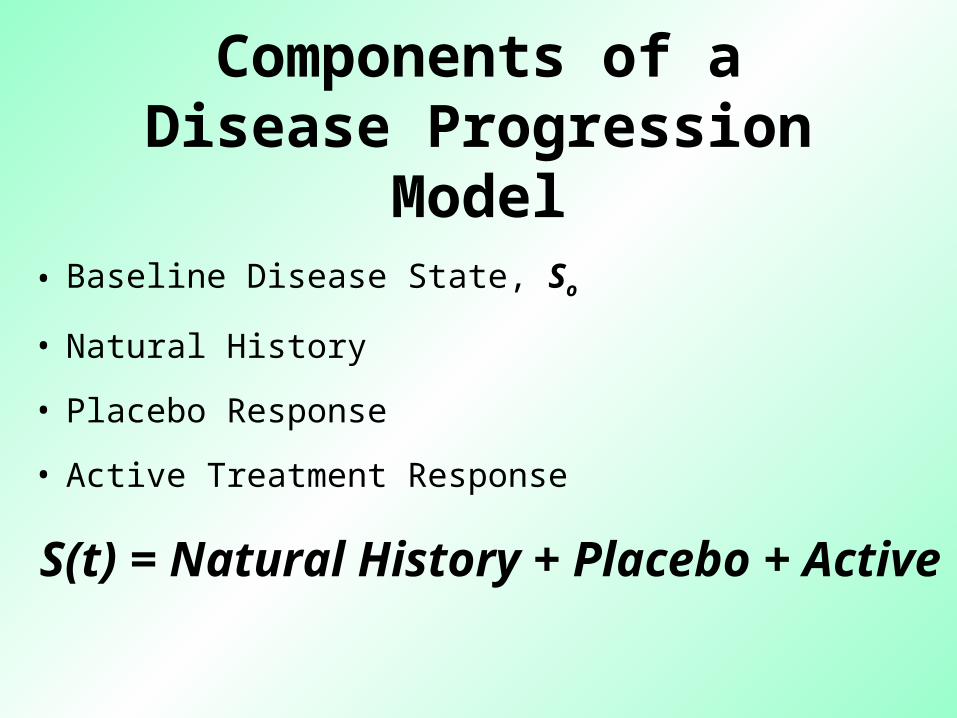
Components of a Disease Progression
Model• Baseline Disease State, So
• Natural History
• Placebo Response
• Active Treatment Response
S(t) = Natural History + Placebo
+ Active
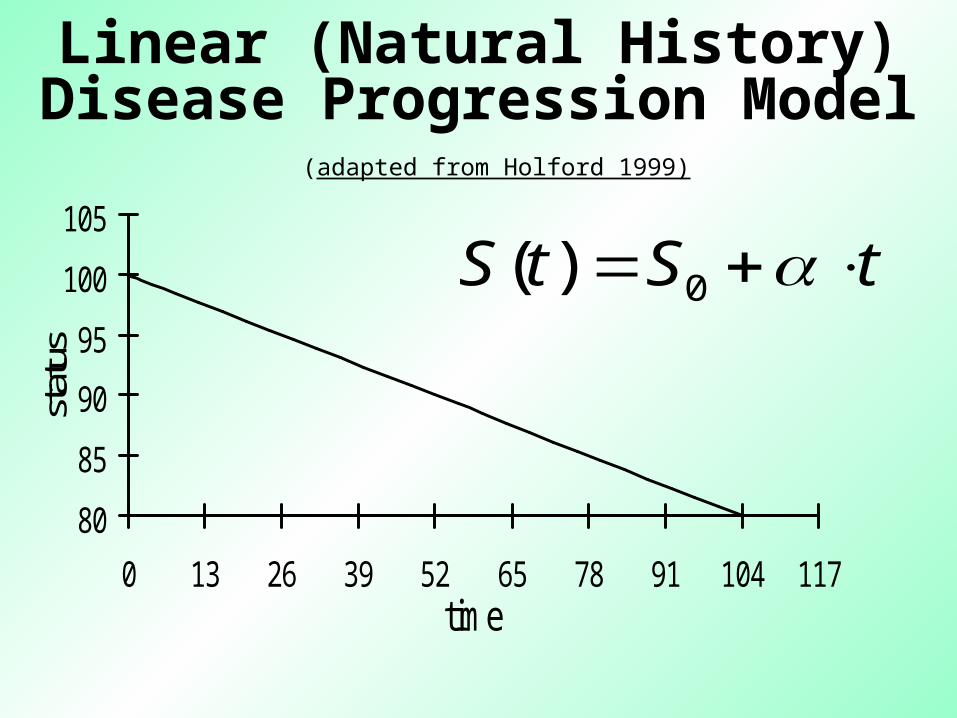
Linear (Natural History) Disease Progression Model
(adapted from Holford 1999)
tStS 0)(
80
85
90
95
100
105
0 13 26 39 52 65 78 91 104 117time
stat
us
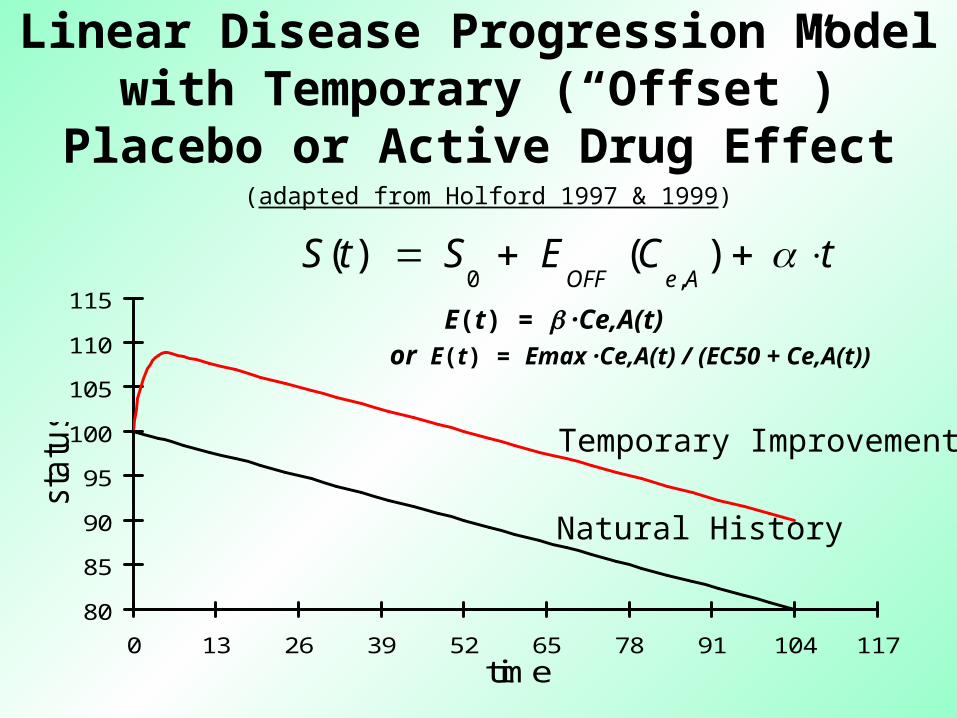
Linear Disease Progression Model with Temporary (“Offset”)
Placebo or Active Drug Effect (adapted from Holford 1997 & 1999)
E(t) = ·Ce,A(t) or E(t) = Emax ·Ce,A(t) / (EC50 +
Ce,A(t))
80
85
90
95
100
105
110
115
0 13 26 39 52 65 78 91 104 117time
sta
tus
Natural History
Temporary Improvement
tCEStSAeOFF
)()(,0

Handling Pharmacokinetic Data for Disease Progress
Models• Use actual measured concentrations
– This is easy to do• Use a “Link” model to create a lag
between observed concentrations and observed effect– This is more “real” as the time course
for change in disease status is usually not the same as the time course of the drug
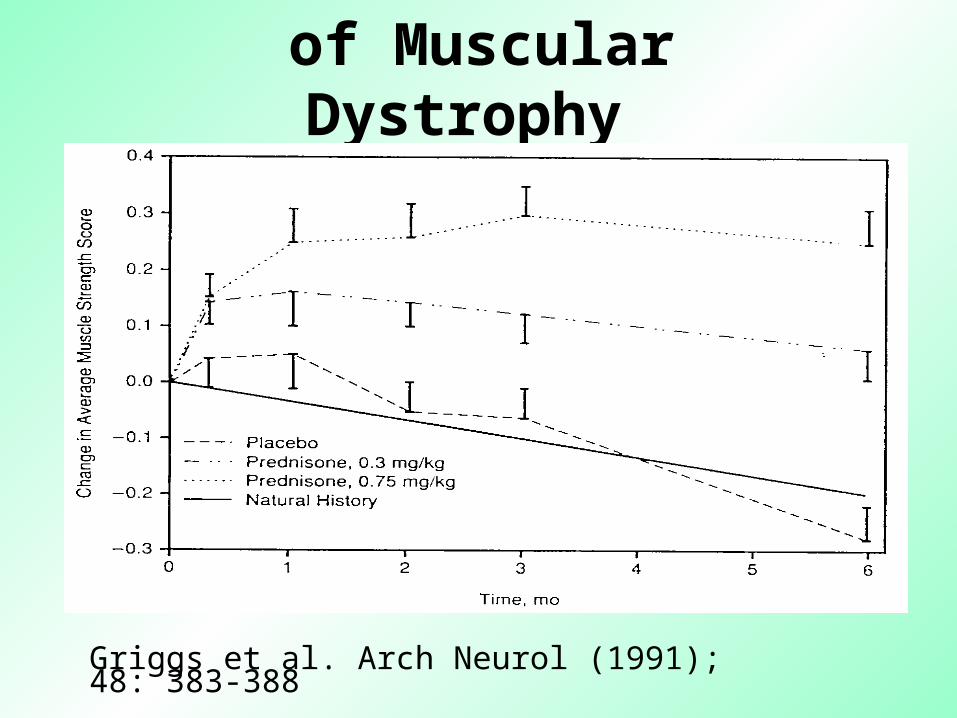
Prednisone Treatment of
Muscular Dystrophy
Griggs et al. Arch Neurol (1991); 48: 383-388
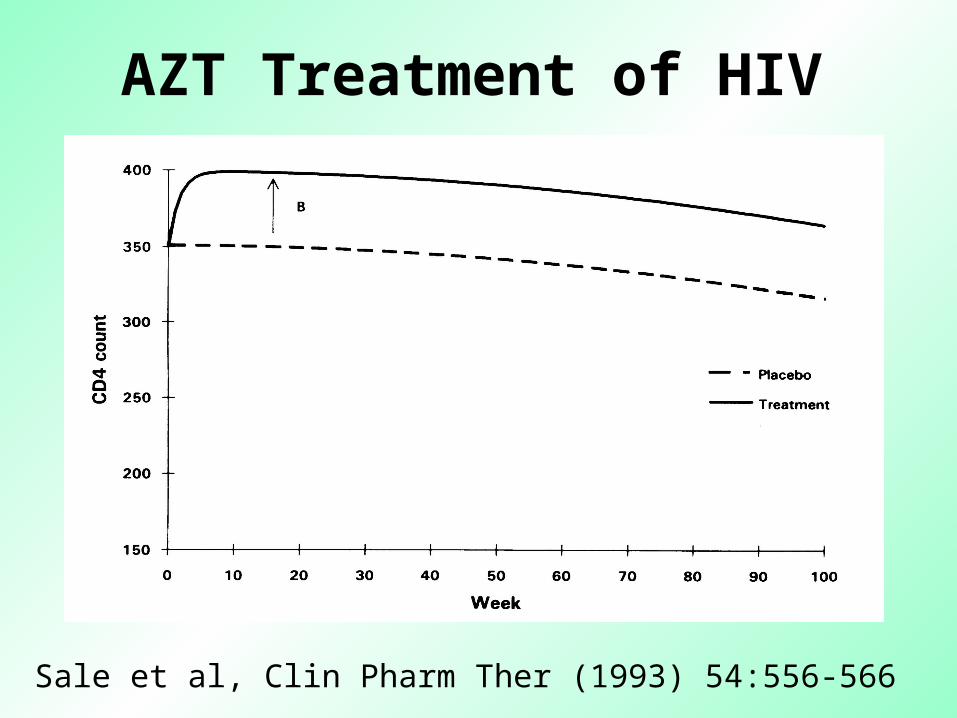
AZT Treatment of HIV
Sale et al, Clin Pharm Ther (1993) 54:556-566
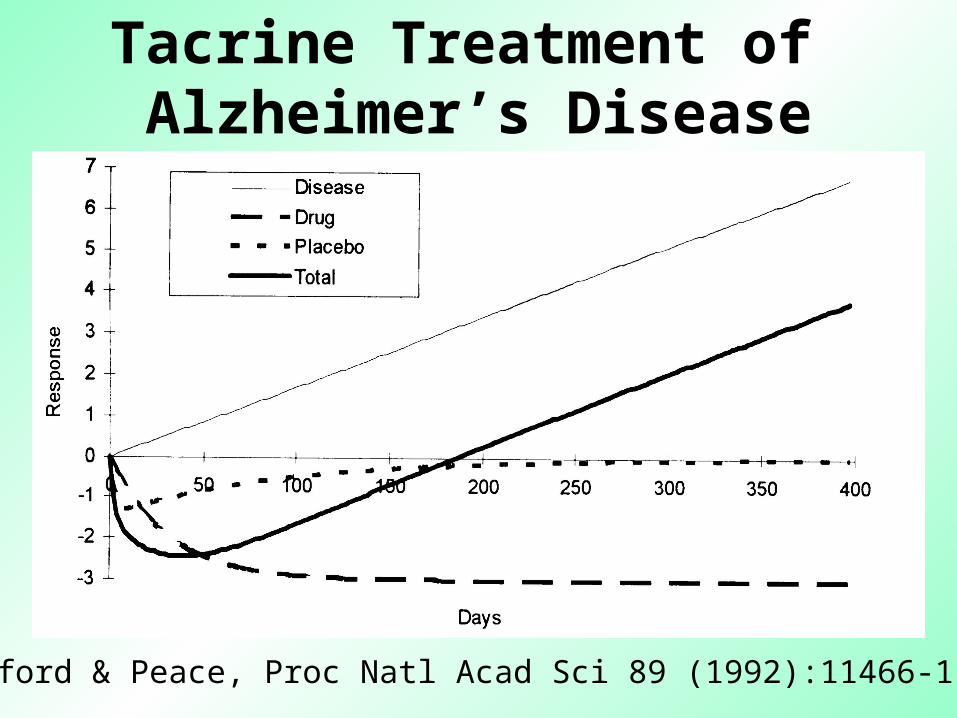
Tacrine Treatment of Alzheimer’s Disease
Holford & Peace, Proc Natl Acad Sci 89 (1992):11466-11470
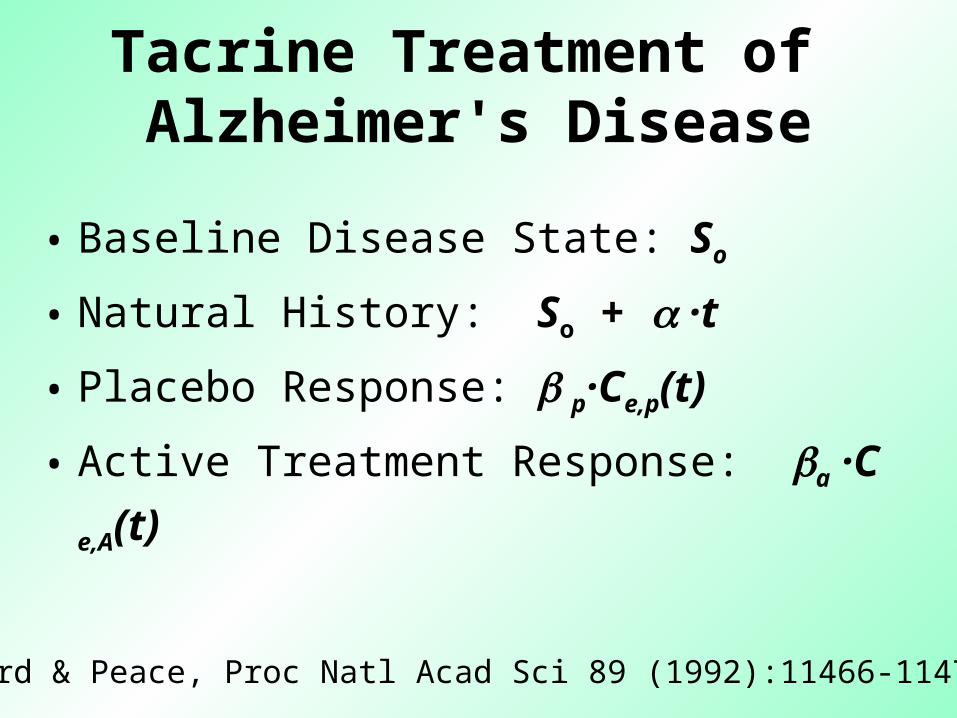
Tacrine Treatment of Alzheimer's Disease
• Baseline Disease State: So
• Natural History: So + ·t
• Placebo Response: p·Ce,p(t)
• Active Treatment Response: a ·C e,A(t)
Holford & Peace, Proc Natl Acad Sci 89 (1992):11466-11470
80
85
90
95
100
105
0 13 26 39 52 65 78 91 104 117time
sta
tus
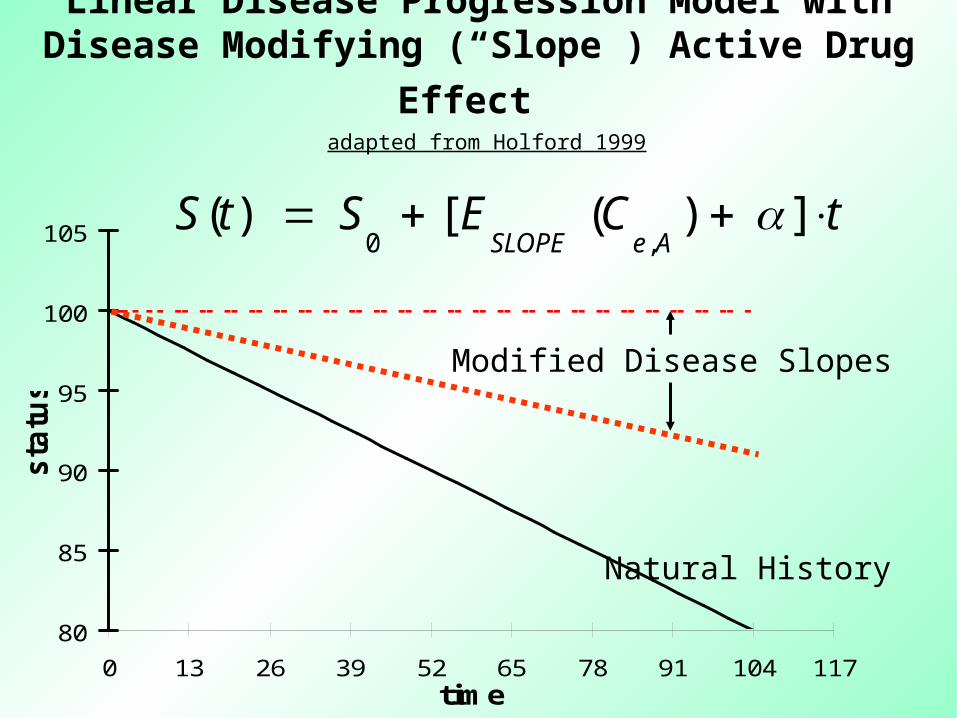
Natural History
Modified Disease Slopes
Linear Disease Progression Model with Disease Modifying (“Slope”) Active Drug
Effect adapted from Holford 1999
tCEStSAeSLOPE
])([)(,0

Alternative Drug Effect Mechanisms Superimposed on a Linear Natural History Disease Progression Model
adapted from Holford 1999
Natural History
80
85
90
95
100
105
110
115
0 13 26 39 52 65 78 91 104 117
time
stat
us
Symptomatic (Offset) Improvement
Modified Disease Progress Slopes
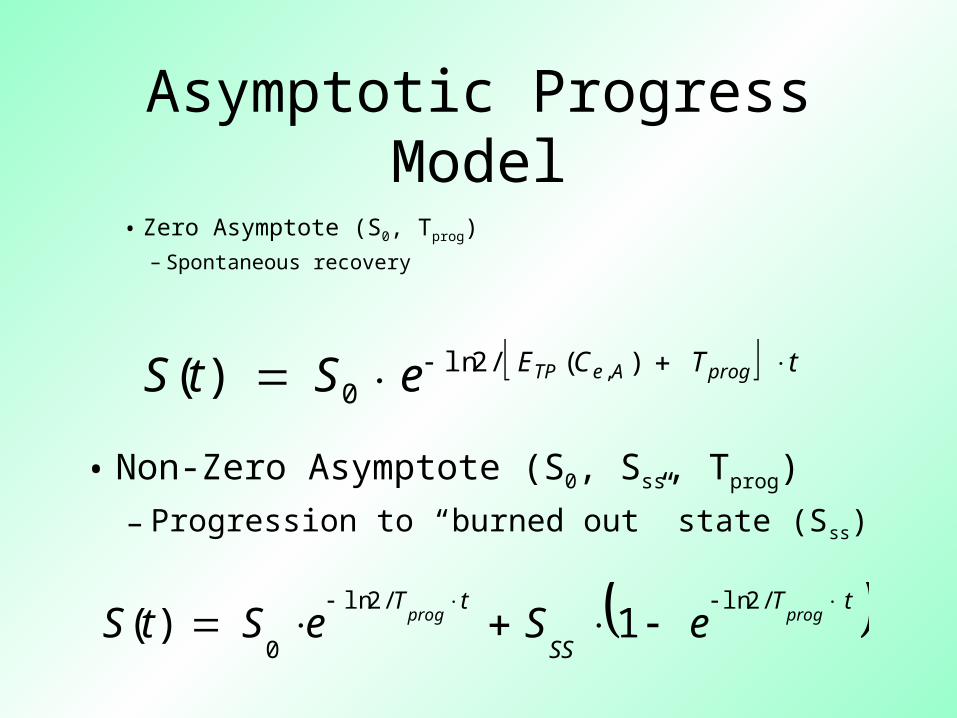
Asymptotic Progress Model
• Non-Zero Asymptote (S0, Sss, Tprog)
– Progression to “burned out” state (Sss)
• Zero Asymptote (S0, Tprog)– Spontaneous recovery
tTCE progAeTPeStS )(/2ln0
,)(
tT
SS
tTprogprog eSeStS
/2ln/2ln
01)(
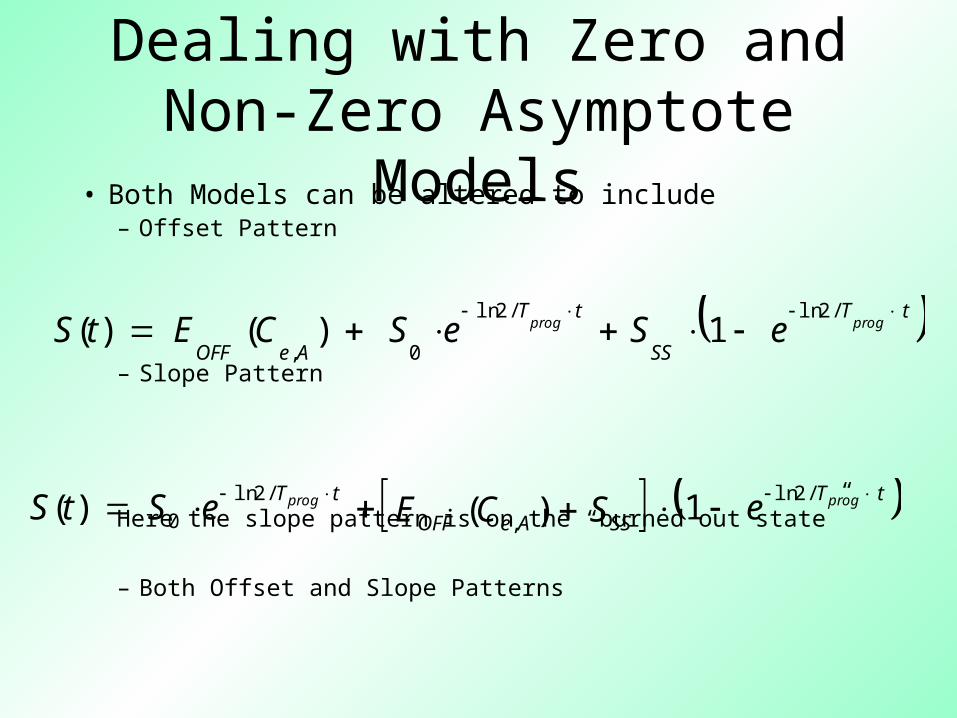
Dealing with Zero and Non-Zero Asymptote
Models• Both Models can be altered to include– Offset Pattern
– Slope Pattern
Here the slope pattern is on the “burned out state”
– Both Offset and Slope Patterns
tT
SS
tT
AeOFF
progprog eSeSCEtS
/2ln/2ln
0,1)()(
tT
SSAeOFF
tT progprog eSCEeStS /2ln
,
/2ln0 1)()(
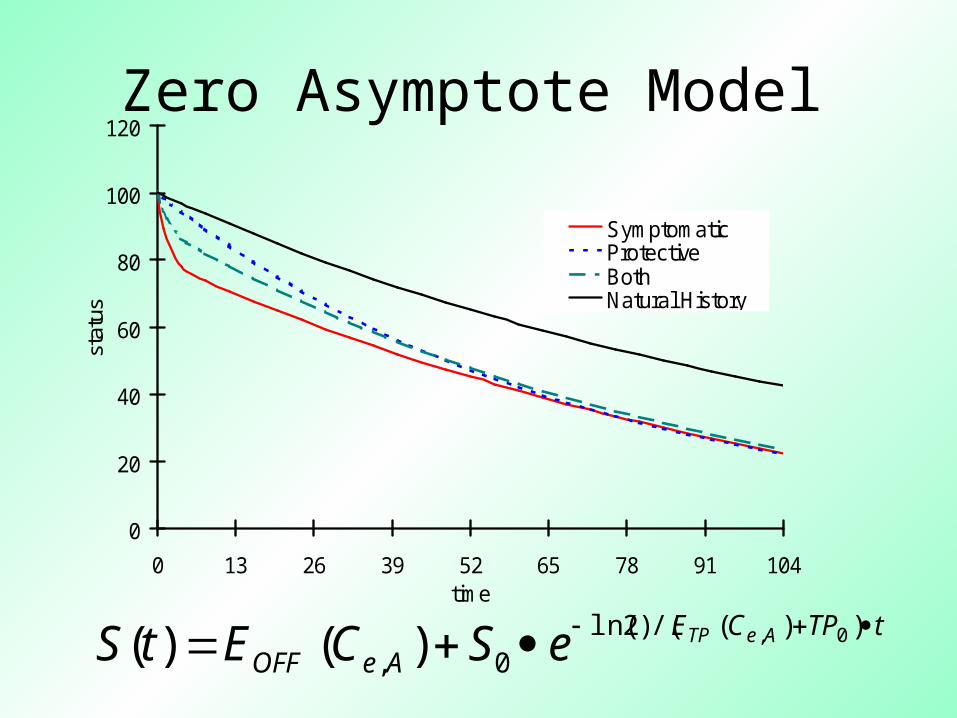
Zero Asymptote Model
0
20
40
60
80
100
120
0 13 26 39 52 65 78 91 104time
stat
us
SymptomaticProtectiveBothNatural History
tTPCEAeOFF
AeTPeSCEtS ))(/()2ln(0,
0,)()(
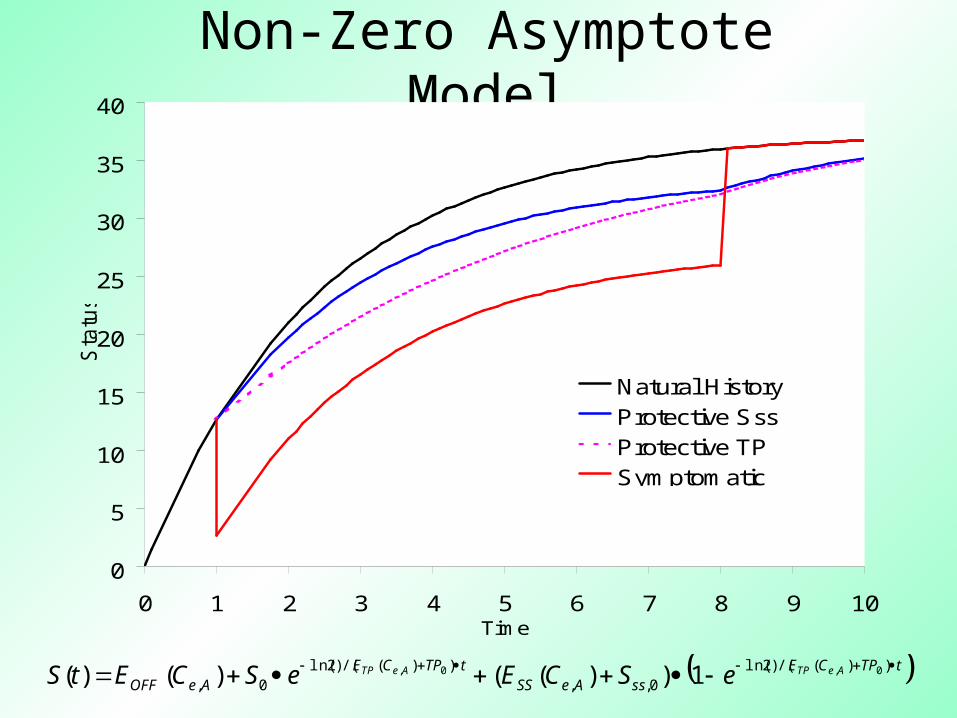
Non-Zero Asymptote Model
0
5
10
15
20
25
30
35
40
0 1 2 3 4 5 6 7 8 9 10Time
Sta
tus
Natural HistoryProtective SssProtective TPSymptomatic
tTPCEssAeSS
tTPCEAeOFF
AeTPAeTP eSCEeSCEtS ))(/()2ln(0,,
))(/()2ln(0,
0,0, 1))(()()(
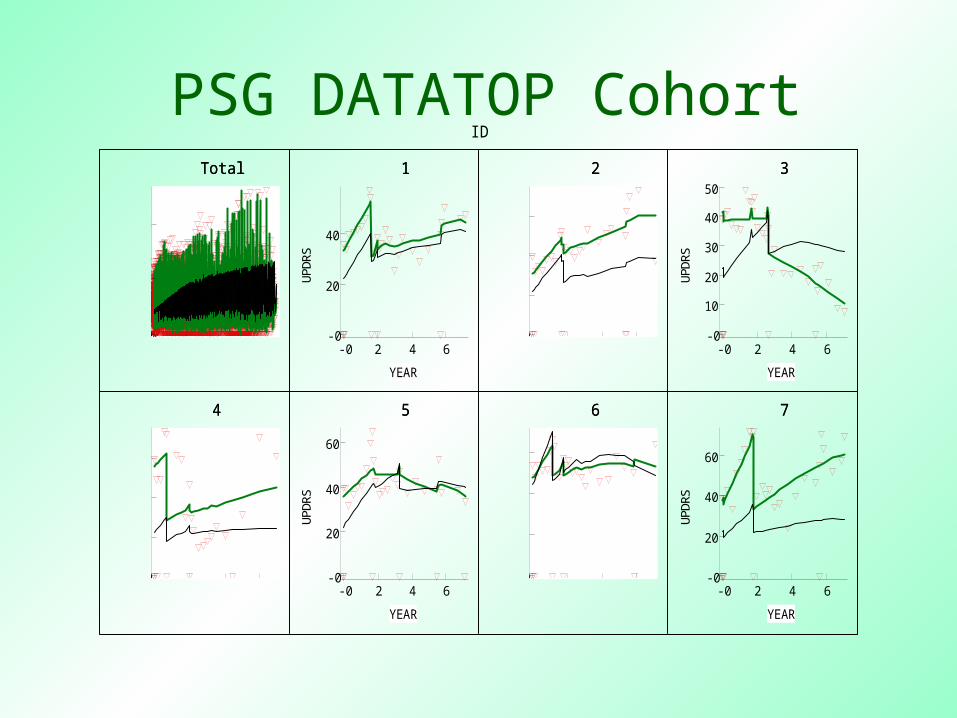
PSG DATATOP Cohort
-0 2 4 6
YEAR
-0
50
100
UPD
RS
-0 2 4 6
YEAR
-0
20
40
UPD
RS
-0 2 4 6
YEAR
-0
20
40
60
UPD
RS
-0 2 4 6
YEAR
-0
10
20
30
40
50
UPD
RS
-0 2 4 6
YEAR
-0
20
40
60
UPD
RS
-0 2 4 6
YEAR
-0
20
40
60
UPD
RS
-0 2 4 6
YEAR
-0
10
20
30
UPD
RS
-0 2 4 6
YEAR
-0
20
40
60
UPD
RS
TotalTotal 11 22 33
44 55 66 77
ID
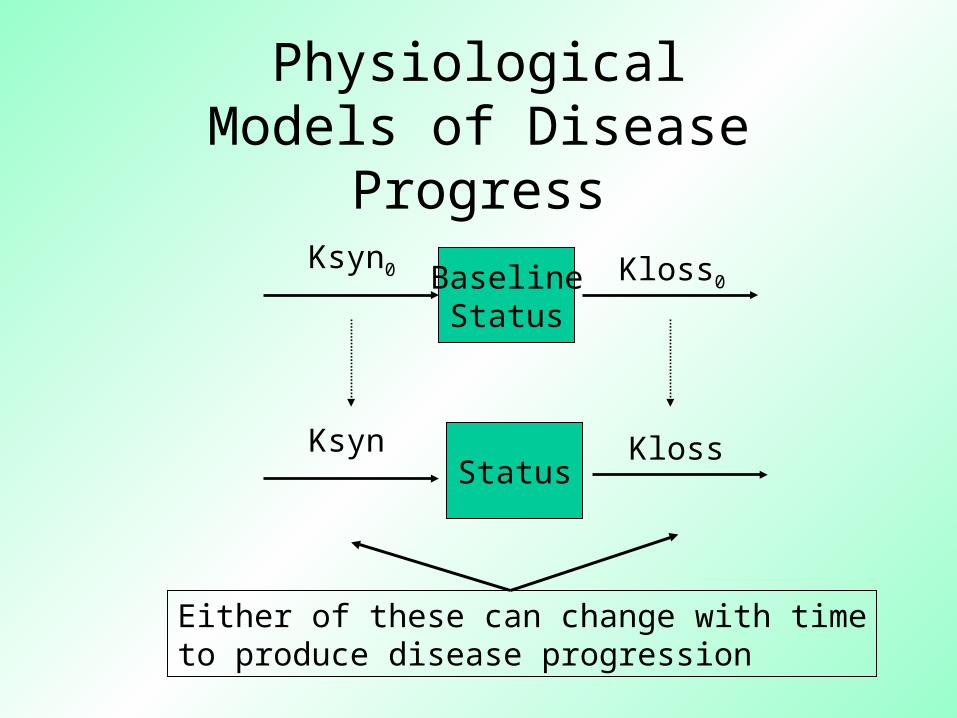
PhysiologicalModels of Disease Progress
Either of these can change with timeto produce disease progression
BaselineStatus
Kloss0Ksyn0
KsynStatus
Kloss
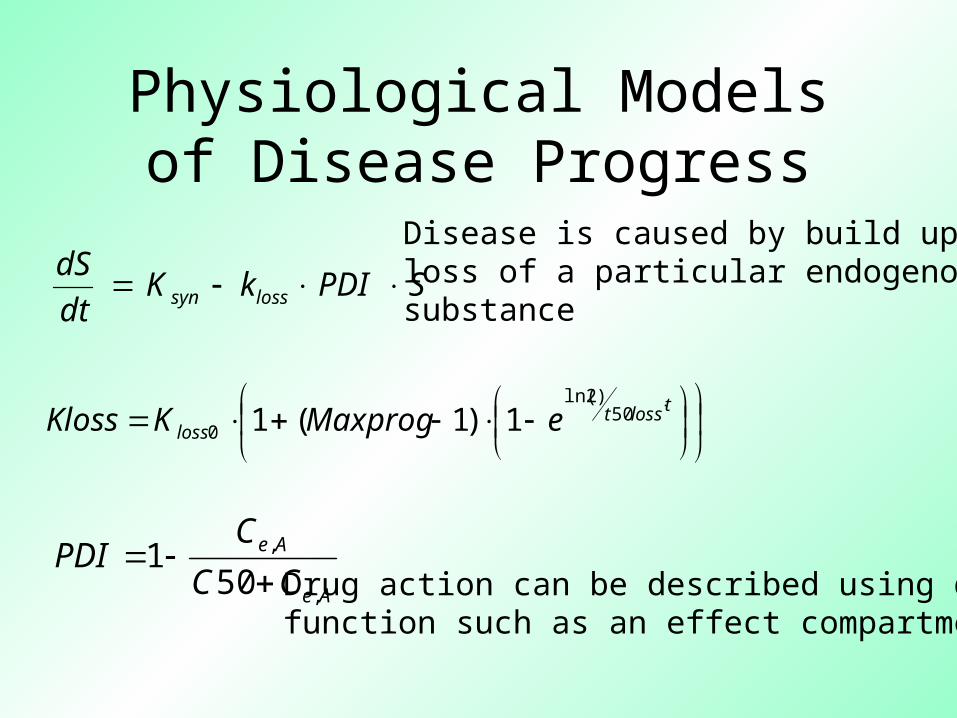
Physiological Models of Disease Progress
tlosstloss eMaxprogKKloss 50
)2ln(
0 1)1(1
Ae
Ae
CC
CPDI
,
,
501
Disease is caused by build up or loss of a particular endogenoussubstance
Drug action can be described using delay function such as an effect compartment
SPDIkKdt
dSlosssyn
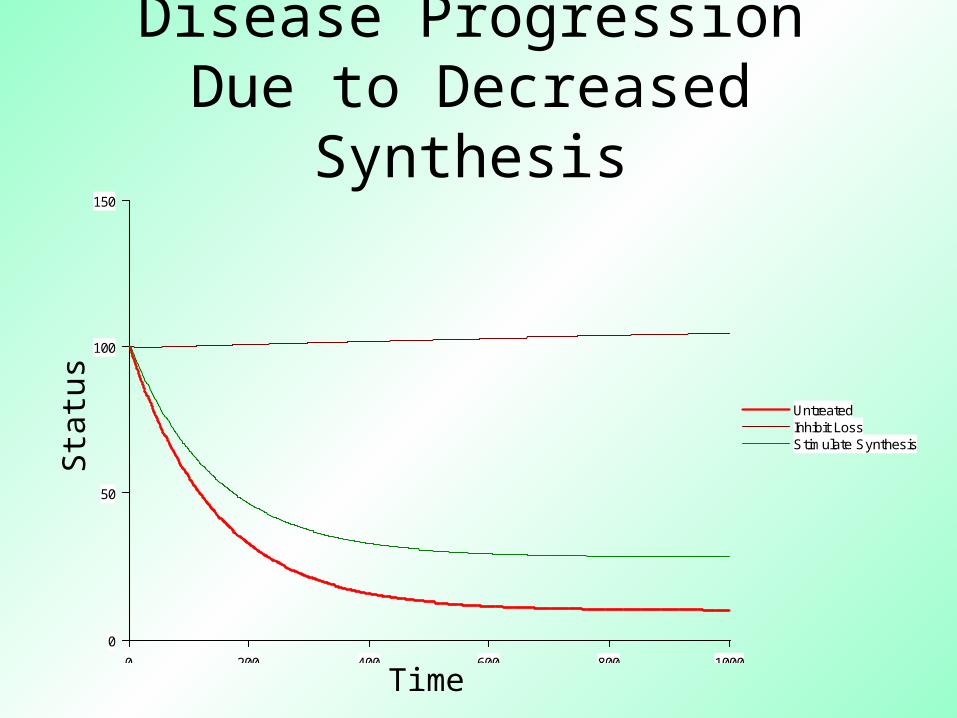
Disease Progression Due to Decreased Synthesis
0 200 400 600 800 1000
0
50
100
150
UntreatedInhibit LossStimulate Synthesis
Time
Sta
tus
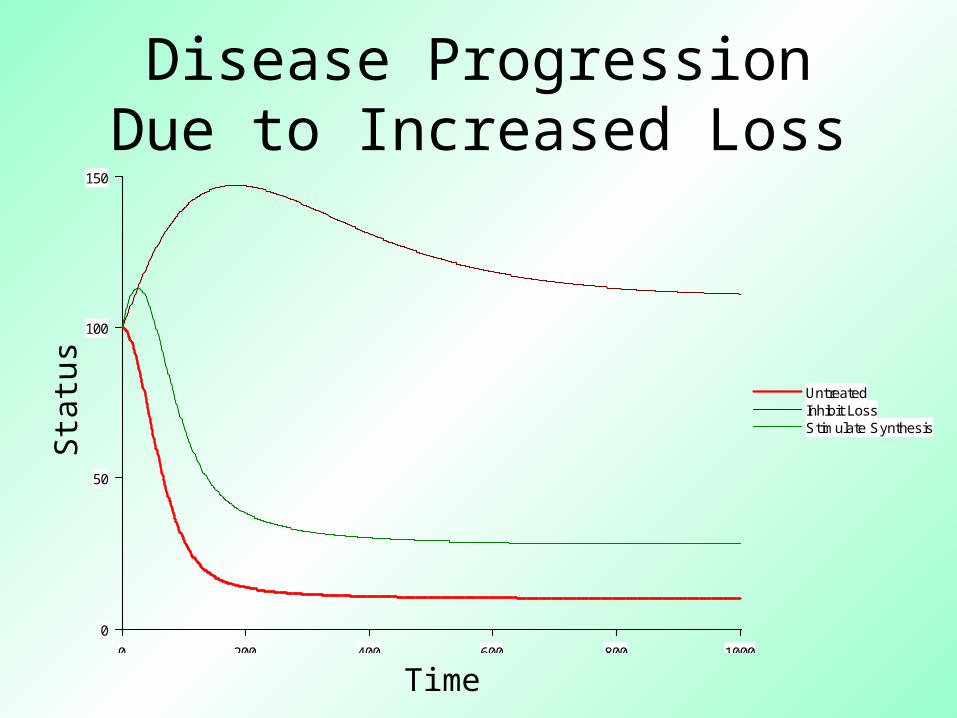
Disease Progression Due to Increased Loss
0 200 400 600 800 1000
0
50
100
150
UntreatedInhibit LossStimulate SynthesisS
tatu
s
Time
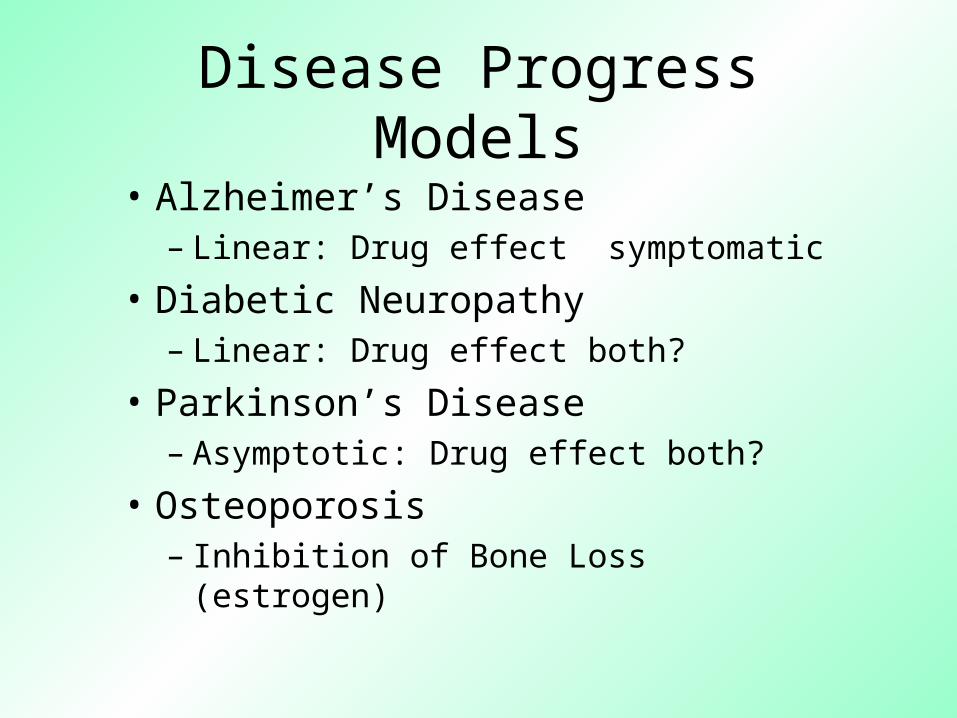
Disease Progress Models
• Alzheimer’s Disease– Linear: Drug effect symptomatic
• Diabetic Neuropathy– Linear: Drug effect both?
• Parkinson’s Disease– Asymptotic: Drug effect both?
• Osteoporosis– Inhibition of Bone Loss (estrogen)
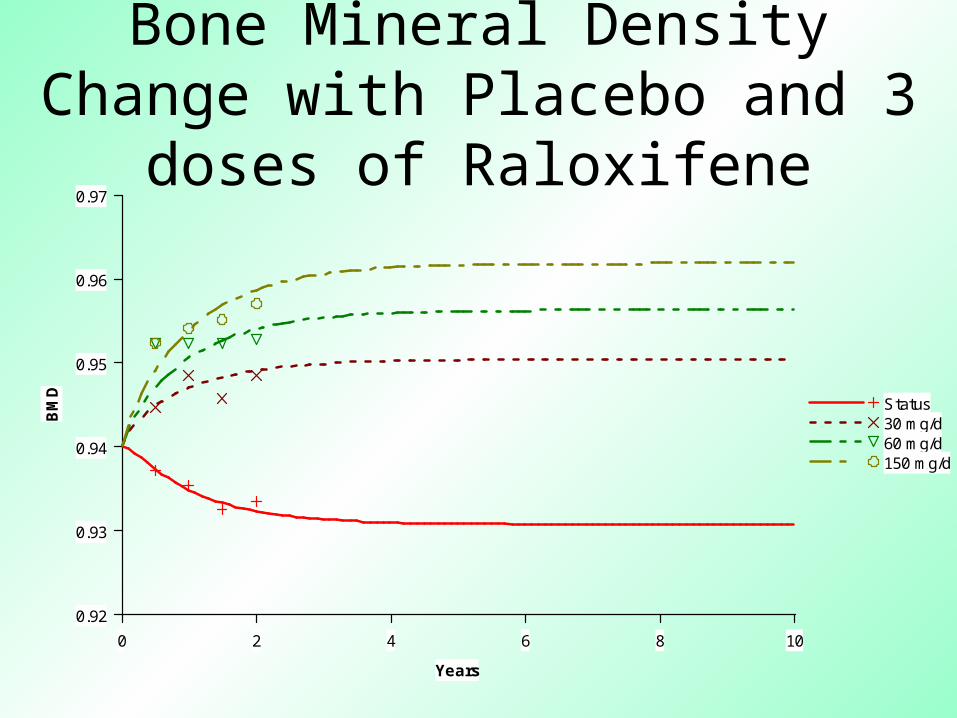
Bone Mineral Density Change with Placebo and 3 doses of Raloxifene
0 2 4 6 8 10
Years
0.92
0.93
0.94
0.95
0.96
0.97
BM
D Status30 mg/d60 mg/d150 mg/d
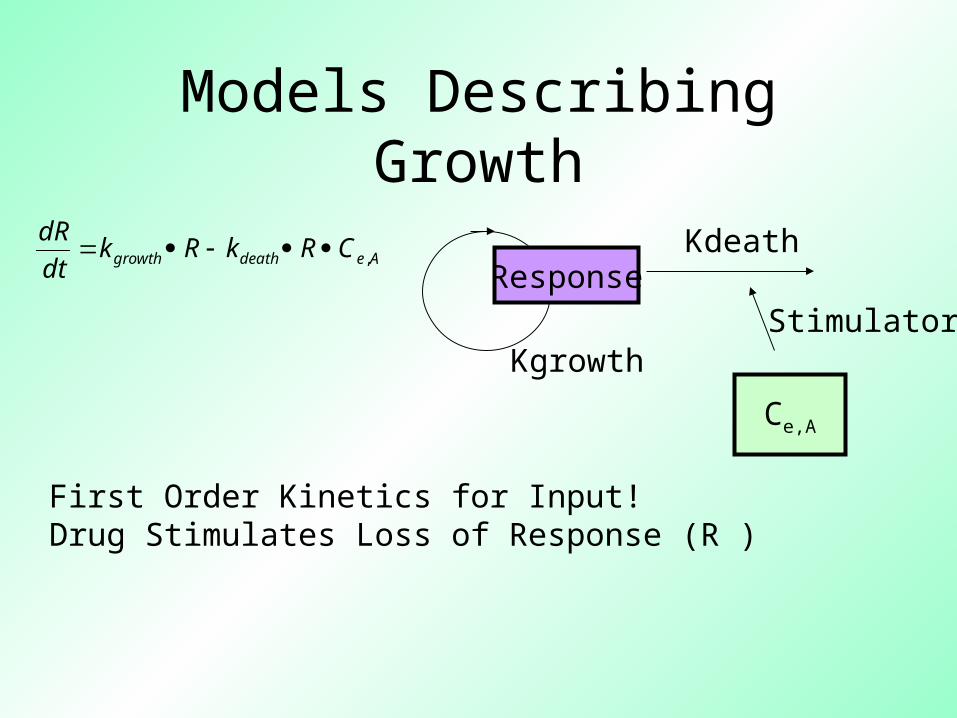
Models Describing Growth
Aedeathgrowth CRkRkdt
dR,
Kgrowth
Kdeath
First Order Kinetics for Input!Drug Stimulates Loss of Response (R )
Ce,A
StimulatoryResponse

Gompertz Growth Function Models
RrKRsKdt
dRr
RsKCEC
CEKRsRsRrK
dt
dRs
RSSR
SOAe
AeSRRS
,
,max 50
max1
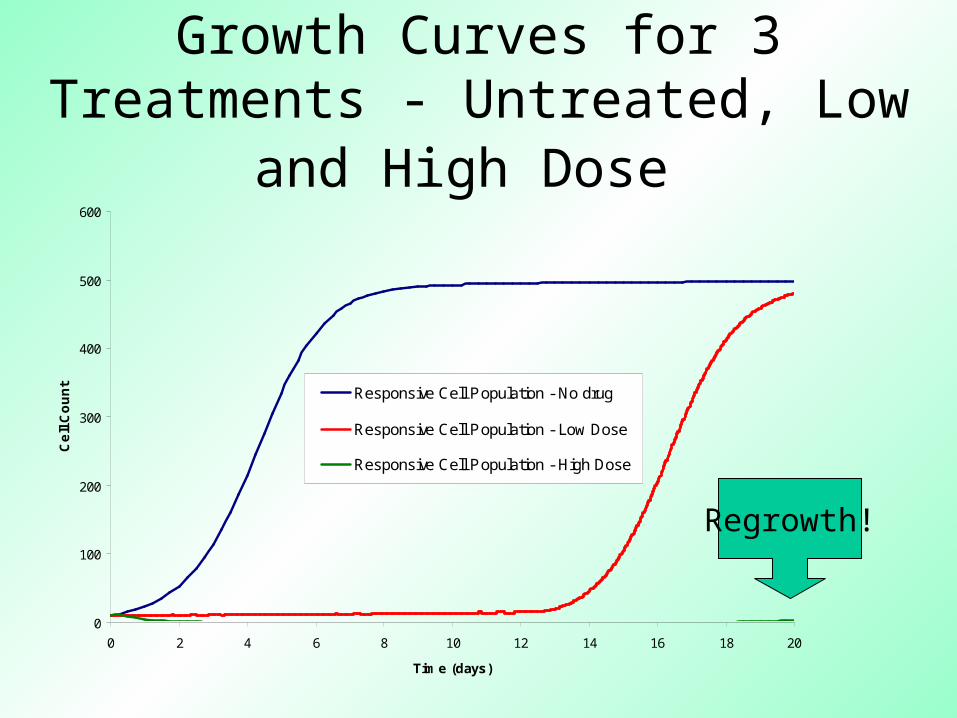
Describes the Formation of Two Responses: Sensitive (Rs) and Resistant (Rr) Defines a Maximal ResponseDrug Effect is Delayed via Link Model and Limited via Emax Model
0
100
200
300
400
500
600
0 2 4 6 8 10 12 14 16 18 20
Time (days)
Ce
ll C
ou
nt Responsive Cell Population - No drug
Responsive Cell Population - Low Dose
Responsive Cell Population - High Dose
Growth Curves for 3 Treatments - Untreated, Low and High Dose
Regrowth!
Using Survival Functions to Describe Disease
Progress• Empirical means of evaluating the
relationship between the drug effect and the time course of disease progress
• Links the pharmacodynamics to measurement of outcome
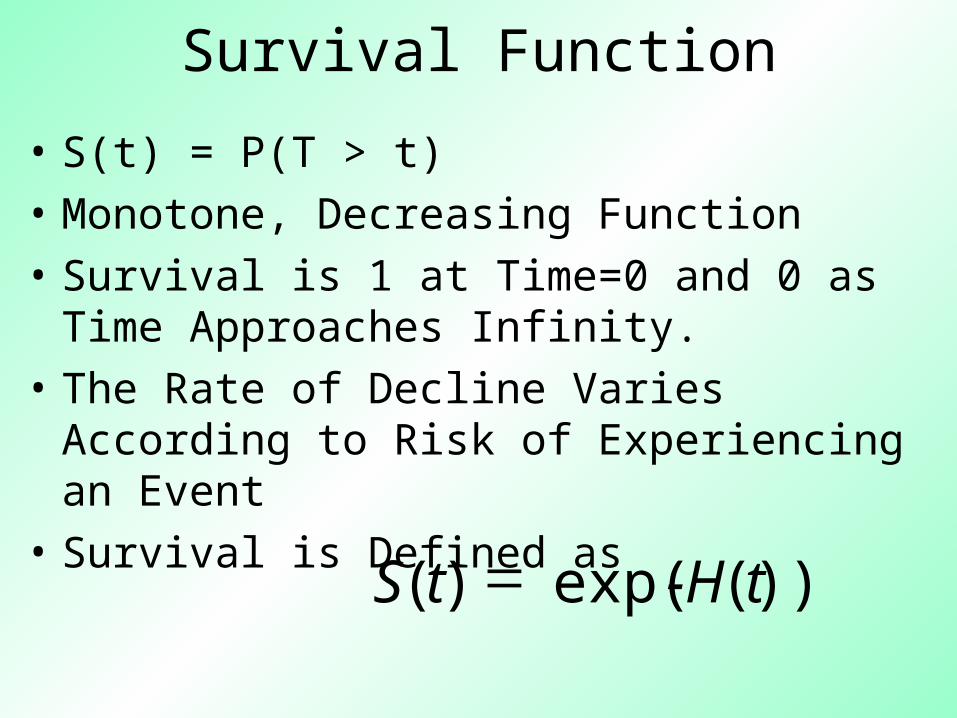
Survival Function
• S(t) = P(T > t)• Monotone, Decreasing Function • Survival is 1 at Time=0 and 0 as Time
Approaches Infinity. • The Rate of Decline Varies According to
Risk of Experiencing an Event• Survival is Defined as
))(exp()( t-HtS
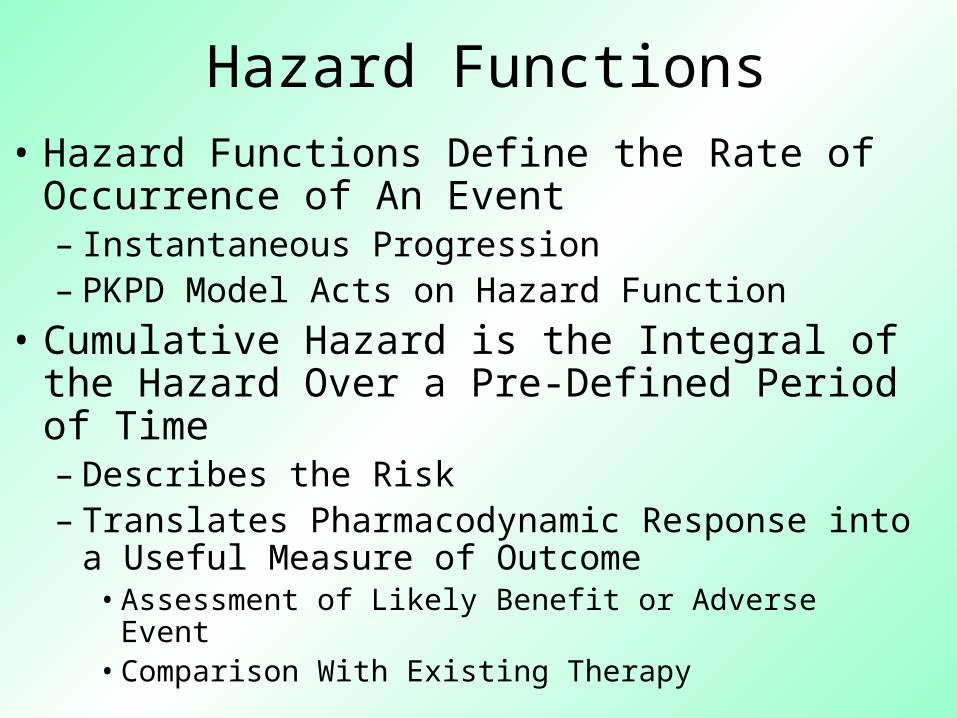
Hazard Functions• Hazard Functions Define the Rate of
Occurrence of An Event – Instantaneous Progression– PKPD Model Acts on Hazard Function
• Cumulative Hazard is the Integral of the Hazard Over a Pre-Defined Period of Time– Describes the Risk– Translates Pharmacodynamic Response into
a Useful Measure of Outcome• Assessment of Likely Benefit or Adverse Event• Comparison With Existing Therapy
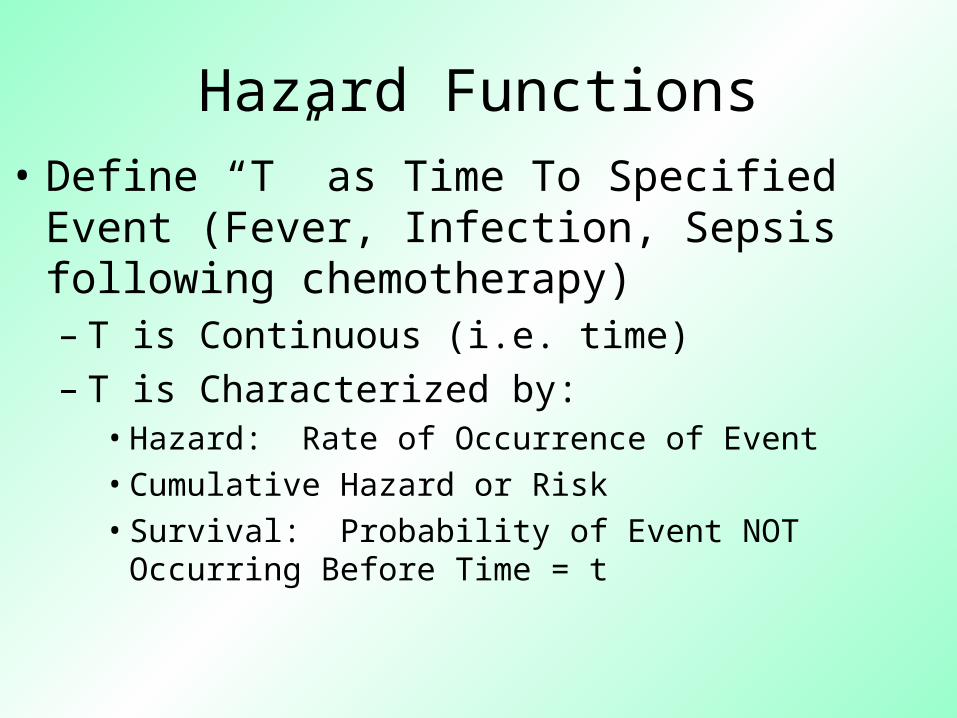
Hazard Functions• Define “T” as Time To Specified Event
(Fever, Infection, Sepsis following chemotherapy)– T is Continuous (i.e. time)– T is Characterized by:
• Hazard: Rate of Occurrence of Event• Cumulative Hazard or Risk• Survival: Probability of Event NOT Occurring
Before Time = t
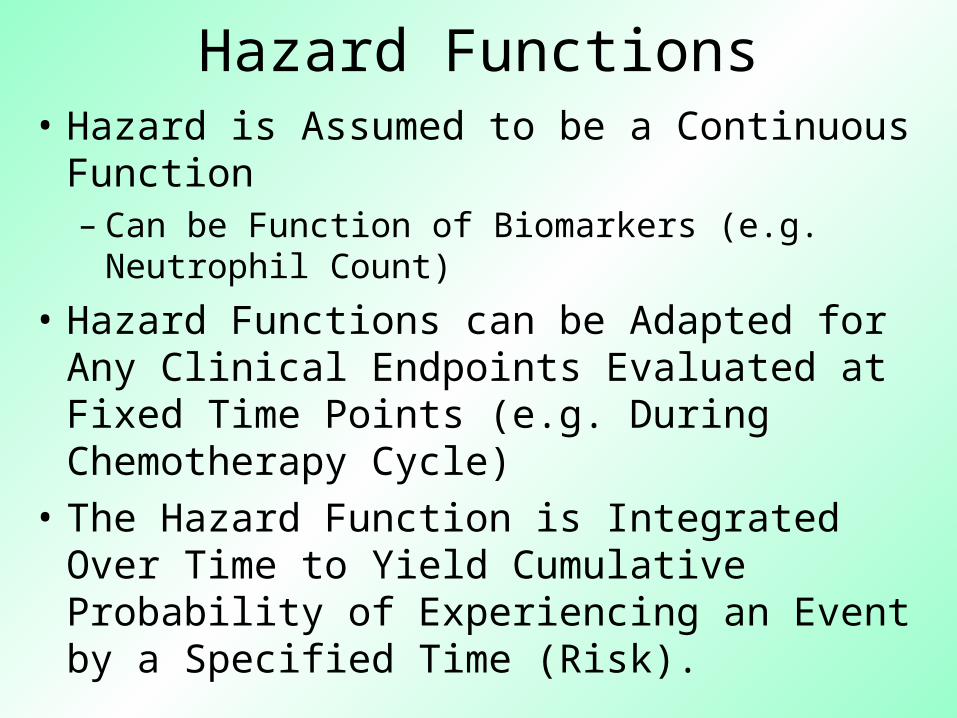
Hazard Functions• Hazard is Assumed to be a Continuous
Function– Can be Function of Biomarkers (e.g.
Neutrophil Count)
• Hazard Functions can be Adapted for Any Clinical Endpoints Evaluated at Fixed Time Points (e.g. During Chemotherapy Cycle)
• The Hazard Function is Integrated Over Time to Yield Cumulative Probability of Experiencing an Event by a Specified Time (Risk).

Using Hazard Functions in PK/PD Models
• If Hazard Function is Defined as a Constant Rate “K” Such that
• Then the Cumulative Hazard is
• Survival is
kth )(
KttS exp)(
)(ln
)(0
tSKt
KtKdttHt
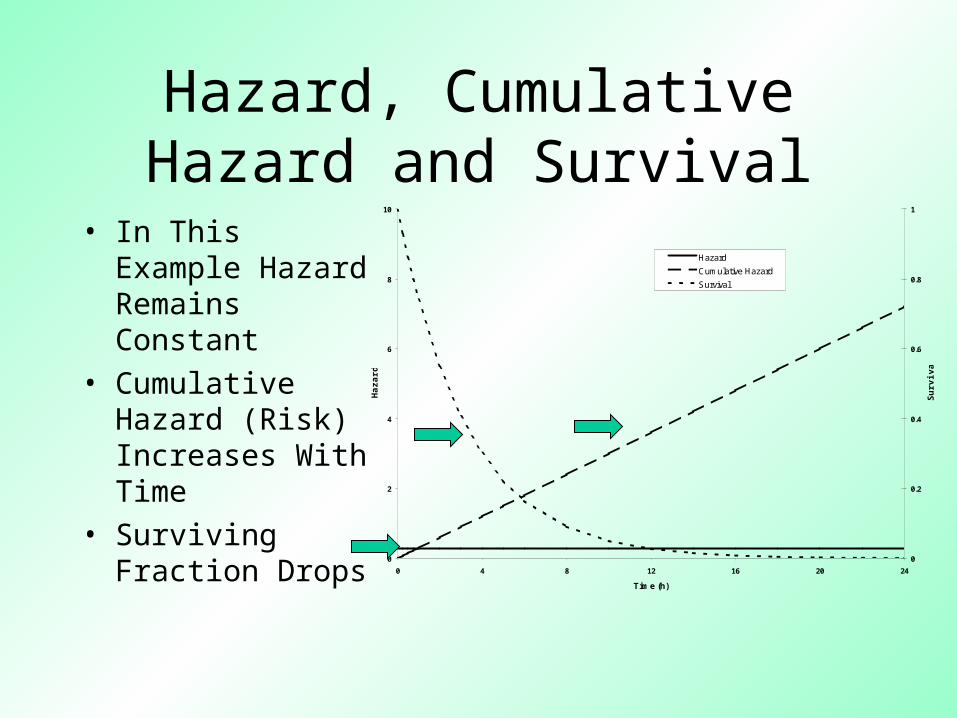
Hazard, Cumulative Hazard and Survival
• In This Example Hazard Remains Constant
• Cumulative Hazard (Risk) Increases With Time
• Surviving Fraction Drops
0
2
4
6
8
10
0 4 8 12 16 20 24
Time (h)
Haz
ard
0
0.2
0.4
0.6
0.8
1
Su
rviv
al
Hazard
Cumulative Hazard
Survival
0
2
4
6
8
10
12
0 24 48 72 96 120 144 168 192 216 240 264 288 312 336 360 384 408 432 456 480 504 528 552
Time (h)
WB
C
0
0.2
0.4
0.6
0.8
1
Pro
ba
bil
ity
WBC Survival Hazard Cumulative Hazard
0
2
4
6
8
10
12
0 24 48 72 96 120 144 168 192 216 240 264 288 312 336 360 384 408 432 456 480 504 528 552
0
0.1
0.2
0.3
0.4
0.5
0.6
0.7
0.8
0.9
1
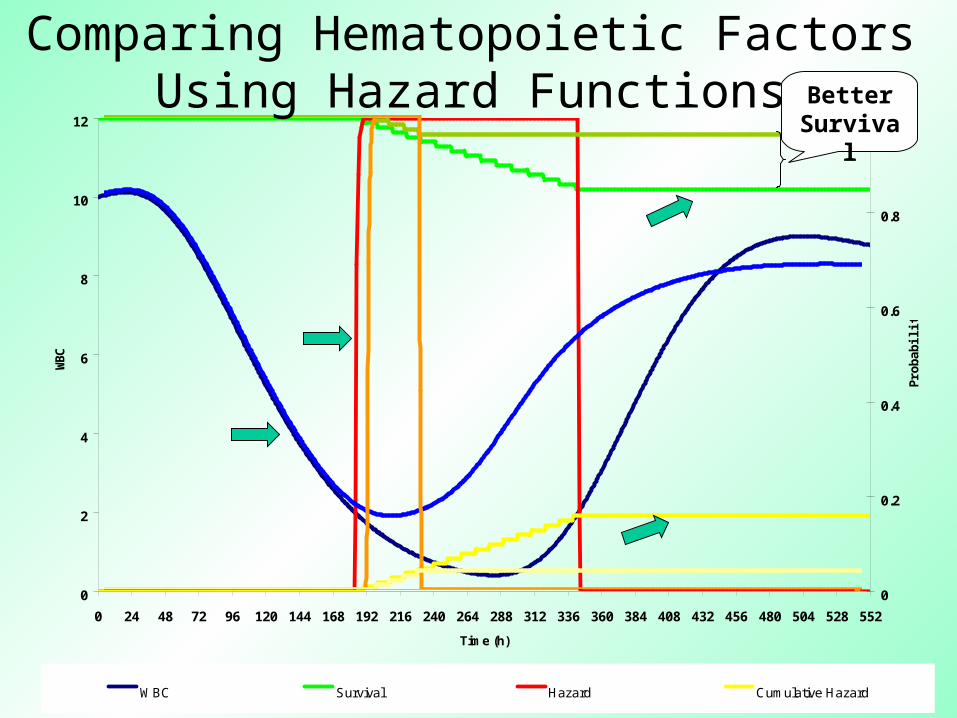
Comparing Hematopoietic Factors Using Hazard Functions Better
Survival
Summary• Accounting for Disease Progress is
Important For the Analysis of Drug Effects– Better Able to Discern True Effect– Improves Reliability of Simulation Work– Developing New Drug Candidates– Visualize the Drug Use Better – Convert Data into Understanding!
• Issues Associated With Building Disease Progress Models– Lack of Available Data for Untreated Patients– Time Required to Collect Data– Variability Inherent in Data May Require Large
Numbers of Subjects to Determine Parameters Accurately