disease statistics chart2
TRANSCRIPT
8/8/2019 Disease Statistics Chart2
http://slidepdf.com/reader/full/disease-statistics-chart2 1/13
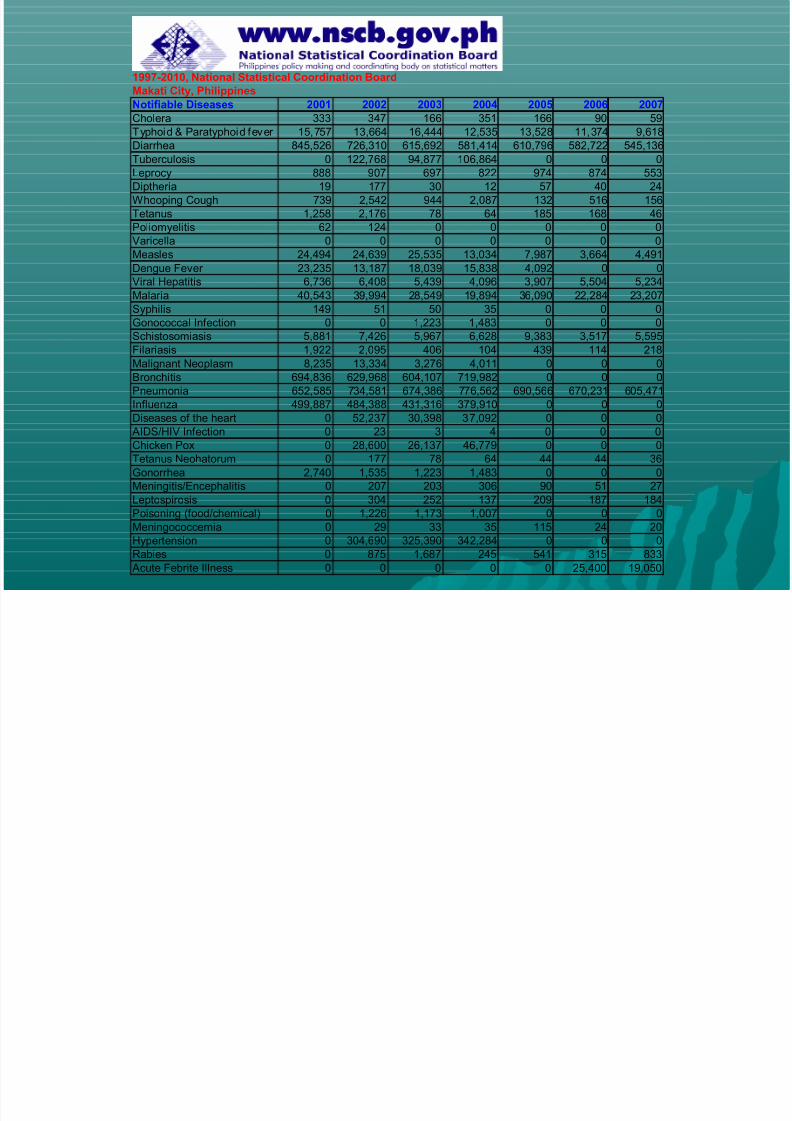
1997-2010, National Statistical Coordination Board
Makati City, Philippines
Notifiable Diseases 2001 2002 2003 2004 2005 2006 2007
Cholera 333 347 166 351 166 90 59
Typhoid & Paratyphoid fever 15,757 13,664 16,444 12,535 13,528 11,374 9,618
Diarrhea 845,526 726,310 615,692 581,414 610,796 582,722 545,136
Tuberculosis 0 122,768 94,877 106,864 0 0 0
Leprocy 888 907 697 822 974 874 553
Diptheria 19 177 30 12 57 40 24
Whooping Cough 739 2,542 944 2,087 132 516 156
Tetanus 1,258 2,176 78 64 185 168 46
Poliomyelitis 62 124 0 0 0 0 0
Varicella 0 0 0 0 0 0 0
Measles 24,494 24,639 25,535 13,034 7,987 3,664 4,491
Dengue Fever 23,235 13,187 18,039 15,838 4,092 0 0
Viral Hepatitis 6,736 6,408 5,439 4,096 3,907 5,504 5,234
Malaria 40,543 39,994 28,549 19,894 36,090 22,284 23,207
Syphilis 149 51 50 35 0 0 0
Gonococcal Infection 0 0 1,223 1,483 0 0 0
Schistosomiasis 5,881 7,426 5,967 6,628 9,383 3,517 5,595
Filariasis 1,922 2,095 406 104 439 114 218
Malignant Neoplasm 8,235 13,334 3,276 4,011 0 0 0
Bronchitis 694,836 629,968 604,107 719,982 0 0 0
Pneumonia 652,585 734,581 674,386 776,562 690,566 670,231 605,471
Influenza 499,887 484,388 431,316 379,910 0 0 0
Diseases of the heart 0 52,237 30,398 37,092 0 0 0AIDS/HIV Infection 0 23 3 4 0 0 0
Chicken Pox 0 28,600 26,137 46,779 0 0 0
Tetanus Neohatorum 0 177 78 64 44 44 36
Gonorrhea 2,740 1,535 1,223 1,483 0 0 0
Meningitis/Encephalitis 0 207 203 306 90 51 27
Leptospirosis 0 304 252 137 209 187 184
Poisoning (food/chemical) 0 1,226 1,173 1,007 0 0 0
Meningococcemia 0 29 33 35 115 24 20
Hypertension 0 304,690 325,390 342,284 0 0 0
Rabies 0 875 1,687 245 541 315 833Acute Febrite Illness 0 0 0 0 0 25,400 19,050

8/8/2019 Disease Statistics Chart2
http://slidepdf.com/reader/full/disease-statistics-chart2 2/13
2001 Notifiable Diseases - Philippines (NSO)
3 3 3
1 5
, 7 5 7
8 4 5
, 5 2 6
0 8 8 8
1 9
7 3 9
1 , 2
5 8
6 2
02
4 , 4
9 4
2 3
, 2 3 5
6 , 7
3 6
4 0
, 5 4 3
1 4 9
0 5 , 8
8 1
1 , 9
2 2
8 , 2
3 5
6 9 4
, 8 3 6
6 5 2
, 5 8
5
4 9 9
, 8 8 7
0 0 0 0 2 , 7
4 0
0 0 0 0 0 0 00
100,000
200,000
300,000
400,000
500,000
600,000
700,000
800,000
900,000
C h o
l e r a
T y p
h o
i d & P a r a
t y p
h o
i d
f e v e r
D i a r r h e a
T u
b e r c u
l o s
i s
L e p
r o c y
D i p t h
e r i a
W h o o p
i n g
C o
u g
h
T e t a n u s
P o
l i o m y e
l i t i s
V a r i c e
l l a
M e a
s l e s
D e n g u e F e v e r
V i r a l H e p a
t i t i s
M a
l a r i a
S y p
h i l i s
G o n o c o c c a
l I n f e c
t i o n
S c
h i s t o s o m
i a s
i s
F i l a r i a s
i s
M a
l i g n a n
t N e o p
l a s m
B r o n c
h i t i s
P n e u m
o n
i a
I n f l u e
n z a
D i s e a s e s o
f t h e h
e a r t
A I D S / H I V I n f e c
t i o n
C h i c k e n
P o x
T e
t a n u s
N e o
h a t o
r u m
G o n o r r h e a
M e n
i n g
i t i s / E n c e p h a
l i t i s
L e p
t o s p i r o s
i s
P o
i s o n i n
g
( f o o
d / c h e m
i c a
l )
M e n
i n g o c o c c e
m i a
H y p e r t e n
s i o n
R a
b i e s
A c u
t e F e
b r i t e
I l l n e s s
Table

8/8/2019 Disease Statistics Chart2
http://slidepdf.com/reader/full/disease-statistics-chart2 3/13
2002 Notifiable Diseases - Philippines (NSO)
3 4 7
1 3
, 6 6 4
7 2 6
, 3 1 0
1 2 2
, 7 6 8
9 0 7
1 7 7
2 , 5
4 2
2 , 1
7 6
1 2 4
02
4 , 6
3 9
1 3
, 1 8 7
6 , 4
0 8
3 9
, 9 9 4
5 1
0 7 , 4
2 6
2 , 0
9 5
1 3
, 3 3 4
6 2 9 , 9
6 8 7
3 4
, 5 8 1
4 8 4
, 3 8 8
5 2
, 2 3 7
2 3 2
8 , 6
0 0
1 7 7
1 , 5
3 5
2 0 7
3 0 4
1 , 2
2 6
2 9
3 0 4
, 6 9 0
8 7 5
00
100,000
200,000
300,000
400,000
500,000
600,000
700,000
800,000
C h o
l e r a
T y p
h o
i d & P a r a t y p
h o
i d
f e v e r
D i a r r h e a
T u
b e r c u
l o s
i s
L e p
r o c y
D i p t h e r i a
W h o o p
i n g C o u g
h
T e t a n u s
P o
l i o m y
e l i t i s
V a r
i c e
l l a
M e a s
l e s
D e n g u e F
e v e r
V i r a l H e p
a t i t i s
M a
l a r i a
S y p
h i l i s
G o n o c o c c a
l I n f e
c t i o n
S c
h i s t o s o m
i a s
i s
F i l a r i a s
i s
M a
l i g n a n
t N e o p
l a s m
B r o n c
h i t i s
P n e u m
o n
i a
I n f l u e n z a
D i s e a s e s o
f t h e h e a r t
A I D S / H I V I n f e
c t i o n
C h i c k e n
P o x
T e
t a n u s
N e o
h a t o r u m
G o n o r r h e a
M e n
i n g
i t i s / E n c e p h
a l i t i s
L e p
t o s p
i r o s
i s
P o
i s o n i n g
( f o o
d / c h e m
i c a
l )
M e n
i n g o c o c c e m
i a
H y p e r t e n s
i o n
R a
b i e s
A c u
t e F e
b r i t e I l
l n e s s
Table
8/8/2019 Disease Statistics Chart2
http://slidepdf.com/reader/full/disease-statistics-chart2 4/13
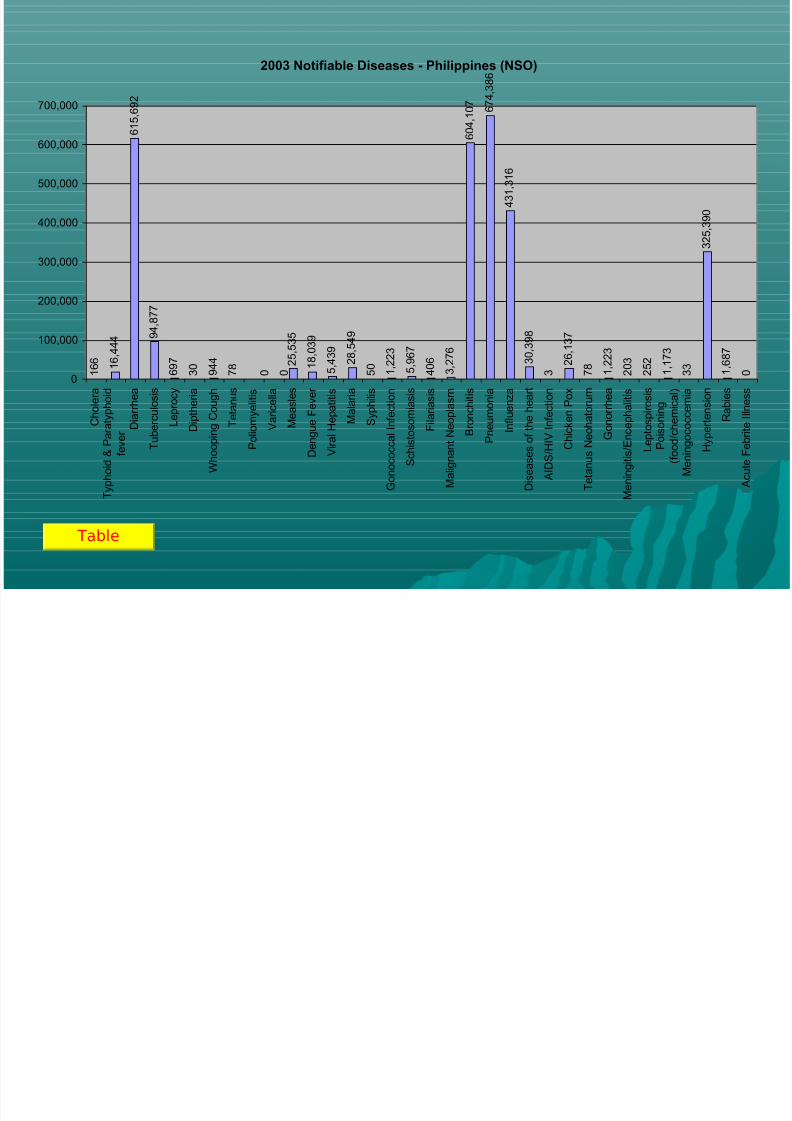
2003 Notifiable Diseases - Philippines (NSO)
1 6 6
1 6
, 4 4 4
6 1 5
, 6 9 2
9 4
, 8 7 7
6 9 7
3 0
9 4 4
7 8
0 02
5 , 5
3 5
1 8
, 0 3 9
5 , 4
3 9
2 8
, 5 4 9
5 0
1 , 2
2 3
5 , 9
6 7
4 0 6
3 , 2
7 6
6
0 4
, 1 0 7
6 7 4
, 3 8 6
4 3 1
, 3 1 6
3 0
, 3 9 8
32
6 , 1
3 7
7 8
1 , 2
2 3
2 0 3
2 5 2
1 , 1
7 3
3 3
3 2 5
, 3 9 0
1 , 6
8 7
00
100,000
200,000
300,000
400,000
500,000
600,000
700,000
C h o
l e r a
T y p
h o
i d & P a r a t y p
h o
i d
f e v e r
D i a r r h e a
T u
b e r c u
l o s
i s
L e p
r o c y
D i p t h e r i a
W h o o p
i n g C o u g
h
T e t a n u s
P o
l i o m y
e l i t i s
V a r
i c e
l l a
M e a s
l e s
D e n g u e F
e v e r
V i r a l H e p
a t i t i s
M a
l a r i a
S y p
h i l i s
G o n o c o c c a
l I n f e
c t i o n
S c
h i s t o s o m
i a s
i s
F i l a r i a s
i s
M a
l i g n a n
t N e o p
l a s m
B r o n c
h i t i s
P n e u m
o n
i a
I n f l u e n z a
D i s e a s e s o
f t h e h e a r t
A I D S / H I V I n f e
c t i o n
C h i c k e n
P o x
T e
t a n u s
N e o
h a t o r u m
G o n o r r h e a
M e n
i n g
i t i s / E n c e p h
a l i t i s
L e p
t o s p
i r o s
i s
P o
i s o n i n g
( f o o
d / c h e m
i c a
l )
M e n
i n g o c o c c e m
i a
H y p e r t e n s
i o n
R a
b i e s
A c u
t e F e
b r i t e I l
l n e s s
Table

8/8/2019 Disease Statistics Chart2
http://slidepdf.com/reader/full/disease-statistics-chart2 5/13
2004 Notifiable Diseases - Philippines (NSO)
3 5 1
1 2
, 5 3 5
5 8 1
, 4 1 4
1 0 6
, 8 6 4
8 2 2
1 2
2 , 0
8 7
6 4
0 01 3
, 0 3 4
1 5
, 8 3 8
4 , 0
9 6
1 9
, 8 9 4
3 5
1 , 4
8 3
6 , 6
2 8
1 0 4
4 , 0
1 1
7 1 9
, 9 8 2
7 7 6
, 5 6 2
3 7 9
, 9 1 0
3 7
, 0 9 2
4
4 6
, 7 7 9
6 4
1 , 4
8 3
3 0 6
1 3 7
1 , 0
0 7
3 5
3 4 2
, 2 8 4
2 4 5
00
100,000
200,000
300,000
400,000
500,000
600,000
700,000
800,000
C h o
l e r a
T y p
h o
i d & P a r a
t y p h o
i d
f e v e r
D i a r r
h e a
T u
b e r c u l o s
i s
L e p r o c y
D i p t h e r i a
W h o o p
i n g
C o u g
h
T e t a
n u s
P o
l i o m y e
l i t i s
V a r i c
e l l a
M e a s
l e s
D e n g u e
F e
v e r
V i r a l H e p a
t i t i s
M a l a r i a
S y p
h i l i s
G o n o c o c c a
l I n f e c
t i o n
S c
h i s t o s o m i a s
i s
F i l a r i a s
i s
M a
l i g n a n
t N e o p l a
s m
B r o n c
h i t i s
P n e u m o n
i a
I n f l u e
n z a
D i s e a s e s o
f t h e h
e a r t
A I D S / H I V I n f e c
t i o n
C h i c k e n
P o x
T e
t a n u s
N e o
h a t o r u m
G o n o r r
h e a
M e n
i n g
i t i s / E n c e p h a
l i t i s
L e p
t o s p i r o s
i s
P o
i s o n i n g
( f o o
d / c h e m
i c a
l )
M e n
i n g o c o c c e
m i a
H y p e r t e n s
i o n
R a b i e s
A c u
t e F e
b r i t e
I l l n
e s s
Table

8/8/2019 Disease Statistics Chart2
http://slidepdf.com/reader/full/disease-statistics-chart2 6/13
2005 Notifiable Diseases - Philippines (NSO)
1 6 6
1 3
, 5 2 8
6 1 0
, 7 9 6
0 9 7 4
5 7
1 3 2
1 8 5
0 0 7 , 9
8 7
4 , 0
9 2
3 , 9
0 7
3 6
, 0 9 0
0 0 9 , 3
8 3
4 3 9
0 0
6 9 0
, 5 6 6
0 0 0 0 4 4
0 9 0
2 0 9
0 1 1 5
0 5 4 1
00
100,000
200,000
300,000
400,000
500,000
600,000
700,000
C h o
l e r a
T y p
h o
i d & P a r a
t y p h o
i d
f e v e r
D i a r r h e a
T u
b e r c u
l o s
i s
L e p r o c y
D i p t h
e r i a
W h o o p
i n g
C o
u g
h
T e t a
n u s
P o
l i o m y e
l i t i s
V a r i c
e l l a
M e a
s l e s
D e n g u e F e v e r
V i r a l H e p a
t i t i s
M a l a r i a
S y p
h i l i s
G o n o c o c c a
l I n f e c
t i o n
S c
h i s t o s o m
i a s
i s
F i l a r i a s
i s
M a
l i g n a n
t N e o p l a s m
B r o n c
h i t i s
P n e u m o n
i a
I n f l u e
n z a
D i s e a s e s o
f t h e h
e a r t
A I D S / H I V I n f e c
t i o n
C h i c k e n
P o x
T e
t a n u s
N e o
h a t o
r u m
G o n o r r h e a
M e n
i n g
i t i s / E n c e p h a
l i t i s
L e p
t o s p i r
o s
i s
P o
i s o n i n g
( f o o
d / c h e m
i c a
l )
M e n
i n g o c o c c e
m i a
H y p e r t e n s
i o n
R a b i e s
A c u
t e F e
b r i t e
I l l n
e s s
Table

8/8/2019 Disease Statistics Chart2
http://slidepdf.com/reader/full/disease-statistics-chart2 7/13
2006 Notifiable Diseases - Philippines (NSO)
9 0 1
1 , 3
7 4
5 8 2
, 7 2 2
0 8 7 4
4 0
5 1 6
1 6 8
0 03 , 6
6 4
0 5 , 5
0 4
2 2
, 2 8 4
0 03 , 5
1 7
1 1 4
0 0
6 7 0
, 2 3 1
0 0 0 0 4 4
0 5 1
1 8 7
0 2 4
0 3 1 5 2
5 , 4
0 0
0
100,000
200,000
300,000
400,000
500,000
600,000
700,000
C h o
l e r a
T y p
h o
i d & P a r a
t y p h o
i d
f e v e r
D i a r r
h e a
T u
b e r c u
l o s
i s
L e p r o c y
D i p t h
e r i a
W h o o p
i n g
C o
u g
h
T e t a
n u s
P o
l i o m y e
l i t i s
V a r i c
e l l a
M e a
s l e s
D e n g u e
F e v e r
V i r a l H e p a
t i t i s
M a l a r i a
S y p
h i l i s
G o n o c o c c a
l I n f e c
t i o n
S c
h i s t o s o m i a s
i s
F i l a r i a s
i s
M a
l i g n a n
t N e o p l a s m
B r o n c
h i t i s
P n e u m o n
i a
I n f l u e
n z a
D i s e a s e s o
f t h e h
e a r t
A I D S / H I V I n f e c
t i o n
C h i c k e n
P o x
T e
t a n u s
N e o
h a t o
r u m
G o n o r r
h e a
M e n
i n g
i t i s / E n c e p h a
l i t i s
L e p
t o s p i r
o s
i s
P o
i s o n i n g
( f o o
d / c h e m
i c a
l )
M e n
i n g o c o c c e
m i a
H y p e r t e n s
i o n
R a b i e s
A c u
t e F e
b r i t e
I l l n
e s s
Table
8/8/2019 Disease Statistics Chart2
http://slidepdf.com/reader/full/disease-statistics-chart2 8/13
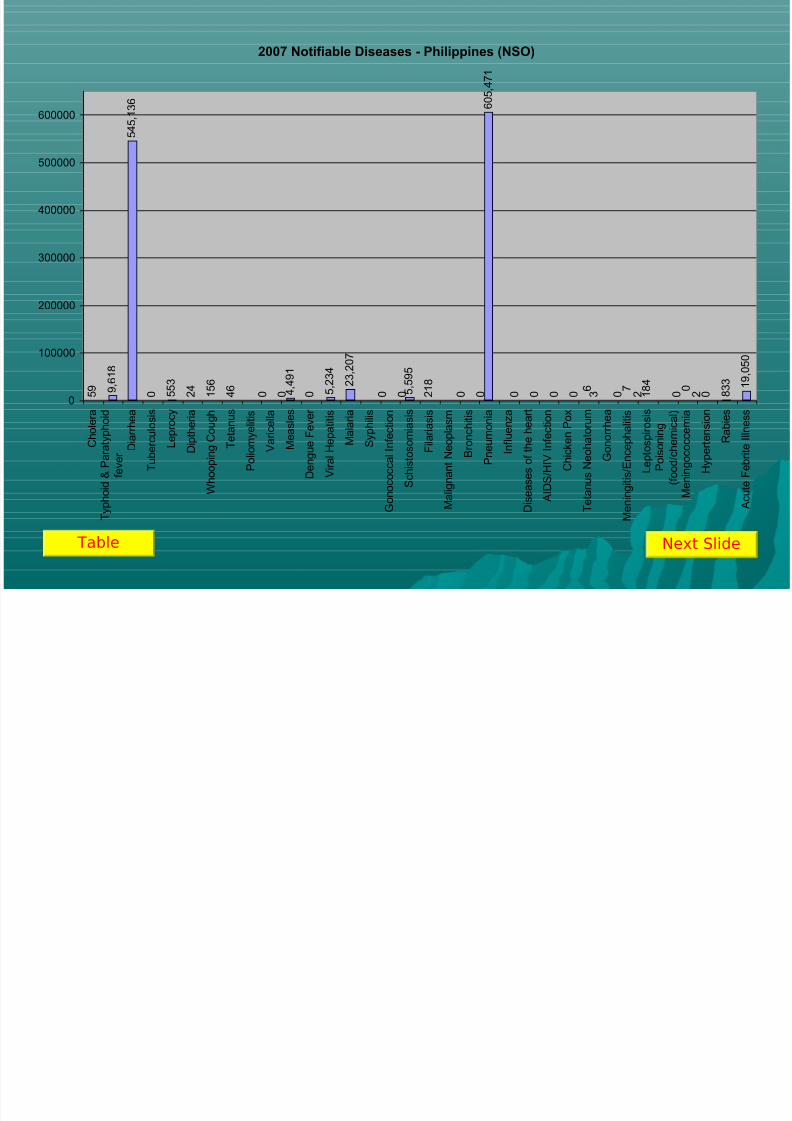
2007 Notifiable Diseases - Philippines (NSO)
5 9 9
, 6 1 8
5 4 5
, 1 3 6
0 5 5 3
2 4
1 5 6
4 6
0 0 4 , 4
9 1
0 5 , 2
3 4
2 3
, 2 0 7
0 05 , 5
9 5
2 1 8
0 0
6 0 5
, 4 7 1
0 0 0 0 3 6
0 2 7
1 8 4
0 2 0
0 8 3 3 1
9 , 0
5 0
0
100000
200000
300000
400000
500000
600000
C h o
l e r a
T y p
h o
i d & P a r a
t y p
h o i d
f e v e r
D i a r r h e a
T u
b e r c u
l o s i s
L e p r o c y
D i p t h e r i a
W h o o p
i n g
C o u g h
T e
t a n u s
P o
l i o m y e
l i t i s
V a r i c e l l a
M e a s l e s
D e n g u e
F e v e r
V i r a l H e p a
t i t i s
M a
l a r i a
S y p
h i l i s
G o n o c o c c a
l I n f e c
t i o n
S c
h i s t o s o m
i a s i s
F i l a r i a s i s
M a
l i g n a n
t N e o p
l a s m
B r o n c
h i t i s
P n e u m o n i a
I n f l u e n z a
D i s e a s e s o
f t h e
h e a r
t
A I D S / H I V I n f e c
t i o n
C h i c k e n
P o x
T e
t a n u s
N e o
h a
t o r u m
G o n o r r h e a
M e n
i n g
i t i s / E n c e p
h a
l i t i s
L e p
t o s p
i r o s i s
P o
i s o n
i n g
( f o o
d / c h e m
i c a l )
M e n
i n g o c o c c e m i a
H y p e r t e n s i o n
R a
b i e s
A c u
t e F e
b r i t e
I l l n e s s
Table Next Slide

8/8/2019 Disease Statistics Chart2
http://slidepdf.com/reader/full/disease-statistics-chart2 9/13
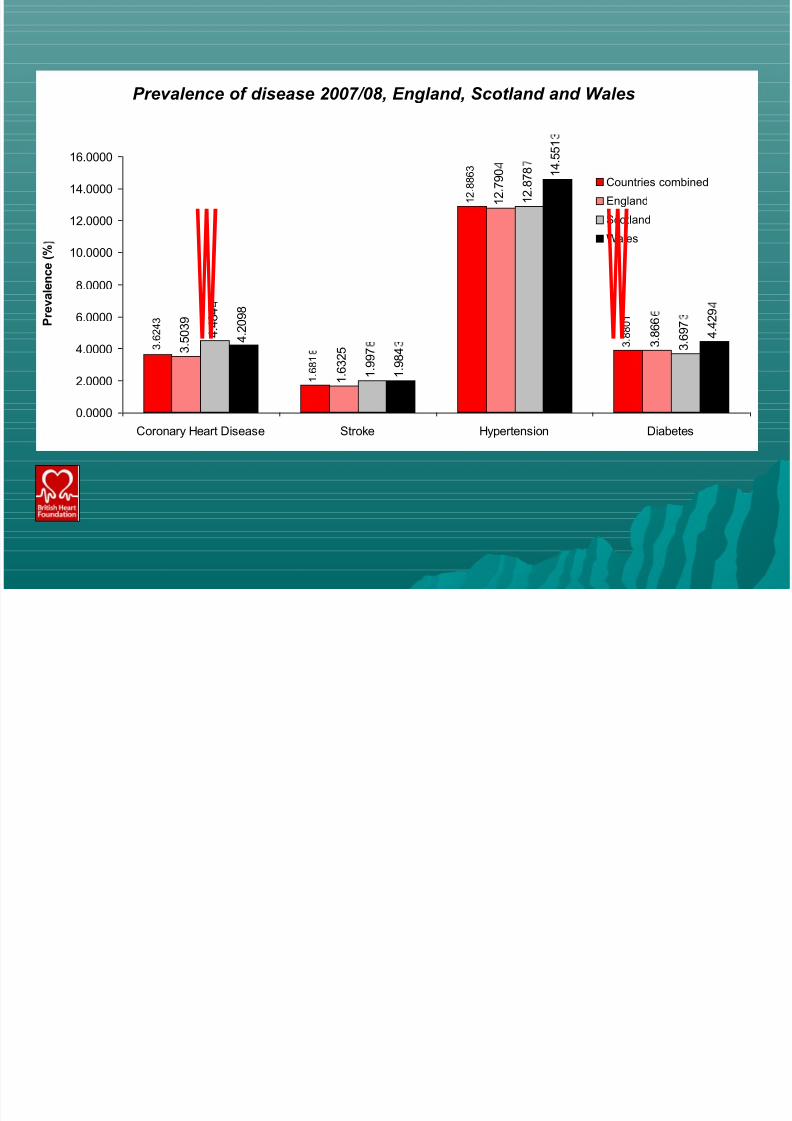
Prevalence (%) Coronary Heart Disease Stroke Hypertension Diabetes
Countries combined 3.624317008 1.681788 12.88632748 3.880119695
England 3.503865805 1.63246 12.79036589 3.866583104
Scotland 4.48443184 1.997775 12.87868347 3.697272108
Wales 4.209838285 1.98428 14.551268 4.429382535
Prevalence of disease 2007/08, England,
Scotland and Wales
Graph
8/8/2019 Disease Statistics Chart2
http://slidepdf.com/reader/full/disease-statistics-chart2 10/13
Prevalence of disease 2007/08, England, Scotland and Wales
1 .
6 8 1
1 2 .
8 8 6 3
3 .
8 8 0 1
3 .
5 0 3 9
1 . 6
3 2 5
1 2 .
7 9 0
3 .
8 6 6
4 .
4 8 4
1 .
9 9 7
1 2 .
8 7 8
3 .
6 9 7
4 .
2 0 9 8
1 .
9 8 4
1 4 .
5 5 1
4 . 4
2 9
3 .
6 2 4 3
0.0000
2.0000
4.0000
6.0000
8.0000
10.0000
12.0000
14.0000
16.0000
Coronary Heart Disease Stroke Hypertension Diabetes
P r e v a l e n c e ( %
Countries combined
England
Scotland
Walesw w

8/8/2019 Disease Statistics Chart2
http://slidepdf.com/reader/full/disease-statistics-chart2 11/13
Illness All ages 16-44 45-64 65-74 75+
Heart attack-Both 1.5 0.1 1.5 4.6 5.4
Other heart complaints-Both 3.2 0.5 3.7 8.4 10.9
Hypertension-Both 4.1 0.6 6.0 11.3 8.8
Stroke-Both 0.65 0.05 0.65 2 2.85
Other blood vessel/embolic disorders-Both 0.8 0.3 0.85 1.65 2.5
Arthritis and rheumatism 0.7 0.2 0.8 1.8 2.7
Back problems 3.2 1.8 3.8 5.1 7.4Other bone and joint problems 3.75 1.75 4.1 6.2 9.95
Asthma 4.15 4.1 4 4.55 4.45
Bronchitis and emphysema 0.5 0 0.6 1.7 1.75
Hay fever 0.25 0.35 0.15 0.25 0.15
Other respiratory complaints 0.95 0.35 0.95 2.05 3.05
Endocrine and metabolic 5.4 1.6 7.7 11 11.4
Digestive system 3.1 1.7 4.1 5 4.4
Nervous system 3 2.1 3.9 4.1 3.6
Any longstanding illness 31 21 42 58 65
Longstanding illness by age and
condition, 2007, Great Britain

8/8/2019 Disease Statistics Chart2
http://slidepdf.com/reader/full/disease-statistics-chart2 12/13
0 . 1 1
. 5
4 . 6 5
. 4
3 . 2
0 . 5
3 . 7
8 . 4
1 0
. 9
4 . 1
0 . 6
6 . 0
1 1
. 3
8 . 8
0 . 6
5
0 . 0
5
0 . 6
5 2
2 . 8
5
0 . 8
0 . 3
0 . 8
5
1 . 6
5 2
. 5
0 . 7
0 . 2
0 . 8
1 . 8
2 . 7
3 . 2
1 . 8 3
. 8 5 . 1
7 . 4
3 . 7
5
1 . 7
5 4 . 1
6 . 2
9 . 9
5
4 . 1
5
4 . 1
4 4 . 5
5
4 . 4
5
0 . 5
00 . 6 1
. 7 1
. 7 5
0 . 2
5
0 . 3
5
0 . 1
5
0 . 2
5
0 . 1
5
0 . 9
5
0 . 3
5
0 . 9
5 2
. 0 5
3 . 0
5 5 . 4
1 . 6
7 . 7
1 1 1
1 . 4
3 . 1
1 . 7
4 . 1 5
4 . 4
3 2
. 1 3 . 9
4 . 1
3 . 6
3 1
2 1
4 2
5 8
6 5
1 . 5
0
10
20
30
40
50
60
70
All ages 16-44 45-64 65-74 75+

8/8/2019 Disease Statistics Chart2
http://slidepdf.com/reader/full/disease-statistics-chart2 13/13
World Health Statistics 2002 -> Health Status Indicators -> Adult high blood pressure
prevalence
Global NCD InfoBase/Online Tool. World Health Organization.
(http://www.who.int/ncd_surveillance/infobase/en)
0
20
40
60
80
100
120
140
160
values 108 142 142 117 122 127 132
female female male Female Male Female Male
kenya Bahamas Lesotho Philippines Philippines United Kingdom of
Great Britain and
Northern Ireland
United Kingdom of
Great Britain and
Northern Ireland