disentangling the effectiveness of advertisement …€¦ · perodua, honda, proton, and nissan;...
TRANSCRIPT

MALAYSIAN JOURNAL OF CONSUMER AND FAMILY ECONOMICS
104
DISENTANGLING THE EFFECTIVENESS OF ADVERTISEMENT CONTENT: EVIDENCE FROM EYE TRACKER DATA
Noreldzaihan Mohd Rais1 and Rosidah Musa2
Abstract
In this 21st century, the advertising industry is focusing more on the online environment, which could be found on websites and social media, rather than the offline environment. With the fast emergence of digital online presence worldwide, marketing managers must ensure that the design and content of their advertisement can attract customers’ attention. As attention is captured, these advertisements will be able to convert it into purchase consideration, subsequently leading to actual purchases. The first ten seconds is the most critical part of an advertisement to capture customers’ attention. However, it is a challenge to understand what customers are looking for in advertisements. Further, from which aspect do customers look into, that would have more influence towards purchase consideration? This study thus intends to explore what and where customers of different genders look for within the first ten seconds of an advertisement; and to unravel its influence towards customers’ purchase consideration. Car advertisements published on Facebook during April 2018 from four brands in Malaysia; which includes Perodua, Honda, Proton, and Nissan; were used as stimuli. Eye tracker device was used to conduct heat map analysis and fixation counts. The data collected was based on a total of thirty participants, fifteen male and /fifteen female participants, aged between 20 to 50 years old. The result was quite surprising; it appears that both male and female participants look at similar angles from Facebook advertisements. Also, it was found that the message conveyed in the promotional text becomes an overall focus for both male and female customers when they look at these advertisements. Thus, it implies that promotional text is more influential in determining purchase consideration.
Keywords: Decision Making Process, Advertisement, and Eye Tracking
Introduction
The automotive industry in Malaysia is the fifth biggest spender on digital
advertising, which contributes to 5.1 per cent of revenue in the entire advertising
industry (Statistica.com, 2018). With this amount of money being spent every year,
marketing managers must ensure that they can obtain their return on investment. Their
primary objective of developing an advertisement is to attract customers’ attention and
convert it into consideration, subsequently leading to actual purchases. These days, the
1 Arshad Ayub Graduate Business School (AAGBS), Universiti Teknologi MARA (UiTM). Correspondence email: [email protected] 2 Institute of Business Excellence (IBE), Universiti Teknologi MARA (UiTM)

MALAYSIAN JOURNAL OF CONSUMER AND FAMILY ECONOMICS
105
advertising industry focuses more on the online environment, which could be found on
websites and social media, rather than the offline environment. However, it is
challenging to know what customers are looking for and from which aspects are
customers paying more attention to as they come across the advertisement. In addition
to that, what and where do customers look in advertisements; that will bring them to the
next level of the purchase funnel, which is the consideration stage? Does different
gender view advertisements differently?
The traditional method of the survey questionnaire was used to measure where
customers look at in advertisements. However, this method does not capture the main
focus of customers’ attention. Thus, eye tracker is deemed to be the best method to
measure customers’ eye movement and catch their fixation on advertisements.
Literature Review
Decision-Making Process
Decision-making process is a complex process which involves perception,
learning and information processing at a cognitive level (Endsley, 2017). Traditional
purchase funnel consist of three phases; which are awareness, consideration, and
purchase (Edwards, 2011; Evans & Bratton, 2012) where the brand promise is made
for a customer (Edwards, 2011). Brand awareness has an essential effect on
customers’ decision making by influencing the customer to choose the brand that they
aware of and consider it for subsequent purchases (Macdonald & Sharp, 2000; Erdem
& Swait, 2004).
Advertisement
Advertising has been widely used by firms to provide product information (Koetz,
dos Santos, & Cliquet, 2017) to their targeted customers. Brand logo, text, pictorial,
headline, colour, and edges are among the essential elements in print advertisement
(Wedel & Pieters, 2008). Prior research has proven that consumers tend to spend more
time on text rather than pictures in print advertisement (Rayner, Rotello, Stewart, Keir,
& Duffy, 2001). Later, Maughan, Gutnikov, and Stevens (2007) identified that
customers would spend more time and look more if they like the advertisement.
However, a recent finding showed that the customers’ goal would determine where and
what they are looking for in print advertisement (Rayner, Miller, & Rotello, 2008). The
main intention of organizations creating advertisement is to attract and influence a

MALAYSIAN JOURNAL OF CONSUMER AND FAMILY ECONOMICS
106
customer to convert into the purchase decision phase. However, substantial debate has
been formed subsequently on the subject of how to measure advertising effectiveness
(Muñoz-Leiva, Hernández-Méndez, & Gómez-Carmona, 2019), which later will impact
on purchase decisions. The various research method has been used to unlock this
problem such as self-assessment method, pool-survey method and recent researcher
has started using a more advanced method, which is using eye-tracking methodology.
Nevertheless, most studies were conducted in the context of a developed country,
where there is limited research done from the context of a developing country such as
Malaysia.
EyeTracker
Eye Tracker is a tool used to capture eye movement and to identify where and
what someone is looking on. Eye Tracker method has become widespread among
researcher in the user experience (UX) (Bojko, 2013) and marketing (Wedel & Pieters,
2008) field when technology is more widely accessible. However, this technology is
very costly. Eye movements had been studied to uncover its relation with cognitive
processes; also to identify how visual stimuli affect customers and influence decisions
made by these customers (Jacob & Karn, 2003; Lund, 2016). Experiments on Eye
Tracker are more widely conducted in developed countries as compared to an
emerging country such as Malaysia. Thus, this study intends to address this gap.
Methodology
Thirty participants were conveniently recruited to participate in this experiment
voluntarily. Fifteen males and fifteen females between the ages of 20-50 years old
participated in this study. This experiment was conducted in April 2018. Participants
were asked to imagine that they need to buy a car for the celebration of Hari Raya
Aidilfitri, which fell in June 2018. This experiment was conducted about two months
before this festival.
Eye Tracker was used to conducting this experiment. Car advertisements
published via Facebook in April 2018 from four brands in Malaysia; which include
Perodua, Honda, Proton, and Nissan; were used as stimuli. Five advertisement images
were loaded with a duration of ten seconds for each image to be viewed by participants.
The last image shown to participants is a combination of all advertisement, as shown in
Figure 5, for these participants to recall all the advertisement that they had seen
MALAYSIAN JOURNAL OF CONSUMER AND FAMILY ECONOMICS
107
previously. Fixation of brand advertisement in the last image, which is a combination of
all brand advertisements, will be counted to see where the customer would look at the
most, that would influence their decision to consider a purchase.
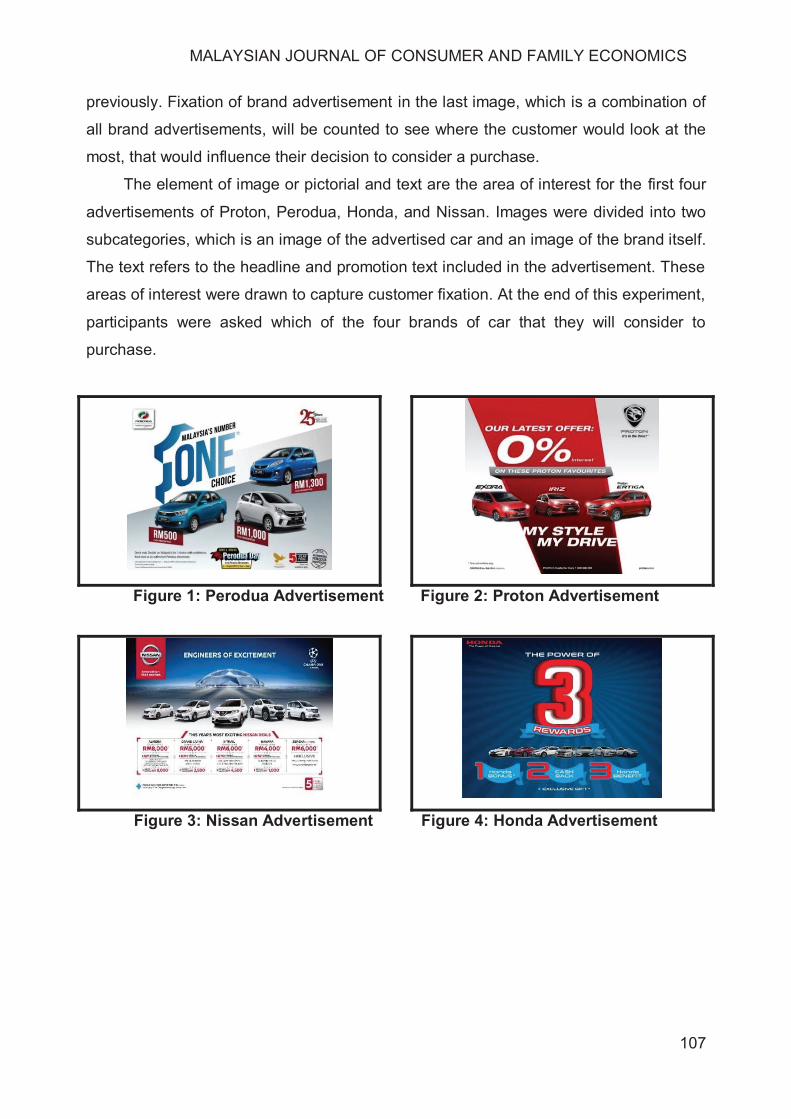
The element of image or pictorial and text are the area of interest for the first four
advertisements of Proton, Perodua, Honda, and Nissan. Images were divided into two
subcategories, which is an image of the advertised car and an image of the brand itself.
The text refers to the headline and promotion text included in the advertisement. These
areas of interest were drawn to capture customer fixation. At the end of this experiment,
participants were asked which of the four brands of car that they will consider to
purchase.
Figure 1: Perodua Advertisement Figure 2: Proton Advertisement
Figure 3: Nissan Advertisement Figure 4: Honda Advertisement

MALAYSIAN JOURNAL OF CONSUMER AND FAMILY ECONOMICS
108
Figure 5: Combination of All Advertisement
Findings
Heat map
Head map captures where customers’ attention is being placed on. Heat maps are
created using data from several panels, which permits an analysis of fixation trends
(Djamasbi, Siegel, & Tullis, 2011). Results of the heat map are shown in Figure 6 to 10.
From the heat map results, we could see that customers would mostly look at all the
elements contained in advertisements, texts, and pictorials.
Figure 6: Perodua Heat Map Figure 7: Proton Heat Map

MALAYSIAN JOURNAL OF CONSUMER AND FAMILY ECONOMICS
109
Figure 8: Nissan Heat Map Figure 9: Honda Heat Map
Figure 10: Combination of All Advertisement Heat Map
Fixation Count
Fixation count refers to how many times an area of interest is viewed. The result
of fixation count for each advertisement is shown in Table 1 for Proton, Table 2 for
Perodua, Table 3 for Nissan and Table 4 for Honda. In the advertisement for Proton
and Perodua, the cars’ image has the most fixation count for both male and female
panels. For Nissan’s advertisement, its promotion text gained the most fixation count for
both male and female panels. For Honda’s advertisement, the headline text has the
most fixation count for both male and female panels. Overall, Proton received the most
fixation count, followed by Honda, Nissan, and Perodua. Further to that, promo text
which refers to promotional text gains most fixation count.

MALAYSIAN JOURNAL OF CONSUMER AND FAMILY ECONOMICS
110
Table 1: Proton Advertisement Fixation Count
Participant Group
Fixation Count
Brand
Image
Car
Image
Headline
Text
Promo
Text Total
Female 20 171 112 112 415
Male 24 156 126 126 432
Total 44 327 238 238 847
Table 2: Perodua Advertisement Fixation Count
Participant Group
Fixation Count
Brand Image
Car Image
Headline Text
Promo Text
Total
Female 15 110 72 15 212
Male 12 105 78 12 207
Total 27 215 150 27 419
Table 3: Nissan Advertisement Fixation Count
Participant Group
Fixation Count
Brand Image
Car Image
Headline Text
Promo Text
Total
Female 15 83 18 200 316
Male 10 107 22 175 314
Total 25 190 40 375 630
Table 4: Honda Advertisement Fixation Count
Participant Group
Fixation Count
Brand Image
Car Image
Headline Text
Promo Text
Total
Female 14 55 129 128 326
Male 8 47 148 108 311
Total 22 102 277 236 637
GRAND
TOTAL 118 834 705 876 2533
MALAYSIAN JOURNAL OF CONSUMER AND FAMILY ECONOMICS
111
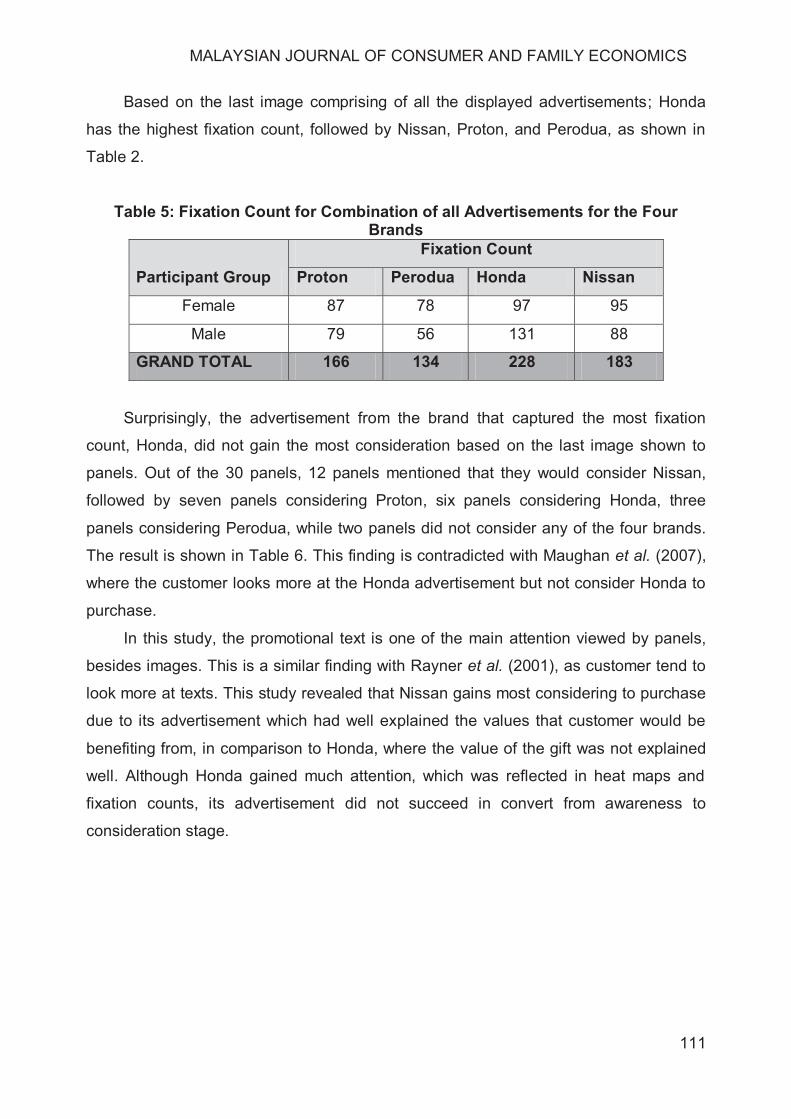
Based on the last image comprising of all the displayed advertisements; Honda
has the highest fixation count, followed by Nissan, Proton, and Perodua, as shown in
Table 2.
Table 5: Fixation Count for Combination of all Advertisements for the Four Brands
Participant Group
Fixation Count
Proton Perodua Honda Nissan
Female 87 78 97 95
Male 79 56 131 88
GRAND TOTAL 166 134 228 183
Surprisingly, the advertisement from the brand that captured the most fixation
count, Honda, did not gain the most consideration based on the last image shown to
panels. Out of the 30 panels, 12 panels mentioned that they would consider Nissan,
followed by seven panels considering Proton, six panels considering Honda, three
panels considering Perodua, while two panels did not consider any of the four brands.
The result is shown in Table 6. This finding is contradicted with Maughan et al. (2007),
where the customer looks more at the Honda advertisement but not consider Honda to
purchase.
In this study, the promotional text is one of the main attention viewed by panels,
besides images. This is a similar finding with Rayner et al. (2001), as customer tend to
look more at texts. This study revealed that Nissan gains most considering to purchase
due to its advertisement which had well explained the values that customer would be
benefiting from, in comparison to Honda, where the value of the gift was not explained
well. Although Honda gained much attention, which was reflected in heat maps and
fixation counts, its advertisement did not succeed in convert from awareness to
consideration stage.

MALAYSIAN JOURNAL OF CONSUMER AND FAMILY ECONOMICS
112
Table 6: Brand Consideration by Customers after Viewing the Advertisement
Gender Brand Consideration
Proton Perodua Honda Nissan None
Female 4 2 3 5 2
Male 3 1 3 7 0
Total 7 3 6 12 2
Conclusion
For advertisements of local brands, the focus is placed on the car image.
Meanwhile, for advertisements of imported brands, the focus is surprisingly placed on
promotional text for Nissan, and headline for Honda; instead of focusing on the car
image itself. It was observed that the image reflecting the size of the car was printed
smaller by Honda, as compared to other brands. Proton used its headline as a form of
promotional text. Nissan has the most information placed on its promotion text in
comparison to all of the brand advertisement. Gender difference did not bring significant
influence when it comes to where and what was being viewed in the advertisement.
However, size, alongside image and text clarity does attract customers’ attention. For
the first four images, Proton received the most fixation count, followed by Honda,
Nissan, and Perodua. In the last image, Honda got most of the fixation count and
followed by Nissan, Proton, and Perodua. However, the most brand that was being
considered by panels was Nissan, followed by Proton, Honda and Perodua. Customer
may like the advertisement and would prefer to have a closer look at the advertisement
in this study, for example, customers look more at Honda. However, Honda did not gain
any of customer consideration. Nissan had more precise information on the promotion
being offered in comparison to Honda. Thus, with limited information available,
customers would choose Nissan over Honda.
In this study, the promotional text is one of the main attention among panels
beside the displayed image. Thus, the automotive industry should pay more attention to
designing promotional text for advertisements. It is advisable to state promotional text
clearly so that customers are aware of the value that they will get by viewing
advertisements without any need to do further research for more information.

MALAYSIAN JOURNAL OF CONSUMER AND FAMILY ECONOMICS
113
Future research needs to explore more on why customers prefer to look more on
an advertisement, yet they decide not to consider the brand to purchase, besides the
clarity of advertisement.
Acknowledgements
The authors proudly thank the Ministry of Higher Education (MOHE) for funding
this research under its Fundamental Research Grant Scheme (FRGS): 600-IRMI/FRGS
5/3 (077/2017).
References
Bojko, A. (2013). Eye-tracking the user experience: A practical guide to research: Rosenfeld Media.
Djamasbi, S., Siegel, M., & Tullis, T. (2011). Visual hierarchy and viewing behaviour: An eye-tracking study. Paper presented at the International Conference on Human-Computer Interaction.
Edwards, S. M. (2011). A social media mindset. Journal of Interactive Advertising, 12(1), 1-3.
Endsley, M. R. (2017). Toward a theory of situation awareness in dynamic systems Situational Awareness (p. 9-42): Routledge.
Erdem, T., & Swait, J. (2004). Brand Credibility, Brand Consideration, and Choice. Journal of Consumer Research, 31(1), 191-198.
Evans, D., & Bratton, S. (2012). Social Media Marketing: An Hour a Day. Canada: John Wiley & Sons.
Jacob, R. J., & Karn, K. S. (2003). Eye-tracking in human-computer interaction and usability research: Ready to deliver the promises The mind's eye (p. 573-605): Elsevier.
Koetz, C., dos Santos, C. P., & Cliquet, G. (2017). Advertising spending, mood, and level of product information on quality perception. Managerial and Decision Economics, 38(3), 314-325.
Lund, H. (2016). Eye-tracking in the library and information science: a literature review. Library Hi Tech, 34(4), 585-614.
Macdonald, E. K., & Sharp, B. M. (2000). Brand awareness effects on consumer decision making for a common, repeat purchase product:: A replication. Journal of Business Research, 48(1), 5-15.
Maughan, L., Gutnikov, S., & Stevens, R. (2007). Like more, look more. Look more, like more: The evidence from eye-tracking. Journal of Brand Management, 14(4), 335-342.
Muñoz-Leiva, F., Hernández-Méndez, J., & Gómez-Carmona, D. (2019). Measuring advertising effectiveness in Travel 2.0 websites through eye-tracking technology. Physiology and Behavior, 200, 83-95.
Rayner, K., Miller, B., & Rotello, C. M. (2008). Eye movements when looking at print advertisements: The goal of the viewer matters. Applied Cognitive Psychology: The Official Journal of the Society for Applied Research in Memory and Cognition, 22(5), 697-707.