disentangling the impacts of environmental contamination from locally undesirable land-uses (lulus)...
TRANSCRIPT
Disentangling the Impacts of Environmental Contamination from
Locally Undesirable Land-uses (LULUs) on Residential Property Values
Xiangping Liu, Laura Taylor, and Daniel Phaneuf
June 25, 2010

Literature on Environmentally Contaminated Sites
• Use distance to a site listed on National Priority List (NPL) to proxy its impact
• Study a single or several NPL sites in one area– Summarized in Kiel and Williams (2007)

Literature on Environmentally Contaminated Sites, contd.
• Heterogeneity of the impact by site– Kiel and Williams (2007; all NPL sites)
• Stigma–Messer et al. (2006)–McCluskey and Rausser (2003)– Dale et al. (1999)
Our Contribution
• Particular focus is to separate two impacts:– Contamination/cleanup (listing/delisting)– LULU (commercial or industrial properties)
• Control for sites that are on both federal and state priority lists

Our Contribution, contd.
• Use accurate site boundary rather than the centroid
• Estimate heterogeneous impacts of site types– Commercial vs. industrial sites– Landfill, solvent, and military sites vs. other sites
• Use parcel-level transaction data, with careful attention to local unobservable community characteristics

Identification strategy--geographic matching
• Key issue: identify treated group & construct unobserved counterfactual for the treated observations.
• Distance matters, but distance can be correlated with local unobservable characteristics.– Local community characteristics, if not controlled for,
could bias the estimation.
Identification strategy, contd.
• Treated observations:– Residential properties within 0.3-mile buffer to the
boundary of a listed site – Identify land-use of each listed site
• Control observations:– Residential properties within 0.3-mile buffer to the
boundary of a clean commercial/industrial (COM/IND) site
– Identify land-use of each “clean” site• Match clean COM or IND sites to contaminated
sites based on their spatial locations

Identification strategy--geographic matching
• Match treated & control observations based on their spatial locations:1. Treated residential properties are within 0.3 mile
buffer of listed site

Illustration of geographic matching
Identification strategy--geographic matching
• Match treated & control observations based on their spatial locations:1. Treated residential properties are within 0.3 mile
buffer of listed site2. Create buffer ring of 0.7-1.0 mile from boundary
of listed site
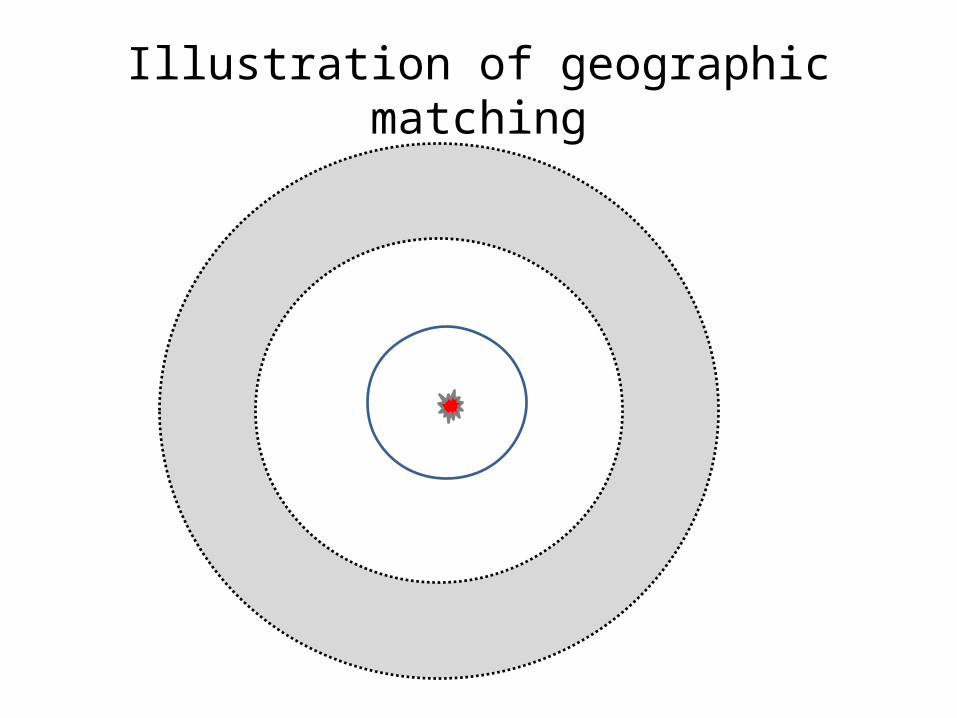
Illustration of geographic matching
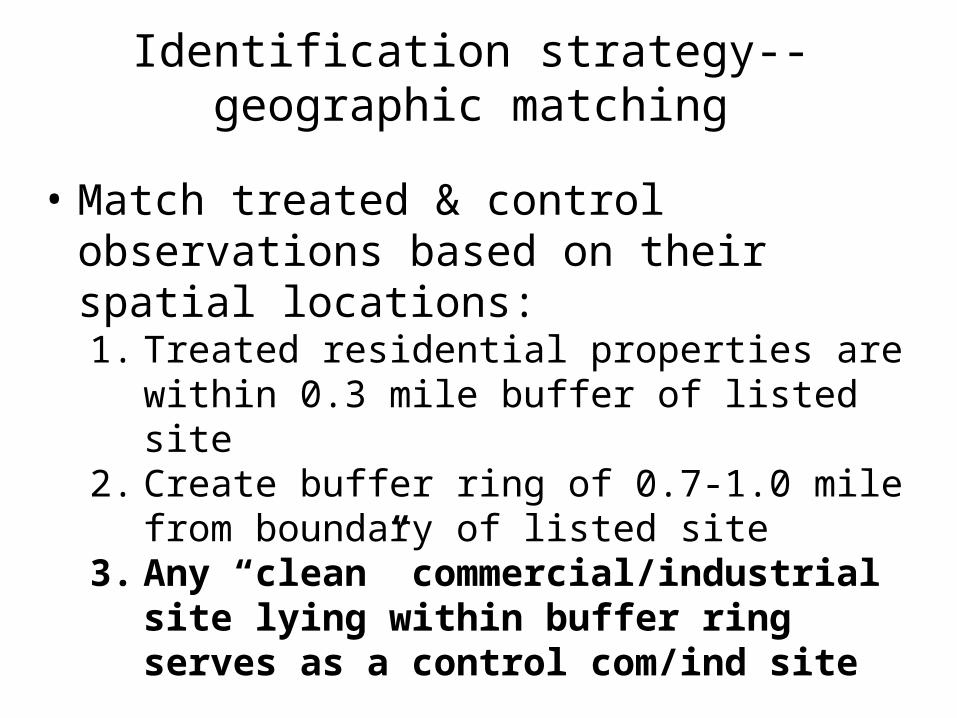
Identification strategy--geographic matching
• Match treated & control observations based on their spatial locations:1. Treated residential properties are within 0.3 mile
buffer of listed site2. Create buffer ring of 0.7-1.0 mile from boundary of
listed site3. Any “clean” commercial/industrial site lying
within buffer ring serves as a control com/ind site

Illustration of geographic matching

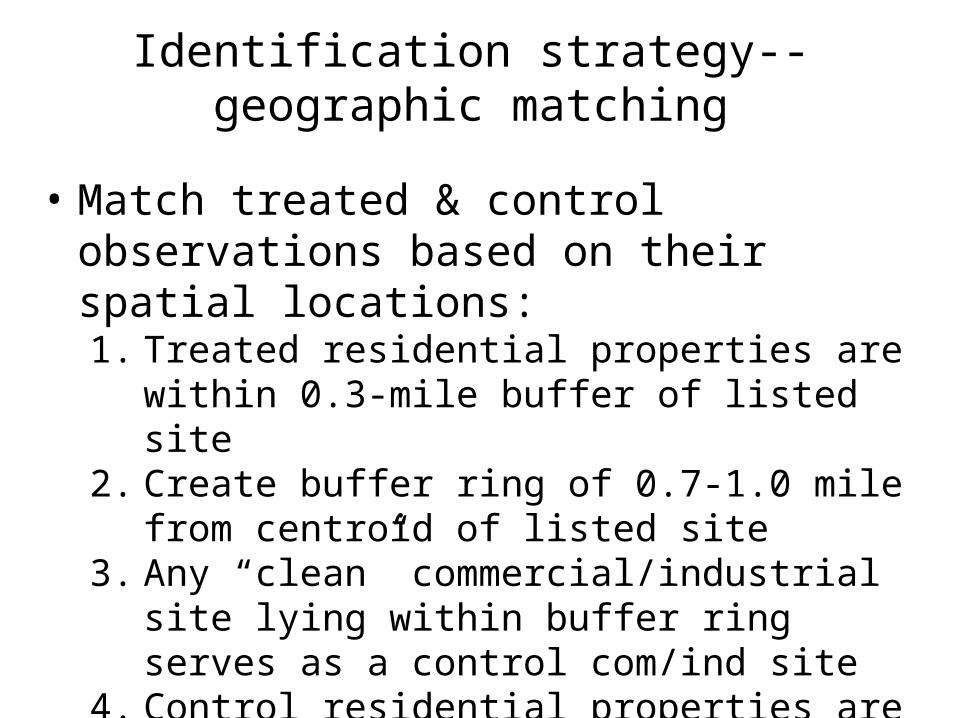
Identification strategy--geographic matching
• Match treated & control observations based on their spatial locations:1. Treated residential properties are within 0.3-mile
buffer of listed site2. Create buffer ring of 0.7-1.0 mile from centroid of
listed site3. Any “clean” commercial/industrial site lying within
buffer ring serves as a control com/ind site4. Control residential properties are within 0.3-mile
buffer of control com/ind site

Illustration of geographic matching
Identification strategy--geographic matching
• Match treated & control observations based on their spatial locations:1. Treated residential properties are within 0.3-mile
buffer of listed site2. Create buffer ring of 0.7-1.0 mile from centroid of
listed site3. Any “clean” commercial/industrial site lying within
buffer ring serves as a control com/ind site4. Control residential properties are within 0.3-mile
buffer of control com/ind site
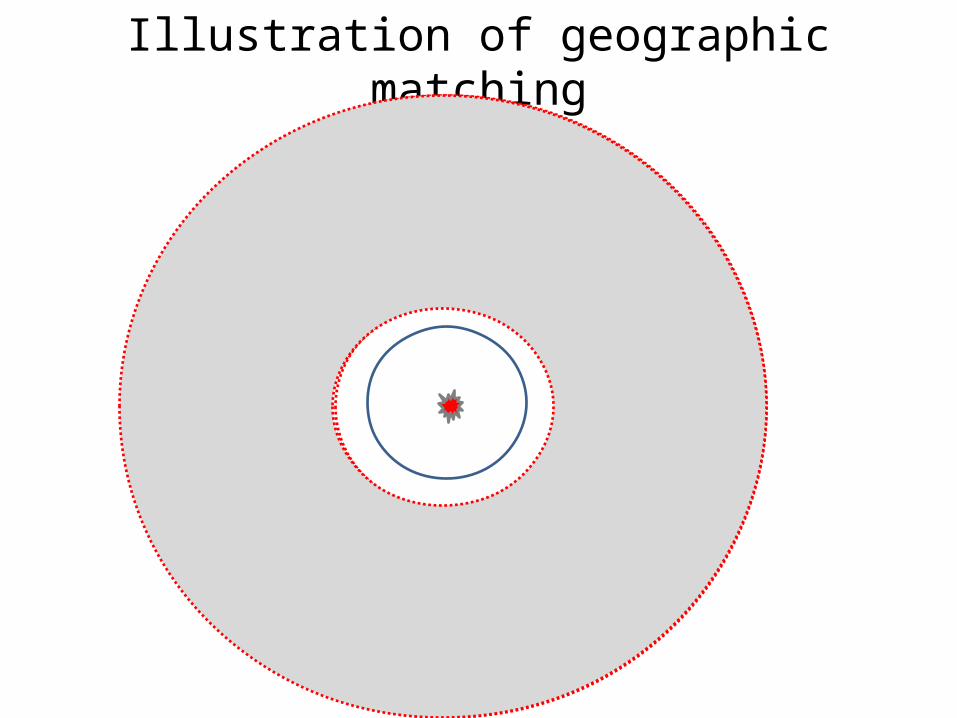
Illustration of geographic matching
Heterogeneous effects and local community level unobservable
• Conduct analysis for COM and IND sites separately
• Examine the impact by site types, eg. landfill, solvent, military sites, and other sites separately
• Control for site fixed effect– Check the robustness of the result by controlling both site
fixed effect and local community characteristics

Data
• Study area: Minneapolis/St. Paul metropolitan statistical area, Minnesota
• Contaminated sites: All sites listed on state or federal registers of contaminated sites.– 108 sites (51 listed after 1990 / 59 delisted after 1990)– Site boundaries (manual identification)– Land-use– Contaminate type
• Residential property transactions 1990-2007– housing attributes: acres, # rooms, bedrooms, baths, age,
school district.

Data
• Community characteristics: – Census demographics at block group level are
compiled from Geolytics
• Local land-use characteristics (within 0.5 miles or 1 mile)–% land in: commercial use; industrial use;
residential use; apartments, open space, water, highway

Example of treated & control residential properties
Legend
Control residentialListed sitesTreated residentialClean com/ind

Empirical specification
• Mathematical representation of estimating equations
--Listing
Ln(sales price)=α*treat+β*tl+γ*treat_tl
+constant+α*X+ site fixed effect+ time effect…
--De-listing
Ln(sales price)=α*treat+β*tdl+γ*treat_tdl
+constant+α*X+ site fixed effect+ time effect…

Housing
characteristicsMost recent transaction
Estimated effect # Obs
Sites listed in any year 0.00352 85,079
Listed since Jan. 1991(and all below are same) -0.0296* 24,491 Y -0.0463** 17,058 Y -0.0360** 24,487 Y Y -0.0648*** 17,054Only sales within 7 years of listing Y Y -0.0459** 8,740
Preliminary sample results: listing
• All listed sites, no impact heterogeneity in land-use of site

Excluding landfill, solvent & military
sitesEstimated effect # Obs
COM N -0.114*** 5,943IND N 0.026 5,034COM Y -0.0639 5,848IND Y -0.536*** 3,525
Preliminary sample results: listing, continued.
• Heterogeneity by land-use: Commercial versus Industrial (all covariates & most recent transaction)
Housing
characteristicsMost recent transactions
Estimated effect # Obs
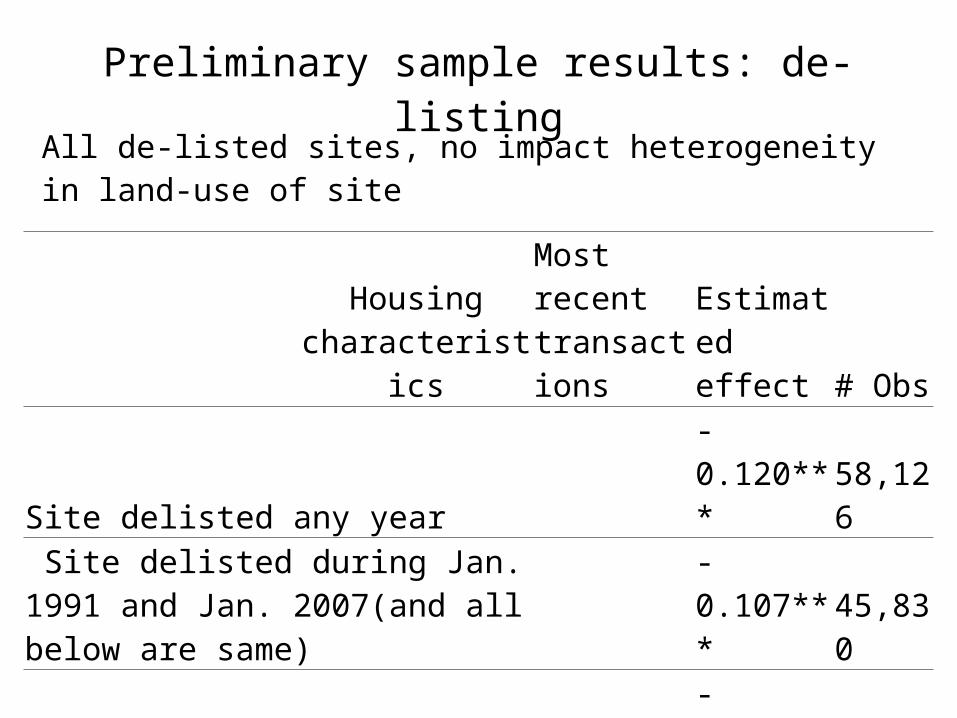
Site delisted any year -0.120*** 58,126 Site delisted during Jan. 1991 and Jan. 2007(and all below are same) -0.107*** 45,830 Y -0.105*** 31,243 Y -0.102*** 45,820 Y Y -0.095*** 31,233Only sales within 7 years of delisting Y Y -0.076*** 17,885
Preliminary sample results: de-listing
All de-listed sites, no impact heterogeneity in land-use of site
Excluding landfill, solvent & military
sitesEstimated effect Obs
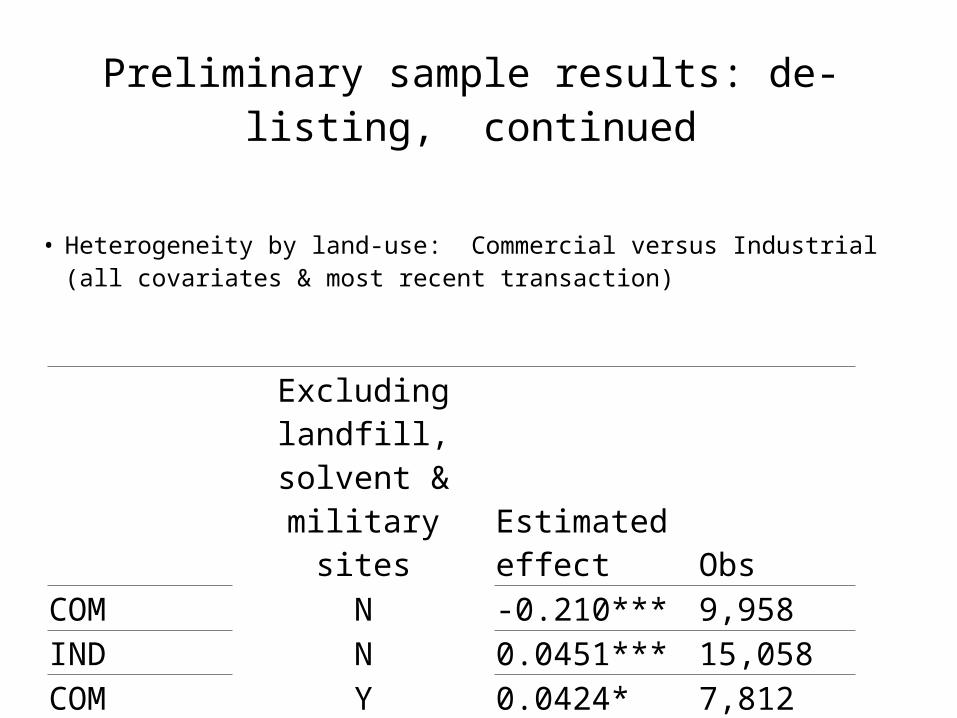
COM N -0.210*** 9,958IND N 0.0451*** 15,058COM Y 0.0424* 7,812IND Y 0.0460** 13,596
Preliminary sample results: de-listing, continued
• Heterogeneity by land-use: Commercial versus Industrial (all covariates & most recent transaction)
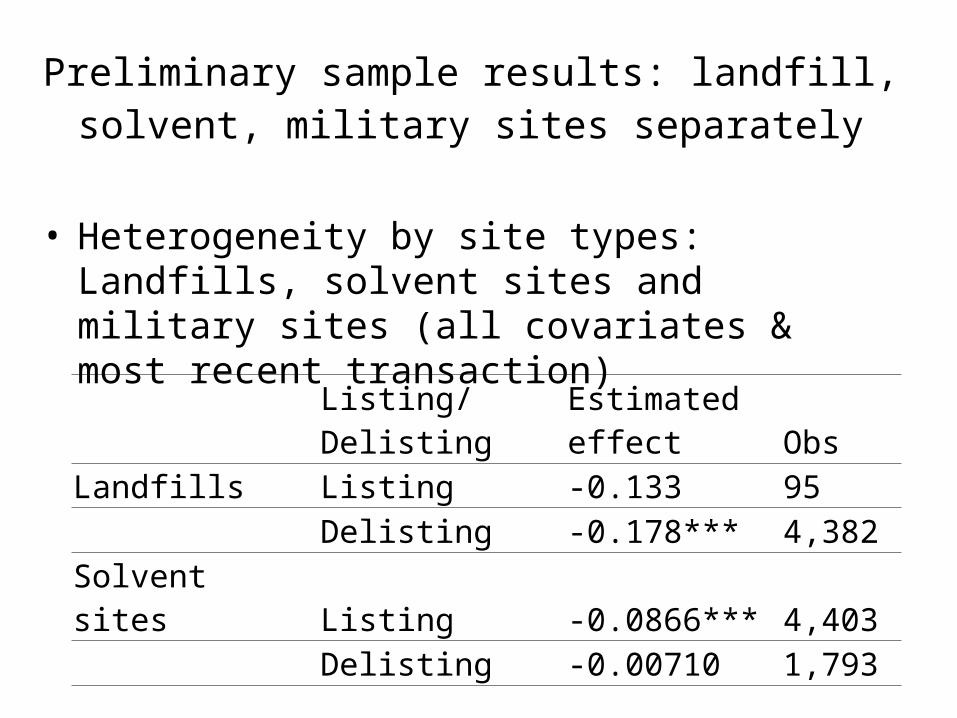
Listing/Delisting Estimated effect ObsLandfills Listing -0.133 95
Delisting -0.178*** 4,382Solvent sites Listing -0.0866*** 4,403
Delisting -0.00710 1,793
Preliminary sample results: landfill, solvent, military sites separately
• Heterogeneity by site types: Landfills, solvent sites and military sites (all covariates & most recent transaction)

Conclusion
• The effect of contamination--listing a site reduces nearby residential property value 3-7 %
• The listing has larger impact on residential property surrounding a industrial site than a commercial site – about 7-12% for a COM site – 47% an IND site
• Delisting some NPL/PLP sites improves nearby residential property by 5%.
• However, there exist stigma effect of cleanup on the nearby residential property for the landfill sites.
Work-to-do
• Matching NPL/PLP sites based on local community characteristics rather than geographical location (a propensity score matching or matching on local community characteristics directly). This method allows us to further check how strong local community characteristics or unobservables affect estimation results.
• Separate regressions for detached residential properties, townhouse, and condo

The End
Thank you!

Excluding landfill, solvent
& military sites Estimated effect ObsCOM N -0.210*** 9,958IND N 0.0451*** 15,058COM Y 0.0424* 7,812IND Y 0.0460** 13,596COM (0-7) N -0.132*** 5,807IND (0-7) N 0.0204 7,371COM (0-7) Y -0.0534** 4,455IND (0-7) Y 0.0136 6,239
Preliminary sample results: de-listing, continued
• Heterogeneity by land-use: Commercial versus Industrial (all covariates & most recent transaction)

Housing & Neighborhood Demographics
Most recent transactions
Estimated effect # Obs
Site delisted any year -0.0292** 49029 Site delisted during Jan. 1991 and Jan. 2007(and all below are same) 0.0298** 36769 Y 0.0329** 25184 Y 0.0183 36760 Y Y 0.0218 25175Only sales within 7 years of delisting Y Y -0.0301** 13413
Preliminary sample results: de-listing, continued
De-listed sites, exluding landfill, solvent & military sites
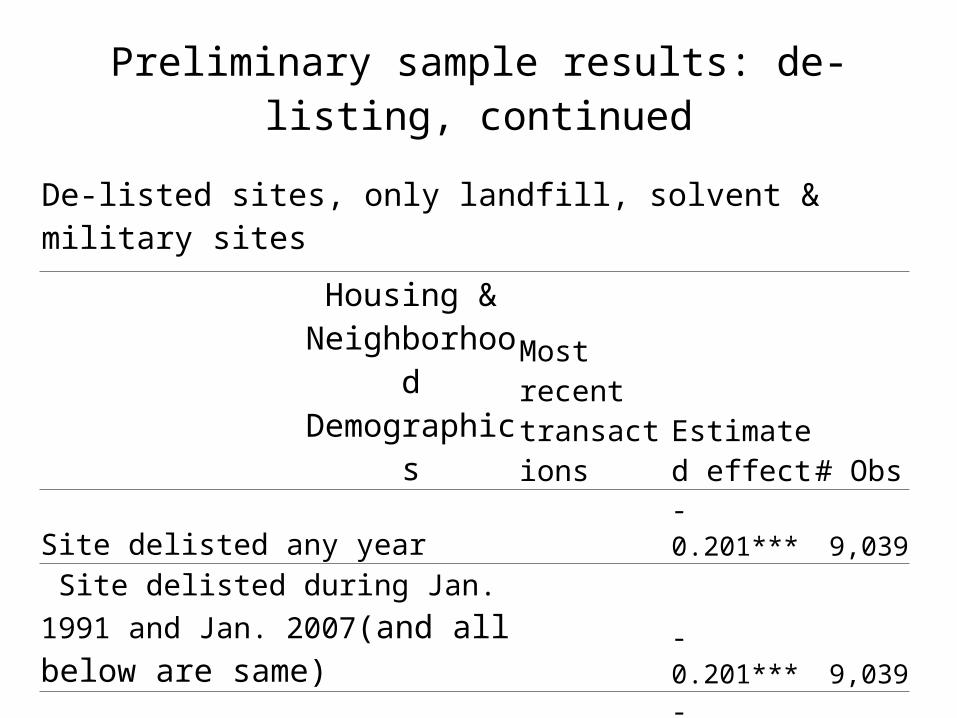
Housing & Neighborhood Demographics
Most recent transactions
Estimated effect # Obs
Site delisted any year -0.201*** 9,039 Site delisted during Jan. 1991 and Jan. 2007(and all below are same) -0.201*** 9,039 Y -0.235*** 6,047 Y -0.192*** 9,038 Y Y -0.214*** 6,046Only sales within 7 years of delisting Y Y -0.153*** 4,479
Preliminary sample results: de-listing, continued
De-listed sites, only landfill, solvent & military sites