dispersing transition metal vacancies in layered double ... · and 1 ml of 5 mm cu(no3)2•3h2o...
TRANSCRIPT
S1
Dispersing Transition Metal Vacancies in Layered Double Hydroxide by Ionic Reductive Complexation Extraction for Efficient Water OxidationYangshan Xie1, Zheng Wang1, Min Ju1, Xia Long*1, Shihe Yang*1,2
1.Guangdong Provincial Key Lab of Nano-Micro Material Research, School of Chemical Biology and Biotechnology, Peking University Shenzhen Graduate School, Shenzhen 518055, China;
2.Department of Chemistry, The Hong Kong University of Science and Technology, Clear Water Bay, Kowloon, Hong Kong, China
Supporting Information
1. Experimental Details S22. Results and Discussion S63. References S24
Electronic Supplementary Material (ESI) for Chemical Science.This journal is © The Royal Society of Chemistry 2019

S2
Experimental Details
1. Chemicals
Chemicals: Nickel nitrate hexahydrate (Ni(NO3)2•6H2O), copper nitrate trihydrate (Cu(NO3)2•3H2O), urea (CO(NH2)2), potassium thiocyanate (KSCN), sodium sulfite (Na2SO3), potassium hydroxide (KOH), Iridium oxide (IrO2), Ruthenium(IV) oxide (RuO2), ploytetrafluoroethylene preparation (PTFE), absolute ethanol (C2H5OH), hydrochloric acid (HCl). Deionized water (18 MΩ) was used to prepare all aqueous solutions. Besides, all chemicals were analytical grade and obtained from commercial suppliers and used without further purification.
2. Synthesis of NiCu LDH
NiCu LDH were synthesized by a hydrothermal method, namely, 1 ml of 10 mM Ni(NO3)2•6H2O aqueous solution and 1 ml of 5 mM Cu(NO3)2•3H2O aqueous solution were mixed in the beaker with 87 ml deionized water. Then 1 ml of 100 mM CO(NH2)2 was added into the beaker in sequence with magnetic stirring. Nickel foam (about 2 × 3 cm) was carefully cleaned with dilute HCl solution by ultrasonication for 30 min to remove the surface NiO layers, and then sonicated in deionized water and absolute ethanol for 5 min. The above solution and a cleaned piece of nickel foam (2 × 3 cm) were transferred to a 100 ml Teflon lined stainless steel autoclave for hydrothermal reaction at 150 ºC for 48 h, and then allowed to cool to room temperature naturally. Then the NiCu LDH was washed with deionized water/ethanol three times and then dried at room temperature.
3. Fabrication atomic defects on NiCu(I) LDH surface
The NiCu(I) LDH was prepared via an ionic reductive method. Specifically, Na2SO3 (1 M) was dissolved in 20 mL of deionized water and stirred to form a clear solution. Then NiCu LDH coated nickel foam was immersed in the above solution with magnetic stirring for 6 days. Then the resulting sample was washed with deionized water/ethanol three times, and dried with a stream of N2.
4. Fabrication atomic defects on NiCu LDH surface
The NiCu LDH surface with atomic defects was prepared via an ionic reductive complexation extraction (IRCE) method. Specifically, KSCN (1 M) and Na2SO3 (1 M) were dissolved in 20 mL of deionized water and stirred to form a clear solution. Then NiCu LDH coated nickel foam was immersed in the above solution with magnetic stirring for various complexation times (3 days, 6 days, 8 days). Then the resulting sample was washed with deionized water/ethanol three times, and dried with a stream of N2.
5. Materials characterizations
The catalysts were characterized directly by scanning electron microscopy (SEM, ZEISS SUPRA®55) at 5.0 kV and the energy dispersive X-ray Spectroscopy (EDX) analysis were performed on SEM OXFORD X-MAX.
Transmission Electron Microscopy, high resolution TEM (HRTEM) and electron diffraction pattern (ED pattern) were collected on JEM-3200FS. The samples were made by sonication the catalysts off from the nickel foam, then the suspensions with catalyst were dropped onto the copper grid for TEM, ED pattern and HRTEM characterization.
The crystal structure of samples was determined by X-ray diffraction (XRD, D8 Advance X-ray diffractometer) operated at 40 kV and 40 mA with a Cu Kα radiation (λ=1.5405 Å) in the 2θ ranging from 5° to 80° with a step size of 0.02°.
X-ray photoelectron spectroscopy (XPS) spectra were collected on ESCALAB 250XI (ThermoScientific). Spectra were analyzed using XPSPEAK software. The C1s peak for adventitious hydrocarbons at 284.6 eV was used for binding energy calibration.

S3
The concentration of the leached copper ions in complexation solution was quantified by an inductively coupled plasma emission spectroscopy instrument (ICP-AES, JY2000-2).
Zeta potentials of the samples (0.2 mg sample was dissolved in 3 mL of deionized water) were determined by dynamic light scattering analysis (Nano-ZS90) at room temperature.
Electron spin resonance (ESR) measurements were obtained on a Bruker EPR A300 spectrometer. Typically, 5mg sample was placed in a quartz-glass sample tube.
6. Electrochemical performance characterizations
Electrochemical measurements were carried out in a standard three electrode system conducted by a Biological VSP-300 electrochemistry workstation. The as-prepared freestanding catalysts@Ni foam were used as the working electrode, platinum wire and Ag/AgCl electrode were used as the counter and reference electrode, respectively. For IrO2@Ni foam, 1 mg IrO2 was dispersed in 0.5 ml ethanol and sonication for 30 min, then 0.5 ml of 4 wt% PTFE was added. After sonication for another 30 min, the catalyst ink was drop dried onto a Ni foam (1 cm × 1 cm). The preparation of RuO2@Ni foam was the same as that of IrO2@Ni foam except for using RuO2 to replace the IrO2.
The reference was calibrated against and converted to reversible hydrogen electrode (RHE) according to the formula of
E (vs RHE) = E(exp)+ E(Ag/AgCl) +0.059pH
All measurements were recorded in 1 M KOH. The cyclic voltammetry (CV) measurements were cycled at a scan rate of 10 mV/s for 20 times until a stable CV curve was achieved before collecting polarization curves and Tafel plots of the catalysts.
Linear sweep voltammetry (LSV) was carried out at 5 mV/s for the polarization curves and 0.5 mV/s for Tafel plots. LSV polarization curves were corrected with 95% iR-compensation.
Chrompotentiometry (CP) was carried out under a constant current density of 10 mA/cm2, 20 mA/cm2, and 50 mA/cm2.
Electrochemical impedance spectroscopy (EIS) analysis were conducted at 1.53 V vs RHE at overpotential of 300mV at DC potential of 5 mV with the frequency ranging from 100 kHz to 0.1 Hz.
The Faradaic efficiency can be calculated as follows1:
Faradaic efficiency = n Z F/I t
where n is the number of moles of O2 evolution, Z is the needed electrons to produce one O2 molecule, F is the faraday constant (96485 C/mol), t is the time (s), I is the defined current density (A). The electrocatalytic reaction was typically performed at a constant current of 20 mA for 90 min, and 1mL of reactive gas was taken from the reactor with a syringe for analysis using a gas chromatograph (GC-2014C, Lab-solution, TCD, N2 carrier).
7. Theoretical simulations
All the first-principles spin-polarized calculations were performed using Vienna ab initio simulation package (VASP).2,3 Projector augmented wave (PAW) potentials were employed to describe the core-valance interactions.4 And the electronic exchange and correlation was treated by the generalized gradient approximation with the Perdew, Burke, and Ernzerhof (PBE) functional5 with onsite Hubbard U corrections 6, in which U values for Ni and Cu are chosen as 4.4 and 7.0 eV, respectively, similar to the reported work.7, 8 The energy cutoff for the plane-wave basis set is set as 400 eV. The convergence criteria is set as 0.001 eV/Å for maximal forces and 10-5 eV for energies. Solvation corrections are taken into consideration by relaxing the structures using the implicit solvation model with water as
S4
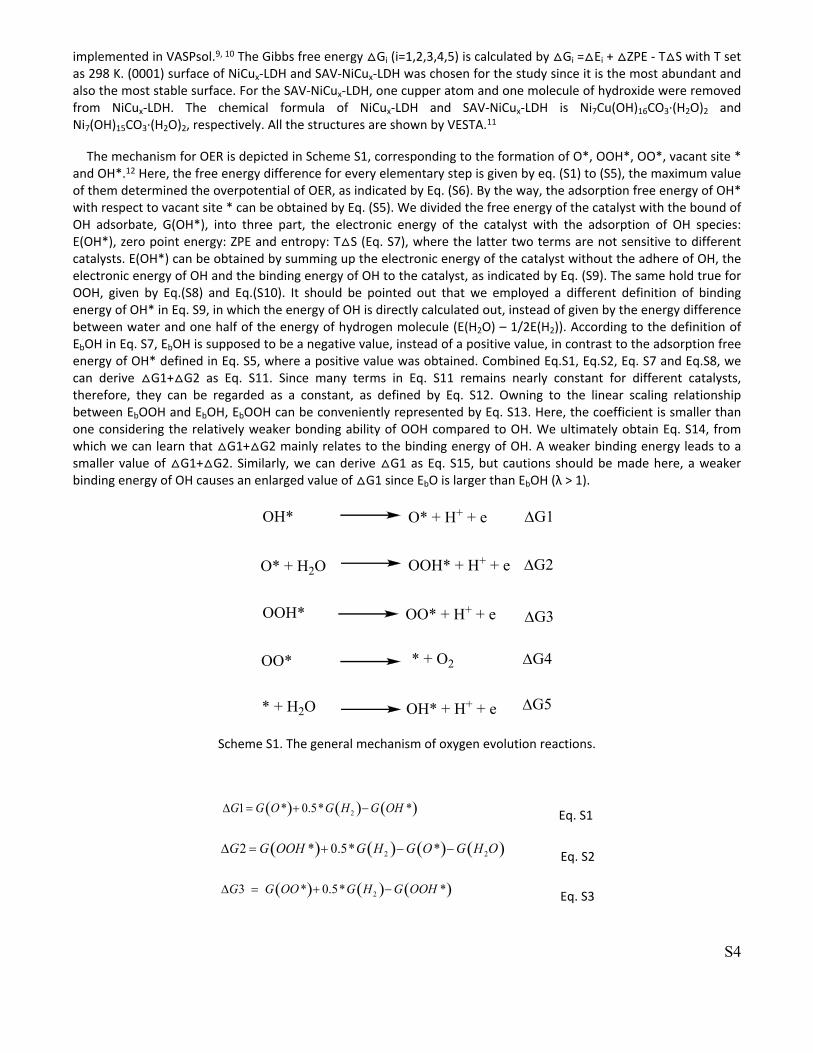
implemented in VASPsol.9, 10 The Gibbs free energy △Gi (i=1,2,3,4,5) is calculated by △Gi =△Ei + △ZPE - T△S with T set as 298 K. (0001) surface of NiCux-LDH and SAV-NiCux-LDH was chosen for the study since it is the most abundant and also the most stable surface. For the SAV-NiCux-LDH, one cupper atom and one molecule of hydroxide were removed from NiCux-LDH. The chemical formula of NiCux-LDH and SAV-NiCux-LDH is Ni7Cu(OH)16CO3·(H2O)2 and Ni7(OH)15CO3·(H2O)2, respectively. All the structures are shown by VESTA.11
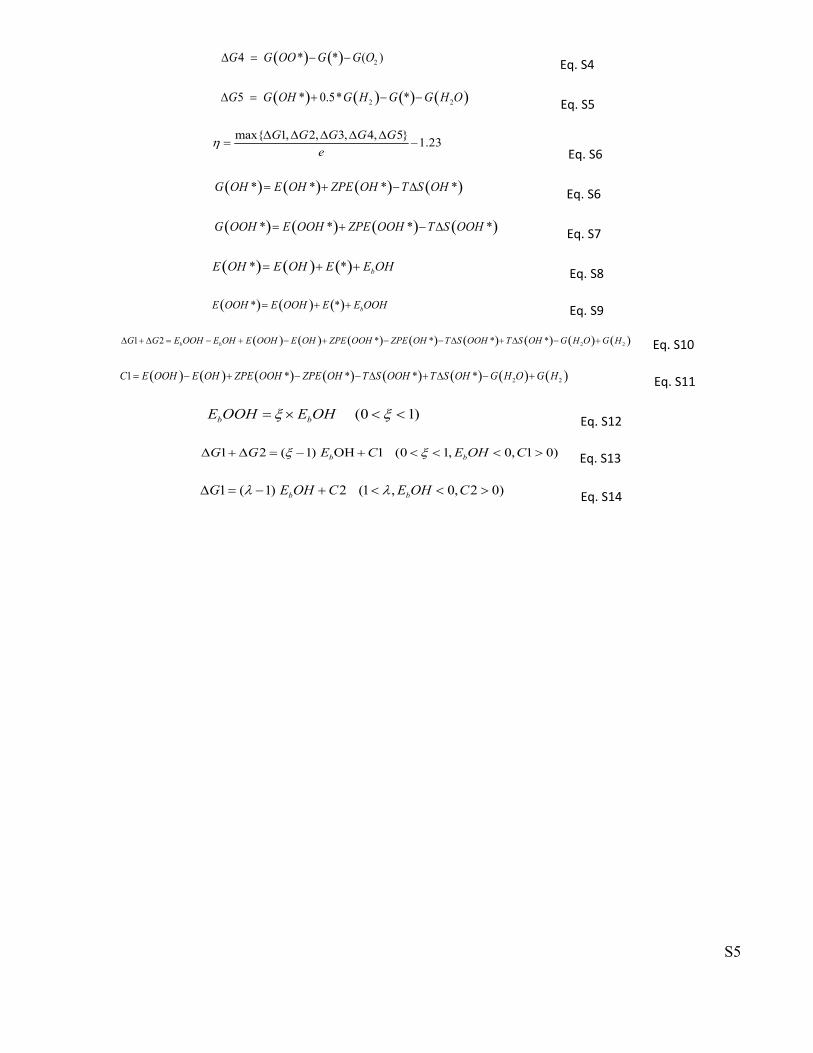
The mechanism for OER is depicted in Scheme S1, corresponding to the formation of O*, OOH*, OO*, vacant site * and OH*.12 Here, the free energy difference for every elementary step is given by eq. (S1) to (S5), the maximum value of them determined the overpotential of OER, as indicated by Eq. (S6). By the way, the adsorption free energy of OH* with respect to vacant site * can be obtained by Eq. (S5). We divided the free energy of the catalyst with the bound of OH adsorbate, G(OH*), into three part, the electronic energy of the catalyst with the adsorption of OH species: E(OH*), zero point energy: ZPE and entropy: T△S (Eq. S7), where the latter two terms are not sensitive to different catalysts. E(OH*) can be obtained by summing up the electronic energy of the catalyst without the adhere of OH, the electronic energy of OH and the binding energy of OH to the catalyst, as indicated by Eq. (S9). The same hold true for OOH, given by Eq.(S8) and Eq.(S10). It should be pointed out that we employed a different definition of binding energy of OH* in Eq. S9, in which the energy of OH is directly calculated out, instead of given by the energy difference between water and one half of the energy of hydrogen molecule (E(H2O) – 1/2E(H2)). According to the definition of EbOH in Eq. S7, EbOH is supposed to be a negative value, instead of a positive value, in contrast to the adsorption free energy of OH* defined in Eq. S5, where a positive value was obtained. Combined Eq.S1, Eq.S2, Eq. S7 and Eq.S8, we can derive △G1+△G2 as Eq. S11. Since many terms in Eq. S11 remains nearly constant for different catalysts, therefore, they can be regarded as a constant, as defined by Eq. S12. Owning to the linear scaling relationship between EbOOH and EbOH, EbOOH can be conveniently represented by Eq. S13. Here, the coefficient is smaller than one considering the relatively weaker bonding ability of OOH compared to OH. We ultimately obtain Eq. S14, from which we can learn that △G1+△G2 mainly relates to the binding energy of OH. A weaker binding energy leads to a smaller value of △G1+△G2. Similarly, we can derive △G1 as Eq. S15, but cautions should be made here, a weaker binding energy of OH causes an enlarged value of △G1 since EbO is larger than EbOH (λ > 1).
G1
O* + H2O OOH* + H+ + e G2
OOH*
O* + H+ + e
OO* * + O2
OH*
OH* + H+ + e
G3
G4
G5
OO* + H+ + e
* + H2O
Scheme S1. The general mechanism of oxygen evolution reactions.
Eq. S1 21 * 0.5* *G G O G H G OH
Eq. S2 2 22 * 0.5* *G G OOH G H G OG O H
Eq. S3 23 * 0.5* *G G OO G H G OOH
S5
Eq. S4 24 * * ( )G G OO G G O
Eq. S5 2 25 * 0.5* *G G OH G H G G H O
Eq. S6max{ 1, 2, 3, 4, 5} 1.23G G G G G
e
Eq. S6 * * * *G OH E OH ZPE OH T S OH
Eq. S7 * * * *G OOH E OOH ZPE OOH T S OOH
Eq. S8 * * bE OH E OH E OHE
Eq. S9 * * bE OOH E OOH E E OOH
Eq. S10 2 21 2 * * * *b bG G E E E OOH E OH ZPE OOH ZPE OH T S OOHO T S OH G H O GOH OH H
Eq. S11 2 21 * * * *C E OOH E OH ZPE OOH ZPE OH T S OOH T S OH G H O G H
Eq. S12 0 ( 1)b bOOH OHE E
Eq. S131 2 1 1 ( ) OH ( 0, 1, 1 0)0b bG G E C OHE C
Eq. S141 1 2 1( ) ( , 2 00, )b bOHG E C E COH
S6
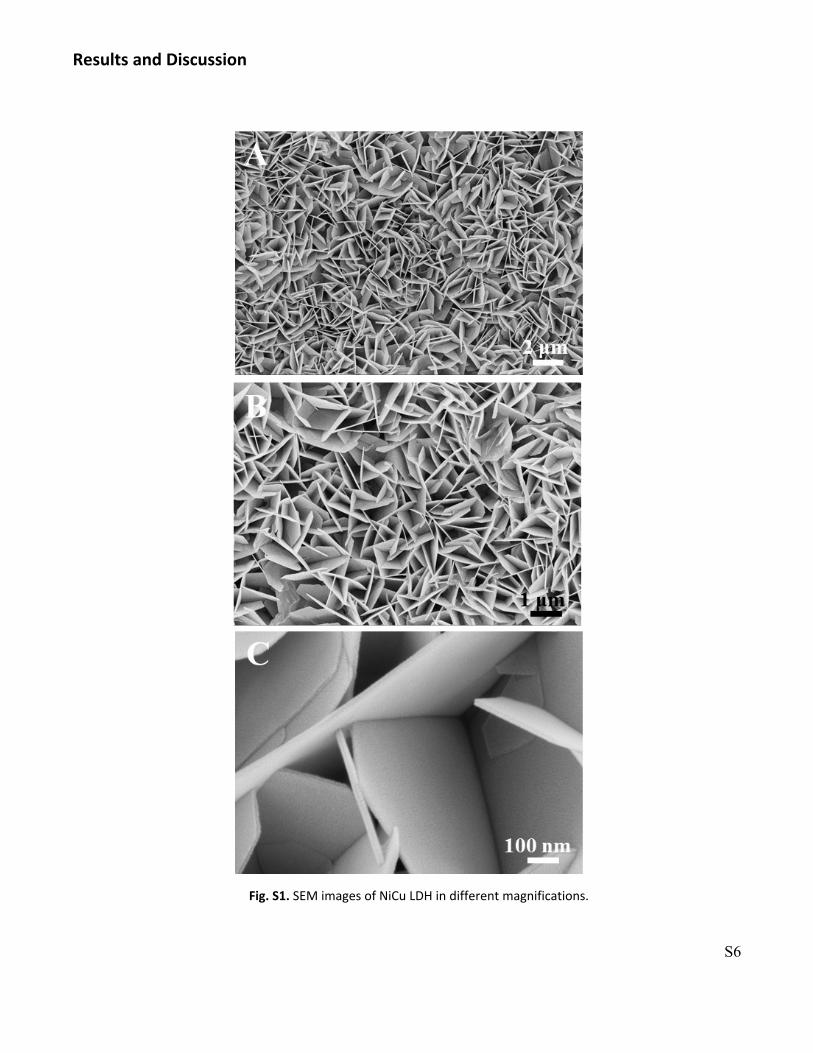
Results and Discussion
Fig. S1. SEM images of NiCu LDH in different magnifications.

S7
Fig. S2. SEM and the corresponding elemental mapping images of NiCu LDH. (A) SEM image, (B) the combined elemental, (C) O, (D) Ni, and (E) Cu mapping.
S8
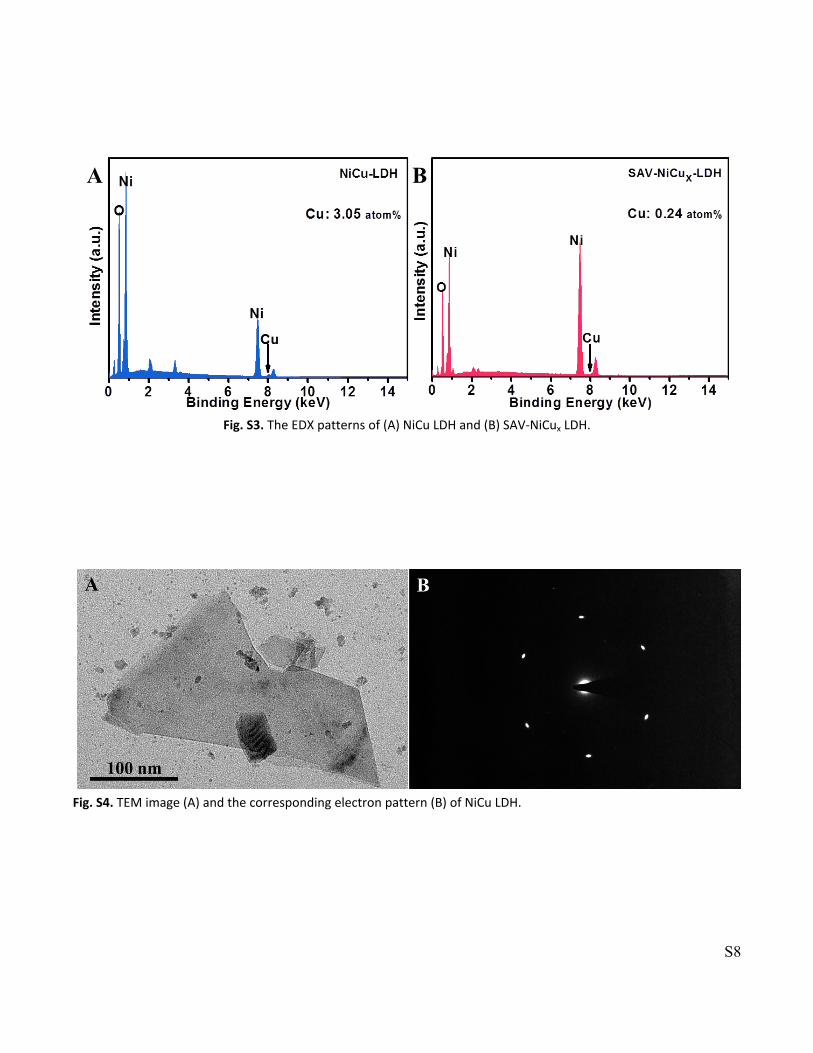
Fig. S3. The EDX patterns of (A) NiCu LDH and (B) SAV-NiCux LDH.
Fig. S4. TEM image (A) and the corresponding electron pattern (B) of NiCu LDH.

S9
Fig. S5. More HRTEM images of the SAV-NiCux LDH showing the atomic vacancies.
Fig. S6. High resolution XPS spectra of NiCu LDH (blue curve), NiCu(I) LDH (orange curve) and SAV-NiCux LDH (red curve) in the Ni 2p spin-orbital.

S10
Fig. S7. High resolution XPS spectra of NiCu LDH (blue curve), NiCu(I) LDH (orange curve) and SAV-NiCux LDH (red curve) in the Cu 2p spin-orbital.
Fig. S8. High resolution XPS spectra of NiCu LDH (blue curve), NiCu(I) LDH (orange curve) and SAV-NiCux LDH (red curve) in the O 1s spin-orbital.
S11
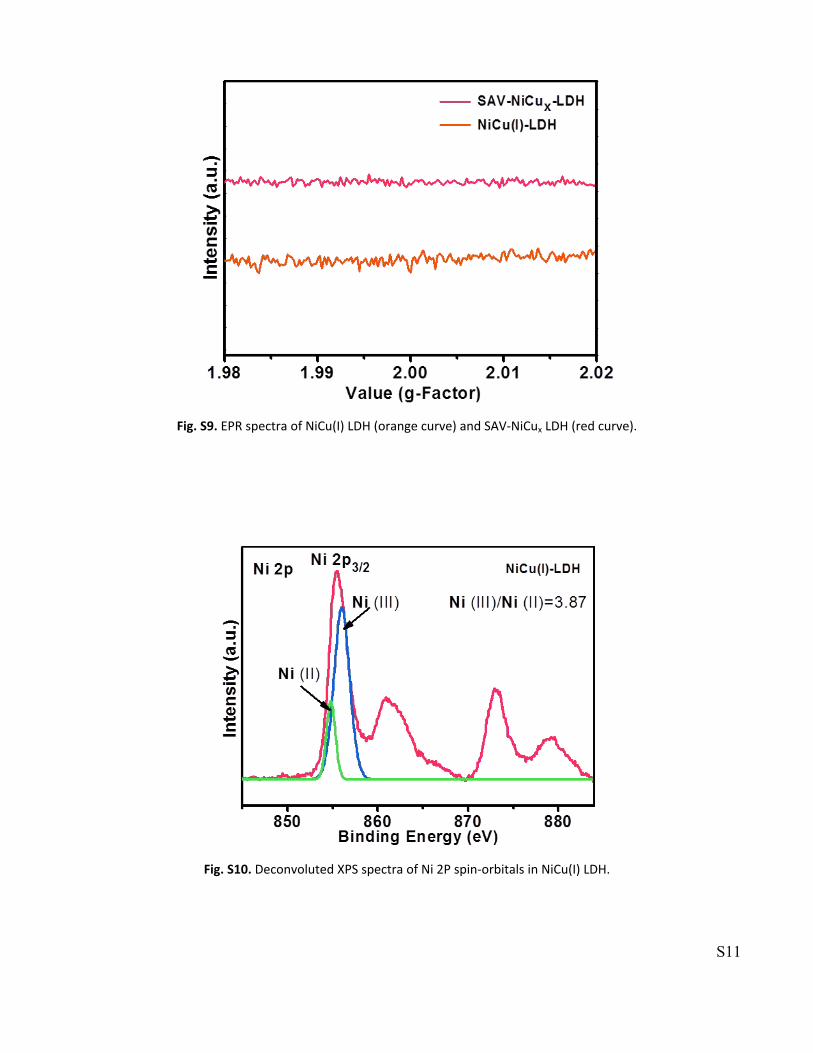
Fig. S9. EPR spectra of NiCu(I) LDH (orange curve) and SAV-NiCux LDH (red curve).
Fig. S10. Deconvoluted XPS spectra of Ni 2P spin-orbitals in NiCu(I) LDH.
S12
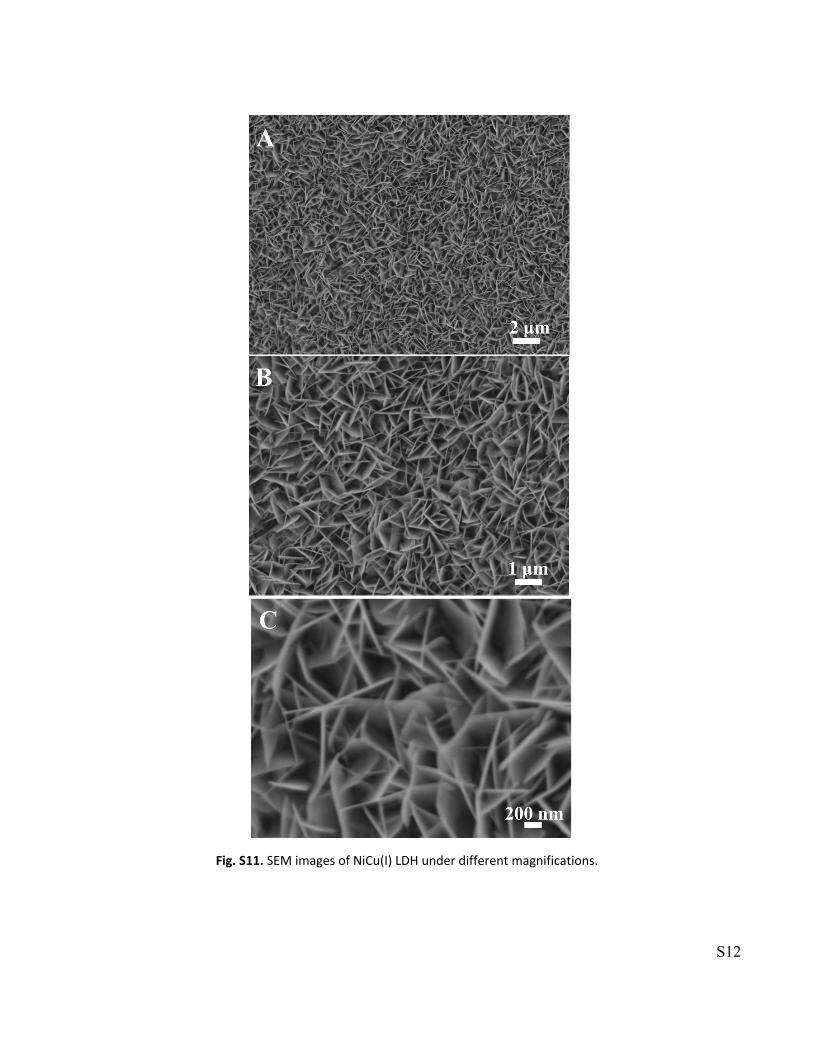
Fig. S11. SEM images of NiCu(I) LDH under different magnifications.

S13
Fig. S12. SEM images of Ni(OH)2 under different magnifications.
S14
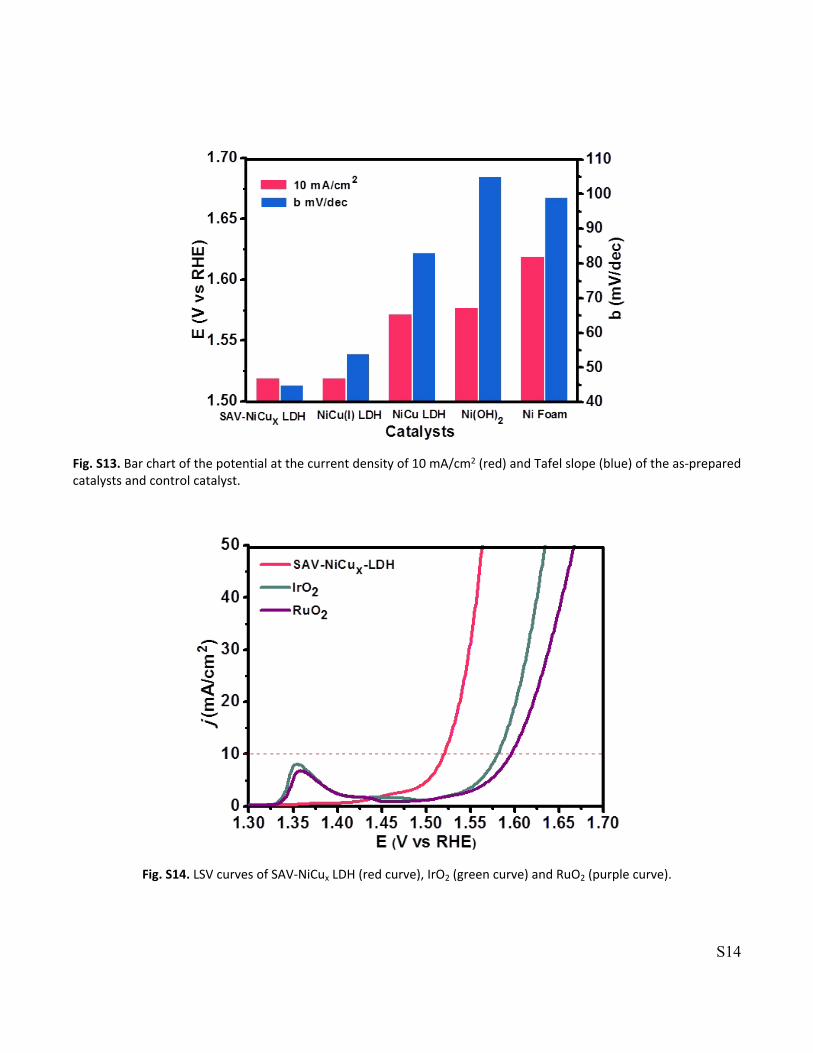
Fig. S13. Bar chart of the potential at the current density of 10 mA/cm2 (red) and Tafel slope (blue) of the as-prepared catalysts and control catalyst.
Fig. S14. LSV curves of SAV-NiCux LDH (red curve), IrO2 (green curve) and RuO2 (purple curve).

S15
Fig. S15. Tafel plots of SAV-NiCux LDH (red curve), IrO2 (green curve) and RuO2 (purple curve).
S16
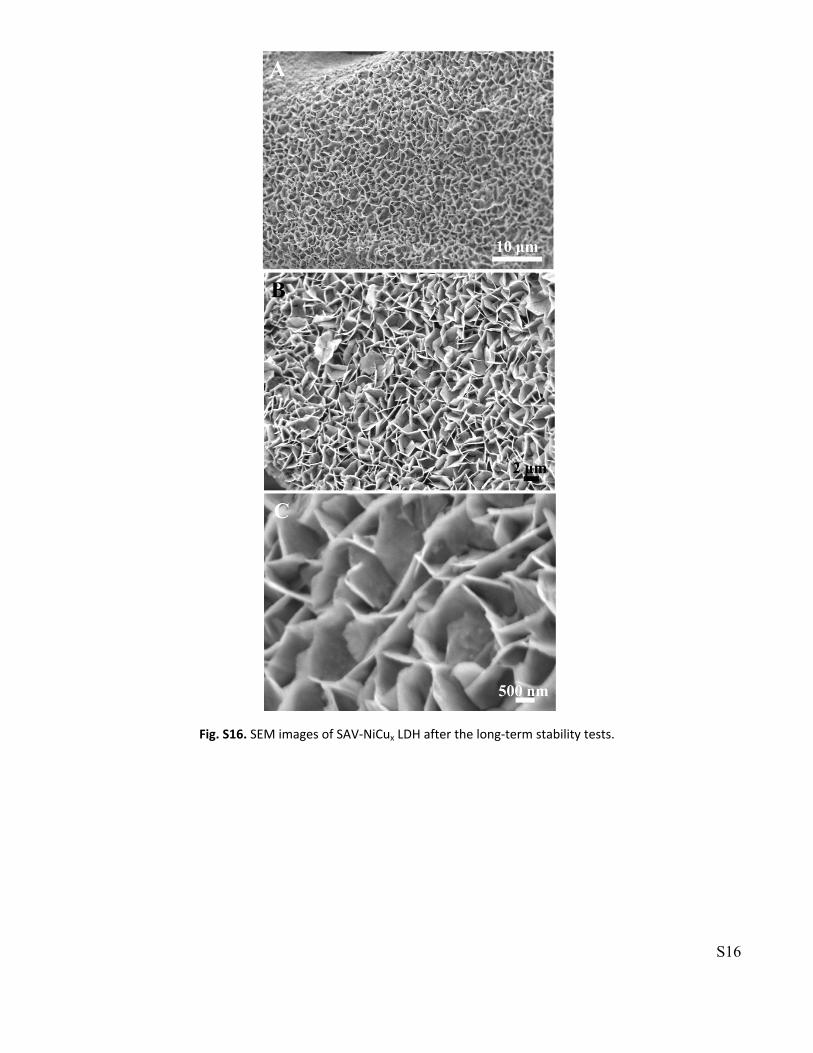
Fig. S16. SEM images of SAV-NiCux LDH after the long-term stability tests.
S17
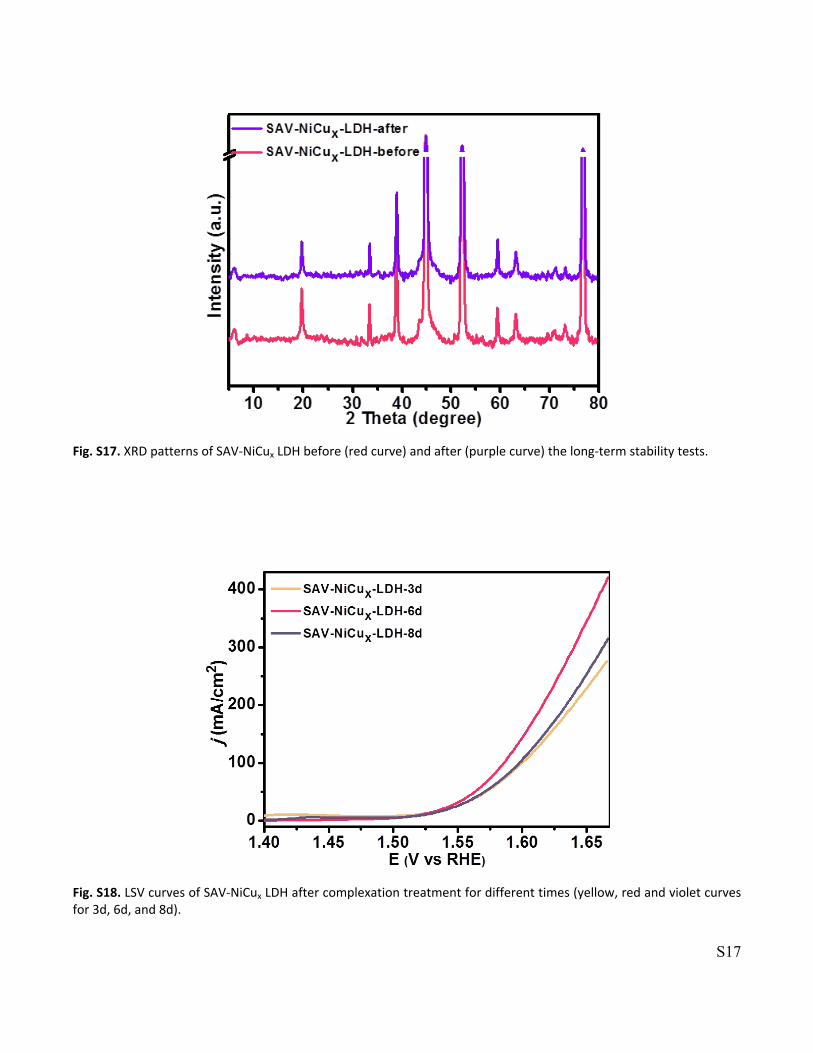
Fig. S17. XRD patterns of SAV-NiCux LDH before (red curve) and after (purple curve) the long-term stability tests.
Fig. S18. LSV curves of SAV-NiCux LDH after complexation treatment for different times (yellow, red and violet curves for 3d, 6d, and 8d).

S18
Fig. S19. Tafel slopes of SAV-NiCux LDH after complexation treatment for different times (yellow, red and violet curves for 3d, 6d, and 8d).

S19
Fig. S20. CV curves collected at different scan rates. (A) Ni foam, (B) Ni(OH)2, (C) NiCu LDH, (D) NiCu(I) LDH and SAV-NiCux LDH obtained by different complexation time (E, F and G curves for 3d, 6d, and 8d).

S20
Fig. S21. The Δj as the function of scan rates for Ni foam (black curve), Ni(OH)2 (green curve), NiCu LDH (blue curve), NiCu(I) LDH (orange curve) and SAV-NiCux LDH obtained by different complexation time (yellow, red and violet curves for 3d, 6d, and 8d).
Fig. S22. Nyquist plots of Ni foam (black curve), Ni(OH)2 (green curve), NiCu LDH (blue curve), NiCu(I) LDH (orange curve) and SAV-NiCux LDH (red curve).

S21
Fig. S23. EIS spectra of SAV-NiCux LDH obtained after various complexation time (yellow, red and violet curves for 3d, 6d, and 8d).
Fig. S24. The structures of key intermediate: OH*, O*, OOH*, OO* and * for (A) NiCu-LDH and (B) SAV-NiCux-LDH. Selected bond lengths are given in Å (gray balls represent Ni, bule balls represent Cu, red balls represent O and white balls represent H, respectively.).

S22
Table S1. The XPS data of NiCu LDH, NiCu(I) LDH and SAV-NiCux LDH showing the concentrations of elements.
Atom %Elements
NiCu LDH NiCu(I) LDH SAV-NiCux LDH
Ni 2p 23.49 23.38 21.51
O 1s 50.01 55.39 53.87
Cu 2p 1.84 1.31 0.01
Table S2. The fitting data of Ni element in SAV-NiCux LDH
SAV-NiCux LDH
Peak 1 Peak 2 Peak 3 Peak 4 Peak 5 Peak 6 Peak 7 Ni(III)/Ni(II)
Width 1.17254 2.38293 3.51496 3.21692 1.99673 1.60336 4.04051 2.03
Height 7646.166 16254.24 8617.125 1405.397 9653.406 1977.472 4427.509 2.13
Area 11236.48 48544.35 37961.41 5666.29 24157.95 3973.757 22421.03 4.32
Note: peak 1 and peak 2 represent Ni(II) and Ni(III), respectively.
Table S3. The fitting data of Ni element in NiCu LDH
NiCu-LDH
Peak 1 Peak 2 Peak 3 Peak 4 Peak 5 Peak 6 Peak 7 Ni(III)/Ni(II)
Width 1.25573 2.20063 3.73163 2.84263 1.83164 1.80469 3.65883 1.75
Height 10151.47 14082.53 7939.974 1187.124 8898.669 2426.377 4084.063 1.39
Area 15976.66 38840.75 37134.55 4229.379 20428.02 5488.073 18728.15 2.43
Note: peak 1 and peak 2 represent Ni(II) and Ni(III), respectively.
S23
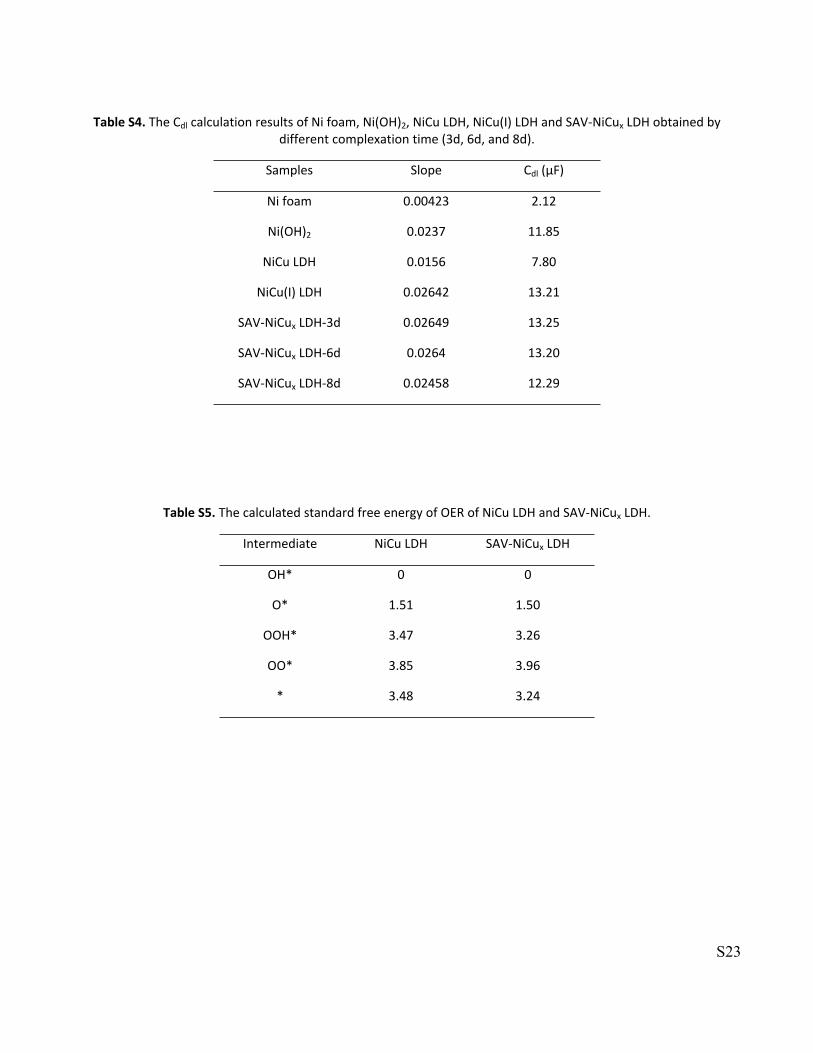
Table S4. The Cdl calculation results of Ni foam, Ni(OH)2, NiCu LDH, NiCu(I) LDH and SAV-NiCux LDH obtained by different complexation time (3d, 6d, and 8d).
Samples Slope Cdl (μF)
Ni foam 0.00423 2.12
Ni(OH)2 0.0237 11.85
NiCu LDH 0.0156 7.80
NiCu(I) LDH 0.02642 13.21
SAV-NiCux LDH-3d 0.02649 13.25
SAV-NiCux LDH-6d 0.0264 13.20
SAV-NiCux LDH-8d 0.02458 12.29
Table S5. The calculated standard free energy of OER of NiCu LDH and SAV-NiCux LDH.
Intermediate NiCu LDH SAV-NiCux LDH
OH* 0 0
O* 1.51 1.50
OOH* 3.47 3.26
OO* 3.85 3.96
* 3.48 3.24

S24
References
1 F. Song and X. Hu, Nat. Commun., 2014, 5, 4477.2 G. Kresse and J. Furthmüller, Comp. Mater. Sci., 1996, 6, 15-50.3 G. Kresse and J. Furthmüller, Phys. Rev. B 1996, 54, 11169-11186.4 P. E. Blöchl, Phys. Rev. B, 1994, 50, 17953-17979.5 J. P. Perdew, K. Burke and M. Ernzerhof, Phys. Rev. Lett., 1996, 77, 3865-3868.6 V. I. Anisimov, Berlin, Heidelberg, 1995.7 A. J. Tkalych, J. M. P. Martirez and E. A. Carter, Phys. Chem. Chem. Phys., 2018, 20, 19525-19531.8 M. Nolan and S. D. Elliott, Phys. Chem. Chem. Phys., 2006, 8, 5350-5358.9 K. Mathew, R. Sundararaman, K. Letchworth-Weaver, T. A. Arias and R. G. Hennig, The Journal of Chemical Physics,
2014, 140, 084106.10 K. M. a. R. G. Hennig, arXiv 2016, 1601.03346.11 K. Momma and F. Izumi, J. Appl. Crystallography, 2011, 44, 1272-1276.12 J. Rossmeisl, A. Logadottir and J. K. Nørskov, Chem. Phys., 2005, 319, 178-184.