dispersion of the hyperpolarizability of the carbon
TRANSCRIPT

UNLV Theses, Dissertations, Professional Papers, and Capstones
5-2011
Dispersion of the hyperpolarizability of the carbon tetrachloride Dispersion of the hyperpolarizability of the carbon tetrachloride
molecule molecule
Scott Wilde University of Nevada, Las Vegas
Follow this and additional works at: https://digitalscholarship.unlv.edu/thesesdissertations
Part of the Atomic, Molecular and Optical Physics Commons
Repository Citation Repository Citation Wilde, Scott, "Dispersion of the hyperpolarizability of the carbon tetrachloride molecule" (2011). UNLV Theses, Dissertations, Professional Papers, and Capstones. 1016. http://dx.doi.org/10.34917/2356106
This Thesis is protected by copyright and/or related rights. It has been brought to you by Digital Scholarship@UNLV with permission from the rights-holder(s). You are free to use this Thesis in any way that is permitted by the copyright and related rights legislation that applies to your use. For other uses you need to obtain permission from the rights-holder(s) directly, unless additional rights are indicated by a Creative Commons license in the record and/or on the work itself. This Thesis has been accepted for inclusion in UNLV Theses, Dissertations, Professional Papers, and Capstones by an authorized administrator of Digital Scholarship@UNLV. For more information, please contact [email protected].

DISPERSION OF THE SECOND HYPERPOLARIZABILITY OF THE CARBON
TETRACHLORIDE MOLECULE
by
Scott Wilde
Bachelor of Science University of Nevada, Las Vegas
2008
A thesis submitted in partial fulfillment of the requirements for the
Master of Science in Physics Department of Physics and Astronomy
College of Sciences
Graduate College University of Nevada, Las Vegas
May 2011

ii
THE GRADUATE COLLEGE We recommend the thesis prepared under our supervision by Scott Wilde entitled Dispersion of the Hyperpolarizability of the Carbon Tetrachloride Molecule be accepted in partial fulfillment of the requirements for the degree of Masters of Science in Physics Department of Physics and Astronomy David P. Shelton, Committee Chair Victor H. S. Kwong, Committee Member Stephen Lepp, Committee Member Chulsung Bae, Graduate Faculty Representative Ronald Smith, Ph. D., Vice President for Research and Graduate Studies and Dean of the Graduate College May 2011

ABSTRACT
Dispersion of the Second Hyperpolarizability of the Carbon Tetrachloride Molecule
by
Scott Wilde
Dr. David Shelton, Examination Committee Chair
Professor of Physics University of Nevada, Las Vegas
The second hyperpolarizability of a molecule is the microscopic version of the third
order susceptibility. Direct measurements of the ratio of the second hyperpolarizability
of carbon tetrachloride to diatomic nitrogen are made possible through electric field
induced second harmonic generation. Whenever the dispersion of the second
hyperpolarizability is not negligible, there should be deviations from Kleinman
symmetry. Previous experimental data for second hyperpolarizability of this molecule
have only been at two frequencies and theory predicts the zero frequency value. In order
to provide for a better extrapolation to zero frequency, additional gas phase
measurements of this ratio at optical frequencies are presented and discussed.
iii

TABLE OF CONTENTS
ABSTRACT....................................................................................................................... iii LIST OF TABLES...............................................................................................................v LIST OF FIGURES ........................................................................................................... vi CHAPTER 1 INTRODUCTION ........................................................................................1 CHAPTER 2 THEORY ......................................................................................................4 CHAPTER 3 EXPERIMENTAL METHODS .................................................................13 CHAPTER 4 MEASUREMENTS AND RESULTS ........................................................21 CHAPTER 5 CONCLUSION...........................................................................................30 REFERENCES ..................................................................................................................31
iv

LIST OF TABLES Table 1 Hyperpolarizability measurements for 488.0nm ................................................22 Table 2 Hyperpolarizability measurements for 514.5nm ................................................24 Table 3 Summary of measured hyperpolarizability ratios...............................................25 Table 4 Kleinman symmetry measurements of N2 ..........................................................27 Table 5 Kleinman symmetry measurements of mixtures N2 and CCl4............................27
v

LIST OF FIGURES
Figure 1 Diagram of experimental setup .........................................................................14 Figure 2 Example measured signal (open circles) and parabolic fit (solid line) .............19 Figure 3 Attenuation of the frequency doubled 488.0nm signal from SHG in quartz.....21 Figure 4 Measured hyperpolarizability ratios plotted versus wavenumber squared........26 Figure 5 Deviations from Kleinman symmetry for CCl4.................................................28
vi

1
CHAPTER 1
INTRODUCTION
A molecule in external fields will respond according to the strength of the applied
fields. The subject of linear optics is the case where the material response is
characterized by a linear coefficient multiplied by the applied field. For low amplitude
electric fields the response is an induced electric dipole by the molecule that is linear in
the field. The subject of nonlinear optics is concerned with the case of a nonlinear
response to external fields. In the dipole approximation, the molecular response to
external fields is modeled by the induced dipole. By Taylor expanding the polarization
equation in powers of the electric field, the calculated response to strong fields will
become nonlinear in terms of hyperpolarizabilities. In terms of static fields the dipole per
molecule can be written as:
... E 6
E 2
E 30
200
)0( ++++= γβαµµ (1)
The terms that vary as the square of the field and the cube of the field are referred to
as the first and second hyperpolarizabilities respectively. The first constant term in the
expansion is referred to as the intrinsic dipole moment and it is nonzero for dipolar
molecules. The vector nature of the polarization and the applied field(s) require that the
polarization, α, be a second rank tensor, β a third rank tensor, γ a fourth rank tensor and
so on. The field(s) in equation (1) has been represented as scalar(s) but in general the
field(s) is vector quantities and can be oscillating with non-zero frequencies. As in most
systems, symmetry can reduce the number of independent elements of tensors describing
physical processes. Kleinman symmetry is a condition that is always valid at zero
frequency, but for non-zero, and especially optical frequencies, deviations from

2
Kleinman symmetry become more apparent as frequency increases and approaches the
threshold for absorption. In general, Kleinman symmetry is not valid where dispersion of
the hyperpolarizability is not negligible. [1]
Sum frequency generation is the process where two or more photons are converted
into one photon with a frequency equal to the sum of the frequencies of the incident
photons. When the process takes two identical wavelengths and the resulting sum photon
has half the wavelength it is called second harmonic generation (SHG). If the process
occurs along a focused beam of photons, generated photons will begin to be out of phase
with photons that are generated further along the beam path. It is possible to “match” the
phase of generated photons from multiple sites by coherent addition. Phase matching is
difficult to achieve in an isotropic medium such as a gas, but it can be done by
introducing a periodic phase shift in one or more of the applied electric fields. A static
and an optical field can be used to induce SHG from the third order response of the
molecule, hence electric field induced second harmonic generation. If the direction of the
static field is reversed periodically, then phase matching of the static field and the second
harmonic can be found directly by scanning the density and measuring the second
harmonic signal.
This work involves the measurement of the nonlinear properties of carbon
tetrachloride (CCl4) by using the technique of Electric Field Induced Second Harmonic
Generation (EFISHG) for gas phase molecules. Resonant absorption is the process that
makes both the deviations from Kleinman symmetry interesting and also the process that
makes measurements difficult.

3
An additional complication comes from the CCl4 low vapor pressure, and samples of
high densities would require heating of the sample. By taking advantage of the
experimentally measured hyperpolarizability for diatomic nitrogen (N2) as a ratio to
helium (He), for which an exact calculation can be done and has been done by Bishop
and Pipin, the experiment can be done using mixtures as samples. [2, 3]

4
CHAPTER 2
THEORY
The following formulations are based on the work by Ward and New and also the
work of Shelton and Buckingham. [4, 5] The static electric field in the y direction as a
function of position along z, the axis of the fundamental beam propagation, can be
defined as a periodic function.
)cos(E (z)E 0y Kz= (2)
where K=2πN/L, where N is the number of periods, or pairs, L is the total length of the
electrode array, and E0 is the static field amplitude. The phase mismatch between the
fundamental, Eω, and the second harmonic, E2ω, is related to the difference of the index
of refraction.
( ) ( ) ( )22
022 in terms
242 ρραα
ελπ
λπ
ωωω
ωωω
ωω +−−=−=−=∆ nnkkk (3)
The phase is matched when clk /π=∆ , where lc is the coherence length of the gas.
Therefore if the phase matching condition is satisfied, the second harmonic generated
between each electrode pair will constructively interfere. Note that λω is the wavelength
of the fundamental in vacuum, nω is the index of refraction for frequency ω, and ρ is the
density of the gas.
The optical field is defined as a Gaussian beam polarized parallel to the static field
direction that is focused to a spot size defined by the confocal parameter z0.
ωω λπ / 200 nRz = (4)
( ) ( )200 /1/ zzRR += (5)

5
where R0 is the radius of beam at the beam waist and R is the beam radius at a point z
away from the beam radius. The maximum size, or diameter, of the beam that passes
through the electrodes is therefore limited by diffraction. Diffraction sets an upper limit
on how far apart and how many electrode pairs that the fundamental and second
harmonic beams can pass through unobstructed. The case of a large number of repeats
and a short distance between electrodes is preferred, but the optical field must pass
through from outside the medium.
If the optical field is focused to the center of the electrode array, then the power
generated at frequency 2ω can be written in terms of the power P(ω) of the fundamental.
( ) ( ) ( )[ ]( )[ ]
2
2
12
0
020
2)(2)3(2
3
0
0220
3)(2
/1
/arctancos)cos(EPP
+
−∆
= ∫
−
L
L zz
zzkzKzdz
cnzω
ω
ω χεµ
πω
(6)
where the third order susceptibility, χ(3), is defined in terms of macroscopic second
hyperpolarizability, Γ. The macroscopic hyperpolarizability is related to the spatially
averaged microscopic hyperpolarizability, γ, and, β||, which is the parallel component of β
to the dipole moment.
4
1)3( =χ (0) 2
(ω) (2ω) Γρ (7)
Γ = γ + TkB3
||)0( βµ
(8)
where (ω) is the Lorentz local field factor at frequency ω, defined as (ω) =
( ) 3/22 +ωn , and ρ is the number density of the gas molecules. The second term in
equation (8) is an orientational average, and since the intrinsic dipole moment of CCl4 is

6
zero, Γ = γ , which simplifies the expression for the third order susceptibility in
equation (7).
At phase match, the power of the second harmonic is peaked around | ∆k | = K, and
the height of the peak is proportional to N2, with a width of 1/N, because of the density
dependence of χ(3) and ∆k. The peak power of the second harmonic beam is found by
evaluating the integral in equation (6), which yields: [5]
( ) ( ) [ ])/()/(arctan)/(EPP 002
02
0
2)(2)3(2
3
0
0220
3)(2
peak zLCzLLzLcnz
ω
ω
ω χεµ
πω
= (9)
where )/( 0zLC is a slowly varying function near unity that depends on the focusing, z0
and the length, L, of the electrode array. From here it is plain to see that the ratio of
hyperpolarizabilities is easier to measure, provided a reference gas is available, instead of
a direct measurement. The ratio of the power of the second harmonic for both CCl4 and
N2, in the low density approximation, as long as all other experimental parameters stay
the same, is written as:
2
N
CCl
2
N
CCl
N
CCl
N
)2(peak
CCl
)2(peak
2
4
2
4
2
4
2
4
P
P
==
ρρ
γγ
ω
ω
S
S (10)
where 4CClS is the peak count rate for CCl4. Since it would be proportional to the power
by the same factor as the2NS , it can be shown that the ratio of peak second harmonic
power for the pure gases is identically equal to the ratio of peak count rates from equation
(9). For mixtures of low density, the ratio of phase matched power for a mixture of CCl4
and N2 can be written as:

7
2
NN
mixNNmixCClCClmix)2(
N
)(2mix
22
2244
22P
P
+=
⋅=
ργργργ
ω
ω xx
S
SF
N
(11)
where 4CClx is the molar fraction of the carbon tetrachloride, and
42 CClN 1 xx −= , so the
ratio of hyperpolarizabilities can be solved to be:
111
mix
N
N
mix
CClN
CCl 2
21
242
4 +
−
⋅=
ρρ
γγ
S
SF
x (12)
where F is the correction to the signal due to attenuation of the second harmonic by the
sample, which is the ratio of the unabsorbed signal to the absorbed signal, calculation of
this factor will be discussed later. Frequency doubled optical fields will start to approach
the absorption band of the molecule and a correction must be calculated for the
attenuation of the second harmonic to get the signal as if attenuation were not present.
This can be done by calculating the ratio of the square of the amplitudes in the equation
for the power of the second harmonic with an attenuation factor. The attenuation of the
amplitude from one electrode pair, a site of generated second harmonic, is calculated with
respect to the attenuation through the entire length of the cell. An attenuation coefficient
in terms of the density of the gas in the cell can be used as an attenuation coefficient in a
Beer-Lambert Law calculation for the length of the cell that the light passes through
before exiting the attenuating medium.
ρα aL eeIIt −− === 2
02 / (13)
La 2/ρα = (14)
where a is the attenuation in terms of the density of the gas and α is the attenuation
coefficient that follows the Beer-Lambert law. The amplitude from one electrode site can

8
be approximated by using equation (6) and the attenuation due to the path through the
rest of the sample in the cell. To find the amplitude of the combined second harmonic
generated at sites along the electrode array one can calculate the sum of the amplitudes
generated across the electrode array. [7]
( ) ( )[ ]( )
( ) ( )( )
+++∆−
+
′−−∆=∆ ∑−
−=2
0
1
2
12
c
1
sincoscos/1
1
/exp
2
1 ,
ux
uKk
u
Kxx
NK
kkI
N
Nn
ϕϕϕαα (15)
( ) uxxK
kKw arctan−−′∆+=ϕ (16)
( ) 0/ xxxu w−′= (17)
π
+=′2
1nx (18)
The x parameters are the normalized parameters of the beam and cell, cx is the position
of the center of the array with respect to the output window multiplied by the period of
the array, so that cc Kzx = , and so on for the other parameters. The factor by which the
signal is attenuated is just the square of this amplitude divided by the square of the
amplitude with no attenuation. The F factor in equation (12) is the square of the
amplitude with no attenuation divided by the amplitude with attenuation squared.
( )
( )2
peak
peak
,0,
∆
=∆= αα
kIkI
F (19)
where ( )peak0, =∆ αkI is the calculated peak amplitude from equation (15) with α = 0,
and ( )peak,αkI ∆ is the attenuated signal. The measured signal, Smix in equations (11) and
12, of a sample that attenuates the generated signal along the beam path will be

9
attenuated by 1/F and the second harmonic generated signal will be F times the measured
signal.
In birefringent crystals, the phase match condition can be met for optical fields by
changing the orientation of the crystal axes to the optical field. By using a quartz wave
plate in the beam to convert the fundamental into double the frequency, one can measure
the attenuation of the through the length of the cell as a function of density. Therefore
the right hand side of equation (13) can be measured by slowly filling the cell with CCl4
and measuring the attenuation of the signal from the quartz plate as a function of fill
pressure, which can be converted to a function of the length of the gas cell the second
harmonic travels through before it exits the cell. This is used to determine the attenuation
correction.
Kleinman symmetry imposes the condition that the susceptibility is invariant under
permutation of spatial indices, such that if the frequency components were all zero you
would have perfect permutation symmetry and thus Kleinman symmetry is everywhere
valid in the zero frequency limit. [3] In the case for EFISHG, the third order
susceptibility has four indices, and four frequency arguments, as shown in the full
macroscopic polarization, P, in equation (20), excluding lower order terms.
)0()E()E(0)E , ,;(-2)2( k23
ljijkliP ωωωωωχω = (20)
The electric field in the j-th direction that is oscillating with a frequency ω is denoted
by the Ej(ω), where the polarization in the i-th direction oscillating at a frequency of 2ω
is Pi(2ω). For an isotropic gas, the susceptibility tensor should also be isotropic, which
means that there will be at most two independent elements which can be written as a sum.
)0,,;2(2)0,,;2()0,,;2( ωωωχωωωχωωωχ −+−=− zxzxzxxzzzzz (21)

10
where )0,,;2()0,,;2( ωωωχωωωχ −=− zzxxzxzx because permuting the indices of the
optical fields of the same frequency should be indistinguishable. At zero frequency, if
the frequency components are interchanged simultaneously with the spatial components
and the components of the sum are left unchanged then the independent elements must be
equal, in other words )0,0,0;0(3)0,0,0;0( zxxzzzzz χχ = , and the ratio of the susceptibilities
should yield R(ω=0) = 3 as shown in equation (24). This type of symmetry is referred to
as intrinsic permutation symmetry.
)0,,;2(/)0,,;2( )R( ωωωχωωωχω −−= zxxzzzzz (22)
Measurements of this ratio for different frequencies will be in effect measuring
deviations from Kleinman symmetry. Using the dipole approximation further, the
displacement of the electron cloud for the molecule can be modeled as a driven electron
on a spring oscillator with complex frequency components. Taking the real part and
expanding that in terms of frequency will result in an expansion in even powers of
frequency. The same can be done for the second hyperpolarizability,
( )...1)0,0,0;0()0,,;2( 42
21 +++=− ωωγωωωγ aa (23)
Several theoretical techniques are used to calculate the zero frequency value, and the
burden on the experiment is to provide an extrapolation to zero frequency. As the
frequency increases to the optical, oscillations will occur so quickly that the nuclei in the
molecule will be near stationary and the only contribution to the hyperpolarizability will
be the electronic part. The EFISHG experiment using vapor phase molecules and optical
frequencies is essentially probing only the electronic part of the hyperpolarizability. An
extrapolation to zero frequency using optical frequencies will then result in a reliable
estimate for the zero frequency hyperpolarizability.

11
The Kleinman symmetry ratio can also be modeled using a power series expansion in
even powers of the frequency because of the relationship it has with the
hyperpolarizability.
( )...13)R( 42
21 +++= ωωω bb (24)
As the strength of the dependence of the hyperpolarizability on frequency becomes
more apparent, there should also be deviations from Kleinman symmetry. The measured
signal from a pure gas in an optical field polarized parallel to the static field would be
proportional to the square of )0,,;2( ωωωχ −zzzz , and the measured signal from a pure gas
in an optical field polarized perpendicular to the static field is proportional to the square
of )0,,;2( ωωωχ −zxxz , as shown in equation (25).
zxxz
zzzzzxxzzzzzS
Sγ
γγ
γχχ ===
=
⊥⊥
||||exp /R
21
(25)
where the brackets around γ indicate an orientation average. The measured
hyperpolarizability ratio of CCl4 and N2 from EFISHG will be24 N ||,CCl ||, / γγ . For a low
density mixture of two gases, the expression for the measured ratio can be written as
equation (26), in terms of the mixture density as,
mixNN ,mixCClCCl ,
mixNN ||,mixCClCCl ||,
mix,
|| mix,mix
2244
224421
ργργργργ
xx
xxS
SR
⊥⊥⊥ ++
=
= (26)
and this equation can be manipulated by using the ratio of hyperpolarizabilities for the
two gases in the mixture,
( )4
4
2
4
24 CCl
CCl
N
CCl
NmixmixCCl 1R
1
R
1
R
1
R
1
-x
x
γγ
−+= (27)

12
where 4CClR is the ratio for pure carbon tetrachloride,
2NR is the ratio for pure nitrogen,
and mixR is the ratio for the mixture. The molar fraction of nitrogen, 2Nx , can be written
in terms of the molar fraction of carbon tetrachloride, 4CClx , which is just =
2Nx (1-
4CClx ), note that this is true for binary mixtures.

13
CHAPTER 3
EXPERIMENTAL METHODS
The optical fields available and used to measure the ratio of hyperpolarizabilities
were two laser lines from an argon ion laser, λ = 488.0nm and λ = 514.5nm, which
produced second harmonic of wavelength 244.0nm and 257.3nm, respectively. The
fundamental beam is weakly focused to a confocal length of 48.85cm and 45.92cm
through the electrode array. Note this is the confocal parameter for the unfilled gas cell.
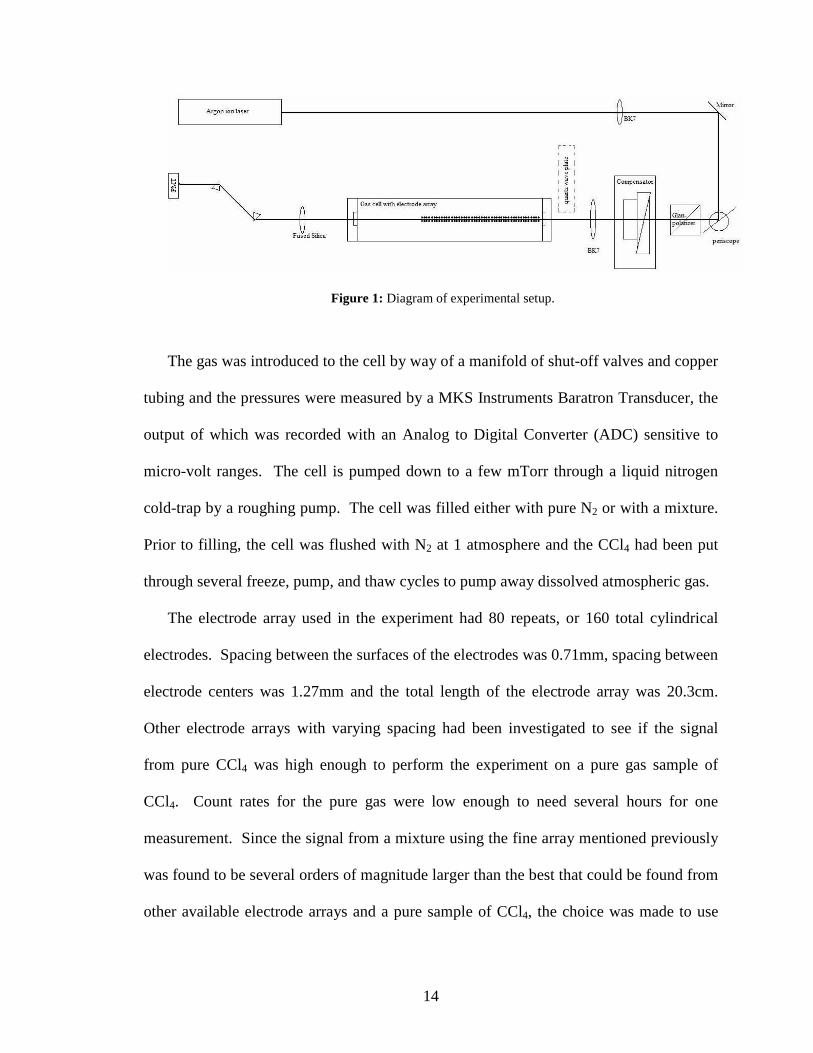
A diagram of the experimental setup is shown in figure 1; a representative line is drawn
to show the path of the beam through the apparatus. The beam is weakly focused through
the cell and the beam profile was measured by using a Thor Labs beam profiler for both
wavelengths prior to installation of the gas cell. The diameter of the beam as a function
of position was fit to a hyperbola to find the position of the beam waist with respect to the
center of the electrode array. Periodically throughout the experiment the beam
divergence was measured downstream from the cell to verify the beam profile had not
changed.
The windows of the cell containing the electrodes and the gas were made of fused
silica to pass the ultraviolet. Since fused silica is susceptible to stress induced
birefringence, it was important to minimize translational force gradients in the window.
The windows were sandwiched between two polytetraflouroethylene (PTFE, Teflon) O-
rings so that the window would seal against the outer O-ring and the inner O-ring served
as a spring feedback when installing the window in the cell.
14
Figure 1: Diagram of experimental setup.
The gas was introduced to the cell by way of a manifold of shut-off valves and copper
tubing and the pressures were measured by a MKS Instruments Baratron Transducer, the
output of which was recorded with an Analog to Digital Converter (ADC) sensitive to
micro-volt ranges. The cell is pumped down to a few mTorr through a liquid nitrogen
cold-trap by a roughing pump. The cell was filled either with pure N2 or with a mixture.
Prior to filling, the cell was flushed with N2 at 1 atmosphere and the CCl4 had been put
through several freeze, pump, and thaw cycles to pump away dissolved atmospheric gas.
The electrode array used in the experiment had 80 repeats, or 160 total cylindrical
electrodes. Spacing between the surfaces of the electrodes was 0.71mm, spacing between
electrode centers was 1.27mm and the total length of the electrode array was 20.3cm.
Other electrode arrays with varying spacing had been investigated to see if the signal
from pure CCl4 was high enough to perform the experiment on a pure gas sample of
CCl4. Count rates for the pure gas were low enough to need several hours for one
measurement. Since the signal from a mixture using the fine array mentioned previously
was found to be several orders of magnitude larger than the best that could be found from
other available electrode arrays and a pure sample of CCl4, the choice was made to use

15
mixtures of N2 and CCl4. Attached to the electrode array is a plate that makes contact
with a high voltage power supply through the gas cell wall. The only available feed
through ports for the high voltage power supply was on either end of the cell, and the
electrode array was positioned on the front end of the cell. This geometry is a result of
the beam waist position from the lenses and the space needed to introduce the quartz
plate in front of the cell for both alignment and attenuation measurements. The preferred
orientation would have been to focus the fundamental beam even less so that the BK7
lens could be further away from the cell and the array on the far end of the cell. This
would have minimized the attenuation from the gas in the cell because the second
harmonic would have had to travel less distance through the sample before exiting the
cell. The second harmonic travels collinearly with the fundamental beam, and so it is
separated from the fundamental beam by using a double prism spectrometer.
A set of mirror mounts were used to mount mirrors in a periscope configuration, the
first mirror would reflect the beam upwards and the second would reflect back down to
the horizontal and turn the beam to pass through the cell. As a consequence of this beam
steering, the polarization of the beam was also rotated by the reflections to a horizontal
polarization state before entering the prism polarizer. By using a crossed polarizer, the
angle of extinction was measured to be 89.9 ± 0.1 degrees in reference to the horizontal.
Initially the photomultiplier (PMT) used was a Hamamatsu R1527P, reflection type
photocathode, but during the experiment it became apparent that a different PMT was
needed. A wire mesh obstruction, which is meant to focus the photoelectrons to the first
dynode, also obstructed the signal beam. The beam spot size at the window to the
photodetector was about the size of the wires in the mesh, there was a strong systematic

16
error introduced in the Kleinman symmetry measurements from beam steering from the
change in the polarization. The part of the beam would overlap over the wire mesh for
one polarization and a different overlap would be for another polarization of the
fundamental. Since the compensator could be adjusted for up to three wavelengths path
difference, it would be possible to measure the effect of beam steering and find a
correction. An alternative was to use a different PMT, yet all that was available was one
that had been used in several experiments prior to the first. The advantage was it was
without the mesh, because it had a transmission photocathode, but the price was lower
signal. Fortunately the signal was high enough that it would take approximately the same
amount of time to obtain large enough statistics that it would take measure the systematic
error that the reflection photocathode PMT introduced. All the measurements for
Kleinman symmetry deviations required the use of this PMT in order to achieve a
precision of <0.1% but some of the measurements for the second hyperpolarizability
were done using the first PMT since the polarization was unchanged during those
measurements.
The input polarization state of the optical field is prepared by using a Glan-laser
prism polarizer in order to have a well defined horizontal polarization. The polarization
is then controlled by using a Special Optics Soleil-Babinet compensator. The different
polarization settings of the compensator would still steer the beam and even though the
mesh-less PMT was used, sometimes there would still be a detectable difference from
one polarization to another. One method to reduce this effect was to average across a
vertical polarization state defined by rotating the horizontal through a positive rotation
and then through a negative rotation in reference to the fundamental beam propagation

17
direction. The first analysis of a data set was a comparison between the vertical
polarizations. If both did not agree within the statistical error then the measurements
from that data set were abandoned.
The argon ion laser has an intense plasma glow that overlaps the ultraviolet that is
detectable even through the spectrometer. To mitigate this and also to address the second
harmonic light generated by the polarization control components, the lens just before the
input window of the gas cell is made out of borosilicate (BK7) glass which strongly
absorbs in the ultraviolet. A further measure to prevent coherent interference with second
harmonic light generated outside the cell is to reverse the direction of the static field and
take the average of measurements of one direction and the other. The interference term
from a 180 degrees phase shift will exactly cancel out in an average. This is necessary
because a weak source of second harmonic light generated along the beam path will
interfere with the light generated inside the cell and will change the measured signal.
Large effects were seen using the quartz plate in both upstream and downstream, and
some cases were observed to nearly cancel out a phase matched signal. For normal
experimental conditions, the signals from both directions of the static field were in
agreement.
To prevent temporal shifts in the apparatus to bias the data, measurements were taken
in ABA triplets, and the average taken over each triplet. For the Kleinman symmetry
measurements, each measured value would be taken with both polarities of the static
field,
( )( )( )( )( )( )( )( )( )( )...,,,,,,,,,, −↔+↔+↓−↓−↔+↔+↑−↑−↔+↔ (29)

18
where ( )( )−↔+↔ ,, is an average of the two sequential horizontal measurements,↔
indicates the polarization is along the horizontal, the + means positive polarity and –
means negative polarity of the static field. The parentheses represent one separate
measurement, so the horizontal measurement is a measurement of the positive polarity
across the electrode array and the negative polarity averaged together. The polarization
was rotated in two different directions, and so those measurements are indicated as ↑ for
a positive rotation and ↓ for negative rotation, and both are vertically polarized.
For the hyperpolarizability data, the measured values that are extracted are the peak
density and count rate. Both are found by filling the cell to well above peak density, then
slowly leaking the sample gas and measuring pressure, temperature, and count rate as the
pressure went over the peak to the other side. Then the peak pressure and count rate can
be found by fitting a parabola, s = b(x-c)2 + S, where S is the peak signal count rate, s is
the signal count rate, x is the pressure, and c is the peak pressure. An example of such a
measurement is found in figure 2, where the solid line is the weighted parabolic fit. The
range of points used in the fit is the top half of the peak. The signal in figure 2 is from a
N2 sample.

19
0
5000
10000
15000
20000
25000
3925 3975 4025 4075 4125 4175 4225 4275
Co
un
ts P
er
Se
con
d
Pressure (Torr)
Figure 2: Example measured signal (open circles) and parabolic fit (solid line)
The temperature was measured by a type K thermocouple in contact with the gas at
roughly 295K. Peak density is determined by using the temperature and the peak
pressure by application of the virial equation of state. The gas mixtures were prepared by
first filling with CCl4 while simultaneously measuring the attenuation as a function of fill
pressure. Then the cell was filled with N2 until the pressure of the mixture was just above
the expected peak pressure and the cell was allowed to come to equilibrium. Minimal
fluctuations of the temperature inside the cell after filling were what determined the
equilibrium condition. The molar fractions are determined by taking the ratio of the
densities calculated from the fill pressures:
mix
CClCCl
4
4 ρρ=x (27)
42 CClN 1 xx −= (28)
20
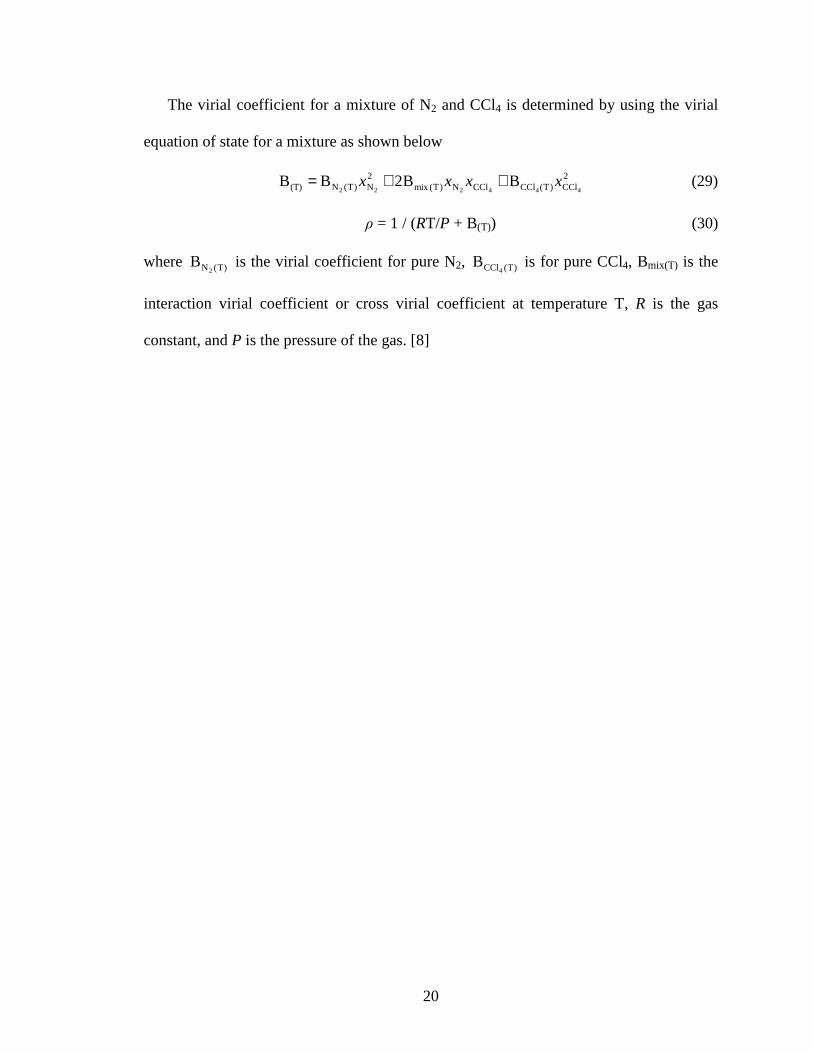
The virial coefficient for a mixture of N2 and CCl4 is determined by using the virial
equation of state for a mixture as shown below
2CCl)T(CClCClN)T(mix
2N)T(N(T) 444222
BB2BB xxxx ++= (29)
ρ = 1 / (RT/P + B(T)) (30)
where )T(N2B is the virial coefficient for pure N2, )T(CCl4
B is for pure CCl4, Bmix(T) is the
interaction virial coefficient or cross virial coefficient at temperature T, R is the gas
constant, and P is the pressure of the gas. [8]

21
CHAPTER 4
MEASUREMENTS AND RESULTS
An example of an attenuation measurement is shown in figure 3, the case shown is for
488.0nm, or 244.0nm.
0.6
0.65
0.7
0.75
0.8
0.85
0.9
0.95
1
1.05
0 0.5 1 1.5 2 2.5 3
Figure 3: Attenuation of the frequency doubled 488.0nm signal from SHG in quartz
The solid line is a weighted linear fit to the data, ρa+= 1I/I 0 , where a is the
attenuation coefficient that depends on density, this value is used to determine the Beer-
Lambert law attenuation coefficient and 0I/I is the ratio of the signal to the signal with
CCl4 in the cell. The length of the gas the beam travels through was measured window to
window to be 50.43 ± 0.08 cm. The average attenuation coefficient measured by this
method for 244nm is a = -0.1082 ± 0.0018 m3/mol, and for 257nm a = -0.01562 ±
0.00040 m3/mol. These values were used to calculate F in equation 19, the peak density
for each mixture was used to calculate α and the signal for each mixture is corrected by

22
this factor in tables 1 and 2. The average cross section for 244nm is in agreement by a
factor of two from an extrapolation of measurements in the ultraviolet of the cross section
for CCl4 from measurements by Carlon, et. al. Their measurements were from 185.0nm
to 228.8nm and their measured cross section for 228.8nm is about two decades larger
than what was measured for 244.0nm in this experiment. [9]
Table 1: Hyperpolarizability measurements for 488.0nm
Sample S
(cps) F Smix (cps) ( )SF ⋅=
Pressure (Torr)
Temp (K)
Peak Density (mol/m3)
4CClx
(%) 2N4CCl /γγ
N2 23148.91 3443.21 295.15 187.23 + 0.14
CCl4 + N2 24131.39 1.218 ± 0.016 29392.75 2880.86 295.15 156.73 + 0.12 1.750 ± 0.047 20.51 + 0.73
N2 23389.91 3437.21 295.15 186.91 + 0.14
CCl4 + N2 24546.71 1.220 ± 0.016 29937.46 2882.60 295.15 156.83 + 0.12 1.761 ± 0.047 20.29 + 0.73
N2 23931.41 3432.79 295.15 186.67 + 0.14
CCl4 + N2 24718.31 1.222 ± 0.017 30194.95 2875.91 295.15 156.47 + 0.12 1.780 ± 0.047 20.57 + 0.73
N2 23350.21 3432.75 295.15 186.66 + 0.14
N2 2068.57 3431.88 293.95 185.40 ± 0.14
CCl4 + N2 2098.51 1.230 ± 0.016 2582.124 2900.10 294.00 156.42 ± 0.12 1.734 ± 0.049 19.96 ± 0.74
N2 2052.62 3442.82 294.05 185.93 ± 0.14
CCl4 + N2 2093.51 1.222 ± 0.017 2557.690 2914.51 294.35 157.02 ± 0.12 1.775 ± 0.048 19.11 ± 0.71
N2 2056.23 3447.75 294.35 186.01 ± 0.14
N2 2058.89 3441.94 294.35 185.69 ± 0.14
CCl4 + N2 2089.1 1.220 ± 0.016 2548.771 2912.46 294.45 156.85 ± 0.12 1.764 ± 0.048 19.00 ± 0.71
N2 2058.12 3443.41 294.35 185.77 ± 0.14
N2 2495.67 3408.12 294.75 185.55 ± 0.14
CCl4 + N2 2562.32 1.231 ± 0.016 3154.858 2887.50 294.85 157.23 ± 0.12 1.731 ± 0.47 20.20 ± 0.73
N2 2460.64 3414.85 294.95 185.80 ± 0.14
N2 2107.77 3424.96 295.65 185.90 ± 0.14
CCl4 + N2 2179.77 1.225 ± 0.016 2670.717 2894.00 296.05 156.94 ± 0.12 1.689 ± 0.045 21.66 ± 0.76
N2 2019.95 3436.34 295.95 186.33 ± 0.14
After the peak densities, count rates, and signal attenuation are measured, the ratio of
the hyperpolarizabilities can be determined by using equation (12) for the mixtures. The
errors in peak pressure and peak count rates from the parameters of the parabolic fits such

23
as figure 2 were small, < 0.01%, that they were omitted from the table. Measurements
for 488.0nm are found in table 1.
The following pertains to measurements done after the first measured value of the
hyperpolarizability ratio for 514.5nm which appears as the first three rows of table 2. It
was found that for the measurements of 514.5nm there was contamination of the cell with
carbon tetrachloride during measurements of the pure nitrogen samples. Measurements
that were intended to be for an uncontaminated sample were shifted towards a mixture
measurement by left over sample between measurements. Previous work involving the
same electrode array had measured the peak density as 222 mol/m3 and this work has an
average of 219 mol/m3 for 514.5nm. [10] The peak density found by using the parabolic
fits to the data are reported in table 2, but the peak density used in the hyperpolarizability
ratio calculation for pure N2 was 222 mol/m3.

24
Table 2: Hyperpolarizability measurements for 514.5nm
Sample S (cps) F Smix (cps)
(=F·S)
Pressure (Torr)
Temp (K)
Peak Density (mol/m3)
(%) 2N4CCl /γγ
N2 2054.48 4128.78 295.15 222.48 ± 0.15
CCl4 + N2 2335.34 1.0279 ± 0.0028
2400.43 3569.84 295.15 192.20 ± 0.13 1.469 ± 0.038
17.91 ± 0.46
N2 2078.68 4134.02 295.15 222.77 ± 0.15
N2 21526.0 4020.96 295.25 218.51 ± 0.15†
CCl4 + N2 24530.3 1.0300 ± 0.0027
25265.9 3564.19 295.25 191.82 ± 0.13 1.417 ± 0.038
18.93 ± 0.50
N2 21511.0 4045.10 295.25 217.86 ± 0.15†
CCl4 + N2 25024.2 1.0289 ± 0.0027
25746.9 3597.22 295.25 191.62 ± 0.13 1.416 ± 0.038
19.72 ± 0.52
N2 21683.0 4017.12 295.25 216.34 ± 0.15†
N2 21500.4 4053.54 295.35 218.32 ± 0.15†
CCl4 + N2 24725.2 1.0292 ± 0.0027
25447.6 3564.61 295.25 191.82 ± 0.13 1.432 ± 0.038
19.12 ± 0.50
N2 21477.9 4038.54 295.25 217.65 ± 0.15†
N2 22068.0 4077.83 295.00 220.06 ± 0.15†
CCl4 + N2 24521.7 1.0614 ± 0.0028
26026.9 3565.39 295.00 192.05 ± 0.13 1.407 ± 0.038
19.06 ± 0.51
N2 22157.5 4076.85 295.15 219.90 ± 0.15†
CCl4 + N2 23802.1 1.0751 ± 0.0028
25590.1 3557.87 295.15 191.54 ± 0.13 1.423 ± 0.038
19.16 ± 0.51
N2 21260.0 4078.60 295.05 219.75 ± 0.15†
CCl4 + N2 22959.4 1.0707 ± 0.0025
24581.7 3553.92 295.15 191.33 ± 0.13 1.414 ± 0.038
19.80 ± 0.52
N2 20047.9 4096.39 295.45 220.50 ± 0.15† †measured contaminated phase match density for N2
A summary of the measured ratio of hyperpolarizabilities are found in the table 3 and
plotted versus wavenumber in figure 4. Solid data points are from previous work, and the
solid line is a weighed linear fit to the data. The point at zero frequency is the calculated
zero frequency value, the size of the point is not intended to indicate error.
4 CCl x

25
Table 3: Summary of measured hyperpolarizability ratios
Wavelength (nm) 2N4CCl /γγ
2N4CCl /γγ
20.51 ± 0.73
20.29 ± 0.73
20.57 ± 0.73
19.96 ± 0.74
19.11 ± 0.71
19.00 ± 0.71
20.20 ± 0.73
488.0
21.66 ± 0.76
20.13 ± 0.26
17.91 ± 0.46
18.93 ± 0.49
19.72 ± 0.52
19.12 ± 0.50
19.06 ± 0.51
19.15 ± 0.51
514.5
19.80 ± 0.52
19.05 ± 0.19
694.3a 15.59 ± 0.19
1064b 12.82 ± 0.21
- 14.41c a see reference [13], b see reference [11], c calculated zero frequency value, reference [16]
10
12
14
16
18
20
22
0 0.5 1 1.5 2 2.5 3 3.5 4 4.5 5
� ����� �
��
wavenumber 10 cm
��
Figure 4: Measured hyperpolarizability ratios plotted versus wavenumber squared.

26
The value for the zero frequency value of the ratio is 10.99 ± 0.14, and the slope is
2.158 ± 0.035 cm2 found from the weighted linear fit. The major contribution to the error
in the hyperpolarizability ratio is from the molar fraction of the CCl4 in the mixture. The
error in the molar fraction for CCl4 was estimated by the estimate of the error in the fill
pressure and temperature. The fill pressure for CCl4 for all samples was 52 Torr and the
error was estimated by using the statistical spread in fill pressures measured at 1 second
intervals by the ADC manometer combination. The error contribution from the molar
fraction was 1-2% to the hyperpolarizability ratio. Following the molar fraction the next
major contribution to the error in the hyperpolarizability ratio is from the error in the
correction term from the attenuation, which was less than 0.3%, it was calculated by
propagating the errors through the sum in equation (15). The main contribution to the
error in the attenuation correction was from the error in the density dependent attenuation
factor from the weighted linear least squares such as in figure 3.
As shown in equation (25), the ratio for Kleinman symmetry using mixtures requires
the measured value of the ratio of hyperpolarizabilities and the ratio, R, for the pure
nitrogen in order to calculate the R value for carbon tetrachloride. Measurements were
made using pure nitrogen and are tabulated in table 4. The weighted means of the
measurements are indicated in the second to last column and in the last column are
measurements made by Mizrahi and Shelton. [12]

27
Table 4: Kleinman symmetry measurements of N2
Wavelength (nm) 2NR
2NR Ra
2.9453 ± 0.0022 2.9478 ± 0.0026 2.9475 ± 0.0024 2.9470 ± 0.0024 2.9500 ± 0.0026 2.9505 ± 0.0027
514.5
2.9434 ± 0.0030
2.947 ± 0.001 2.945 ± 0.003
2.9372 ± 0.0040 2.9368 ± 0.0025 2.9385 ± 0.0028 2.9363 ± 0.0030 2.9400 ± 0.0027
488.0
2.9409 ± 0.0022
2.939 ± 0.001
2.942 ± 0.004
a from reference [12]
After the mixture is prepared the triplet measurements would run about 10-20 triplets
per mixture, for between 45-75 seconds for each measurement. The results from the
measurements of several mixtures are tabulated in table 5 and each value corresponds to
one mixture.
Table 5: Kleinman symmetry measurements for gas mixtures and calculated ratios for pure CCl4
Wavelength
(nm) 42 CCl NR + 4CClx
4CClR 4CClR
2.9863 ± 0.0017 1.426 ± 0.043 3.137± 0.036
2.9838 ± 0.0018 1.390 ± 0.042 3.128 ± 0.036
2.9831 ± 0.0030 1.459 ± 0.044 3.117 ± 0.037
2.9781 ± 0.0017 1.374 ± 0.038 3.100 ± 0.037
514.5
2.9721 ± 0.0021 1.265 ± 0.038 3.078 ± 0.037
3.113 ± 0.016
3.0032 ± 0.0056 1.690 ± 0.051 3.206 ± 0.035
2.9799 ± 0.0045 1.719 ± 0.052 3.103 ± 0.037
2.9753 ± 0.0061 1.704 ± 0.051 3.084 ± 0.037
2.9777 ± 0.0048 1.753 ± 0.053 3.091 ± 0.037
488.0
2.9799 ± 0.0045 1.756 ± 0.053 3.100 ± 0.037
3.123 ± 0.018

28
2.900
2.950
3.000
3.050
3.100
3.150
0 1 2 3 4
)
Figure 5: Deviations from Kleinman symmetry for CCl4.
Following the same expansion of even powers in frequency and the results from the
ratio of hyperpolarizabilities, it is expected that the measurements will fall on a straight
line that intercepts 3 at zero frequency plotted against frequency squared or wavenumber
squared as shown in figure 5. The solid point is a previous measurement done by Ward
and Miller. [13]
The errors in the Kleinman symmetry ratios were calculated using estimated errors
for the molar fraction of CCl4, the statistical error in the mixture and pure nitrogen
measurements, and the calculated error for the mean of the measured hyperpolarizability
ratio.
Requirements were imposed on data points taken during Kleinman symmetry
measurements that resulted in some triplets to not be used in the final result. If a triplet
disagreed with the weighted mean by twice the statistical error it was not used in the final

29
result of the mixture. The number of omitted triplets under this criterion was less than
one per mixture.

30
CHAPTER 5
CONCLUSION
The zero frequency value for 2N4CCl /γγ was found to be 11.04 ± 0.14. The zero
frequency value is calculated as 14.41 by Ohta, et. al., as indicated by the open point in
figure 4. [15, 16] It appears that a linear relationship between the hyperpolarizability of
CCl4 and wavenumber squared is adequate to describe the dispersion of the
hyperpolarizability even in the optical range. Similarly for the deviations from Kleinman
symmetry, even though they are large as compared to deviations for other molecules that
have been measured. [12]

31
REFERENCES
[1] D. A. Kleinman, Phys. Rev. 126, 1977 (1962)
[2] D. M. Bishop and J. Pipin, J. Chem. Phys. 91, 3549 (1989)
[3] V. Mizrahi and D. P. Shelton, Phys. Rev. Lett., 55, 696 (1985)
[4] J. F. Ward and G. H. C. New, Phys. Rev. 185, 57 (1969)
[5] D. P. Shelton and A. D. Buckingham, Phys. Rev. A 26, 5 (1982)
[6] D. P. Shelton, J. Opt. Soc. Am. B 12, 1880 (1985)
[7] D. P. Shelton, Chem. Phys. Lett., 121, 69 (1985)
[8] J. H. Dymond and E. B. Smith, The Virial Coefficients of Pure Gases and Mixtures
(Clarendon, Oxford, 1980).
[9] N. Rontu Carlon, D. K. Papanastasiou, E. L. Fleming, C. H. Jackman, P. A.
Newman, and J. B. Burkholder, Atmos. Chem. Phys., 10, 6137 (2010).
[10] E. A. Donley and D. P. Shelton, Chem. Phys. Lett., 215, 156 (1993)
[11] P. Kaatz, E. A. Donley, and D. P. Shelton, J. Chem. Phys. 108, 849 (1998)
[12] V. Mizrahi and D. P. Shelton, Phys. Rev. A, 31, 3145. (1985)
[13] C. K. Miller and J. F. Ward, Phys. Rev. A, 16, 1179 (1977)
[14] D. P. Shelton and A. D. Buckingham, Phys. Rev. A, 26, 2787 (1982)
[15] D. P. Shelton, Phys. Rev. A 42, 2578 (1990)
[16] K. Ohta, et. al., Mol. Phys. 101, 315 (2003)

VITA
Graduate College University of Nevada, Las Vegas
Scott Wilde
Degrees: Bachelor of Science, Physics, 2008 University of Nevada, Las Vegas Thesis Title: Dispersion of the Hyperpolarizability of the Carbon Tetrachloride Molecule Thesis Examination Committee: Chairperson, Dr. David P. Shelton, Ph. D. Committee Member, Dr. Victor H. S. Kwong, Ph. D. Committee Member, Dr. Stephen Lepp, Ph. D. Graduate Faculty Representative, Dr. Chulsung Bae, Ph. D.
32