displaying information in sharepoint using excel · pdf filedisplaying information in...
TRANSCRIPT
Displaying Information In SharePoint
Using Excel Services, Reporting
Services And PerformancePoint
Tricia Wilcox Almas, Director, Business Intelligence, Advanced Data
SharePoint Saturday Virginia Beach January 7, 2012

AGENDA Many SharePoint users and developers are not aware of the various ways that information can
be displayed in SharePoint. Whether the data is stored in lists, or is from a Line of Business
application (LOB), SharePoint gives you several options for displaying reports, graphs,
scorecards, strategy maps and other valuable information insight. We will also cover the
basics of good dashboard design.
Choices for Information Display in SharePoint
Dashboard Design Template
Deciding Which Tool To Use To Create Display Components
Set Up For Excel Services, Reporting Services And PerformancePoint
Publishing Excel Workbooks And Excel Services Web Parts
Report Libraries And The Reporting Services Report Viewer Web Part
Whirlwind Overview Of PerformancePoint Dashboard Designer
Deploying PerformancePoint Dashboards
Using PerformancePoint Web Parts
WHY SHOULD YOU LISTEN TO ME?
Consultant
Instructor
Published Author
1/17/2012 Rockville MD 1501 SharePoint 2010
Microsoft® SQL Server 2008 R2 Analytics & Data
Visualization, McGraw-Hill, Doug Harts, Jim Dugan, Tricia Wilcox Almas http://www.mhprofessional.com/contributor.php?id=44423

CHOICES FOR ANALYTIC INFORMATION
DISPLAY IN SHAREPOINT

DECISIONS, DECISIONS
So how do you decide which tool to use for each
dashboard component?
Strategic or Performance Dashboards generally need
scorecards – create in PerformancePoint or Excel
Operational and Process-oriented Dashboards will generally
show workflow and task completion, and other department-
level types of measures – create in Excel or Reporting Services,
Process Maps in Visio and PerformancePoint
Charts, gauges, graphs – Excel or Reporting Services
Pivots – Excel and PowerPivot

DASHBOARD DESIGN TEMPLATE

EXCEL SERVICES CAPABILITIES
More secure sharing of workbooks, reliability and availability. A single
version of the truth.
Business intelligence. Workbooks connected to enterprise data sources can
be published to the server and used in business intelligence dashboards and
scorecards.
Extensibility. Reusable logic that is contained in workbooks and user-defined
functions is available for developers to implement in server-based applications.
Use of Unattended Service Accounts. Excel Services relies on the Secure
Store Service to store the encrypted unattended service account.
Excel Services is now a Managed Service Application, and is managed thru
SharePoint Central Administration.
Slicer feature. The Slicer feature is a new type of data filter in Microsoft Excel
2010 that is interactive, flexible in design and layout, and always conveys the
current filtering state. With these data filters more people benefit from the
power of analyzing data using PivotTables and OLAP Functions

SET UP FOR EXCEL SERVICES AND
PERFORMANCEPOINT
These tasks are in
SharePoint Central
Administration, and
should be done by
your SharePoint
Administrator

USING EXCEL COMPONENTS ON THE
DASHBOARD
Once the Service Applications are configured in Central Administration,
in order to use Excel components on your dashboards, take a couple of
steps:
Publish your Excel Workbooks to a SharePoint Library (Document or
Reports Library preferred)
Name your items (charts and tables)
Choose the Publish Options
Select Items in the Workbook Option
Use Excel Web Access Web Parts to expose that content on your
dashboard

PUBLISHING EXCEL WORKBOOKS
AND EXCEL SERVICES WEB PARTS

PUBLISHING EXCEL WORKBOOKS
AND EXCEL SERVICES WEB PARTS
Select
where to
put it

PUBLISHING EXCEL WORKBOOKS
AND EXCEL SERVICES WEB PARTS
Must know the
Named Item,
this ellipses is
not a lookup

REPORTING SERVICES CAPABILITIES
R2 has a new version of Report Builder, an end-user report creation tool.
Lots of new charts, gauges, sparklines, visualizations including geospatial
(mapping) capabilities.
PowerPivot delivered as a result of project gemini.
More precise control over chart size.
Can use a variety of data sources in one report.
Supports report subscriptions, including delivery to Outlook.
Can be consumed in SharePoint or PerformancePoint.

CONFIGURING REPORTING SERVICES INTEGRATION
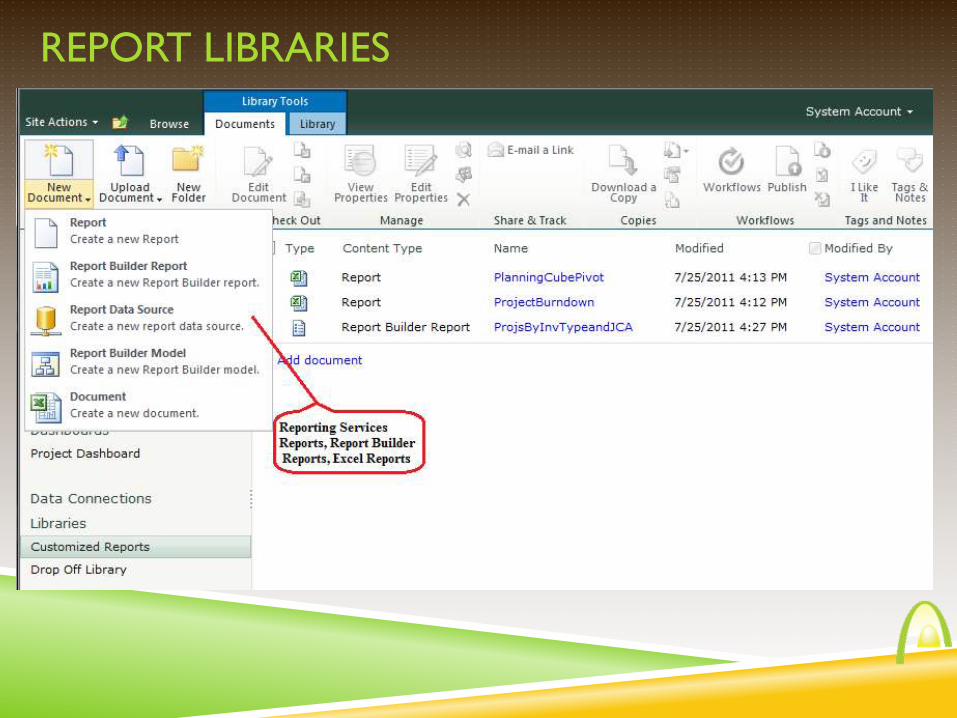
REPORT LIBRARIES

DISPLAY AS STAND-ALONE REPORT
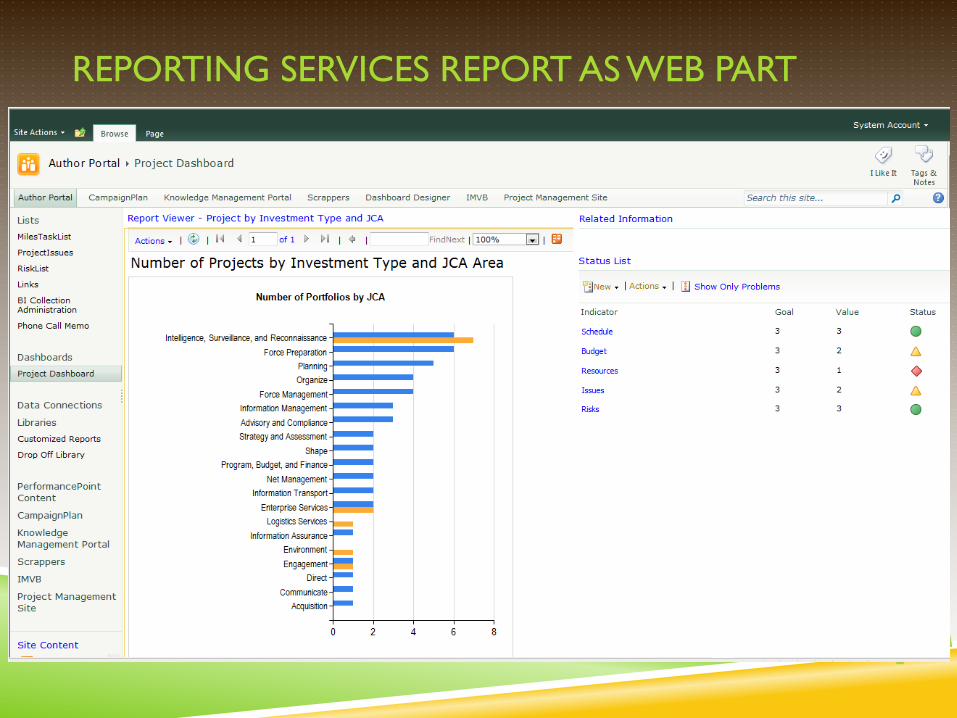
REPORTING SERVICES REPORT AS WEB PART

POWERPIVOT BENEFITS
A PowerPivot report can be published as an interactive web app with a
single click.
The report itself takes less than 5 minutes to produce if you just want
answers.
Data preparation is essential, and may take less than 30 minutes to bring
together multiple data sources.
Reports based on your company’s LOB data, up to hundreds of millions
of rows, but still very fast (because of in-memory OLAP).
Report will automatically refresh with new data as it becomes available.
Access your workbook applications directly in the browser without
having to download the workbooks with all their data to every
workstation.

POWERPIVOT USES AND CONSIDERATIONS
Can connect to a variety of data sources
SQL Server, Analysis Services, Access, Reporting Services, MS Azure DataMarket, Atom Data
Feed, Excel File, Text File, MS Parallel Data Warehouse, Oracle, Teradata, Sybase, Informix,
IBM DB2, Other
Can quickly “mash-up” data from multiple sources without an ETL
process
Because all data is stored in memory, analysis and results are quick
Extensive use of PowerPivot may increase your app server memory
needs, and which app server it runs on
PowerPivot can be integrated with Reporting Services and
PerformancePoint
Results displayed in SharePoint, but must have Excel 2010 PowerPivot
Add-in

POWERPIVOT CONFIGURATION
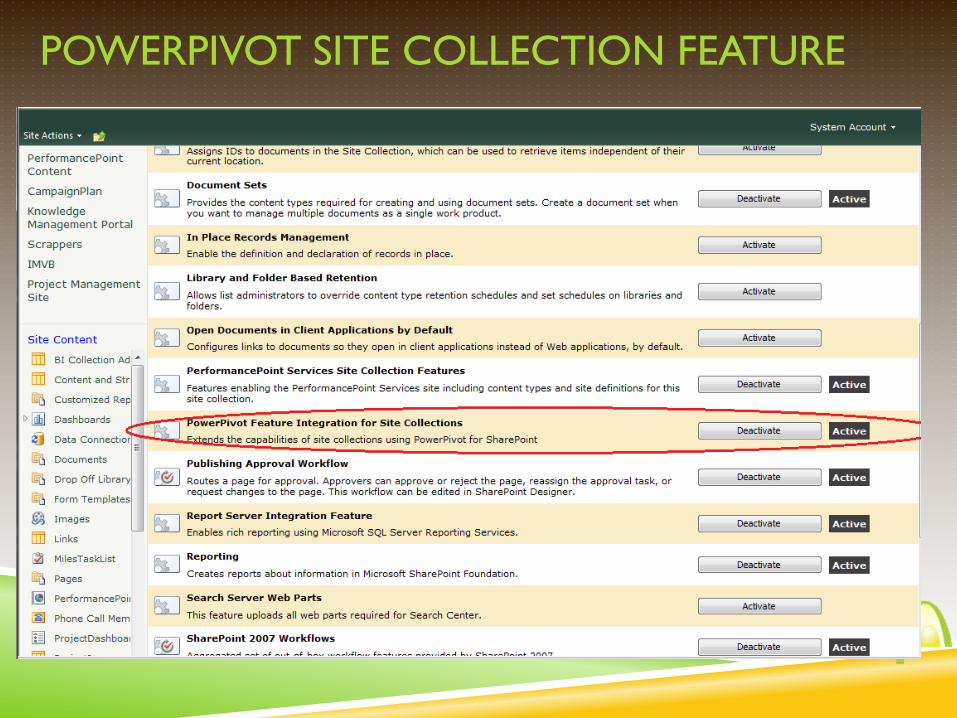
POWERPIVOT SITE COLLECTION FEATURE
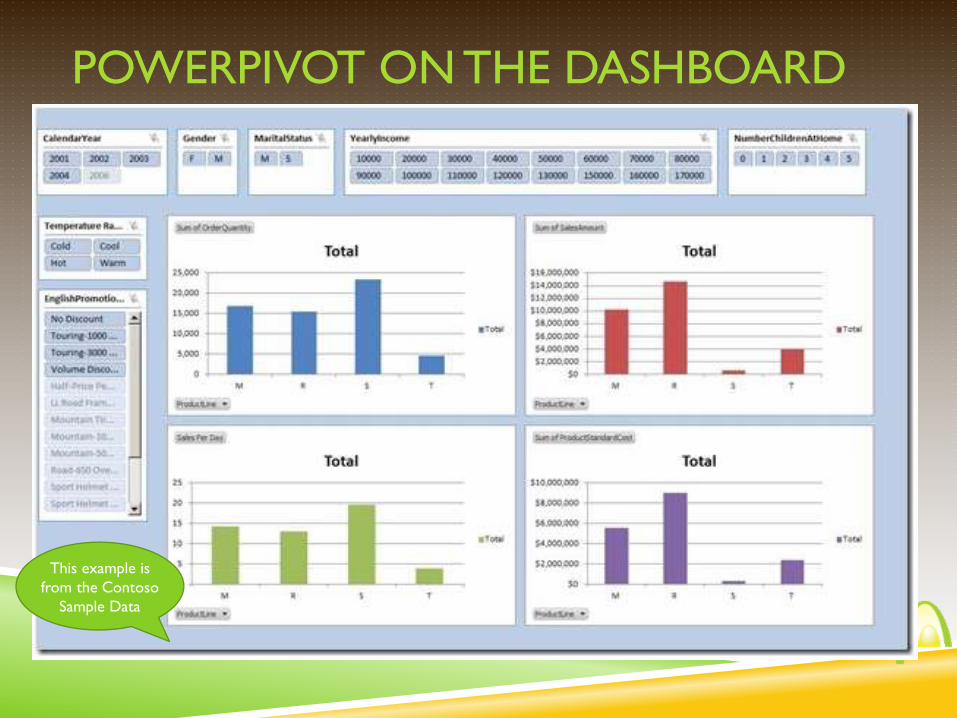
POWERPIVOT ON THE DASHBOARD
This example is
from the Contoso
Sample Data
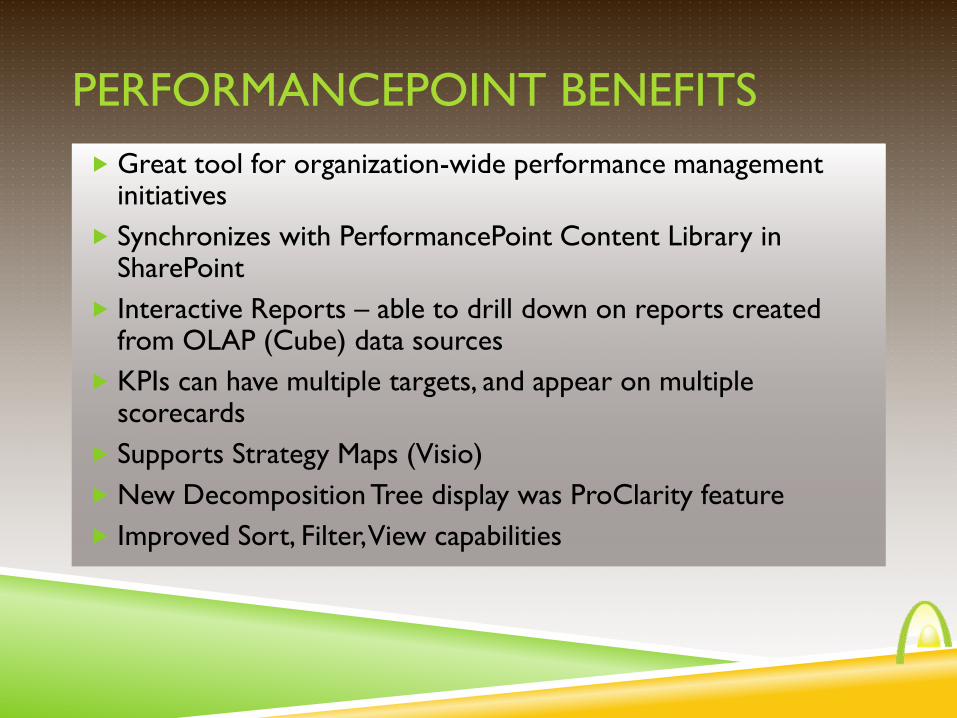
PERFORMANCEPOINT BENEFITS
Great tool for organization-wide performance management initiatives
Synchronizes with PerformancePoint Content Library in SharePoint
Interactive Reports – able to drill down on reports created from OLAP (Cube) data sources
KPIs can have multiple targets, and appear on multiple scorecards
Supports Strategy Maps (Visio)
New Decomposition Tree display was ProClarity feature
Improved Sort, Filter, View capabilities

PERFORMACEPOINT DASHBOARD DESIGNER
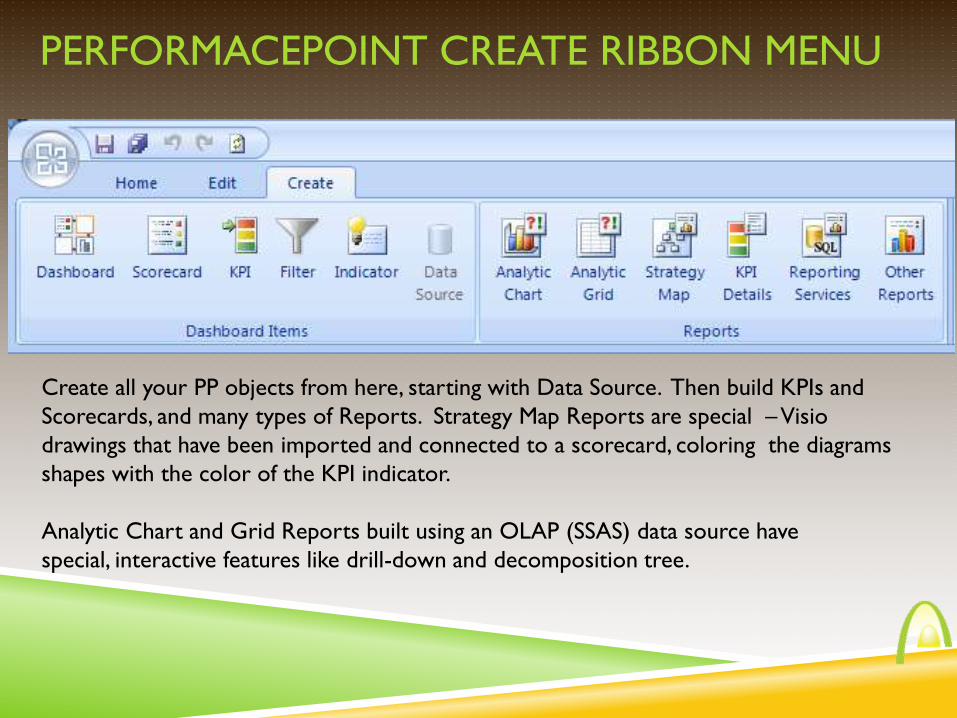
PERFORMACEPOINT CREATE RIBBON MENU
Create all your PP objects from here, starting with Data Source. Then build KPIs and
Scorecards, and many types of Reports. Strategy Map Reports are special – Visio
drawings that have been imported and connected to a scorecard, coloring the diagrams
shapes with the color of the KPI indicator.
Analytic Chart and Grid Reports built using an OLAP (SSAS) data source have
special, interactive features like drill-down and decomposition tree.
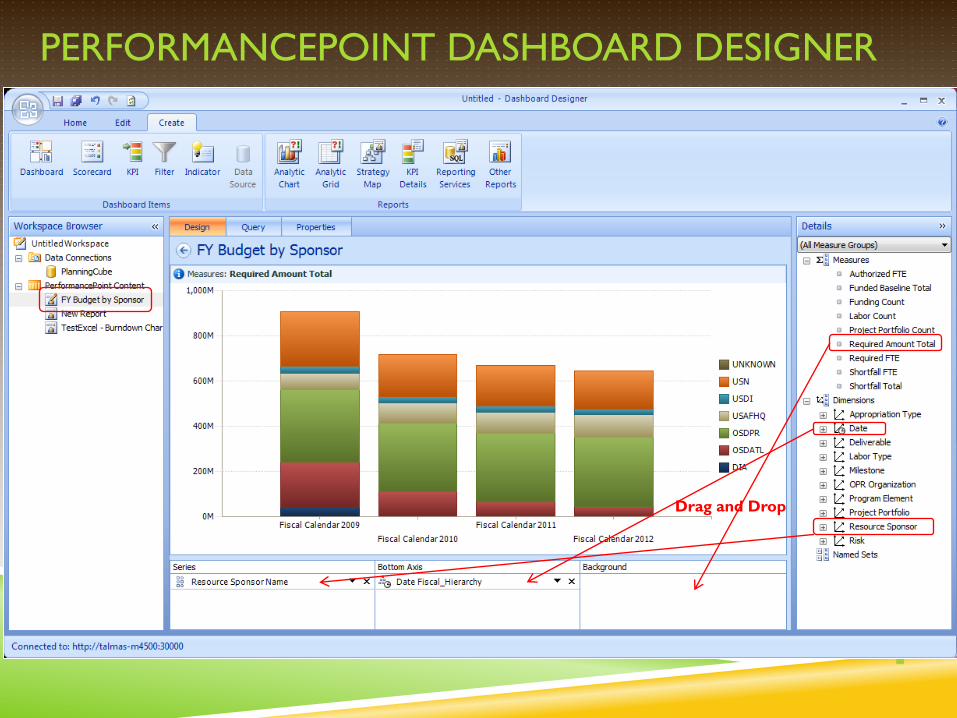
PERFORMANCEPOINT DASHBOARD DESIGNER
Drag and Drop
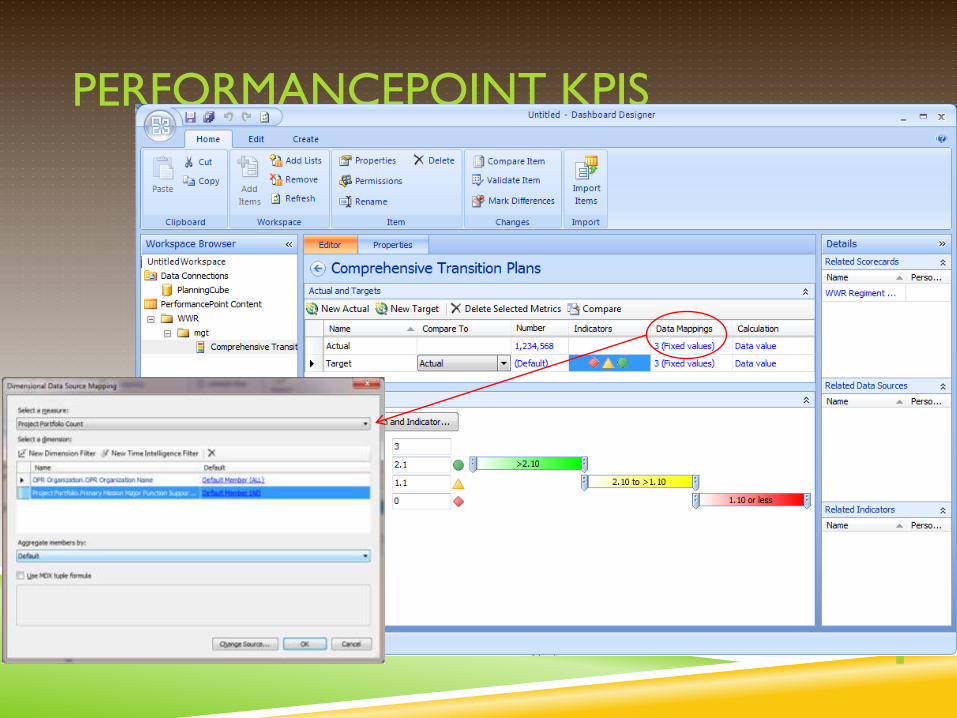
PERFORMANCEPOINT KPIS
Set the boundaries to reflect
changes in Rating – whether the KPI
value is Favorable, Cautious or Warning

PERFORMANCEPOINT SCORECARD
Drag and drop KPIs
Properties & Dimensions

PERFORMANCEPOINT AND VISIO – STRATEGY MAPS
Strategy Maps are a
report type in
PerformancePoint, a
special combination
of a Visio Diagram
that has been linked
to a Scorecard. The
diagram can contain
any shapes desired,
and will take on the
coloration of the KPI
indicator it is linked
to on the scorecard.

CONNECTING STRATEGY MAP TO SCORECARD
Create the Strategy Map Report
Import the Visio File
Select a shape
Click Connect Shape button on toolbar
Select the KPI from the Connect Shape dialog box

DEPLOYING PERFORMANCEPOINT DASHBOARDS
Select Create Dashboard from Create Menu
Select Dashboard Template from Wizard
Drag and Drop from Scorecards
and Reports in Details Pane
Save, then Deploy your Dashboard

USING PERFORMANCEPOINT WEB PARTS
PerformancePoint
Dashboard
components can be
added to any
Dashboard

INTERACTIVE PERFORMANCEPOINT REPORTS

INTERACTIVE PERFORMANCEPOINT REPORTS
Decomposition Tree – shows part to whole

PUTTING IT ALL TOGETHER TO GET THE POINT ACROSS
Use the best tool for the visualization you want to create:
Sparklines, gauges, charts in Excel or Report Builder
Interactive charts with drill-down and decomposition in
PerformancePoint
KPIs/Scorecards in either PerformancePoint (Program) or Excel (One-
Off)
PowerPivot requires Excel Add-in and Analysis Services 2008R2 Add-in,
but delivers on-demand self-service business intelligence and analytics
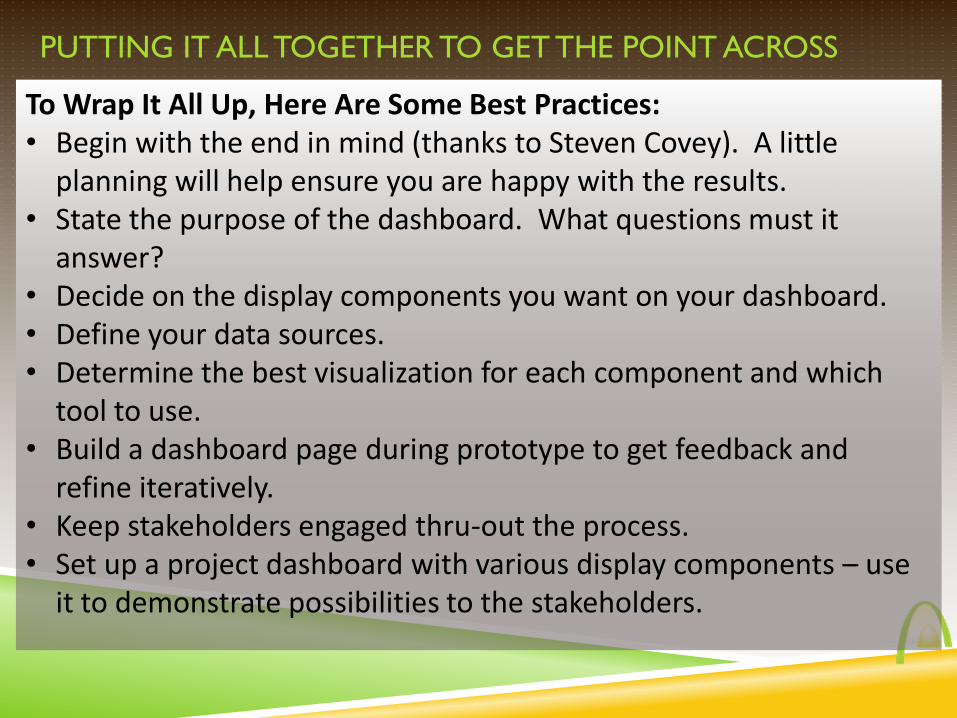
PUTTING IT ALL TOGETHER TO GET THE POINT ACROSS
To Wrap It All Up, Here Are Some Best Practices: • Begin with the end in mind (thanks to Steven Covey). A little
planning will help ensure you are happy with the results. • State the purpose of the dashboard. What questions must it
answer? • Decide on the display components you want on your dashboard. • Define your data sources. • Determine the best visualization for each component and which
tool to use. • Build a dashboard page during prototype to get feedback and
refine iteratively. • Keep stakeholders engaged thru-out the process. • Set up a project dashboard with various display components – use
it to demonstrate possibilities to the stakeholders.

QUESTIONS?
Tricia Wilcox Almas
Director, Business Intelligence
Advanced Data - SNVC
Email me to get your dashboard design template
Join Me on LinkedIn