disrupting multimerization of hermes transposase chelsea vandegrift, ronald d. gorham, aliana lópez...
Post on 21-Dec-2015
214 views
TRANSCRIPT
Disrupting Multimerization of Hermes Transposase
Chelsea Vandegrift, Ronald D. Gorham, Aliana López De Victoria, Chris A. Kieslich, Dimitrios Morikis
Department of Bioengineering, University of California, 900 University Avenue, Riverside, CA 92521
Aug. 20, 2009

Hermes Transposase
Hermes Transposase is native to Musca domestica (the housefly) and carries out transposition of DNA segments.
It works using a cut-and-paste mechanism and the DNA flanking the excised element transiently forms hairpins before the gap is repaired.
Hickman et al. Nature Structural & Molecular Biology (2005) vol. 12 715-721
Background

Hermes Transposase is a hexamer, but the largest crystallographic structure available is the heterotetramer.
Homohexamer
HeterotetramerA
FC
B
AB
C
D
F
E
Hickman et al. Nature Structural & Molecular Biology (2005) vol. 12 715-721

Objective: To delineate the physicochemical properties that hold the different chains together.
1. Hydrophobicity (SASA – Solvent Accessible Surface Area)
2. Charge
•Coulombic Interactions
Salt Bridges
•Hydrogen Bonds

Salt Bridges – Interactions between charged amino acids
ASP
LYS
-
+
Strength of Interaction Bond Distance
Strong 0.0 – 3.5 Å
Medium 3.5 – 5.0 Å
Weak 5.0 – 8.0 Å
Acidic Amino Acids (-)
Basic Amino Acids (+)
Aspartic Acid (ASP or D)
Lysine (LYS or K)
Glutamic Acid (GLU or E)
Arginine(ARG or R)
Histidine (HIS or H)
ASP CG
ARG CZ
GLU CD
LYS NZ
Atom measured from:

pKa Values
The pKa represents the pH at which Hydrogen ions are 50% dissociated.
If a basic amino acid is found to have a higher pKa value than typical, it indicates that it is in a favorable location and the hydrogen is less likely to be dissociated.
The opposite is true for acidic amino acids. A pKa value lower than the model indicates a favorable environment where the hydrogen is more likely to be dissociated.
++ -
Unfavorable
Unfavorable
Favorable
+--
++ -+
-
Basic
Acidic
HA H+ + A-
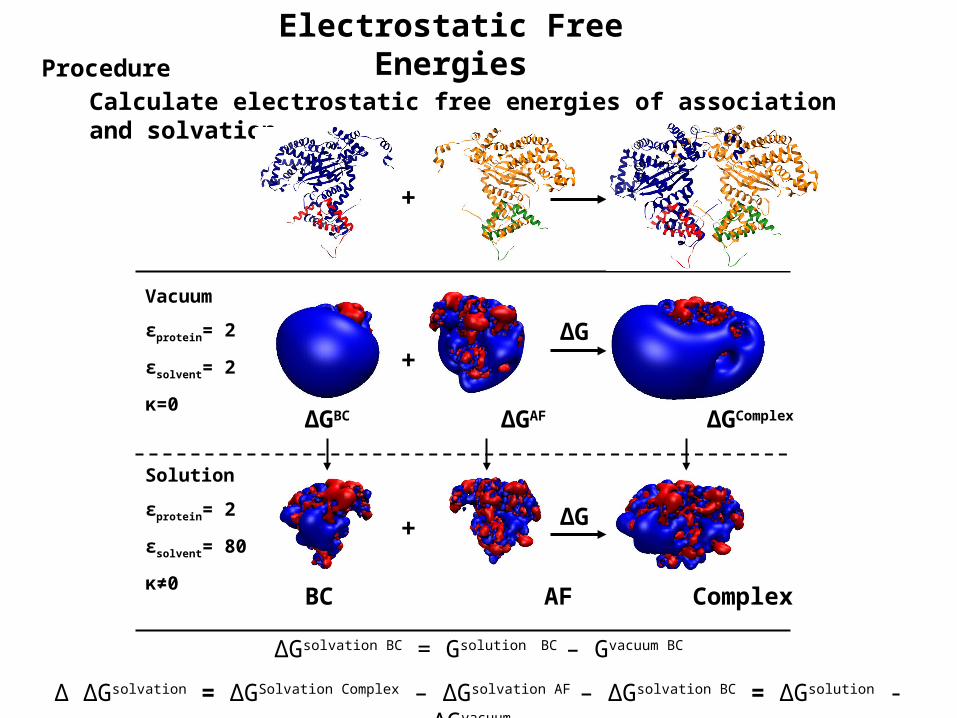
Electrostatic Free EnergiesProcedure
Calculate electrostatic free energies of association and solvation
ΔGsolvation BC = Gsolution BC – Gvacuum BC
Δ ΔGsolvation = ΔGSolvation Complex – ΔGsolvation AF – ΔGsolvation BC = ΔGsolution - ΔGvacuum
Vacuum
εprotein= 2
εsolvent= 2
κ=0
Solution
εprotein= 2
εsolvent= 80
κ≠0
+
+
ΔG
BC AF Complex
ΔGBC ΔGAF ΔGComplex
ΔG
+

• Linearized Poisson-Boltzmann Equation (LPBE):
– Accounts for different dielectric coefficients within the protein and solvent, ionic strengths, and protein charges
– Calculated at discrete grid points within and surrounding protein and extrapolated to individual atoms
ε = dielectric coefficientκ = ion accessibilityI = ionic strengthe = chargez = ionic valenceφ = electrostatic potential
Calculation of Electrostatic Potential
8

Two-step binding model• McCammon et al (1986) J. Phys. Chem proposed two-step model for association of
proteins– Recognition
• Initial collision of the two proteins free in solution through diffusive motion• Driven and or accelerated by long range electrostatic interactions• Weak encounter complex
– Binding • Short to medium range electrostatic interactions, van der Waals interactions, as
well as entropic affects• Specific final complex.
– Essential in understanding why mutations away from the binding interface can affect binding

AESOP Calculation of Free Energy
PDB
WHATIF
PDB2PQR
APBS
1
2
3
4
5
Retrieval & cleaning of coordinates for parent protein complex
Generation of coordinates for mutants
Generation of coordinate files with partial charges & vdW radii
Calculation of electrostatic potentials
APBSFree energycalculation

Intermolecular Salt Bridges – AC
Chain Residue pKa Chain Residue pKa Å
A 84 K 10.43 C 89 D 3.85 4.6
Intermolecular Salt Bridges – BF
Chain Residue pKa Chain Residue pKa Å
B 84 K 10.43 F 89 D 3.85 4.6
Intermolecular
Salt Bridges
Intermolecular Salt Bridges – AB
Chain Residue pKa Chain Residue pKa Å
B 549 K 10.29 A 537 D 1.96 3.4
A 549 K 10.29 B 537 D 1.96 3.4
B 369 R 11.31 A 497 D 3.58 5.0
A 369 R 11.31 B 497 D 3.58 5.0
≤5 Å
Number of salt bridges at each interface
3.5Å 3.6-5.0Å 5.1-8.0Å
AF/BC 0 1 4
AC/BF 0 9 2
AB 2 1 4
A
FC
B
Model pKa Values
Asp (D) 3.9
Glu (E) 4.3
Arg (R) 12
Lys (K) 10.5

Intermolecular Salt Bridges continued… A
FC
B
Model pKa Values
Asp (D) 3.9
Glu (E) 4.3
Arg (R) 12
Lys (K) 10.5
Intermolecular Salt Bridges – BC and AF
Chain pKaChain
pKa Å
B/A 91 K 10.15 C/F 139E 4.42 3.9
B/A 104 R 11.87 C/F 119 D 3.14 5.0
C/F 104 R 13.37 B/A 119 D -1.93 4.7
B/A 122 K 11.45 C/F 138 E 2.88 4.0
C/F 122 K 10.15 B/A 138 E 3.49 4.1
B/A 126 K 13.06 C/F 93 E 1.85 4.3
C/F 126 K 10.01 B/A 93 E 4.27 4.2
B/A 150 K 13.13 C/F 96 E 4.84 4.9
C/F 150 K 10.22 B/A 96 E 4.05 4.9

Free Energies9 different calculations each at 0mM and 150mM A
FC
B
Part 1 Part 2 Complex
A B AB
A C AC
A F AF
B C BC
B F BF
C F CF
+
+
+
+
+
+ =
=
=
=
=
=
Dimers
Part 1 Part 2 Complex
AF BC ABCF
AB CF ABCF
AC BF ABCF
+
+
+
=
=
=
Tetramers
ABCF
AB
AC
AF
BC
BF
CF
A
B
C
F
0 ° 90° 180 ° 270 °0mM Charge
+10
+8
+5
+5
+5
+5
+2
+4
+4
+1
+1

Free Energies ΔΔG 0mM Chain C
800.00
850.00
900.00
950.00
1000.00
1050.00
1100.00
1150.00
1200.00
74 84 94 104 114 124 134 144 154Mutation
Fre
e E
nerg
y (
kJ/m
ol)
Free Energy ΔΔG 0mM Chain F
800.00
850.00
900.00
950.00
1000.00
1050.00
1100.00
1150.00
1200.00
75 85 95 105 115 125 135 145 155
Mutation
Fre
e E
nerg
y (
kJ/m
ol)
82E
81R 84K
89D
91K
92K
93E
96E
97K 104R
105D
107R
119D
122K 126K
130E
133E
138E 139E
149R 150K
154D
156K
157E
82E
81R 84K
89D
91K
92K
93E
96E
97K 104R
105D
107R
119D
122K126
130E
133E
138E 139E
149R150K
154D
156K
157E
158K
A
FC
B
BC AF
Parent
Parent
Shaded = ±50 KJ/mol from the parent,
Bold = less than 5.0Å,
Blue = not in a salt bridge

Free Energy ΔΔG 0mM Chain B, part 1
800.00
850.00
900.00
950.00
1000.00
1050.00
1100.00
1150.00
1200.00
70 120 170 220 270
Mutation
Fre
e E
nerg
y (
kJ/m
ol)
119D82E
81R 122K150K84K
89D
91K
93E
96E138E/139E
126K104R
Free Energies ΔΔG 0mM Chain B, part 2
800.00
850.00
900.00
950.00
1000.00
1050.00
1100.00
1150.00
1200.00
1250.00
1300.00
295 345 395 445 495 545 595
Mutation
Fre
e E
nerg
y (
kJ/m
ol)
497D
537D
539K
549K
369R
573R
609K
Shaded = ±50 KJ/mol from the parent, Red = less than 3.5Å, Bold = less than 5.0Å, Blue = not in a salt bridge
133E
97K92K
372K
530E 550K
154D
165E203E 206D
217E
205R
342E 536E 542E 584E595D
605K
107R
A
FC
B
BC AF

Previous Studies continued… Mutations known to disrupt multimerization:
~Triple mutant: Mutation of R369A, F501A and F504A together disrupts domain swapping interface.1
1Hickman A. et al. Nature Structural & Molecular Biology vol. 12 715-721 (2005)
2Atkinson, P.W. et al. Insect Biochem. MOL. Biol. 33, 959-970 (2003).
Regions known to be important to multimerization2:
~The first 252 amino acids from the N-terminus
~252-380 necessary for binding
~The region between amino acids 551 and 569
800.00
850.00
900.00
950.00
1000.00
1050.00
1100.00
1150.00
1200.00
1250.00
1300.00
295 345 395 445 495 545 595
Free E
nerg
y (
kJ/m
ol)

Free Energy ΔΔG 0mM Chain A, part 1
1400.00
1450.00
1500.00
1550.00
1600.00
1650.00
1700.00
1750.00
1800.00
75 90 105 120 135 150 165 180 195 210 225 240 255 270 285 300
Mutation
Fre
e E
ner
gy
(KJ/
mo
l)
Free Energy ΔΔG 0mM Chain A, part 2
1400.00
1450.00
1500.00
1550.00
1600.00
1650.00
1700.00
1750.00
1800.00
298 313 328 343 358 373 388 403 418 433 448 463 478 493 508 523 538 553 568 583 598
Mutation
Fre
e E
ner
gy
(KJ/
mo
l)
A
FC
B
82E
91K
93E
107R
105D122K
138E
126K
149R
139E84K
584E
308R312K 585K
586R
588R
A
F

Conclusions
Mutations within the first 250 amino acids and at the C-terminus have the most effect on the electrostatic free energy calculations.
Mutation of an acidic amino acid to alanine decreases stability while mutation of a basic amino acid increases stability.
The free energy calculations agree with the salt bridge analysis.
Future Work
The data will continue to be analyzed and these theoretical predictions can be tested in a wet lab to confirm their validity.

References
Craig, N.L., Dyda, F., Hickman, A.B., Musingarimi, P., Perez Z. (2005) Purification, crystallization and preliminary crystalographic analysis of Hermes transposase, Acta Crystalographica F61:587–590.
Guex N and Peitsch MC: SWISS-MODEL and the Swiss-PdbViewer: an environment for comparative protein modeling. Electrophoresis 18: 2714-2723, 1997.
Hickman A., Perez Z., Zhou L., Musingarimi P., Ghirlando R., Hinshar J., Craig N., Dyda F. (2005). Molecular architecture of a eukaryotic DNA transposase. Nature Structural &Molecular Biology. 12:715-721.
Humphrey W., Dalke A., Schulten K. (1996). VMD: visual molecular dynamics. Journal of Molecular Graphics. 14: 33-37.
Kieslich, CA, Yang, J., and Morikis, D (2009) AESOP: Analysis of Electrostatic Properties of Proteins, To be Published.
Michel, K., O’Brochta, D.A. and Atkinson, P.W. The C-terminus of the Hermes transposase contains a protein multimerization domain. Insect Biochem. MOL. Biol. 33, 959-970 (2003).
MOLMOL: a program for display and analysis of macromolecular structures
UCSF Chimera--a visualization system for exploratory research and analysis. Pettersen EF, Goddard TD, Huang CC, Couch GS, Greenblatt DM, Meng EC, Ferrin TE. J Comput
Chem. 2004 Oct;25(13):1605-12.
Acknowledgements
Dr. Dimitrios Morikis, Ron Gorham, Aliana López De Victoria, Chris Kieslich
Dr. Atkinson for suggesting the project
Jun Wang and the BRITE program
National Science Foundation

Questions?