dissecting a complex chemical stress: chemogenomic
TRANSCRIPT

Dissecting a complex chemical stress: chemogenomicprofiling of plant hydrolysates
Jeffrey M Skerker1,2,3,5, Dacia Leon1,3,5, Morgan N Price3, Jordan S Mar1,4, Daniel R Tarjan1,4, Kelly M Wetmore3,Adam M Deutschbauer3, Jason K Baumohl3, Stefan Bauer1, Ana B Ibanez1, Valerie D Mitchell1, Cindy H Wu4, Ping Hu4,Terry Hazen4 and Adam P Arkin1,2,3,*
1 Energy Biosciences Institute, University of California, Berkeley, CA, USA, 2 Department of Bioengineering, University of California, Berkeley, CA, USA,3 Physical Biosciences Division, LBNL, Berkeley, CA, USA and 4 Earth Sciences Division, LBNL, Berkeley, CA, USA5 These authors contributed equally to this work.* Corresponding author. Lawrence Berkeley National Laboratory, 1 Cyclotron Road, Mailstop 955-512L, Berkeley, CA 94720, USA.Tel.: þ 1 510 495 2116; Fax: þ 1 510 486 6219; E-mail: [email protected]
Received 30.11.12; accepted 12.5.13
The efficient production of biofuels from cellulosic feedstocks will require the efficient fermentationof the sugars in hydrolyzed plant material. Unfortunately, plant hydrolysates also contain manycompounds that inhibit microbial growth and fermentation. We used DNA-barcoded mutantlibraries to identify genes that are important for hydrolysate tolerance in both Zymomonas mobilis(44 genes) and Saccharomyces cerevisiae (99 genes). Overexpression of a Z. mobilis tolerance gene ofunknown function (ZMO1875) improved its specific ethanol productivity 2.4-fold in the presence ofmiscanthus hydrolysate. However, a mixture of 37 hydrolysate-derived inhibitors was not sufficientto explain the fitness profile of plant hydrolysate. To deconstruct the fitness profile of hydrolysate,we profiled the 37 inhibitors against a library of Z. mobilis mutants and we modeled fitness inhydrolysate as a mixture of fitness in its components. By examining outliers in this model,we identified methylglyoxal as a previously unknown component of hydrolysate. Our work providesa general strategy to dissect how microbes respond to a complex chemical stress and should enablefurther engineering of hydrolysate tolerance.Molecular Systems Biology 9: 674; published online 18 June 2013; doi:10.1038/msb.2013.30Subject Categories: cellular metabolism; microbiology & pathogensKeywords: biofuels; chemogenomics; plant hydrolysate; systems biology; tolerance
Introduction
Concerns over energy security, global warming, and risingpetroleum prices have led to a renewed interest in thedevelopment of technologies for cost-effective production ofethanol or other biofuels from renewable resources (Hillet al, 2006; US Department of Energy, 2011). Lignocellulosicbiomass, such as wood and grasses, can provide a sufficientquantity of feedstock material that can be converted intobiofuels, and a variety of energy crops are currently beingconsidered for use in the United States, such as Miscanthusgiganteus (miscanthus) and Panicum virgatum (switchgrass)(Somerville et al, 2010; Youngs and Somerville, 2012). Thegrand challenge is to produce large quantities of a commoditychemical given economic constraints. In the case of cellulosicethanol, technoeconomic analysis has been used to determinewhich steps of the production process, if optimized, canhave the greatest impact on the minimum selling price(Klein-Marcuschamer et al, 2010, 2011; Kumar and Murthy,2011; Tao et al, 2011; Vicari et al, 2012). Two critical steps arethe conversion of biomass into fermentable hexose andpentose sugars (mainly glucose and xylose) and theirsubsequent fermentation into ethanol.
Conversion of biomass into sugars is typically a two-stepprocess involving pretreatment and enzymatic hydrolysis.Although many variations exist, we have focused on thedilute-acid hydrolysis method, which is considered as a viableoption for commercial-scale cellulosic ethanol production(Wyman et al, 2005). The high temperatures and pressurestypically used for dilute-acid pretreatment result in theco-production of inhibitory compounds (derived from sugarand lignin degradation) in addition to fermentable sugars. Thisresulting mixture, or plant hydrolysate, contains at least 60inhibitory compounds (Clark and Mackie, 1984; Palmqvist andHahn-Hagerdal, 2000a, b). These inhibitors have a significantimpact on growth and fermentation of bacteria and yeast, thuspreventing efficient biofuel production. There are threecommon approaches to deal with fermentation inhibitors:prevent their formation by reducing the severity of pretreat-ment, remove inhibitors by detoxification, or improve thetolerance of the host organism (Palmqvist and Hahn-Hagerdal,2000a; Nilvebrant et al, 2001; Martın et al, 2007a; Parawira andTekere, 2011; Stoutenburg et al, 2011). All three methods can besuccessful and are expected to have a significant economicimpact (Klein-Marcuschamer et al, 2010; Tao et al, 2011), buthere we will focus on improving tolerance.
Molecular Systems Biology 9; Article number 674; doi:10.1038/msb.2013.30Citation: Molecular Systems Biology 9:674www.molecularsystemsbiology.com
& 2013 EMBO and Macmillan Publishers Limited Molecular Systems Biology 2013 1
There are two complementary approaches to develop moretolerant strains: laboratory evolution in the presence of planthydrolysates and rational strain engineering (Larsson et al,2001; Heer and Sauer, 2008; Chen, 2010; Yang et al, 2010a, b;Liu, 2011; Agrawal et al, 2012; Fujitomi et al, 2012). Regardlessof the approach, the resulting strains are often not fullytolerant, and further improvements in ethanol yield andproductivity are needed (Keller et al, 1998; Martın et al,2007b; Heer and Sauer, 2008). Many of these studies havefocused on single inhibitory compounds present in hydro-lysate or simple model mixtures as a proxy for planthydrolysates (Palmqvist et al, 1999; Liu, 2011). Given thecomplexity of inhibitors in actual hydrolysate, it is challengingto predict and engineer the necessary genetic changes fortolerance based on these previous studies.
Given this challenge, we present here an experimental andcomputational approach to dissect the effects of complexchemical mixtures, such as plant hydrolysates, on the growthand fermentation of the bacterium Zymomonas mobilis andthe yeast Saccharomyces cerevisiae. Both microbes are beingconsidered for commercial-scale cellulosic ethanol produc-tion. Z. mobilis is currently being used as part of a DuPontindustrial-scale cellulosic ethanol process (http://www.ddce.com/), and S. cerevisiae has a long history of industrial-scaleethanol production from corn in the United States and fromsugarcane in Brazil (Wheals et al, 1999).
First, we used a functional genomics approach, based onchemogenomic profiling of mutant libraries in Z. mobilis andS. cerevisiae, to identify genes that are important for growth inplant hydrolysates. Chemogenomic profiling with DNAbarcodes was first pioneered in S. cerevisiae and we haverecently adapted the technology for use in bacteria (Giaeveret al, 2002, 2004; Oh et al, 2010; Deutschbauer et al, 2011).These previous studies, and other technologies for profilinglarge mutant pools, have led to key insights into the function ofunknown genes and the mechanism of action of inhibitorycompounds (Sassetti et al, 2001; Giaever et al, 2004; Langridgeet al, 2009; Smith et al, 2009; Van Opijnen et al, 2009;Hillenmeyer et al, 2010; Deutschbauer et al, 2011). The putativehydrolysate tolerance genes that we identified are attractivetargets for strain improvement programs, and we demonstratehere, by systematic overexpression of Z. mobilis tolerancegenes, that we can rationally engineer improved fermentationin miscanthus hydrolysate. Most of our fitness experimentswere carried out under aerobic growth conditions because thiswas most compatible with our high-throughput protocols.However, we did perform some experiments under anaerobicgrowth conditions to better match the environment ofan industrial bioreactor, and identified seven additionalZ. mobilis tolerance genes (see Discussion).
Second, we deconstructed the complex biological responseto plant hydrolysates by obtaining individual chemogenomicprofiles for each of 37 hydrolysate-derived inhibitors and insynthetic mixtures of known components. We modeled fitnessin hydrolysate as a mixture of fitness in individual componentsand identified outliers in our model that led to the discovery ofa previously unknown chemical component, methylglyoxal,which is present in our miscanthus plant hydrolysate andcontributes to overall toxicity. In sum, our combined experi-mental and computational approach provides a general strategy
for understanding how microbes respond to a complex chemicalstress, for identifying critical unknown chemical components inplant hydrolysates, and for rationally engineering strains withimproved hydrolysate tolerance and fermentation properties.
Results
Plant hydrolysate composition and effects onZ. mobilis growth and fermentation
To explore the natural diversity of hydrolysate compositionand to determine the effect of feedstock-derived inhibitors onthe growth and fermentation of Z. mobilis, we developed amicrowave oven-based protocol to hydrolyze M. giganteus(miscanthus) and P. virgatum (switchgrass) plant material athigh temperature and pressure. The procedure was designed tomimic, at the laboratory scale, a dilute-acid hydrolysispretreatment method that can be used for the industrial-scaleproduction of cellulosic biofuels (Tao et al, 2011). We preparedsix hydrolysate samples from miscanthus or switchgrassgrown at different field sites in Illinois and two additionalhydrolysate samples from a mixture of miscanthus, frommultiple field sites. All eight hydrolysate samples wereanalyzed using a combination of GC/MS and LC-RID/DAD;the composition of these mixtures, including 4 sugars(glucose, xylose, arabinose, and cellobiose) and 37 potentialinhibitors, is shown in Supplementary Table 1. As expected,the harsh hydrolysis conditions (low pH and high tempera-ture) resulted in the production of sugar dehydration products,such as furfural and 5-hydroxymethylfurfural (5-HMF)and their degradation products, formic acid and levulinicacid, respectively. In addition, we detected a wide variety ofphenolic compounds derived from lignin degradation(Palmqvist and Hahn-Hagerdal, 2000b; Klinke et al, 2004).Based on clustering of the inhibitor and sugar concentrations,we identified three groups of samples with distinct chemicalcompositions: miscanthus, switchgrass, and the batch mis-canthus samples (Supplementary Figure 1). Despite thedifferent field locations, miscanthus hydrolysates were moresimilar to each other than switchgrass, and vice versa. Bycontrast, the two batch miscanthus samples (batch 1 andbatch 2) formed a third independent cluster, and this is likelyexplained by the higher temperature used for their processing(2001C versus 1801C) that led to higher concentrations ofinhibitors (Supplementary Table 1).
To understand the inhibitory effect of hydrolysate, we firstdetermined the concentration of hydrolysate that, when addedto rich media, significantly inhibited the growth of Z. mobilis.Consistent with their similar, but not identical, chemicalcompositions, all eight hydrolysate samples inhibited growthof Z. mobilis at concentrations ranging from about 8 to 20%(v/v) (Supplementary Figure 2). The most potent hydrolysatesamples were the batch miscanthus that was prepared at ahigher temperature, consistent with their higher inhibitorconcentrations (Supplementary Table 1). We also determinedthe effects of plant hydrolysate on the fermentation profile ofZ. mobilis by carrying out small-scale aerobic batchfermentations in the absence (Figure 1A) or presence of 8%(v/v) batch 2 hydrolysate (Figure 1B). In the presence ofhydrolysate, specific ethanol productivity was reduced about
Dissecting plant hydrolysate stressJM Skerker et al
2 Molecular Systems Biology 2013 & 2013 EMBO and Macmillan Publishers Limited

three-fold (0.10 versus 0.27 g/l/h/OD600). Taken together, ourhydrolysate preparations provide a complex mixture ofinhibitors that serve as a model for industrial-scale dilute-acidhydrolysates.
Generating a genome-wide Z. mobilis barcodedtransposon library
To understand the genetic basis of hydrolysate tolerance, wefirst mapped 14 008 random DNA-barcoded transposon inser-tions in Z. mobilis ZM4 using protocols recently developed inour laboratory for Shewanella oneidensis MR-1 (Deutschbaueret al, 2011). From our collection of 14 008 mutants, we derivedtwo Z. mobilis mutant pools of 3716 barcoded strains each thattogether represent 1620 of the 1892 (86%) annotated protein-coding genes (Materials and methods; SupplementaryTable 2). We designed two mutant pools because it providedoptimal genome-wide coverage given a limited set of barcodes(about 4200), and it allowed us to include some strains in bothpools and measure them twice, which provided an internalcontrol for experimental consistency. These mutant pools wereused to perform competitive growth assays, or pooled fitnessexperiments, where the relative abundance of strains in ourtwo pools was quantified (Giaever et al, 2002; Pierce et al,2006; Oh et al, 2010). Before all experiments, we recovered
the mutant pools from frozen stocks and used these cells asthe starting inoculum for setting up fitness experiments inexperimental conditions. By comparing strain abundance aftergrowth in the experimental condition (END) to strainabundance in the starting inoculum (START), we calculateda log2 ratio, or strain fitness value for each mutant strain in thatcondition. We define ‘gene fitness’ as the average strain fitnessvalue for insertions within that gene (see Materials andmethods for details). Negative gene fitness values indicate thata gene is important for growth in the condition of interest, thatis, transposon mutants of that gene should grow poorly in thatcondition. In contrast, positive gene fitness values indicatethat the gene is detrimental to growth in the condition ofinterest, that is, transposon mutants of that gene haveimproved growth relative to the typical strain. After final datafiltering, we obtained gene fitness data for 1578 of 1892(83%) protein-coding genes. Because many genes hadmultiple transposon insertions (1336/1578 had 41 insertion),and because the same strain was sometimes present in bothpools, we were able to make an average of 3.5 fitnessmeasurements per gene.
We were surprised to find transposon insertions within thecentral 5–80% of most genes regardless of whether they wereexpected to be essential. In fact, we mapped insertions in 82%of predicted essential genes (Supplementary Table 3), which isnot significantly less than the rate of 85% for other genes(P¼ 0.10, Fisher’s exact test). To our knowledge, this is the firstexample of a large-scale transposon mutagenesis study inbacteria with this unusual distribution of insertion sites.To study this further, we first examined six mutants by PCRusing primers that flanked each transposon site. Three of thesemutants were in predicted essential genes (leuS::TN5,ftsZ::TN5, and rpoB::TN5), and three mutants were innon-essential genes (ZMO0759::TN5, ZMO1490::TN5, andZMO1723::TN5). In the predicted essential gene mutants, weamplified two bands that correspond to the wild-type andmutant copies of leuS, ftsZ, and rpoB, respectively(Supplementary Figure 4A and B). By contrast, transposoninsertions in non-essential genes only had a single band byPCR analysis, corresponding to the mutant copy. Mutants withtwo bands by PCR were classified as ‘mixed’ and wereexamined further by using a transposon stability assay andcomparative genome hybridization (Materials and methods;Supplementary Figure 4C–L). Based on these experiments, weconcluded that Z. mobilis is polyploid (i.e., has multiple copiesof its main 2 Mbp chromosome), and that insertions inessential genes are heterozygous and unstable in the absenceof kanamycin selection, whereas insertions in non-essentialgenes are homozygous and stable (Supplementary Note 1;Supplementary Figure 5). Alternatively, polyploidy might be arare event that is selected for only when an essential gene ismutated; however, because the rate of insertion in essentialgenes is similar to non-essential genes, we believe thatpolyploidy is the normal state for Z. mobilis. In this study,we focused our single-mutant follow-up experiments onstable, homozygous KanR mutants. Although unusual, otherbacteria, such as Deinococcus radiodurans, Thermusthermophilus, Synechococcus spp., Sinorhizobium melilotibacteroids, and Epulopiscium sp. type B are known to bepolyploid and to have multiple copies of their chromosome
0
2
4
6
8
10
0
5
10
15
20
25
30
Eth
anol
(g/
l), O
D60
0
Glu
cose
(g/
l)
Time (h)
WT + pJS71 (RM)
0
2
4
6
8
10
0
5
10
15
20
25
30
Eth
anol
(g/
l), O
D60
0
Glu
cose
(g/
l)
Time (h)
WT + pJS71 (HZ)
0 5 10 15 20 25 30
0 5 10 15 20 25 30
Figure 1 Miscanthus hydrolysate inhibits Z. mobilis growth and ethanolproduction. Batch fermentation profiles for wild-type Z. mobilis strain carrying anempty control plasmid (WTþ pJS71) either in (A) rich media (RM) or in (B) richmedia supplemented with 8% (v/v) batch 2 miscanthus hydrolysate (HZ). Data shownare the average of four replicates and error bars indicate standard deviation.
Dissecting plant hydrolysate stressJM Skerker et al
& 2013 EMBO and Macmillan Publishers Limited Molecular Systems Biology 2013 3

(Masters et al, 1991; Mergaert et al, 2006; Ohtani et al, 2010;Griese et al, 2011; Angert, 2012).
We validated our pooled fitness assay by growing the mutantpools in minimal media where we had a strong prediction ofwhich genes should have fitness defects. Most of the 53annotated amino-acid synthesis genes had strong fitness defectsin minimal media and were rescued by the addition of casaminoacids (CAA) (Supplementary Figure 6A–C; SupplementaryTable 4). We were unable to rescue mutants of genes requiredfor tryptophan biosynthesis (aroABCDE and trpDE), whichcan be explained because CAA does not contain tryptophan; it islost during the preparation of CAA, which involves acidhydrolysis of casein. As a second test of auxotroph rescue, wegrew the Z. mobilis transposon pools in the presence ofmethionine, and this specifically rescued the fitness defect ofsix genes (metCEFWXZ) all predicted to be required formethionine biosynthesis (Supplementary Figure 6C). We thencarried out single-mutant follow-up studies on a metC::TN5mutant to confirm that fitness defects in the pooled assay canbe recapitulated at the single strain level (SupplementaryFigure 6D). As expected, growth of metC::TN5 on minimalmedia could be rescued by the addition of methionine.
In addition to our biological tests, we calculated two metrics(strain and operon correlation), as previously described(Deutschbauer et al, 2011) that were used to measure overallexperiment quality and to flag potential experimental errors(Supplementary Figure 6E–G). In the typical experiment, thecorrelation of the 1057 identical strains contained in both poolswas 0.89 and the correlation of fitness between adjacent genesin the same operon was 0.50. Experiments with poor qualitymetrics (operon correlation o0.4 or strain correlation o0.75)were repeated, and kept if reproducible across multiplebiological replicates. In sum, our validation confirms thatour Z. mobilis pooled fitness assay provides accurate andbiologically meaningful results that could be used to studyhydrolysate tolerance.
Genome-wide fitness profiling of Z. mobilismutants in plant hydrolysates and 37 chemicalcomponents
Using high-throughput culturing methods we recentlydeveloped for Shewanella oneidensis MR-1 (Deutschbaueret al, 2011), we performed 189 whole-genome mutant fitnessexperiments with our two Z. mobilis pools. These 189experiments represent 58 unique experimental conditionsincluding miscanthus and switchgrass hydrolysates, 2 types ofsynthetic hydrolysate mixtures (SYN-37 and SYN-10), 37individual compounds that are present in miscanthus hydro-lysate, and 11 other stress conditions (Supplementary Table 5).Most fitness experiments were performed in rich mediawithout inhibitors and in rich media supplemented withhydrolysate or specific compounds of interest. We tested eachpotential growth inhibitor at several different concentrationsto identify the suitable concentration for mutant fitnessexperiments. In general, we selected the concentration thatcaused about a two-fold increase in doubling time and gave afitness pattern that was reproducibly different from thebaseline rich media condition (see Materials and methods).
An overview of our fitness data set is shown as a clusteredheat map of average gene fitness values (Figure 2). Genefitness values were averaged across replicate conditions, suchas rich media (24 replicates) or identical concentrations of thesame inhibitor. We also averaged the gene fitness valuesfor 37 hydrolysate experiments (Supplementary Figure 7)that included both miscanthus and switchgrass samples(from single field sites or batch material). The complete,non-averaged data set can be found in Supplementary Dataset 1and online (http://genomics.lbl.gov/supplemental/zm4hy-drolysate/).
Two-dimensional hierarchical clustering of the averagedgene fitness data revealed two broad categories. One largegroup represents genes that when mutated have littleor no fitness defect in the 58 conditions we tested (left half,Figure 2). Additional experimental conditions might uncoverphenotypes for these mutants. The second large group hadfitness defects in nearly all 58 conditions, including rich media(right half, Figure 2). With a fitness value of � 1 or less, weidentified 402 genes that were important for growth in richmedia and 1184 that are not. Of these 402 genes, 185 (46%) areexpected to be essential (see Materials and methods), whilejust 5% of the other 1184 genes are expected essentials(Po10�15, Fisher’s exact test). Because this large cluster ofgenes had negative fitness values in our baseline condition(rich media), and many are likely to be essential, they werenot pursued further in this study. In addition, we found thatmutants in expected essential genes were more likely to have alow abundance in our starting pool (SupplementaryFigure 3B), making it more difficult to perform accurate fitnessmeasurements on these strains.
Clustering the fitness data by condition revealed a few largegroups of similar conditions, such as organic acids (Y -axis,near bottom, Figure 2). In many cases, these broad groupsincluded chemicals of different classes, and it was not clearwhy they formed a cluster. However, within these broadgroups, we found that chemicals with highly similar structuresclustered closely (Clusters 1–10 on Y axis, Figure 2). In 10cases, these closely related chemicals differed by a singlefunctional group, such as a single hydroxyl, ester, methyl, orC¼C group (Supplementary Figure 8). For example, cluster 1on the Y axis contains two chemicals (2,5-dihydroxybenzoicacid and 3-hydroxybenzoic acid) that differ by a singlehydroxyl group. In sum, chemicals with closely relatedstructures had very similar fitness profiles. Our results areconsistent with previous chemogenomic studies andlikely reflect the underlying similarity in mechanism ofaction for structurally related inhibitory compounds(Hillenmeyer et al, 2010).
Identification of 44 putative hydrolysate tolerancegenes in Z. mobilis
To identify genes that are important for growth in hydrolysate,we searched for mutants that showed a significant differencein fitness between rich media supplemented with hydrolysateand plain rich media. Based on this criterion (fitnesshydrolysate
o� 1 and fitnesshydrolysateofitnessrich � 1), we identified 44putative hydrolysate tolerance genes that were further grouped
Dissecting plant hydrolysate stressJM Skerker et al
4 Molecular Systems Biology 2013 & 2013 EMBO and Macmillan Publishers Limited

into 7 functional categories (Figure 3A; Table I; SupplementaryDataset 2). In contrast, using a second criterion (fitnesshy-
drolysate40.5 and fitnesshydrolysate4fitnessrichþ 0.75), wefound only one gene, ZMO1496, that was detrimental forgrowth in hydrolysate, which encodes phosphoenolpyruvate(PEP) carboxylase (fitness in hydrolysate¼ 0.72 versusrich media¼ � 0.48). Because signal intensity on microarrayscan saturate, we believe that our pooled fitness assays have areduced sensitivity for mutants with positive fitness, whichmay explain why we only identified one mutant in the positivefitness category. In this study, we only pursued the negativefitness mutants.
The 44 putative tolerance genes included 8 auxotrophs,5 genes involved in cytochrome c biogenesis or cytochromec-containing proteins, 4 efflux pump-related genes, 6glutathione-related genes, 8 genes related to membranes or thecell wall, 3 regulators, and 10 other genes (Table I). The varietyof predicted gene functions suggests that the cellular responseto growth in hydrolysate is complex and that hydrolysatetolerance is a multigenic trait. This is consistent with the factthat plant hydrolysates are complex mixtures containing avariety of chemical classes (e.g., weak organic acids, furans,aldehydes, and phenolics) that likely affect cell physiology bydifferent mechanisms of action.
Fitness of 1586 genes
58 Conditions
OH (1)
Ester (2,7)
Methyl (4,6,10)
C=C (7,8,9)
Ethyl group (3,5)
Chemical differences
Potassium chlorideSodium chlorideSYN-37Formic acid pH 6Acetic acid pH 6Levulinic acid pH 6Formic acidLevulinic acid4-hydroxyphenylpropionic acid4-hydroxyphenylacetic acidVanillylmandelic acidp-coumaric acidSyringic acidSinapic acidAcetic acidBenzoic acid4-hydroxymandelic acidProtocatechuic acidCaffeic acidSuccinic acidFuroic acidHomovanillic acid 4−hydroxybenzoic acidVanillic acidFerulic acidMinimal mediaMinimal media + methionineMinimal media + casamino acidsAnaerobicSYN-10SYN-10 + methylglyoxalHydrolysateMethylglyoxalRich media (no inhibitor)DMSO5-HMFGlycolaldehydeGlycerolFurfuralAcetaldehydeSodium hypochloriteCatechol4-hydroxybenzaldehydeSyringaldehydeAcetosyringoneProtocatechualdehydeConiferyl alcoholEugenolHydrogen peroxideVanillinAcetovanilloneHydroquinoneGuaiacolVanillyl alcoholConiferyl aldehydeSinapinaldehyde3-hydroxybenzoic acid2,5-dihydroxybenzoic acid1
2
3
4
5
6
7
8
9
10
−2 −1.5 −1 −0.5 0 0.5 1 1.5 2
Gene fitness
NeutralImportantfor growth
Detrimentalfor growth
Figure 2 Genome-wide fitness profiling of Z. mobilis in 58 experimental conditions, including plant hydrolysate and 37 individual components of hydrolysate.Average gene fitness data are represented as a two-dimensional heat map for 1586 genes (X axis) and 58 experimental conditions (Y axis). For each transposon mutantin our pool, strain fitness is calculated as log2 ratio of (END/START). Gene fitness values are the average of per-strain fitness across all insertions within that gene andare displayed according to the color bar at the top right of the heat map. In addition, gene fitness values have also been averaged across replicate experimentalconditions. Chemicals with similar structures cluster together on the Y axis (labeled 1–10) and differ by a single functional group, as colored by the key at the top left. Forexample, compounds 2,5-dihydroxybenzoic acid and 3-hydroxybenzoic acid (cluster 1) differ by a single hydroxyl group (see Supplementary Figure 8 for moreexamples). The fitness data were clustered in both dimensions by hierarchical agglomerative clustering with complete linkage. Euclidean distance was used as thedistance metric for genes and Pearson’s correlation was used as the similarity metric for experimental conditions. Hydrolysate components are indicated by red text.
Dissecting plant hydrolysate stressJM Skerker et al
& 2013 EMBO and Macmillan Publishers Limited Molecular Systems Biology 2013 5

Gene fitness in rich media
Gen
e fit
ness
in h
ydro
lysa
te
Gene fitness
–2 –1.5 –1 –0.5 0.5 1 1.5 20
ZM
O07
60Z
MO
1722
ZM
O17
23Z
MO
0100
ZM
O01
01Z
MO
0675
ZM
O15
90Z
MO
0846
ZM
O13
89Z
MO
1136
ZM
O12
52Z
MO
0007
ZM
O00
03Z
MO
0008
ZM
O00
09Z
MO
1541
ZM
O14
04Z
MO
1659
ZM
O10
67Z
MO
1874
ZM
O18
75Z
MO
0759
ZM
O15
20Z
MO
0483
ZM
O02
00Z
MO
0201
ZM
O04
68Z
MO
0472
ZM
O07
74Z
MO
1253
ZM
O12
55Z
MO
0429
ZM
O01
92Z
MO
1490
ZM
O04
18Z
MO
0763
ZM
O14
29Z
MO
1431
ZM
O14
30Z
MO
1432
ZM
O09
75Z
MO
1391
ZM
O12
21Z
MO
1715
Potassium chlorideSodium chlorideSYN-37Formic acid pH 6Acetic acid pH 6Levulinic acid pH 6Formic acidLevulinic acid4-hydroxyphenylpropionic acid4-hydroxyphenylacetic acid
4–hydroxymandelic acid
4-hydroxybenzoic acid
Sinapic acidSyringic acidp-coumaric acidVanillylmandelic acid
Acetic acidBenzoic acid
Protocatechuic acidCaffeic acidSuccinic acidFuroic acidHomovanillic acid
Vanillic acidFerulic acidMinimal media Minimal media + methionineMinimal media + casamino acidsAnaerobicSYN-10SYN-10 + methylglyoxal
Rich media (no inhibitor)
Glycerol
Sodium hypochloriteAcetaldehyde
Hydrogen peroxide
Glycolaldehyde
DMSO
Furfural
5-HMF
MethylglyoxalHydrolysate
Catechol
Vanillin
EugenolConiferyl alcoholProtocatechualdehydeAcetosyringoneSyringaldehyde4-hydroxybenzaldehyde
AcetovanilloneHydroquinoneGuaiacolVanillyl alcoholConiferyl aldehydeSinapinaldehyde3-hydroxybenzoic acid2,5-dihydroxybenzoic acid
AuxotrophCytochrome cEffluxGlutathioneMembraneOtherRegulator
ZMO1496
Dissecting plant hydrolysate stressJM Skerker et al
6 Molecular Systems Biology 2013 & 2013 EMBO and Macmillan Publishers Limited

To confirm the pooled fitness results, 25 transposon mutantswere selected from our set of 44 tolerance genes for detailedfollow-up studies (Supplementary Table 6). This group ofstrains represents examples from each of the seven functionalclasses we identified. Each mutant was re-streaked to a singlecolony isolate and their transposon insertion sites wereverified by PCR and DNA sequencing. We then used ourtransposon stability assay to check whether the insertion wasstable or mixed. Nine of the twenty-five mutants had mixedtransposon insertions and were not studied further. Four ofthese nine mixed mutants were in a single operon encoding anefflux pump (ZMO1429-ZMO1432). Of the remaining 16 stablemutants, we confirmed negative fitness defects for 13 of them,when grown in batch 1 or batch 2 miscanthus hydrolysate(e.g., see Supplementary Figure 9). In addition, we comple-mented three mutants (ZMO0100::TN5, ZMO1722::TN5, andZMO0759::TN5) by expression of the correspondingwild-type gene on a plasmid, demonstrating that the observedphenotype is due to a single gene defect (SupplementaryFigure 10). In sum, these data demonstrate that ourpooled fitness assay can be used to identify bona fidehydrolysate tolerance genes that are critical for growth inplant hydrolysate.
To further understand the specific function of each putativetolerance gene, we examined the fitness pattern for these 44genes in each of the 37 components (colored red) known to bepresent in miscanthus and switchgrass hydrolysates(Figure 3B). Broadly, most of the tolerance genes had fitnessdefects in many of the individual hydrolysate components,which makes it difficult to infer a specific detoxificationfunction for any particular tolerance gene. Some of thetolerance genes might respond to or detoxify a class ofcompounds, such as aldehydes, so this could explain the lackof a one-to-one relationship between gene fitness andhydrolysate component. While more detailed follow-upstudies will be required to determine the specific biochemicalfunctions of these tolerance genes, we find that hydrolysatetolerance genes with related functions cluster together onour fitness data heatmap (X axis, Figure 3B). For example, onecluster contains four auxotrophs that are part of the sulfateassimilation pathway (cysCHIJ encoded by ZMO0003,ZMO0007, ZMO0008, and ZMO0009), and a second clustercontains cytochrome c peroxidase (CCP) (ZMO1136) and twogenes that are involved in cytochrome c biogenesis (ZMO1389and ZMO1252). Many of these fitness clusters containgenes that are predicted to form operons, which are alsoconsistent with their shared function (ZMO0100-ZMO0101,ZMO0007-ZMO0009, ZMO1874-ZMO1875, ZMO0200-ZMO0201, ZMO1429-ZMO1432).
Five hydrolysate tolerance genes (ZMO0760, ZMO0100,ZMO0101, ZMO1722, and ZMO1723) did not exhibit afitness defect in any of the 37 inhibitors we tested. Thesehydrolysate-specific mutants might be affected by someunknown component of hydrolysate or only by a combinationof inhibitors. To test the latter possibility, we made twosynthetic hydrolysate mixtures based on the composition ofmiscanthus batch 1; one contained the 10 most abundantinhibitors (SYN-10; furfural, acetic acid, formic acid, levulinicacid, succinic acid, 5-HMF, 2-furoic acid, vanillin, vanillic acid,and syringaldehyde), and the second contained the full set of37 inhibitors and four sugars: glucose, xylose, arabinose, andcellobiose (SYN-37). The composition of SYN-10 and SYN-37was verified using GC/MS and LC-RID and closely matched thevalues for batch 1 hydrolysate (Supplementary Table 1).
Fitness profiling of synthetic hydrolysate mixturesin Z. mobilis and S. cerevisiae
We first examined the effect of SYN-10 and SYN-37 on thegrowth of Z. mobilis and found that both mixtures were lesspotent than the batch 1 and batch 2 hydrolysates and inhibitedgrowth in a similar manner (Supplementary Figure 11A,Po10� 5, analysis of variance (ANOVA)). This suggests thatour synthetic mixtures are missing critical inhibitory compo-nents. To further understand this difference, we performedpooled fitness assays in the presence of SYN-10 or SYN-37(Supplementary Figure 12A; Figure 4A). The fitness profilesof SYN-10 and SYN-37 were very similar (R2¼ 0.807,Supplementary Figure 12B), consistent with their similargrowth effects on Z. mobilis. However, a plot of average fitnessin SYN-37 versus average fitness in hydrolysate shows thatnine genes are outliers (fitnesshydrolysate o� 1 and fitnessSYN-
374�1/3, enclosed by dashed black lines in Figure 4A). Of the9 genes, 5 are important for growth in hydrolysate but not inany of the 37 components (ZMO0760, ZMO1722, ZMO1723,ZMO0100, and ZMO0101, all fitnesscomponents4� 1, leftmostcluster in Figure 3B). In addition, a heatmap of the 44 tolerancegenes shows that SYN-10 and SYN-37 are more alike each otherthan hydrolysate (Figure 4B). In sum, our synthetic mixturesdo not fully recapitulate the growth and fitness effects of realhydrolysate and the presence of outliers indicates that thereare unidentified hydrolysate components that contribute to itsoverall toxicity.
To determine whether synthetic mixtures can recapitulatethe fitness profile of plant hydrolysates in other organisms, wechose Saccharomyces cerevisiae, for which a genome-widecollection of DNA-barcoded deletion strains is available
Figure 3 Identification of 44 Z. mobilis genes that are important for growth and 1 gene that is detrimental for growth in plant hydrolysate. (A) Scatter plot of gene fitnessvalues in rich media (average of 24 experiments) versus gene fitness in hydrolysate (average of 37 experiments) for 1586 Z. mobilis genes. A dashed grey line indicatesX¼ Y and dashed black lines indicate the cutoffs used to select tolerance genes. Putative tolerance genes have a more negative fitness value in hydrolysate than in richmedia and are indicated by colored symbols. They are further classified based on their predicted function, as indicated in the legend. A single gene (ZMO1496), indicatedby a black circle, was found to be detrimental for growth in plant hydrolysate. (B) Subset of average gene fitness data from Figure 2, showing only the fitness datafor the 44 tolerance genes. The 37 hydrolysate components are indicated by red text. Arrows indicate the baseline condition without any added inhibitors (rich media), orrich media supplemented with DMSO (DMSO) or plant hydrolysate (hydrolysate). Gene fitness values are colored according to the color bar at the top right of the heatmap. Each tolerance gene on the X axis is labeled by its systematic gene name (ZMOxxxx) and the clustering is colored based on predicted functional classes, as in (A).Tolerance genes were clustered by Euclidean distance, and conditions were clustered as in Figure 2.
Dissecting plant hydrolysate stressJM Skerker et al
& 2013 EMBO and Macmillan Publishers Limited Molecular Systems Biology 2013 7

(Giaever et al, 2002). First, we profiled the S. cerevisiaehomozygous deletion library (as a pool) in the presence ofbatch 1 hydrolysate. To identify the putative tolerance genes inS. cerevisiae, we searched for mutants with a significant fitnessdefect in rich media (YPD) supplemented with hydrolysate,but not in the rich media baseline condition. Using the sameselection criterion as for Z. mobilis (fitnesshydrolysate o� 1 andfitnesshydrolysateofitnessrich � 1), we identified 99 yeasthydrolysate tolerance genes. As in Z. mobilis, the S. cerevisiaetolerance genes represent a variety of functional categories andpathways, including 12 regulatory genes, 12 amino-acidbiosynthesis genes, 4 pentose phosphate pathway genes, 15
membrane/secretion-related genes, and 5 oxidant-inducedcell-cycle arrest (OCA) genes (Table II; SupplementaryFigure 13; Supplementary Dataset 3). The overlap withthe Z. mobilis tolerance genes was just two genes involvedin amino-acid biosynthesis (see Discussion).
We then examined the effects of SYN-10 and SYN-37 onS. cerevisiae growth. In contrast to Z. mobilis, we found theprimary effect of either synthetic or genuine hydrolysates wasan increase in the length of lag phase rather than a reduction ingrowth rate. SYN-10 and SYN-37 increased the length of lagphase less than batch 1 or batch 2 hydrolysate did(Supplementary Figure 11B; Po10�15, ANOVA). To examinethis difference in detail, we profiled the S. cerevisiae mutantpool in SYN-10 and SYN-37 (Figure 4C; SupplementaryFigure 12C). The fitness profiles of SYN-10 and SYN-37 arehighly similar (Figure 4D; Supplementary Figure 12D,R2¼0.860) consistent with their similar effects on lag phaselength. Similarly to Z. mobilis, a plot of average fitness in SYN-37 versus average fitness in batch 1 hydrolysate uncovered 20outliers among our set of 99 tolerance genes (fitnesshydrolysate
o� 1 and fitnessSYN-374�1/3) that have significant fitnessdefects in real hydrolysate but not in SYN-37 (listed on plot inFigure 4C).
Taken together, our results demonstrate that in both bacteriaand yeast, synthetic hydrolysate mixtures of up to 37compounds do not fully recapitulate the fitness effects of realhydrolysate, strongly suggesting that we are missing criticalinhibitors from our synthetic mixtures. Consistent with ourfitness data, there are many unidentified peaks in ourhydrolysate GC/MS chromatograms. Prioritizing which peaksto study further using analytical chemistry is difficult withoutadditional knowledge regarding the potential contribution ofeach peak to overall hydrolysate toxicity. To address thisproblem, we used chemogenomic profiling of our 37 knownhydrolysate components and a computational model to searchfor key missing inhibitors.
Modeling Z. mobilis hydrolysate fitness andidentification of methylglyoxal as a previouslyunknown hydrolysate component
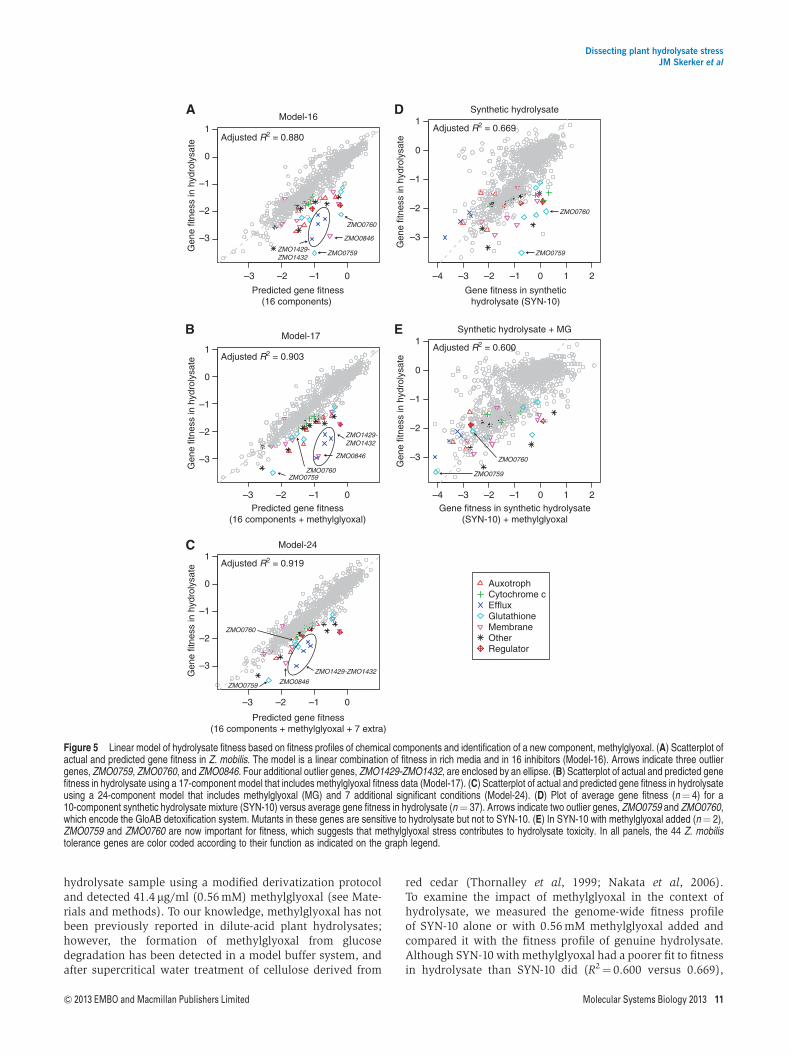
Using the Z. mobilis fitness data for the 37 compounds, we firstmodeled average gene fitness in hydrolysate as a linearcombination of its fitness in each component. Our modelincluded fitness in the baseline condition (rich media) and inthe 16 (of 37 tested) components that significantly improvedthe fit. The full linear model, including the list of components,can be found in Supplementary Table 7. Our model (Model-16)correlates well with fitness in hydrolysate (R2¼0.880,Figure 5A). This is as good a fit as we obtained withexperimental fitness data from SYN-37 (R2¼0.810,Figure 4A). To test for possible synergistic effects of inhibitors,we also tested a model that included non-linear interactions.We identified three significant pairs (see Materials andmethods): formic acid� levulinic acid (Po10�13),furfural� 4-hydroxyphenylacetic acid (Po10�15), andfurfural� vanillin (Po10� 5). Adding these terms to our linearmodel makes relatively little difference overall (adjusted R2
rises from 0.880 to 0.893). Unlike previous growth and
Table I Table of 44 Z. mobilis hydrolysate tolerance genes identified in this study
Gene Class Annotation
ZMO0003 auxo Adenylylsulfate kinaseZMO0007 auxo Phosphoadenosine phosphosulfate reductaseZMO0008 auxo Sulfite reductase subunit betaZMO0009 auxo Sulfite reductase subunit alphaZMO0100 reg Transcriptional regulator, HxlR familyZMO0101 mem NAD-dependent epimerase/dehydrataseZMO0192 mem Peptidase M48 Ste24pZMO0200 auxo Anthranilate phosphoribosyltransferaseZMO0201 auxo Glutamine amidotransferase of anthranilate
synthaseZMO0418 other Hypothetical proteinZMO0429 other Iron-sulfur cluster assembly accessory proteinZMO0468 auxo Anthranilate synthase component IZMO0472 other rpsU-divergently transcribed proteinZMO0483 auxo Homoserine dehydrogenaseZMO0675 other Transcriptional regulator, LysR familyZMO0759 glt Hydroxyacylglutathione hydrolaseZMO0760 glt Glyoxalase/bleomycin resistance protein/
dioxygenaseZMO0763 other Tetratricopeptide domain proteinZMO0774 reg Transcriptional regulator, LysR familyZMO0846 mem Sodium/hydrogen exchangerZMO0975 mem Conserved hypothetical membrane spanning
proteinZMO1067 other Fe-S metabolism-associated SufEZMO1136 cytc Cytochrome c peroxidaseZMO1221 other Hypothetical proteinZMO1252 cytc Cytochrome c biogenesis factor-like proteinZMO1253 cytc Cytochrome c biogenesis proteinZMO1255 cytc Cytochrome c assembly proteinZMO1389 cytc Cytochrome c biogenesis protein transmembrane
regionZMO1391 mem Diacylglycerol kinase catalytic regionZMO1404 reg RNA polymerase, sigma-24 subunit, ECF subfamilyZMO1429 eff RND efflux system, outer membrane lipoprotein,
NodT familyZMO1430 eff Efflux transporter, RND family, MFP subunitZMO1431 eff Hypothetical proteinZMO1432 eff Fusaric acid resistance protein conserved regionZMO1490 mem Hypothetical proteinZMO1520 other Hypothetical proteinZMO1541 other Ferrous iron transport protein BZMO1590 mem ABC transporter related proteinZMO1659 other ATP-dependent metalloprotease FtsHZMO1715 mem Biopolymer transport protein ExbD/TolRZMO1722 glt S-(hydroxymethyl)glutathione dehydrogenase/
class III alcohol dehydrogenaseZMO1723 glt Hypothetical proteinZMO1874 glt BolA family proteinZMO1875 glt Hypothetical protein
Systematic gene names, their functional class, and annotation are listed.Functional classes are auxo (auxotroph), cytc (cytochrome c), eff (efflux), glt(glutathione related), mem (membrane), other (other), and reg (regulator).Annotations were obtained from RefSeq (http://www.ncbi.nlm.nih.gov/RefSeq/).
Dissecting plant hydrolysate stressJM Skerker et al
8 Molecular Systems Biology 2013 & 2013 EMBO and Macmillan Publishers Limited

fermentation studies that have documented synergisticinhibitor combinations (Zaldivar and Ingram, 1999; Zaldivaret al, 1999; Oliva et al, 2004), our modeling suggeststhat fitness effects of hydrolysate are primarily additive(see Discussion).
Our linear model does not fully explain the fitness profile ofreal hydrolysates. There are still several outliers where thefitness defect of the mutant predicted by our model is not assevere as observed in the real hydrolysate (Figure 5A). Two ofthese outliers (ZMO0760-ZMO0759) form an operon thatencodes a putative GloAB glutathione-dependent enzymesystem, which is required for detoxification of methylglyoxal(or other 2-oxoaldehydes) in a wide variety of organisms(Ozyamak et al, 2010). Typically, methylglyoxal is formed
during unbalanced metabolism (Freedberg et al, 1971), whichsuggests that growth on hydrolysate leads to a methylglyoxalstress that is detoxified by the GloAB system. However, theZ. mobilis genome appears to lack a methyglyoxal synthasegene; thus, it is not clear why Z. mobilis needs a GloAB enzymesystem or whether significant amounts of methyglyoxal can beformed intracellularly during unbalanced metabolism. Theother outliers in our model encode a predicted efflux pumpof unknown function (ZMO1429-ZMO1432) and a sodium/hydrogen exchanger (ZMO0846) (Figure 5A). ZMO0846 is amember of the KefB superfamily and may play a role in pHregulation. The presence of these outliers together with gloABstrongly suggests that we are missing critical hydrolysatecomponents.
SY
N-37
SY
N-10
Hydrolysate
No inhibitor (Y
PD
)
ZR
MG
99 S. cerevisiaetolerancegenes
Gene fitness in synthetic hydrolysate (SYN-37)
Gene fitness in synthetic hydrolysate (SYN-37)
Gen
e fit
ness
in h
ydro
lysa
te
R2 = 0.810
R2 = 0.522
Z. mobilis
S. cerevisiae
SY
N-37
SY
N-10
Hydrolysate
No inhibitor (Z
RM
G)
DM
SO
Gene fitness
Gene fitness
ZMO0100ZMO0101ZMO0192ZMO0760ZMO1252ZMO1490ZMO1590ZMO1722ZMO1723
44 Z. mobilistolerancegenes
AuxotrophCytochrome cEffluxGlutathioneMembraneOtherRegulator
Gen
e fit
ness
in h
ydro
lysa
te
YDR008CCDC26 CSG2CYS3ERG2 ERG5GSH1GTR1GTR2GYP1
HOM3IML2 LDB19 NBP2SUR1TAL1TRP3TRP5TSC3VPS75
Amino-acid biosynthesisPentose phosphate pathwayMembrane/secretionRegulatoryOCAOther
Figure 4 Synthetic hydrolysate mixtures do not fully explain the fitness profile of real hydrolysate. Two synthetic hydrolysate mixtures containing either 37 components(SYN-37) or the 10 most abundant components (SYN-10) were made based on the composition of miscanthus batch 1 (Supplementary Table 1). Data for SYN-10 areshown in Supplementary Figure 12. (A) Scatterplot of Z. mobilis gene fitness data in SYN-37 (average of 4 experiments) versus in hydrolysate (average of37 experiments). The 44 Z. mobilis tolerance genes are color coded by category. Nine outlier genes (defined by two dashed black lines) have more negative gene fitnessvalues in hydrolysate than in SYN-37, and are listed in a black box and color coded by category. (B) Heatmap of gene fitness data for the 44 Z. mobilis tolerance genes.Genes were clustered by Euclidean distance with complete linkage using all non-averaged fitness data. Fitness values are colored according to the color bar.The baseline conditions are rich media (ZRMG) and rich media supplemented with DMSO (DMSO). (C) Scatterplot of S. cerevisiae gene fitness data in SYN-37 (averageof 6 experiments) versus in batch 1 miscanthus hydrolysate (average of 6 experiments). In all, 99 putative tolerance genes are color coded according to their function asindicated on the graph legend. Twenty of these genes are outliers (defined by two dashed black lines) and have more negative fitness values in hydrolysate than inSYN-37. Outlier genes are listed in a black box and color coded according to the legend. (D) Heatmap of gene fitness data for the 99 S. cerevisiae tolerance genes.Genes were clustered as in (B). Fitness values are colored according to the color bar. Two baseline conditions are shown: YPD is the rich media used for S. cerevisiaegrowth (n¼ 3) and ZRMG is the rich media used for Z. mobilis growth that was also used to prepare the SYN-10 and SYN-37 synthetic hydrolysate mixtures (n¼ 2,see Materials and methods).
Dissecting plant hydrolysate stressJM Skerker et al
& 2013 EMBO and Macmillan Publishers Limited Molecular Systems Biology 2013 9

To investigate this, we obtained fitness profiles in methyl-glyoxal and a number of additional compounds and stressconditions that might result from hydrolysate exposure or fromunbalanced metabolism (Supplementary Table 5). For exam-ple, furfural is known to induce the formation of reactiveoxygen species (ROS) (Allen et al, 2010), so we tested two typesof oxidative stress (hydrogen peroxide and sodium hypochlor-ite). Glycolaldehyde was recently reported to be a newcomponent of hydrolysate, so we added this to our list ofconditions (Jayakody et al, 2011). In total, we performedZ. mobilis pooled fitness assays in 11 additional conditions,including salt stress (KCl, NaCl), oxidative stress (hydrogenperoxide, sodium hypochlorite), glycerol, acetaldehyde,methylglyoxal, glycolaldehyde, and organic acids (acetic,formic, levulinic) at pH 6 to match the pH of our hydrolysate.The fitness data for these additional conditions are included inFigure 2 and 3B and Supplementary Dataset 1. Addingmethylglyoxal to the regression significantly improved the fit(adjusted R2¼0.903, Po10�15, ANOVA) and explained thetwo outliers in the GloAB system (Model-17 in Figure 5B andSupplementary Table 7). Adding all of the extra components,but removing insignificant ones, further improved the adjustedR2 to 0.919 (Model-24 in Figure 5C and SupplementaryTable 7). In Model-24, the biggest improved prediction wasfor ZMO0846, which tends to be sensitive to organic acids atpH 6 but not in our unbuffered organic acid experiments(Figure 3B), consistent with its predicted role in pH regulation.
Our modeling results suggested that methylglyoxal might bepresent in our plant hydrolysates. We reanalyzed our batch 2
Table II Table of 99 S. cerevisiae hydrolysate tolerance genes identified in thisstudy
Class ORF Gene
AA biosynthesis YDR127W ARO1AA biosynthesis YGL148W ARO2AA biosynthesis YPR060C ARO7AA biosynthesis YAL012W CYS3AA biosynthesis YJL101C GSH1AA biosynthesis YDR158W HOM2AA biosynthesis YER052C HOM3AA biosynthesis YJR139C HOM6AA biosynthesis YER086W ILV1AA biosynthesis YCR053W THR4AA biosynthesis YKL211C TRP3AA biosynthesis YGL026C TRP5Membrane YBR036C CSG2Membrane YLR436C ECM30Membrane YMR202W ERG2Membrane YGL012W ERG4Membrane YMR015C ERG5Membrane YPL057C SUR1Membrane YBR058C-A TSC3OCA YNL099C OCA1OCA YNL056W OCA2OCA YCR095C OCA4OCA YHL029C OCA5OCA YDR067C OCA6Other YLR338W OPI9Other YDR136C VPS61Other YLR261C VPS63Other YNL148C ALF1Other YML035C AMD1Other YGL105W ARC1Other YHR013C ARD1Other YBR068C BAP2Other YPL161C BEM4Other YFL023W BUD27Other YFR036W CDC26Other YPL241C CIN2Other YGR092W DBF2Other YFL001W DEG1Other YMR126C DLT1Other YDL172C DubiousOther YJL120W DubiousOther YDR048C DubiousOther YML122C DubiousOther YDR008C DubiousOther YDL050C DubiousOther YDR125C ECM18Other YGL168W HUR1Other YJL082W IML2Other YOL081W IRA2Other YOR322C LDB19Other YDL051W LHP1Other YDR378C LSM6Other YNL147W LSM7Other YBR255W MTC4Other YDL040C NAT1Other YOR209C NPT1Other YDR360W OPI7Other YDL173W PAR32Other YHR071W PCL5Other YGR240C PFK1Other YGR233C PHO81Other YPR153W Putative proteinOther YDR529C QCR7Other YMR283C RIT1Other YJR063W RPA12Other YOL138C RTC1Other YGL100W SEH1Other YOR035C SHE4Other YNL032W SIW14Other YCR033W SNT1Other YMR304W UBP15Other YKR020W VPS51
Table II (Continued )
Class ORF Gene
Other YNL246W VPS75Other YML097C VPS9Other YNL107W YAF9PPP YJL121C RPE1PPP YLR354C TAL1PPP YPR074C TKL1PPP YNL241C ZWF1Regulatory YPL202C AFT2Regulatory YDR173C ARG82Regulatory YIR023W DAL81Regulatory YOL051W GAL11Regulatory YGR163W GTR2Regulatory YOL012C HTZ1Regulatory YDR162C NBP2Regulatory YDR195W REF2Regulatory YDR028C REG1Regulatory YDL020C RPN4Regulatory YHR178W STB5Regulatory YML007W YAP1Secretion YGL054C ERV14Secretion YML121W GTR1Secretion YOR070C GYP1Secretion YDR137W RGP1Secretion YLR039C RIC1Secretion YMR183C SSO2Secretion YOL018C TLG2Secretion YLR262C YPT6
Functional class (Class), systematic gene name (ORF), and gene name (Gene)are listed. The six broad functional classes are AA biosynthesis (amino-acidbiosynthesis), membrane, secretion, OCA (Oxidant-induced Cell-cycle Arrest),PPP (pentose phosphate pathway), and regulatory. These classes are based onGO annotations obtained from the Saccharomyces Genome Database (http://www.yeastgenome.org). See Supplementary Dataset 2 for detailed annotations.
Dissecting plant hydrolysate stressJM Skerker et al
10 Molecular Systems Biology 2013 & 2013 EMBO and Macmillan Publishers Limited
hydrolysate sample using a modified derivatization protocoland detected 41.4 mg/ml (0.56 mM) methylglyoxal (see Mate-rials and methods). To our knowledge, methylglyoxal has notbeen previously reported in dilute-acid plant hydrolysates;however, the formation of methylglyoxal from glucosedegradation has been detected in a model buffer system, andafter supercritical water treatment of cellulose derived from
red cedar (Thornalley et al, 1999; Nakata et al, 2006).To examine the impact of methylglyoxal in the context ofhydrolysate, we measured the genome-wide fitness profileof SYN-10 alone or with 0.56 mM methylglyoxal added andcompared it with the fitness profile of genuine hydrolysate.Although SYN-10 with methylglyoxal had a poorer fit to fitnessin hydrolysate than SYN-10 did (R2¼ 0.600 versus 0.669),
AuxotrophCytochrome cEffluxGlutathioneMembraneOtherRegulator
Predicted gene fitness(16 components)
Gene fitness in synthetichydrolysate (SYN-10)
Gene fitness in synthetic hydrolysate(SYN-10) + methylglyoxal
Model-16
Model-17
Predicted gene fitness(16 components + methylglyoxal)
Model-24
Predicted gene fitness(16 components + methylglyoxal + 7 extra)
Gen
e fit
ness
in h
ydro
lysa
te
ZMO0759
ZMO0760
ZMO0846
ZMO0759ZMO0760
ZMO0846
ZMO0846
ZMO1429-ZMO1432
Synthetic hydrolysate
Gen
e fit
ness
in h
ydro
lysa
te
Synthetic hydrolysate + MG
Gen
e fit
ness
in h
ydro
lysa
te
ZMO0759
ZMO0760
ZMO1429-ZMO1432
ZMO1429-ZMO1432
ZMO0759
ZMO0760
ZMO0759
Adjusted R2 = 0.8801
0
0
–1
–1
–2
–2
–3
–3
1
0
0 1 2
–1
–1
–2
–2
–3
–3–4
1
0
0
–1
–1
–2
–2
–3
–3
1
0
0
–1
–1
–2
–2
–3
–3
1
0
0 1 2
–1
–1
–2
–2
–3
–3–4
Adjusted R2 = 0.903
Adjusted R2 = 0.919
Adjusted R2 = 0.669
Adjusted R2 = 0.600
ZMO0760
Gen
e fit
ness
in h
ydro
lysa
teG
ene
fitne
ss in
hyd
roly
sate
Figure 5 Linear model of hydrolysate fitness based on fitness profiles of chemical components and identification of a new component, methylglyoxal. (A) Scatterplot ofactual and predicted gene fitness in Z. mobilis. The model is a linear combination of fitness in rich media and in 16 inhibitors (Model-16). Arrows indicate three outliergenes, ZMO0759, ZMO0760, and ZMO0846. Four additional outlier genes, ZMO1429-ZMO1432, are enclosed by an ellipse. (B) Scatterplot of actual and predicted genefitness in hydrolysate using a 17-component model that includes methylglyoxal fitness data (Model-17). (C) Scatterplot of actual and predicted gene fitness in hydrolysateusing a 24-component model that includes methylglyoxal (MG) and 7 additional significant conditions (Model-24). (D) Plot of average gene fitness (n¼ 4) for a10-component synthetic hydrolysate mixture (SYN-10) versus average gene fitness in hydrolysate (n¼ 37). Arrows indicate two outlier genes, ZMO0759 and ZMO0760,which encode the GloAB detoxification system. Mutants in these genes are sensitive to hydrolysate but not to SYN-10. (E) In SYN-10 with methylglyoxal added (n¼ 2),ZMO0759 and ZMO0760 are now important for fitness, which suggests that methylglyoxal stress contributes to hydrolysate toxicity. In all panels, the 44 Z. mobilistolerance genes are color coded according to their function as indicated on the graph legend.
Dissecting plant hydrolysate stressJM Skerker et al
& 2013 EMBO and Macmillan Publishers Limited Molecular Systems Biology 2013 11
the addition of methylglyoxal recapitulated the fitness defectsof the gloAB operon (ZMO0759 and ZMO0760, comparearrows in Figure 5D and E). This suggests that ZMO0759and ZMO0760 are important for growth in real hydrolysatebecause they are directly involved in methylglyoxal detox-ification. Finally, we tested the effect of 0.56 mM methyl-glyoxal on the growth of wild-type Z. mobilis and found thataddition of this hydrolysate-relevant concentration resulted ina small, but significant growth defect (SupplementaryFigure 18, unpaired t-test, Po10� 5). In sum, we used ourmodeling, fitness, and growth experiments to identify methyl-glyoxal as a previously unknown component of hydrolysateand to demonstrate that it contributes to overall hydrolysatetoxicity in Z. mobilis.
Rational engineering of Z. mobilis for improvedfermentation performance
We hypothesized that overexpression of putative tolerancegenes in Z. mobilis might improve its growth and ethanolproduction in hydrolysate. To test this idea, we systematicallyoverexpressed 21 tolerance genes (Supplementary Table 6),which were selected because they represented examples of thevarious functional classes we identified. These genes wereoverexpressed using an arabinose inducible Pbad promoter anda broad host plasmid system that we developed for thispurpose (Supplementary Figure 14). Each tolerance gene wastagged with an N-terminal FLAG tag (DDDDYDK) that allowedus to examine relative protein levels by western blot. We firstscreened our overexpression strains for the correct molecularweight proteins and lack of significant protein degradation(Supplementary Figure 15). Based on these data, and on ourprior verification of their negative fitness phenotypes, weselected 10 transposon mutant strains for complementationstudies (Supplementary Table 6). For these experiments, weasked whether each Pbad expression construct was sufficient tocomplement the fitness defect of the corresponding transposonmutant (e.g., see Supplementary Figure 10). Based
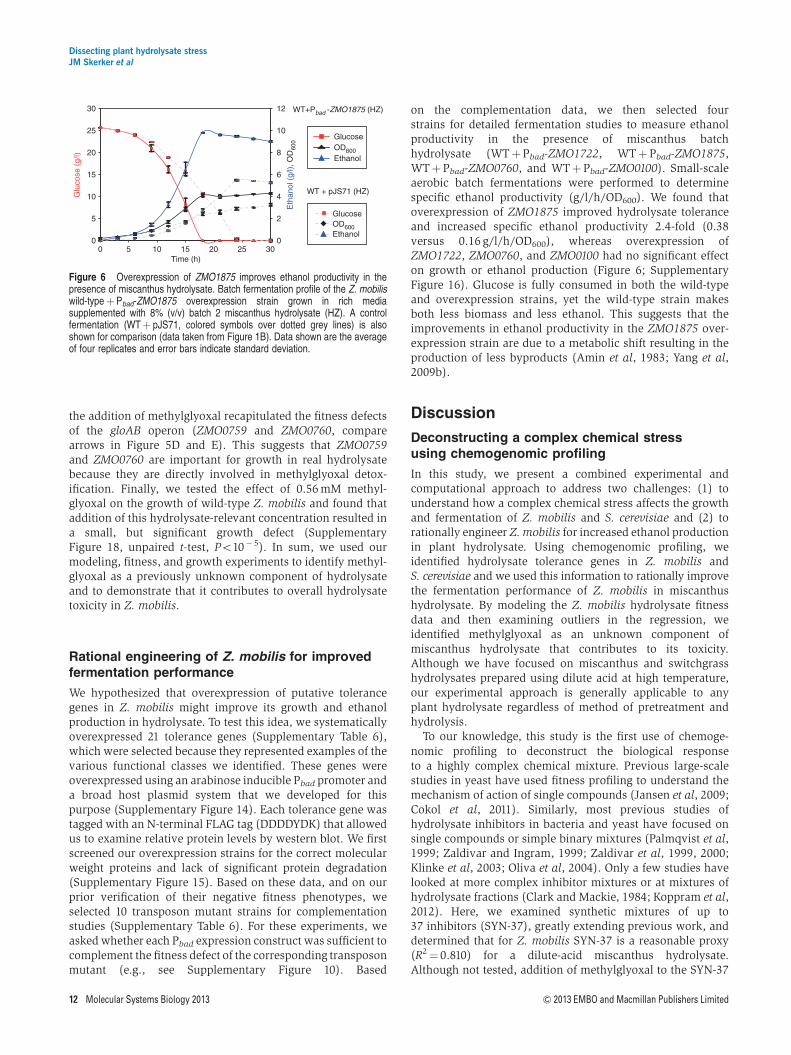
on the complementation data, we then selected fourstrains for detailed fermentation studies to measure ethanolproductivity in the presence of miscanthus batchhydrolysate (WTþPbad-ZMO1722, WTþ Pbad-ZMO1875,WTþPbad-ZMO0760, and WTþ Pbad-ZMO0100). Small-scaleaerobic batch fermentations were performed to determinespecific ethanol productivity (g/l/h/OD600). We found thatoverexpression of ZMO1875 improved hydrolysate toleranceand increased specific ethanol productivity 2.4-fold (0.38versus 0.16 g/l/h/OD600), whereas overexpression ofZMO1722, ZMO0760, and ZMO0100 had no significant effecton growth or ethanol production (Figure 6; SupplementaryFigure 16). Glucose is fully consumed in both the wild-typeand overexpression strains, yet the wild-type strain makesboth less biomass and less ethanol. This suggests that theimprovements in ethanol productivity in the ZMO1875 over-expression strain are due to a metabolic shift resulting in theproduction of less byproducts (Amin et al, 1983; Yang et al,2009b).
Discussion
Deconstructing a complex chemical stressusing chemogenomic profiling
In this study, we present a combined experimental andcomputational approach to address two challenges: (1) tounderstand how a complex chemical stress affects the growthand fermentation of Z. mobilis and S. cerevisiae and (2) torationally engineer Z. mobilis for increased ethanol productionin plant hydrolysate. Using chemogenomic profiling, weidentified hydrolysate tolerance genes in Z. mobilis andS. cerevisiae and we used this information to rationally improvethe fermentation performance of Z. mobilis in miscanthushydrolysate. By modeling the Z. mobilis hydrolysate fitnessdata and then examining outliers in the regression, weidentified methylglyoxal as an unknown component ofmiscanthus hydrolysate that contributes to its toxicity.Although we have focused on miscanthus and switchgrasshydrolysates prepared using dilute acid at high temperature,our experimental approach is generally applicable to anyplant hydrolysate regardless of method of pretreatment andhydrolysis.
To our knowledge, this study is the first use of chemoge-nomic profiling to deconstruct the biological responseto a highly complex chemical mixture. Previous large-scalestudies in yeast have used fitness profiling to understand themechanism of action of single compounds (Jansen et al, 2009;Cokol et al, 2011). Similarly, most previous studies ofhydrolysate inhibitors in bacteria and yeast have focused onsingle compounds or simple binary mixtures (Palmqvist et al,1999; Zaldivar and Ingram, 1999; Zaldivar et al, 1999, 2000;Klinke et al, 2003; Oliva et al, 2004). Only a few studies havelooked at more complex inhibitor mixtures or at mixtures ofhydrolysate fractions (Clark and Mackie, 1984; Koppram et al,2012). Here, we examined synthetic mixtures of up to37 inhibitors (SYN-37), greatly extending previous work, anddetermined that for Z. mobilis SYN-37 is a reasonable proxy(R2¼0.810) for a dilute-acid miscanthus hydrolysate.Although not tested, addition of methylglyoxal to the SYN-37
WT + pJS71 (HZ)
WT+Pbad -ZMO1875 (HZ)
Glu
cose
(g/
l)
Eth
anol
(g/
l), O
D60
0
Time (h)
GlucoseOD600Ethanol
GlucoseOD600Ethanol
0
2
4
6
8
10
12
0
5
10
15
20
25
30
300 5 10 15 20 25
Figure 6 Overexpression of ZMO1875 improves ethanol productivity in thepresence of miscanthus hydrolysate. Batch fermentation profile of the Z. mobiliswild-typeþ Pbad-ZMO1875 overexpression strain grown in rich mediasupplemented with 8% (v/v) batch 2 miscanthus hydrolysate (HZ). A controlfermentation (WTþ pJS71, colored symbols over dotted grey lines) is alsoshown for comparison (data taken from Figure 1B). Data shown are the averageof four replicates and error bars indicate standard deviation.
Dissecting plant hydrolysate stressJM Skerker et al
12 Molecular Systems Biology 2013 & 2013 EMBO and Macmillan Publishers Limited

mixture might further improve this correlation. Our Model-17results (adjusted R2¼ 0.903) suggest that it may be possible torecapitulate the biological effects of hydrolysate with a mixtureof only 17 compounds. Thus, our work provides a goodstarting point for developing new synthetic hydrolysatemixtures that mimic the real material and for enabling therational engineering of hydrolysate tolerance.
Because our high-throughput fitness protocols were devel-oped for aerobic conditions, most of the experiments in thisstudy were performed in the presence of oxygen. However, werecognize that most industrial biofuel fermentations will likelybe microaerobic or anaerobic; therefore, we performedanaerobic hydrolysate experiments in Z. mobilis to determinewhether the tolerance genes we identified in this study can beused to engineer tolerance under these growth conditions.Using the same criterion for identifying aerobic tolerance genes(fitnesshydrolysate o� 1 and fitnesshydrolysateofitnessrich � 1),we identified 11 genes that are important for growth inanaerobic hydrolysate (Supplementary Figure 17). Four ofthese genes were found in our aerobic studies (ZMO0100-ZMO0101, ZMO0759, and ZMO1490). In addition to these fourgenes, we identified seven new anaerobic tolerance genes(ZMO1015, ZMO1016, ZMO1017, ZMO1018, ZMO1355,ZMO1548, and ZMO1556), which provide a basis for futureengineering of anaerobic hydrolysate tolerance. These resultsemphasize the need to match laboratory hydrolysate tolerancestudies with the specific growth and environmental conditionsof an industrial-scale cellulosic biofuel process. However, ourapproach for dissecting a complex chemical stress is general,and by collecting fitness data for the 37 components underanaerobic conditions, it should be possible to model anaerobichydrolysate stress.
Mechanisms of hydrolysate tolerance inZ. mobilis and S. cerevisiae
In both Z. mobilis and S. cerevisiae, we identified severalbroad categories of gene functions required for hydrolysatetolerance. We also identified many genes of unknownfunction, or unrelated to any previously known tolerancemechanism, demonstrating that our experimental approach isa rich source of new knowledge for understanding thebiological response to a complex chemical stress. Of the 44tolerance genes we identified in Z. mobilis, only 1 (ZMO1432)has previously been reported in the patent WO 2012/082711 A1(Caimi and Hitz, 2012). In this patent, they identified a pointmutation in ZMO1432 after evolving Z. mobilis for improvedfermentation performance in hydrolysate. ZMO1432 is partof a four gene operon (ZMO1429-ZMO1432) that encodes apredicted efflux pump. In our study, we identified transposoninsertions in all four of these genes as sensitive to hydrolysate,which suggests that efflux of inhibitory compounds is animportant mechanism for hydrolysate tolerance. Upregulationof efflux pump genes has recently been reported in atranscriptome study of E. coli growth in corn stover hydro-lysate (Schwalbach et al, 2012). In S. cerevisiae, only 9 of 99tolerance genes that we identified were previously reported insingle inhibitor or hydrolysate tolerance studies (BAP2, ERG2,GTR2, LSM6, RPN4, TAL1, TKL1, YAP1, and ZWF1) (Jeppsson
et al, 2003; Gorsich et al, 2006; Kawahata et al, 2006; Ma andLiu, 2010; Sundstrom et al, 2010; Liu, 2011; Pereira et al, 2011;Sanda et al, 2011; Gao and Xia, 2012; Hueso et al, 2012).Broadly, there is little overlap in the genes we identifiedwith previous tolerance studies in Z. mobilis, E. coli, andS. cerevisiae (Petersson et al, 2006; Almeida et al, 2007; Milleret al, 2009b, 2010; Yang et al, 2010a, b; Parawira and Tekere,2011; Drobna et al, 2012), which likely reflects the underlyinggenetic complexity of tolerance, the different experimentalprotocols used for tolerance gene identification, and thedifferent plant feedstocks and methods used for hydrolysatepreparation. However, despite these differences, we dididentify genes in two pathways (oxidative stress responseand amino-acid biosynthesis) that overlap with previousstudies, which suggest a fundamental role for these pathwaysin hydrolysate tolerance in bacteria and yeast (Miller et al,2009a; Allen et al, 2010; Warner et al, 2010). In addition,our work in Z. mobilis has uncovered genes involved insulfate assimilation and iron-sulfur (Fe-S) cluster assemblyand repair that represent new potential gene targets for strainengineering.
Oxidative stress response
In both Z. mobilis and S. cerevisiae, we identified tolerancegenes involved in oxidative stress response, which suggeststhat growth in hydrolysate induces the intracellular formationof ROS, which includes hydrogen peroxide, superoxide anion,and hydroxyl radicals. Although not tested, these ROS are notlikely to be present in our plant hydrolysates due to theirchemical instability. Furfural, which is an abundant compo-nent of plant hydrolysates, can induce the formation of ROS inS. cerevisiae, and provides a direct link between oxidativestress and hydrolysate toxicity (Allen et al, 2010). In ourZ. mobilis gene fitness data, we identified CCP (ZMO1136),and a number of genes involved in cytochrome c biogenesis(ZMO1252, ZMO1253, ZMO1255, and ZMO1389) that areimportant for growth in hydrolysate. CCP converts hydrogenperoxide to water (Mishra and Imlay, 2012), and likely has adirect role in hydrolysate tolerance by reducing the levels ofthis ROS. Consistent with previous studies of Z. mobilis CCP(Charoensuk et al, 2011), we find that mutants in ZMO1136 aresensitive to hydrogen peroxide (average fitness in richmedia¼ 0.003, average fitness in hydrogen peroxide¼ � 3.82,Supplementary Dataset 1). Previous work in E. coli identifiedthree genes involved in peroxide detoxification (ahpC, tpx, andbcp) that were important for growth in corn stover hydrolysate(Warner et al, 2010). In our S. cerevisiae hydrolysate fitnessdata, we identified YAP1, which is a known regulator of theoxidative stress response, including the response to peroxides(Veal et al, 2003; Drobna et al, 2012), and previously found tobe important for growth in 5-HMF, an abundant component ofhydrolysate (Ma and Liu, 2010). We also identified twotranscriptional targets (GSH1 and CYS3) of the YAP1 regulator(Nisamedtinov et al, 2011), further implicating the YAP1pathway. In addition, we identified five OCA genes (OCA1,OCA2, OCA4, OCA5, and OCA6) that are important for growthin hydrolysate, which are involved in the repair of lipids afteroxidative damage (Alic et al, 2001). Together, our data suggest
Dissecting plant hydrolysate stressJM Skerker et al
& 2013 EMBO and Macmillan Publishers Limited Molecular Systems Biology 2013 13

that in both bacteria and yeast, growth in hydrolysate leads tothe formation of intracellular peroxides and that peroxidedetoxification is an important mechanism of hydrolysatetolerance.
Amino-acid biosynthesis
We also implicated amino-acid biosynthesis as a mechanism ofhydrolysate tolerance in both Z. mobilis and S. cerevisiae. Wefound that both homoserine dehydrogenase (ZMO0483 orHOM6), which is required for methionine biosynthesis, andglutamine amidotransferase (ZMO0201 or TRP3), which isrequired for tryptophan biosynthesis, are important for growthin hydrolysate. In addition, we identified four tolerance genesinvolved in sulfate assimilation, which also suggests a role forcysteine biosynthesis in hydrolysate tolerance; although thispathway may play other roles in hydrolysate tolerance (seenext section). Our work is consistent with previous studies inE. coli which found that addition of cysteine and methionine tothe growth media helped alleviate furfural, acetic acid, andhydrolysate toxicity (Roe et al, 2002; Miller et al, 2009a; Nieveset al, 2011; Sandoval et al, 2011). In E. coli, reduction of furfuraldepletes NADPH, which limits sulfate assimilation by theNADPH-dependent enzyme sulfite reductase encoded by cysIJ.Acetate appears to block methionine biosynthesis downstreamof homocysteine, which leads to accumulation of this toxicintermediate (Roe et al, 2002). Our studies also suggest thataddition of methionine and cysteine might improve hydro-lysate tolerance; however, our fitness experiments wereconducted in rich media (ZRMG or YPD), which should havehigh levels of these amino acids, in contrast to previous studiesthat were conducted in minimal media (Nieves et al, 2011).It is not clear why we identified amino-acid biosynthesis genesin our rich media growth conditions, but the overlap withprevious studies strongly suggests a fundamental role foramino-acid biosynthesis in hydrolysate tolerance in bothbacteria and yeast.
Sulfate assimilation
Our fitness data in Z. mobilis also suggest that growth inhydrolysate induces ROS that lead to an increased demand forcysteine biosynthesis and for sulfide. We identified fourZ. mobilis auxotrophs in the sulfate assimilation pathway(ZMO0003, ZMO0007, ZMO0008, and ZMO0009) encodingCysC, CysH, CysI, and CysJ, respectively, which are needed forde novo cysteine biosynthesis and are important for growth inhydrolysate. In Salmonella typhimurium, the CysB regulon isinduced by oxidants, such as hydrogen peroxide or mena-dione, and cysCIJ mutants have reduced levels of glutathioneand induce an oxidative stress response (Turnbull and Surette,2010). Similarly, growth of Z. mobilis in hydrolysate may leadto reduced levels of glutathione, which is formed fromglutamate and cysteine; thus, this might explain the increaseddemand for cysteine. In addition, the sulfate assimilationpathway also functions to provide sulfur for assembly of Fe-Sclusters; thus, it is likely that this pathway has multiple roles inhydrolysate tolerance.
Fe-S clusters
Fe-S clusters are essential enzyme prosthetic groups that canbe damaged by ROS (Djaman, 2004). A number of pathwaysexist in E. coli for the repair of Fe-S clusters that have beendamaged by oxidative stress (Yang, 2002; Djaman, 2004;Bitoun et al, 2008). We identified four tolerance genes in Z.mobilis (ZMO0429, ZMO1067, ZMO1874, and ZMO1875) thatprovide a causal link between growth in hydrolysate,oxidative stress, and Fe-S clusters. In Z. mobilis, ZMO0429and ZMO1067 encode predicted Fe-S assembly proteins, andZMO1874 encodes a predicted BolA family member, which hasalso been linked to Fe-S cluster assembly (Li and Outten,2012); however, ZMO1875 has no predicted function.The fitness profiles of ZMO1067::TN5, ZMO1874::TN5,and ZMO1875::TN5 are similar and cluster together(Figure 3B), suggesting a shared function in Fe-S cluster repairand hydrolysate tolerance.
BolA family members have recently been shown to interactwith GrxD family monothiol glutaredoxins in both E. coli andS. cerevisiae (Huynen et al, 2005; Koch and Nybroe, 2006;Rouhier et al, 2010; Shakamuri et al, 2012). These complexesdirectly bind Fe-S clusters, and are thought to function inboth Fe-S cluster assembly and regulation of new Fe-Scluster synthesis (Kumanovics et al, 2008; Cameron et al,2011; Shakamuri et al, 2012; Willems et al, 2012). Consistentwith this role, ZMO1874 is in the same operon with a predictedmonothiol glutaredoxin (ZMO1873) and an Fe-S containingenzyme quinolinate synthetase (ZMO1871), which is involvedin NAD biosynthesis. The ZMO1874-ZMO1873 complexmay function to assemble Fe-S clusters in the quinolinatesynthetase enzyme, or regulate its activity.
ZMO1875 encodes a gene of unknown function (DUF1476),which, in this study, was used to improve ethanol productivityin the presence of hydrolysate. One recent study identified aDUF1476 protein that functions as an inhibitory subunit of theFoF1 ATP synthase complex (Morales-Rios et al, 2010). It is notclear how inhibiting ATP synthase would improve hydrolysatetolerance, and ATP synthase is not consistently detrimental tofitness in hydrolysate. Instead, we propose that ZMO1875functions together with BolA-GrxD like complexes inZ. mobilis (ZMO1874-ZMO1873) to assemble Fe-S clusters inthe enzyme quinolinate synthetase or to regulate the de novobiosynthesis of new Fe-S clusters, to replace those thathave been damaged by ROS. This is the first example, to ourknowledge, of targeting Fe-S cluster pathways for engineeringimproved hydrolysate tolerance.
Synergistic effects of inhibitors
Previous studies have explored synergistic interactionsbetween hydrolysate inhibitors, based on effects on growthand fermentation (Palmqvist et al, 1999; Zaldivar and Ingram,1999; Zaldivar et al, 1999, 2000). Some combinations ofcompounds inhibit growth or ethanol production more thanone would expect from the activity of the compoundsindividually. The mechanisms behind this synergistic inhibi-tion of growth are not well understood. More broadly,synergistic inhibition on growth appears to be common butnot predominant—a recent study found that 38 of 200 pairs of
Dissecting plant hydrolysate stressJM Skerker et al
14 Molecular Systems Biology 2013 & 2013 EMBO and Macmillan Publishers Limited

antifungal drugs synergistically inhibited the growth of S.cerevisiae (Cokol et al, 2011).
Here, we focused on a related but different question: doinhibitors have synergistic effects on a mutant’s growthrelative to wild type? We found that gene fitness on hydrolysatecan be modeled as a linear combination of gene fitnesson the individual compounds. Furthermore, although somegenes were important for fitness in plant hydrolysate withoutbeing important for fitness on any of the known components,these genes were not important for fitness in synthetichydrolysate mixtures, which suggests that they are importantfor resisting unidentified components. Similarly, we did notidentify any genes with much lower fitness in the definedmixtures SYN-10 or SYN-37 than in any of their components(the biggest reductions in fitness, relative to the minimum onthe components, were –1.1 and –0.6, respectively). Finally, weconsidered adding interaction terms of the form X�Y to ourregression. These would be necessary if combining inhibitorsconverts some mutants’ mild phenotypes into severe ones.Although we found interaction terms that were statisticallysignificant, adding them did not lead to a notable improvementin the fit of the model.
Implications for rational engineering ofhydrolysate tolerance
The success of our linear model for predicting hydrolysatefitness suggests that we can separately engineer tolerance toindividual components, and then combine these improve-ments into a single strain. The successful evolution of aS. cerevisiae strain for improved fermentation in spruce hydro-lysate by adaptation to a cocktail of 12 inhibitors is consistentwith our hypothesis that the biological response to hydrolysatecan be understood as the combination of responses to theindividual compounds (Koppram et al, 2012). A combinatorialengineering approach has already proved successful forimproving tolerance to a binary mixture of inhibitors(Sommer et al, 2010). In their study, they identified threegenes, recA, orfX, and udpE that conferred resistance to either2-furoic acid or syringaldehyde. When these three genes wereco-expressed, the combination conferred tolerance to themixture of both compounds. Based on these results and ourdata, we believe that a strain engineered for improvedtolerance to the main chemical classes found in hydrolysate,such as weak organic acids, phenolics, aldehydes, and furans,might be sufficient to confer tolerance to the full, complexchemical mixture present in real plant hydrolysates. Forexample, two well-known tolerance mechanisms, furfuralreduction and laccase detoxification of phenolics (Parawiraand Tekere, 2011) could be combined into a single strain forfurther improvements in hydrolysate tolerance. In addition,based on our work, this strain could be further engineeredby modifying pathways for peroxide detoxificationand Fe-S cluster repair. It is possible that complex epistaticrelationships exist between tolerance gene pathways, makingcombinatorial engineering more difficult (Sandoval et al,2012); however, to a first approximation our linear fitnessmodel and previous work (Wood et al, 2012) argues againstthis possibility.
Conclusions
In this study, we have shown that chemogenomic profiling andmodeling can be used to deconstruct a complex chemicalstress and that this information can be used to rationallyengineer a strain for improved fermentation in planthydrolysate. More broadly, our approach can be used to modelother complex stresses, such as the array of environmentalstresses (including product toxicity) encountered by microbesinside an industrial bioreactor (Gibson et al, 2007, 2008).Understanding how the production host deals with thiscomplex environmental stress has significant implicationsfor improving the yield and productivity of any industrial-scalefermentation process.
Materials and methods
Strains, media, plasmids, and primers
Bacterial strains, primers, and plasmids used in this study are listed inSupplementary Table 6. Zymomonas mobilis strain ZM4 obtained fromATCC (ATCC 31821) was the parent strain for our studies. E. coli strainsTOP10 (Invitrogen), NEB 5-alpha (New England Biolabs), andWM3064 (W. Metcalf, University of Illinois at Urbana-Champaign)were used as needed. Z. mobilis was cultured in ZRMG, ZymomonasRich Medium Glucose (25 g/l glucose, 10 g/l yeast extract, and2 g/l KH2PO4) or ZMMG, Zymomonas Minimal Medium Glucose(Goodman et al, 1982), and grown aerobically at 301C. Anaerobicgrowth was performed in sealed Hungate tubes after degassing mediawith nitrogen or on ZRMG agar plates in an anaerobic chamber (CoyLab Products). For Z. mobilis, plates or liquid media were supple-mented with 100mg/ml kanamycin, chloramphenicol, or spectinomy-cin as necessary. E. coli strains were grown in Luria-Bertani (LB) brothat 371C, supplemented with 30mg/ml kanamycin, 20 mg/ml chloram-phenicol, or 50mg/ml spectinomycin as needed. The S. cerevisiaehomozygous barcoded deletion mutant collection (Giaever et al, 2002)was a gift of Ron Davis (Stanford Genome Technology Center). Yeaststrains were grown aerobically at 301C in Difco Yeast Extract PeptoneDextrose (YPD) media.
Preparation and analysis of plant hydrolysates
A dilute-acid pretreatment method was used to release fermentablesugars from plant biomass. M. giganteus (miscanthus) and P. virgatum(switchgrass) were grown in Illinois at four different field sites:Brownstown (BTN), Fairfield (FRF), Havana (HAV), and Orr (ORR).‘Batch’ hydrolysates were prepared from a mixed miscanthus samplethat was derived from several field sites (Batch February 2009, EBISouth 2006 Season, obtained from UIUC). After harvesting, sampleswere air dried, processed with a SM 2000 cutting mill and a 2-mm sieve(Retsch, Haan, Germany), and then finally ground to pass a 120-mmsieve screen using a SR 200 rotor beater mill (Retsch). Pretreatmentand hydrolysis were performed in an Ethos Z microwave (MilestoneInc., Shelton, CT) equipped with six closed reaction vessels(each 100 ml in volume). In brief, each vessel contained 5 g groundmiscanthus and 45 g of 1% (w/w) sulfuric acid. The temperature wasincreased in 4 min to 1801C (in 4.5 min to 2001C for batch 1 and batch 2)and held for 2 min. The mixture was cooled in an ice bath to 951C,the vessels were opened and the contents rapidly transferred into abeaker and the mixture was further cooled to room temperature. Thesupernatant was collected after centrifugation (5000� g) and adjustedto pH 6.0 with KOH. Samples were filter sterilized, 10 ml aliquots wereflash frozen in a dry-ice ethanol bath, and stored at � 801C, protectedfrom light. Since the stability of compounds present in hydrolysate isunknown, hydrolysate aliquots used in pool and growth experimentswere thawed and used only once.
The supernatant was analyzed for soluble carbohydrates, organicacids and furans using an Agilent 1200 series liquid chromatographysystem (Agilent Technologies, Santa Clara, CA) equipped with a
Dissecting plant hydrolysate stressJM Skerker et al
& 2013 EMBO and Macmillan Publishers Limited Molecular Systems Biology 2013 15

refractive index detector and a diode-array detector. Samples wereinjected onto an Aminex HPX-87H column (Bio-Rad, Hercules, CA)and compounds were eluted at 501C and a flow rate of 0.6 ml/min by amobile phase consisting of 0.005 M sulfuric acid. For detection andquantification of methylglyoxal, 1 ml of the hydrolysate was mixedwith 0.5 ml of a solution of 1% orthophenylenediamine in 0.5 Msodium phosphate (pH 6.5). The mixture was incubated at roomtemperature in the dark for 16 h and then 5ml was injected onto aZorbax SB-C18 Rapid Resolution column (Agilent Technologies) andeluted at 401C by a gradient of solvent A (0.1% (v/v) formic acid)and solvent B (acetonitrile containing 0.1% (v/v) formic acid).The gradient program was: 5–50% B in 10 min, 50–90% B in 4 min,90–5% B in 1 min, then 3 min isocratic elution. Detection was at312 nm. A standard of methylglyoxal (40% solution, Sigma-Aldrich, St.Louis, MO) was derivatized in the same way and used to confirm theretention time and UV spectra. GC/MS was used for analysis ofphenolic compounds: to 1 ml of neutralized hydrolysate, 30ml of 72%sulfuric acid and 20ml of internal standard (iso-propylphenol, 1 mg/mlin 0.1% sodium hydroxide) were added. This mixture was vigorouslymixed three times each with 0.5 ml of ethyl acetate. After phaseseparation, the upper ethyl acetate layer was removed and collected.All ethyl acetate phases were combined and dried over sodium sulfate.An aliquot of the combined dried ethyl acetate phase (100ml) wasincubated with 50 ml of N,O-bis(trimethylsilyl)trifluoroacetamidecontaining 1% trimethylchlorosilane (Sigma-Aldrich) at 701C for30 min. In all, 1 ml was injected in splitless mode onto a VF5-MScapillary column (Varian, Palo Alto, CA). An Agilent 7890A gaschromatograph coupled to an Agilent 5975C single quadrupole massspectrometer with the following settings was used: injector tempera-ture 2801C, carrier gas: helium at 1 ml/min, temperature program:3 min isocratic 751C, 51C/min to 1501C, 0.51C/min to 1601C, 21C/minto 1901C, 51C/min to 2401C, 701C/min to 3251C, 3 min isocratic, ionswere detected by electron impact ionization (70 eV) in full scan modem/z 35–500. Compounds were identified by matching their massspectra with NIST database entries and by comparing their retentiontimes with commercially available standards (Sigma-Aldrich). Peakareas were quantified using selected extracted ions for the compoundsin internal standard calibration mode (m/z 193 for iso-propylphenol).We quantified 37 inhibitors and 4 sugars for each plant hydrolysatesample (Supplementary Table 1). Only batch 2 hydrolysate wasanalyzed for methylglyoxal.
Preparation and analysis of synthetic hydrolysatemixtures (SYN-37 and SYN-10)
Two synthetic hydrolysate mixtures were prepared containing the10 most abundant compounds (SYN-10) or the 37 most abundantcompounds (SYN-37) present in batch 1 miscanthus hydrolysate.SYN-37 also contained four sugars (xylose, glucose, arabinose, andcellobiose). All chemicals were purchased from Sigma-Aldrich. Eachmixture was prepared by mixing 1 M DMSO (or Milli-Q water) stocksolutions directly into 2� ZRMG media, and then the final solutionadjusted to 1� ZRMG with water and the pH was adjusted to 6.0 withKOH. Liquid chemicals such as furfural were added directly to themixture. SYN-37 and SYN-10 were analyzed by LC-RID and GC/MS todetermine their compositions (Supplementary Table 1). We found thatthe concentrations of vanillin, syringaldehyde, vanillic acid, and furoicacid in the SYN-10 mixture were higher than expected. For SYN-37,we found that benzoic acid and cellobiose were higher than the valuesin batch 1 hydrolysate. Despite these differences in composition,the fitness profiles of SYN-37 and SYN-10 are highly correlated (inZ. mobilis, R2¼0.81; in S. cerevisiae, R2¼0.86), and we chose to continueour studies with these mixtures. In addition, this high correlationimplies that the presence of three non-metabolizable sugars in SYN-37(xylose, arabinose, and cellobiose) versus SYN-10 (glucose only)had little effect on their genome-wide fitness profiles. Once made,the synthetic mixtures were flash frozen into 10 and 50 ml aliquots andstored at � 801C. These stock solutions were considered as 100% byvolume and used accordingly for both Z. mobilis and S. cerevisiaefitness and growth experiments. The final concentration of DMSO inSYN-37 was 0.16%. SYN-10 did not contain any DMSO. Thefitness profile of ZRMGþ 2% DMSO was measured as a control for
any possible effects of DMSO on fitness, but little effect was seen(e.g., Figure 4B).
Generation of a Z. mobilis barcoded transposonlibrary and chemogenomic profiling
Our laboratory has previously described detailed methods forTagModule construction, the generation of a genome-wide barcodedtransposon library, pooled fitness assays, data normalization andanalysis in Shewanella oneidensis MR-1 (Oh et al, 2010; Deutschbaueret al, 2011). The same methods were used to create a barcodedtransposon library in Z. mobilis, and perform fitness assays, witha few modifications. Each mutant in our Z. mobilis pool contains abarcoded transposon, which is a KanR Tn5 containing a TagModule(each TagModule contains two 20 bp DNA barcodes, called UPTAGand DNTAG). Briefly, to build the transposon mutant collection inZ. mobilis, we used a mini-Tn5 delivery system based on the suicideplasmid pRL27 (Larsen et al, 2002). Transposons were delivered intoZ. mobilis by plate mating and conjugation using E. coli WM3064.Kanamycin-resistant colonies were picked and mutants were stored at� 801C in 384-well plates. Gene disruptions were mapped using a two-step arbitrary PCR method previously described (Deutschbauer et al,2011), using the primers (Round 1: pRL27_IE_rev1þARB8, ARB11,Round 2: U2_compþARB2). A custom Perl program was designed totrack each transposon insertion and TagModule identity. Perl scriptsare available upon request. Z. mobilis gene annotations for themain chromosome and five plasmids (pZZM401-pZZM405) wereobtained from RefSeq (http://www.ncbi.nlm.nih.gov/RefSeq/) and arecent annotation paper (Yang et al, 2009a). Two Z. mobilis pools(up-pool and dn-pool; Supplementary Table 2) were designed using acustom Perl script that contained 7432 strains total and 6302 uniquestrains. These strains were cherry-picked from the 384-well platesusing a Biomek FxP Liquid Handling Robot (Beckman Instruments)into 96-well ‘pool plates’ and grown to saturation in ZRMGþ 100mg/ml kanamycin. In all, 25ml of each mutant was transferred and pooledtogether. The mixed pool was pelleted by centrifugation, andresuspended in fresh ZRMG mediaþ 10% glycerol. In all, 100 ml poolaliquots were made and frozen at � 80 1C.
For chemogenomic profiling, the up-pool and dn-pool wererecovered by thawing 100ml aliquots and inoculating into 10 ml ofZRMG. Cells were grown for 5 h, shaking at 301C, until they reached anOD600 of 0.5. These cultures called ‘START’ were used to initiatepool experiments, which were done either in 10 ml or in 24-wellplate format, starting at 0.02 OD600. Several concentrations of eachcondition were prescreened until a concentration that showed about50% inhibition was identified. A list of experiments, includingconcentrations used for each condition in the fitness data set, is foundin Supplementary Table 5. After growing the pool for about 5–7generations (typically to saturation), cell pellets were collected (called‘END’), and the genomic DNA was isolated (Qiagen DNeasy Kit orQiagen PureGene Kit). We PCR amplified the UPTAGs from the up-pooland DOWNTAGs from the dn-pool as previously described(Deutschbauer et al, 2011). These PCR products were combined andhybridized to an Affymetrix 16K TAG4 array, washed, and scanned aspreviously described (Pierce et al, 2006). The abundance of eachmutant in the ‘END’ sample compared with its abundance in the‘START’ sample is used to calculate a log2 fitness ratio (END/START),which is called ‘strain fitness’. For most genes,‘gene fitness’ is definedas the average strain fitness value for all ‘good’ transposon insertions(i.e., within the central 5–80% portion of a gene). We found that thestrain fitness values for different insertions within the same gene werewell correlated (for all hydrolysate experiments, n¼ 37, R¼ 0.85,mean absolute difference in fitness was only 0.27), and therefore wereport only gene fitness values in this paper.
Data normalization and calculation of gene fitness values was doneusing a modification of our previous method (Oh et al, 2010;Deutschbauer et al, 2011). First, we set the median of strain fitnessfrom each scaffold (main chromosome and five plasmids) to zero.This corrected for differential efficiency of DNA extraction between themain chromosome and five plasmids. In addition, for the mainchromosome we used a smooth estimator (loess in R) to remove asmall effect of chromosomal position on tag abundance (this was
Dissecting plant hydrolysate stressJM Skerker et al
16 Molecular Systems Biology 2013 & 2013 EMBO and Macmillan Publishers Limited

probably due to increased copy number near the origin). Finally,for the main chromosome, we also set the mode of the strainfitness distribution to zero. We did this because the median fitnesswas generally below the mode (the mode was estimated using themaximum of the kernel density using the density function in R) andbecause the mode for all proteins matched the mode for hypotheticalproteins, which should be less likely to have phenotypes. Data analysiswas done using custom R scripts (available upon request). The fulldata set of conditions tested and fitness values is found inSupplementary Dataset 1.
We found that a putative prophage region (ZMO1920-ZMO1952)contained 18 genes that were often detrimental for fitness (verticalyellow stripe in Figure 2, a little to the right of center); however,they were not specifically detrimental to fitness in hydrolysate and sowe did not study them further. In our comparative genome hybridiza-tion data, this region appeared to have variable copy number(Supplementary Figure 4H). The positive fitness of these genes couldbe an artifact—if the prophage increases its copy number when the cellis stressed (Imae and Fukasawa, 1970), then the barcodes in thesestrains will be amplified and their fitness values will be positive, eventhough those cells have not increased in abundance.
Modeling hydrolysate fitness using componentfitness data
We modeled the average gene fitness in hydrolysate as a linear mixtureof gene fitness in ZRMG-rich media and in various stresses,for example, for each gene g:
fhydrolysateðgÞ¼Cþbrich�frichðgÞþ bfurfural�ffurfuralðgÞþ bacetic acid�facetic acidðgÞþ ::::
where frich is the average gene fitness in rich media across 24experiments and the parameters C, brich, bfurfural, bacetic acid, etc., werecomputed using a standard linear regression (lm in R) to best fit theaverage gene fitness in hydrolysate across 37 experiments. We startedfrom a model with 37 components and used ANOVA to identifycomponents that did not significantly improve the regression. Theresults of ANOVA depend on the order of the components; componentswith the highest concentrations were included first and hence weremore likely to be retained. We removed insignificant components andthen built a new regression and performed a new ANOVA with fewercomponents. We repeated this procedure until all componentswere statistically significant (Po0.05 after Bonferroni correction formultiple testing), resulting in a model with 16 components (Model-16). The regression results are shown in Supplementary Table 7. To testthe effect of additional conditions on our model (see SupplementaryTable 5 for full condition list), we added them and repeated theANOVA test.
We also considered adding interaction terms to test for possiblesynergistic effects of components. We considered adding all terms ofthe form X�Y, where X and Y are components, and used a P-valuecutoff of 10� 4 to make up for the large number of terms tested. Weidentified 20 significant interaction terms. As with the linear regressionwith individual components, we then used ANOVA to see if these termswere significant when used in combination, again requiring Po10� 4.The resulting model contained only three interaction terms. Addingthese terms to Model-16 improves the adjusted R2 from 0.880 to 0.893and alters the predicted fitness of four genes by 0.5 or more. Theaffected genes were ZMO0975, ZMO1430, ZMO1431, and ZMO1432;also ZMO1429 is in an operon with ZMO1430-ZMO1432 and is near thethreshold. All five of these genes were identified as having non-stableinsertions, so we are not sure that the improvement of fit for thesegenes is biologically meaningful.
Yeast pooled fitness experiments
Fitness experiments were performed using a S. cerevisiae homozygousdeletion pool. For each pool experiment, 100 ml of our frozen poolaliquot was diluted into 50 ml YPD media, and grown for 6 h to anOD600 of 2.4. Once the pool had recovered, we collected a ‘START’sample, and then inoculated into various experimental conditions at a
starting OD600 of 0.03. Pool experiments were performed in 24-well or48-well formats and grown in a TECAN Infinite F200 plate reader.Samples were grown in the condition of interest for about sevengenerations (typically to saturation) and then the ‘END’ sample wascollected. Either 1 ml (24-well format) or 2.1 ml (48-well format) wascollected for genomic DNA isolation (YeaStar Genomic DNA Kit, ZymoResearch). DNA barcode amplification by PCR, Affymetrix hybridiza-tion, washing, and scanning of TAG4 arrays was done as previouslydescribed (Pierce et al, 2006). Using custom R scripts, we set themedian fitness value, as computed using the UPTAG or DNTAG, to zeroand then averaged across the measurements for each gene(Supplementary Dataset 1). ‘Gene fitness’ and ‘strain fitness’ valuesare the same (log2 ratio of END/START) for S. cerevisiae because onlyone deletion strain exists per gene in the homozygous pool. For mostyeast strains, we have both UPTAG and DNTAG measurements ofabundance. In addition, the Affymetrix TAG4 array has five replicateprobe spots for each UPTAG and DNTAG; therefore,‘gene fitness’ is anaverage of multiple measurements (i.e., two different tags and probereplicates). To identify putative S. cerevisiae tolerance genes, weplotted the gene fitness data in YPD-rich media versus gene fitness inYPD-rich media supplemented with batch 1 hydrolysate, andselected genes using the following criterion: fitnesshydrolysate o� 1and fitnesshydrolysateofitnessrich � 1 (Supplementary Figure 13;Supplementary Dataset 2). Gene and GO annotations for S288C wereobtained from the SGD database (http://www.yeastgenome.org/).We used GO annotations to help classify our tolerance gene list into sixbroad functional groups (Table II).
Identification of promoters for use in Z. mobilis
We developed a series of Gateway (Invitrogen) adapted vectors foroverexpression of genes in Z. mobilis. The system is based on pJS71, abroad-host plasmid derived from pBBR1MCS (Skerker and Shapiro,2000) that we found to be stably maintained in Z. mobilis. Using afluorescence-based assay based on superfolder GFP (Pedelacq et al,2005), we tested the relative promoter strengths of one E. coli (Pbad)and one Z. mobilis (Pgap) promoter (Conway et al, 1987; Guzman et al,1995). Each promoter construct was made using the Gateway systemby fusing the promoter of interest to GFP using a pJS71-baseddestination vector (Supplementary Table 6). These strains were grownin a 10-ml ZRMG media culture with spectinomycin. In the case of Pbad,cultures were induced with increasing concentrations of arabinose.Once saturated, cultures were diluted 1:1000 and allowed to grow untilthey reached an OD600 of 0.4. Cells were washed twice with 1� PBS.After washing, 150ml of resuspended cells was pipetted into a 96-wellassay plate (Costar 3603). In addition, a Z. mobilis control straincarrying only the pJS71 plasmid was used as a negative control.Fluorescence (RFU) was measured in a Tecan Safire plate reader.Average fluorescence of the control strain was subtracted from theaverage of each experimental sample. Relative promoter activity wasdetermined by calculating RFU/OD for all samples and averaged overthree biological replicates (Supplementary Figure 14).
Z. mobilis growth experiments
Growth experiments were performed in 24-well and 96-well micro-plates. Single transposon mutant characterization was performed in150ml volume, 96-well format and in 1 ml volume, 24-well formatusing either a Tecan Sunrise or Tecan Infinite F200 plate reader (TecanSystems Inc., San Jose, CA). Starting OD600 for all Z. mobilis strainswas 0.02. For Z. mobilis transposon mutants, saturated overnightZRMG cultures were diluted 1:20, grown to OD600 0.5 and then used toinoculate a plate containing 1� ZRMG with and without 10% batch 1or 8% batch 2 miscanthus hydrolysate (% v/v). Complementation andoverexpression experiments were done using a Tecan Sunrise reader ina 96-well format. Strains were grown overnight in ZRMGþ 100mg/mlspectinomycin. For mutants where Pbad controlled expression of therelevant gene, 2% arabinose was added to the media. Once saturated,cultures were diluted back 1:20 and grown to 0.5 OD600. Strains wereinoculated at a starting OD600 of 0.1 into plates containing ZRMG, withand without inhibitor. For these experiments, inhibitor concentrations
Dissecting plant hydrolysate stressJM Skerker et al
& 2013 EMBO and Macmillan Publishers Limited Molecular Systems Biology 2013 17

were 10% batch 1 hydrolysate or 1.5 mM methylglyoxal in 150ml totalvolume per well. All growth experiments were run for up to 72 h.
Construction of expression clones forcomplementation and overexpression
We used the Pbad and Pgap promoters for complementation of tolerancegene mutants and for testing the effect of overexpression on growthand fermentation performance. Each promoter construct included anin-frame N-terminal FLAG tag (DDDDYDK), so protein expressioncould be detected by western blot with anti-FLAG antibodies(Sigma-Aldrich). A series of pENTR clones were generated for putativeZ. mobilis tolerance genes (Supplementary Table 6). We usedGateway cloning to generate Pbad-ZMOxxxx or Pgap-ZMOxxxx expres-sion clones, where ZMOxxxx is the systematic gene name(Supplementary Table 6). These plasmids were electroporated intowild-type Z. mobilis to examine the effects of overexpression on cellgrowth and ethanol production. For electroporation, competent cellswere made from an overnight wild-type culture grown to 0.8–1.0OD600. Cells were harvested by centrifugation and resuspended twicein ice-cold sterile Milli-Q water (EMD Millipore, Billerica, MA). Cellswere then washed twice with ice-cold 10% glycerol and frozen in 80 mlaliquots at � 80 1C. To perform the electroporation, 40ml of cells wasthawed on ice and 1mg of DNA was added, along with 2.5 mg of TypeOne Restriction Inhibitor (Epicentre). The transformation mixture waspipetted into an electroporation cuvette and cells were electroporatedusing the following settings: 1600 V, 200 ohms, and 25mF. Cells wererecovered in ZRMG media for 6 h, shaking at 30 1C. After recovery,10ml or 100 ml of recovered cells was spread on selective plates andincubated at 30 1C for at least 2 days. A single colony for eachoverexpression strain was archived at � 80 1C (SupplementaryTable 6). The same constructs were also used for complementationstudies, except that they were electroporated into the correspondingmutant (ZMOxxxx::TN5) strain. Overexpression and complementationexperiments were performed with at least three biological replicates,using freshly streaked single colonies from ZRMGþ spectinomycinplates.
Western blot analysis of overexpression strains
The relative expression of each clone used for overexpression wasexamined by western blot analysis (Supplementary Figure 15). Strainscontaining expression plasmids were grown in ZRMGþ 100mg/mlspectinomycinþ 2% arabinose. After 24 h, cultures were diluted 1:20,grown to 0.5 OD600, and 1 ml was harvested. Cells were resuspended infreshly made 1� SDS–PAGE sample buffer (Bio-Rad) containingb-mercaptoethanol and boiled for 5 min. All samples were stored at� 801C until used. Protein samples were separated by SDS–PAGE(using precast 2–40% gradient gels, Bio-Rad), transferred at 41C onto aPVDF membrane and then blocked overnight in PBSTþ 5% non-fatinstant dry milk. Once blocked, the membrane was washed briefly inPBSþ 3% non-fat milk and subsequently incubated with the primaryantibody, 1:5000 dilution of anti-FLAG (Sigma F3165), for 1 h, shakingat room temperature. After thoroughly washing with PBST, themembrane was incubated with the secondary antibody, 1:1000 goatanti-mouse horseradish peroxidase (Thermo Scientific), again for 1 hwith shaking. The membrane was washed with PBST and incubatedwith ECL reagent (1:1 mixture, Thermo Scientific) for 5 min.After allowing to drip dry briefly, the blot was imaged using a FujifilmLAS-4000 imager in chemiluminescence mode.
Fermentation experiments
The fermentation capability of mutants was measured during aerobicgrowth in rich media with and without hydrolysate (Figures 1 and 6;Supplementary Figure 16). Starter cultures were grown in 1�ZRMGþ 100 mg/ml spectinomycin and induced with 2% arabinose.After 24 h, cultures were diluted 1:20 and grown to 0.5 OD600.Fermentations were started at 0.1 OD600 and set up in 10 ml tubes,shaking 200 r.p.m. at 301C. Fermentation media contained 1� ZRMG,
2% arabinose, and spectinomycin for control conditions. To test theeffects of hydrolysate on fermentation, the media was supplementedwith 8% (v/v) batch 2 hydrolysate. Samples were collected every 3 hfor 50 h. At each time point, OD600 was measured and supernatant wasremoved for HPLC analysis of glucose and ethanol concentrations.Vials were stored at 41C until processed. For HPLC analysis of thesupernatant, samples were analyzed at 551C on a Rezex RFQ fast acidcolumn (Phenomenex, Torrance, CA) and compounds wereeluted with 0.005 M sulfuric acid at a flow rate of 1 ml/min. Ethanoland glucose were detected by RID. Specific ethanol productivity(g/l/h/OD600) was calculated during the time period (t1 to t2) whenglucose was being consumed, using the formula (ethanolt2�ethanolt1)/(t2� t1)/(OD600t1þOD600t2)/2). The following intervalswere used: WTþpJS71 (0–15 h), WTþpJS71 in hydrolysate(0–27 h), WTþPbad-ZMO1875 in hydrolysate (0–18 h). Fermentationexperiments for WTþpJS71 and WTþPbad-ZMO1875 wereperformed using four biological replicates and averageproductivity values are reported. Fermentation experiments usingWTþPbad-ZMO1722, WTþPbad-ZMO0760, and WTþPbad-ZMO0100) were performed in duplicate.
Supplementary information
Supplementary information is available at the Molecular SystemsBiology website (www.nature.com/msb).
AcknowledgementsWe thank the Stanford Genome Technology Center for help withsequencing and for the yeast deletion collection. We thank RebeccaArundale (UIUC) for providing the samples of miscanthus andswitchgrass. This work was funded by the Energy Biosciences Institutegrant OO7G02.
Author contributions: JMS, JSM, KMW, AMD, and DRT generated thetransposon library and performed pool experiments. DL performedsingle mutant, overexpression, complementation, and fermentationstudies. MNP analyzed fitness data and modeled hydrolysate fitness.SB, ABI, and VDM generated and analyzed plant hydrolysatesand performed glucose and ethanol measurements. CHW andPH developed the arabinose inducible expression plasmid. TH andAPA managed the project and helped plan experiments. JMS, DL, MNP,SB, and APA wrote the manuscript.
Conflict of interestThe authors declare that they have no conflict of interest.
References
Agrawal M, Wang Y, Chen RR (2012) Engineering efficient xylosemetabolism into an acetic acid-tolerant Zymomonas mobilis strainby introducing adaptation-induced mutations. Biotechnol Lett 34:1825–1832
Alic N, Higgins VJ, Dawes IW (2001) Identification of a Saccharomycescerevisiae gene that is required for G1 arrest in response to the lipidoxidation product linoleic acid hydroperoxide. Mol Biol Cell 12:1801–1810
Allen SA, Clark W, McCaffery JM, Cai Z, Lanctot A, Slininger PJ, Liu ZL,Gorsich SW (2010) Furfural induces reactive oxygen speciesaccumulation and cellular damage in Saccharomyces cerevisiae.Biotechnol Biofuels 3: 2
Almeida JR, Modig T, Petersson A, Hahn-Hagerdal B, Liden G,Gorwa-Grauslund M-F (2007) Increased tolerance and conversionof inhibitors in lignocellulosic hydrolysates by Saccharomycescerevisiae. J Chem Technol Biotechnol 82: 340–349
Amin G, Van den Eynde E, Verachtert H (1983) Determination ofby-products formed during the ethanolic fermentation, using batch
Dissecting plant hydrolysate stressJM Skerker et al
18 Molecular Systems Biology 2013 & 2013 EMBO and Macmillan Publishers Limited
and immobilized cell systems of Zymomonas mobilis andSaccharomyces bayanus. Eur J Appl Microbiol Biotechnol 18: 1–5
Angert ER (2012) DNA replication and genomic architecture of verylarge bacteria. Annu Rev Microbiol 66: 197–212
Bitoun JP, Wu G, Ding H (2008) Escherichia coli FtnA acts as an ironbuffer for re-assembly of iron–sulfur clusters in response tohydrogen peroxide stress. BioMetals 21: 693–703
Caimi P, Hitz W (2012) Xylose utilizing Zymomonas mobilis withimproved ethanol production in biomass hydrolysate medium. WOPatent 2012/082711
Cameron JM, Janer A, Levandovsky V, MacKay N, Rouault TA, TongWH, Ogilvie I, Shoubridge EA, Robinson BH (2011) Mutations iniron-sulfur cluster scaffold genes NFU1 and BOLA3 cause a fataldeficiency of multiple respiratory chain and 2-Oxoaciddehydrogenase enzymes. Am J Hum Genet 89: 486–495
Charoensuk K, Irie A, Lertwattanasakul N, Sootsuwan K, ThanonkeoP, Yamada M (2011) Physiological importance of cytochromeperoxidase in ethanologenic thermotolerant Zymomonas mobilis.J Mol Microbiol Biotechnol 20: 70–82
Chen M (2010) irrE, an exogenous gene from Deinococcus radiodurans,improves the growth of and ethanol production by a Zymomonasmobilis strain under ethanol and acid stresses. J MicrobiolBiotechnol 20: 1156–1162
Clark TA, Mackie KL (1984) Fermentation inhibitors in woodhydrolysates derived from the softwood Pinus radiata. J ChemTech Biotechnol 34: 101–110
Cokol M, Chua HN, Tasan M, Mutlu B, Weinstein ZB, Suzuki Y,Nergiz ME, Costanzo M, Baryshnikova A, Giaever G, Nislow C,Myers CL, Andrews BJ, Boone C, Roth FP (2011) Systematicexploration of synergistic drug pairs. Mol Syst Biol 7: 544
Conway T, Sewell GW, Ingram LO (1987) Glyceraldehyde-3-phosphatedehydrogenase gene from Zymomonas mobilis: cloning,sequencing, and identification of promoter region. J Bacteriol169: 5653–5662
Deutschbauer A, Price MN, Wetmore KM, Shao W, Baumohl JK, Xu Z,Nguyen M, Tamse R, Davis RW, Arkin AP (2011) Evidence-basedannotation of gene function in Shewanella oneidensis MR-1 usinggenome-wide fitness profiling across 121 conditions. PLoS Genet 7:e1002385
Djaman O (2004) Repair of oxidized iron-sulfur clusters in Escherichiacoli. J Biol Chem 279: 44590–44599
Drobna E, Gazdag Z, Culakova H, Dzugasova V, Gbelska Y, Pesti M,Subik J (2012) Overexpression of the YAP1, PDE2, and STB3 genesenhances the tolerance of yeast to oxidative stress induced by7-chlorotetrazolo[5,1-c]benzo[1,2,4]triazine. FEMS Yeast Res 8:958–968
Freedberg WB, Kistler WS, Lin EC (1971) Lethal synthesis ofmethylglyoxal by Escherichia coli during unregulated glycerolmetabolism. J Bacteriol 108: 137–144
Fujitomi K, Sanda T, Hasunuma T, Kondo A (2012) Deletion of thePHO13 gene in Saccharomyces cerevisiae improves ethanolproduction from lignocellulosic hydrolysate in the presenceof acetic and formic acids, and furfural. Bioresour Technol 111:161–166
Gao L, Xia L (2012) Sm-like protein enhanced tolerance of recombinantSaccharomyces cerevisiae to inhibitors in hemicellulosichydrolysate. Bioresour Technol 124: 504–507
Giaever G, Chu AM, Ni L, Connelly C, Riles L, Veronneau S, Dow S,Lucau-Danila A, Anderson K, Andre B, Arkin AP, Astromoff A, El-Bakkoury M, Bangham R, Benito R, Brachat S, Campanaro S,Curtiss M, Davis K, Deutschbauer A et al (2002) Functionalprofiling of the Saccharomyces cerevisiae genome. Nature 418:387–391
Giaever G, Flaherty P, Kumm J, Proctor M, Nislow C, Jaramillo DF, ChuAM, Jordan MI, Arkin AP, Davis RW (2004) Chemogenomicprofiling: identifying the functional interactions of smallmolecules in yeast. Proc Natl Acad Sci USA 101: 793–798
Gibson BR, Lawrence SJ, Boulton CA, Box WG, Graham NS, LinforthRST, Smart KA (2008) The oxidative stress response of a lager
brewing yeast strain during industrial propagation andfermentation. FEMS Yeast Res 8: 574–585
Gibson BR, Lawrence SJ, Leclaire JPR, Powell CD, Smart KA (2007)Yeast responses to stresses associated with industrial breweryhandling. FEMS Microbiol Rev 31: 535–569
Goodman AE, Rogers PL, Skotnicki ML (1982) Minimal medium forisolation of auxotrophic Zymomonas mutants. Appl EnvironMicrobiol 44: 496–498
Gorsich SW, Dien BS, Nichols NN, Slininger PJ, Liu ZL, Skory CD(2006) Tolerance to furfural-induced stress is associated withpentose phosphate pathway genes ZWF1, GND1, RPE1, and TKL1in Saccharomyces cerevisiae. Appl Microbiol Biotechnol 71: 339–349
Griese M, Lange C, Soppa J (2011) Ploidy in cyanobacteria. FEMSMicrobiol Lett 323: 124–131
Guzman LM, Belin D, Carson MJ, Beckwith J (1995) Tight regulation,modulation, and high-level expression by vectors containing thearabinose PBAD promoter. J Bacteriol 177: 4121–4130
Heer D, Sauer U (2008) Identification of furfural as a key toxin inlignocellulosic hydrolysates and evolution of a tolerant yeast strain.Microb Biotechnol 1: 497–506
Hill J, Nelson E, Tilman D, Polasky S, Tiffany D (2006) Environmental,economic, and energetic costs and benefits of biodiesel and ethanolbiofuels. Proc Natl Acad Sci USA 103: 11206–11210
Hillenmeyer ME, Ericson E, Davis RW, Nislow C, Koller D, Giaever G(2010) Systematic analysis of genome-wide fitness data in yeastreveals novel gene function and drug action. Genome Biol 11: R30
Hueso G, Aparicio-Sanchis R, Montesinos C, Lorenz S, Murguıa JR,Serrano R (2012) A novel role for protein kinase Gcn2 in yeasttolerance to intracellular acid stress. Biochem J 441: 255–264
Huynen MA, Spronk CAEM, Gabaldon T, Snel B (2005) Combiningdata from genomes, Y2H and 3D structure indicates that BolA is areductase interacting with a glutaredoxin. FEBS Lett 579: 591–596
Imae Y, Fukasawa T (1970) Regional replication of the bacterialchromosome induced by derepression of prophage lambda.J Mol Biol 54: 585–597
Jansen G, Lee AY, Epp E, Fredette Ael, Surprenant J, Harcus D, Scott M,Tan E, Nishimura T, Whiteway M, Hallett M, Thomas DY (2009)Chemogenomic profiling predicts antifungal synergies. Mol SystBiol 5: 1–13
Jayakody LN, Hayashi N, Kitagaki H (2011) Identification ofglycolaldehyde as the key inhibitor of bioethanol fermentation byyeast and genome-wide analysis of its toxicity. Biotechnol Lett 33:285–292
Jeppsson M, Johansson B, Jensen PR, Hahn-Hagerdal B, Gorwa-Grauslund MF (2003) The level of glucose-6-phosphatedehydrogenase activity strongly influences xylose fermentationand inhibitor sensitivity in recombinant Saccharomyces cerevisiaestrains. Yeast 20: 1263–1272
Kawahata M, Masaki K, Fujii T, Iefuji H (2006) Yeast genes involved inresponse to lactic acid and acetic acid: acidic conditions caused bythe organic acids in Saccharomyces cerevisiae cultures induceexpression of intracellular metal metabolism genes regulated byAft1p. FEMS Yeast Res 6: 924–936
Keller FA, Bates D, Ruiz R, Nguyen Q (1998) Yeast adaptationon softwood prehydrolysate. Appl Biochem Biotechnol 70-72:137–148
Klein-Marcuschamer D, Oleskowicz-Popiel P, Simmons BA, BlanchHW (2010) Technoeconomic analysis of biofuels: a wiki-basedplatform for lignocellulosic biorefineries. Biomass Bioenergy 34:1914–1921
Klein-Marcuschamer D, Oleskowicz-Popiel P, Simmons BA, BlanchHW (2011) The challenge of enzyme cost in the production oflignocellulosic biofuels. Biotechnol Bioeng 109: 1083–1087
Klinke H, Olsson L, Thomsen A, Ahring B (2003) Potential inhibitorsfrom wet oxidation of wheat straw and their effect on ethanolproduction of Saccharomyces cerevisiae: wet oxidation andfermentation by yeast. Biotechnol Bioeng 81: 738–747
Klinke HB, Thomsen AB, Ahring BK (2004) Inhibition of ethanol-producing yeast and bacteria by degradation products produced
Dissecting plant hydrolysate stressJM Skerker et al
& 2013 EMBO and Macmillan Publishers Limited Molecular Systems Biology 2013 19

during pre-treatment of biomass. Appl Microbiol Biotechnol 66:10–26
Koch B, Nybroe O (2006) Initial characterization of a bolA homologuefrom Pseudomonas fluorescens indicates different roles for BolA-like proteins in P. fluorescens and Escherichia coli. FEMS MicrobiolLett 262: 48–56
Koppram R, Albers E, Olsson L (2012) Evolutionary engineeringstrategies to enhance tolerance of xylose utilizing recombinantyeast to inhibitors derived from spruce biomass. Biotechnol Biofuels5: 32
Kumanovics A, Chen OS, Li L, Bagley D, Adkins EM, Lin H, Dingra NN,Outten CE, Keller G, Winge D, Ward DM, Kaplan J (2008)Identification of FRA1 and FRA2 as genes involved in regulatingthe yeast iron regulon in response to decreased mitochondrialiron-sulfur cluster synthesis. J Biol Chem 283: 10276–10286
Kumar D, Murthy GS (2011) Impact of pretreatment and downstreamprocessing technologies on economics and energy in cellulosicethanol production. Biotechnol Biofuels 4: 27
Langridge GC, Phan M-D, Turner DJ, Perkins TT, Parts L, Haase J,Charles I, Maskell DJ, Peters SE, Dougan G, Wain J, Parkhill J,Turner AK (2009) Simultaneous assay of every Salmonella typhigene using one million transposon mutants. Genome Res 19:2308–2316
Larsen RA, Wilson MM, Guss AM, Metcalf WW (2002) Geneticanalysis of pigment biosynthesis in Xanthobacter autotrophicus Py2using a new, highly efficient transposon mutagenesis systemthat is functional in a wide variety of bacteria. Arch Microbiol178: 193–201
Larsson S, Nilvebrant NO, Jonsson LJ (2001) Effect of overexpressionof Saccharomyces cerevisiae Pad1p on the resistance tophenylacrylic acids and lignocellulose hydrolysates underaerobic and oxygen-limited conditions. Appl Microbiol Biotechnol57: 167–174
Li H, Outten CE (2012) Monothiol CGFS glutaredoxins and BolA-likeproteins: [2Fe-2S] binding partners in iron homeostasis.Biochemistry 51: 4377–4389
Liu ZL (2011) Molecular mechanisms of yeast tolerance and in situdetoxification of lignocellulose hydrolysates. Appl MicrobiolBiotechnol 90: 809–825
Ma M, Liu ZL (2010) Comparative transcriptome profiling analysesduring the lag phase uncover YAP1, PDR1, PDR3, RPN4, and HSF1as key regulatory genes in genomic adaptation to the lignocellulosederived inhibitor HMF for Saccharomyces cerevisiae. BMC Genomics11: 660
Martın C, Almazan O, Marcet M, Jonsson LJ (2007a) A study of threestrategies for improving the fermentability of sugarcanebagasse hydrolysates for fuel ethanol production. Int Sugar J 109:33–39
Martın C, Marcet M, Almazan O, Jonsson LJ (2007b) Adaptation of arecombinant xylose-utilizing Saccharomyces cerevisiae strain to asugarcane bagasse hydrolysate with high content of fermentationinhibitors. Bioresour Technol 98: 1767–1773
Masters CI, Smith MD, Gutman PD, Minton KW (1991) Heterozygosityand instability of amplified chromosomal insertions in theradioresistant bacterium Deinococcus radiodurans. J Bacteriol173: 6110–6117
Mergaert P, Uchiumi T, Alunni B, Evanno G, Cheron A, Catrice O,Mausset A-E, Barloy-Hubler F, Galibert F, Kondorosi A, Kondorosi E(2006) Eukaryotic control on bacterial cell cycle and differentiationin the Rhizobium-legume symbiosis. Proc Natl Acad Sci USA 103:5230–5235
Miller EN, Jarboe LR, Turner PC, Pharkya P, Yomano LP, York SW,Nunn D, Shanmugam KT, Ingram LO (2009a) Furfural inhibitsgrowth by limiting sulfur assimilation in ethanologenic Escherichiacoli strain LY180. Appl Environ Microbiol 75: 6132–6141
Miller EN, Jarboe LR, Yomano LP, York SW, Shanmugam KT, IngramLO (2009b) Silencing of NADPH-dependent oxidoreductase genes(yqhD and dkgA) in furfural-resistant ethanologenic Escherichiacoli. Appl Environ Microbiol 75: 4315–4323
Miller EN, Turner PC, Jarboe LR, Ingram LO (2010) Genetic changesthat increase 5-hydroxymethyl furfural resistance in ethanol-producing Escherichia coli LY180. Biotechnol Lett 32: 661–667
Mishra S, Imlay J (2012) Why do bacteria use so many enzymes toscavenge hydrogen peroxide? Arch Biochem Biophys 525: 145–160
Morales-Rios E, de la Rosa-Morales F, Mendoza-Hernandez G,Rodriguez-Zavala JS, Celis H, Zarco-Zavala M, Garcia-Trejo JJ(2010) A novel 11-kDa inhibitory subunit in the F1F0 ATP synthaseof Paracoccus denitrificans and related alpha-proteobacteria. FASEBJ 24: 599–608
Nakata T, Miyafuji H, Saka S (2006) Bioethanol from cellulose withsupercritical water treatment followed by enzymatic hydrolysis.Appl Biochem Biotechnol 129-132: 476–485
Nieves IU, Geddes CC, Miller EN, Mullinnix MT, Hoffman RW, Fu Z,Tong Z, Ingram LO (2011) Effect of reduced sulfur compounds onthe fermentation of phosphoric acid pretreated sugarcanebagasse by ethanologenic Escherichia coli. Bioresour Technol 102:5145–5152
Nilvebrant N-O, Reimann A, Larsson S, Jonsson LJ (2001)Detoxification of lignocellulose hydrolysates with ion-exchangeresins. Appl Biochem Biotechnol 91-93: 35–50
Nisamedtinov I, Kevvai K, Orumets K, Arike L, Sarand I, Korhola M,Paalme T (2011) Metabolic changes underlying the higheraccumulation of glutathione in Saccharomyces cerevisiae mutants.Appl Microbiol Biotechnol 89: 1029–1037
Oh J, Fung E, Price MN, Dehal PS, Davis RW, Giaever G, Nislow C,Arkin AP, Deutschbauer A (2010) A universal TagModule collectionfor parallel genetic analysis of microorganisms. Nucleic Acids Res38: e146
Ohtani N, Tomita M, Itaya M (2010) An extreme thermophile, Thermusthermophilus, is a polyploid bacterium. J Bacteriol 192: 5499–5505
Oliva JM, Ballesteros I, Negro MJ, Manzanares P, Cabanas A,Ballesteros M (2004) Effect of binary combinations of selectedtoxic compounds on growth and fermentation of Kluyveromycesmarxianus. Biotechnol Prog 20: 715–720
Ozyamak E, Black SS, Walker CA, Maclean MJ, Bartlett W, Miller S,Booth IR (2010) The critical role of S-lactoylglutathione formationduring methylglyoxal detoxification in Escherichia coli. MolMicrobiol 78: 1577–1590
Palmqvist E, Grage H, Meinander NQ, Hahn-Hagerdal B (1999) Mainand interaction effects of acetic acid, furfural, andp-hydroxybenzoic acid on growth and ethanol productivity ofyeasts. Biotechnol Bioeng 63: 46–55
Palmqvist E, Hahn-Hagerdal B (2000a) Fermentation of lignocellulosichydrolysates. II: Inhibitors and mechanisms of inhibition. BioresourTechnol 74: 25–33
Palmqvist E, Hahn-Hagerdal B (2000b) Fermentation of lignocellulosichydrolysates. I: inhibition and detoxification. Bioresour Technol 74:17–24
Parawira W, Tekere M (2011) Biotechnological strategies to overcomeinhibitors in lignocellulose hydrolysates for ethanol production:review. Crit Rev Biotechnol 31: 20–31
Pedelacq J-D, Cabantous S, Tran T, Terwilliger TC, Waldo GS (2005)Engineering and characterization of a superfolder green fluorescentprotein. Nat Biotechnol 24: 79–88
Pereira FB, Guimaraes PM, Gomes DG, Mira NP, Teixeira MC,Sa-Correia I, Domingues L (2011) Identification of candidategenes for yeast engineering to improve bioethanol production invery high gravity and lignocellulosic biomass industrialfermentations. Biotechnol Biofuels 4: 57
Petersson A, Almeida J, Modig T, Karhumaa K (2006)A 5-hydroxymethyl furfural reducing enzyme encoded by theSaccharomyces cerevisiae ADH6 gene conveys HMF tolerance. Yeast23: 455–464
Pierce SE, Fung EL, Jaramillo DF, Chu AM, Davis RW, Nislow C,Giaever G (2006) A unique and universal molecular barcode array.Nat Methods 3: 601–603
Roe AJ, O’Byrne C, McLaggan D, Booth IR (2002) Inhibition ofEscherichia coli growth by acetic acid: a problem with methionine
Dissecting plant hydrolysate stressJM Skerker et al
20 Molecular Systems Biology 2013 & 2013 EMBO and Macmillan Publishers Limited

biosynthesis and homocysteine toxicity. Microbiology 148:2215–2222
Rouhier N, Couturier J, Johnson MK, Jacquot J-P (2010) Glutaredoxins:roles in iron homeostasis. Trends Biochem Sci 35: 43–52
Sanda T, Hasunuma T, Matsuda F, Kondo A (2011) Repeated-batchfermentation of lignocellulosic hydrolysate to ethanol using ahybrid Saccharomyces cerevisiae strain metabolically engineeredfor tolerance to acetic and formic acids. Bioresour Technol 102:7917–7924
Sandoval NR, Kim JYH, Glebes TY, Reeder PJ, Aucoin HR, Warner JR,Gill RT (2012) Strategy for directing combinatorial genomeengineering in Escherichia coli. Proc Natl Acad Sci USA 109:10540–10545
Sandoval NR, Mills TY, Zhang M, Gill RT (2011) Elucidating acetatetolerance in E. coli using a genome-wide approach. Metab Eng 13:214–224
Sassetti CM, Boyd DH, Rubin EJ (2001) Comprehensive identificationof conditionally essential genes in mycobacteria. Proc Natl Acad SciUSA 98: 12712–12717
Schwalbach MS, Keating DH, Tremaine M, Marner WD, Zhang Y,Bothfeld W, Higbee A, Grass JA, Cotten C, Reed JL, da Costa SousaL, Jin M, Balan V, Ellinger J, Dale B, Kiley PJ, Landick R (2012)Complex physiology and compound stress responses duringfermentation of alkali-pretreated corn stover hydrolysateby an Escherichia coli ethanologen. Appl Environ Microbiol 78:3442–3457
Shakamuri P, Zhang B, Johnson MK (2012) Monothiol glutaredoxinsfunction in storing and transporting [Fe2S2] clusters assembled onIscU scaffold proteins. J Am Chem Soc 134: 15213–15216
Skerker JM, Shapiro L (2000) Identification and cell cycle controlof a novel pilus system in Caulobacter crescentus. EMBO J 19:3223–3234
Smith AM, Heisler LE, Mellor J, Kaper F, Thompson MJ, Chee M, RothFP, Giaever G, Nislow C (2009) Quantitative phenotyping via deepbarcode sequencing. Genome Res 19: 1836–1842
Somerville C, Youngs H, Taylor C, Davis SC, Long SP (2010) Feedstocksfor Lignocellulosic Biofuels. Science 329: 790–792
Sommer MO, Church GM, Dantas G (2010) A functional metagenomicapproach for expanding the synthetic biology toolbox for biomassconversion. Mol Syst Biol 6: 360
Stoutenburg RM, Perrotta JA, Nakas JP (2011) Overcoming inhibitorsin a hemicellulosic hydrolysate: improving fermentability byfeedstock detoxification and adaptation of Pichia stipitis. J IndMicrobiol Biotechnol 38: 1939–1945
Sundstrom L, Larsson S, Jonsson LJ (2010) Identification ofSaccharomyces cerevisiae genes involved in the resistance tophenolic fermentation inhibitors. Appl Biochem Biotechnol 161:106–115
Tao L, Aden A, Elander RT, Pallapolu VR, Lee YY, Garlock RJ, Balan V,Dale BE, Kim Y, Mosier NS, Ladisch MR, Falls M, Holtzapple MT,Sierra R, Shi J, Ebrik MA, Redmond T, Yang B, Wyman CE,Hames B et al (2011) Process and technoeconomic analysisof leading pretreatment technologies for lignocellulosicethanol production using switchgrass. Bioresour Technol 102:11105–11114
Thornalley PJ, Langborg A, Minhas HS (1999) Formation of glyoxal,methylglyoxal and 3-deoxyglucosone in the glycation of proteins byglucose. Biochem J 344: 109–116
Turnbull AL, Surette MG (2010) Cysteine biosynthesis, oxidative stressand antibiotic resistance in Salmonella typhimurium. Res Microbiol161: 643–650
US Department of Energy (2011) US Billion-Ton Update: BiomassSupply for a Bioenergy and Bioproducts Industry. In: Perlack RD,Stokes BJ (Leads), ORNL/TM-2011/224. Oak Ridge NationalLaboratory: Oak Ridge, TN. 227 p
Van Opijnen T, Bodi KL, Camilli A (2009) Tn-seq: high-throughputparallel sequencing for fitness and genetic interaction studies inmicroorganisms. Nat Methods 6: 767–772
Veal EA, Ross SJ, Malakasi P, Peacock E, Morgan BA (2003) Ybp1 isrequired for the hydrogen peroxide-induced oxidation of the Yap1transcription factor. J Biol Chem 278: 30896–30904
Vicari KJ, Tallam SS, Shatova T, Koh KJ, Scarlata CJ, Humbird D,Wolfrum EJ, Beckham GT (2012) Uncertainty in techno-economicestimates of cellulosic ethanol production due to experimentalmeasurement uncertainty. Biotechnol Biofuels 5: 23
Warner J, Reeder P, Karimpour-Fard A, Woodruff L, Gill R (2010) Rapidprofiling of a microbial genome using mixtures of barcodedoligonucleotides. Nat Biotechnol 28: 856–862
Wheals A, Basso L, Alves D (1999) Fuel ethanol after 25 years.Trends Biotechnol 17: 482–487
Willems P, Wanschers B, Esseling J, Szklarczyk R, Kudla U, Duarte I,Forkink M, Nooteboom M, Swarts H, Gloerich J, Nijtmans L,Koopman WJH, Huynen M (2012) BOLA1 is an aerobic protein thatprevents mitochondrial morphology changes induced byglutathione depletion. Antioxid Redox Signal 18: 129–138
Wood K, Nishida S, Sontag ED, Cluzel P (2012) Mechanism-independent method for predicting response to multidrugcombinations in bacteria. Proc Natl Acad Sci USA 109: 12254–12259
Wyman CE, Dale BE, Elander RT, Holtzapple M, Ladisch MR, Lee YY(2005) Coordinated development of leading biomass pretreatmenttechnologies. Bioresour Technol 96: 1959–1966
Yang S, Pappas KM, Hauser LJ, Land ML, Chen G-L, Hurst GB, Pan C,Kouvelis VN, Typas MA, Pelletier DA, Klingeman DM, Chang Y-J,Samatova NF, Brown SD (2009a) Improved genome annotation forZymomonas mobilis. Nat Biotechnol 27: 893–894
Yang S, Tschaplinski TJ, Engle NL, Carroll SL, Martin SL, Davison BH,Palumbo AV, Rodriguez Jr M, Brown SD (2009b) Transcriptomicand metabolomic profiling of Zymomonas mobilis during aerobicand anaerobic fermentations. BMC Genomics 10: 34
Yang S, Land ML, Klingeman DM, Pelletier DA, Lu T-YS, Martin SL, GuoH-B, Smith JC, Brown SD (2010a) Paradigm for industrial strainimprovement identifies sodium acetate tolerance loci inZymomonas mobilis and Saccharomyces cerevisiae. Proc Natl AcadSci USA 107: 10395–10400
Yang S, Pelletier DA, Lu T-YS, Brown SD (2010b) The Zymomonasmobilis regulator hfq contributes to tolerance against multiplelignocellulosic pretreatment inhibitors. BMC Microbiol 10: 1–11
Yang W (2002) Repair of nitric oxide-modified ferredoxin [2Fe-2S]cluster by cysteine desulfurase (IscS). J Biol Chem 277:12868–12873
Youngs H, Somerville C (2012) Development of feedstocks forcellulosic biofuels. F1000 Biol Rep 4: 10
Zaldivar J, Ingram L (1999) Effect of organic acids on the growth andfermentation of ethanologenic Escherichia coli LY01. BiotechnolBioeng 66: 203–210
Zaldivar J, Martinez A, Ingram L (1999) Effect of selected aldehydes onthe growth and fermentation of ethanologenic Escherichia coli.Biotechnol Bioeng 65: 24–33
Zaldivar J, Martinez A, Ingram LO (2000) Effect of alcohol compoundsfound in hemicellulose hydrolysate on the growth and fermentationof ethanologenic Escherichia coli. Biotechnol Bioeng 68: 524–530
Molecular Systems Biology is an open-accessjournal published by the European Molecular
Biology Organization and Nature Publishing Group. Thiswork is licensed under a Creative Commons Attribution-Noncommercial-No Derivative Works 3.0 Unported Licence.To view a copy of this licence visit http://creativecommons.org/licenses/by-nc-nd/3.0/.
Dissecting plant hydrolysate stressJM Skerker et al
& 2013 EMBO and Macmillan Publishers Limited Molecular Systems Biology 2013 21