dissecting on-node memory access performance: a...
TRANSCRIPT
Dissecting On-Node Memory Access Performance:A Semantic Approach
Alfredo Gimenez∗, Todd Gamblin†, Barry Rountree†, Abhinav Bhatele†, Ilir Jusufi∗,Peer-Timo Bremer† and Bernd Hamann∗
∗Department of Computer Science, University of California, Davis, California 95616 USA†Center for Applied Scientific Computing, Lawrence Livermore National Laboratory, Livermore, California 94551 USA
E-mail: ∗{aagimenez, jusufi, bhamann}@ucdavis.edu, †{tgamblin, rountree, bhatele, ptbremer}@llnl.gov
Abstract—Optimizing memory access is critical for perfor-mance and power efficiency. CPU manufacturers have developedsampling-based performance measurement units (PMUs) thatreport precise costs of memory accesses at specific addresses.However, this data is too low-level to be meaningfully interpretedand contains an excessive amount of irrelevant or uninterestinginformation.
We have developed a method to gather fine-grained memoryaccess performance data for specific data objects and regionsof code with low overhead and attribute semantic informationto the sampled memory accesses. This information provides thecontext necessary to more effectively interpret the data. We havedeveloped a tool that performs this sampling and attribution andused the tool to discover and diagnose performance problemsin real-world applications. Our techniques provide useful insightinto the memory behavior of applications and allow programmersto understand the performance ramifications of key design deci-sions: domain decomposition, multi-threading, and data motionwithin distributed memory systems.
I. INTRODUCTION
Modern microprocessors have reached limits in instruction-level parallelism and on-chip power capacity. On-node concur-rency levels have also increased dramatically. Moore’s law isstill alive and well [1] but the increasing transistor count isnow used to build additional processing units instead of fastersingle-threaded cores. To support on-node parallelism, thememory architecture has also become more complex. This hasseverely complicated the task of extracting peak performancefrom modern chips.
For years, computational power of processors has out-paced available memory bandwidth, and this phenomenonwas traditionally called the “memory wall” [2]. Indeed, on-chip data motion within the cache hierarchy has long beenthe largest performance bottleneck and consumer of power.Keeping processors fed with work has traditionally been amatter of carefully managing a single cache hierarchy. To-day, nodes with multiple levels of potentially shared caches,non-uniform memory access (NUMA) domains, and multiplesockets are ubiquitous. Optimizing data motion within thistype of topology is a much more difficult problem requiringprogrammers to lay out application data with extreme care.
Recent generations of Intel and AMD processors haveincluded fine-grained measurement capabilities that allow toolsto sample system-wide memory instructions and record per-formance data and metadata associated with them. These
performance monitoring units (PMUs) can associate a memoryoperation with a particular CPU, socket, cache resource, orNUMA domain. In addition, they can report the achievedlatency of specific memory acccess operations. Such robustPMUs offer new potential for performance monitoring, buttheir produced results can be exceedingly large and difficultto interpret.
Understanding the memory behavior of a parallel programrequires the software developer to understand the relationshipsof each memory instruction with the source code, the datastructure the instruction operated on, and the processor topol-ogy. For example, in a hydrodynamics simulation, a memoryaddress may refer to a particular volume within a large mesh,or a particular physics property of the associated material.Likewise, a particular thread executing on one socket mayaccess that address, but memory attached to another socketmay service the request. To understand the performance of alarge processor topology, we may need to associate a particularmemory instruction with potentially many other data points.
To expose these relationships to application developers andto enable more intuitive optimization of application perfor-mance, we have developed several novel measurement andanalysis techniques that allow us to associate memory behaviorwith code, data structures, and node topology. Our contribu-tions are:
1) A sampling technique that uses hardware PMUs andaccurately filters incoming data in kernel space toprovide memory access performance data at a finegranularity and with low overhead.
2) An efficient method to attribute memory access sam-ples with high-level information regarding the asso-ciated node hardware topology, program state anddata structures, and code. This provides meaningfulcontext for low-level data.
3) A tool, MemAxes, that implements our methodsconsisting of a kernel driver module for capturingmemory performance data, a source instrumentationlibrary for attributing high-level information to mem-ory accesses, and a program to visually analyze theacquired data interactively.
The contributions of the visualization methods developedin MemAxes are outside the scope of this paper, but we explainthe relevant portions to this work in Section VI.
We used our method to diagnose the performance of and
SC14, November 16-21, 2014, New Orleans, Louisiana, USA978-1-4799-5500-8/14/$31.00 c©2014 IEEE
optimize benchmark applications, and we describe the resultsin a series of case studies. We show that our method intuitivelyhighlights key on-node performance characteristics in HPCapplications that were otherwise unobservable or difficult tounderstand.
II. MEMORY ACCESS PERFORMANCE DATA ANDSEMANTIC ATTRIBUTES
Modern architectures have begun to include advancedPerformance Measurement Units (PMUs) with capabilities forsampling based on events. One such PMU makes possible sam-pling of memory access events occurring on the architecturesand collection of information corresponding to those events,including instruction operands and performance results of theirexecution.
Intel has provided the capability for accurate memory ac-cess sampling in their Precise Event-Based Sampling (PEBS)framework [3], and AMD has released similar capability intheir Instruction Based Sampling (IBS) framework [4]. Weused the PEBS framework for this research, but our presentedmethods are equally applicable for other memory access sam-pling frameworks.
The PEBS framework provides a programmable hardwarecounter that supports sampling of memory access events at aspecified frequency. At the retirement of each sampled access,an entry is generated containing information pertaining to thatevent. Each entry contains:
1) The instruction pointer2) The data address accessed3) The number of core clock cycles elapsed during the
access operation4) The memory resource in which the address was
resolved (L1,L2, etc)5) The processor ID that issued the access1
6) The socket ID on which the processor resides1
This information provides memory access performancedata at a high level of detail. However, many of the valuesare exceedingly low-level and require further processing tobecome meaningful. From this data, we extract higher-levelinformation that provides context, which we refer to as se-mantic attributes. These attributes must provide contexts thatare intuitive for the programmer to interpret. Furthermore,different contexts elucidate different areas of performance,and thus it is essential to define a set that encompasses arepresentative portion of the different types of performancebehavior.
We categorize the semantic attributes in terms of thecontext they provide. These contexts are: (1) the node hardwaretopology, (2) the application, and (3) the source code. In somecases, a semantic attribute provides multiple contexts, here weorganize them by the areas where they are most applicable.We also determine the performance characteristics associatedwith each context and provide examples of behavior that canbe analyzed within them.
1This information is not directly contained in a PEBS sample but can beeasily determined
A. Node Hardware Topology
In order to optimize software’s utilization of a node’shardware capabilities, we have to understand the relationshipbetween them. This includes what resources are being usedand to what extent. From this we can determine imbalances,hardware bottlenecks, and improper resource utilization. Of-ten, software practices that are aimed at improving resourceutilization, such as rearranging program flow to increase lo-cality, result in different behavior than was intended due tounexpected behavior in the hardware, compiler, or operatingsystem. By gaining a detailed understanding of how softwareruns on the available hardware, we can begin to target areasfor performance optimization.
The node hardware topology consists of the topologies ofmemory and processing resources. The memory topologies inmodern architectures are typically arranged as a multi-levelhierarchy. At the root, we have the largest resources, suchas RAM, and below them we have larger, possibly sharedcaches, and finally smaller, faster caches at the leaves. Thisorganization is intrinsically related to the processor topology.Physical CPUs each typically have independent access to aset of smaller caches, such as L1 and L2, and shared accesslarger caches and memory. Each physical CPU may be furtherdivided into multiple logical CPUs via multi-threading, inwhich case they may share small caches as well. NUMAarchitectures contain multiple sockets (or processor packages)on a single motherboard, each of which contains a set of CPUs,caches, and a larger memory resource shared between socketscalled a NUMA domain.
Of the memory access sample attributes, those that concernthe utilization of these various resources are the processorID, socket ID, and memory resource where the data wasresolved. If we also know the node’s hardware topology,we can associate a memory sample with a specific portionof it. Tools such as hwloc [5] and likwid [6] exist todetect the available hardware topology on a system. We use amodification of likwid suited to integrate with our existingcodebase.
We annotate the performance data onto the acquired nodehardware topology. This allows us to determine the preciseloads on the different available resources. With this informa-tion we can also estimate the effects of data migration betweenresources. Under the assumption that the data is copied to alllower cache levels between the CPU that was issued the requestand the memory resource where the data was resolved, werecord the resources that an accessed data element must havebeen copied to.
B. Application
The term application here refers to the problem beingsolved by a code or the dataset it is solving a problemfor. Complex simulation codes often encounter performancecharacteristics caused by application-specific behavior suchas boundary conditions, non-deterministic execution, or un-predictable changes to the program state for given typesof data. Application-specific behavior also includes elementsof the abstract representation of the problem, such as thedata structures and algorithms used. Several solutions existto mitigate this issue, such as load-balancing techniques and
branch prediction. Some of these treat application-specificperformance as a black box problem, modifying inputs todetermine a combination for which performance is improved.Others are predictive and attempt to determine the causesfor performance degradation and resolve them. The latter, inparticular, requires a great deal of understanding how changesin the application affect performance behavior. In both cases, itis necessary to determine when and where application-specificbehavior causes performance degradation in order to improveit.
Schulz et al. noted the significance of providing contextin terms of the application [7]. The programmer often has anintuition of the application of a program, and Schulz et al.found it useful to provide this intuitive context to performancedata that is otherwise difficult to interpret.
By nature, the application context cannot be generally de-termined. For this reason, we provide three semantic attributesthat are generally useful in providing application context toa memory access sample and created the capability for theprogrammer to easily define additional attributes. The gen-eral attributes provided are the timestamp, access index, andaccessed value. The timestamp can be loosely correspondedto the program state or executing iteration at the time of theaccess. The index indicates the location within a buffer that apiece of data was accessed from. This may be used to deter-mine whether the access occured near a data boundary or if theflow of the program caused accesses to occur in an unexpectedspatial order. This, in conjunction with the timestamp, providesinsight into the access pattern achieved for a specific scenario.The accessed value may be used to determine whether thereexists a correlation between anomalous data and anomalousperformance, such as performing arithmetic with denormalizedvalues or causing a divide-by-zero hardware exception.
The programmer may define any additionally desired se-mantic attribute. Specifically, we have found it useful to definean attribution to the spatial and temporal locations in thedomain of the applied dataset. For example, the spatial locationmay refer to the 2-dimensional coordinates of an elementwithin an array that represents a matrix, and the temporallocation may refer to the iteration or time step during asimulation. These attributes may be derived from the existingsample data or looked up directly from globally accessiblevariables in the program.
C. Code
Providing context in terms of the code is the most directform of attribution given the data in a memory access sample.It is also one of the most essential for optimizing a program.Most forms of performance optimization involve modifyingthe source code (as opposed to configuring the hardware,operating system, scheduling policies, etc.) and thus attributingperformance problems to the code often helps to determinewhat may be modified in order to improve the achievedperformance.
Attribution of memory access data to the context of thecode has been recently done by Liu et al. [8] They mappedmemory access samples to their associated lines of code anddata objects using the instruction pointer and accessed data
address. We use the same method with a slightly differentimplementation, as described in Section V.
We also record metadata regarding an allocated data object,specifically the size of the buffer and individual data elementsin conjunction with the symbol name. This allows us tounderstand how objects are allocated and gives additionalinformation regarding the access pattern, for example, if abuffer is organized as an array of structs (AoS) or struct ofarrays (SoA).
The memory access samples thus include the original at-tributes along with the following appended semantic attributes:
1) Source Code Line2) Source Code File3) Data Symbol4) Buffer Size5) Element Size6) Access Index7) Accessed Value8) Resources Used
Additionally, we annotate performance data and resourcetraversal onto the acquired hardware topology. We gathergeneral statistics regarding the access performance, such asnumber of samples, total cycles, and average cycles for eachresource.
III. SYSTEM OVERVIEW
Our system is comprised of two main parts: a kernelmodule and a source-level instrumentation module. The kernelmodule manages memory access sampling, and the instrumen-tation library is responsible for associating data addresses withsemantic values.
The programmer uses the instrumentation library to specifydata objects of interest and, optionally, functions to collectadditional application-specific semantic attributes. The libraryalso provides functions for configuring memory access sam-pling, for which it communicates with the kernel module. Themodule, in turn, communicates directly with the hardware.
Fig. 1 shows an overview of the basic system. The librarystores metadata for a programmer-provided data object in adata structure called a Semantic Memory Range (SMR). AllSMRs are stored in a Semantic Memory Tree (SMT). Thekernel module begins the memory access sampling unit bysetting the appropriate Machine-Specific Registers (MSRs) inthe hardware and registers an interrupt handler to processand collect samples as they are generated. As the moduleproduces samples, the instrumentation library consumes them,performing semantic attribution and recording the results.Semantic attribution involves searching the SMT for the SMRassociated with the data address of the sample and recordingthe sample data along with the semantic information providedby the SMR (and, optionally, by programmer-defined func-tions). After sampling is terminated, the programmer may storethe acquired data for post-mortem analysis.
In order for semantic attribution to be possible, it mustoccur during the execution of the program. Throughout theexecution, the address range of data objects may change dueto allocation and deallocation operations. In addition, during
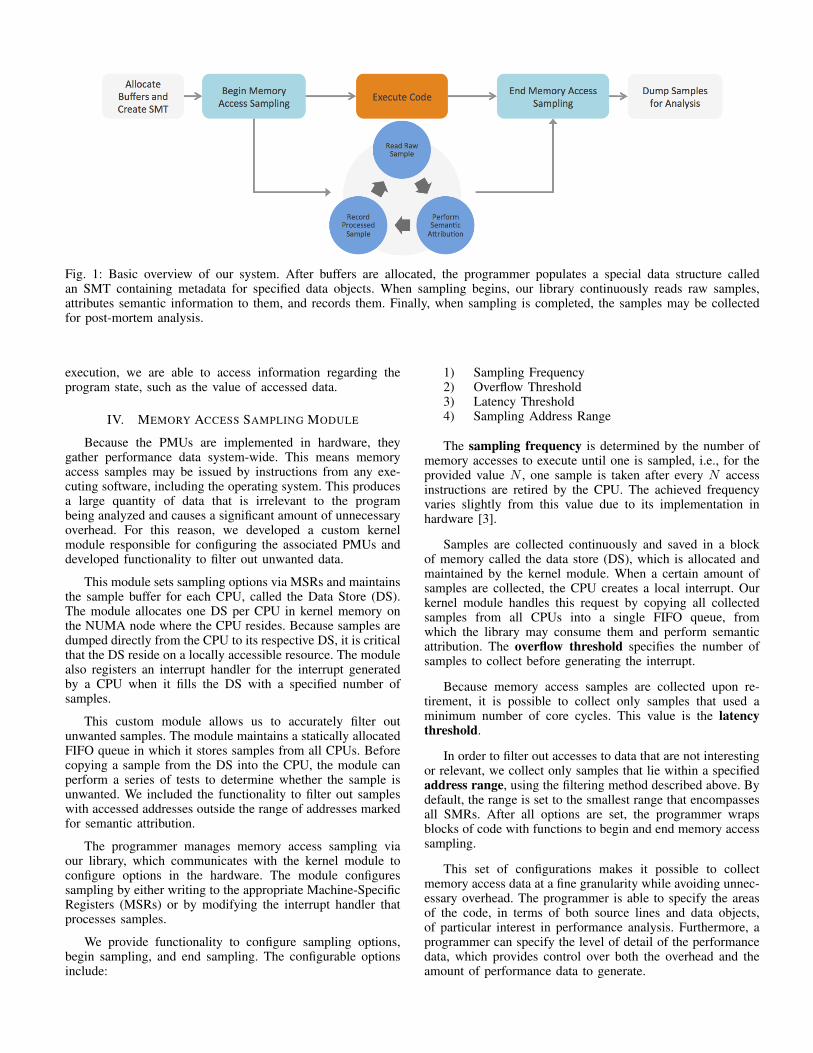
Fig. 1: Basic overview of our system. After buffers are allocated, the programmer populates a special data structure calledan SMT containing metadata for specified data objects. When sampling begins, our library continuously reads raw samples,attributes semantic information to them, and records them. Finally, when sampling is completed, the samples may be collectedfor post-mortem analysis.
execution, we are able to access information regarding theprogram state, such as the value of accessed data.
IV. MEMORY ACCESS SAMPLING MODULE
Because the PMUs are implemented in hardware, theygather performance data system-wide. This means memoryaccess samples may be issued by instructions from any exe-cuting software, including the operating system. This producesa large quantity of data that is irrelevant to the programbeing analyzed and causes a significant amount of unnecessaryoverhead. For this reason, we developed a custom kernelmodule responsible for configuring the associated PMUs anddeveloped functionality to filter out unwanted data.
This module sets sampling options via MSRs and maintainsthe sample buffer for each CPU, called the Data Store (DS).The module allocates one DS per CPU in kernel memory onthe NUMA node where the CPU resides. Because samples aredumped directly from the CPU to its respective DS, it is criticalthat the DS reside on a locally accessible resource. The modulealso registers an interrupt handler for the interrupt generatedby a CPU when it fills the DS with a specified number ofsamples.
This custom module allows us to accurately filter outunwanted samples. The module maintains a statically allocatedFIFO queue in which it stores samples from all CPUs. Beforecopying a sample from the DS into the CPU, the module canperform a series of tests to determine whether the sample isunwanted. We included the functionality to filter out sampleswith accessed addresses outside the range of addresses markedfor semantic attribution.
The programmer manages memory access sampling viaour library, which communicates with the kernel module toconfigure options in the hardware. The module configuressampling by either writing to the appropriate Machine-SpecificRegisters (MSRs) or by modifying the interrupt handler thatprocesses samples.
We provide functionality to configure sampling options,begin sampling, and end sampling. The configurable optionsinclude:
1) Sampling Frequency2) Overflow Threshold3) Latency Threshold4) Sampling Address Range
The sampling frequency is determined by the number ofmemory accesses to execute until one is sampled, i.e., for theprovided value N , one sample is taken after every N accessinstructions are retired by the CPU. The achieved frequencyvaries slightly from this value due to its implementation inhardware [3].
Samples are collected continuously and saved in a blockof memory called the data store (DS), which is allocated andmaintained by the kernel module. When a certain amount ofsamples are collected, the CPU creates a local interrupt. Ourkernel module handles this request by copying all collectedsamples from all CPUs into a single FIFO queue, fromwhich the library may consume them and perform semanticattribution. The overflow threshold specifies the number ofsamples to collect before generating the interrupt.
Because memory access samples are collected upon re-tirement, it is possible to collect only samples that used aminimum number of core cycles. This value is the latencythreshold.
In order to filter out accesses to data that are not interestingor relevant, we collect only samples that lie within a specifiedaddress range, using the filtering method described above. Bydefault, the range is set to the smallest range that encompassesall SMRs. After all options are set, the programmer wrapsblocks of code with functions to begin and end memory accesssampling.
This set of configurations makes it possible to collectmemory access data at a fine granularity while avoiding unnec-essary overhead. The programmer is able to specify the areasof the code, in terms of both source lines and data objects,of particular interest in performance analysis. Furthermore, aprogrammer can specify the level of detail of the performancedata, which provides control over both the overhead and theamount of performance data to generate.

V. SOURCE-LEVEL INSTRUMENTATION
Semantic attribution requires the programmer to provideknowledge from which the library will extract semantic infor-mation. We developed a source-level instrumentation librarythat accepts the required input and performs semantic attribu-tion in run-time. We describe the methods to use our instru-mentation library and the underlying mechanisms used, andwe demonstrate code snippets performing this instrumentationin a simple example.
A. Specifying Data Objects
The programmer specifies a set of data objects for whichsemantic attributes will be recorded. Data objects are con-tiguous allocated blocks of memory, such as single variables,arrays, and vectors. This is done by creating a SemanticMemory Tree (SMT) and populating it with Semantic MemoryRanges (SMR). The SMRs provide the necessary informationto extract semantic attributes from memory access samples inrun-time.
The SMT is an Adelson-Velskii and Landis’ (AVL) tree,meaning it is a self-balancing binary tree. The programmerinitializes an SMT by calling its constructor and populates itby inserting SMRs into it. An SMR consists of:
1) A label string2) The start and end addresses3) The size of each element4) The number of elements
The programmer creates and inserts SMRs by passing thesevariables as arguments to functions within our library. Leavesin the SMT represent SMRs, and internal nodes are createdsuch that the address range of every parent encompasses theaddress ranges of both its children.
Whenever the library consumes a memory access sampleproduced by the kernel module, it searches for the SMR thatcontains the data address accessed. Because this happens dur-ing program execution, it is critical that the lookup be highlyefficient in order to minimize overhead. We organized the SMTas an AVL tree, which guarantees O(logN) lookups. Liu andMellor-Crummey used a splay tree for a similar purpose [?].Both implementations have advantages; the splay tree takesadvantage of temporal locality but has a worst-case complexityof O(N), while the AVL tree has a consistent complexity ofO(logN). We chose the AVL tree because we cannot predictwhat various instrumentation and sampling configurations theprogrammer sets, and thus we cannot be certain if an executionwill create worst-case scenarios for the splay tree.
B. Semantic Attribution
After the SMR associated with a memory access sample isfound, the library uses this information to derive the semanticattributes listed in Section II. The data symbol, buffer size,and element size are already available in the metadata of theSMR, and the kernel module records the CPU timestamp atthe time it receives a memory access sample. The resourcesused are available from the memory access sample.
We determine the line and file of the source code using theinstruction pointer and debug symbols in the code that provide
this mapping. We calculate the access index using the SMRstart address s, element size e, and accessed data address d, as(d−s)/e. In cases where an individual element is comprised ofmultiple values, such as a struct or tuple, we can also determinewhich value within the element was accessed. Using the datasymbol and access index, we look up the accessed value fora particular piece of data and record it as well.
C. Programmer-defined Semantic Attribution
In addition to the semantic attributes from Section II, weprovide the capability for the programmer to define functionsto derive further attributes. These may be application-specificvariables, such as variables values and program state at thetime of a memory access. We have particularly observedthe effectiveness of using programmer-defined attribution tomap an accessed index to a spatial or temporal location inthe context of the application. We demonstrate this with anexample in the following section.
Every SMR contains a function in which it performs se-mantic attribution for a given SMR and memory access sample.The programmer may define a set of additional attributesand write a function that accepts an SMR and a memoryaccess sample and produces values for the additional attributes.The programmer must keep in mind that this function willrun during the program execution for every sample, and thusmust take necessary precautions to avoid incurring excessiveoverhead.
D. Instrumentation Example: Matrix Multiplication
We demonstrate the instrumentation steps necessary to useour method for a simple matrix multiplication example. Weshow code snippets for specifying the matrix data objects anddefining a custom semantic attribution.
We are interested in the accesses to three data objects: thetwo input matrices to be multiplied and the output matrix.As described, we create an SMT and one SMR for each dataobject. To avoid redundancy, we show the code for specifyingone of the three matrices. The syntax is as follows:
#define N 1024double A[N][N]; // matrix data object
SMRTree *smrt = new SMRTree();SMRNode *A_SMR =
smrt->addSMR("A", sizeof(double), A, N*N);
By providing the pointer to the first element in each dataobject as well as the size and number of elements, our librarycan determine the complete range of addresses associated withthe object. The data symbol string must be provided duringinstrumentation, as C does not allow code reflection.
This information is sufficient to gather memory accessdata with the default provided semantic attributes. To specifyadditional attributes, we first define new attributes, as such:
smrt->addIntegerAttribute("x_coord",-1);smrt->addIntegerAttribute("y_coord",-1);
The x_coord and y_coord attributes refer to the 2-dimensional coordinates of a data element within a matrix.The second argument specifies the default value.

(a) (b)
Fig. 2: The radial hierarchy (sunburst) visualization for hard-ware topology. (a) Dark purple arcs are NUMA domains, lightpurple are L3 caches, dark orange are CPUs, and light orangeare L1 and L2 caches. (b) shows a more complex topologywith performance data annotated. We annotate the number ofcycles caused by access to a resource with color; darker meansmore cycles. Resource traversal is indicated by lines betweenresources, where thicker indicates more data.
Fig. 3: The parallel coordinate visualization for a singlememory access sample. The red line represents the sample,and the black lines represent its attributes. The intersectionsdenote the values of the sample for each attribute.
With the knowledge that the matrices are stored in row-major ordering, we define the following function to populatethese attributes:
void* mat_attribution(SMRNode *smr,struct mem_sample *sample)
{// Obtain the index of the addressint bufferIndex =
smr->indexOf(sample->daddr);
// Calculate the x and y indices (row-major)sample->setAttribute("x_coord", bufferIndex % N);sample->setAttribute("y_coord", bufferIndex / N);
}
The indexOf function provides the array index, withwhich we can calculate the x and y coordinates for a row-majorordering. The resulting data will have these values appendedfor every memory access sample.
VI. VISUALIZATION AND ANALYSIS
We developed a tool, MemAxes, that allows a user tovisually analyze the acquired memory access performancedata. Here, we briefly describe the visualization methodsof MemAxes and how they are interpreted, and we showscreenshots of the tool to explain our results in Section VII.
MemAxes takes advantage of the semantic attributes of thedata to create intuitive visualizations with context. It featuresmultiple coordinated views, each of which represents the datain a different context, and allows the user to specify selectionsin the various views. The tightly linked nature of the differentviews allows us to examine patterns and correlations betweendifferent contexts. We briefly describe three views featured inMemAxes, (1) the application view, (2) the hardware topologyview, and (3) the parallel coordinates [9] view.
A. Application
As described in Section V, we can attribute memory accesssamples to spatial locations with respect to the applied dataset.We can then employ the same visualization methods that aretypically used to show the dataset. MemAxes employs directvolume rendering (DVR), a technique capable of displayingscalar 3-dimensional data, to do so. DVR represents scalarvalues using colors and opacities in 3-dimensional space. Inthis case, locations of higher opacity and green color indicatemore cycles taken to access elements mapped to a particularspatial location (shown in Fig. 4). In order to effectivelynavigate the 3-dimensional space, MemAxes allows interactiverotating and zooming as well.
B. Hardware Topology
We record performance data in terms of the node hardwaretopology, as outlined in Section V, and thus we can visualizethe data laid out in a representation of the topology. MemAxesdisplays the hardware topology in the form of a radial hierar-chy known as a sunburst chart [10]. Larger memory resourcesare placed in the center, CPU IDs are placed on the outerleaves, and caches are shown for their associated CPUs inbetween, as shown in Fig. 2. The color of each segment inthe sunburst chart indicate the number of cycles associatedwith the access samples that resolved in a particular resource.The resource traversal is represented by black lines connectingradial segments—thicker indicates more samples were copiedbetween a pair of resources.
C. Parallel Coordinates
Lastly, MemAxes employs a multidimensional visualiza-tion technique called parallel coordinates [9]. This view showseach sample as a polyline intersecting a set of parallel axes.The polyline is constructed such that the intersection betweenit and the parallel axes indicate the value of a single attribute inthe sample. An example is shown in Fig. 3. This view enablesa user to view correlations between a high number of differentattributes by examining line segments between axes—crossingline segments indicate negative correlation, while parallel linesegments indicate positive correlation.
We modified the standard parallel coordinate implementa-tion to include histograms along each axis in MemAxes. The
histograms represent the distribution of values along one axisfor the shown data, shown in Fig. 6 and 7
D. Analysis Methodology
The process of exploring the dataset to find features ofinterest requires the user to make interesting selections. Thisis often not straightforward, and as such we developed abasic methodology for useful interaction in MemAxes. Thismethodology is essentially (1) identify any anomalies in anyof the views, and (2) select the anomalous data and look forpatterns or correlations in the selected data.
Here, data anomalies refer to data outliers or identifiabledistributions (such as a cluster of memory accesses originatingfrom a small set of variables). Patterns and correlations thatmay be observed are relative to the view in which they arevisible, e.g. the hardware topology view may show that aselection of memory accesses were requested mainly fromeven-numbered CPUs. Parallel coordinates are particularlysuited for viewing correlations between pairs of attributes—the axes may be reordered to place two dimensions next toeach other, and if the lines between them are uncrossed, thedata is positively correlated, while many crossings indicate anegative correlation.
VII. CASE STUDIES
We used our method to identify real performance problemsin two different benchmark applications, LULESH and XS-Bench. All executions were performed on an isolated singlenode of the Hyperion HPC test bed [11]. This node usesan Intel Xeon E5-2660, which features 32 logical CPUs (16physical), 16 32kB L1 caches, 16 256kB L2 caches, 2 20MBL3 caches, and 2 32GB NUMA domains.
A. LULESH
Livermore Unstructured Lagrangian Explicit Shock Hydro-dynamics (LULESH) is a proxy application for calculatingthe Sedov blast problem [12]. It highlights the performancecharacteristics involved with performing simulations on anunstructured mesh. Specifically, as the mesh deforms to matchthe underlying Lagrangian structures, the changing mesh co-ordinate locations must be looked up via a secondary array.This indirect method for determining coodinate locations oftencauses memory access inefficiency. LULESH takes advan-tage of parallelism via OpenMP, and we hoped to determinewhether the parallel decomposition could be related to itsmemory performance characteristics.
We instrumented all persistent data buffers that containedstate information for the simulated mesh. We also provided twoapplication-specific semantic attributes: 3-dimensional locationand iteration. Like the example in Section V we created afunction to determine mesh coordinates. In this case, the meshis a 3-dimensional, row-major ordered array. We also provideda function to look up and record the currently executingiteration.
We ran LULESH for a 453-resolution mesh while obtainingsemantic memory access samples for the code segment thatruns the iterative simulation steps. We set the memory sam-pling configuration to sample an access every four instructionsand only those with access latencies greater than 30 cycles.
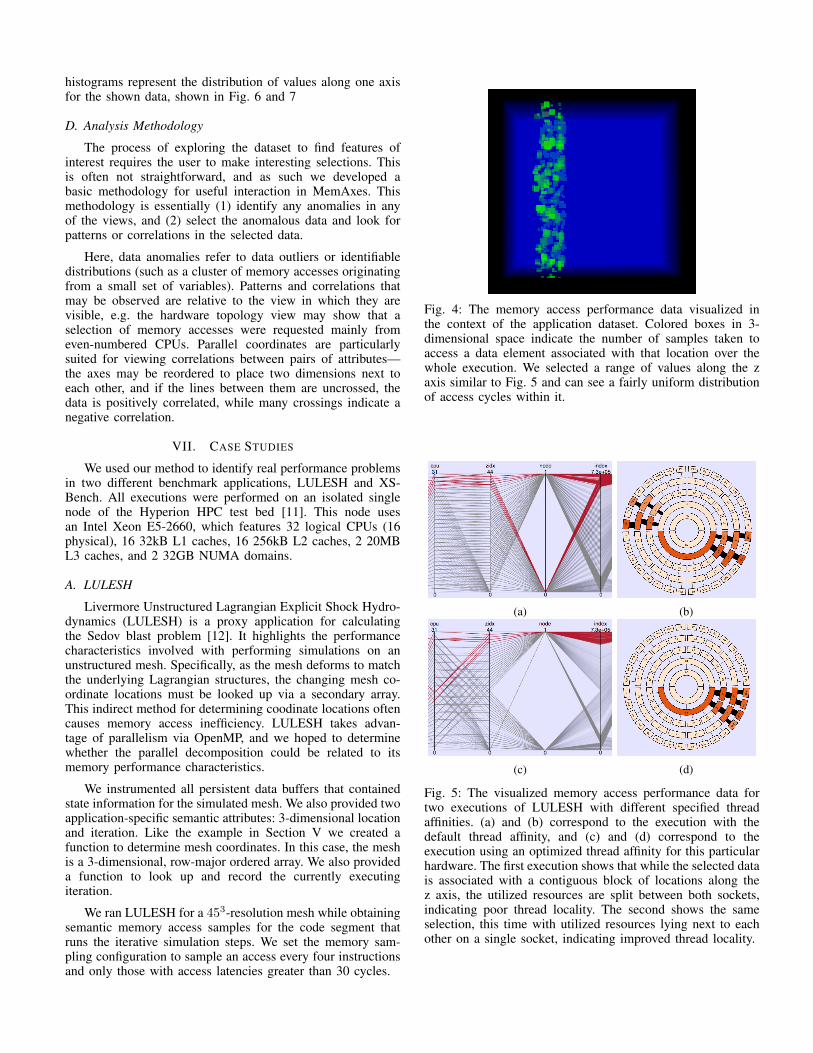
Fig. 4: The memory access performance data visualized inthe context of the application dataset. Colored boxes in 3-dimensional space indicate the number of samples taken toaccess a data element associated with that location over thewhole execution. We selected a range of values along the zaxis similar to Fig. 5 and can see a fairly uniform distributionof access cycles within it.
(a) (b)
(c) (d)
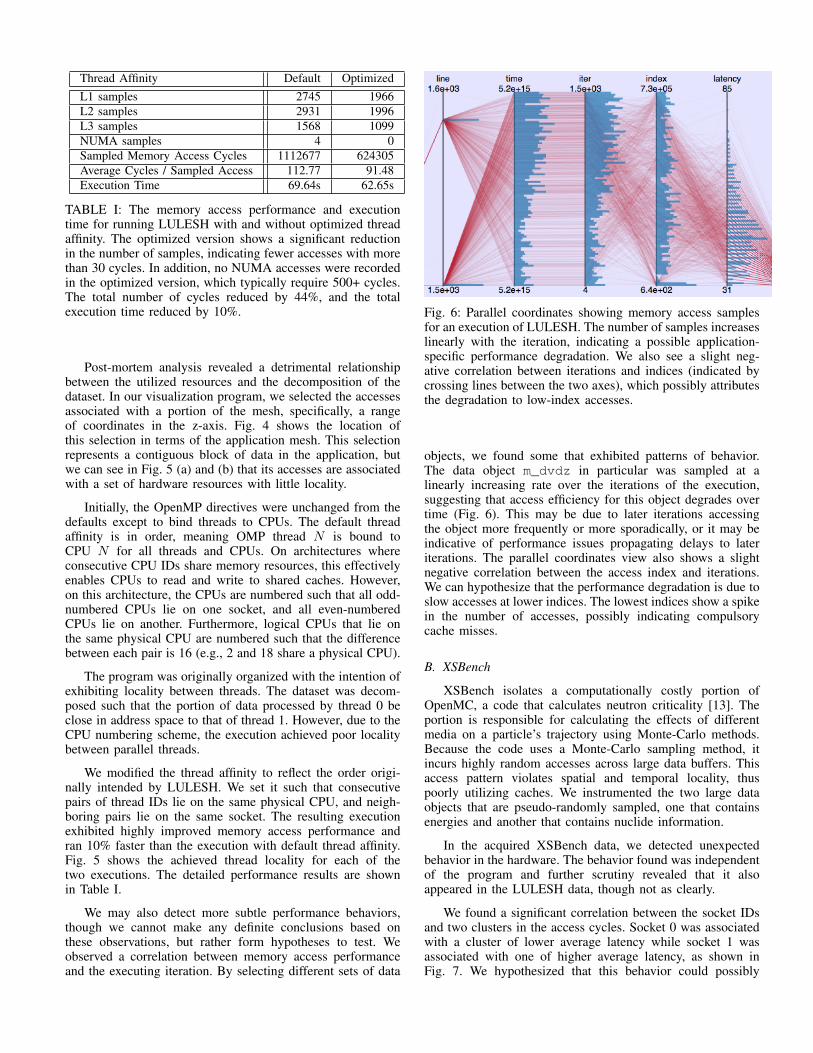
Fig. 5: The visualized memory access performance data fortwo executions of LULESH with different specified threadaffinities. (a) and (b) correspond to the execution with thedefault thread affinity, and (c) and (d) correspond to theexecution using an optimized thread affinity for this particularhardware. The first execution shows that while the selected datais associated with a contiguous block of locations along thez axis, the utilized resources are split between both sockets,indicating poor thread locality. The second shows the sameselection, this time with utilized resources lying next to eachother on a single socket, indicating improved thread locality.
Thread Affinity Default OptimizedL1 samples 2745 1966L2 samples 2931 1996L3 samples 1568 1099NUMA samples 4 0Sampled Memory Access Cycles 1112677 624305Average Cycles / Sampled Access 112.77 91.48Execution Time 69.64s 62.65s
TABLE I: The memory access performance and executiontime for running LULESH with and without optimized threadaffinity. The optimized version shows a significant reductionin the number of samples, indicating fewer accesses with morethan 30 cycles. In addition, no NUMA accesses were recordedin the optimized version, which typically require 500+ cycles.The total number of cycles reduced by 44%, and the totalexecution time reduced by 10%.
Post-mortem analysis revealed a detrimental relationshipbetween the utilized resources and the decomposition of thedataset. In our visualization program, we selected the accessesassociated with a portion of the mesh, specifically, a rangeof coordinates in the z-axis. Fig. 4 shows the location ofthis selection in terms of the application mesh. This selectionrepresents a contiguous block of data in the application, butwe can see in Fig. 5 (a) and (b) that its accesses are associatedwith a set of hardware resources with little locality.
Initially, the OpenMP directives were unchanged from thedefaults except to bind threads to CPUs. The default threadaffinity is in order, meaning OMP thread N is bound toCPU N for all threads and CPUs. On architectures whereconsecutive CPU IDs share memory resources, this effectivelyenables CPUs to read and write to shared caches. However,on this architecture, the CPUs are numbered such that all odd-numbered CPUs lie on one socket, and all even-numberedCPUs lie on another. Furthermore, logical CPUs that lie onthe same physical CPU are numbered such that the differencebetween each pair is 16 (e.g., 2 and 18 share a physical CPU).
The program was originally organized with the intention ofexhibiting locality between threads. The dataset was decom-posed such that the portion of data processed by thread 0 beclose in address space to that of thread 1. However, due to theCPU numbering scheme, the execution achieved poor localitybetween parallel threads.
We modified the thread affinity to reflect the order origi-nally intended by LULESH. We set it such that consecutivepairs of thread IDs lie on the same physical CPU, and neigh-boring pairs lie on the same socket. The resulting executionexhibited highly improved memory access performance andran 10% faster than the execution with default thread affinity.Fig. 5 shows the achieved thread locality for each of thetwo executions. The detailed performance results are shownin Table I.
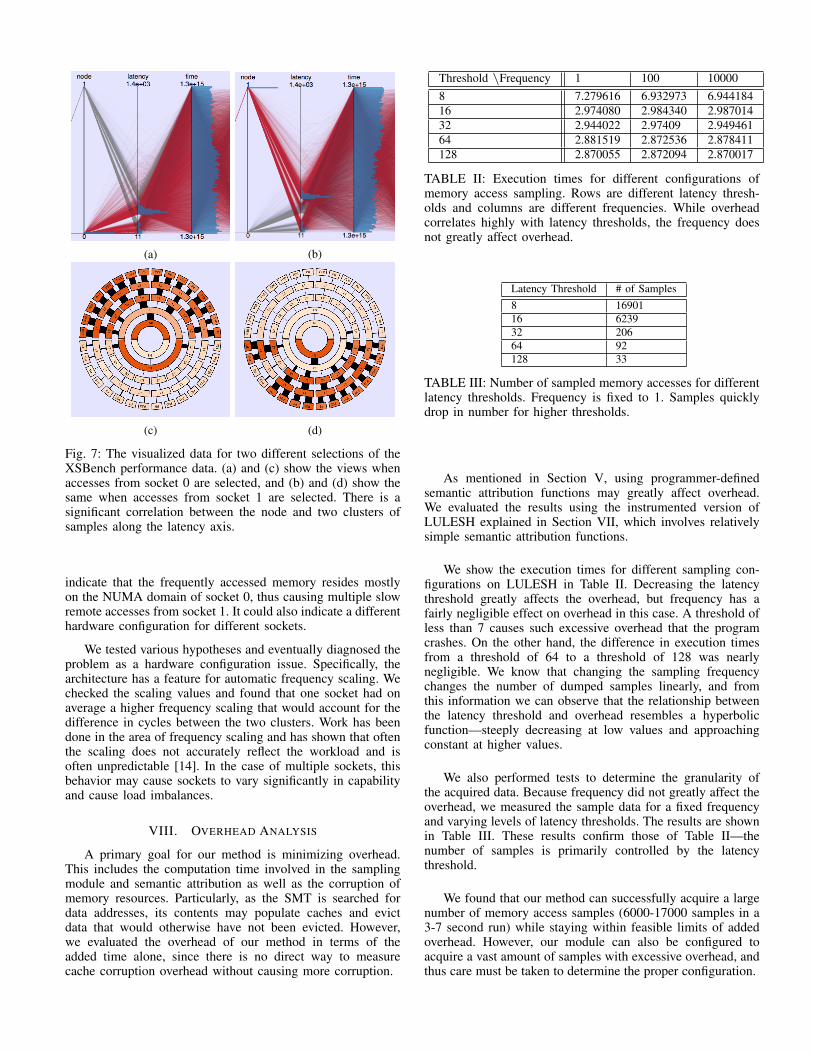
We may also detect more subtle performance behaviors,though we cannot make any definite conclusions based onthese observations, but rather form hypotheses to test. Weobserved a correlation between memory access performanceand the executing iteration. By selecting different sets of data
Fig. 6: Parallel coordinates showing memory access samplesfor an execution of LULESH. The number of samples increaseslinearly with the iteration, indicating a possible application-specific performance degradation. We also see a slight neg-ative correlation between iterations and indices (indicated bycrossing lines between the two axes), which possibly attributesthe degradation to low-index accesses.
objects, we found some that exhibited patterns of behavior.The data object m_dvdz in particular was sampled at alinearly increasing rate over the iterations of the execution,suggesting that access efficiency for this object degrades overtime (Fig. 6). This may be due to later iterations accessingthe object more frequently or more sporadically, or it may beindicative of performance issues propagating delays to lateriterations. The parallel coordinates view also shows a slightnegative correlation between the access index and iterations.We can hypothesize that the performance degradation is due toslow accesses at lower indices. The lowest indices show a spikein the number of accesses, possibly indicating compulsorycache misses.
B. XSBench
XSBench isolates a computationally costly portion ofOpenMC, a code that calculates neutron criticality [13]. Theportion is responsible for calculating the effects of differentmedia on a particle’s trajectory using Monte-Carlo methods.Because the code uses a Monte-Carlo sampling method, itincurs highly random accesses across large data buffers. Thisaccess pattern violates spatial and temporal locality, thuspoorly utilizing caches. We instrumented the two large dataobjects that are pseudo-randomly sampled, one that containsenergies and another that contains nuclide information.
In the acquired XSBench data, we detected unexpectedbehavior in the hardware. The behavior found was independentof the program and further scrutiny revealed that it alsoappeared in the LULESH data, though not as clearly.
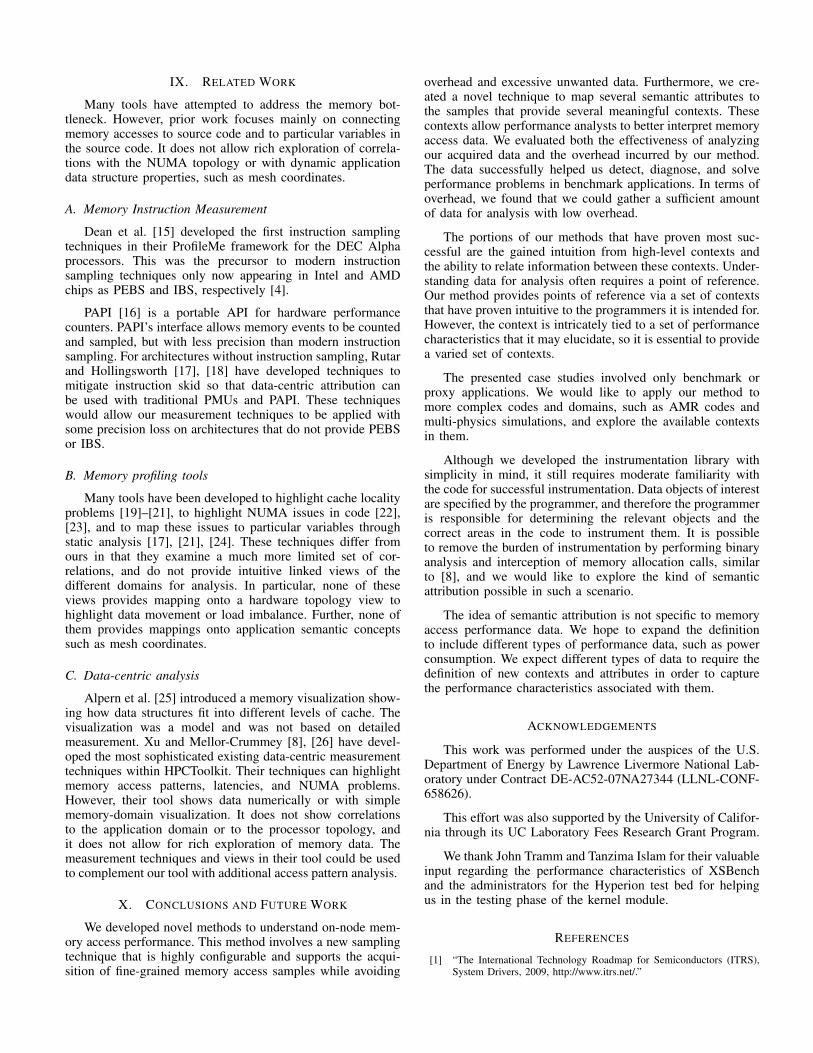
We found a significant correlation between the socket IDsand two clusters in the access cycles. Socket 0 was associatedwith a cluster of lower average latency while socket 1 wasassociated with one of higher average latency, as shown inFig. 7. We hypothesized that this behavior could possibly
(a) (b)
(c) (d)
Fig. 7: The visualized data for two different selections of theXSBench performance data. (a) and (c) show the views whenaccesses from socket 0 are selected, and (b) and (d) show thesame when accesses from socket 1 are selected. There is asignificant correlation between the node and two clusters ofsamples along the latency axis.
indicate that the frequently accessed memory resides mostlyon the NUMA domain of socket 0, thus causing multiple slowremote accesses from socket 1. It could also indicate a differenthardware configuration for different sockets.
We tested various hypotheses and eventually diagnosed theproblem as a hardware configuration issue. Specifically, thearchitecture has a feature for automatic frequency scaling. Wechecked the scaling values and found that one socket had onaverage a higher frequency scaling that would account for thedifference in cycles between the two clusters. Work has beendone in the area of frequency scaling and has shown that oftenthe scaling does not accurately reflect the workload and isoften unpredictable [14]. In the case of multiple sockets, thisbehavior may cause sockets to vary significantly in capabilityand cause load imbalances.
VIII. OVERHEAD ANALYSIS
A primary goal for our method is minimizing overhead.This includes the computation time involved in the samplingmodule and semantic attribution as well as the corruption ofmemory resources. Particularly, as the SMT is searched fordata addresses, its contents may populate caches and evictdata that would otherwise have not been evicted. However,we evaluated the overhead of our method in terms of theadded time alone, since there is no direct way to measurecache corruption overhead without causing more corruption.
Threshold \Frequency 1 100 100008 7.279616 6.932973 6.94418416 2.974080 2.984340 2.98701432 2.944022 2.97409 2.94946164 2.881519 2.872536 2.878411128 2.870055 2.872094 2.870017
TABLE II: Execution times for different configurations ofmemory access sampling. Rows are different latency thresh-olds and columns are different frequencies. While overheadcorrelates highly with latency thresholds, the frequency doesnot greatly affect overhead.
Latency Threshold # of Samples8 1690116 623932 20664 92128 33
TABLE III: Number of sampled memory accesses for differentlatency thresholds. Frequency is fixed to 1. Samples quicklydrop in number for higher thresholds.
As mentioned in Section V, using programmer-definedsemantic attribution functions may greatly affect overhead.We evaluated the results using the instrumented version ofLULESH explained in Section VII, which involves relativelysimple semantic attribution functions.
We show the execution times for different sampling con-figurations on LULESH in Table II. Decreasing the latencythreshold greatly affects the overhead, but frequency has afairly negligible effect on overhead in this case. A threshold ofless than 7 causes such excessive overhead that the programcrashes. On the other hand, the difference in execution timesfrom a threshold of 64 to a threshold of 128 was nearlynegligible. We know that changing the sampling frequencychanges the number of dumped samples linearly, and fromthis information we can observe that the relationship betweenthe latency threshold and overhead resembles a hyperbolicfunction—steeply decreasing at low values and approachingconstant at higher values.
We also performed tests to determine the granularity ofthe acquired data. Because frequency did not greatly affect theoverhead, we measured the sample data for a fixed frequencyand varying levels of latency thresholds. The results are shownin Table III. These results confirm those of Table II—thenumber of samples is primarily controlled by the latencythreshold.
We found that our method can successfully acquire a largenumber of memory access samples (6000-17000 samples in a3-7 second run) while staying within feasible limits of addedoverhead. However, our module can also be configured toacquire a vast amount of samples with excessive overhead, andthus care must be taken to determine the proper configuration.
IX. RELATED WORK
Many tools have attempted to address the memory bot-tleneck. However, prior work focuses mainly on connectingmemory accesses to source code and to particular variables inthe source code. It does not allow rich exploration of correla-tions with the NUMA topology or with dynamic applicationdata structure properties, such as mesh coordinates.
A. Memory Instruction Measurement
Dean et al. [15] developed the first instruction samplingtechniques in their ProfileMe framework for the DEC Alphaprocessors. This was the precursor to modern instructionsampling techniques only now appearing in Intel and AMDchips as PEBS and IBS, respectively [4].
PAPI [16] is a portable API for hardware performancecounters. PAPI’s interface allows memory events to be countedand sampled, but with less precision than modern instructionsampling. For architectures without instruction sampling, Rutarand Hollingsworth [17], [18] have developed techniques tomitigate instruction skid so that data-centric attribution canbe used with traditional PMUs and PAPI. These techniqueswould allow our measurement techniques to be applied withsome precision loss on architectures that do not provide PEBSor IBS.
B. Memory profiling tools
Many tools have been developed to highlight cache localityproblems [19]–[21], to highlight NUMA issues in code [22],[23], and to map these issues to particular variables throughstatic analysis [17], [21], [24]. These techniques differ fromours in that they examine a much more limited set of cor-relations, and do not provide intuitive linked views of thedifferent domains for analysis. In particular, none of theseviews provides mapping onto a hardware topology view tohighlight data movement or load imbalance. Further, none ofthem provides mappings onto application semantic conceptssuch as mesh coordinates.
C. Data-centric analysis
Alpern et al. [25] introduced a memory visualization show-ing how data structures fit into different levels of cache. Thevisualization was a model and was not based on detailedmeasurement. Xu and Mellor-Crummey [8], [26] have devel-oped the most sophisticated existing data-centric measurementtechniques within HPCToolkit. Their techniques can highlightmemory access patterns, latencies, and NUMA problems.However, their tool shows data numerically or with simplememory-domain visualization. It does not show correlationsto the application domain or to the processor topology, andit does not allow for rich exploration of memory data. Themeasurement techniques and views in their tool could be usedto complement our tool with additional access pattern analysis.
X. CONCLUSIONS AND FUTURE WORK
We developed novel methods to understand on-node mem-ory access performance. This method involves a new samplingtechnique that is highly configurable and supports the acqui-sition of fine-grained memory access samples while avoiding
overhead and excessive unwanted data. Furthermore, we cre-ated a novel technique to map several semantic attributes tothe samples that provide several meaningful contexts. Thesecontexts allow performance analysts to better interpret memoryaccess data. We evaluated both the effectiveness of analyzingour acquired data and the overhead incurred by our method.The data successfully helped us detect, diagnose, and solveperformance problems in benchmark applications. In terms ofoverhead, we found that we could gather a sufficient amountof data for analysis with low overhead.
The portions of our methods that have proven most suc-cessful are the gained intuition from high-level contexts andthe ability to relate information between these contexts. Under-standing data for analysis often requires a point of reference.Our method provides points of reference via a set of contextsthat have proven intuitive to the programmers it is intended for.However, the context is intricately tied to a set of performancecharacteristics that it may elucidate, so it is essential to providea varied set of contexts.
The presented case studies involved only benchmark orproxy applications. We would like to apply our method tomore complex codes and domains, such as AMR codes andmulti-physics simulations, and explore the available contextsin them.
Although we developed the instrumentation library withsimplicity in mind, it still requires moderate familiarity withthe code for successful instrumentation. Data objects of interestare specified by the programmer, and therefore the programmeris responsible for determining the relevant objects and thecorrect areas in the code to instrument them. It is possibleto remove the burden of instrumentation by performing binaryanalysis and interception of memory allocation calls, similarto [8], and we would like to explore the kind of semanticattribution possible in such a scenario.
The idea of semantic attribution is not specific to memoryaccess performance data. We hope to expand the definitionto include different types of performance data, such as powerconsumption. We expect different types of data to require thedefinition of new contexts and attributes in order to capturethe performance characteristics associated with them.
ACKNOWLEDGEMENTS
This work was performed under the auspices of the U.S.Department of Energy by Lawrence Livermore National Lab-oratory under Contract DE-AC52-07NA27344 (LLNL-CONF-658626).
This effort was also supported by the University of Califor-nia through its UC Laboratory Fees Research Grant Program.
We thank John Tramm and Tanzima Islam for their valuableinput regarding the performance characteristics of XSBenchand the administrators for the Hyperion test bed for helpingus in the testing phase of the kernel module.
REFERENCES
[1] “The International Technology Roadmap for Semiconductors (ITRS),System Drivers, 2009, http://www.itrs.net/.”
[2] W. A. Wulf and S. A. McKee, “Hitting the memory wall:Implications of the obvious,” SIGARCH Comput. Archit. News,vol. 23, no. 1, pp. 20–24, Mar. 1995. [Online]. Available:http://doi.acm.org/10.1145/216585.216588
[3] Intel 64 and IA-32 Architectures Software Developer’s Manual - Volume3B, Intel Corporation, August 2007.
[4] P. J. Drongowski, L. Yu, F. Swehosky, S. Suthikulpanit, andR. Richter, “Incorporating instruction-based sampling into amdcodeanalyst.” in ISPASS. IEEE Computer Society, 2010, pp. 119–120.[Online]. Available: http://dblp.uni-trier.de/db/conf/ispass/ispass2010.html#DrongowskiYSSR10
[5] F. Broquedis, J. Clet-Ortega, S. Moreaud, N. Furmento, B. Goglin,G. Mercier, S. Thibault, and R. Namyst, “Hwloc: A generic frameworkfor managing hardware affinities in hpc applications,” in Proceedingsof the 2010 18th Euromicro Conference on Parallel, Distributed andNetwork-based Processing, ser. PDP ’10. Washington, DC, USA:IEEE Computer Society, 2010, pp. 180–186. [Online]. Available:http://dx.doi.org/10.1109/PDP.2010.67
[6] J. Treibig, G. Hager, and G. Wellein, “Likwid: A lightweightperformance-oriented tool suite for x86 multicore environments,”CoRR, vol. abs/1004.4431, 2010. [Online]. Available: http://dblp.uni-trier.de/db/journals/corr/corr1004.html#abs-1004-4431
[7] M. Schulz, J. A. Levine, P. T. Bremer, T. Gamblin, and V. Pascucci,“Interpreting Performance Data across Intuitive Domains,” in ParallelProcessing (ICPP), 2011 International Conference on. IEEE, 2011,pp. 206–215.
[8] X. Liu and J. Mellor-Crummey, “A data-centric profiler for parallelprograms,” in Proceedings of the International Conference on HighPerformance Computing, Networking, Storage and Analysis, ser. SC’13. New York, NY, USA: ACM, 2013, pp. 28:1–28:12. [Online].Available: http://doi.acm.org/10.1145/2503210.2503297
[9] A. Inselberg and B. Dimsdale, “Parallel coordinates: a tool for visual-izing multi-dimensional geometry,” in VIS ’90: Proceedings of the 1stconference on Visualization ’90. IEEE Computer Society Press, Oct.1990, pp. 361–378.
[10] J. Stasko and E. Zhang, “Focus+context display and navigation tech-niques for enhancing radial, space-filling hierarchy visualizations,”Information Visualization, 2000. InfoVis 2000. IEEE Symposium on,pp. 57–65, 2000.
[11] K. Light, “Hyperion: A titan of high-performance computing systems,”Science and Technology Review, pp. 15–16, Dec. 2009.
[12] “Hydrodynamics Challenge Problem, Lawrence Livermore NationalLaboratory,” Tech. Rep. LLNL-TR-490254.
[13] J. R. Tramm, A. R. Siegel, T. Islam, and M. Schulz, “XSBench–Thedevelopment and verification of a performance abstraction for MonteCarlo reactor analysis,” mcs.anl.gov.
[14] B. Rountree, D. Ahn, B. De Supinski, D. Lowenthal, and M. Schulz,“Beyond dvfs: A first look at performance under a hardware-enforcedpower bound,” in Parallel and Distributed Processing SymposiumWorkshops PhD Forum (IPDPSW), 2012 IEEE 26th International, May2012, pp. 947–953.
[15] J. Dean, J. E. Hicks, C. A. Waldspurger, W. E. Weihl, and G. Chrysos,“Profileme: Hardware support for instruction-level profiling on out-of-order processors,” in Proceedings of the 30th Annual ACM/IEEEInternational Symposium on Microarchitecture, ser. MICRO 30.Washington, DC, USA: IEEE Computer Society, 1997, pp. 292–302.[Online]. Available: http://dl.acm.org/citation.cfm?id=266800.266828
[16] P. J. Mucci, S. Browne, C. Deane, and G. Ho, “PAPI: A portableinterface to hardware performance counters,” in Proc. Department ofDefense HPCMP User Group Conference, Jun. 1999.
[17] N. Rutar and J. K. Hollingsworth, “Data centric techniques for mappingperformance data to program variables,” Parallel Computing, vol. 38,no. 1-2, pp. 2–14, 2012.
[18] ——, “Software techniques for negating skid and approximating cachemiss measurements,” Parallel Computing, vol. 39, no. 3, pp. 120–131,2013.
[19] W. Cachegrind, “a cache-miss profiler,”http://valgrind.org/docs/manual/cg-manual.html.
[20] B. R. Buck and J. K. Hollingsworth, “Data centric cache measurement
on the Intel Itanium 2 processor,” in Supercomputing (SC’04), Wash-ington, DC, USA 2004, p. 58.
[21] M. Martonosi, A. Gupta, and T. Anderson, “Memspy: Analyzingmemory system bottlenecks in programs,” in Proceedings ofthe 1992 ACM SIGMETRICS Joint International Conference onMeasurement and Modeling of Computer Systems, ser. SIGMETRICS’92/PERFORMANCE ’92. New York, NY, USA: ACM, 1992, pp.1–12. [Online]. Available: http://doi.acm.org/10.1145/133057.133079
[22] C. McCurdy and J. S. Vetter, “Memphis: Finding and fixing NUMA-related performacne problems on multi-core platforms,” in IEEE Intl.Symp. on Performance Analysis of Systems Software (ISPASS’10),March 2010, pp. 87–96.
[23] R. Lchaize, B. Lepers, and V. Quema, “MemProf: a memory profilersfor NUMA multicore systems,” in USENIX Annual Technical Confer-ence (USENIX ATC’12), Berkeley, CA, 2012.
[24] R. B. Irvin and B. P. Miller, “Mapping performance data for high-level and data views of parallel program performance,” in InternationalConference on Supercomputing (ICS’96), New York, NY, USA, 1996,pp. 69–77.
[25] B. Alpern, L. Carter, and T. Selker, “Visualizing computer memoryarchitectures,” in Visualization, 1990. Visualization ’90., Proceedingsof the First IEEE Conference on. IEEE Comput. Soc. Press, 1990, pp.107–113.
[26] X. Liu and J. Mellor-Crummey, “A tool to analyze the performanceof multithreaded programs on NUMA architectures,” in PPoPP ’14:Proceedings of the 19th ACM SIGPLAN symposium on Principles andpractice of parallel programming. New York, New York, USA: ACMRequest Permissions, Feb. 2014, pp. 259–272.