dissecting the first transcriptional divergence during
TRANSCRIPT
Dissecting the First Transcriptional DivergenceDuring Human Embryonic Development
Qiang Bai & Said Assou & Delphine Haouzi & Jean-Marie Ramirez & Cécile Monzo &
Fabienne Becker & Sabine Gerbal-Chaloin & Samir Hamamah & John De Vos
Published online: 13 July 2011# The Author(s) 2011. This article is published with open access at Springerlink.com
Abstract The trophoblast cell lineage is specified early atthe blastocyst stage, leading to the emergence of thetrophectoderm and the pluripotent cells of the inner cellmass. Using a double mRNA amplification technique and acomparison with transcriptome data on pluripotent stemcells, placenta, germinal and adult tissues, we report heresome essential molecular features of the human muraltrophectoderm. In addition to genes known for their role in
placenta (CGA, PGF, ALPPL2 and ABCG2), humantrophectoderm also strongly expressed Laminins, such asLAMA1, and the GAGE Cancer/Testis genes. The very highlevel of ABCG2 expression in trophectoderm, 7.9-foldhigher than in placenta, suggests a major role of this genein shielding the very early embryo from xenobiotics.Several genes, including CCKBR and DNMT3L, werespecifically up-regulated only in trophectoderm, indicatingthat the trophoblast cell lineage shares with the germinallineage a transient burst of DNMT3L expression. Atrophectoderm core transcriptional regulatory circuitryformed by 13 tightly interconnected transcription factors(CEBPA, GATA2, GATA3, GCM1, KLF5, MAFK, MSX2,MXD1, PPARD, PPARG, PPP1R13L, TFAP2C and TP63),was found to be induced in trophectoderm and maintainedin placenta. The induction of this network could berecapitulated in an in vitro trophoblast differentiationmodel.
Keywords Pluripotent stem cells . Transcription factor .
Transcriptional network . Transcriptome . Trophectoderm
Introduction
Human embryo development begins with the fusion ofthe female and male gametes, followed by the firstcleavage divisions that lead to the formation of an 8-cellembryo in about 3 days [1]. At day 4, the embryodevelops into a 16-cell morula, starts compaction andbecomes a blastocyst. The inner cell mass (ICM) of theblastocyst will then go through gastrulation and organo-genesis, whereas the trophectoderm (TE) cells that formthe outer envelope of the blastocyst will give rise to theplacenta. The specification of the TE and ICM lineages
Electronic supplementary material The online version of this article(doi:10.1007/s12015-011-9301-3) contains supplementary material,which is available to authorized users.
Q. Bai : S. Assou :D. Haouzi : J.-M. Ramirez :S. Gerbal-Chaloin : S. Hamamah : J. De VosINSERM U1040,Montpellier 34000, France
D. Haouzi : F. Becker : S. Hamamah : J. De VosCHU Montpellier, Institute for Research in Biotherapy,Hôpital Saint-Eloi,Montpellier 34000, France
Q. Bai :C. Monzo : S. Hamamah : J. De VosUniversité MONTPELLIER1, UFR de Médecine,Montpellier 34000, France
S. HamamahCHU Montpellier, ART/PDG Department,Hôpital Arnaud de Villeneuve,Montpellier 34000, France
J. De VosCHU Montpellier, Unit for Cellular Therapy, Hospital Saint-Eloi,Montpellier 34000, France
J. De Vos (*)Institute for Research in Biotherapy, Hôpital Saint-Eloi,80 Avenue Augustin Fliche,34295 Montpellier Cedex 5, Francee-mail: [email protected]
Stem Cell Rev and Rep (2012) 8:150–162DOI 10.1007/s12015-011-9301-3
during blastocyst formation is the first developmentaldecision during human embryo development [2]. It is a keystep that paves the way for all subsequent developmentalevents. Moreover, the earliest stages of trophoblast differen-tiation are critical for mediating implantation and fosteringnormal placental growth and function during gestation.Aberrant trophoblast development is associated with seriouscomplications during pregnancy, including recurrent miscar-riages, pre-eclampsia and restricted fetal growth.
In mice, TE identity is already set at the blastocyst stage.Indeed, it is possible to isolate embryonic stem (ES) cellsfrom the ICM [3] and trophoblast stem (TS) cells from thetrophectoderm [4]. In mouse, the identification of thedeterminants of trophoblast cell fate mainly stems fromthe analysis of targeted mutations [5, 6]. At the top of thetranscription factor (TF) cascade involved in TE developmentlies Tead4, which in turn controls Cdx2, Eomes and Tcfap2c.Further downstream, other TFs that play an important role innormal TE development include Gata3, Elf5 and Ets2. Over-expression of these TFs in ES cells revealed that they can bedivided in two functionally different groups, one resulting inthe conversion of ES cells into self-renewing TS cells (Tead4,Cdx2, Tcfap2c and Eomes), and the other pushing TS celldifferentiation into post-mitotic cells (Elf5, Ets2, Gata3) [5].Growth factors also play important roles in TE development.For instance, Fgf4, which is secreted by the ICM, is crucialfor TE development as over-expression of a dominantnegative Fgf receptor precludes TE cell division [7].Conversely, the Hippo signaling pathway must be suppressedto promote the activity of Tead4 via the nuclear localizationof its co-factor YAP [8].
To what extent are these findings relevant to under-stand human TE development? Conserved featuresbetween rodents and humans include the mutuallyexclusive expression of key TFs in ICM (NANOG,OCT4 and SOX2) and TE (CDX2), as well as therelatively lower DNA methylation of TE in comparisonto ICM [5, 9]. But there are also some major differences,such as the failure of deriving human TS cells or the factthat, in humans, the initial implantation contact occursthrough the polar TE. Therefore, improving our knowl-edge about the molecular features of this first develop-mental cell lineage split in humans is mandatory. Wholeembryo microarray experiments have contributed to thedescription of the first 3 days of the human embryo [10,11]. Studies in human ES cells (hESC) have opened theway to understanding the ICM transcriptional network[12] as hESC are derived from the ICM and retain itscardinal features (i.e., pluripotency, the core transcription-al regulatory network and intense proliferation) [13–15].By contrast, knowledge on the transcriptional network thatregulates early human trophoblast development is stillfragmentary with very few published studies in which few
samples were used and only part of the human tran-scriptome was covered [16].
Here, we report the whole genome transcriptomeanalysis of five mechanically dissected human muralTE samples. By comparing the TE gene expressionprofile with that of human pluripotent stem cells (PSCs)and placenta samples, we uncovered a tightly connectednetwork of TFs that are expressed during TE develop-ment and in mature placenta. Moreover, induction of thistranscriptional network could be recapitulated in vitro byinducing hESC and induced pluripotent stem (iPS) cellsto differentiate into trophoblast cells. This new insightinto early TE development contributes not only to ourknowledge on human development but also to improvingassisted reproductive technologies.
Results and Discussion
The Mural Trophectoderm Transcriptome
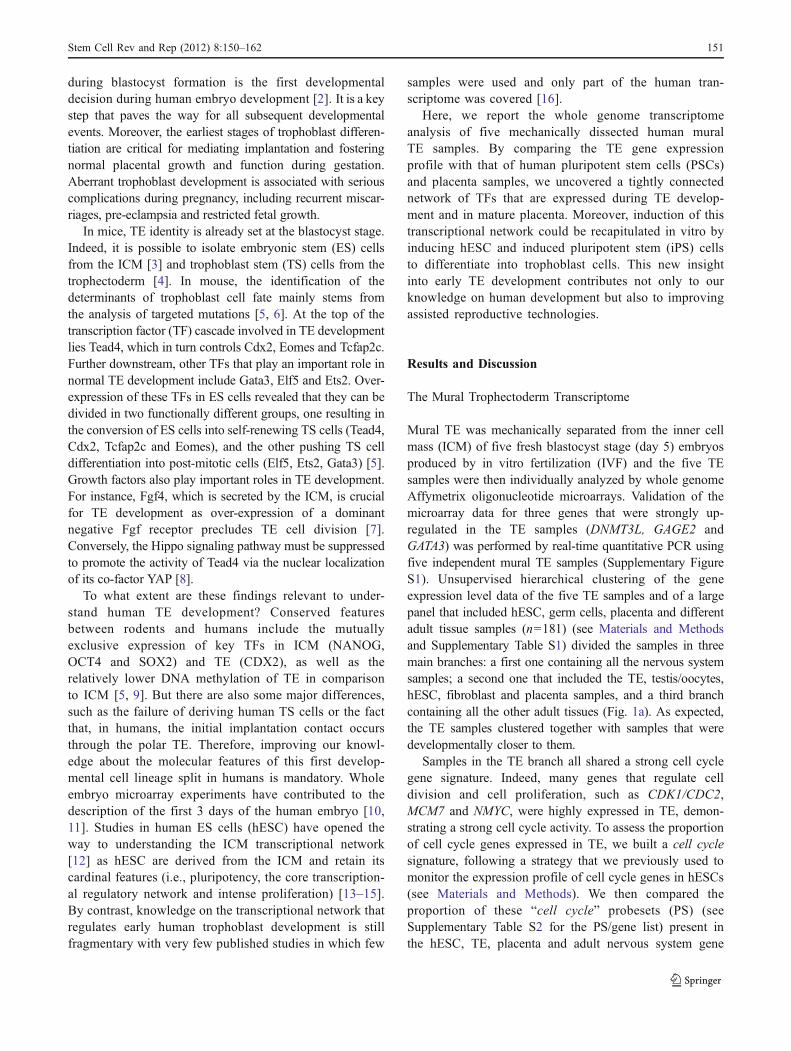
Mural TE was mechanically separated from the inner cellmass (ICM) of five fresh blastocyst stage (day 5) embryosproduced by in vitro fertilization (IVF) and the five TEsamples were then individually analyzed by whole genomeAffymetrix oligonucleotide microarrays. Validation of themicroarray data for three genes that were strongly up-regulated in the TE samples (DNMT3L, GAGE2 andGATA3) was performed by real-time quantitative PCR usingfive independent mural TE samples (Supplementary FigureS1). Unsupervised hierarchical clustering of the geneexpression level data of the five TE samples and of a largepanel that included hESC, germ cells, placenta and differentadult tissue samples (n=181) (see Materials and Methodsand Supplementary Table S1) divided the samples in threemain branches: a first one containing all the nervous systemsamples; a second one that included the TE, testis/oocytes,hESC, fibroblast and placenta samples, and a third branchcontaining all the other adult tissues (Fig. 1a). As expected,the TE samples clustered together with samples that weredevelopmentally closer to them.
Samples in the TE branch all shared a strong cell cyclegene signature. Indeed, many genes that regulate celldivision and cell proliferation, such as CDK1/CDC2,MCM7 and NMYC, were highly expressed in TE, demon-strating a strong cell cycle activity. To assess the proportionof cell cycle genes expressed in TE, we built a cell cyclesignature, following a strategy that we previously used tomonitor the expression profile of cell cycle genes in hESCs(see Materials and Methods). We then compared theproportion of these “cell cycle” probesets (PS) (seeSupplementary Table S2 for the PS/gene list) present inthe hESC, TE, placenta and adult nervous system gene
Stem Cell Rev and Rep (2012) 8:150–162 151
expression signatures. The nervous system group wasincluded as a negative control because neuronal cells donot (or very little) proliferate. We found that hESC and TEsamples included respectively 28.5% and 16.7% of the cellcycle PS, whereas the placenta contained only 3.1% and thenervous system group none (Fig. 1b). These resultsdemonstrate an intense cell proliferation activity in the fiveTE samples. Indeed, like hESCs will give rise to the fetusthrough massive cell expansion, TE cells also need toconsiderably expand to contribute to the development of theplacenta, a temporary organ of about 500 grams.
Comparison with hESCs: The Human TrophectodermExpression Signature
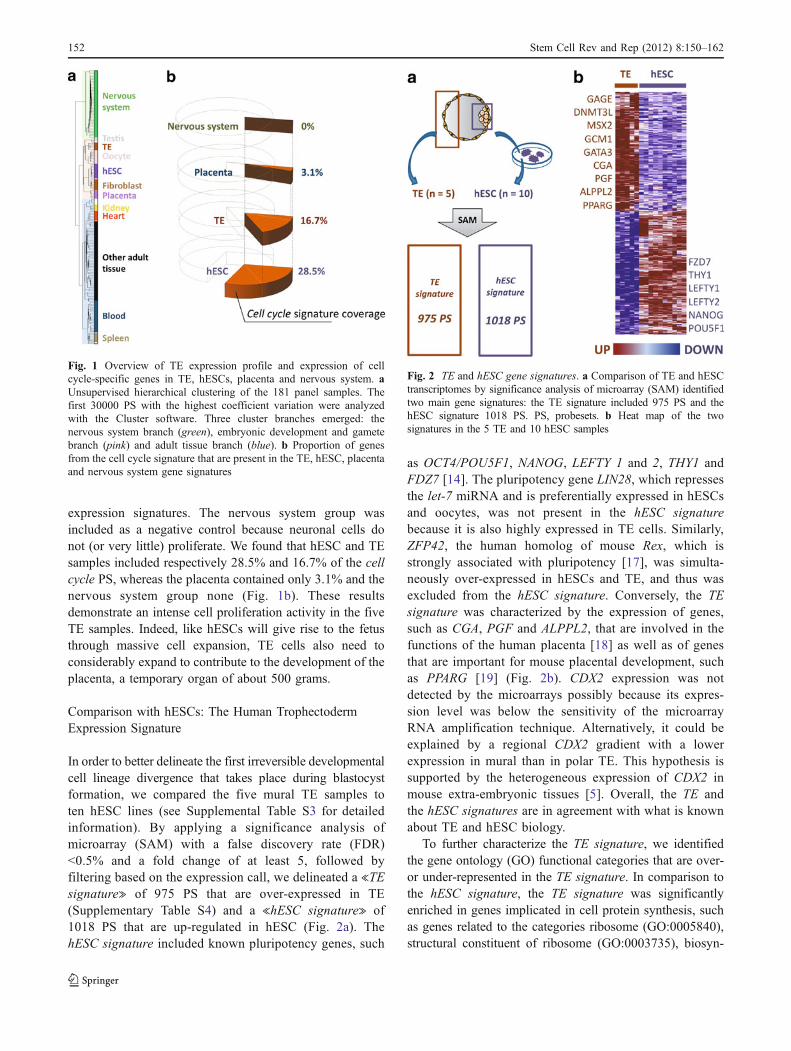
In order to better delineate the first irreversible developmentalcell lineage divergence that takes place during blastocystformation, we compared the five mural TE samples toten hESC lines (see Supplemental Table S3 for detailedinformation). By applying a significance analysis ofmicroarray (SAM) with a false discovery rate (FDR)<0.5% and a fold change of at least 5, followed byfiltering based on the expression call, we delineated a ≪TEsignature≫ of 975 PS that are over-expressed in TE(Supplementary Table S4) and a ≪hESC signature≫ of1018 PS that are up-regulated in hESC (Fig. 2a). ThehESC signature included known pluripotency genes, such
as OCT4/POU5F1, NANOG, LEFTY 1 and 2, THY1 andFDZ7 [14]. The pluripotency gene LIN28, which repressesthe let-7 miRNA and is preferentially expressed in hESCsand oocytes, was not present in the hESC signaturebecause it is also highly expressed in TE cells. Similarly,ZFP42, the human homolog of mouse Rex, which isstrongly associated with pluripotency [17], was simulta-neously over-expressed in hESCs and TE, and thus wasexcluded from the hESC signature. Conversely, the TEsignature was characterized by the expression of genes,such as CGA, PGF and ALPPL2, that are involved in thefunctions of the human placenta [18] as well as of genesthat are important for mouse placental development, suchas PPARG [19] (Fig. 2b). CDX2 expression was notdetected by the microarrays possibly because its expres-sion level was below the sensitivity of the microarrayRNA amplification technique. Alternatively, it could beexplained by a regional CDX2 gradient with a lowerexpression in mural than in polar TE. This hypothesis issupported by the heterogeneous expression of CDX2 inmouse extra-embryonic tissues [5]. Overall, the TE andthe hESC signatures are in agreement with what is knownabout TE and hESC biology.
To further characterize the TE signature, we identifiedthe gene ontology (GO) functional categories that are over-or under-represented in the TE signature. In comparison tothe hESC signature, the TE signature was significantlyenriched in genes implicated in cell protein synthesis, suchas genes related to the categories ribosome (GO:0005840),structural constituent of ribosome (GO:0003735), biosyn-
Fig. 2 TE and hESC gene signatures. a Comparison of TE and hESCtranscriptomes by significance analysis of microarray (SAM) identifiedtwo main gene signatures: the TE signature included 975 PS and thehESC signature 1018 PS. PS, probesets. b Heat map of the twosignatures in the 5 TE and 10 hESC samples
Fig. 1 Overview of TE expression profile and expression of cellcycle-specific genes in TE, hESCs, placenta and nervous system. aUnsupervised hierarchical clustering of the 181 panel samples. Thefirst 30000 PS with the highest coefficient variation were analyzedwith the Cluster software. Three cluster branches emerged: thenervous system branch (green), embryonic development and gametebranch (pink) and adult tissue branch (blue). b Proportion of genesfrom the cell cycle signature that are present in the TE, hESC, placentaand nervous system gene signatures
152 Stem Cell Rev and Rep (2012) 8:150–162
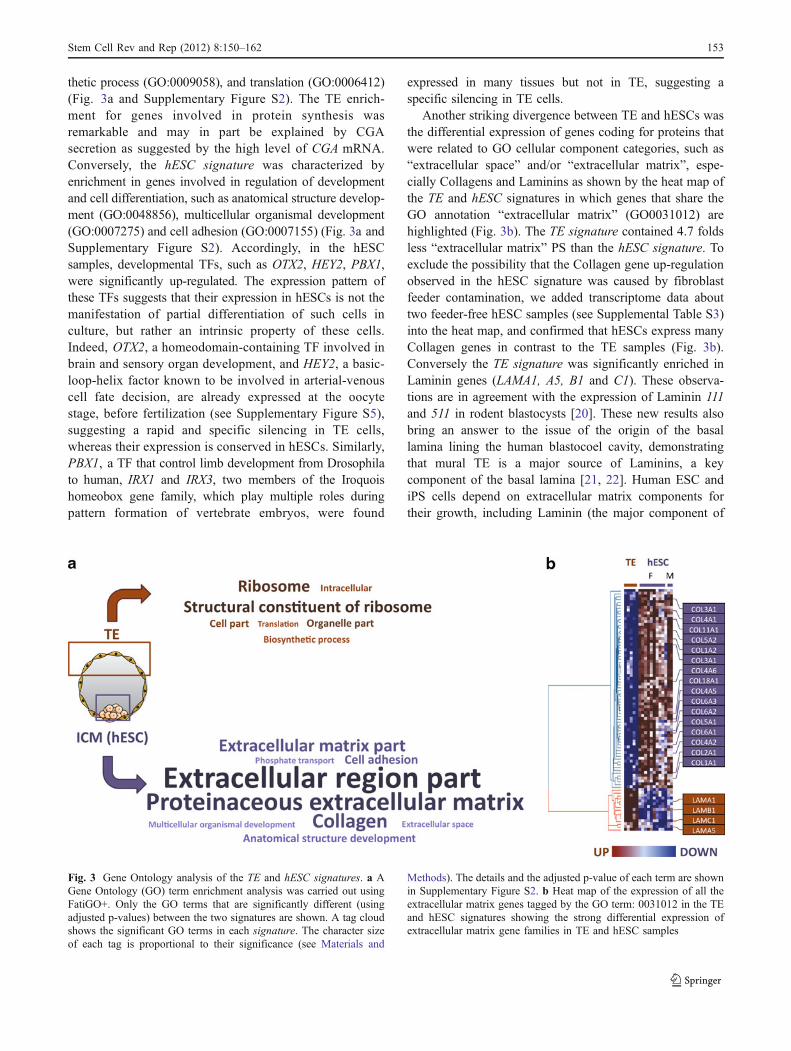
thetic process (GO:0009058), and translation (GO:0006412)(Fig. 3a and Supplementary Figure S2). The TE enrich-ment for genes involved in protein synthesis wasremarkable and may in part be explained by CGAsecretion as suggested by the high level of CGA mRNA.Conversely, the hESC signature was characterized byenrichment in genes involved in regulation of developmentand cell differentiation, such as anatomical structure develop-ment (GO:0048856), multicellular organismal development(GO:0007275) and cell adhesion (GO:0007155) (Fig. 3a andSupplementary Figure S2). Accordingly, in the hESCsamples, developmental TFs, such as OTX2, HEY2, PBX1,were significantly up-regulated. The expression pattern ofthese TFs suggests that their expression in hESCs is not themanifestation of partial differentiation of such cells inculture, but rather an intrinsic property of these cells.Indeed, OTX2, a homeodomain-containing TF involved inbrain and sensory organ development, and HEY2, a basic-loop-helix factor known to be involved in arterial-venouscell fate decision, are already expressed at the oocytestage, before fertilization (see Supplementary Figure S5),suggesting a rapid and specific silencing in TE cells,whereas their expression is conserved in hESCs. Similarly,PBX1, a TF that control limb development from Drosophilato human, IRX1 and IRX3, two members of the Iroquoishomeobox gene family, which play multiple roles duringpattern formation of vertebrate embryos, were found
expressed in many tissues but not in TE, suggesting aspecific silencing in TE cells.
Another striking divergence between TE and hESCs wasthe differential expression of genes coding for proteins thatwere related to GO cellular component categories, such as“extracellular space” and/or “extracellular matrix”, espe-cially Collagens and Laminins as shown by the heat map ofthe TE and hESC signatures in which genes that share theGO annotation “extracellular matrix” (GO0031012) arehighlighted (Fig. 3b). The TE signature contained 4.7 foldsless “extracellular matrix” PS than the hESC signature. Toexclude the possibility that the Collagen gene up-regulationobserved in the hESC signature was caused by fibroblastfeeder contamination, we added transcriptome data abouttwo feeder-free hESC samples (see Supplemental Table S3)into the heat map, and confirmed that hESCs express manyCollagen genes in contrast to the TE samples (Fig. 3b).Conversely the TE signature was significantly enriched inLaminin genes (LAMA1, A5, B1 and C1). These observa-tions are in agreement with the expression of Laminin 111and 511 in rodent blastocysts [20]. These new results alsobring an answer to the issue of the origin of the basallamina lining the human blastocoel cavity, demonstratingthat mural TE is a major source of Laminins, a keycomponent of the basal lamina [21, 22]. Human ESC andiPS cells depend on extracellular matrix components fortheir growth, including Laminin (the major component of
Fig. 3 Gene Ontology analysis of the TE and hESC signatures. a AGene Ontology (GO) term enrichment analysis was carried out usingFatiGO+. Only the GO terms that are significantly different (usingadjusted p-values) between the two signatures are shown. A tag cloudshows the significant GO terms in each signature. The character sizeof each tag is proportional to their significance (see Materials and
Methods). The details and the adjusted p-value of each term are shownin Supplementary Figure S2. b Heat map of the expression of all theextracellular matrix genes tagged by the GO term: 0031012 in the TEand hESC signatures showing the strong differential expression ofextracellular matrix gene families in TE and hESC samples
Stem Cell Rev and Rep (2012) 8:150–162 153
the basement membrane matrix Matrigel). Since Laminingenes are expressed in TE cells but not in the ICM, wecannot exclude that ICM cells depend for their growth onthe Laminins produced by the TE cells. We previouslyshowed that hESCs express significantly less genes codingfor extracellular compartment proteins than differentiatedtissues [14] and that oocytes express these genes at a lowerlevel than cumulus cells, in agreement with the fact thatoocytes are solitary cells that are not embedded in a tissue[23]. Altogether, these results suggest that extracellularmatrix genes are globally silent before fertilization, thenthey are partially expressed in hESCs, but mostly not in TE(except for Laminins), and finally they become stronglyexpressed as soon as somatic cell differentiation begins.
Another remarkable gene of the TE signature is ABCG2,a membrane transporter of the ATP-binding cassette (ABC)super-family. This gene is involved in the efflux ofxenobiotics with a well-documented role in the resistanceof malignant cells to anti-cancer drugs [24]. In addition,high expression of ABCG2 in specific stem cell subpopu-lations makes it possible to purify “side cell populations”,including hESCs, based on the efflux of the Hoechst 33342dye [25, 26]. ABCG2 is also expressed and functional inplacenta, possibly to protect the fetus [27, 28]. Strikingly,ABCG2 was expressed at a very high level in TE cells, 90-fold higher than in hESCs and 7.9-fold higher than inplacenta (Supplemental Figure S5), which may reflect thedistinct susceptibility of the early embryo to xenobioticsand suggests a major role of this gene in its protection.
Cancer/Testis Antigen Expression in Trophoblastand the Epigenetic Pattern in TE
Another feature of the TE signature was the up-regulationof several cancer/testis (CT) antigens. C/T gene expressionwas first described in various cancers and in testis. Morerecent studies have reported expression in other normaltissues, such as pancreas, liver, spleen and placenta [29,30]. Their function remains poorly documented, although arole in transcription activation or repression and, for someof them, more specifically in gametogenesis has beendescribed [29]. Recent reports have shown that some C/Tgenes are expressed during human early embryonicdevelopment and in placenta [31–33]. Here we report astrong expression in TE of several C/T antigen genes fromthe GAGE, MAGE, PAGE and XAGE families, all locatedon the X chromosome (CT-X genes) (see SupplementaryFigure S5). The most over-expressed C/T gene wasGAGE3, with an expression 1155-fold higher in TE thanin hESC samples. Other GAGE family members were alsohighly detected, but due to the high sequence conservationamong the members of this family, they could not beprecisely identified by microarray analysis. Although the
expression of these C/T genes in TE may be linked to afunctional role, their up-regulation could also be an indirectconsequence of the genome hypomethylation of TE cells[9]. Indeed, CT-X gene expression is reported to becorrelated with the methylation level of their promotersand their expression can be induced by experimentalchromatin demethylation even in cells that do not normallyexpress them [29, 34, 35].
Trophectoderm-Specific Genes
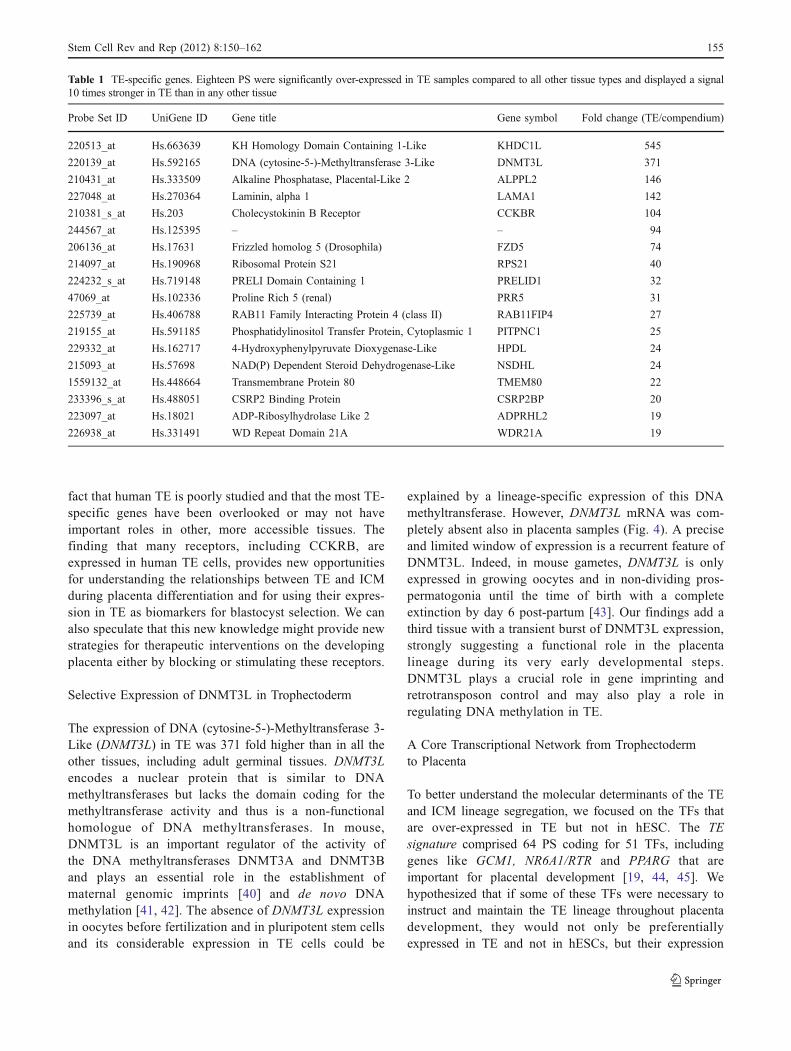
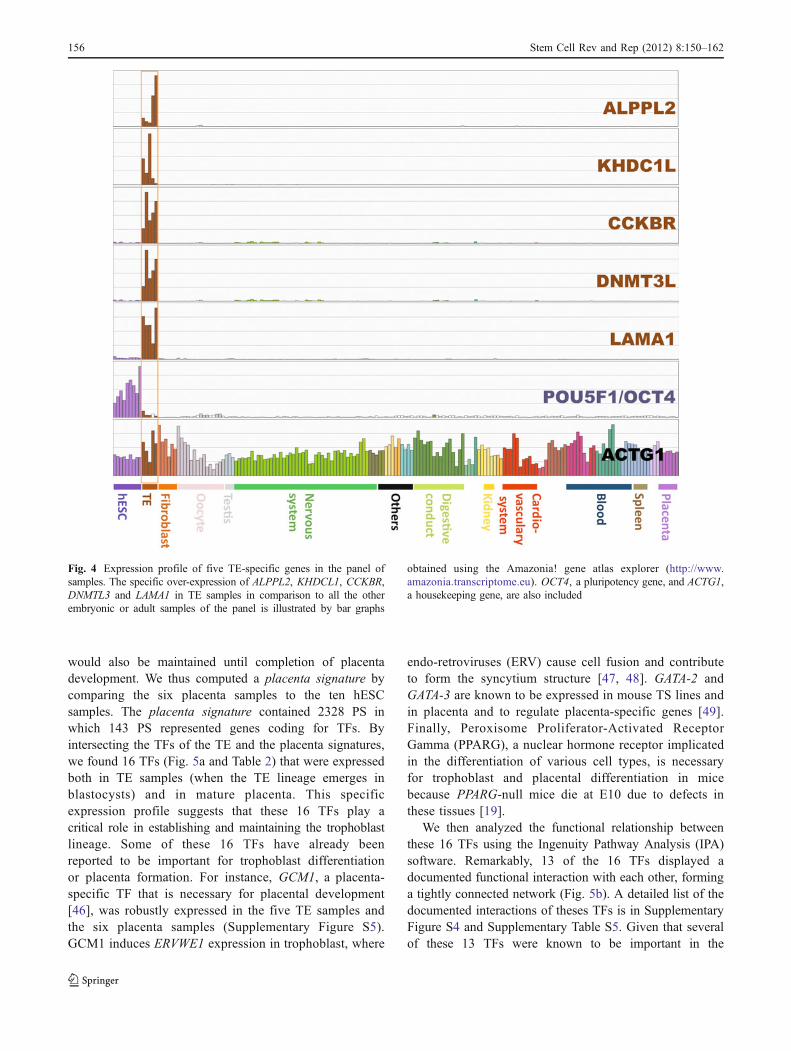
To establish a list of TE-specific genes, we compared thetranscriptome data of the five TE samples to the data of allthe other samples of the panel (n=176). A SAM analysiswith a FDR <0.01% and fold change >5 revealed that 978PS were significantly up-regulated in TE compared to theother tissues. Within these PS, 18 PS displayed a signal 10times stronger in TE than in any other tissue and were thusconsidered “TE-specific” (Table 1). Some selected genesare illustrated in Fig. 4. This tissue selectivity stronglysuggests a role for these genes in the development andfunction of human mural TE. The specific expression ofAlkaline Phosphatase Placental-Like 2 (ALPPL2) is inagreement with the reported expression of this gene in theplacenta lineage. However, two different PS displayed verycontrasting expression patterns (Supplemental Figure S3).One PS located in the 5′ region of ALPPL2 (exons 3 and 4)was highly expressed in placenta samples and weakly in TEsamples. The other PS, located in the 3′ untranslated regionof ALPPL2 was specifically expressed in TE samples,suggesting a splicing event determined by the developmen-tal stage of the placental tissue. Laminin alpha 1 (LAMA1)was another TE-specific gene, thus further supporting thehypothesis of a major role for Laminins during early humanembryo development, especially in compartmentalizationvia the basement membrane and in orienting the directionand quality of trophoblast invasion similarly to whatobserved in rodents [20, 36]. The very strong, TE-specificexpression of CCKBR was unexpected. There are two typesof human Cholecystokinin (CCK) receptors. The B receptor(CCKBR)shows high affinity for Gastrin and CCK. Studiesin the mouse showed that it is involved in digestionstimulation and regulation of neurotransmitter levels, butalso in cell proliferation [37], migration [38] and invasion[39]. Wroblewski et al. have reported that the CCKBRpathways induce the expression ofMatrixMetalloproteinase 9(MMP9) [39], but we could not find any over-expressedMMP in the TE signature. Since our TE samples werederived from pre-implantation embryos, CCKBR might beinvolved in readying the trophoblast for invasion, whereasthe invasion machinery will be operational only aftercontact with the endometrium. Overall, many TE-specificgenes have no known function (see Table 1), reflecting the
154 Stem Cell Rev and Rep (2012) 8:150–162
fact that human TE is poorly studied and that the most TE-specific genes have been overlooked or may not haveimportant roles in other, more accessible tissues. Thefinding that many receptors, including CCKRB, areexpressed in human TE cells, provides new opportunitiesfor understanding the relationships between TE and ICMduring placenta differentiation and for using their expres-sion in TE as biomarkers for blastocyst selection. We canalso speculate that this new knowledge might provide newstrategies for therapeutic interventions on the developingplacenta either by blocking or stimulating these receptors.
Selective Expression of DNMT3L in Trophectoderm
The expression of DNA (cytosine-5-)-Methyltransferase 3-Like (DNMT3L) in TE was 371 fold higher than in all theother tissues, including adult germinal tissues. DNMT3Lencodes a nuclear protein that is similar to DNAmethyltransferases but lacks the domain coding for themethyltransferase activity and thus is a non-functionalhomologue of DNA methyltransferases. In mouse,DNMT3L is an important regulator of the activity ofthe DNA methyltransferases DNMT3A and DNMT3Band plays an essential role in the establishment ofmaternal genomic imprints [40] and de novo DNAmethylation [41, 42]. The absence of DNMT3L expressionin oocytes before fertilization and in pluripotent stem cellsand its considerable expression in TE cells could be
explained by a lineage-specific expression of this DNAmethyltransferase. However, DNMT3L mRNA was com-pletely absent also in placenta samples (Fig. 4). A preciseand limited window of expression is a recurrent feature ofDNMT3L. Indeed, in mouse gametes, DNMT3L is onlyexpressed in growing oocytes and in non-dividing pros-permatogonia until the time of birth with a completeextinction by day 6 post-partum [43]. Our findings add athird tissue with a transient burst of DNMT3L expression,strongly suggesting a functional role in the placentalineage during its very early developmental steps.DNMT3L plays a crucial role in gene imprinting andretrotransposon control and may also play a role inregulating DNA methylation in TE.
A Core Transcriptional Network from Trophectodermto Placenta
To better understand the molecular determinants of the TEand ICM lineage segregation, we focused on the TFs thatare over-expressed in TE but not in hESC. The TEsignature comprised 64 PS coding for 51 TFs, includinggenes like GCM1, NR6A1/RTR and PPARG that areimportant for placental development [19, 44, 45]. Wehypothesized that if some of these TFs were necessary toinstruct and maintain the TE lineage throughout placentadevelopment, they would not only be preferentiallyexpressed in TE and not in hESCs, but their expression
Table 1 TE-specific genes. Eighteen PS were significantly over-expressed in TE samples compared to all other tissue types and displayed a signal10 times stronger in TE than in any other tissue
Probe Set ID UniGene ID Gene title Gene symbol Fold change (TE/compendium)
220513_at Hs.663639 KH Homology Domain Containing 1-Like KHDC1L 545
220139_at Hs.592165 DNA (cytosine-5-)-Methyltransferase 3-Like DNMT3L 371
210431_at Hs.333509 Alkaline Phosphatase, Placental-Like 2 ALPPL2 146
227048_at Hs.270364 Laminin, alpha 1 LAMA1 142
210381_s_at Hs.203 Cholecystokinin B Receptor CCKBR 104
244567_at Hs.125395 – – 94
206136_at Hs.17631 Frizzled homolog 5 (Drosophila) FZD5 74
214097_at Hs.190968 Ribosomal Protein S21 RPS21 40
224232_s_at Hs.719148 PRELI Domain Containing 1 PRELID1 32
47069_at Hs.102336 Proline Rich 5 (renal) PRR5 31
225739_at Hs.406788 RAB11 Family Interacting Protein 4 (class II) RAB11FIP4 27
219155_at Hs.591185 Phosphatidylinositol Transfer Protein, Cytoplasmic 1 PITPNC1 25
229332_at Hs.162717 4-Hydroxyphenylpyruvate Dioxygenase-Like HPDL 24
215093_at Hs.57698 NAD(P) Dependent Steroid Dehydrogenase-Like NSDHL 24
1559132_at Hs.448664 Transmembrane Protein 80 TMEM80 22
233396_s_at Hs.488051 CSRP2 Binding Protein CSRP2BP 20
223097_at Hs.18021 ADP-Ribosylhydrolase Like 2 ADPRHL2 19
226938_at Hs.331491 WD Repeat Domain 21A WDR21A 19
Stem Cell Rev and Rep (2012) 8:150–162 155
would also be maintained until completion of placentadevelopment. We thus computed a placenta signature bycomparing the six placenta samples to the ten hESCsamples. The placenta signature contained 2328 PS inwhich 143 PS represented genes coding for TFs. Byintersecting the TFs of the TE and the placenta signatures,we found 16 TFs (Fig. 5a and Table 2) that were expressedboth in TE samples (when the TE lineage emerges inblastocysts) and in mature placenta. This specificexpression profile suggests that these 16 TFs play acritical role in establishing and maintaining the trophoblastlineage. Some of these 16 TFs have already beenreported to be important for trophoblast differentiationor placenta formation. For instance, GCM1, a placenta-specific TF that is necessary for placental development[46], was robustly expressed in the five TE samples andthe six placenta samples (Supplementary Figure S5).GCM1 induces ERVWE1 expression in trophoblast, where
endo-retroviruses (ERV) cause cell fusion and contributeto form the syncytium structure [47, 48]. GATA-2 andGATA-3 are known to be expressed in mouse TS lines andin placenta and to regulate placenta-specific genes [49].Finally, Peroxisome Proliferator-Activated ReceptorGamma (PPARG), a nuclear hormone receptor implicatedin the differentiation of various cell types, is necessaryfor trophoblast and placental differentiation in micebecause PPARG-null mice die at E10 due to defects inthese tissues [19].
We then analyzed the functional relationship betweenthese 16 TFs using the Ingenuity Pathway Analysis (IPA)software. Remarkably, 13 of the 16 TFs displayed adocumented functional interaction with each other, forminga tightly connected network (Fig. 5b). A detailed list of thedocumented interactions of theses TFs is in SupplementaryFigure S4 and Supplementary Table S5. Given that severalof these 13 TFs were known to be important in the
Fig. 4 Expression profile of five TE-specific genes in the panel ofsamples. The specific over-expression of ALPPL2, KHDCL1, CCKBR,DNMTL3 and LAMA1 in TE samples in comparison to all the otherembryonic or adult samples of the panel is illustrated by bar graphs
obtained using the Amazonia! gene atlas explorer (http://www.amazonia.transcriptome.eu). OCT4, a pluripotency gene, and ACTG1,a housekeeping gene, are also included
156 Stem Cell Rev and Rep (2012) 8:150–162
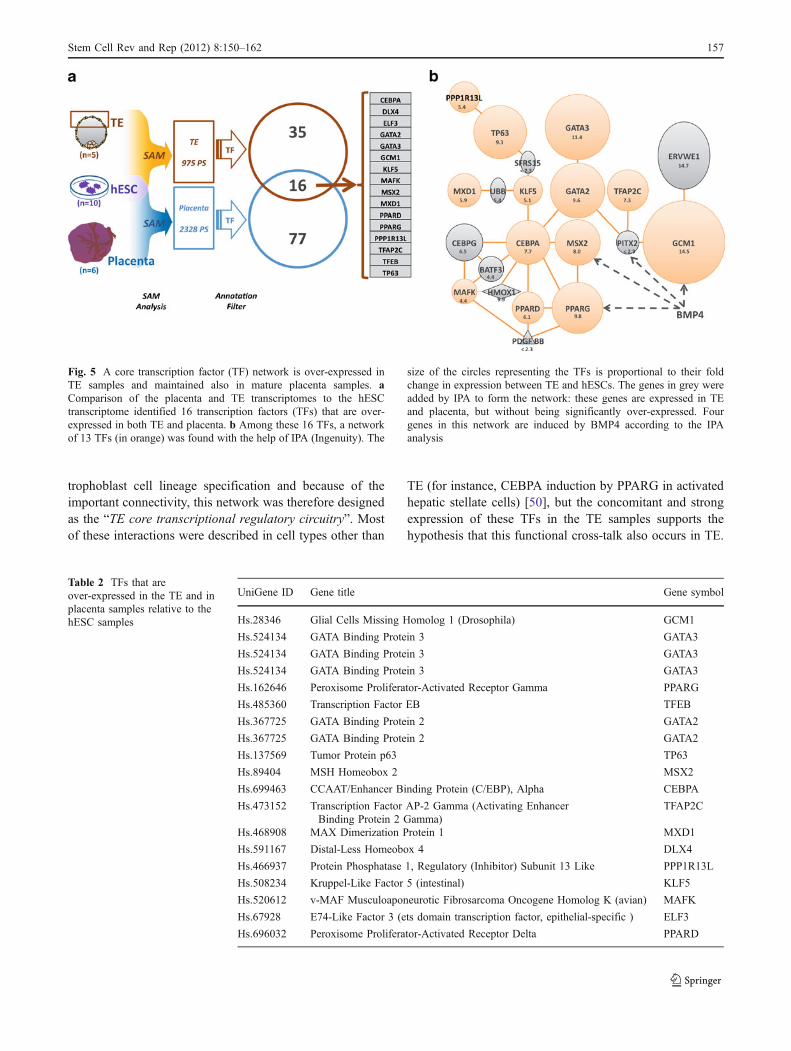
trophoblast cell lineage specification and because of theimportant connectivity, this network was therefore designedas the “TE core transcriptional regulatory circuitry”. Mostof these interactions were described in cell types other than
TE (for instance, CEBPA induction by PPARG in activatedhepatic stellate cells) [50], but the concomitant and strongexpression of these TFs in the TE samples supports thehypothesis that this functional cross-talk also occurs in TE.
Fig. 5 A core transcription factor (TF) network is over-expressed inTE samples and maintained also in mature placenta samples. aComparison of the placenta and TE transcriptomes to the hESCtranscriptome identified 16 transcription factors (TFs) that are over-expressed in both TE and placenta. b Among these 16 TFs, a networkof 13 TFs (in orange) was found with the help of IPA (Ingenuity). The
size of the circles representing the TFs is proportional to their foldchange in expression between TE and hESCs. The genes in grey wereadded by IPA to form the network: these genes are expressed in TEand placenta, but without being significantly over-expressed. Fourgenes in this network are induced by BMP4 according to the IPAanalysis
UniGene ID Gene title Gene symbol
Hs.28346 Glial Cells Missing Homolog 1 (Drosophila) GCM1
Hs.524134 GATA Binding Protein 3 GATA3
Hs.524134 GATA Binding Protein 3 GATA3
Hs.524134 GATA Binding Protein 3 GATA3
Hs.162646 Peroxisome Proliferator-Activated Receptor Gamma PPARG
Hs.485360 Transcription Factor EB TFEB
Hs.367725 GATA Binding Protein 2 GATA2
Hs.367725 GATA Binding Protein 2 GATA2
Hs.137569 Tumor Protein p63 TP63
Hs.89404 MSH Homeobox 2 MSX2
Hs.699463 CCAAT/Enhancer Binding Protein (C/EBP), Alpha CEBPA
Hs.473152 Transcription Factor AP-2 Gamma (Activating EnhancerBinding Protein 2 Gamma)
TFAP2C
Hs.468908 MAX Dimerization Protein 1 MXD1
Hs.591167 Distal-Less Homeobox 4 DLX4
Hs.466937 Protein Phosphatase 1, Regulatory (Inhibitor) Subunit 13 Like PPP1R13L
Hs.508234 Kruppel-Like Factor 5 (intestinal) KLF5
Hs.520612 v-MAF Musculoaponeurotic Fibrosarcoma Oncogene Homolog K (avian) MAFK
Hs.67928 E74-Like Factor 3 (ets domain transcription factor, epithelial-specific ) ELF3
Hs.696032 Peroxisome Proliferator-Activated Receptor Delta PPARD
Table 2 TFs that areover-expressed in the TE and inplacenta samples relative to thehESC samples
Stem Cell Rev and Rep (2012) 8:150–162 157
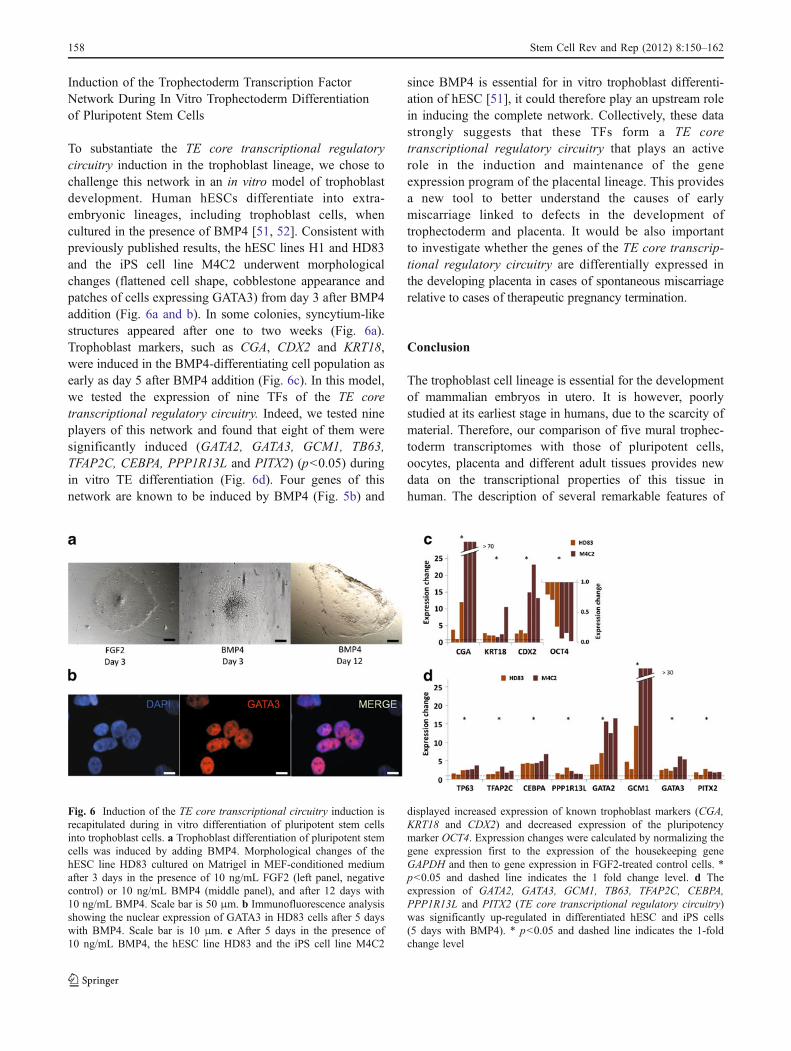
Induction of the Trophectoderm Transcription FactorNetwork During In Vitro Trophectoderm Differentiationof Pluripotent Stem Cells
To substantiate the TE core transcriptional regulatorycircuitry induction in the trophoblast lineage, we chose tochallenge this network in an in vitro model of trophoblastdevelopment. Human hESCs differentiate into extra-embryonic lineages, including trophoblast cells, whencultured in the presence of BMP4 [51, 52]. Consistent withpreviously published results, the hESC lines H1 and HD83and the iPS cell line M4C2 underwent morphologicalchanges (flattened cell shape, cobblestone appearance andpatches of cells expressing GATA3) from day 3 after BMP4addition (Fig. 6a and b). In some colonies, syncytium-likestructures appeared after one to two weeks (Fig. 6a).Trophoblast markers, such as CGA, CDX2 and KRT18,were induced in the BMP4-differentiating cell population asearly as day 5 after BMP4 addition (Fig. 6c). In this model,we tested the expression of nine TFs of the TE coretranscriptional regulatory circuitry. Indeed, we tested nineplayers of this network and found that eight of them weresignificantly induced (GATA2, GATA3, GCM1, TB63,TFAP2C, CEBPA, PPP1R13L and PITX2) (p<0.05) duringin vitro TE differentiation (Fig. 6d). Four genes of thisnetwork are known to be induced by BMP4 (Fig. 5b) and
since BMP4 is essential for in vitro trophoblast differenti-ation of hESC [51], it could therefore play an upstream rolein inducing the complete network. Collectively, these datastrongly suggests that these TFs form a TE coretranscriptional regulatory circuitry that plays an activerole in the induction and maintenance of the geneexpression program of the placental lineage. This providesa new tool to better understand the causes of earlymiscarriage linked to defects in the development oftrophectoderm and placenta. It would be also importantto investigate whether the genes of the TE core transcrip-tional regulatory circuitry are differentially expressed inthe developing placenta in cases of spontaneous miscarriagerelative to cases of therapeutic pregnancy termination.
Conclusion
The trophoblast cell lineage is essential for the developmentof mammalian embryos in utero. It is however, poorlystudied at its earliest stage in humans, due to the scarcity ofmaterial. Therefore, our comparison of five mural trophec-toderm transcriptomes with those of pluripotent cells,oocytes, placenta and different adult tissues provides newdata on the transcriptional properties of this tissue inhuman. The description of several remarkable features of
Fig. 6 Induction of the TE core transcriptional circuitry induction isrecapitulated during in vitro differentiation of pluripotent stem cellsinto trophoblast cells. a Trophoblast differentiation of pluripotent stemcells was induced by adding BMP4. Morphological changes of thehESC line HD83 cultured on Matrigel in MEF-conditioned mediumafter 3 days in the presence of 10 ng/mL FGF2 (left panel, negativecontrol) or 10 ng/mL BMP4 (middle panel), and after 12 days with10 ng/mL BMP4. Scale bar is 50 μm. b Immunofluorescence analysisshowing the nuclear expression of GATA3 in HD83 cells after 5 dayswith BMP4. Scale bar is 10 μm. c After 5 days in the presence of10 ng/mL BMP4, the hESC line HD83 and the iPS cell line M4C2
displayed increased expression of known trophoblast markers (CGA,KRT18 and CDX2) and decreased expression of the pluripotencymarker OCT4. Expression changes were calculated by normalizing thegene expression first to the expression of the housekeeping geneGAPDH and then to gene expression in FGF2-treated control cells. *p<0.05 and dashed line indicates the 1 fold change level. d Theexpression of GATA2, GATA3, GCM1, TB63, TFAP2C, CEBPA,PPP1R13L and PITX2 (TE core transcriptional regulatory circuitry)was significantly up-regulated in differentiated hESC and iPS cells(5 days with BMP4). * p<0.05 and dashed line indicates the 1-foldchange level
158 Stem Cell Rev and Rep (2012) 8:150–162
trophectoderm, such as the specific expression of Laminins,Cancer/Testis genes, CCKBR and DNMT3L, opens newdirections for understanding trophoblast cell lineagedevelopment but also implantation disorders. Mostremarkably, the identification of a TE core transcriptionalregulatory circuitry, which is maintained until the placentastage, provides a new framework for delineating themolecular control of the TE lineage. These results opennew avenues for medical interventions by providing abetter understanding of the molecular causes of earlymiscarriages and for improving the implantation rate bymodulating the level of the ligands of the receptorsexpressed in TE cells.
Materials and Methods
Trophectoderm Preparation
Mural TE samples were mechanically separated from theICM of individual blastocysts under an inverted microscope(Leica, Germany), then lysed in RLT RNA extractionbuffer and frozen at −80°C. Blastocysts were donated forresearch after informed consent by couples for our hESCcell derivation project approved by the Agence de laBiomédecine. Overall, we successfully derived five hESClines, but none of them originated from the embryos fromwhich the TE samples were isolated. Five TE samples fromblastocysts of two patients were used for the microarrayanalyses and five additional TE samples from blastocysts ofthree other patients were used for qRT–PCR validation ofthe microarray data.
Microarray Data Collection and Normalization
Total RNA was purified from the TE samples using theRNeasy Micro kit (Qiagen, Courtaboeuf, France) with anadditional RNAse-Free DNase step to eliminate residualDNA, and quantified with a NanoDrop spectrophotometer(Thermo Fischer,Wilmington, Delaware, USA). A doubleamplification of total RNA was used to generate suitablequantity of labeled cRNA for hybridization to U133plus 2.0 GeneChip pangenomic oligonucleotide arrays(Affymetrix, Santa Clara, CA, USA) as previously described[53]. We recently reported a comparison of these five TEmicroarray data with human endometrium [54].
In parallel, we collected U133 Plus 2.0 chip microarraydata from published reports or from our laboratory andassembled a panel of 181 samples that includes tran-scriptome data on hESC, oocyte, placenta, different adulttissues and the five TE samples. In addition, transcriptomedata for another 28 non-proliferating and 36 highlyproliferating tissue samples, which are independent from
the panel, were used for the cell cycle analysis and dataabout two other hESC samples from feeder-free cultureswere collected for the extracellular matrix analysis. Thesedata are available in the Gene Expression Omnibus (GEO)database and the list of these samples with their GEOaccession number is in Supplementary Tables S1 and S3.All microarray data were normalized and analyzed usingExpression Console (Affymetrix) and the MAS5 algorithmwith the default analysis setting and global scaling as firstnormalization method, with a trimmed mean target intensityvalue (TGT) of each array arbitrarily set at 100. For eachsignal measurement, the MAS5 algorithm provides a“detection call”. The ‘call’ is tagged as ‘present’ when theperfect match probes of the probeset (PS) are significantly(p-value <0.05) more hybridized than the mismatch probes;‘absent’ when both perfect match and mismatch probesdisplay a similar fluorescent signal; and ‘marginal’ whenthe probeset does not match with the ‘present’ or to the‘absent’ call criteria.
Data Analysis and Visualization
Hierarchical clustering was carried out with CLUSTER andvisualized with the help of TREEVIEW [55]. The whole-genome, unsupervised clustering was run with the 10,000PS that had the most significant coefficient of variation(CV) of signal across the samples.
Lists of the genes differentially expressed between twoclasses of samples were obtained using two-class SignificanceAnalysis of Microarray (SAM) (http://www-stat.stanford.edu/~tibs/SAM/) with Wilcoxon test statistic and sample-labelpermutation (n=300) [56]. Using this method, we comparedthe transcriptome data of the five TE samples with data forthe ten hESC samples collected from public and in-housedatabases. With a false discovery rate (FDR) of 0.277%,7521 PS were found to have a TE/hESC signal ratio≥5 and975 of these PS (“TE signature”) displayed a “present” callin at least three of the five TE samples. Conversely, 1083PS were significantly over-expressed in the ten hESCsamples compared with the five TE samples with ahESC/TE signal ratio≥5; 1018 of these PS (“hESCsignature”) displayed a “present” call in at least threehESC samples. The same method and thresholds wereused to compare placenta and hESC samples with an FDRof 0.188%. The parameters and results of each SAM analysisare summarized in Supplementary Table S6. All the TFs inthe placenta and TE signatures were defined using GeneOntology annotations (http://www.geneontology.org/).
For the cell cycle gene analysis, public Human GenomeU133 Plus 2.0 chip (Affymetrix) data about 36 highlyproliferating (“cycling”) and 28 differentiated adult tissuesamples with little proliferation activity (“non-cycling”)(see Supplementary Table S1) were compared using SAM
Stem Cell Rev and Rep (2012) 8:150–162 159
with a FDR <0.2% and a ratio of 5. A group of 664 PS(representing 531 genes), termed “cell cycle signature”, wassignificantly over-expressed in the “cycling” samplescompared to the “non-cycling” samples. The cell cyclesignature was intersected with the hESC, TE, placenta andnervous system signatures that were computed using SAMby comparing each of these groups (hESC: n=10, TE: n=5,placenta: n=6 and nervous system: n=45 samples) with allthe other samples of the panel (n=115).
To compute a list of TE-specific genes, we carried out atwo-class, unpaired SAM analysis of the TE samples andthe panel samples (n=176), which identified 978 PSdifferentially expressed in TE samples (see SupplementaryTable S6 for parameters). Of these PS, only those with a“present” call in 3 out of 5 TE samples, a signal value >50and a mean signal 10-fold higher in TE than in any of theother 23 tissue categories (see the microarray sample list,Supplementary Table S1) were designed as “TE-specific”.
The Gene Ontology annotation analysis was carriedout using the FatiGO+tool (BABELOMICS v3.1; http://babelomics.bioinfo.cipf.es) [57]. Only annotations with afalse discovery rate-adjusted P-value below 0.05 wereconsidered significant.
The gene expression profile of TE and of the otherhuman tissues can be accessed using our free web interfaceAmazonia! that allows an easy query of public humantranscriptome data by key words in thematic pages (http://amazonia.transcriptome.eu) (Le Carrour et al 2010). TheAmazonia! tool was used to generate the bar graphs shownin the figures.
Cell Culture
The human ESC line HD83 was derived in ourlaboratory and H1 was imported from WiCell [53, 58].The human induced pluripotent stem cell line M4C2 wasreprogrammed by using lentiviral vectors containing thehuman OCT4/POU5F1, SOX2, NANOG and LIN28 genes[59] and displays all the features of pluripotent stem cells(PSC): M4C2 grow as typical PSCs, are positive forOCT4 and ABCG2 expression and for phosphatasealkaline activity, display a typical PSC expression signa-ture by microarray analysis and can differentiate into cellsof all three germ layers (Dijon-Grinand et al, submitted).PSC lines were maintained on irradiated (40 Gy) humanforeskin fibroblast feeders [60], in 80% KO-DMEM, 20%KOSR, 2 mM L-glutamine, 1% non-essential amino acids,0.5 mM β-mercaptoethanol (all from Gibco Invitrogen,Cergy-Pontoise, France) and complemented with 10 ng/mLbFGF (Abcys, Paris, France). PSC were mechanicallypassaged weekly.
Before trophoblast differentiation, PSC were placed infeeder-free culture conditions: cells were dissociated with
1 mg/mL collagenase IV at 37°C for 20 min, then platedon a 1/30 diluted Matrigel-coated support and cultured inmouse embryonic fibroblast (MEF) conditioned mediumwith 10 ng/mL of FGF2. For in vitro trophoblastdifferentiation, MEF-conditioned medium was comple-mented with 10 ng/mL of BMP4 (R&D System) insteadof FGF2. Cells were either harvested for real-timequantitative PCR or fixed for immunofluorescence atday 5, or maintained in culture until week 2 formorphological observations.
To produce MEF-conditioned medium, MEFs wereplated in 6-well plates at a concentration of 100 000cells/mL with 2 mL/well of pluripotent stem cell culturemedium without FGF2 and supernatant was collectedevery day for 1 week.
Reverse Transcription (RT) and Real-Time QuantitativePCR (qPCR)
One μg of total RNA was used for RT in a final volume of20 μL with the SuperScript® First-Strand Synthesis System(Invitrogen) according to the manufacturer’s instructions.qPCR was performed in 384-well plates (Sorenson BioSci-ence, Inc.) on a Lightcycler ® 480 Real-Time PCR System(Roche Diagnostics). cDNA (1/20 dilution) was added to areaction mix (final volume of 10 μL) containing 2 μLdiluted cDNA, 5 μL Sybr Green (Roche Diagnostics),0.5 μM forward and reverse primers (primer sequences arelisted in supplementary Table S7) and amplification carriedout according to the following conditions: 10 min at 95°C,then 55 cycles of 10 s at 95°C, 20 s at 62°C and 25 s at72°C. At the end, a melting curve from 95°C to 62°Cwas performed to control primer specificity. GAPDH wasused as endogenous control for calculating the relativeexpression level of each gene, and the gene expression ofBMP4-treated cells was normalized to control FGF2-treated cells to compute the expression change.
For the qPCR validation of the microarray data, fiveindependent TE and hESC mRNA samples were amplifiedusing the microarray double in vitro transcription method,followed by qPCR.
Immunofluorescence
After 5 days of BMP4 treatment, PSCs were washed withPBS, fixed in 4% paraformaldehyde and permeabilizedwith 0.1% Triton-X for 30 min. They were then blockedwith 5% goat serum at room temperature for 30 min,incubated with anti-GATA3 (R&D system) antibody (1/20dilution) and immunolabeling was revealed by incubationwith rabbit anti-mouse IgG antibody coupled with Alexafluor 568 (Molecular Probes) (1/300 dilution) for 1 h. Cellnuclei were detected with DAPI staining. Images were
160 Stem Cell Rev and Rep (2012) 8:150–162
taken with the Isis Fluorescence Imaging System(MetaSystems Germany).
Acknowledgments We thank Tanguy Le Carrour for expert help inmaintaining the Amazonia! database and Robert Feil for helpfulsuggestions. JDV is supported by the ANR (grant ANR-07-BLAN-0076-01), JDV and SH by the Association Française contre lesMyopathies (AFM), JDV by the ANR (ANR-08-BIOT-012-02) and theRégion Languedoc-Roussillon (Chercheur d’Avenir 09–13198 01).
Conflicts of Interest The authors declare no potential conflicts ofinterest.
Open Access This article is distributed under the terms of theCreative Commons Attribution Noncommercial License which per-mits any noncommercial use, distribution, and reproduction in anymedium, provided the original author(s) and source are credited.
References
1. Wong, C. C., Loewke, K. E., Bossert, N. L., et al. Non-invasiveimaging of human embryos before embryonic genome activationpredicts development to the blastocyst stage. Nature Biotechnology,28, 1115–1121.
2. Arnold, S. J., & Robertson, E. J. (2009). Making a commitment:cell lineage allocation and axis patterning in the early mouseembryo. Nature Reviews. Molecular Cell Biology, 10, 91–103.
3. Evans, M. J., & Kaufman, M. H. (1981). Establishment in culture ofpluripotential cells from mouse embryos. Nature, 292, 154–156.
4. Tanaka, S., Kunath, T., Hadjantonakis, A. K., Nagy, A., &Rossant, J. (1998). Promotion of trophoblast stem cell proliferationby FGF4. Science, 282, 2072–2075.
5. Senner, C. E., & Hemberger, M. (2010). Regulation of earlytrophoblast differentiation—lessons from the mouse. Placenta, 31,944–950.
6. Rossant, J., & Cross, J. C. (2001). Placental development: lessonsfrom mouse mutants. Nature Reviews Genetics, 2, 538–548.
7. Chai, N., Patel, Y., Jacobson, K., McMahon, J., McMahon, A., &Rappolee, D. A. (1998). FGF is an essential regulator of the fifthcell division in preimplantation mouse embryos. DevelopmentalBiology, 198, 105–115.
8. Nishioka, N., Inoue, K., Adachi, K., et al. (2009). The Hipposignaling pathway components Lats and Yap pattern Tead4 activityto distinguish mouse trophectoderm from inner cell mass.Developmental Cell, 16, 398–410.
9. Santos, F., Hendrich, B., Reik, W., & Dean, W. (2002). Dynamicreprogramming of DNA methylation in the early mouse embryo.Developmental Biology, 241, 172–182.
10. Dobson, A. T., Raja, R., Abeyta, M. J., et al. (2004). The uniquetranscriptome through day 3 of human preimplantation develop-ment. Human Molecular Genetics, 13, 1461–1470.
11. Assou, S., Boumela, I., Haouzi, D., et al. (2011). Dynamicchanges in gene expression during human early embryo develop-ment: from fundamental aspects to clinical applications. HumanReproduction Update, 17, 272–290.
12. Boyer, L. A., Lee, T. I., Cole, M. F., et al. (2005). Coretranscriptional regulatory circuitry in human embryonic stemcells. Cell, 122, 947–956.
13. Smith, A. G. (2001). Embryo-derived stem cells: of mice andmen. Annual Review of Cell and Developmental Biology, 17, 435–462.
14. Assou, S., Le Carrour, T., Tondeur, S., et al. (2007). A meta-analysis of human embryonic stem cells transcriptome integratedinto a web-based expression atlas. Stem Cells, 25, 961–973.
15. Ramirez, J., Bai, Q., Dijon-Grinand, M., et al. (2010). Humanpluripotent stem cells: from biology to cell therapy. World Journalof Stem Cells, 2, 24–33.
16. Adjaye, J., Ralf Herwig, H. J., BenKahla, A., Brink, T. C.,Wierling, C., Hultschig, C., et al. (2005). Primary differentiationin the human blastocyst: comparative molecular portraits of innercell mass and trophectoderm cells. Stem Cells, 23, 1514–1525.
17. Ben-Shushan, E., Thompson, J. R., Gudas, L. J., & Bergman, Y.(1998). Rex-1, a gene encoding a transcription factor expressed inthe early embryo, is regulated via Oct-3/4 and Oct-6 binding to anoctamer site and a novel protein, Rox-1, binding to an adjacentsite. Molecular and Cellular Biology, 18, 1866–1878.
18. Sood, R., Zehnder, J. L., Druzin, M. L., & Brown, P. O. (2006).Gene expression patterns in human placenta. Proceedings of theNational Academy of Sciences of the United States of America,103, 5478–5483.
19. Barak, Y., Nelson, M. C., Ong, E. S., et al. (1999). PPAR gammais required for placental, cardiac, and adipose tissue development.Molecular Cell, 4, 585–595.
20. Aszodi, A., Legate, K. R., Nakchbandi, I., & Fassler, R. (2006).What mouse mutants teach us about extracellular matrix function.Annual Review of Cell and Developmental Biology, 22, 591–621.
21. Timpl, R., Rohde, H., Robey, P. G., Rennard, S. I., Foidart, J. M.,& Martin, G. R. (1979). Laminin–a glycoprotein from basementmembranes. Journal of Biological Chemistry, 254, 9933–9937.
22. Thorsteinsdottir, S. (1992). Basement membrane and fibronectinmatrix are distinct entities in the developing mouse blastocyst.Anatomical Record, 232, 141–149.
23. Assou, S., Anahory, T., Pantesco, V., et al. (2006). The humancumulus–oocyte complex gene-expression profile. Human Repro-duction, 21, 1705–1719.
24. Doyle, L. A., Yang, W., Abruzzo, L. V., et al. (1998). A multidrugresistance transporter from human MCF-7 breast cancer cells.Proceedings of the National Academy of Sciences of the UnitedStates of America, 95, 15665–15670.
25. Bhattacharya, B., Miura, T., Brandenberger, R., et al. (2004). Geneexpression in human embryonic stem cell lines: unique molecularsignature. Blood, 103, 2956–2964.
26. Chan, E. M., Ratanasirintrawoot, S., Park, I. H., et al. (2009). Livecell imaging distinguishes bona fide human iPS cells from partiallyreprogrammed cells. Nature Biotechnology, 27, 1033–1037.
27. Mao, Q. (2008). BCRP/ABCG2 in the placenta: expression, functionand regulation. Pharmaceutical Research, 25, 1244–1255.
28. Kolwankar, D., Glover, D. D., Ware, J. A., & Tracy, T. S. (2005).Expression and function of ABCB1 and ABCG2 in humanplacental tissue. Drug Metabolism and Disposition, 33, 524–529.
29. Simpson, A. J., Caballero, O. L., Jungbluth, A., Chen, Y. T., &Old, L. J. (2005). Cancer/testis antigens, gametogenesis andcancer. Nature Reviews. Cancer, 5, 615–625.
30. Scanlan, M. J., Simpson, A. J., & Old, L. J. (2004). The cancer/testis genes: review, standardization, and commentary. CancerImmunity, 4, 1.
31. Jungbluth, A. A., Silva, W. A., Jr., Iversen, K., et al. (2007).Expression of cancer-testis (CT) antigens in placenta. CancerImmunity, 7, 15.
32. Gjerstorff, M. F., Kock, K., Nielsen, O., & Ditzel, H. J. (2007).MAGE-A1, GAGE and NY-ESO-1 cancer/testis antigen expres-sion during human gonadal development. Human Reproduction,22, 953–960.
33. Gjerstorff, M. F., Harkness, L., Kassem, M., et al. (2008). DistinctGAGE and MAGE-A expression during early human develop-ment indicate specific roles in lineage differentiation. HumanReproduction, 23, 2194–2201.
Stem Cell Rev and Rep (2012) 8:150–162 161
34. Sigalotti, L., Coral, S., Altomonte, M., et al. (2002). Cancer testisantigens expression in mesothelioma: role of DNA methylationand bioimmunotherapeutic implications. British Journal of Cancer,86, 979–982.
35. De Smet, C., De Backer, O., Faraoni, I., Lurquin, C., Brasseur, F.,& Boon, T. (1996). The activation of human gene MAGE-1 intumor cells is correlated with genome-wide demethylation.Proceedings of the National Academy of Sciences of the UnitedStates of America, 93, 7149–7153.
36. Klaffky, E. J., Gonzales, I. M., & Sutherland, A. E. (2006).Trophoblast cells exhibit differential responses to lamininisoforms. Developmental Biology, 292, 277–289.
37. Nagata, A., Ito, M., Iwata, N., et al. (1996). G protein-coupledcholecystokinin-B/gastrin receptors are responsible for physiologicalcell growth of the stomach mucosa in vivo. Proceedings of theNational Academy of Sciences of the United States of America, 93,11825–11830.
38. Noble, P. J., Wilde, G., White, M. R., Pennington, S. R., Dockray,G. J., & Varro, A. (2003). Stimulation of gastrin-CCKB receptorpromotes migration of gastric AGS cells via multiple paracrinepathways. American Journal of Physiology. Gastrointestinal andLiver Physiology, 284, G75–84.
39. Wroblewski, L. E., Pritchard, D. M., Carter, S., & Varro, A.(2002). Gastrin-stimulated gastric epithelial cell invasion: the roleand mechanism of increased matrix metalloproteinase 9 expres-sion. Biochemical Journal, 365, 873–879.
40. Bourc’his, D., Xu, G. L., Lin, C. S., Bollman, B., & Bestor, T. H.(2001). Dnmt3L and the establishment of maternal genomicimprints. Science, 294, 2536–2539.
41. Ooi, S. K., Qiu, C., Bernstein, E., et al. (2007). DNMT3Lconnects unmethylated lysine 4 of histone H3 to de novomethylation of DNA. Nature, 448, 714–717.
42. Chedin, F., Lieber, M. R., & Hsieh, C. L. (2002). The DNAmethyltransferase-like protein DNMT3L stimulates de novomethylation by Dnmt3a. Proceedings of the National Academyof Sciences of the United States of America, 99, 16916–16921.
43. Bourc’his, D., & Bestor, T. H. (2004). Meiotic catastrophe andretrotransposon reactivation in male germ cells lacking Dnmt3L.Nature, 431, 96–99.
44. Mehta, D. V., Kim, Y. S., Dixon, D., & Jetten, A. M. (2002).Characterization of the expression of the retinoid-related, testis-associated receptor (RTR) in trophoblasts. Placenta, 23, 281–287.
45. Janatpour, M. J., Utset, M. F., Cross, J. C., et al. (1999). Arepertoire of differentially expressed transcription factors thatoffers insight into mechanisms of human cytotrophoblastdifferentiation. Developmental Genetics, 25, 146–157.
46. Yamada, K., Ogawa, H., Tamiya, G., et al. (2000). Genomicorganization, chromosomal localization, and the complete 22 kbDNA sequence of the human GCMa/GCM1, a placenta-specific
transcription factor gene. Biochemical and Biophysical ResearchCommunications, 278, 134–139.
47. Rawn, S. M., & Cross, J. C. (2008). The evolution, regulation,and function of placenta-specific genes. Annual Review of Celland Developmental Biology, 24, 159–181.
48. Black, S. G., Arnaud, F., Palmarini, M., & Spencer, T. E.Endogenous retroviruses in trophoblast differentiation and placentaldevelopment. Am J Reprod Immunol, 64, 255–264.
49. Ma, G. T., Roth, M. E., Groskopf, J. C., et al. (1997). GATA-2 andGATA-3 regulate trophoblast-specific gene expression in vivo.Development, 124, 907–914.
50. She, H., Xiong, S., Hazra, S., & Tsukamoto, H. (2005).Adipogenic transcriptional regulation of hepatic stellate cells.Journal of Biological Chemistry, 280, 4959–4967.
51. Xu, R. H., Chen, X., Li, D. S., et al. (2002). BMP4 initiateshuman embryonic stem cell differentiation to trophoblast. NatureBiotechnology, 20, 1261–1264.
52. Schulz, L. C., Ezashi, T., Das, P., Westfall, S. D., Livingston, K.A., & Roberts, R. M. (2008). Human embryonic stem cells asmodels for trophoblast differentiation. Placenta, 29(Suppl A),S10–16.
53. Assou, S., Cerecedo, D., Tondeur, S., et al. (2009). A geneexpression signature shared by human mature oocytes andembryonic stem cells. BMC Genomics, 10, 10.
54. Haouzi, D., Dechaud, H., Assou, S., Monzo, C., de Vos, J., &Hamamah, S. (2011). Transcriptome analysis reveals dialoguesbetween human trophectoderm and endometrial cells during theimplantation period. Human Reproduction
55. Eisen, M. B., Spellman, P. T., Brown, P. O., & Botstein, D. (1998).Cluster analysis and display of genome-wide expression patterns.Proceedings of the National Academy of Sciences of the UnitedStates of America, 95, 14863–14868.
56. Tusher, V. G., Tibshirani, R., & Chu, G. (2001). Significanceanalysis of microarrays applied to the ionizing radiation response.Proceedings of the National Academy of Sciences of the UnitedStates of America, 98, 5116–5121.
57. Al-Shahrour, F., Diaz-Uriarte, R., & Dopazo, J. (2004). FatiGO: aweb tool for finding significant associations of Gene Ontologyterms with groups of genes. Bioinformatics, 20, 578–580.
58. Thomson, J. A., Itskovitz-Eldor, J., Shapiro, S. S., et al. (1998).Embryonic stem cell lines derived from human blastocysts.Science, 282, 1145–1147.
59. Yu, J., Vodyanik, M. A., Smuga-Otto, K., et al. (2007). Inducedpluripotent stem cell lines derived from human somatic cells.Science, 318, 1917–1920.
60. Strom, S., Inzunza, J., Grinnemo, K. H., et al. (2007). Mechanicalisolation of the inner cell mass is effective in derivation of newhuman embryonic stem cell lines. Human Reproduction, 22,3051–3058.
162 Stem Cell Rev and Rep (2012) 8:150–162