dissertation essays on the role of microfinance
TRANSCRIPT
DISSERTATION
ESSAYS ON THE ROLE OF MICROFINANCE INSTITUTIONS IN FINANCIAL
DEEPENING, ECONOMIC GROWTH AND DEVELOPMENT
Submitted by
Vange Mariet Ocasio
Department of Economics
In partial fulfillment of the requirements
For the Degree of Doctor of Philosophy
Colorado State University
Fort Collins, Colorado
Fall 2012
Doctoral Committee: Advisor: Elissa Braunstein Alexandra Bernasek Ramaa Vasudevan Robert G. Schwebach Sherrill Shaffer
Copyright by Vange Mariet Ocasio 2012
All Rights Reserved
ii
ABSTRACT
ESSAYS ON THE ROLE OF MICROFINANCE INSTITUTIONS IN FINANCIAL
DEEPENING, ECONOMIC GROWTH AND DEVELOPMENT
This dissertation is composed of three essays which examine how access to credit,
namely micro credit, impacts economic outcomes at the household and village level in
Bangladesh. The capability approach brought forward by Amartya Sen is applied to analyze
economic development at the community level and to explore the complementarity between the
provision of capability-enhancing services and the effectiveness of microfinance in terms of both
removing credit constraints and improving economic outcomes for poor borrowers. In light of
Sen’s view of development, the Human Development Report defines development as a process
of expanding opportunities so that each person can live a life of respect and value (UNDP, 2000,
p. 2).1 According to this definition, true development would include the improvement of
economic outcomes as well as improvements in human conditions. The main objective of this
dissertation is to explore how microfinance can contribute to economic development as measured
by income growth and to analyze how investment in human capital (as measured by the
provision of education, skill training, etc.) can augment economic growth at the community
level.
Chapter 1 reviews the literature on microfinance including its history, its outreach and its
impact on economic growth and development. In chapter 2, I use household level panel data
from Bangladesh to estimate the economic impact of microfinance by tracing the marginal effect
of microcredit on household income.
1 United Nations Programme. www.undp.org . 2 http://www.accion.org/page.aspx?pid=265. Accessed August 2011.
iii
The findings suggest that the existence of banks and electricity in the village have a positive
impact on household income as well as the ownership of land assets. In terms of microcredit
borrowing, a main result in this study is that micro loans, especially those disbursed by the
Grameen Bank, have a positive and statistically significant effect on household income. Unlike
other studies (particularly, Khandker 2005), the findings in this study suggest that microcredit
benefits all borrowers and not just female borrowers. The findings also suggest differential
impacts by gender, education assets and labor assets.
In chapter 3, I investigate how Amartya Sen's capability approach can be applied to
conceptualize and assess the effectiveness of micro loans when combined with capability-
enhancing services. In this study, microcredit itself is viewed as a capability in the sense that it
enables poor borrowers to start-up enterprises, build assets and remove credit constraints.
Microfinance is also viewed as a complementary tool for enhancing economic development.
Existing impact analysis focuses on marginal outcomes to assess the effectiveness of microcredit
programs. In this context, the methodologies used in impact studies have resulted in findings
that appear trivial in terms of the effects of microcredit on development and poverty reduction.
In this paper, I explore the reasons why microfinance has not been as successful as we would
hope in the case of Bangladesh.
Using household-level panel data from Bangladesh, I develop capability-enhancing
policy variables and use interactions in a multiple linear regression (MLR) model to investigate
whether the existence of services have any effect on the effectiveness of micro loans in
increasing household income. Such services include, the provision of basic literacy services,
skill training, etc..

iv
The findings in this study suggest that when a set of capability-enhancing services are combined
with microcredit, the marginal effect of microcredit on household income is positive and in some
cases, more robust than when credit is issued without these services. The results suggest that the
positive effect of microcredit can be larger in magnitude when credit is issued along with
capability-enhancing services.
There are two preliminary conclusions in this study: (i) The implementation of capability-
enhancing policies along with microcredit, augments the effectiveness of microfinance and, (ii)
Given this positive association, from a policy perspective, in order to maximize the effectiveness
of microcredit, the disbursement of micro loans should be accompanied by a capability set that
would allow poor borrowers to thrive both economically and socially. In this context, giving
poor borrowers access to credit along with capabilities or opportunity sets would result in greater
efficiency in terms of maximizing the social and income return of micro loans. From a
sustainable development standpoint, the effectiveness of microcredit in enhancing development
would be greater when there is also simultaneous investment in human capital.
In chapter 4, I expand the dissertation with a study that attempts to measure some of the
spillover effects of microfinance. I specifically estimate the effect of microfinance on both,
village income and intra-village income inequality. The objective of the study is to examine the
effects of microfinance beyond borrower welfare and to explore some of the possible general
equilibrium effects of microfinance. In this study, I find that microfinance is positively
associated with increases in income at the village level and it is also positively associated with
increases in village income inequality. This result is counterintuitive because one would expect
that if incomes increase at the village-level, income inequality would decrease and not increase.
v
However, this expectation implies that microcredit’s return to income is the same for all
borrowers. If this is not the case, for instance, if some borrowers are wealthier than others when
they received the loan, then it is possible for microcredit to have differential income effects. In
this context, if wealthier borrowers become wealthier as a result of access to micro credit, then it
is possible for income inequality to widen even though incomes overall are also increasing.
Higher educational achievement was found to be negatively associated with intra-village income
inequality. From a policy standpoint, the findings in this study suggest that in order to offset the
polarizing effect of microcredit, policymakers should look at initiatives that encourage
investment in human capital.
This dissertation expands the dialogue about the effectiveness of microfinance and
advocates for more investment in human capital as a way to augment the potential social and
economic returns of microcredit. The results obtained through the many econometric
estimations suggest that microcredit, while not a perfect poverty reduction tool, is an effective
way to encourage economic growth.
vi
ACKNOWLEGEMENTS
I would first like to thank God and my family, particularly my husband, Manuel
Hochheimer, and my twin sister, Rose Ocasio, for their unwavering love and longstanding
support for my academic journey. I would also like to thank my sons, Noah and Luca, for their
smile and daily inspiration. Thank you to all of my friends and colleagues at Colorado State
University for providing a genuine and nurturing environment for learning. Thank you Dr. Ian
M. Breunig, Dr. Paula M. Cole, Dr. Karen Gebhardt and Dr. Anita Alves Pena for your
friendship.
I would like to express my eternal gratitude and appreciation for my advisors as well as
the rest of the faculty and staff at Colorado State University for their guidance throughout my
academic career. I would most like to thank Dr. Elissa Braunstein for nurturing my research
creativity and for her genuine interest in my work and my professional success. Thank you to
Dr. Sherrill Shaffer for being such an inspiration to me and for his guidance and support
throughout the years. I would also like to express special thanks to Dr. Alexandra Bernasek for
being a mentor and friend to me throughout the years. Lastly, but not least, thank you to my
grandparents for loving me and teaching me about perseverance.
vii
TABLE OF CONTENTS
LIST OF ACRONYMS .................................................................................................................. ix CHAPTER I: Brief History of Microfinance .................................................................................. 1
1. Introduction ........................................................................................................................................... 1 1.1 Microfinance: A Definition ............................................................................................................ 3 1.2 Overview of Microfinance in Bangladesh and Other Countries .................................................... 5 1.3 Microfinance in Latin America and the Caribbean ....................................................................... 8 1.4 Microfinance in South Asia ......................................................................................................... 11 1.5 Sources of Poverty in Bangladesh ............................................................................................... 13 1.6 Impact of Microfinance in Bangladesh and Around the World ................................................... 15
CHAPTER II: The Economic Impact of Microcredit on Poor Households: A Study of Flagship Programs in Bangladesh .................................................................... 17
1. Introduction ........................................................................................................................................ 17 1.1 Use of Income vs. Consumption to Measure Poverty ................................................................. 20 1.2 Microfinance in Bangladesh ........................................................................................... 21
2. Empirical Literature ............................................................................................................. 22 3. Theoretical Model and Estimation Strategy ......................................................................... 25 4. The Data ............................................................................................................................... 28 5. Results .................................................................................................................................. 32 6. Conclusion ............................................................................................................................ 38 CHAPTER III: Complementarity Between Microcredit and Capability-Enhancing Services:
The Case of Microfinance Institutions in Bangladesh ....................................... 40 1. Introduction ........................................................................................................................................ 40 2. Sen’s Capability Approach ................................................................................................... 43
2.1 Institutions and Instrumental Freedoms ......................................................................... 46 2.2 Capabilities, Interconnections, and Microfinance .......................................................... 47
3. Capability Constraints in Bangladesh .................................................................................. 48 4. Capabilities and Economic Development in Bangladesh………………… ......................... 54 5. Microcredit and Channels of Impact .................................................................................... 59
5.1 Impact of Microcredit and Capability-Enhancing Services on Household Income .......................................................................................................... 62
6. Empirical Model I: Policy Impact on Household Outcome ................................................. 64 7. Empirical Model II: Analysis of Associations Between Microcredit and
Capability-Enhancing Services ............................................................................................. 68 7.1 Interactions in Multiple Regression Model: Significance Testing and Interpretation of Results ................................................................................................. 72
8. The Data ................................................................................................................................ 76 8.1 Institutional Design of Selected MFIs in Bangladesh .................................................... 79
9. Results: Impact by Type of Institutions and by Policy ........................................................ 84 10. Results: Analysis of the Effect of Microcredit and Capability-Enhancing Policies ............................................................................................................................... 91 11. Conclusion ........................................................................................................................ 104
viii
TABLE OF CONTENTS-continued CHAPTER IV: Microfinance and its Effect on Income Inequality: Evidence from Rural Bangladesh ............................................................................................ 106
1. Background ..................................................................................................................................... 106 1.1 Microfinance and Inequality ..................................................................................................... 110
2. Data ........................................................................................................................................ 114 2.1 Measuring Inequality and Poverty ............................................................................... 119
3. Theoretical Model and Estimation Strategy ....................................................................... 121 3.1 Pooled OLS Regression Model: Effect of Microcredit on
Village Income ............................................................................................................. 122 3.2 Fixed-Effect Estimator: Effect of Microcredit on Village Income .............................. 123 3.3 Pooled OLS Regression Model: Effect of Microcredit on Village Income Inequality ......................................................................................................... 124
3.4 Fixed-Effect Estimator: Effect of Microcredit on Village Income Inequality ......................................................................................................... 125 4. Results ................................................................................................................................ 126
4.1 Pooled OLS Regression Model: Effect of Microcredit on Village Income .......................................................................................................................... 126 4.2 Fixed-Effect Estimator: Effect of Microcredit on Village Income .............................. 128 4.3 Pooled OLS Regression Model: Effect of Microcredit on Village ............................. 131 Income Inequality 4.4 Fixed-Effect Estimator: Effect of Microcredit on Village Income .............................. 134 Inequality 5. Conclusion ........................................................................................................................... 135 CHAPTER V: Microfinance as a Development and Poverty Reduction Tool:
Concluding Remarks ......................................................................................... 139 REFERENCES ............................................................................................................................ 144 APPENDIX I ............................................................................................................................... 153 APPENDIX II ............................................................................................................................. 157
ix
LIST OF ACRONYMS
Acronym
ASA Association for Social Advancement
BIDS Bangladesh Institute of Development Studies
BRAC Bangladesh Rural Advancement Committee
BRI Bank Rakyat Indonesia
FE Fixed-effects
GDV Gender-based violence
GSS Gana Shahajyo Sangstha
HID Human Development Index
IHDI Inequality-adjusted HDI Index
LAC Latin America and the Caribbean
LS Two-stage Least Squares
MCP Microcredit programs
MFIs Microfinance Institutions
MLE Maximum Likelihood Estimation
MLR Multiple Linear Regression
MRA Microcredit Regulatory Authority
NGOs Non-governmental organizations
OLS Ordinary Least Squares
PPAF Pakistan Poverty Alleviation Fund
RD-12 Bangladesh Rural Development Board’s RD-12 Program
x
RFM Rural Financial Market
SHG Self-help group model
UNDP United Nations Development Programme
VBSP Vietnam Bank for Social Policies
1
CHAPTER I
Brief History of Microfinance
1. Introduction
The microfinance movement has changed perceptions towards helping the
poor in both, South Asia and Latin America. In many countries, microfinance has been used as a
tool to increase financial depth in rural areas and it has typically targeted very low-income
groups who would normally be excluded by conventional financial institutions (Weiss and
Montgomery, 2004).
There is extensive literature on the range of institutional arrangements employed by
different countries, the types of services microfinance institutions (MFIs) provide and the extent
of outreach. However, there is agreement amongst the academic development community about
the fact that we still know very little about the impact of microcredit (ibid). The overall
consensus concerning the extent of what we currently know about microfinance was bluntly
expressed in the following statement: “MFI field operations have far surpassed the research
capacity to analyze them, so excitement about the use of microfinance for poverty alleviation is
not backed up with sound facts derived from rigorous research. Given the current state of
knowledge, it is difficult to allocate confidently public resources to microfinance development”
(Zeller and Meyer, 2002).
2
The potential role financial institutions and intermediation play in economic growth and
development has always been a topic I have found of interest during my graduate studies.
According to the literature I have read on this topic, (i.e. King and Levine, 1993), there seems to
be a positive relationship between the size of the financial sector and economic growth. Access
to credit both for individuals and for businesses, even countries, has been positively associated
with asset growth, investment and overall economic growth (See King and Levine, 1993abc,
Ross, 1997 and 1998, Lucas, 1988 and Pagano, 1993). In this context, when I learned about
microfinance, I immediately validated the idea of providing the very poor with access to credit,
since access to credit has been linked to positive economic growth. In this sense, my dissertation
work has been grounded on the following general question: If access to credit has been found to
be effective in promoting economic growth and development, why would this not be the case for
microfinance? If microfinance is a type of financial intermediation that eases credit constraints
among the poor, then why shouldn’t we expect the same positive impact we have seen in the case
of macro-level financial intermediation?
There are many reasons why the impact of microcredit might not be expected to be the
same as the impact that has been traced in the finance and growth literature. One of the major
reasons is that the characteristics of the borrowing pool are much different for microfinance
clients than for the clients of formal financial institutions. Such differences range from the
collateral that is provided to the socio-economic background of these borrowers. In this context,
rigorous impact analysis must be conducted to establish a strong linkage between microcredit
and the potential benefits that it can bring about.
3
1.1 Microfinance: A Definition
Microfinance is a term used to describe the provision of financial services such as savings
and insurance and issuing loans as low as $100. These services and loans are typically offered to
the poor and their families to assist them in the launching and development of small businesses
as well as to help them engage in other productive activities. Many microfinance institutions
(MFIs) adopt the social objective of helping the poor become more self-sufficient in order to
improve the lives of family members, communities and whole societies (ACCION
International)2.
Microfinance used to be known as microcredit. Microcredit refers to the practice of
issuing small loans without additional services. Today, since microcredit is offered along with a
range of other services, the term microcredit has been replaced with the term microfinance (ibid).
Throughout this dissertation, the terms microcredit and microfinance are used interchangeably to
describe loans and services provided by MFIs.
The issue of microcredit became prevalent in the 1980s, although an early experiment of
this lending scheme dates back 30 years ago in Brazil, Bangladesh and a few other countries
(ibid). Microcredit came about from the need to provide the very poor access to credit without
the collateral requirements typically imposed by the formal banking sector. In this context,
microcredit has focused on clients whose alternative sources of credit have typically been in the
informal sector where they are subject to violence and abuse by money-lenders.
2 http://www.accion.org/page.aspx?pid=265. Accessed August 2011.

4
Microcredit is loaned to a micro entrepreneur by a bank or other institution and is often offered
without requiring collateral from a group or an individual. Some of the main characteristics of
the microcredit lending model includes the following (ibid):
Group lending: This type of lending scheme is also known as solidarity group lending
or village banking and it is a self-monitoring mechanism that allows individuals to gain
access to microcredit by securing collateral through group savings or guaranteeing a loan
through a group repayment pledge. In this lending model, the incentive to repay is based
upon peer pressure. If a group member defaults, the other group members make up the
payment amount.
• Individual lending: This type of lending practice focuses on providing microcredit to
one client at a time and does not require collateral or a guarantee for the loan.
Many microcredit loans are working capital loans used by the borrower to purchase
additional inventory for their business, such as flour for the food entrepreneur or to acquire
equipment. Over time, the issue of microcredit has expanded to the provision of other financial
services not available to poor borrowers in the informal sector. Microfinance has attempted to
meet the needs of poor borrowers by offering many services such as loans, savings, transfer
services (remittances), insurance, education and skill training. Many financial institutions can
provide these services, including non-governmental organizations (NGOs), cooperatives, credit
unions, private commercial banks, non-bank financial institutions and some state-owned banks
(ibid).
5
In many countries, microfinance programs lend predominately to poor women who are
self-employed in the informal sector. In the Grameen Bank in Bangladesh, for instance, 97
percent of their seven million borrowers are women.3 One of the reasons for focusing on
providing credit to women is that women are believed to be poorer and more credit constrained
than men (see Burjorjee et al., 2002). In this context, microfinance has been used as a tool to
provide access to financial services to women as well as a way to help them become
entrepreneurs, empower them, induce higher levels of mobility and increase political
participation (Hashemi et al. 1996).
1.2 Overview of Microfinance in Bangladesh and Other Countries
During the early 1980s and mid 1990s, there was an increase of semi-formal financial
institutions focusing on poor women micro entrepreneurs with no collateral. To reach the poor,
new lending schemes, widely known as microfinance, were developed by NGOs and banks with
special charter such as the Grameen Bank in Bangladesh and the village banks of the Bank
Rakyat Indonesia. In countries such as India, Indonesia, Sri Lanka and Vietnam, government-
owned banks are key suppliers of microfinance services. Many of these banks are reliant on
substantial subsidies for their operations. An exception is the Bank Rakyat Indonesia (BRI)
where a unit desa system is used to ascertain financial sustainability. BRI focuses on the issue of
loans to the “better off” poor as well as non-poor households (Morduch 1999). In Bangladesh,
Cambodia, Nepal, Philippines, and Sri Lanka, NGOs are the predominant suppliers of
microfinance services.
3 hhtp://www.grameen-info.org/bank/index.html. Accessed May 2007.
6
There are more than 1,000 NGOs in Bangladesh who service more than 10 million households
(Haque 2006). The largest NGOs in Bangladesh, are the Bangladesh Rural Advancement
Committee (BRAC), the Association for Social Advancement (ASA), and Proshika. These
NGOs account for 73% of the total outstanding loans (Thapa, 2007).
In Bangladesh, the Grameen Bank is the largest provider of microcredit among chartered
banks. The Grameen Bank originated in 1976 when Professor Muhammad Yunus, Head of the
Rural Economics Program at the University of Chittagong, executed an action research project to
explore the idea of designing a credit delivery mechanism to provide banking services to the
rural poor (Grameen Bank).5 The objectives of the Grameen Bank (named Grameen, which in
the Bangla language means “rural” or “village”), include the following (ibid):
1. Provide banking facilities to the poor.
2. Prohibit the exploitation of the poor by money-lenders.
3. Create opportunities for self-employment for the unemployed in rural Bangladesh.
4. Enable the disadvantaged, particularly women from the poorest households, to be self-sufficient.
5. End the vicious circle of "low income, low saving & low investment", and create a
virtuous circle of "low income, injection of credit, investment, more income, more savings, more investment, more income".
5 http://www.grameeninfo.org/index.php?option=com_content&task=view&id=19&Itemid=114. Accessed October 2012.
7
Yunus’ action research project became successful in Jobra (a village adjacent to
Chittagong University) and in some of the neighboring villages during 1976-1979. Over time,
and with the sponsorship of the central bank of Bangladesh and the support of the nationalized
commercial banks, the project’s outreach was extended to the Tangail district in 1979. Given the
success of the program in Tangail, the project was further extended to other areas in the country.
In October 1983, the Grameen Bank Project was converted into a formal bank by government
legislation. Currently, the Grameen Bank is owned by its members who are the rural poor.
Member borrowers of the Bank own 90% of its shares, and the remaining 10%, is owned by the
government of Bangladesh (ibid).
The Grameen Bank’s lending model has been replicated worldwide, including China,
India, Malaysia, Philippines, Sri Lanka, Thailand and Vietnam. The self-help group model
(SHG) was designed by nongovernmental organizations (NGOs) (e.g. MYRADA) in India and is
currently used by many MFIs and banks. This model is widely used in some parts of South East
Asia, including Indonesia and Africa (Thapa, 2007).
Cooperatives are also major providers of microfinance in countries like India,
Philippines, Sri Lanka, Thailand and Vietnam. In 1999, in Sri Lanka, there were 1,418
cooperative rural banks with 5.3 million deposit accounts and 1.23 million loans outstanding
(Fernando, 2002, pp. 5-6). There were 8,400 thrift and credit cooperative societies that serviced
786,000 members (Thapa, 2007, p. 18).
8
1.3 Microfinance in Latin America and the Caribbean
Latin American MFIs have had tremendous success in expanding financial services to
underserved groups. Since the late 1980s, microfinance clients have been growing to make Latin
America one of the largest providers of microfinance in the world along with South East Asia.
Through MFIs, financial services are currently available to nearly six million low income
borrowing households in Latin America and the Caribbean (LAC) (Navajas and Tejerina, 2006).
Microfinance lending in LAC ranges in design and structure. There are non-regulated
MFIs that focus lending predominately in less urbanized areas. NGOs continue to be the most
significant source of non-regulated microfinance. On the other side of the regulation spectrum,
in countries like Peru, Bolivia and Honduras, we find MFIs that are specialized nonbank
charters. Such nonbank institutions are regulated financial institutions that are required to
comply with the regulations put in place by the designated financial authority. The main
difference between these institutions and a full service bank is typically lower capital
requirements and a limited scope of services provided (Navajas and Tejerina, 2006).
In LAC, the provision of microfinance by commercial banks has become a common
trend. For some banks like MiBanco in Peru and ProCredit in Ecuador, their primary line of
business is microfinance. Other banks such as BanHcafe in Honduras, Banco Pichinca in
Ecuador and Banco Santander in Chile are adopting microfinance as a new product (Westley,
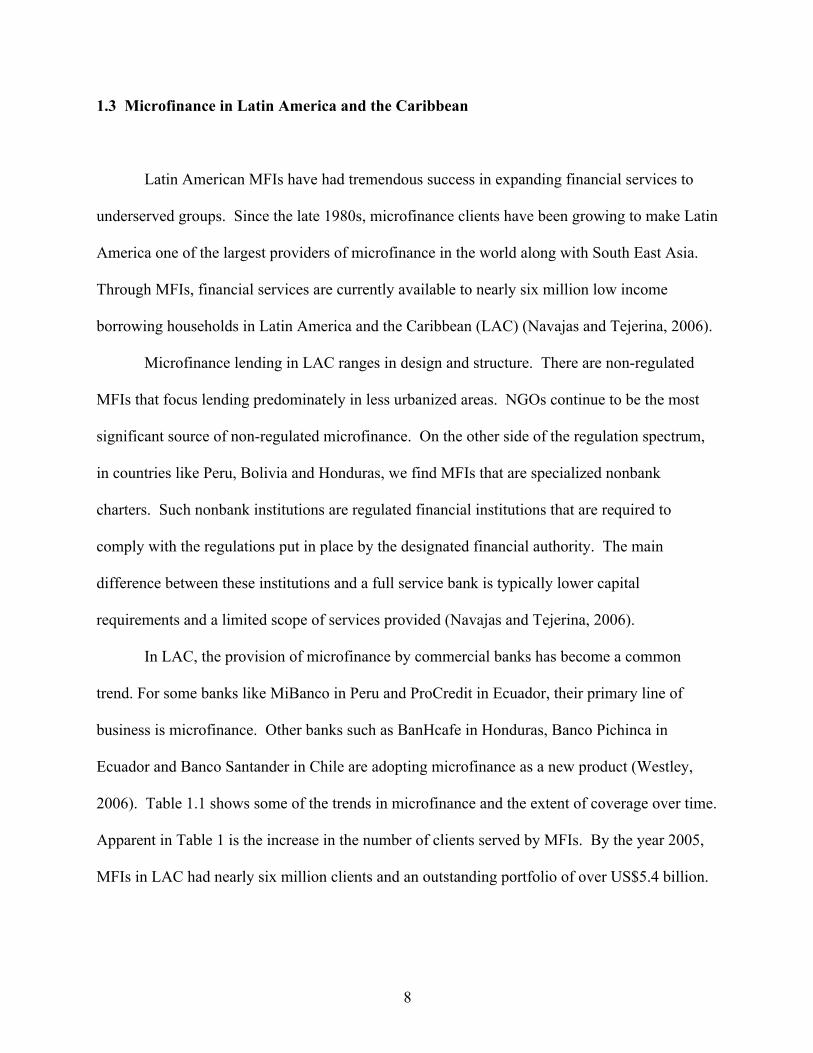
2006). Table 1.1 shows some of the trends in microfinance and the extent of coverage over time.
Apparent in Table 1 is the increase in the number of clients served by MFIs. By the year 2005,
MFIs in LAC had nearly six million clients and an outstanding portfolio of over US$5.4 billion.
9
According to Navajas and Tejerina (2006), the estimates in their study do not include the number
of clients with access to remittances, deposits, payment services and other financial services.
The estimates are also not adjusted for borrowers with multiple loans at a given time.
Table 1.1: MFIs in Latin America and the Caribbean, 2005 and 2001
Type of Institution Number of Institutions
Portfolio (US$
Million) Borrowers
Average Loan (US$)
Data from 2005 (23 countries) Regulated MFIs 98 4,407 3,851 1,144
Downscale (Banks & Financieras)a 31 1,810 1,233,873 1,467
Greenfieldsb 30 1,005 738,671 1,361 Upgradesc 37 1,592 1,879,221 847
Non-regulated MFIs 238 1,030 2,100,951 490 All MFIs-2005 336 5,437 5,952,716 913
Data from 2001 (17 countries)
Regulated MFIs 60 901 936,936 962 Downscale (Banks &
Financieras)a 21 343 365,171 939
Upgradesc 39 558 571,765 976 Non-regulated MFIs 124 288 869,509 332
All MFIs-2001 184 1,189 1,806,45 659 aDownscales: regulated financial institutions that added microcredit as a new line of business. bGreefields: MFIs that started operating as regulated financial institutions since their inception. cUpgrades: NGOs that have transformed themselves into regulated financial institutions. Source: Adapted from Table 1, Navajas and Tejerina, 2006, p. 4. Another important trend is the fact that regulated MFIs have a significant market share in
micro lending. In 2001 52 percent of microfinance clients were served by regulated MFIs and
this percent increased to 65 percent by 2005. According to Navaja and Tejerina (2006, p. 5), the
annual growth rate for the number of borrowers is 35 percent annually and 46 percent for the
growth in portfolio.
10
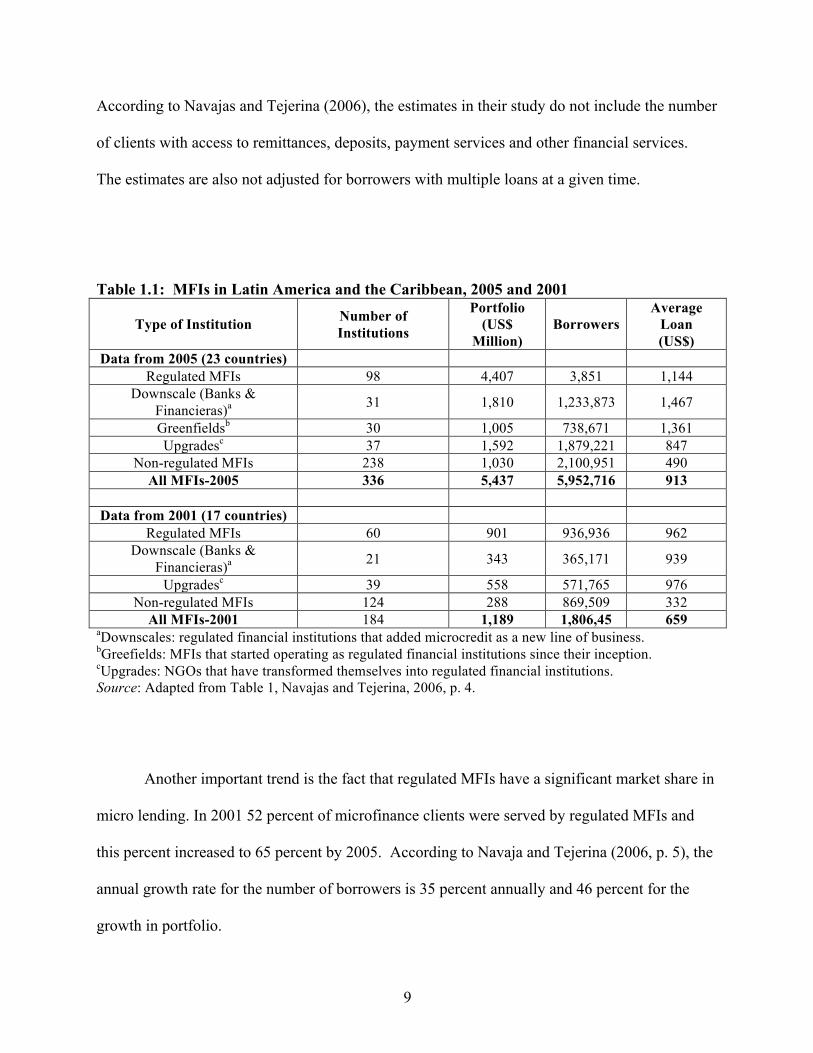
Table 1.2 shows the magnitude of microfinance coverage in the LAC region. The countries are
listed according to the number clients they have. Mexico ranks at the top and Peru, Columbia
and Bolivia follow with well-established microfinance markets.
Table 1.2: Microfinance in Latin America and the Caribbean (circa 2005)
Country Number of MFIs
Portfolio (US$ Millions) Borrowers Average Loan
(US$) Mexico 39 471 1,217,920 387
Peru 67 1,516 1,174,361 1,291 Columbia 22 315 608,282 518
Bolivia 21 635 548,242 1,158 Nicaragua 21 261 399,614 652 Guatemala 24 273 363,286 753
Ecuador 20 322 327,065 985 Chile 5 663 297,995 2,223 Brazil 16 91 289,697 313
Dominican Republic 13 158 145,332 1,087 El Salvador 11 138 143,461 964 Honduras 14 80 143,118 560
Haiti 9 24 81,222 374 Paraguay 5 71 59,936 1,193
Costa Rica 19 341 45,607 7,469 Venezuela 5 37 44,969 816
Panama 6 16 28,103 552 Uruguay 3 10 7,155 1,422
Argentina 10 4 10,649 402 Jamaica 3 4 10,401 376 Guyana 1 2 4,184 413 Trinidad 1 3 1,733 1,500 Barbados 1 4 384 9,446
Total 336 5,437 5,952,716 913 Source: Adapted from Table 2, Navajas and Tejerina, 2006, p. 5.
An interesting aspect of the microfinance market in LAC is that the countries are
different in the number of MFIs they have and the average loan size. Peru for instance, does not
have as many borrowers as Mexico but it outranks Mexico in both the number of MFIs and the
average size of the loans disbursed. Costa Rica does not rank at the top in the number of
borrowers, but it does rank second to Barbados in the average size of the loans its MFIs provide.
11
1.4 Microfinance in South Asia
The number of MFIs serving the South Asian region varies from country to country.
There are many factors that contribute to the extent of coverage of MFIs in the South Asian
microfinance sector. Such factors include the modes of delivery mechanism by which credit is
disbursed, the extent of competition and institutional frameworks as well as the historical context
of the country. Some countries have a very mature market and low barriers to entry and this has
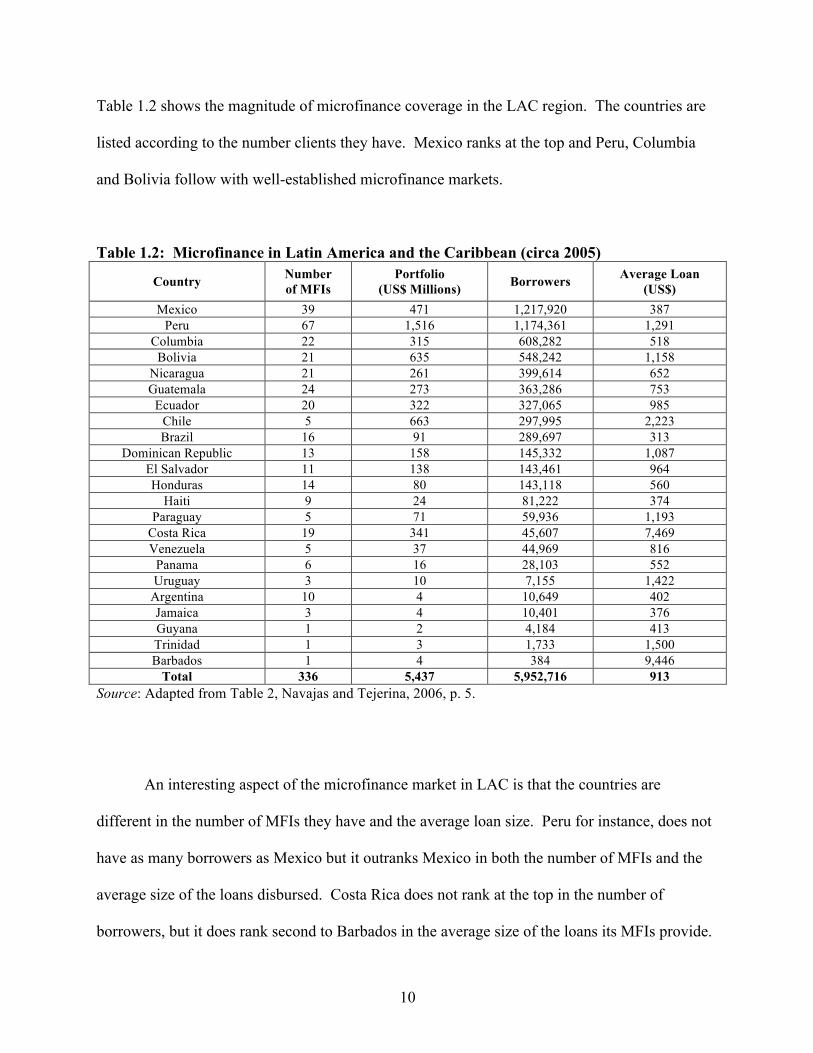
contributed to the significant growth of MFIs in these countries (Alamgir, 2009). As illustrated
in Table 1.3, Bangladesh is a good example of a market where microfinance has penetrated to a
significant extent. Currently, there are 518 NGO-MFIs registered with the recently established
Microcredit Regulatory Authority (MRA) and there are a number of unregulated MFIs
throughout the country.6
Table 1.3: Number of MFI Branches by South Asian Countries
Country Number of Branches Number of Branches per 100 Sq Km Land
Area
Average Annual Growth between 2006
and 2008a
Afghanistan 283 0.43 6% Bangladesh 14,441 110.94 5% Nepal 590 4.13 12% Pakistan 1,281 1.88 12% Sri Lanka 1,465 22.67 1% Source: Microfinance Institute, Overview Report 2010. See MRA at www.mra.gov.bd. Accessed on January 2011.
6 See MRA at www.mra.gov.bd. Accessed on January 2011.

12
Although Bangladesh and Sri Lanka have a more mature microfinance sector in terms of
coverage, all of the South Asian countries have experienced growth in their respective
microfinance sector. According to the data presented in Table 1.3, Nepal and Pakistan have
experienced the largest growth from 2006 to 2008. In Table 1.4 we can see the extent of
microfinance coverage in South Asia in terms of the number of borrowers each country had as of
2007. Sri Lanka and Bangladesh are by far the largest hosts of microfinance schemes. An
interesting number to look at is the growth rate in coverage from 2006-2007. Pakistan and
Afghanistan display a tremendous growth in microfinance over this period. In the case of
Pakistan a significant driver in the increase of microfinance has been the effort of the Pakistan
Poverty Alleviation Fund (PPAF) to alleviate poverty. In addition, the government of Pakistan
established the Khushali Bank to provide financial services to the underserved population. In
Afghanistan, the country has adopted microfinance as a tool to alleviate poverty and to facilitate
the process of democratization in the country (Alamgir, 2010).
Table 1.4: Number of Borrowers per thousand poor people by countries in South Asia and growth in 2007 Country Borrowers per 1000 people Growth (% change over
2006-2007) Afghanistan 28.1 55.2 Bangladesh 305.9 15.1 India 33.9 18.4 Nepal 33.4 23.5 Pakistan 26.6 51.3 Sri Lanka 365.8 3.4 Source: Microfinance Institute, Overview Report 2010. See MRA at www.mra.gov.bd. Accessed on January 2011.
13
1.5 Sources of Poverty in Bangladesh
Bangladesh is a predominately rural economy although urbanization has been taking
place at a fast pace. According to current estimates, agricultural activities have been declining as
a percentage share of GDP. In 1989, agricultural activities accounted for 30.4% of GDP and by
2009 agriculture as a percentage of GDP had declined to 18.7%. Industry during this same
period climbed from 21.1% of GDP to 28.7 percent in 2009. Industrial activities are now
becoming more important in the Bangladeshi economy. Most of the industrial activities are in
the services sector rather than in the manufacturing sector (World Bank, 2011). 7 In terms of
economic growth, Bangladesh has achieved stable economic growth (as measured by GDP) in
the past three years of about 5.4% annually.
Currently, the World Bank estimates that Bangladesh’s economy will continue to grow at a 5.4%
per year but some constraints to this growth are noted. Some of these constraints includes lack
of a quality education, rapid urbanization, weak governance and inadequate infrastructure,
especially power and ports (ibid)
The incidence of poverty in Bangladesh is relatively high, particularly in the rural areas
(Rahman and Hossain, 1995). Although poverty has declined in recent years , about 40 percent
of the population (likely higher in rural areas) live below the national poverty line (World Bank
2011)8.
7 http://www.worldbank.org.bd/WBSITE/EXTERNAL/COUNTRIES/SOUTHASIAEXT/BANGLADESHEXTN/0,,contentMDK:23209442~menuPK:295765~pagePK:2865066~piPK:2865079~theSitePK:295760,00.html. Accessed August 2011. 8http://www.worldbank.org.bd/WBSITE/EXTERNAL/COUNTRIES/SOUTHASIAEXT/BANGLADESHEXTN/0,,contentMDK:23209442~menuPK:295765~pagePK:2865066~piPK:2865079~theSitePK:295760,00.html. Accessed August 2011.
14
Historically, poverty in Bangladesh has been associated with increasing landlessness, high
unemployment, low literacy and high pollution growth (Khandker, 1998). Bangladesh has also
been characterized as a high population growth country. Currently, population is a 162.2 million
and the population growth is 1.5% annually.
Even though more than 90 percent of cultivable land in Bangladesh is used for food-grain
production, the growth rate of food is substantially low (about 4 percent) which means that the
country’s supply of food does not meet its demand. Malnutrition is prevalent among the poor,
particularly among women and children (ibid). Child malnutrition is (% of children under 5)
41percent compared to 28 percent for low income countries. The literacy rate (% of population
age 15+) for Bangladesh is 55 percent compared to 61% in South Asia and 66% in low income
countries (World Bank 2011)9.
Given Bangladesh’s historical and current constraints in terms of large population
growth, sluggish agricultural production and lack of adequate education and infrastructure, the
prospects of continued economic growth are in question. In the meantime, providing the rural
poor with access to credit seems like a viable strategy to reduce poverty. This supply-based
approach is centered on the idea that there is a strong demand for inputs such as credit and
schooling and that individuals and households with access to such inputs can improve their well-
being through increases in production, consumption and investment (Khandker, 1998).
9http://www.worldbank.org.bd/WBSITE/EXTERNAL/COUNTRIES/SOUTHASIAEXT/BANGLADESHEXTN/0,,contentMDK:22977793~pagePK:141137~piPK:141127~theSitePK:295760,00.html. Accessed August 2011.
15
1.6 Impact of Microfinance in Bangladesh and Around the World
Measuring the impact of microfinance has been a popular objective among researchers
interested in exploring the issues surrounding the topic of poverty. Many of these studies are
cited throughout this dissertation but to set the stage for the analysis to follow, I will mention a
few impact studies that have been influential in igniting recent and future research.
One of the early and widely cited studies of the impact of microfinance on poverty is
Hume and Mosley (1996). In this study a control group approach was employed to evaluate
programs in different countries, including the Grameen Bank in Bangladesh and the Bank of
Rakyat Indonesia. The authors found that the incomes of poor borrowers increased ranging from
10-12% in Indonesia to about 30% in Bangladesh.
Another study of a couple of major microcredit programs in Bangladesh revealed that 5
percent of participating households were removed from poverty annually as a result of receiving
microcredit. This study also suggests that loans taken out by women add 18 Taka to
consumption (Khandker 1998). A similar study of Bangladesh programs suggests that
participation in a microcredit programs, particularly in the Grameen credit program, has an
increasing effect on schooling by girls when women are the loan recipients (Pitt and Khandker,
1998). Other studies such as that of Duong and Izumida (2002) find that participation in
microcredit programs is influenced by the lack of credit facilities and by the ownership of assets.
The findings in this study also suggest a positive correlation between credit and output.
16
In a more recent study, Amin et al. (2003), the findings suggest that members are
typically poorer than nonmembers and that programs are more successful in reaching the poor
but not as successful in reaching the vulnerable. Another study of MFIs in Indonesia found a
significant correlation between consumption and health among borrowing households (Gertler et.
al., 2003). A similar study concerning the correlation between microfinance borrowing and
health suggests that microcredit given to women is positively correlated with height-for-age and
arm circumference of boys and girls in the household (Pitt et. al., 2003).
The aforementioned studies document the impact of microfinance in South Asia and
establish an overall positive correlation between access to microcredit, poverty reduction and
positive social outcomes. The impact literature on Latin American microcredit programs
suggests a similar outcome. In a study of credit programs in Bolivia such as BancoSol,
ProMujer, PRODEM and SARTAWA, the findings suggest that microcredit is associated with
larger increases in income for borrowers as compared with nonborrowers (Mosely, 2001).
Another similar result was obtained in a study of Ecuador’s Banco Solidario program and
Bolivia’s Caja de los Andes program. The findings suggest that being a client of an MFI is
associated with increasing incomes (Benegas et al, 2002). In a study of Peru’s Mibanco, the
findings suggest that the microenterprises of participants have substantial increases in net
income, assets and employment relative to those microenterprises that do not participate in a
credit program (Dunn and Arbucle, 2001a, 2001b). A prevalent finding in the literature is that
access to microfinance benefits poor borrowers and contributes to poverty alleviation.
17
CHAPTER II
The Economic Impact of Microcredit on Poor Households: A Study of Flagship Programs in Bangladesh
1. Introduction
Critics of microfinance argue that micro loans are just “micro-Band-Aids” because they
fail to generate benefits substantial enough to alleviate poverty in the countries where
microcredit programs have been implemented. Bangladesh and Bolivia are examples of such
countries.10 On a macroeconomic level and looking at aggregate data, it is hard to dispute claims
that microfinance has not indeed succeeded in alleviating poverty. Looking at recent studies on
the household and village-level effects of microfinance, however, tells quite a different story.
Using household level panel data from Bangladesh, this paper estimates the economic
impact of microfinance by tracing the marginal effect of microcredit on household-level income.
The motivation and research question in this study is driven by a simple question: If increases in
income contribute to poverty reduction, are micro loans important in income generation and thus
poverty alleviation? This paper contributes to the current literature on microfinance in two ways:
(i) to my knowledge, the impact of microcredit on household income has not been measured
using both periods in this dataset, (ii) the results obtained in this study contradict previous
findings that suggest that microfinance in Bangladesh benefits only women.
10 Alexander Cockburn, “The Myth of Micro Loans”, The Nation, October 19, 2006.
18
In fact, in a recent study, Khandker 2005 found that access to microcredit contributes to poverty
reduction, especially for women while in the case of men, microfinance had no statistical
significance in augmenting household consumption. In this study, microfinance loans given to
both female and male borrowers have a positive and statistically significant impact on household
income.
Lastly, this study contributes to the literature in that it captures differential impacts by
loan source, gender, education assets and labor assets. Additionally, the loans obtained from
money-lenders in the informal market are included in the analysis to see how these loans affect
borrowing households. This paper is organized as follows: section 1.1 presents a rationale for
using household income rather than household expenditure as a dependent variable to measure
household economic outcome, section 1.2 describes the extent of microfinance outreach in
Bangladesh, section 2 presents the empirical literature, section 3 presents the model and
estimation strategy, section 4 describes the data, and sections 5 and 6 summarize the results and
provide the main conclusions.
As described in chapter 1, in Bangladesh, as well as in other countries, microfinance
programs are often targeted towards the poor and women who are self-employed in the informal
sector. Microfinance involves small-scale credit and savings transactions that allow small
businesses to obtain start-up capital with little or no collateral in place. Microcredit programs
also provide education and working skills to women and the poor in order to improve production
capabilities and decision-making. A number of microfinance institutions (MFIs) and non-
governmental organizations (NGOs) lend predominately to women. For instance, about 97
percent of Grameen Bank’s seven million borrowers are women.11
11 hhtp://www.grameen-info.org/bank/index.html, as of May 2007.
19
Other major microfinance programs such as FINCA and ACCION also lend
predominately to women.12 One of the reasons MFIs and NGOs have shifted micro-lending
toward women is that women are believed to be poorer than men on average (see Burjorjee et al.,
2002). Women also tend to own little assets compared to their male counterparts and this makes
them unable to provide the collateral required by most formal lenders. In this context, women
are believed to be more credit-constrained (Khandker, 1998).
In the case of Bangladesh, microcredit is targeted toward poor rural women because
rural women in particular, tend to be isolated and deprived and even though they greatly
contribute to rural economic activity, their work is marginalized and ignored (see Schuler &
Hashemi, 1995 and Abdullah & Zeidenstein, 1982). Additionally, given Bangladesh’s system of
‘purdah,’ “a system for the seclusion of women” (Khan, 1988, p. 33), women, particularly in
rural Bangladesh, have typically been prevented from getting an education, they do not own land
or borrow from the formal sector without their husband and they are socially conditioned to view
themselves as inferior to their male counterparts (Papa, Auwal, & Singhal, 1995). This Muslim
doctrine of ‘purdah’ requires Bangladeshi women to veil themselves in public and they are
prevented from visiting towns away from their homes. In this context, women are kept out of the
paid labor force (Auwal, 1996). Furthermore, if a poor household cannot afford food, the
expectation is that the women should forgo food and starve, resulting in a higher mortality rate
for women than for men (Shehabuddin, 1992).
12http://www.villagebanking.org/site/c.erKPI2PCIoE/b.2604299/k.FFD9/What_is_Microfinance_What_is_Village_Banking.htm and http://www.accion.org/Page.aspx?pid=492 (accessed October 7, 2009)
20
1.1 Use of Income vs. Consumption to Measure Poverty
The issue of whether the specification of the model employed in this study should use
household consumption rather than income as a dependent variable has been noted during
seminar and conference presentations. This issue is a valid one, particularly if we are trying to
determine changes in the poverty rate for the population sample (in this case, the effect of
microfinance on poverty).
The use of income as a measure of poverty is commonly used by governments and
researches both in the United States and other countries. Consumption expenditure is another
commonly used measure of poverty and currently, this is the measure recommended by many
researchers. The argument in favor of using consumption expenditure rather than income is that
income will tend to overstate poverty rates because there are many sources of income that are not
included in the income measure and as such this could impose a downward bias on the measure
of well-being. Other sources of income that are not included in the income measure are access to
credit, tax credits, remittances and many other sources of income that would allow an individual
or family to smooth consumption and thus increase or keep constant the standard of living
(Meyer and Sullivan, 2011). Another argument against using income as a measure of poverty is
that income is less stable than consumption and thus a less reliable measure of poverty.
The research question pursued in this study is not about how microfinance impacts the
poverty rate among the population sample but rather whether microcredit is associated with
increases in household and village income. The impact of microfinance on poverty in this study
is a more indirect question.
21
The assumption here is that if microfinance is associated with increases in income, then this
result is favorable in terms of a positive step towards reducing poverty. Income was used as a
dependent variable in this study in order to estimate the marginal return of microcredit to
household and village income. In other words, the research inquiry is focused on the role of
microcredit on income generation. I wanted to look at the factors that contribute to increases in
household and village income and what proportion of income can be empirically explained by
these factors (i.e. land ownership, education, microcredit, etc.).
The empirical relationship between household consumption expenditure and
microfinance was examined by Khandker (2005). The aim of this study was not to replicate the
aforementioned study but rather, to provide robustness (or lack thereof) for previous findings in
terms of microcredit’s ability to affect household and village economic outcomes.
1.2 Microfinance in Bangladesh
Bangladesh has been a significant player in the microfinance movement and microcredit
programs are some of the most successful initiatives in the world. The number of MFIs, financial
nongovernmental organizations (NGOs) and banks serving the poor has increased over the past
two decades as well as the number of program participants. This is certainly the case in rural
Bangladesh where the number of borrowers totaled 24.3 million in 2005 (see Table 2.1).

22
Table 2.1: Coverage of Microcredit Programs in Bangladesh
(As of December, 2005)
Organization No. of Borrowers (in millions)
Outstanding Loan (in billions Taka)
NGO-MFIs 14.9 54.5 Grameen Bank 4.9 28 Government Program 2 7.7 Sub Total 21.8 90.2 Nationalized Commercial Banks 2.3 32.8 Private Banks 0.2 1.1 Sub Total 2.5 33.9 Grand Total 24.3 124.1
Source: Maps on Micro credit Coverage in Upazilas of Bangladesh, PKSF (2006)
The member-based Microfinance Institutions are a rapidly growing segment of the Rural
Financial Market (RFM) in Bangladesh. Microcredit programs (MCP) in Bangladesh are
sponsored by various formal financial institutions, specifically, nationalized commercial banks
and specialized banks, as well as government organizations and semi-formal financial
institutions (nearly 1000 NGO-MFIs).13 The Grameen Bank is one of the largest providers of
micro loans in Bangladesh today.
2. Empirical Literature The Grameen Bank’s view that credit is a human right and that the poor are indeed
credit worthy, has encouraged group-based lending models in over 70 countries around the world
(Auwal, 1996). Many countries such as Kenya, the Philippines, Ethiopia, and Malaysia have
adopted the Grameen Bank’s peer lending model and have experienced a great deal of success
(Kamaluddin, 1993). Latin American countries have also welcomed microfinance schemes as a
poverty alleviation tool.
13 Palli Karma-Sahayak Foundation, http://www.pksfbd.org/index.php?option=com_mapping&Itemid=284. Accessed March 2007.
23
A combined research project of the Bangladesh Institute of Development Studies
(BIDS) and the World Bank, find significant evidence that the programs help the poor in
smoothing consumption and enable microenterprises to accumulate capital. The findings also
substantiate the claim that microfinance programs promote investment in human capital (i.e.
schooling) and raise awareness about family planning (i.e. use of contraceptives) among poor
families (Khandker 1998) .
In a similar study on the impact of microfinance in Bangladesh, Pitt and Khandker
(1998) estimated the impact of program participation by gender in each of the three group-based
credit programs studied. 14 The study’s aim was to trace the effects of access to credit on
women’s and men’s labor supply, boys’ and girls’ schooling, expenditure, and assets. Using a
quasi-experimental survey design, they found that participation in the credit programs, measured
by cumulative borrowing, is a strong determinant of labor supply, schooling, household
expenditure and asset building. Interestingly, their findings also show that credit provided to
women was more likely to influence the aforementioned behaviors than credit provided to men.
In a more recent study, Khandker (2005) examined the effects of microfinance on
poverty reduction at both the participant and village levels using panel data from Bangladesh.
Here the 1991/92 BIDS-World Bank survey data was expanded with a follow-up survey in
1998/99. The results of this study show that access to microfinance helps reduce poverty at the
household-level, especially for female participants.
14 The three credit programs studied were the Grameen Bank, the Bangladesh Rural Advancement Committee, and the Bangladesh Rural Development Board’s RD-12 program.
24
In terms of the effects on the local economy, the study concluded that microfinance has a
positive impact at the village-level because it raises per capita household consumption for both
participants and nonparticipants in the villages where the programs operate. Other studies also
report positive impacts of microfinance in Bangladesh (e.g. Hashemi, Schuler, and Riley 1996;
Schuler and Hashemi 1994).
The robustness of the results in the studies discussed above still remains an issue
because impact studies are sensitive to the method applied. It is in this light that this paper
undertakes a slightly different approach to estimating the impact of microfinance in Bangladesh.
Using the same dataset and focusing on the same programs as Khandker (2005), instead of using
per capita consumption expenditure as the dependent variable, I use per capita household income
to estimate the marginal impact of micro loans in Bangladesh. There are compelling reasons
why I have chosen to use per capita household income instead of per capita household
consumption expenditure. Since the three microcredit programs require households to save a
portion of their loans, using consumption expenditure as the dependent variable might understate
impact. Another reason is that given that results are sensitive to the method used, using a
different dependent variable than in the previous studies can serve as a robustness check and can
provide further support for previous findings. According to the results obtained in this study, the
method employed here does provide support for earlier evidence and differential impacts are
revealed.
25
3. Theoretical Model and Estimation Strategy
In assessing the effectiveness of any development program or service, one issue that
arises with impact evaluation is the biases that could come from endogenous participation in
such programs. In the impact analysis literature, the typical sources of correlation are referred to
as program placement bias and household selection bias (Pitt, Rosenzweig, & Gibbons, 1993;
Ravallion, 1999). If there is a systematic geographical bias in the way the program targets the
population, a program placement bias is created. This is certainly the case in Bangladesh where
poor households are specifically targeted and happen to live in areas where the incidence of
poverty is more prevalent. A household selection bias would also occur if participation in the
program is correlated with unobserved individual characteristics. In this study, the concern is the
potential bias on the credit estimate created by the correlation between unobserved heterogeneity
and micro loans.
A major challenge facing development programs, particularly microcredit programs, is
that policy conclusions are difficult to reach because the results of impact studies are sensitive to
the empirical method used to estimate program effects. In this context, the employment
alternative methods to estimate program impacts and determine whether microfinance benefits
participants and their communities is necessary.
I begin with an income equation that relates income yt in year t to the household’s asset
endowment and characteristics X, the amount of loan received M, and a random error ε:
!!"# = !!!!"# + !!!!"#! + !!!!" !!!
! + !!!!"#! + !!!!" !!!
! + !!"# (1)

26
Where yijt is household per capita income in village j, which is assumed to depend on household
characteristics and current and past borrowing. X is a vector of household assets and
characteristics. MF and MM respectively are vectors of current and past microcredit received by
female and male borrowers from different programs. Parameters !!, !!, !!, and !! measure the
effects of current and past credit (stock) for loans given to female and male borrowers by each of
the microcredit programs. Loans are separated by gender because since credit markets are
imperfect and labor markets are different for men and women, the impact of microfinance
borrowing is expected to differ by gender.
According to equation (1), the marginal return to income in any given time period is the
combined returns from past credit and current credit. The model assumes that even if current
credit is zero, for instance, the household did not borrow in period T=2, past credit can still have
an effect on income. Specifying the model in this way allows for differential impacts on
borrowing over time. 15
The above equation, if estimated in this standard way, however, would suffer from the
biases discussed earlier since it is likely that exogenous factors will also affect household and
village level income. To the extent these factors cause the error term in (1) to be correlated
across all periods for a particular household or village, cross-section estimates that do not
account for this correlation will not be efficient. If the omitted variables are correlated with
household income, then estimating equation (1) with methods such as cross-section will in fact
yield biased results (see Mundlak, 1978 and Hsiao, 1986). To eliminate the potential biases
discussed above, the income equation is expanded to capture household and village level
unobserved heterogeneity.
15 A similar specification was used by Khandker (2005).
27
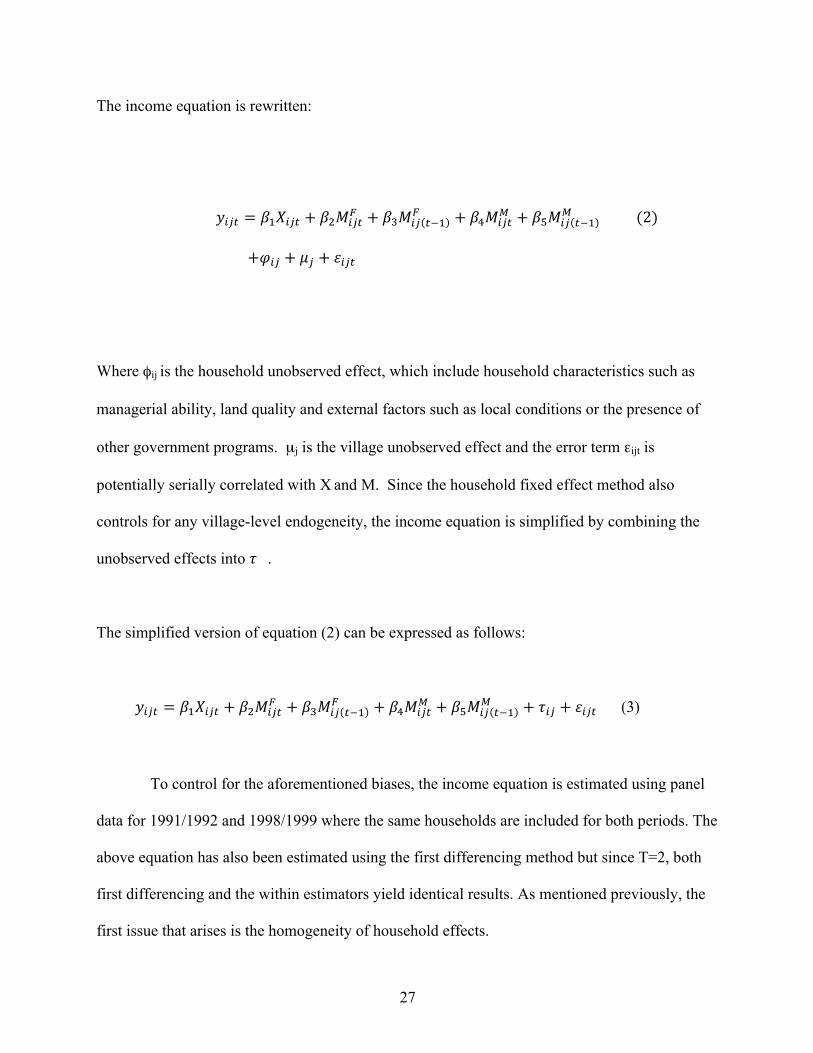
The income equation is rewritten:
!!"# = !!!!"# + !!!!"#! + !!!!" !!!
! + !!!!"#! + !!!!" !!!
! (2)
+!!" + !! + !!"#
Where φij is the household unobserved effect, which include household characteristics such as
managerial ability, land quality and external factors such as local conditions or the presence of
other government programs. µj is the village unobserved effect and the error term εijt is
potentially serially correlated with X and M. Since the household fixed effect method also
controls for any village-level endogeneity, the income equation is simplified by combining the
unobserved effects into ! .
The simplified version of equation (2) can be expressed as follows:
!!"# = !!!!"# + !!!!"#! + !!!!" !!!
! + !!!!"#! + !!!!" !!!
! + !!" + !!"# (3)
To control for the aforementioned biases, the income equation is estimated using panel
data for 1991/1992 and 1998/1999 where the same households are included for both periods. The
above equation has also been estimated using the first differencing method but since T=2, both
first differencing and the within estimators yield identical results. As mentioned previously, the
first issue that arises is the homogeneity of household effects.
28
Here, the null hypothesis of homogeneity is that φij and µj are constant for all i. If this is not the
case, cross-sectional estimators such as pooled OLS are inconsistent and may yield biased
coefficient estimates. To help us determine which model yields the most consistent estimates, we
employ a Hausman test (see Hausman, 1978 and Hsiao, 1986). According to the results of this
test, the null hypothesis of homogeneity, which says that φij and µj are constant for all i, must be
rejected. Therefore, this analysis relies on the fixed-effect (FE) estimator to analyze the marginal
impact of borrowing on household level income.
4. The Data
This study relies on the 1991/92 and the1998/99 surveys conducted by the Bangladesh
Institute of Development Studies (BIDS) and the World Bank. The surveys covered 1,798
households drawn from 87 villages in 29 thanas.17 The 1991/92 survey was conducted during
Bangladesh’s three cropping seasons: round 1 which took place during Aman rice (November-
February), round 2 during Boro rice (March-June), and lastly, round 3 during Aus rice (July-
October). The 1998/99 survey was collected only once during this period (Pitt and Khandker,
1998 and Khandker, 2005).
The purpose of this survey was to collect the data for analyzing three major credit
programs. Those programs were the Grameen Bank, the Bangladesh Rural Advancement
Committee (BRAC), and the Rural Development-12 program of the Bangladesh Rural
Development Board (RD-12).
17 A thana is an administrative unit that is smaller than a district and consists of a number of villages. In Bangladesh, you have “Divisions” and under those divisions you have “Zilas”. Thanas are under the umbrella of zilas.
29
Villages where these programs operated were surveyed as well as non-program villages where
no micro lending or any similar lending activities took place. Target households and non-target
households were surveyed. Target households are those who meet the program eligibility
criteria, which is to own less than or equal to half of an acre of land. Non-target households are
those who do not meet the landholding criteria. Non-target households were surveyed in both
program villages and non-program villages (ibid).
Out of the 29 thanas covered, 24 were program thanas (8 from each of the three
programs) and 5 were non-program thanas. The thanas included in the survey were selected
from 391 rural thanas out of 460 thanas. Three villages in each program thana were randomly
selected from a group of program villages where a program had been in operation for at least
three years. Three villages in each of the non-program thanas were also randomly selected.
These villages were drawn from the village census of the Government of Bangladesh. In terms
of the village survey design, villages with fewer than 51 number of households and villages with
more than 600 households, were excluded (ibid).
The households surveyed in 1991/92 were revisited in 1998/99. This time, however, the
households were interviewed in one round, rather than in three. Among the 1,769 households
surveyed in 1991/92, 113 could not be interviewed in 1998/99 and only 1,656 households were
available for the re-survey. Included in the re-survey were new households from previous
villages and newly included villages. Also three non-target households were randomly selected
from each of the previous 87 villages. Also included, are three new thanas that were randomly
selected from the southern and southeastern regions that were seriously affected by cyclone in
1991/92. These thanas were excluded in the first round survey.
30
From the new thanas, three villages were also drawn randomly, adding an additional 9 villages.
In the new villages, 20 households were drawn from target and non-target households. In total,
2,599 households were surveyed in 1998/99. 18
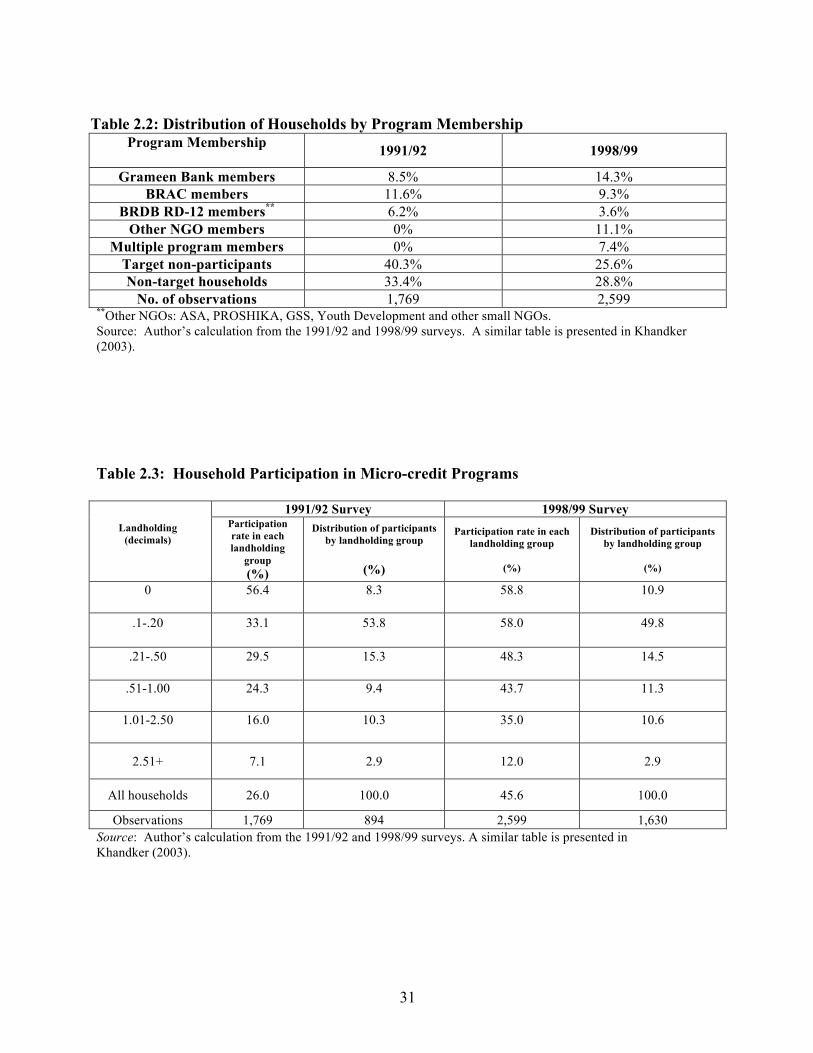
The distribution of households by program membership is presented in Table 2. Out of
all the households surveyed in 1991/92, 11.6 percent were BRAC members, 8.5 percent were
Grameen Bank members and 6.2 percent were RD-12 members. In the 1998/99 survey, the
number of Grameen Bank borrowers increased to 14.3 percent; the number of BRAC borrowers
actually decreased to 9.3 percent and RD-12 project borrowers also decreased to 3.6 percent. An
interesting trend we see in the 1998/99 survey is the increasing presence of other NGOs, with
11.1 percent of participating members.
As we can note from Table 2.2, participation in rural Bangladesh has increased from 26.3
percent in 1991/92 to 45.7 percent in 1998/99. The number of eligible non-participants
decreased from 40.3 percent to 25.6 percent and non-target households also decreased from 33.4
percent to 28.8 percent (ibid). Participation in microfinance programs is more prevalent among
individuals who have very little land or no land at all. In the 1991/92 survey, the participation
rate among the landless is 56 percent and this rate increased to 59 percent in the 1998/99 survey
(see Table 2.3).
18 Details of these surveys were provided by Pitt and Khandker, 1998, Khandker, 2005 and by the published documents for this data (see World Bank).
31
Table 2.2: Distribution of Households by Program Membership
Program Membership 1991/92 1998/99
Grameen Bank members 8.5% 14.3% BRAC members 11.6% 9.3%
BRDB RD-12 members** 6.2% 3.6% Other NGO members 0% 11.1%
Multiple program members 0% 7.4% Target non-participants 40.3% 25.6% Non-target households 33.4% 28.8%
No. of observations 1,769 2,599 **Other NGOs: ASA, PROSHIKA, GSS, Youth Development and other small NGOs. Source: Author’s calculation from the 1991/92 and 1998/99 surveys. A similar table is presented in Khandker (2003).
Table 2.3: Household Participation in Micro-credit Programs
Landholding
(decimals)
1991/92 Survey 1998/99 Survey Participation rate in each landholding
group (%)
Distribution of participants by landholding group
(%)
Participation rate in each landholding group
(%)
Distribution of participants by landholding group
(%)
0
56.4
8.3
58.8
10.9
.1-.20
33.1
53.8
58.0
49.8
.21-.50
29.5
15.3
48.3
14.5
.51-1.00
24.3
9.4
43.7
11.3
1.01-2.50
16.0
10.3
35.0
10.6
2.51+ 7.1 2.9 12.0 2.9
All households 26.0 100.0 45.6 100.0
Observations 1,769 894 2,599 1,630 Source: Author’s calculation from the 1991/92 and 1998/99 surveys. A similar table is presented in Khandker (2003).
32
To better control for unobserved heterogeneity in the sample, this paper relies on panel
data to estimate the marginal impact of microcredit on household income. Once the sample is
restricted to households that were interviewed in both periods to form a panel, we are left with
1,656 households for each survey. In terms of the households that split into multiple households,
they were combined with the original households to form a single household. In terms of the
biases or problems that this may cause, previous studies have conducted statistical tests to see if
merging the data was appropriate and the tests indicate that combining the data does not
significantly alter the results obtained by keeping the households separate (see Khandker and Pitt
2002). Table 2.4 in Appendix I presents summary statistics for relevant variables such as per
capita income, and the various microcredit variables. As can be observed in this table, the mean
for the 1991/92 variables for t-1 is zero. By assumption, there was no borrowing before 1991/92
because data is only available starting in 1991/92. In this case Mij(t-1) in the 1992 survey =0. The
same assumption was made in Khandker (2005).
5. Results
The results from the household FE estimation of equation (3), are presented in Table 2.5
in Appendix I. They show that as expected, the coefficients for labor assets (i.e. number adults in
household), land assets (i.e. avg. household landholding) and infrastructure (i.e. bank present in
village and electricity) are positive and statistically significant. As one would expect, the
obvious implication here in terms of policy is that the state of development of a village in terms
of infrastructure plays a significant role in income generation. The accumulation of assets by
household is also important in terms of generating income and lifting households out of poverty.
33
In terms of microcredit borrowing, the results suggest that the benefits of microcredit
extend to both male and female borrowers. In previous studies, however, the benefits of
microcredit borrowing accrued disproportionately to women rather than men (see Pitt and
Khandker (1998) and Khandker (2005). Based on the fixed-effect estimation, a 10 percent
increase in the current stock of female borrowing from the Grameen Bank, increases per capita
income by .7 percent. The same increase in male borrowing from the Grameen Bank, increases
per capita income by .9 percent (slightly higher than for female borrowers).
Most of the coefficients for the credit variables for other NGOs are significant positive
and of substantial magnitued. For instance, a 10 percent increase in past credit given to women
by other NGOs, increase household income by 1.34 percent. Similarly, a 10 percent increase in
past credit given to men by other NGOs, increase household income by 1.75 percent. This result
suggests that there are other sources of microfinance that are effective in targeting and disbursing
loans to the poor.
The coefficients for the credit variables for other sources of microfinance are not what
we would expect and warrant some analysis here. As an exercise, micro loans obtained from
other sources such as money-lenders (i.e. employers, neighbors, shopkeepers, etc.) were included
in this study. An interesting finding is that the credit coefficients for male and female borrowing
from this source are statistically significant in a puzzling way. The findings show that a 10
percent increase in the current stock of credit given to men by other sources increase household
income by .6 percent. Credit given to women by other sources in both periods has a significant
negative impact on income of .7 percent and 1.15 percent respectively.
34
The estimates of the credit variables for other sources of microcredit borrowing would
be puzzling under normal credit market conditions. In such market, one would expect that an
increase in borrowing would augment the income of borrowers. In Bangladesh, however, credit
markets are not perfect and most poor households are denied access to credit. Women, in
particular, are excluded from the credit market, especially credit outside of formal microcredit
programs. In this context, according to previous studies, it is the case that when women borrow
(particularly in rural areas) in the informal sector (relatives, informal moneylenders, etc.), they
do so under distress and are often exploited by their moneylenders (Yunus, 1994a, pp, 3-4). In
this case, it would make sense that borrowing from other sources outside of NGOs and
microfinance programs would impact household income positively when the borrower is a male
and adversely when the borrower is a female. The fixed-effects estimates are used to calculate
the marginal returns to credit for male and female borrowers (Table 2.6). 20 At the mean, an
additional Tk 100 of cumulative borrowing from Grameen by women during 1998/99 increased
household yearly income by almost Tk 6. The most significant impact observed is the effect of
women borrowing from other NGOs. An additional Tk 100 in women’s stock of credit from
other NGOs during 1991/92 increases the household’s total income by Tk 200.
In terms of the marginal return to microfinance for women borrowing from other
sources, as previously discussed, credit from these sources has a reductive effect on household
yearly income of Tk 36 for 1991/92 and Tk 50 for 1998/99. The marginal returns to borrowing
for male borrowers who obtain credit from other NGOs is also substantial (see Table 2.6).
20 Note: Because the estimation equations are in log-log (elasticity) form, marginal returns are calculated using the formula:
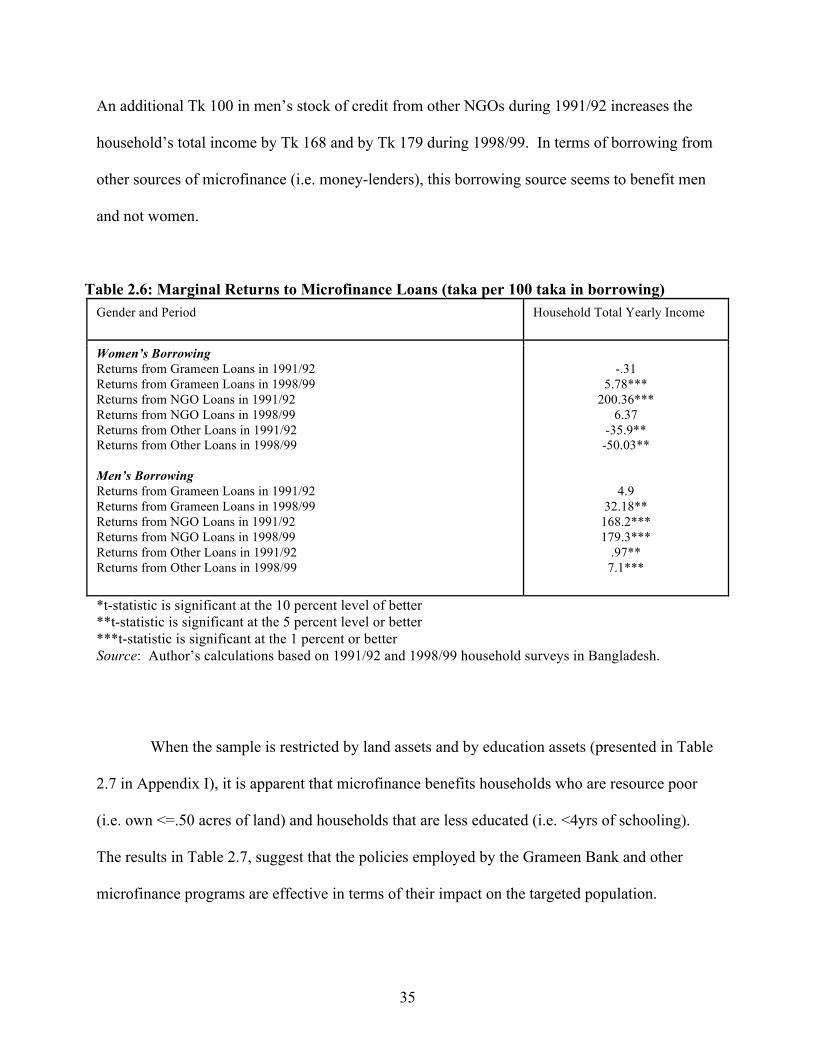
35
An additional Tk 100 in men’s stock of credit from other NGOs during 1991/92 increases the
household’s total income by Tk 168 and by Tk 179 during 1998/99. In terms of borrowing from
other sources of microfinance (i.e. money-lenders), this borrowing source seems to benefit men
and not women.
Table 2.6: Marginal Returns to Microfinance Loans (taka per 100 taka in borrowing) Gender and Period Household Total Yearly Income
Women’s Borrowing Returns from Grameen Loans in 1991/92 Returns from Grameen Loans in 1998/99 Returns from NGO Loans in 1991/92 Returns from NGO Loans in 1998/99 Returns from Other Loans in 1991/92 Returns from Other Loans in 1998/99 Men’s Borrowing Returns from Grameen Loans in 1991/92 Returns from Grameen Loans in 1998/99 Returns from NGO Loans in 1991/92 Returns from NGO Loans in 1998/99 Returns from Other Loans in 1991/92 Returns from Other Loans in 1998/99
-.31
5.78*** 200.36***
6.37 -35.9**
-50.03**
4.9
32.18** 168.2*** 179.3***
.97** 7.1***
*t-statistic is significant at the 10 percent level of better **t-statistic is significant at the 5 percent level or better ***t-statistic is significant at the 1 percent or better Source: Author’s calculations based on 1991/92 and 1998/99 household surveys in Bangladesh.
When the sample is restricted by land assets and by education assets (presented in Table
2.7 in Appendix I), it is apparent that microfinance benefits households who are resource poor
(i.e. own <=.50 acres of land) and households that are less educated (i.e. <4yrs of schooling).
The results in Table 2.7, suggest that the policies employed by the Grameen Bank and other
microfinance programs are effective in terms of their impact on the targeted population.
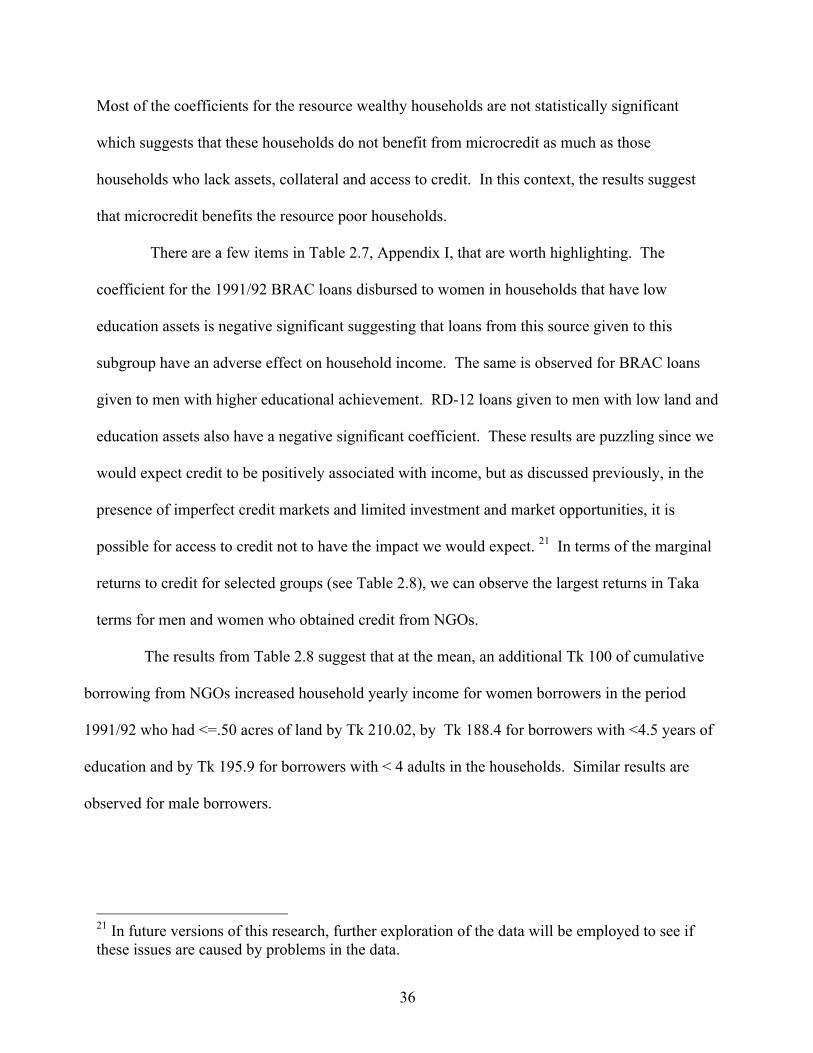
36
Most of the coefficients for the resource wealthy households are not statistically significant
which suggests that these households do not benefit from microcredit as much as those
households who lack assets, collateral and access to credit. In this context, the results suggest
that microcredit benefits the resource poor households.
There are a few items in Table 2.7, Appendix I, that are worth highlighting. The
coefficient for the 1991/92 BRAC loans disbursed to women in households that have low
education assets is negative significant suggesting that loans from this source given to this
subgroup have an adverse effect on household income. The same is observed for BRAC loans
given to men with higher educational achievement. RD-12 loans given to men with low land and
education assets also have a negative significant coefficient. These results are puzzling since we
would expect credit to be positively associated with income, but as discussed previously, in the
presence of imperfect credit markets and limited investment and market opportunities, it is
possible for access to credit not to have the impact we would expect. 21 In terms of the marginal
returns to credit for selected groups (see Table 2.8), we can observe the largest returns in Taka
terms for men and women who obtained credit from NGOs.
The results from Table 2.8 suggest that at the mean, an additional Tk 100 of cumulative
borrowing from NGOs increased household yearly income for women borrowers in the period
1991/92 who had <=.50 acres of land by Tk 210.02, by Tk 188.4 for borrowers with <4.5 years of
education and by Tk 195.9 for borrowers with < 4 adults in the households. Similar results are
observed for male borrowers.
21 In future versions of this research, further exploration of the data will be employed to see if these issues are caused by problems in the data.
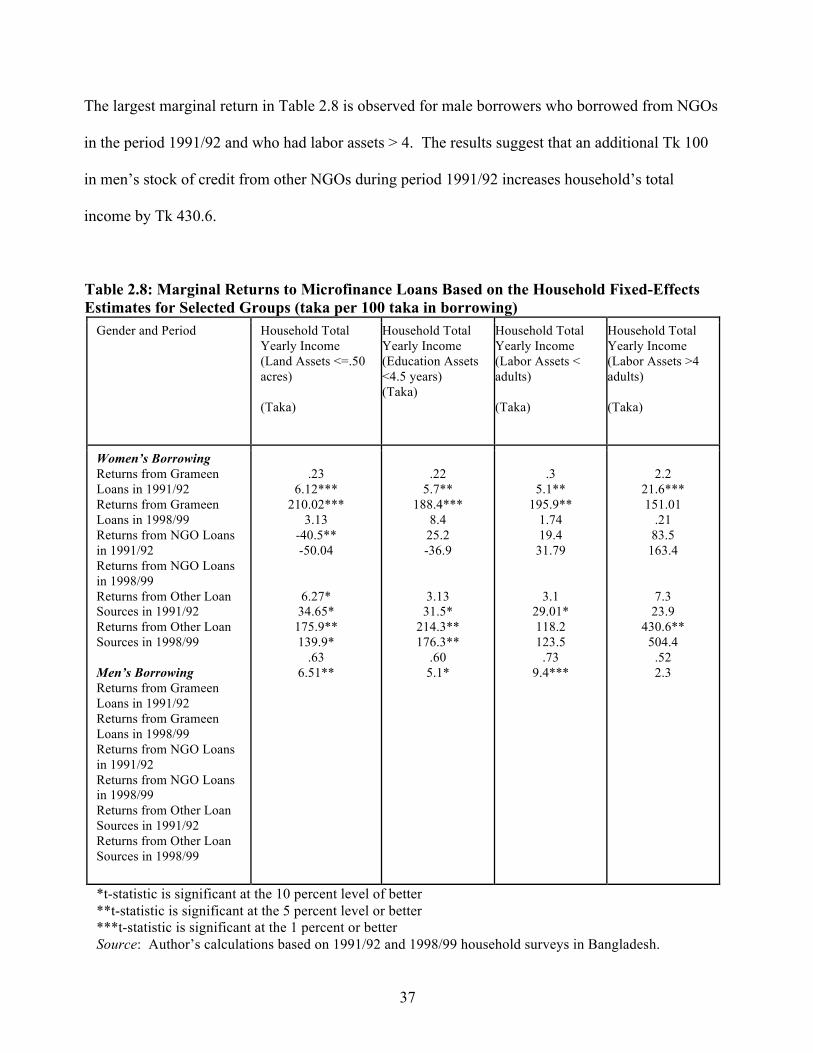
37
The largest marginal return in Table 2.8 is observed for male borrowers who borrowed from NGOs
in the period 1991/92 and who had labor assets > 4. The results suggest that an additional Tk 100
in men’s stock of credit from other NGOs during period 1991/92 increases household’s total
income by Tk 430.6.
Table 2.8: Marginal Returns to Microfinance Loans Based on the Household Fixed-Effects Estimates for Selected Groups (taka per 100 taka in borrowing)
Gender and Period Household Total Yearly Income (Land Assets <=.50 acres) (Taka)
Household Total Yearly Income (Education Assets <4.5 years) (Taka)
Household Total Yearly Income (Labor Assets < adults) (Taka)
Household Total Yearly Income (Labor Assets >4 adults) (Taka)
Women’s Borrowing Returns from Grameen Loans in 1991/92 Returns from Grameen Loans in 1998/99 Returns from NGO Loans in 1991/92 Returns from NGO Loans in 1998/99 Returns from Other Loan Sources in 1991/92 Returns from Other Loan Sources in 1998/99 Men’s Borrowing Returns from Grameen Loans in 1991/92 Returns from Grameen Loans in 1998/99 Returns from NGO Loans in 1991/92 Returns from NGO Loans in 1998/99 Returns from Other Loan Sources in 1991/92 Returns from Other Loan Sources in 1998/99
.23
6.12*** 210.02***
3.13 -40.5** -50.04
6.27* 34.65*
175.9** 139.9*
.63 6.51**
.22
5.7** 188.4***
8.4 25.2 -36.9
3.13 31.5*
214.3** 176.3**
.60 5.1*
.3
5.1** 195.9**
1.74 19.4
31.79
3.1 29.01* 118.2 123.5
.73 9.4***
2.2
21.6*** 151.01
.21 83.5
163.4
7.3
23.9 430.6**
504.4 .52 2.3
*t-statistic is significant at the 10 percent level of better **t-statistic is significant at the 5 percent level or better ***t-statistic is significant at the 1 percent or better Source: Author’s calculations based on 1991/92 and 1998/99 household surveys in Bangladesh.
38
Looking at the marginal returns presented in Tables 2.6 and 2.8 allows us to see a more
tangible measure of the impact of microcredit that is suggested by the estimates. Some of the
marginal returns are small and others are quite significant. However, it is evident by the results
obtained here that microfinance does have the potential to make a significant contribution to
income generation, poverty reduction and to overall economic prosperity for poor borrowers.
6. Conclusion
The findings in this study have important policy implications for microcredit
development programs. One implication is that if microcredit plays an important role in
increasing household income, microcredit programs would be more effective if efforts were
aimed at maximizing the social and income returns from micro credit since the ultimate goal is to
increase human capital and raise the income of targeted households. The findings in this study
suggest that targeting the poor is an effective rural development policy in terms of poverty
reduction and thus future goals of development programs should include expanding the outreach
of microcredit programs. The results presented here also suggest that there are differential
impacts based on gender, socioeconomic factors and microfinance programs. Incorporating
these differential impacts in program evaluation methods could improve the effectiveness of
microfinance schemes so as to allow policymakers to implement policies that would ultimately
result in significant poverty reduction.
39
Another important policy implication stemming from this study is that given the
geographical, political and cultural settings of Bangladesh, something needs to be done to
complement credit with investment opportunities in working capital, technology and equal
opportunity for women in formal sectors. The findings in this study suggest that given the small
magnitude of impact, provision of credit alone will not create significant economic growth at the
household and village level. Microfinance programs are increasing their efforts to compliment
credit with other services such as financial and entrepreneurship education but these efforts will
be ineffective if there are barriers that prevent borrowers, specifically women, from maximizing
the returns to their loans. In this context, microcredit programs should also engage in the kind of
advocacy that would help create an entrepreneurial environment that is inclusive and nurturing
for all borrowers.
40
CHAPTER III
Complementarity Between Microcredit and Capability-Enhancing Services: The Case of Microfinance Institutions in Bangladesh
“… social opportunities of education and health care, which may require public action, complement individual opportunities of economic and political participation and also help to foster our own initiatives in overcoming our respective deprivations. If the point of departure of the approach lies in the identification of freedom as the main objective of development, the reach of the policy analysis lies in establishing the empirical linkages that make the viewpoint of freedom coherent and cogent as the guiding perspective of the process of the development.”
___Amartya Sen (1999, p. 13)
1. Introduction
Microfinance has proven to be an effective development strategy for poverty reduction,
but like many other development tools, it has faced a number of challenges. One of the
challenges has been the inability of microfinance institutions (MFIs) and non-governmental
organizations (NGOs) to reach the people that need access to credit the most. Although outreach
has increased over the years, microfinance has insufficiently reached the poorest strata of society
(Morduch and Haley 2002). Studies have shown that unless there is a specific and appropriate
design of a targeting tool, it is likely that the microfinance program will fail to reach the poorest
of people (ibid). In this context, it is likely that the poor would either be missed or that they will
exclude themselves because they do not believe they could benefit from the program (Navajas et
al 2000).

41
Another major challenge facing microfinance and the issue of focus in this chapter is the
fact that the poor, particularly in Bangladesh, form the vast majority of the people without access
to health care, education and a favorable economic environment. In particular, access to basic
human assets (i.e. education, health care and nutrition) is important because when these assets
are insufficient it can slow income growth and limit the effectiveness of microfinance in lifting
the poor out of poverty. For this reason, it has been argued that the poor, particularly those facing
great social and economic deprivation, may not be good candidates for micro loans. According
to Morduch and Haley (2002), the general consensus about microfinance is that since
entrepreneurial skills and ability are required to run a successful microenterprise, not all
borrowers are equally able to take on debt. Furthermore, it is argued that the sick, the destitute,
etc., many whom are among microfinance borrowers, should be given direct financial assistance
rather than micro loans (ibid). While the aforementioned arguments are valid, the position taken
in this dissertation and the dominant view and evidence in the literature is that the poor can
greatly benefit from receiving loans.
As mentioned earlier in previous chapters and as evidenced in chapter 2, there is strong
evidence that microcredit is positively correlated with increases in income, education,
entrepreneurship, asset building and consumption expenditure (see Hashemi, Schuler, and Riley
1996; Schuler and Hashemi 1994; Khandker 1998; and Khandker 2005). Although studies have
suggested that microfinance has had a positive impact on poverty reduction, critics of
microcredit, as noted previously, argue that micro loans are just “micro-Band-Aids” because they
have failed to generate substantial economic development in the countries where they operate.22
22 Alexander Cockburn, The Myth of Micro Loans”, The Nation, October 19, 2006.
42
On a macroeconomic level, it is hard to dispute this claim and one of the reasons for this, as it is
argued in this chapter, is that in the absence of an opportunity set that would complement
microfinance, namely the existence of basic human assets, investment opportunities, equal
opportunity, etc., the impact of microfinance is likely to remain small in scale and poverty
reduction would be minimal.
The explicit expectation of many microfinance programs is that access to credit will
significantly reduce poverty, empower women and improve the living conditions of poor
borrowers. The underlying issue with this expectation is that the roles that social conditions
and/or what Sen (1999) called “substantive” and “instrumental” freedoms play in development
are ignored. According to Sen, development requires the removal of the major barriers that
cause “unfreedoms” such as tyranny, poor economic opportunities, systematic social deprivation,
neglect of public facilities, as well as oppression (Sen 1999, p. 3). According to this view, if
microcredit is associated with improvements in incomes and expenditures, but individual
freedoms and abilities are not enhanced, substantial development has not been realized. In this
context, development goes beyond the usual macroeconomic indicators of development.
In light of Sen’s capability framework, a different approach to measuring the
effectiveness of microcredit is undertaken in this study. In previous studies, for instance, my
own study in chapter 2, household level panel data from Bangladesh was used to estimate the
economic impact of microfinance by tracing the marginal effect of microcredit on household-
level income. The findings suggested that the existence of banks and electricity in the village is
positively correlated with increases in household income.
43
A positive correlation was also found between income and the ownership of land assets. In this
context, the results confirm that the existence of adequate public facilities, one of Sen’s defined
capabilities, contributes to economic development in terms of the positive influence
infrastructure seems to have on income generation.
A main result in the study conducted in chapter 2 is that micro loans, especially those
disbursed by the Grameen bank, have a positive and statistically significant effect on household
income and this effect is observed for all borrowers from the poorest households. The findings
also suggest differential impacts by gender, education assets and labor assets. The extent of the
impact measured in the aforementioned study, however, is limited in scope since it tells us little
about whether the increase in household income improves the lives of borrowers in terms of their
living conditions, their freedoms and what they are able to do as people.
Given data limitations, the objective in this study is not to measure how freedoms or
capabilities are enhanced by microcredit but rather how the provision of capability-enhancing
services and microcredit enhance economic development as measured by income. Household
panel data from Bangladesh is used to measure the empirical relationship between the capability-
enhancing services provided by three microfinance programs in Bangladesh and per capita
income. The three programs of interest are the Grameen Bank, the Bangladesh Rural
Advancement Committee (BRAC) and Rural Development-12 (RD-12) program.
The organization of the study is as follows: section 2 describes Sen’s capability approach
to development, section 3 reviews some of the capability constraints in Bangladesh and section 4
reviews the relationship between capabilities and poverty reduction in Bangladesh.
44
Section 5 outlines the theoretical background, section 6 outlines the first empirical model used,
section 7 presents the second empirical model used, section 8 describes the data, and section 9
discusses the results from the first model. Section 10 outlines the results from the second model
and section 11 concludes the study.
2. Sen’s Capability Approach
Amartya Sen is an Indian economist who received the 1998 Nobel Prize in Economic
Sciences for his work on welfare economics and social choice theory, and for his focus on
finding solutions to the problems associated with poverty. Sen is known for his work on the
causes of famine and for his instrumental role in the development of solutions for mitigating the
effects of shortages of food. Sen’s most influential book, Development as Freedom, was
published in 1999 and since then, it has been cited by many scholars, particularly, in the field of
development economics. Sen’s unique view about what should be the main goal of development
is centered on a bottom-up approach to economic and human development. His “capability”
approach is based on the idea that people should be able to live the life they choose and value
and should have the “capability” and/or “freedom” to do so in the absence of socially imposed
deprivations. In this context, for instance, an example of a capability would be freedom from
hunger. Sen would argue that access to food is a basic human right and would enable people
(make them capable of) to become nourished and productive members of society.

45
According to Sen, the expansion of freedom should be both the primary end and the
principal means of development. Furthermore, he believes that development should aim to
remove the kinds of “unfreedoms” that prevent people from having choices and opportunities to
exercise their reasoned agency. In this context, Sen contends that true development is that which
removes substantial unfreedoms (Sen, 1999, p. xii).
Sen argues that social opportunities of education and health care complement individual
opportunities of economic and political involvement as well as the chances of overcoming
deprivation. In this sense, the process of development should aim at providing these social
opportunities as a point of departure (Sen, 1999, p. xii). Sen contends that freedom is central to
the process of development for the following reasons (Sen, 1999, p. 4):
(1) The evaluative reason: assessment of progress has to be done primarily in terms of
whether the freedoms that people have are enhanced;
(2) The effectiveness reason: achievement of development is thoroughly dependent on the
free agency of the people.
The above arguments are especially relevant to the use of microfinance as a tool for
development. As previously argued in chapter 2, the provision of social and economic
opportunities to borrowers would complement access to credit by allowing poor borrowers to
fully utilize the funds in a manner that would be efficient and beneficial to income growth and
the emergence of small enterprises.

46
In this context, microfinance providers should look at whether or not the freedoms that would
complement microfinance are in place in order to fully assess the potential benefits microfinance
can bring about. The lack of freedoms on the other hand, should be viewed on the part of the
MFI or NGO as an opportunity to play a larger role in the process of development, namely to act
as an advocate for the provision of such freedoms.
2.1 Institutions and Instrumental Freedoms
Sen identifies two broad categories of freedoms. The first group comprises the
substantive freedoms. Included in this category are elementary capabilities such as being able to
avoid deprivations like starvation, undernourishment, escapable morbidity, premature mortality
and the freedoms that are related to being literate and numerate and having freedom of the press
and speech (Sen, 1999, 36). The other freedoms are placed in the instrumental freedoms
category. There are five distinct types of freedoms in the instrumental freedom category that are
comprised of rights and opportunities that help advance the general capability of an individual.
These freedoms, Sen argues, are not only the primary ends of development but they are in
essence its principal means. In this context, the instrumental role of freedom is related to the
way different types of rights, opportunities and entitlements contribute to the expansion of
overall human freedom and thereby promote development (Sen, 1999, p. 10, 37) Table 3.1 lists
and describes these freedoms.
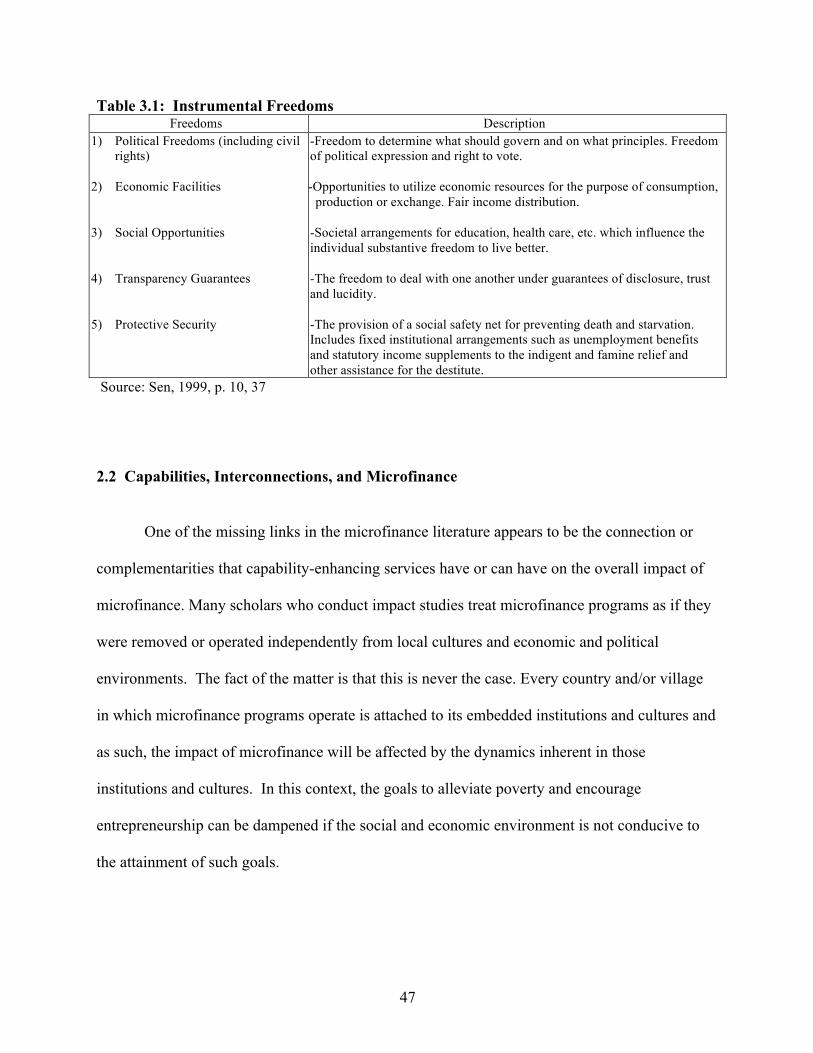
47
Table 3.1: Instrumental Freedoms Freedoms Description
1) Political Freedoms (including civil rights)
2) Economic Facilities
3) Social Opportunities
4) Transparency Guarantees
5) Protective Security
-Freedom to determine what should govern and on what principles. Freedom of political expression and right to vote.
-Opportunities to utilize economic resources for the purpose of consumption, production or exchange. Fair income distribution.
-Societal arrangements for education, health care, etc. which influence the individual substantive freedom to live better. -The freedom to deal with one another under guarantees of disclosure, trust and lucidity. -The provision of a social safety net for preventing death and starvation. Includes fixed institutional arrangements such as unemployment benefits and statutory income supplements to the indigent and famine relief and other assistance for the destitute.
Source: Sen, 1999, p. 10, 37
2.2 Capabilities, Interconnections, and Microfinance
One of the missing links in the microfinance literature appears to be the connection or
complementarities that capability-enhancing services have or can have on the overall impact of
microfinance. Many scholars who conduct impact studies treat microfinance programs as if they
were removed or operated independently from local cultures and economic and political
environments. The fact of the matter is that this is never the case. Every country and/or village
in which microfinance programs operate is attached to its embedded institutions and cultures and
as such, the impact of microfinance will be affected by the dynamics inherent in those
institutions and cultures. In this context, the goals to alleviate poverty and encourage
entrepreneurship can be dampened if the social and economic environment is not conducive to
the attainment of such goals.
48
A main argument pursued in this dissertation is that the provision of the substantive and
instrumental freedoms brought to light by Sen, are relevant to the success of microfinance
programs in alleviating poverty. To put this in context, imagine giving a loan to someone who is
critically ill and without access to health care. It would be very difficult for this borrower to both
repay the loan and turn the funds into a productive activity. In the aforementioned scenario,
access to health care would be interconnected to microcredit in that healthy borrowers can
engage in productive activities and thereby repay the loan and maximize the return (social and
economic) of the funds borrowed.
3. Capability Constraints in Bangladesh In Bangladesh, as well as in other countries, microfinance programs are typically
targeted towards the poor and women who are self-employed in the informal sector.
Microfinance involves small-scale credit and savings transactions that allow small businesses to
obtain start-up capital with little or no collateral in place. Microcredit programs also provide
education and working skills to women and the poor in order to improve production capabilities
and decision-making.
A number of microfinance institutions (MFIs) and non-governmental organizations
(NGOs) lend predominately to women. For instance, about 97 percent of Grameen Bank’s seven
million borrowers are women.23 Other major microfinance programs such as FINCA and
ACCION also lend predominately to women.24
23 hhtp://www.grameen-info.org/bank/index.html, as of May 2007. 24http://www.villagebanking.org/site/c.erKPI2PCIoE/b.2604299/k.FFD9/What_is_Microfinance_What_is_Village_Banking.htm and http://www.accion.org/Page.aspx?pid=492 (accessed October 7, 2009)
49
One of the reasons MFIs and NGOs have shifted micro-lending toward women is that women are
believed to be poorer than men on average (see Burjorjee et al., 2002). Women also tend to own
little assets compared to their male counterparts and this makes them unable to provide the
collateral required by most formal lenders. In this context, women are believed to be more
credit-constrained (Khandker, 1998).
In the case of rural Bangladesh, microcredit is targeted toward poor rural women because
women tend to be isolated and deprived and even though they greatly contribute to rural
economic activity, their work is marginalized and ignored (see Schuler & Hashemi, 1995 and
Abdullah & Zeidenstein, 1982). Additionally, given Bangladesh’s system of ‘purdah,’ “a system
for the seclusion of women” (Khan, 1988, p. 33), many rural women are not encouraged to be
educated, they do not own land or borrow from the formal sector without their husband and they
are socially conditioned to view themselves as inferior to their male counterparts (Papa, Auwal,
& Singhal, 1995). This strict Muslim doctrine of ‘purdah’ requires Bangladeshi women to veil
themselves in public and they are prevented from visiting towns away from their homes. In this
context, women are kept out of the paid labor force (Auwal, 1996). Furthermore, if a poor
household is unable to afford food, the expectation is that the women should forgo food and
starve, resulting in a higher mortality rate for women than for men (Shehabuddin, 1992).
Critics of microcredit question the appropriateness of micro loans as a tool for alleviating
poverty because, as noted earlier, not every borrower is a good candidate for microcredit in terms
of the requirement that the loans be used for productive activities. In this sense, if local
economic conditions, opportunities and “freedoms” are scarce, the extent of poverty reduction
will depend on local circumstances.
50
It is argued that poverty is likely to be caused by low economic growth, high population growth,
inequality in the distribution of resources, unemployment and low productivity among the poor.
Given the aforementioned poverty-inducing factors, poverty reduction would require investing in
human and physical capital in order to increase worker productivity (Khadker, 1998). In the
case of many developing countries, in this particular case, Bangladesh, poverty is caused to an
extent by the lack of investment in both, human and physical assets.
Despite the documented impact microfinance has had on poverty alleviation and the
considerable progress Bangladesh made as a country in reducing poverty during the 1980s and
the 1990s (Sen, 2003), the country is still among the poorest countries and 40% of the population
still lives below the national poverty line (World Bank).25 To give an example of the type of
economic and social environment in which MFIs and NGOs currently operate in Bangladesh, we
can examine the most recent Human Development Report for Bangladesh. The Human
Development Index (HDI) measures the average achievements in a country in three basic
measures of human development. Those measures are a long and healthy life, access to
knowledge and a reasonable standard of living. Similarly to Amartya Sen, The United Nations
Development Programme (UNDP) defines human development as a process of expanding
people’s opportunity set, improving their well-being and the existence of social and political
freedoms. This concept of human development makes a distinction between two aspects of
human development: (1) the development of human capabilities and (2) the freedom to enjoy
these capabilities for work or for leisure (see http://hdr.undp.org for more details). Table 3.2
below outlines the key distinctions between traditional approaches of development as compared
to the human development approach employed by the UNDP.
25 http://data.worldbank.org/country/bangladesh. Accessed July 2011.
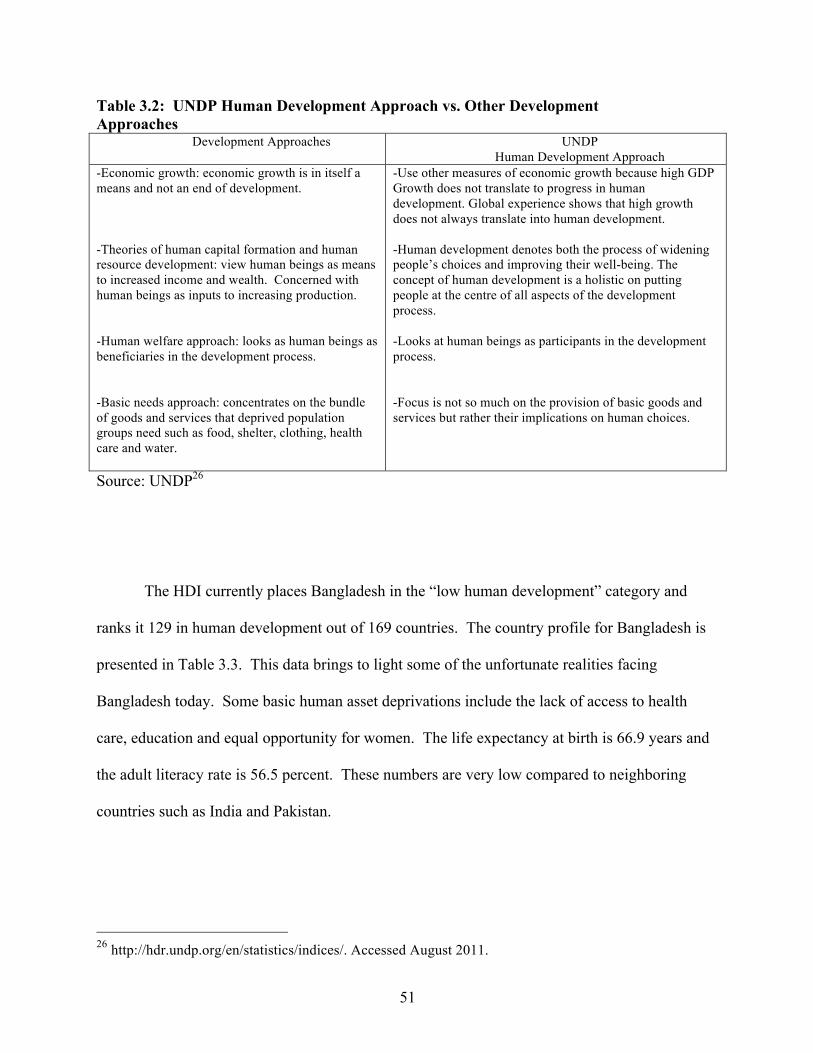
51
Table 3.2: UNDP Human Development Approach vs. Other Development Approaches
Development Approaches UNDP Human Development Approach
-Economic growth: economic growth is in itself a means and not an end of development. -Theories of human capital formation and human resource development: view human beings as means to increased income and wealth. Concerned with human beings as inputs to increasing production. -Human welfare approach: looks as human beings as beneficiaries in the development process. -Basic needs approach: concentrates on the bundle of goods and services that deprived population groups need such as food, shelter, clothing, health care and water.
-Use other measures of economic growth because high GDP Growth does not translate to progress in human development. Global experience shows that high growth does not always translate into human development. -Human development denotes both the process of widening people’s choices and improving their well-being. The concept of human development is a holistic on putting people at the centre of all aspects of the development process. -Looks at human beings as participants in the development process. -Focus is not so much on the provision of basic goods and services but rather their implications on human choices.
Source: UNDP26
The HDI currently places Bangladesh in the “low human development” category and
ranks it 129 in human development out of 169 countries. The country profile for Bangladesh is
presented in Table 3.3. This data brings to light some of the unfortunate realities facing
Bangladesh today. Some basic human asset deprivations include the lack of access to health
care, education and equal opportunity for women. The life expectancy at birth is 66.9 years and
the adult literacy rate is 56.5 percent. These numbers are very low compared to neighboring
countries such as India and Pakistan.
26 http://hdr.undp.org/en/statistics/indices/. Accessed August 2011.
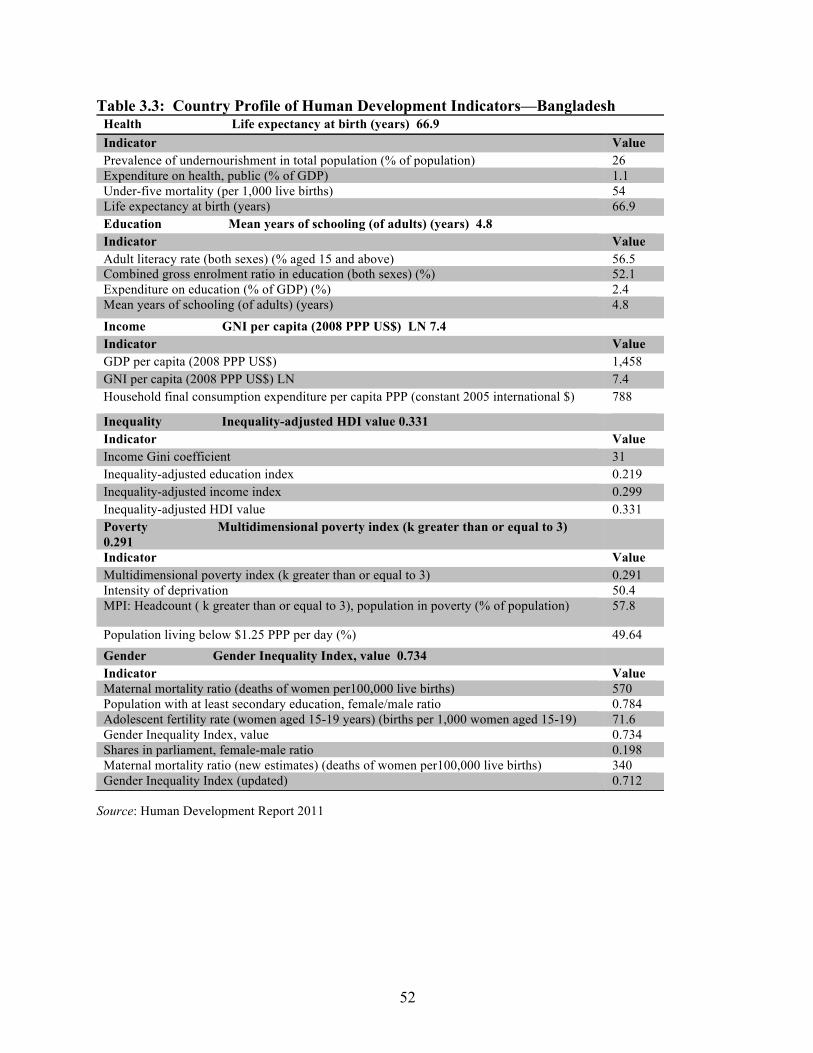
52
Table 3.3: Country Profile of Human Development Indicators—Bangladesh
Source: Human Development Report 2011
Health Life expectancy at birth (years) 66.9 Indicator Value Prevalence of undernourishment in total population (% of population) 26 Expenditure on health, public (% of GDP) 1.1 Under-five mortality (per 1,000 live births) 54 Life expectancy at birth (years) 66.9 Education Mean years of schooling (of adults) (years) 4.8 Indicator Value Adult literacy rate (both sexes) (% aged 15 and above) 56.5 Combined gross enrolment ratio in education (both sexes) (%) 52.1 Expenditure on education (% of GDP) (%) 2.4 Mean years of schooling (of adults) (years) 4.8
Income GNI per capita (2008 PPP US$) LN 7.4 Indicator Value GDP per capita (2008 PPP US$) 1,458 GNI per capita (2008 PPP US$) LN 7.4 Household final consumption expenditure per capita PPP (constant 2005 international $) 788
Inequality Inequality-adjusted HDI value 0.331 Indicator Value Income Gini coefficient 31 Inequality-adjusted education index 0.219 Inequality-adjusted income index 0.299 Inequality-adjusted HDI value 0.331 Poverty Multidimensional poverty index (k greater than or equal to 3) 0.291
Indicator Value Multidimensional poverty index (k greater than or equal to 3) 0.291 Intensity of deprivation 50.4 MPI: Headcount ( k greater than or equal to 3), population in poverty (% of population) 57.8
Population living below $1.25 PPP per day (%) 49.64 Gender Gender Inequality Index, value 0.734 Indicator Value Maternal mortality ratio (deaths of women per100,000 live births) 570 Population with at least secondary education, female/male ratio 0.784 Adolescent fertility rate (women aged 15-19 years) (births per 1,000 women aged 15-19) 71.6 Gender Inequality Index, value 0.734 Shares in parliament, female-male ratio 0.198 Maternal mortality ratio (new estimates) (deaths of women per100,000 live births) 340 Gender Inequality Index (updated) 0.712
53
The gender inequality index reflects women’s disadvantage in three areas: reproductive
health, empowerment and the labor market. The index ranges from 0, which means that men and
women fare equally and 1, which means women fare very poorly in all three dimensions. The
gender inequality index value for Bangladesh is 0.734 which indicates a high degree of
disadvantage for women.
Another important index is the Inequality-adjusted HDI Index (IHDI). This index
captures the loss in potential human development that is due to inequality. The IHDI equals the
HDI when there is no inequality and is less than the HDI as inequality rises. In this context, the
HDI is viewed as a measure of potential human development and IHDI represents actual human
development. The 2011 HDI is 0.469 and the IHDI for Bangladesh is 0.331. The loss in
potential human development due to inequality in Bangladesh is .138 (computed by 0.469-
0.331).
One of the main arguments pursued in this chapter and throughout this dissertation is
that in order for microfinance institution to make a significant dent on poverty reduction, the
enabling conditions necessary for human and economic prosperity must be in place. In the case
of Bangladesh, the degree of existing deprivation must be considered and addressed as a point of
departure in the development process by development initiatives. According to the HDI while
Bangladesh has displayed an upward trend in human development, it still ranks at the bottom
compared to South Asia and the world as a whole (see Figure 3.1, Bangladesh is represented by
the lowest plot).
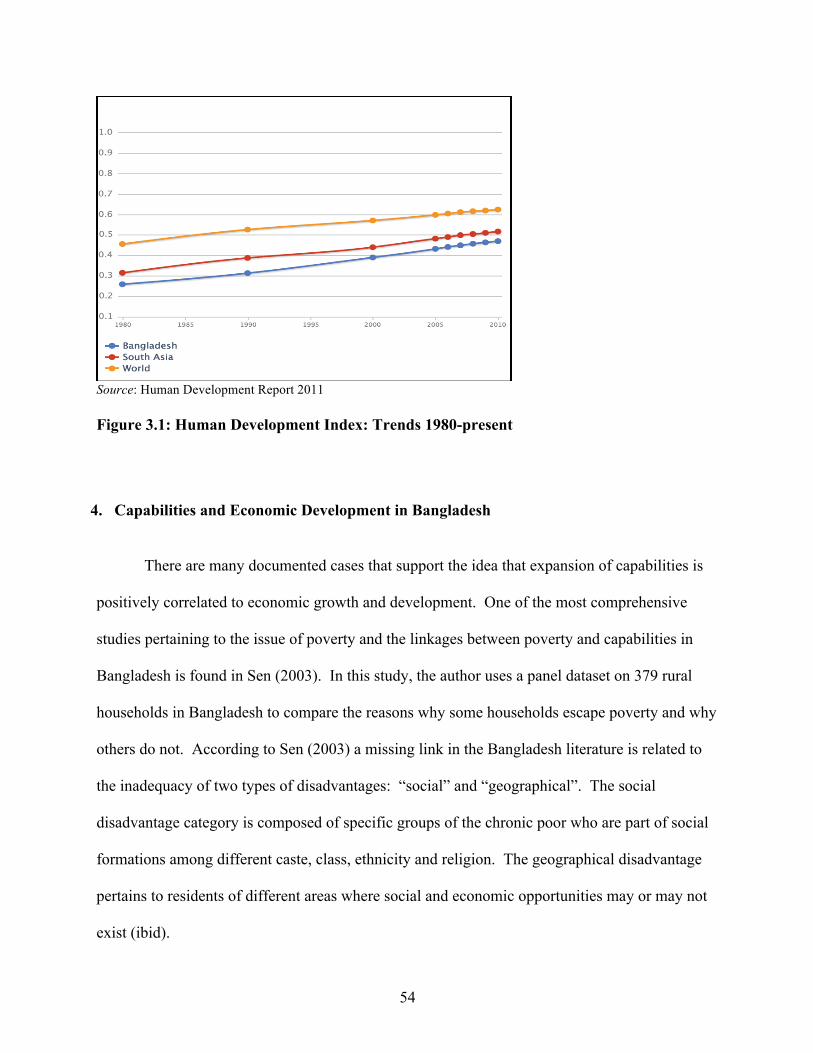
54
Source: Human Development Report 2011 Figure 3.1: Human Development Index: Trends 1980-present
4. Capabilities and Economic Development in Bangladesh There are many documented cases that support the idea that expansion of capabilities is
positively correlated to economic growth and development. One of the most comprehensive
studies pertaining to the issue of poverty and the linkages between poverty and capabilities in
Bangladesh is found in Sen (2003). In this study, the author uses a panel dataset on 379 rural
households in Bangladesh to compare the reasons why some households escape poverty and why
others do not. According to Sen (2003) a missing link in the Bangladesh literature is related to
the inadequacy of two types of disadvantages: “social” and “geographical”. The social
disadvantage category is composed of specific groups of the chronic poor who are part of social
formations among different caste, class, ethnicity and religion. The geographical disadvantage
pertains to residents of different areas where social and economic opportunities may or may not
exist (ibid).
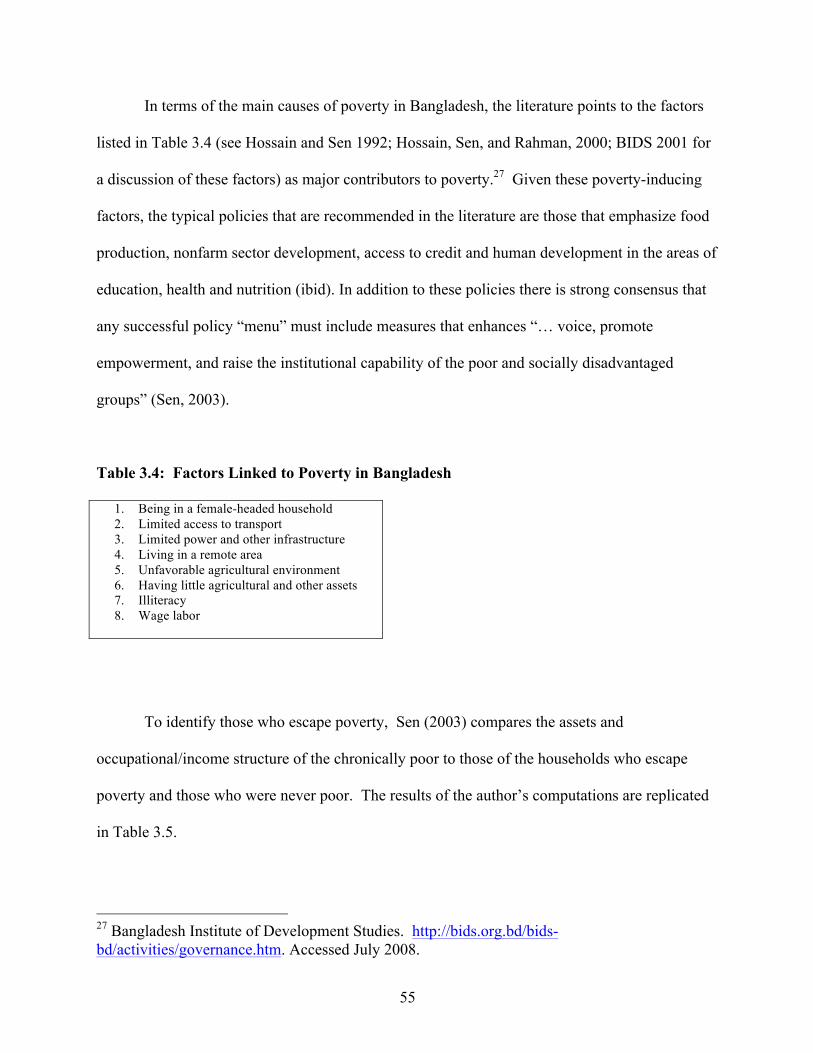
55
In terms of the main causes of poverty in Bangladesh, the literature points to the factors
listed in Table 3.4 (see Hossain and Sen 1992; Hossain, Sen, and Rahman, 2000; BIDS 2001 for
a discussion of these factors) as major contributors to poverty.27 Given these poverty-inducing
factors, the typical policies that are recommended in the literature are those that emphasize food
production, nonfarm sector development, access to credit and human development in the areas of
education, health and nutrition (ibid). In addition to these policies there is strong consensus that
any successful policy “menu” must include measures that enhances “… voice, promote
empowerment, and raise the institutional capability of the poor and socially disadvantaged
groups” (Sen, 2003).
Table 3.4: Factors Linked to Poverty in Bangladesh
1. Being in a female-headed household 2. Limited access to transport 3. Limited power and other infrastructure 4. Living in a remote area 5. Unfavorable agricultural environment 6. Having little agricultural and other assets 7. Illiteracy 8. Wage labor
To identify those who escape poverty, Sen (2003) compares the assets and
occupational/income structure of the chronically poor to those of the households who escape
poverty and those who were never poor. The results of the author’s computations are replicated
in Table 3.5.
27 Bangladesh Institute of Development Studies. http://bids.org.bd/bids-bd/activities/governance.htm. Accessed July 2008.
56
Some of the characteristics about the chronically poor observed in this table is the fact that this
group holds the lowest position with respect to all asset categories such as the number of earners,
average years of schooling of earners, average land owned, access to credit market and
ownership of nonland fixed assets. In terms of the reasons why some of these households could
not escape poverty or fell deeper into poverty, these very same characteristics or lack of
opportunities contributed to their descend into poverty.
In terms of the households that ascended or escaped poverty, Sen (2003) observes that the
existence of “capability” and or “opportunity” sets was the prime driver of high income growth.
The data in Table 3.5 accentuates the fact that those households who escape poverty tend to
accumulate human, physical and financial assets. According to the data, ascending households
tend to focus on nonagricultural activities and engage in trade, migration (remittance) and other
nonagricultural labor.
Sen (2003) identifies a few factors that were instrumental in allowing households to
escape poverty that are relevant to the topic and analysis undertaken in this dissertation. One of
the factors identified is considerable increases in human assets among the ascending households.
The author points out that part of the difference in human assets between the descending
household and the ascending households can be attributed to a high degree of inequality in the
distribution of human assets (ibid).
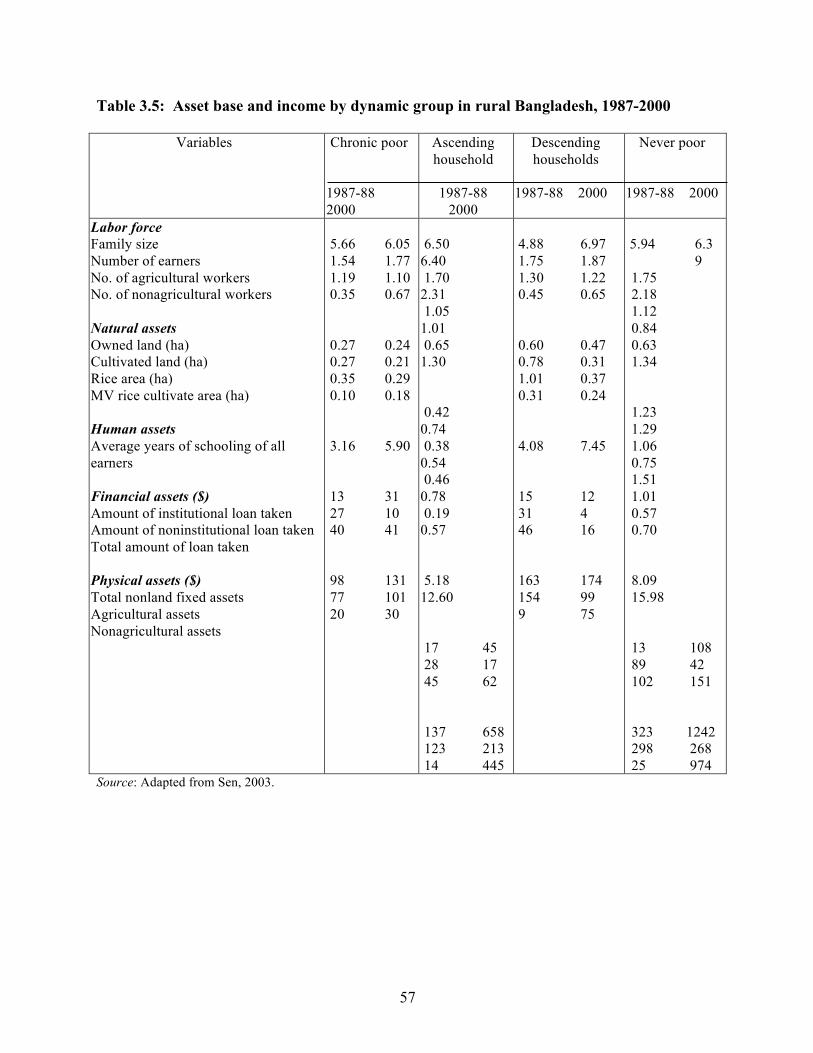
57
Table 3.5: Asset base and income by dynamic group in rural Bangladesh, 1987-2000
Variables Chronic poor 1987-88 2000
Ascending household
1987-88
2000
Descending households
1987-88 2000
Never poor
1987-88 2000
Labor force Family size Number of earners No. of agricultural workers No. of nonagricultural workers Natural assets Owned land (ha) Cultivated land (ha) Rice area (ha) MV rice cultivate area (ha) Human assets Average years of schooling of all earners Financial assets ($) Amount of institutional loan taken Amount of noninstitutional loan taken Total amount of loan taken Physical assets ($) Total nonland fixed assets Agricultural assets Nonagricultural assets
5.66 6.05 1.54 1.77 1.19 1.10 0.35 0.67 0.27 0.24 0.27 0.21 0.35 0.29 0.10 0.18 3.16 5.90 13 31 27 10 40 41 98 131 77 101 20 30
6.50 6.40 1.70 2.31 1.05 1.01 0.65 1.30 0.42 0.74 0.38 0.54 0.46 0.78 0.19 0.57 5.18 12.60 17 45 28 17 45 62 137 658 123 213 14 445
4.88 6.97 1.75 1.87 1.30 1.22 0.45 0.65 0.60 0.47 0.78 0.31 1.01 0.37 0.31 0.24 4.08 7.45 15 12 31 4 46 16 163 174 154 99 9 75
5.94 6.3
9 1.75 2.18 1.12 0.84 0.63 1.34 1.23 1.29 1.06 0.75 1.51 1.01 0.57 0.70 8.09 15.98 13 108 89 42 102 151 323 1242 298 268 25 974
Source: Adapted from Sen, 2003.
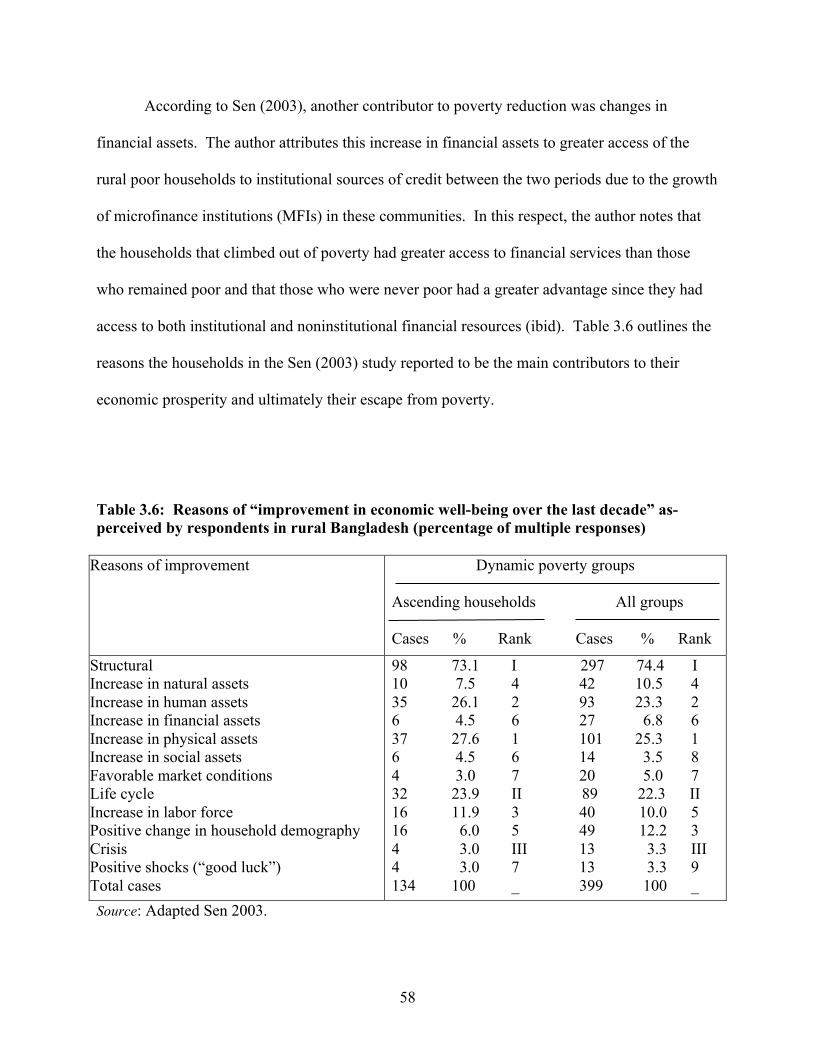
58
According to Sen (2003), another contributor to poverty reduction was changes in
financial assets. The author attributes this increase in financial assets to greater access of the
rural poor households to institutional sources of credit between the two periods due to the growth
of microfinance institutions (MFIs) in these communities. In this respect, the author notes that
the households that climbed out of poverty had greater access to financial services than those
who remained poor and that those who were never poor had a greater advantage since they had
access to both institutional and noninstitutional financial resources (ibid). Table 3.6 outlines the
reasons the households in the Sen (2003) study reported to be the main contributors to their
economic prosperity and ultimately their escape from poverty.
Table 3.6: Reasons of “improvement in economic well-being over the last decade” as-perceived by respondents in rural Bangladesh (percentage of multiple responses)
Reasons of improvement
Dynamic poverty groups
Ascending households All groups Cases % Rank Cases % Rank
Structural Increase in natural assets Increase in human assets Increase in financial assets Increase in physical assets Increase in social assets Favorable market conditions Life cycle Increase in labor force Positive change in household demography Crisis Positive shocks (“good luck”) Total cases
98 73.1 I 297 74.4 I 10 7.5 4 42 10.5 4 35 26.1 2 93 23.3 2 6 4.5 6 27 6.8 6 37 27.6 1 101 25.3 1 6 4.5 6 14 3.5 8 4 3.0 7 20 5.0 7 32 23.9 II 89 22.3 II 16 11.9 3 40 10.0 5 16 6.0 5 49 12.2 3 4 3.0 III 13 3.3 III 4 3.0 7 13 3.3 9 134 100 _ 399 100 _
Source: Adapted Sen 2003.

59
The two most important factors identified as the main drivers of poverty reduction were
improvement in physical assets and the acquisition of human capital. One of the main
conclusions that can be reached from the Sen (2003) study is that there are many routes to
poverty reduction. Another conclusion is that the process of economic development is
multidimensional in the sense that in most cases one policy alone, it being access to credit or the
provision of cash transfers, etc., will not yield economic development of a significant magnitude.
5. Microcredit and Channels of Impact
The majority of recent studies that use survey data to examine the impact of microcredit
have focused on the effect access to credit has on the traditional measures of economic
development such as income and household expenditure (See Hulme and Mosely 1996,
Khandker 1998, Chen and Snodgrass 2001, Park and Ren 2001, Mosely 2001, Duong and
Izumida 2002, Banegas et al 2002, Dunn and Arbuckle 2001a, 2001b and Khandker 2005). The
channel of microcredit impact of this type is represented by diagram (a) in Figure 3.2 and is in
fact the type of analysis found in chapter 2 of this dissertation. Upon further review of the
literature, few studies were found where the correlation between microcredit and capabilities is
explored. The direct impact of microfinance on instrumental freedoms or capabilities can be
modeled in a way consistent with diagram (b) where the focus is on how microfinance enhances
or fails to enhance capabilities (Figure 3.2).
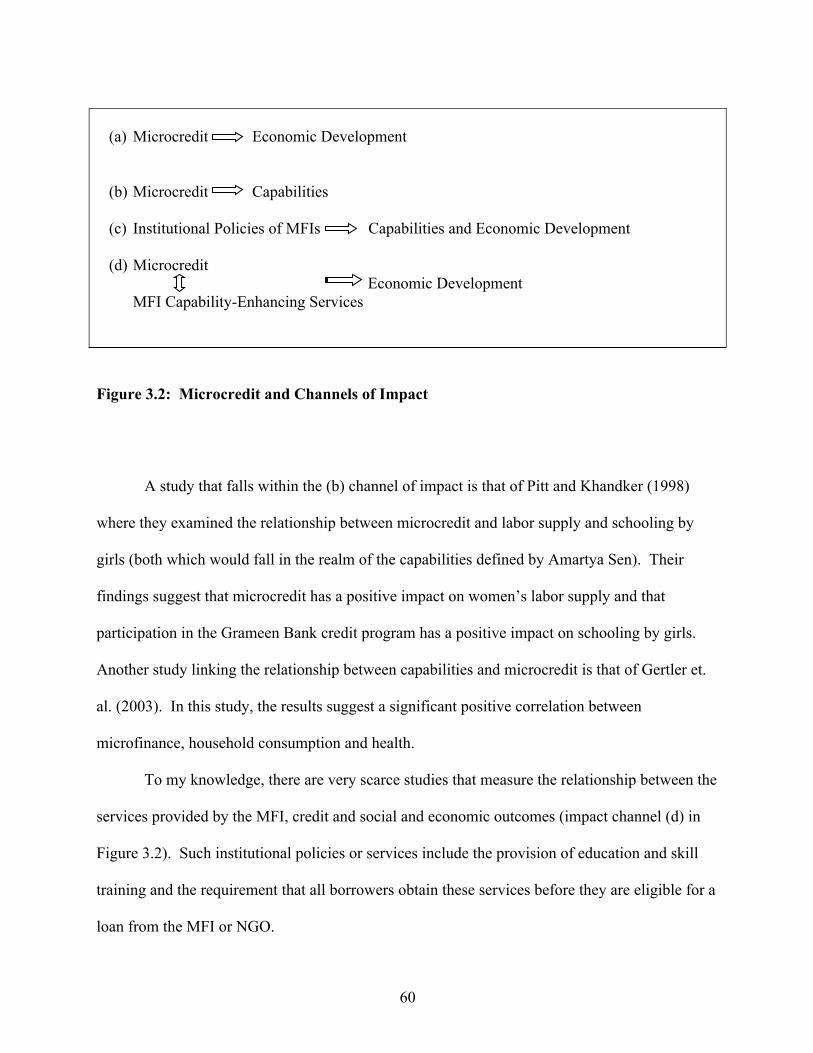
60
Figure 3.2: Microcredit and Channels of Impact
A study that falls within the (b) channel of impact is that of Pitt and Khandker (1998)
where they examined the relationship between microcredit and labor supply and schooling by
girls (both which would fall in the realm of the capabilities defined by Amartya Sen). Their
findings suggest that microcredit has a positive impact on women’s labor supply and that
participation in the Grameen Bank credit program has a positive impact on schooling by girls.
Another study linking the relationship between capabilities and microcredit is that of Gertler et.
al. (2003). In this study, the results suggest a significant positive correlation between
microfinance, household consumption and health.
To my knowledge, there are very scarce studies that measure the relationship between the
services provided by the MFI, credit and social and economic outcomes (impact channel (d) in
Figure 3.2). Such institutional policies or services include the provision of education and skill
training and the requirement that all borrowers obtain these services before they are eligible for a
loan from the MFI or NGO.
(a) Microcredit Economic Development (b) Microcredit Capabilities
(c) Institutional Policies of MFIs Capabilities and Economic Development
(d) Microcredit Economic Development MFI Capability-Enhancing Services
61
Other institutional policies include an explicit pledge by the borrowers to denounce cultural
norms that are oppressive and counterproductive in terms of a borrower’s ability to labor in
freedom and become productive (See Section 8.1). These institutional policies are expected to
enable the borrower to become productive and to prosper as individuals and to achieve economic
prosperity. In this context, the policies or services provided by the microfinance institution are
referred to here as capability-enhancing policies or services. In the context of Amartya Sen’s
capability framework, these policies and services are expected to have the effect of alleviating or
removing “unfreedoms” and allowing individuals to reach their potential and as such, they fall
within the realm of the capability space that Sen describes.
I was able to find one study that considers how financial intermediation provided by
MFIs and their institutional policies impacts social and economic development. Kaboski and
Townsend (2005) studied the correlation between the institutional policies of selected MFIs and
social and economic outcomes. Their paper used variation in policies and institutional
characteristics to evaluate the impacts of microfinance institutions at the village-level in rural
Thailand. They used a two-staged LS and MLE test of microfinance impact on asset growth,
level of consumption/input use, probability of being a business owner, probability of being a rice
farmer, and probability of borrowing from a money lender. They found that institutions with
good policies (such as providing services to borrowers) can promote asset growth, consumption
smoothing, occupational mobility and can decrease moneylender reliance.
The Kaboski and Townsend (2005) study examined impact of the type illustrated in
diagram (c) in Figure 3.2. They used household and village-level data to explore the impact of
financial intermediation in the “unbanked” sector in rural Thailand.
62
One of the limitations in this study is the lack of microcredit data at both the institutional-level
and at the household-level. For example, the authors were unable to obtain data on loan amounts
and so the aim of their study focuses on how the policies of the MFI and the prevalence of MFIs
in rural areas impacts asset growth, entrepreneurship, occupational mobility and many other
aspects of household prosperity.
This study expands on the type of analysis found in Kaboski and Townsend (2005) and
contributes to the existing literature on microfinance and financial intermediation in the
following ways: (i) I examine whether the capability-enhancing services provided by the three
MFIs in this study improve the effectiveness of microcredit in promoting economic
development, (ii) I explore the differential impacts of these capability-enhancing policies by
gender and by institution, and (iii) I explore impact channel (d) in Figure 3.2, which is the
inherent association and/or complementarities between microcredit and the provision of
capability-enhancing services.
5.1 Impact of Microcredit and Capability-Enhancing Services on Household Income
The few rigorous studies that evaluate the impacts of microfinance institutions (see Pitt
and Khandker 1998, Morduch 1998, Coleman 1999, Raviez 2000, Aportela 1998 and Khandker
2005) have produced mixed results rendering it necessary to explore the impact of microcredit at
a deeper level. This is one of the objectives of this study. To my knowledge, besides the Kaboski
and Townsend (2005) study, no other study explores the link between the policies employed by
the MFI and program outcomes.
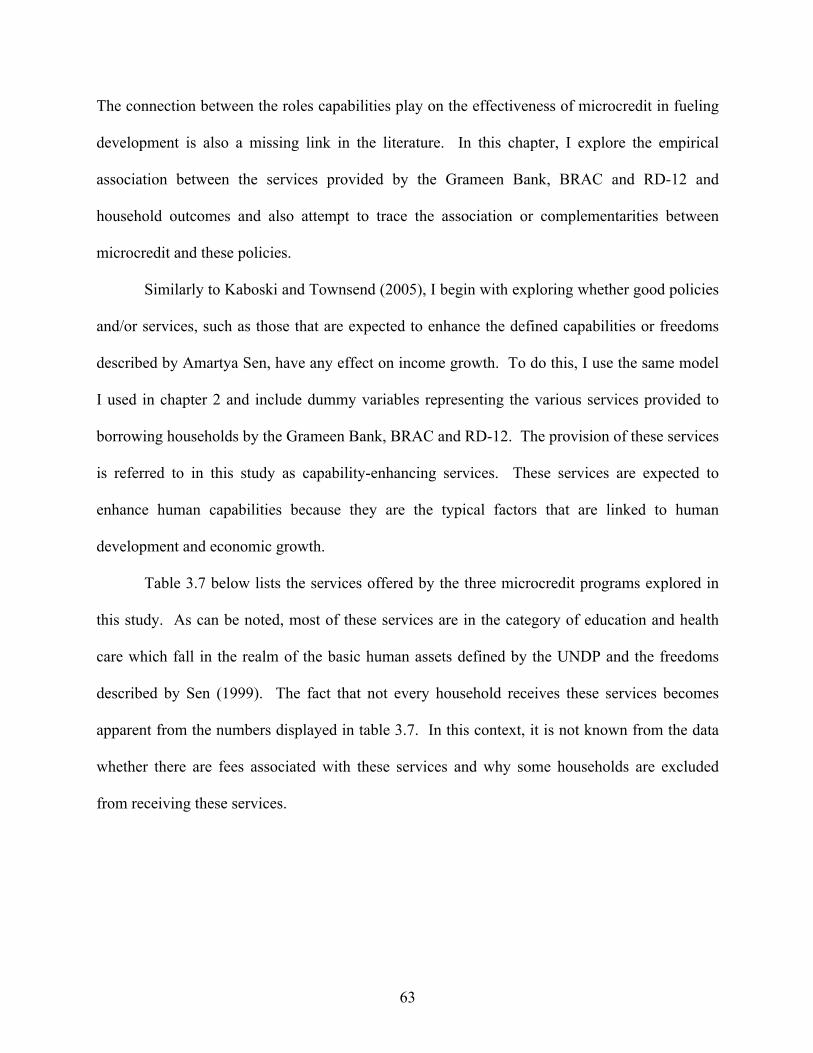
63
The connection between the roles capabilities play on the effectiveness of microcredit in fueling
development is also a missing link in the literature. In this chapter, I explore the empirical
association between the services provided by the Grameen Bank, BRAC and RD-12 and
household outcomes and also attempt to trace the association or complementarities between
microcredit and these policies.
Similarly to Kaboski and Townsend (2005), I begin with exploring whether good policies
and/or services, such as those that are expected to enhance the defined capabilities or freedoms
described by Amartya Sen, have any effect on income growth. To do this, I use the same model
I used in chapter 2 and include dummy variables representing the various services provided to
borrowing households by the Grameen Bank, BRAC and RD-12. The provision of these services
is referred to in this study as capability-enhancing services. These services are expected to
enhance human capabilities because they are the typical factors that are linked to human
development and economic growth.
Table 3.7 below lists the services offered by the three microcredit programs explored in
this study. As can be noted, most of these services are in the category of education and health
care which fall in the realm of the basic human assets defined by the UNDP and the freedoms
described by Sen (1999). The fact that not every household receives these services becomes
apparent from the numbers displayed in table 3.7. In this context, it is not known from the data
whether there are fees associated with these services and why some households are excluded
from receiving these services.
64
Table 3.7: Capability-Enhancing Services
Services Offered by the MFI Grameen % of Households
Receiving Services
BRAC % of Households
Receiving Services
RD-12 % of Households
Receiving Services 1991/92 1998/99 1991/92 1998/99 1991/92 1998/99 Primary Healthcare 64% 58% 51% 56% 30% 42% Basic Literacy 63% 62% 48% 52% 36% 38% Marketing Training 28% 9% 7% 6% 16% 4% Skill Training 12% 67% 25% 54% 62% 47% Other Services 7% 2.5% 36% 9% 31% 4% Source: Author’s calculations from the 1991/92 1998/99 surveys
From looking at the table presented above we can see that for some MFIs less than half of
the households in the sample reported receiving each service. A hypothesis to be tested in this
study is whether the provision of these services or the implementation of these capability-
enhancing policies is important in generating economic prosperity (as measured by income) for
the household. If these services in fact matter, then from a policy perspective, it would be
beneficial for MFIs to increase the provision of these services in order to both augment the
effectiveness of microcredit in alleviating poverty and speed up the process of economic
development.
6. Empirical Model I: Policy Impact on Household Outcome In assessing the effectiveness of any development program or service, one issue that
instantly arises with impact evaluation is the biases that could come from endogenous
participation in such programs. In the impact analysis literature, the typical sources of
correlation are referred to as program placement bias and household selection bias (Pitt,
Rosenzweig, & Gibbons, 1993; Ravallion, 1999).
65
If there is a systematic geographical bias in the way the program targets the population, a
program placement bias is created. This is certainly the case in Bangladesh where poor
households are specifically targeted and happen to live in areas where the incidence of poverty is
more prevalent. A household selection bias would also occur if participation in the program is
correlated with unobserved individual characteristics. In this study, the concern is the potential
bias on the credit estimate created by the correlation between unobserved heterogeneity and
micro loans.
A major challenge facing development programs, particularly microcredit programs, is
that policy conclusions are difficult because the results of impact studies are sensitive to the
empirical method used to estimate program effects. In this context, there are compelling reasons
to employ alternative methods to estimate program impacts and determine whether microfinance
benefits participants and their communities. Similarly to chapter 2, I begin with an income
equation that relates income !! in year ! to the household’s asset endowment and characteristics
!, the amount of loan received !, and a random error !:
!!"# = !!!!"# + !!!!"#! + !!!!"(!!!)
! + !!!!"#! + !!!!"(!!!)
! + !!! + !!"# (1)
where !!"# is household per capita income in village !, which is assumed to depend on household
characteristics and current and past borrowing. ! is a vector of household assets and
characteristics. !! and !! respectively are vectors of current and past microcredit received by
female and male borrowers from different programs. Parameters !!, !!, !! and !! measure the
effects of current and past credit (stock) for loans given to female and male borrowers by each of
the microcredit programs.
66
Loans are separated by gender because since credit markets are imperfect and labor markets are
different for men and women, the impact of microfinance borrowing is expected to differ by
gender. Also since many of the group-based programs are separated by female only or male only
groups, separating these effects seems appropriate. The term !!! is a vector of various
capability-enhancing services provided by each MFI and the parameter !! captures the effect
these services have on the household’s ability to generate income. Z is a dichotomous variable
that equals one when the household receives the service and zero when it does not.
According to equation (1), the marginal return to income in any given time period is the
combined returns from past credit and current credit. The model assumes that even if current
credit is zero, for instance, the household did not borrow in period ! = 2, past credit can still
have an effect on income. Structuring the model in this way allows for differential impacts on
borrowing over time. 28
The above equation, if estimated in this standard way, however, would suffer from the
biases discussed earlier since it is likely that exogenous factors will also affect household and
village level income. To the extent these factors cause the error term in (1) to be correlated
across all periods for a particular household or village, cross-section estimates that do not
account for this correlation will not be efficient. If the omitted variables are correlated with
household income, then estimating equation (1) with methods such as cross-section will in fact
yield biased results (see Mundlak, 1978 and Hsiao, 1986).
28 A similar specification was used by Khandker (2005).
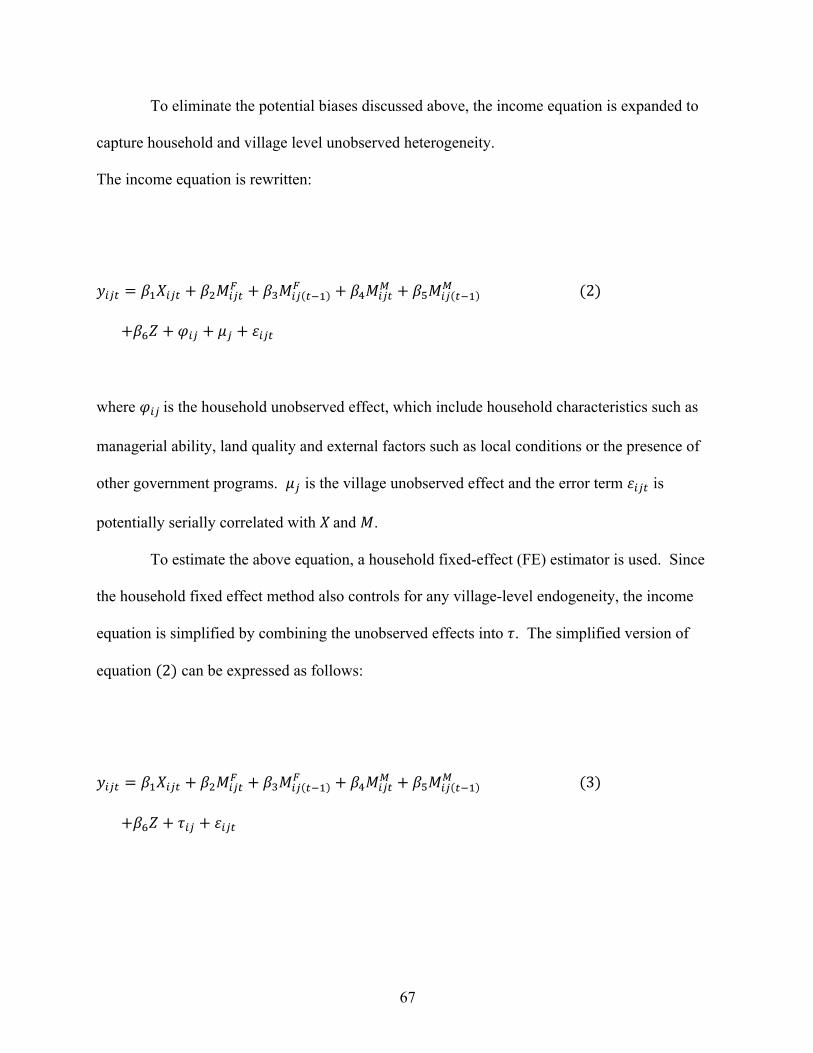
67
To eliminate the potential biases discussed above, the income equation is expanded to
capture household and village level unobserved heterogeneity.
The income equation is rewritten:
!!"# = !!!!"# + !!!!"#! + !!!!! !!!
! + !!!!"#! + !!!!" !!!
! (2)
+!!! + !!" + !! + !!"#
where !!" is the household unobserved effect, which include household characteristics such as
managerial ability, land quality and external factors such as local conditions or the presence of
other government programs. !! is the village unobserved effect and the error term !!"# is
potentially serially correlated with ! and !.
To estimate the above equation, a household fixed-effect (FE) estimator is used. Since
the household fixed effect method also controls for any village-level endogeneity, the income
equation is simplified by combining the unobserved effects into !. The simplified version of
equation (2) can be expressed as follows:
!!"# = !!!!"# + !!!!"#! + !!!!" !!!
! + !!!!"#! + !!!!" !!!
! (3)
+!!! + !!" + !!"#
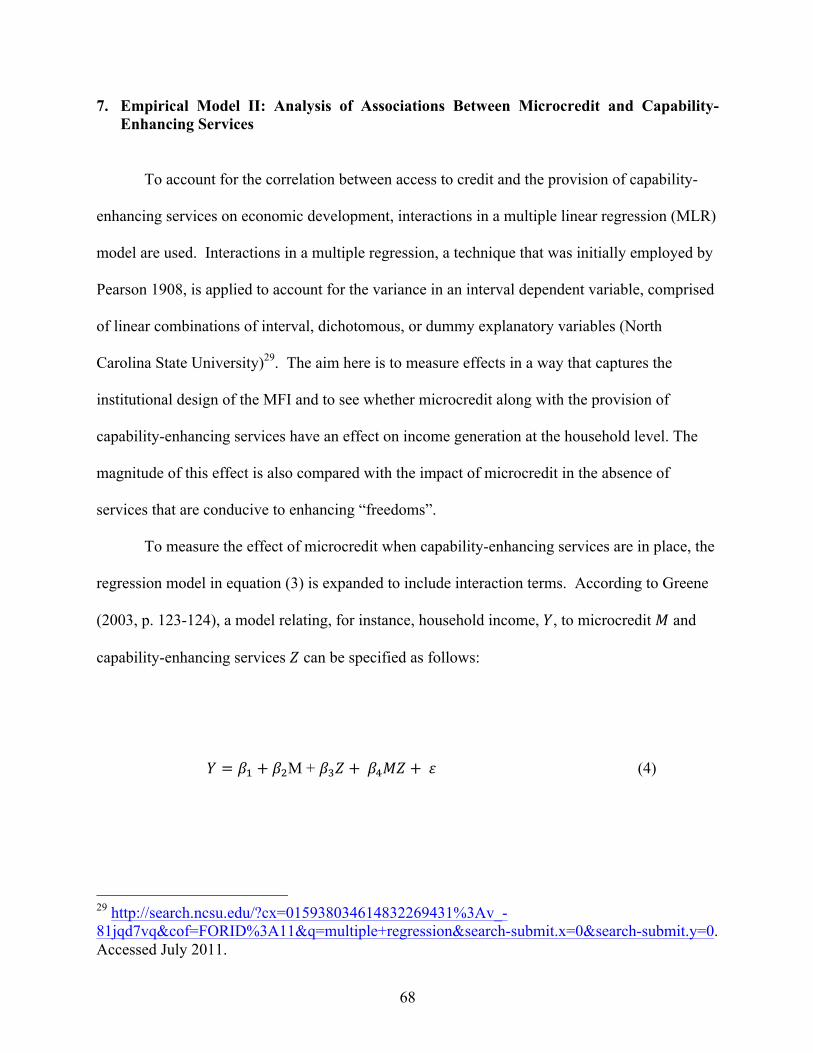
68
7. Empirical Model II: Analysis of Associations Between Microcredit and Capability-Enhancing Services
To account for the correlation between access to credit and the provision of capability-
enhancing services on economic development, interactions in a multiple linear regression (MLR)
model are used. Interactions in a multiple regression, a technique that was initially employed by
Pearson 1908, is applied to account for the variance in an interval dependent variable, comprised
of linear combinations of interval, dichotomous, or dummy explanatory variables (North
Carolina State University)29. The aim here is to measure effects in a way that captures the
institutional design of the MFI and to see whether microcredit along with the provision of
capability-enhancing services have an effect on income generation at the household level. The
magnitude of this effect is also compared with the impact of microcredit in the absence of
services that are conducive to enhancing “freedoms”.
To measure the effect of microcredit when capability-enhancing services are in place, the
regression model in equation (3) is expanded to include interaction terms. According to Greene
(2003, p. 123-124), a model relating, for instance, household income, !, to microcredit ! and
capability-enhancing services ! can be specified as follows:
! = !! + !!M + !!! + !!!! + ! (4)
29 http://search.ncsu.edu/?cx=015938034614832269431%3Av_-81jqd7vq&cof=FORID%3A11&q=multiple+regression&search-submit.x=0&search-submit.y=0. Accessed July 2011.
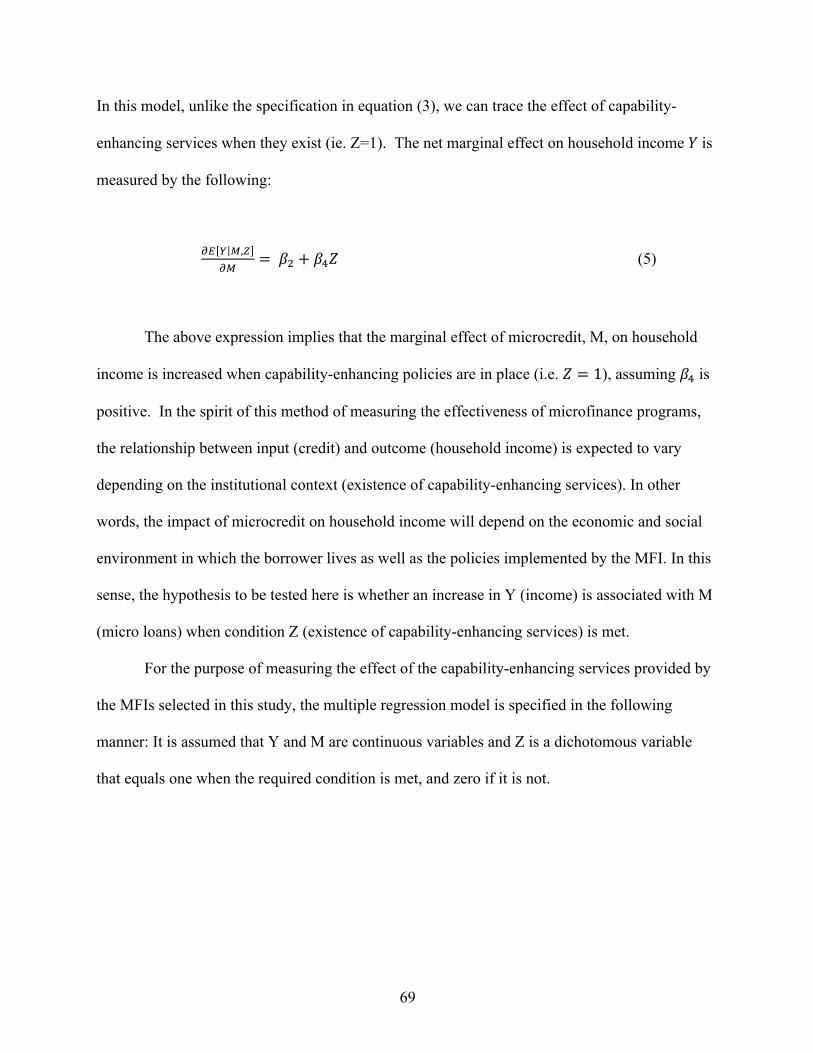
69
In this model, unlike the specification in equation (3), we can trace the effect of capability-
enhancing services when they exist (ie. Z=1). The net marginal effect on household income ! is
measured by the following:
!" ! !,!!"
= !! + !!! (5)
The above expression implies that the marginal effect of microcredit, M, on household
income is increased when capability-enhancing policies are in place (i.e. ! = 1), assuming !! is
positive. In the spirit of this method of measuring the effectiveness of microfinance programs,
the relationship between input (credit) and outcome (household income) is expected to vary
depending on the institutional context (existence of capability-enhancing services). In other
words, the impact of microcredit on household income will depend on the economic and social
environment in which the borrower lives as well as the policies implemented by the MFI. In this
sense, the hypothesis to be tested here is whether an increase in Y (income) is associated with M
(micro loans) when condition Z (existence of capability-enhancing services) is met.
For the purpose of measuring the effect of the capability-enhancing services provided by
the MFIs selected in this study, the multiple regression model is specified in the following
manner: It is assumed that Y and M are continuous variables and Z is a dichotomous variable
that equals one when the required condition is met, and zero if it is not.
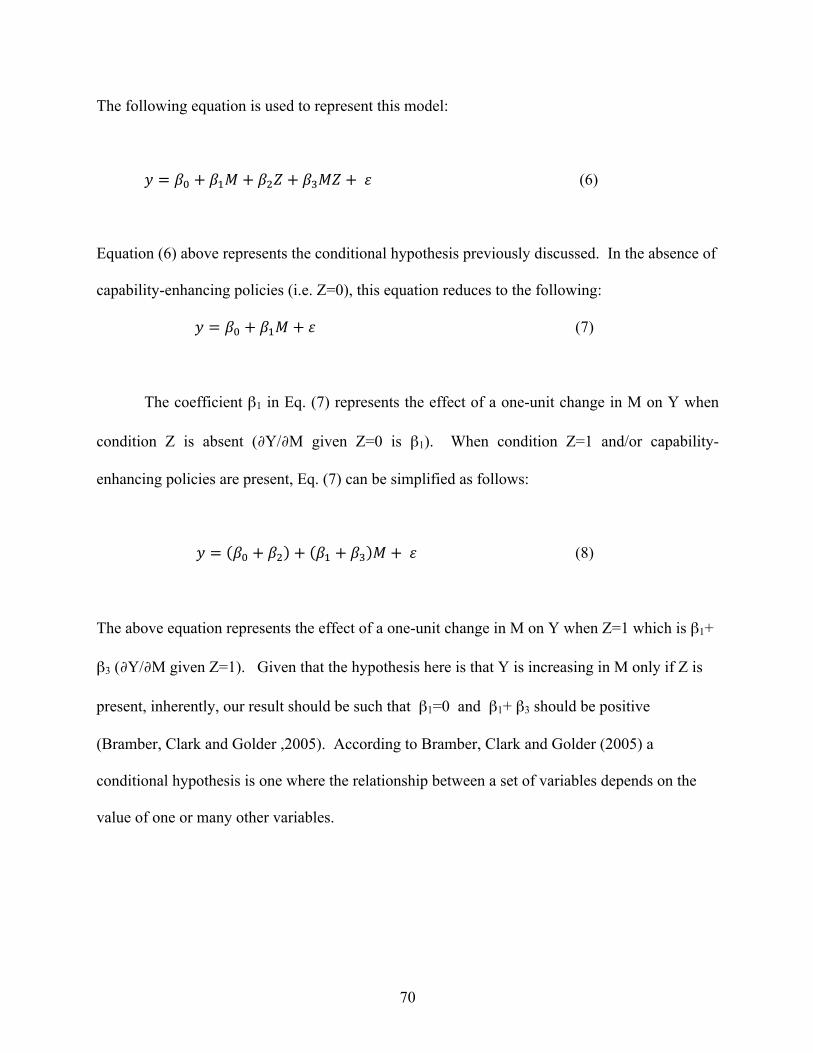
70
The following equation is used to represent this model:
! = !! + !!! + !!! + !!!" + ! (6)
Equation (6) above represents the conditional hypothesis previously discussed. In the absence of
capability-enhancing policies (i.e. Z=0), this equation reduces to the following:
! = !! + !!! + ! (7)
The coefficient β1 in Eq. (7) represents the effect of a one-unit change in M on Y when
condition Z is absent (∂Y/∂M given Z=0 is β1). When condition Z=1 and/or capability-
enhancing policies are present, Eq. (7) can be simplified as follows:
! = !! + !! + !! + !! ! + ! (8)
The above equation represents the effect of a one-unit change in M on Y when Z=1 which is β1+
β3 (∂Y/∂M given Z=1). Given that the hypothesis here is that Y is increasing in M only if Z is
present, inherently, our result should be such that β1=0 and β1+ β3 should be positive
(Bramber, Clark and Golder ,2005). According to Bramber, Clark and Golder (2005) a
conditional hypothesis is one where the relationship between a set of variables depends on the
value of one or many other variables.
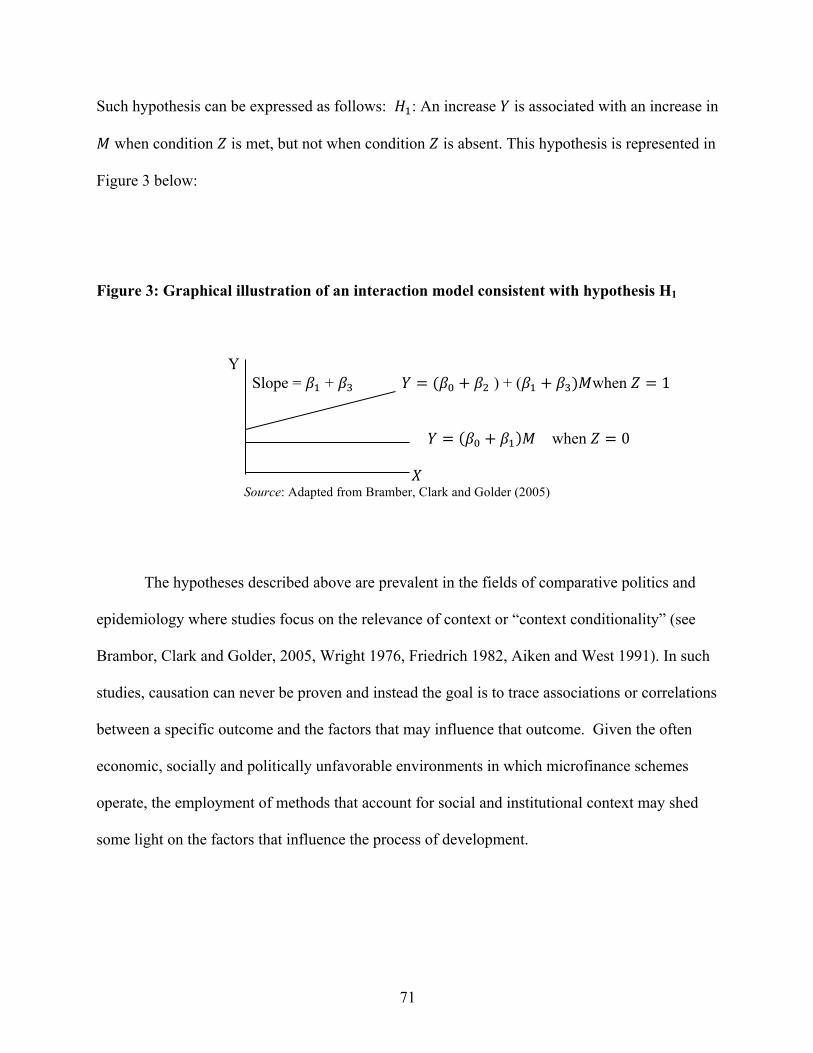
71
Such hypothesis can be expressed as follows: !!: An increase ! is associated with an increase in
! when condition ! is met, but not when condition ! is absent. This hypothesis is represented in
Figure 3 below:
Figure 3: Graphical illustration of an interaction model consistent with hypothesis H1
Y Slope = !! + !! ! = (!! + !! ) + (!! + !!)!when ! = 1 ! = !! + !! ! when ! = 0 ! Source: Adapted from Bramber, Clark and Golder (2005)
The hypotheses described above are prevalent in the fields of comparative politics and
epidemiology where studies focus on the relevance of context or “context conditionality” (see
Brambor, Clark and Golder, 2005, Wright 1976, Friedrich 1982, Aiken and West 1991). In such
studies, causation can never be proven and instead the goal is to trace associations or correlations
between a specific outcome and the factors that may influence that outcome. Given the often
economic, socially and politically unfavorable environments in which microfinance schemes
operate, the employment of methods that account for social and institutional context may shed
some light on the factors that influence the process of development.
72
A challenge that arises with a multiplicative interaction term model is that interpreting
the results can be tricky because the size of the coefficients represent conditional marginal
effects rather than average effects. This feature of the model is what allows this model to capture
the meaning behind a conditional hypothesis because the model can only shed light on
associations between the independent variables and the dependent variable. Specifying the
model this way enables the effect of the independent variable M on the dependent variable Y
depend on an additional variable such as Z. This model specification cannot be interpreted to
mean that M has an average effect on Y as it can be concluded in the linear-additive regression
model.
As previously mentioned and as represented in Eq.(4), the Z coefficient exclusively
captures the effect of Z on Y when M=0. In this context, it would be incorrect to conclude that a
positive and significant coefficient on M or Z translates into an increase in Y. The estimates can
only shed light on the fact that M is associated with a increase/decrease in Y when condition Z is
absent. It will also tell us the association of M with an increase/decrease in Y when condition Z
is present (Bramber, Clark and Golder ,2005).
7.1 Interactions in a Multiple Linear Regression Model: Significance Testing and Interpretation of Results In the additive regression model ! has a constant effect on !, whereas the interaction
model asserts that the effect of a change in ! on ! will be influenced by the value of the
conditioning variable !. In this sense, regression results will only display model parameters and
goodness of fit.
73
These attributes are of interest in the linear-additive model but in the case of a multiple
regression model, what is of interest is the combination of coefficients such as (!! + !!!) (see
equation 6) in terms of predicting associations between the variables. One example Bramber,
Clark and Golder (2005) provide in their paper is the case where ! represents government size.
From looking at the regression output, we would know the effect of ! when government size is
zero. However, since there would be no observation where government size is zero, logically we
would see that the coefficient on ! tells us nothing about the effect of ! (if M were to measure
government size) on !. In this sense, from the typical results table, there is no way of knowing if
! has a significant effect on ! when ! = 0 (Bramber, Clark and Golder, 2005).
In terms of the magnitude and significance of the coefficient on the interaction term, the
analyst cannot determine whether ! has a meaningful conditional effect on ! from the
regression output. The reason for this is that, as previously mentioned, marginal impact of ! on
! results from (!! + !!!) and not the parameters on !! and !!! independently (Bramber, Clark
and Golder, 2005). In this context, the statistical significance of the variables can be ignored in
the case of interaction terms due to the following reasons: (i) t-tests are not used for dummy (or
dichotomous) variables although many statistical packages output them, and (ii) the t-test is a test
specifically of the unique variance an independent variable accounts for and not of shared
variance which we find in the interaction term (North Carolina State University).30
30 http://search.ncsu.edu/?cx=015938034614832269431%3Av_-81jqd7vq&cof=FORID%3A11&q=multiple+regression&search-submit.x=0&search-submit.y=0. Accessed July 2011.
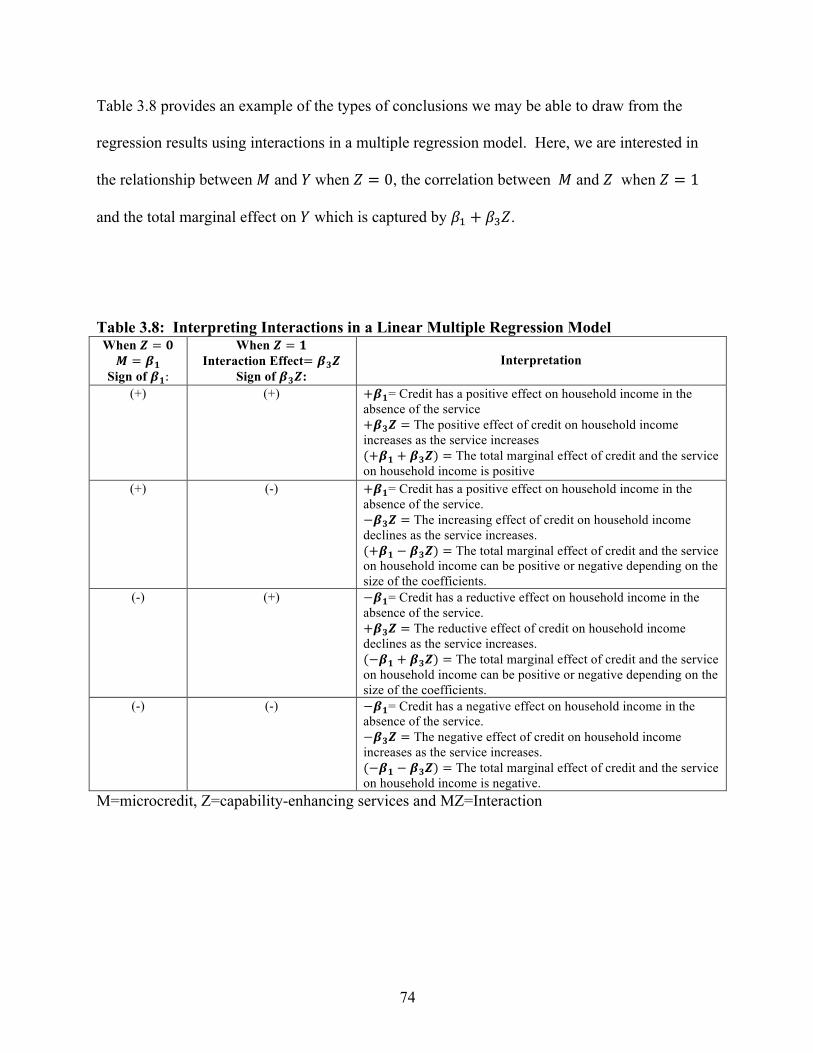
74
Table 3.8 provides an example of the types of conclusions we may be able to draw from the
regression results using interactions in a multiple regression model. Here, we are interested in
the relationship between ! and ! when ! = 0, the correlation between ! and ! when ! = 1
and the total marginal effect on ! which is captured by !! + !!!.
Table 3.8: Interpreting Interactions in a Linear Multiple Regression Model When ! = ! ! = !!
Sign of !!:
When ! = ! Interaction Effect= !!!
Sign of !!!:
Interpretation
(+) (+) +!!= Credit has a positive effect on household income in the absence of the service +!!! = The positive effect of credit on household income increases as the service increases (+!! + !!!) = The total marginal effect of credit and the service on household income is positive
(+) (-) +!!= Credit has a positive effect on household income in the absence of the service. −!!! = The increasing effect of credit on household income declines as the service increases. (+!! − !!!) = The total marginal effect of credit and the service on household income can be positive or negative depending on the size of the coefficients.
(-)
(+) −!!= Credit has a reductive effect on household income in the absence of the service. +!!! = The reductive effect of credit on household income declines as the service increases. (−!! + !!!) = The total marginal effect of credit and the service on household income can be positive or negative depending on the size of the coefficients.
(-) (-) −!!= Credit has a negative effect on household income in the absence of the service. −!!! = The negative effect of credit on household income increases as the service increases. (−!! − !!!) = The total marginal effect of credit and the service on household income is negative.
M=microcredit, Z=capability-enhancing services and MZ=Interaction
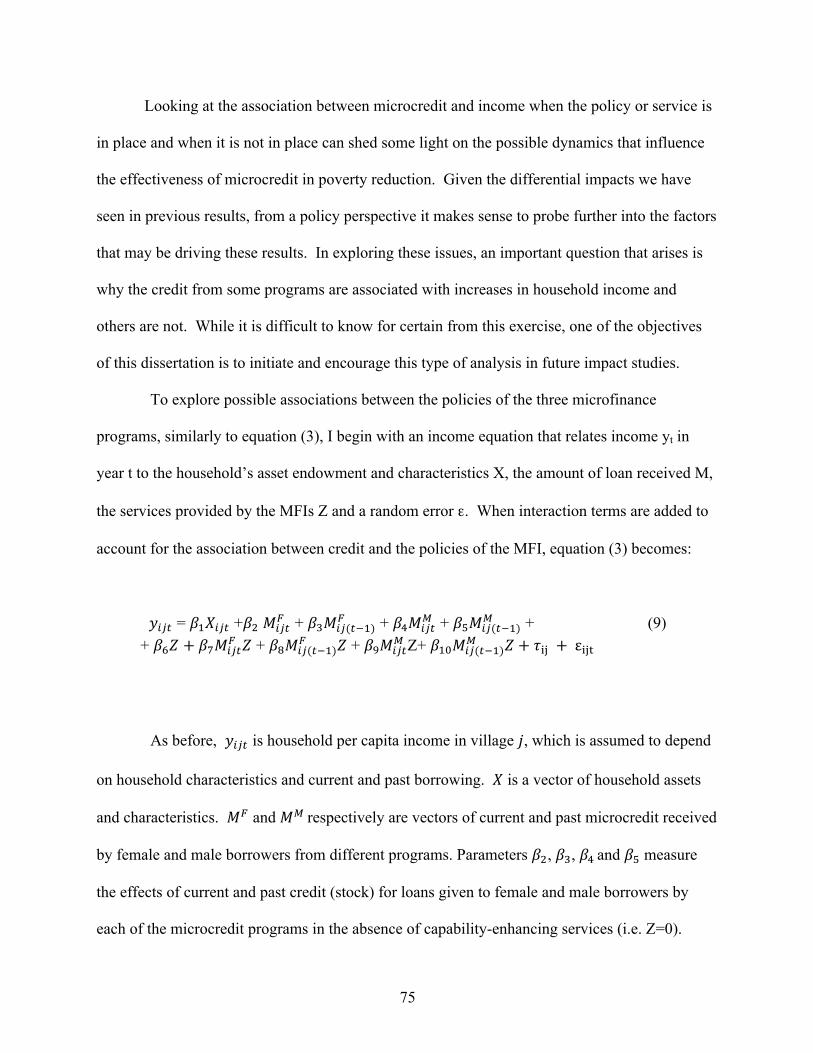
75
Looking at the association between microcredit and income when the policy or service is
in place and when it is not in place can shed some light on the possible dynamics that influence
the effectiveness of microcredit in poverty reduction. Given the differential impacts we have
seen in previous results, from a policy perspective it makes sense to probe further into the factors
that may be driving these results. In exploring these issues, an important question that arises is
why the credit from some programs are associated with increases in household income and
others are not. While it is difficult to know for certain from this exercise, one of the objectives
of this dissertation is to initiate and encourage this type of analysis in future impact studies.
To explore possible associations between the policies of the three microfinance
programs, similarly to equation (3), I begin with an income equation that relates income yt in
year t to the household’s asset endowment and characteristics X, the amount of loan received M,
the services provided by the MFIs Z and a random error ε. When interaction terms are added to
account for the association between credit and the policies of the MFI, equation (3) becomes:
!!"# = !!!!"# +!! !!"#! + !!!!"(!!!)
! + !!!!"#! + !!!!"(!!!)
! + (9) + !!! + !!!!"#
! ! + !!!!"(!!!)! ! + !!!!"#
! Z+ !!"!!"(!!!)! ! + !!" + ε!"#
As before, !!"# is household per capita income in village !, which is assumed to depend
on household characteristics and current and past borrowing. ! is a vector of household assets
and characteristics. !! and !! respectively are vectors of current and past microcredit received
by female and male borrowers from different programs. Parameters !!, !!, !! and !! measure
the effects of current and past credit (stock) for loans given to female and male borrowers by
each of the microcredit programs in the absence of capability-enhancing services (i.e. Z=0).
76
The term !!! is a vector of the various capability-enhancing policies implemented by each MFI
and parameter !! captures the association between these policies and household income.
Parameters !!, !!, !!, and !!" capture the relationship between credit, services and household
income when Z=1. Similarly to the first set of equations found in section 6, a household fixed
effect method is employed to account for unobserved household heterogeneity.
8. The Data
As in chapter 2, this study relies on the 1991/92 and the1998/99 surveys conducted by the
Bangladesh Institute of Development Studies (BIDS) and the World Bank. The surveys covered
1,798 households drawn from 87 villages in 29 thanas (Pitt and Khandker, 1998) and Khandker,
2005).31 The 1991/92 survey was conducted on three cropping seasons: round 1 during Aman
rice (November-February), round 2 during Boro rice (March-June), and round 3 during Aus rice
(July-October). The 1998/99 survey was collected only once during this period (ibid).
The purpose of this survey was to analyze three major credit programs: Grameen Bank,
Bangladesh Rural Advancement Committee, and the Rural Development-12 program of the
Bangladesh Rural Development Board. Villages where these programs operated were surveyed
as well as non-program villages where no micro lending or any similar lending activities took
place (ibid). Target households and non-target households were surveyed.
31 A thana is an administrative unit that is smaller than a district and consists of a number of villages. In Bangladesh, you have “Divisions” and under those divisions you have “Zilas”. Thanas are under the umbrella of zilas.
77
Target households are those who meet the program eligibility criteria, which is to own less than
or equal to half of an acre of land. Non-target households are those who do not meet the
landholding criteria. Non-target households were surveyed in both program villages and non-
program villages (ibid).
Out of the 29 thanas covered, 24 were program thanas (8 from each of the three
programs) and 5 were non-program thanas. The thanas included in the survey were selected
from 391 rural thanas out of 460 thanas. Three villages in each program thana were randomly
selected from a group of program villages where a program had been in operation for at least
three years. Three villages in each of the non-program thanas were also randomly selected.
These villages were drawn from the village census of the Government of Bangladesh. In terms
of the village survey design, villages with fewer than 51 number of households and villages with
more than 600 households, were excluded (ibid).
The households surveyed in 1991/92 were revisited in 1998/99. This time, however, the
households were interviewed in one round, rather than in three. Among the 1,769 households
surveyed in 1991/92, 113 could not be interviewed in 1998/99 and only 1,656 households were
available for the re-survey. Included in the re-survey were new households from previous
villages and newly included villages. Also three non-target households were randomly selected
from each of the previous 87 villages (ibid). Also included, are three new thanas that were
randomly selected from the southern and southeastern regions that were seriously affected by
cyclone in 1991/92. These thanas were excluded in the first round survey.
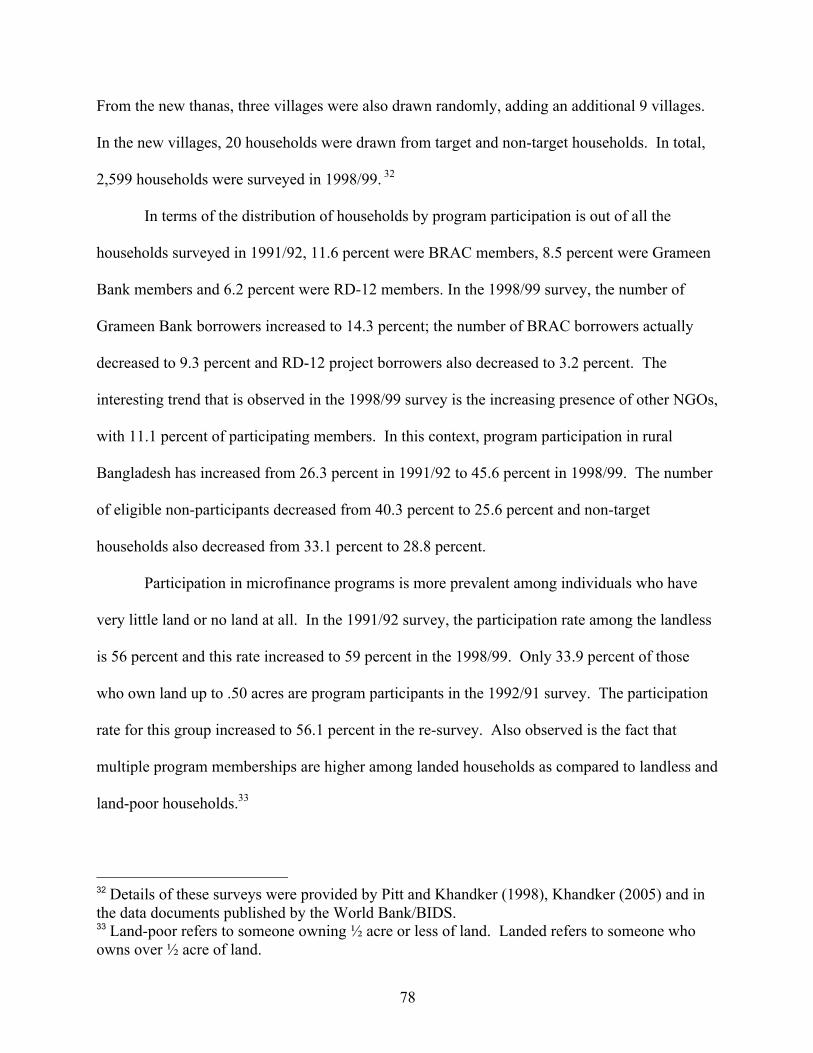
78
From the new thanas, three villages were also drawn randomly, adding an additional 9 villages.
In the new villages, 20 households were drawn from target and non-target households. In total,
2,599 households were surveyed in 1998/99. 32
In terms of the distribution of households by program participation is out of all the
households surveyed in 1991/92, 11.6 percent were BRAC members, 8.5 percent were Grameen
Bank members and 6.2 percent were RD-12 members. In the 1998/99 survey, the number of
Grameen Bank borrowers increased to 14.3 percent; the number of BRAC borrowers actually
decreased to 9.3 percent and RD-12 project borrowers also decreased to 3.2 percent. The
interesting trend that is observed in the 1998/99 survey is the increasing presence of other NGOs,
with 11.1 percent of participating members. In this context, program participation in rural
Bangladesh has increased from 26.3 percent in 1991/92 to 45.6 percent in 1998/99. The number
of eligible non-participants decreased from 40.3 percent to 25.6 percent and non-target
households also decreased from 33.1 percent to 28.8 percent.
Participation in microfinance programs is more prevalent among individuals who have
very little land or no land at all. In the 1991/92 survey, the participation rate among the landless
is 56 percent and this rate increased to 59 percent in the 1998/99. Only 33.9 percent of those
who own land up to .50 acres are program participants in the 1992/91 survey. The participation
rate for this group increased to 56.1 percent in the re-survey. Also observed is the fact that
multiple program memberships are higher among landed households as compared to landless and
land-poor households.33
32 Details of these surveys were provided by Pitt and Khandker (1998), Khandker (2005) and in the data documents published by the World Bank/BIDS. 33 Land-poor refers to someone owning ½ acre or less of land. Landed refers to someone who owns over ½ acre of land.
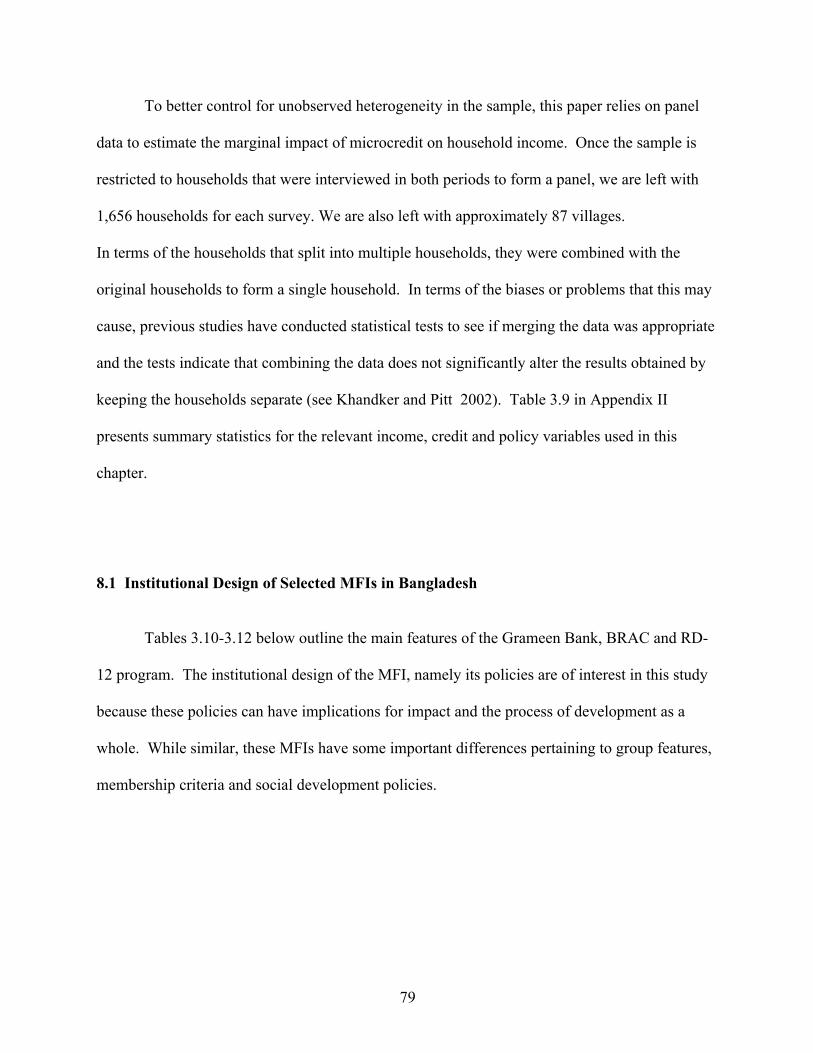
79
To better control for unobserved heterogeneity in the sample, this paper relies on panel
data to estimate the marginal impact of microcredit on household income. Once the sample is
restricted to households that were interviewed in both periods to form a panel, we are left with
1,656 households for each survey. We are also left with approximately 87 villages.
In terms of the households that split into multiple households, they were combined with the
original households to form a single household. In terms of the biases or problems that this may
cause, previous studies have conducted statistical tests to see if merging the data was appropriate
and the tests indicate that combining the data does not significantly alter the results obtained by
keeping the households separate (see Khandker and Pitt 2002). Table 3.9 in Appendix II
presents summary statistics for the relevant income, credit and policy variables used in this
chapter.
8.1 Institutional Design of Selected MFIs in Bangladesh
Tables 3.10-3.12 below outline the main features of the Grameen Bank, BRAC and RD-
12 program. The institutional design of the MFI, namely its policies are of interest in this study
because these policies can have implications for impact and the process of development as a
whole. While similar, these MFIs have some important differences pertaining to group features,
membership criteria and social development policies.
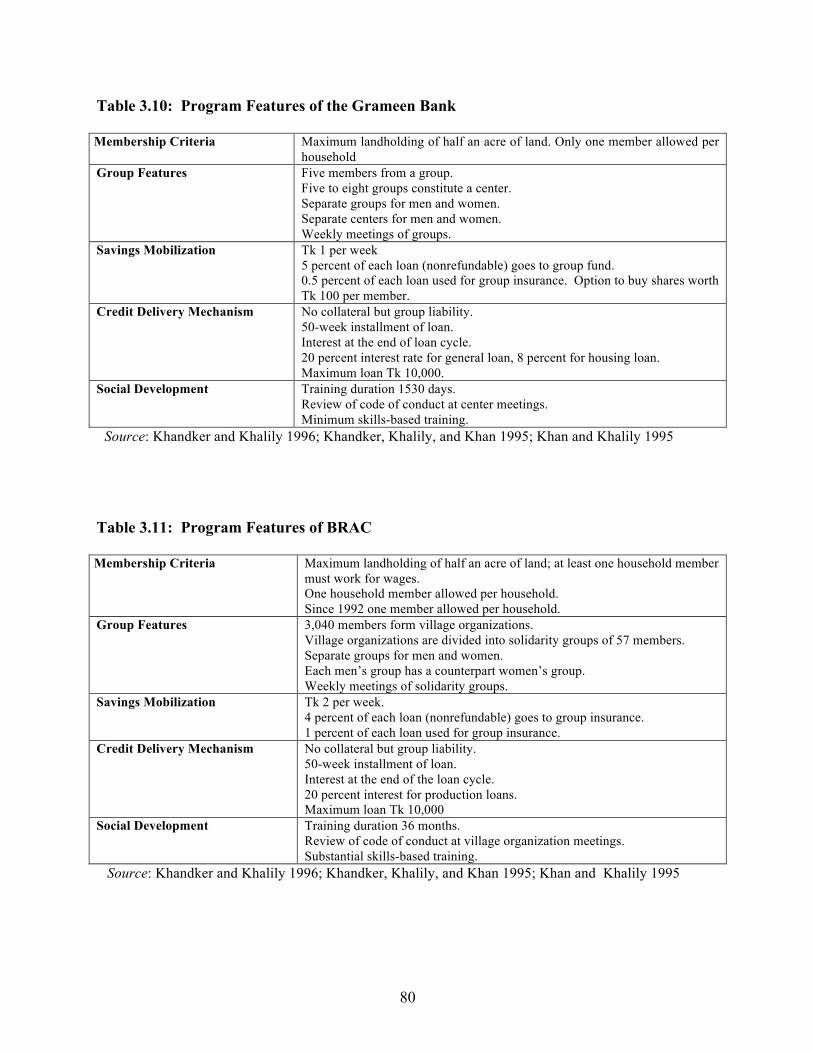
80
Table 3.10: Program Features of the Grameen Bank
Membership Criteria Maximum landholding of half an acre of land. Only one member allowed per household
Group Features Five members from a group. Five to eight groups constitute a center. Separate groups for men and women. Separate centers for men and women. Weekly meetings of groups.
Savings Mobilization Tk 1 per week 5 percent of each loan (nonrefundable) goes to group fund. 0.5 percent of each loan used for group insurance. Option to buy shares worth Tk 100 per member.
Credit Delivery Mechanism No collateral but group liability. 50-week installment of loan. Interest at the end of loan cycle. 20 percent interest rate for general loan, 8 percent for housing loan. Maximum loan Tk 10,000.
Social Development Training duration 1530 days. Review of code of conduct at center meetings. Minimum skills-based training.
Source: Khandker and Khalily 1996; Khandker, Khalily, and Khan 1995; Khan and Khalily 1995
Table 3.11: Program Features of BRAC
Membership Criteria Maximum landholding of half an acre of land; at least one household member must work for wages. One household member allowed per household. Since 1992 one member allowed per household.
Group Features 3,040 members form village organizations. Village organizations are divided into solidarity groups of 57 members. Separate groups for men and women. Each men’s group has a counterpart women’s group. Weekly meetings of solidarity groups.
Savings Mobilization Tk 2 per week. 4 percent of each loan (nonrefundable) goes to group insurance. 1 percent of each loan used for group insurance.
Credit Delivery Mechanism No collateral but group liability. 50-week installment of loan. Interest at the end of the loan cycle. 20 percent interest for production loans. Maximum loan Tk 10,000
Social Development Training duration 36 months. Review of code of conduct at village organization meetings. Substantial skills-based training.
Source: Khandker and Khalily 1996; Khandker, Khalily, and Khan 1995; Khan and Khalily 1995
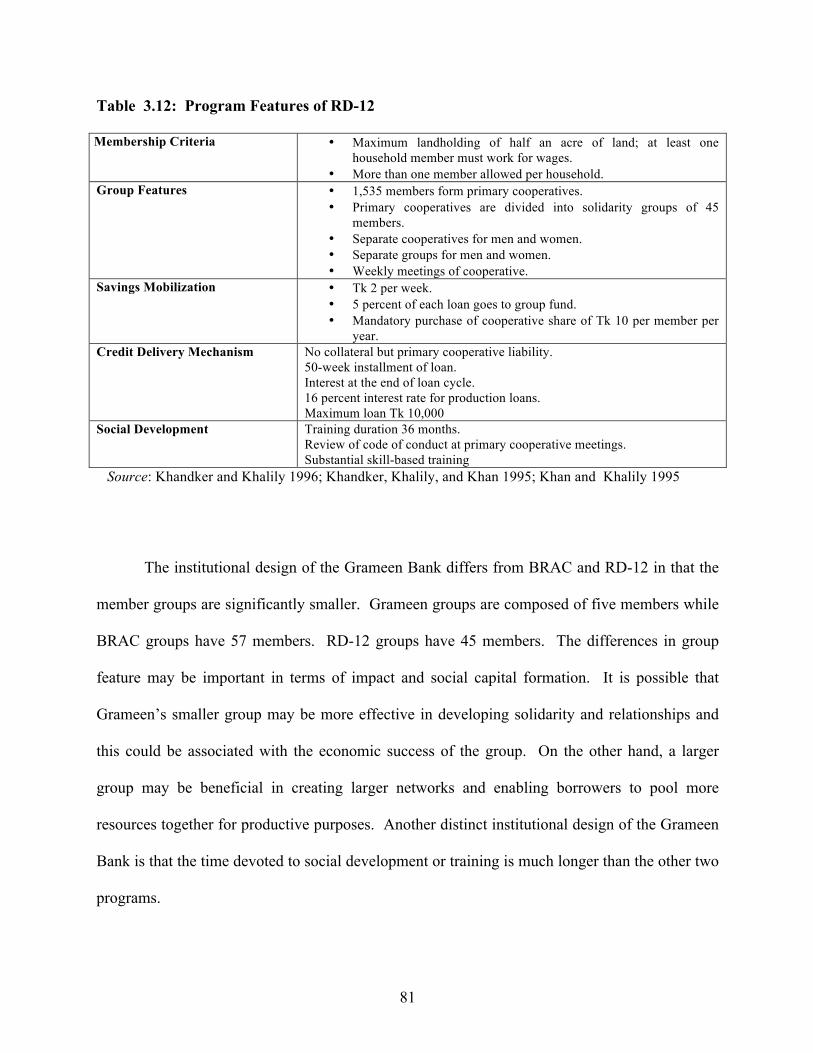
81
Table 3.12: Program Features of RD-12
Membership Criteria • Maximum landholding of half an acre of land; at least one household member must work for wages.
• More than one member allowed per household. Group Features • 1,535 members form primary cooperatives.
• Primary cooperatives are divided into solidarity groups of 45 members.
• Separate cooperatives for men and women. • Separate groups for men and women. • Weekly meetings of cooperative.
Savings Mobilization • Tk 2 per week. • 5 percent of each loan goes to group fund. • Mandatory purchase of cooperative share of Tk 10 per member per
year. Credit Delivery Mechanism No collateral but primary cooperative liability.
50-week installment of loan. Interest at the end of loan cycle. 16 percent interest rate for production loans. Maximum loan Tk 10,000
Social Development Training duration 36 months. Review of code of conduct at primary cooperative meetings. Substantial skill-based training
Source: Khandker and Khalily 1996; Khandker, Khalily, and Khan 1995; Khan and Khalily 1995
The institutional design of the Grameen Bank differs from BRAC and RD-12 in that the
member groups are significantly smaller. Grameen groups are composed of five members while
BRAC groups have 57 members. RD-12 groups have 45 members. The differences in group
feature may be important in terms of impact and social capital formation. It is possible that
Grameen’s smaller group may be more effective in developing solidarity and relationships and
this could be associated with the economic success of the group. On the other hand, a larger
group may be beneficial in creating larger networks and enabling borrowers to pool more
resources together for productive purposes. Another distinct institutional design of the Grameen
Bank is that the time devoted to social development or training is much longer than the other two
programs.
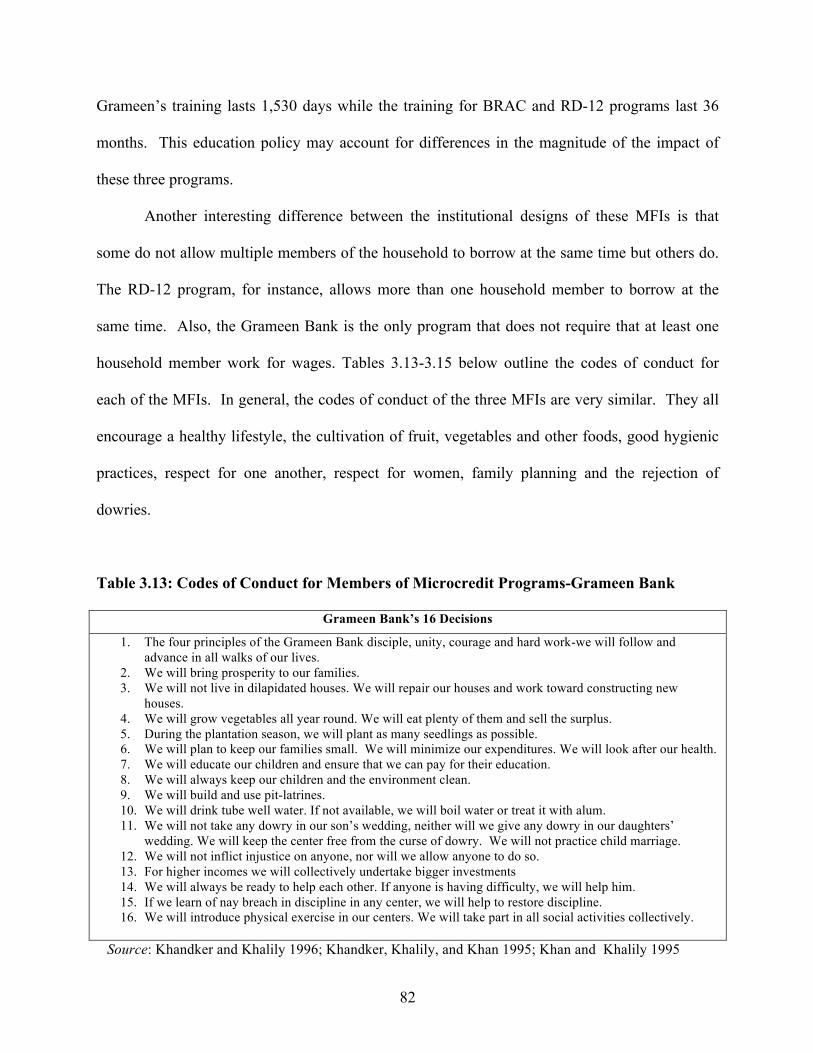
82
Grameen’s training lasts 1,530 days while the training for BRAC and RD-12 programs last 36
months. This education policy may account for differences in the magnitude of the impact of
these three programs.
Another interesting difference between the institutional designs of these MFIs is that
some do not allow multiple members of the household to borrow at the same time but others do.
The RD-12 program, for instance, allows more than one household member to borrow at the
same time. Also, the Grameen Bank is the only program that does not require that at least one
household member work for wages. Tables 3.13-3.15 below outline the codes of conduct for
each of the MFIs. In general, the codes of conduct of the three MFIs are very similar. They all
encourage a healthy lifestyle, the cultivation of fruit, vegetables and other foods, good hygienic
practices, respect for one another, respect for women, family planning and the rejection of
dowries.
Table 3.13: Codes of Conduct for Members of Microcredit Programs-Grameen Bank
Grameen Bank’s 16 Decisions
1. The four principles of the Grameen Bank disciple, unity, courage and hard work-we will follow and advance in all walks of our lives.
2. We will bring prosperity to our families. 3. We will not live in dilapidated houses. We will repair our houses and work toward constructing new
houses. 4. We will grow vegetables all year round. We will eat plenty of them and sell the surplus. 5. During the plantation season, we will plant as many seedlings as possible. 6. We will plan to keep our families small. We will minimize our expenditures. We will look after our health. 7. We will educate our children and ensure that we can pay for their education. 8. We will always keep our children and the environment clean. 9. We will build and use pit-latrines. 10. We will drink tube well water. If not available, we will boil water or treat it with alum. 11. We will not take any dowry in our son’s wedding, neither will we give any dowry in our daughters’
wedding. We will keep the center free from the curse of dowry. We will not practice child marriage. 12. We will not inflict injustice on anyone, nor will we allow anyone to do so. 13. For higher incomes we will collectively undertake bigger investments 14. We will always be ready to help each other. If anyone is having difficulty, we will help him. 15. If we learn of nay breach in discipline in any center, we will help to restore discipline. 16. We will introduce physical exercise in our centers. We will take part in all social activities collectively.
Source: Khandker and Khalily 1996; Khandker, Khalily, and Khan 1995; Khan and Khalily 1995

83
Table 3.14: Code of Conduct for Members of Microcredit Programs: BRAC BRAC’s 17 Promises
1. We will not engage in malpractice or injustice. 2. We will work hard and bring prosperity to our family. 3. We will send our children to school. 4. We will adopt family planning and keep our family size small. 5. We will try to be clean and keep our house tidy. 6. We will always drink pure water. 7. We will not keep our food uncovered and will wash our hand and face before we take our meal. 8. We will construct latrines and will not leave our stool where it does not belong. 9. We will cultivate vegetables and trees in and around our house. 10. We will try to help each other under all circumstances. 11. We will fight against polygamy and injustices to our wives and all women. 12. We will be loyal to the organization and abide by its rules and regulations. 13. We will not sign anything without having a good understanding of what it means (we will look carefully
before we act). 14. We will attend weekly meetings regularly and on time. 15. We will always abide by the decisions of the weekly group meetings. 16. We will regularly deposit our weekly savings. 17. If we receive a loan we will repay it.
Source: Khandker and Khalily 1996; Khandker, Khalily, and Khan 1995; Khan and Khalily 1995
Table 3.15: Code of Conduct for Members of Microfinance Programs: RD-12
RD-12’s 21 Oaths
1. We will remain united. 2. We will be sincere and sympathetic toward all. 3. We will follow the principles of the cooperatives. 4. We will strive for development through work and sincerity. 5. We will educate ourselves and send our children to school. 6. We will adopt family planning methods. 7. We will drink boiled water and use hygienic toilets. 8. We will fight against polygamy and the abuse of women. 9. We will save a part of our income and deposit it with the society. 10. We will take loans from the society and strive to increase our incomes 11. We will not ask for aid from anybody. 12. We will not run after relief. 13. We will not be lazy. 14. We will not remain illiterate. 15. We will not sign paper without reading it. 16. We will not give or take any dowry. 17. We will not have very large families. 18. We will not break the rules and discipline of the cooperative societies 19. We will not delay repayments of loan installments. 20. We will not listen to bad advice from mischievous persons. 21. We will not allow our organizations to be damaged in any way.
Source: Khandker and Khalily 1996; Khandker, Khalily, and Khan 1995; Khan and Khalily 1995
84
9. Results: Impact by Type of Institution and by Policy
The results from the household FE estimation of equation (3) (presented in Table 3.16
for the Grameen Bank) are consistent with the results from the regressions in chapter 2. The
results show that as expected, the coefficients for labor assets (i.e. number of adults in
household), and infrastructure (i.e. electricity present in village) are positive and statistically
significant. These results are consistent with Amartya Sen’s contention that the provision of
adequate economic facilities such as banks and good infrastructure are instrumental in the
process of development (Sen, 1999, p. 10, 37).
According to the results presented in Table 3.16, microcredit borrowing from Grameen,
similarly to the results obtained in chapter 2, benefits both male and female and borrowers in the
household. Previous studies using this data-set (outside of this dissertation) found that the
benefits of microcredit borrowing accrued disproportionately to women rather than men (see Pitt
and Khandker (1998) and Khandker (2005). Based on the fixed-effect estimation of the impact
of Grameen credit, a 10 percent increase in the period 1998/99 stock of female borrowing from
the Grameen Bank, increases per capita income by about .5 percent for women and .8 percent for
men (see regression 2).
The coefficients for the policy variables are not statistically significant across all
programs, and policy effects differ from program to program (see Tables 3.16-3.18). For the
Grameen bank, primary health care, basic literacy and skill training services have a statistically
significant effect on household income. Marketing training and other services are not typically
emphasized with the issue of Grameen credit and a reduction of these two services can be traced
over the two period (see Table 3.7). In this context, it makes sense that these two policy
variables do not have a statistically significant effect on household outcome.
85
Table 3.16: Household Fixed-Effects Estimates of the Impact of Grameen Credit and Capability-Enhancing Services on Household Income
(1) (2) (3) (4) (5) VARIABLES lnincome lnincome lnincome lnincome lnincome Primary Health
Care Basic
Literacy Marketing Training
Skill Training
Other Services
Number of adults in Household (15-59yrs.)
0.183** 0.202*** 0.193*** 0.187*** 0.197***
(0.0710) (0.0696) (0.0694) (0.0690) (0.0691) Avg. years of education of household adults
0.0487 0.0417 0.0401 0.0457 0.0386
(0.0462) (0.0457) (0.0460) (0.0450) (0.0458) Bank in village (dummy) 0.176 0.164 0.201 0.158 0.193 (0.165) (0.165) (0.173) (0.168) (0.164) Electricity in village (dummy) 0.398** 0.433** 0.329* 0.291 0.327* (0.192) (0.207) (0.193) (0.192) (0.191) Log of women’s loans from Grameen, (t)
0.0457 0.0568* 0.0623* 0.0504 0.0628*
(0.0341) (0.0335) (0.0339) (0.0331) (0.0344) Log of women’s loans from Grameen, (t-1)
0.0234 0.0172 0.00943 -0.0110 0.00859
(0.0461) (0.0464) (0.0454) (0.0440) (0.0462) Log of men’s loans from Grameen, (t)
0.0730* 0.0820** 0.0910** 0.0609 0.0933**
(0.0391) (0.0394) (0.0399) (0.0400) (0.0403) Log of men’s loans from Grameen, (t-1)
0.0883* 0.0840 0.0800 0.0444 0.0803
(0.0529) (0.0536) (0.0530) (0.0514) (0.0537) Primary Health Care (dummy) 0.438*** (0.161) Basic Literacy (dummy) 0.297* (0.154) Marketing Training (dummy) 0.0989 (0.141) Skill Training (dummy) 0.575*** (0.161) Other Services (dummy) -0.168 (0.206) Observations 878 878 878 878 878 Number of hhcode 439 439 439 439 439 F-statistics 18.70 19.36 18.38 19.72 18.62 Prob > F 0.0000 0.0000 0.0000 0.0000 0.0000 *t-statistic is significant at the 10 percent level of better **t-statistic is significant at the 5 percent level of better ***t-statistic is significant at the 1 percent or better
Note: Robust standard errors are in parentheses. Regressions also controlled for the following: sex, age, education, year dummy, village level infrastructure and price variables to account for the impact of time-varying changes in local economic conditions. Source: Author’s computations based on 1991/92 and 1998/99 household surveys in Bangladesh.
86
In terms of the effect of BRAC loans on household income, consistent with earlier
results, only the men benefit from this credit (See Table 3.17). The coefficients for the loans
disbursed to women by BRAC are not statistically significant. The results suggest that a 10
percent increase in the period 1998/99 stock of male borrowing from BRAC, increases per capita
income by 1.6 percent. Loans disbursed to men in the earlier period (t-1) also had a positive and
statistically significant effect on household per capital income. In this period, a 10 percent
increase in the stock of male borrowing from BRAC, increases per capita income by 1.7 percent
(see Table 3.17).
As discussed previously, the institutional design of each of the MFIs in this study is
different in some aspects and this can have an impact on household outcomes. According to the
results, credit has differential effects in terms of gender and the distinct institutional design of the
MFIs may play a role in the impact of credit. BRAC for instance, has larger solidarity groups as
compared to Grameen. BRAC has solidarity groups of 57 members compared to Grameen
groups of five members. It is possible, that group size matters in terms of the impact credit will
have on household outcomes. Another distinct feature of BRAC is that membership requires that
at least one household member work for wages. This feature can serve as collateral for
borrowing and as such, borrowers from this institution will have to provide collateral as a
condition for borrowing. The requirement of wage labor can potentially reduce the time for
entrepreneurship and as such, the return of credit to the household may not be large enough to
contribute to poverty reduction (income) in a significant way. Finally, BRAC contributes
significantly less time for social development than Grameen does.
87
Table 3.17: Household Fixed-Effects Estimates of the Impact of BRAC Credit and Capability-Enhancing Services on Household Income (1) (2) (3) (4) (5) VARIABLES lnincome lnincome lnincome lnincome lnincome Primary Health
Care Basic
Literacy Marketing Training
Skill Training
Other Services
Number of adults in Household (15-59yrs.) 0.252** 0.260** 0.254** 0.262** 0.259** (0.105) (0.106) (0.107) (0.105) (0.105) Avg. years of education of household adults -0.000297 -0.00348 -0.00181 -0.00252 -0.00268 (0.0596) (0.0598) (0.0598) (0.0599) (0.0599) Bank in village (dummy) -0.535 -0.500 -0.506 -0.496 -0.488 (0.433) (0.428) (0.431) (0.425) (0.425) Electricity in village (dummy) 0.699** 0.693** 0.685** 0.697** 0.690** (0.275) (0.277) (0.278) (0.277) (0.276) Log of women’s loans from BRAC, (t) -0.00792 -0.00911 -0.0107 -0.00775 -0.00667 (0.0389) (0.0391) (0.0394) (0.0392) (0.0396) Log of women’s loans from BRAC, (t-1) 0.0325 0.0148 0.0152 0.0173 0.0151 (0.0679) (0.0670) (0.0653) (0.0650) (0.0649) Log of men’s loans from BRAC, (t) 0.155** 0.165** 0.165** 0.165** 0.161** (0.0689) (0.0704) (0.0694) (0.0708) (0.0708) Log of men’s loans from BRAC, (t-1) 0.174** 0.175** 0.175** 0.175** 0.168** (0.0739) (0.0750) (0.0743) (0.0755) (0.0771) Primary Health Care (dummy) 0.198 (0.198) Basic Literacy (dummy) -0.0366 (0.184) Marketing Training (dummy) 0.163 (0.306) Skill Training (dummy) -0.0383 (0.188) Other Services (dummy) -0.108 (0.262) Observations 668 668 668 668 668 Number of hhcode 338 338 338 338 338 F-statistics 8.69 8.59 8.69 8.70 8.55 Prob > F 0.0000 0.0000 0.0000 0.0000 0.0000 *t-statistic is significant at the 10 percent level of better, **t-statistic is significant at the 5 percent level of better, ***t-statistic is significant at the 1 percent or better
Note: Robust standard errors are in parentheses. Source: Author’s computations based on 1991/92 and 1998/99 household surveys in Bangladesh.
In terms of social development services, the duration of training is 36 month for BRAC
compared to 51 months in the Grameen program. Since women in Bangladesh generally have
less access to education than men, it is possible that the length of training makes a difference in
terms of the impact credit has household outcomes.
88
For the BRAC program, none of the policy variables are statistically significant despite their
increase of most of these services over the two periods. This result seems counterintuitive but as
previously noted, the institutional design and credit delivery of the MFI can play an important
role in the magnitude of overall program impact. This fact, can contribute to the differential
impacts we observe here.
In terms of the RD-12 program, consistent with the earlier results in chapter 2, the
coefficients of the credit variables for this program were not statistically significant (see Tables
18). The institutional design of the RD-12 program is that of a cooperative that requires
members to both contribute five percent of each loan to a group fund and mandatory purchase of
cooperative shares. Similarly to BRAC, this MFI requires that one household member work for
wage labor and large solidarity groups. It is possible that for very poor borrowers both the
requirement of wage labor and the purchase of shares may not be adequate. Both requirements
can impose burdens that may not be conducive to income generation at the household level. In
this context, the larger retention of the borrowed funds by the institution while it increases
savings, it reduces the amount of funds the borrower can invest in productive activities.
In the case of the RD-12 program, basic literacy services, skill training and other
services have a positive and statistically significant effect on household outcome (see Table
3.18). While none of the credit variables in the regression for RD-12 were statistically
significant, the results suggest that capability-enhancing policies play an important role in
income generation. This result highlights the possibility of complementarities between access to
credit and access to services. The insignificant result for marketing training could be due to the
small percentage of households that receive this service in the sample.
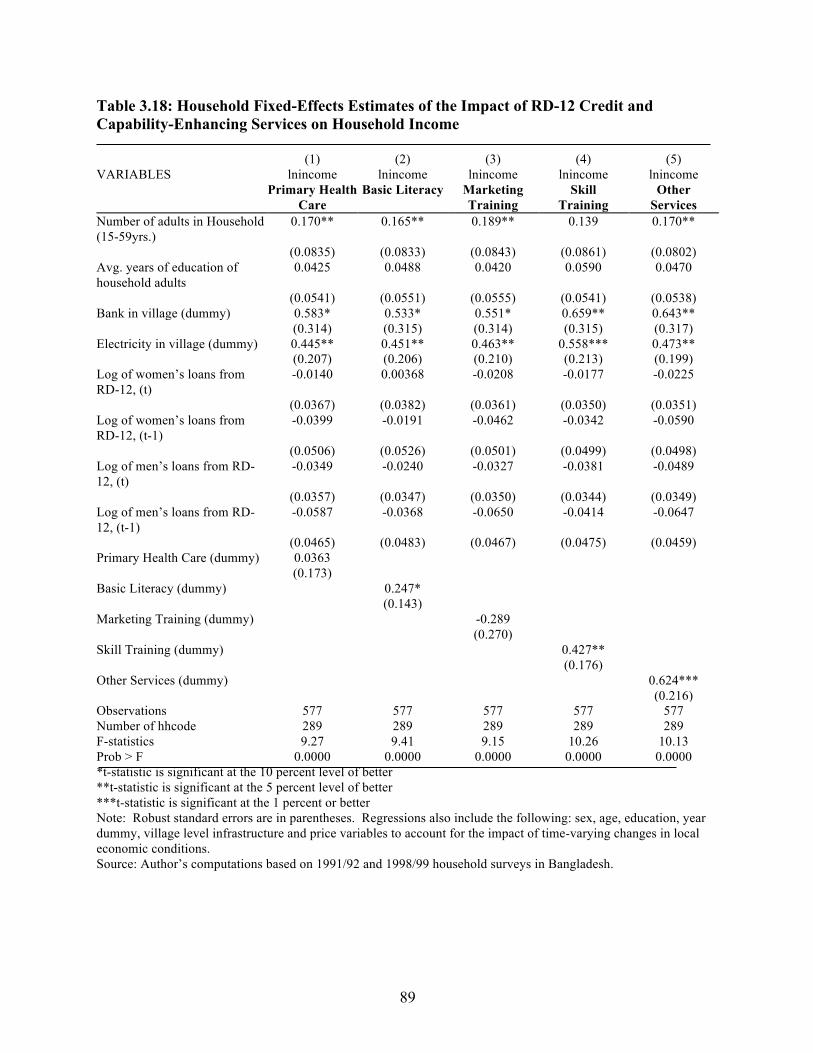
89
Table 3.18: Household Fixed-Effects Estimates of the Impact of RD-12 Credit and Capability-Enhancing Services on Household Income (1) (2) (3) (4) (5) VARIABLES lnincome lnincome lnincome lnincome lnincome Primary Health
Care Basic Literacy Marketing
Training Skill
Training Other
Services Number of adults in Household (15-59yrs.)
0.170** 0.165** 0.189** 0.139 0.170**
(0.0835) (0.0833) (0.0843) (0.0861) (0.0802) Avg. years of education of household adults
0.0425 0.0488 0.0420 0.0590 0.0470
(0.0541) (0.0551) (0.0555) (0.0541) (0.0538) Bank in village (dummy) 0.583* 0.533* 0.551* 0.659** 0.643** (0.314) (0.315) (0.314) (0.315) (0.317) Electricity in village (dummy) 0.445** 0.451** 0.463** 0.558*** 0.473** (0.207) (0.206) (0.210) (0.213) (0.199) Log of women’s loans from RD-12, (t)
-0.0140 0.00368 -0.0208 -0.0177 -0.0225
(0.0367) (0.0382) (0.0361) (0.0350) (0.0351) Log of women’s loans from RD-12, (t-1)
-0.0399 -0.0191 -0.0462 -0.0342 -0.0590
(0.0506) (0.0526) (0.0501) (0.0499) (0.0498) Log of men’s loans from RD-12, (t)
-0.0349 -0.0240 -0.0327 -0.0381 -0.0489
(0.0357) (0.0347) (0.0350) (0.0344) (0.0349) Log of men’s loans from RD-12, (t-1)
-0.0587 -0.0368 -0.0650 -0.0414 -0.0647
(0.0465) (0.0483) (0.0467) (0.0475) (0.0459) Primary Health Care (dummy) 0.0363 (0.173) Basic Literacy (dummy) 0.247* (0.143) Marketing Training (dummy) -0.289 (0.270) Skill Training (dummy) 0.427** (0.176) Other Services (dummy) 0.624*** (0.216) Observations 577 577 577 577 577 Number of hhcode 289 289 289 289 289 F-statistics 9.27 9.41 9.15 10.26 10.13 Prob > F 0.0000 0.0000 0.0000 0.0000 0.0000 *t-statistic is significant at the 10 percent level of better **t-statistic is significant at the 5 percent level of better ***t-statistic is significant at the 1 percent or better
Note: Robust standard errors are in parentheses. Regressions also include the following: sex, age, education, year dummy, village level infrastructure and price variables to account for the impact of time-varying changes in local economic conditions. Source: Author’s computations based on 1991/92 and 1998/99 household surveys in Bangladesh.
90
The results obtained for policy effects in all of the regressions for all of the three
programs suggest that for the most part, policies that are instrumental in expanding the capability
set and/or the social and economic prosperity of an individual play an important role in economic
development. In the case of using microcredit as a tool to reduce poverty, this study suggests
that both access to credit and the provision of capability-enhancing services are positively
associated with poverty reduction at the household-level. The findings in this study suggest that
Grameen credit is associated with a positive impact on household economic outcomes and that
Grameen loans are more effective in alleviating poverty than the credit disbursed by similar
programs such as BRAC and RD-12. This result and implication is not new in the literature.
Other impact studies on these same programs obtained similar results (see Pitt and Khandker,
1998 and Khandker, 2005).
A reason for the observed contrast in program impacts could stem from the fact that each
program, while similar in institutional design, is different with respect to group features,
membership criteria and social development policies (see tables 3.10-3.15). These differences
can influence program impacts and make some programs more effective than others. In terms of
the effect or correlation between the services provided by all three programs, the results suggest
a positive correlation between many of the services and income growth at the household-level.34
So far, the results in this study suggest that independently of one another, microcredit and
MFI services are positively associated with increases in income. In the next section, I would like
to conduct an experiment to see if the simultaneous provision of credit and capability-enhancing
services, have any effect on the economic outcome of the household.
34 Dummies for each policy variable were estimated separately to avoid multicollinearity and other issues that may arise with using dummy variables and having too many independent variables.
91
The objective here is to explore whether there are any complementarities or interconnections
between microcredit and the provision of services. Looking into this interaction would help
policymakers implement effective credit delivery methods .
10. Results: Analysis of the Effect of Microcredit and Capability-Enhancing Services The regression model in equation (9) was estimated separately for each of the
microcredit programs. Similarly to the results presented in the previous section, the credit
coefficients for BRAC are only statistically significant for the stock of credit disbursed to male
borrowers but not to female borrowers. The credit coefficients for the RD-12 program were not
statistically significant. One feature of the MLR model is that even though the coefficient of the
relevant variables are not statistically significant on their own, once subjected to a set of
conditions, this variable may gain statistical significance. This feature highlights the conditional
hypothesis concept presented in Section 7. In other words, the coefficient for microcredit, M,
may be statistically insignificant when the condition Z= 0 or namely, when capability-enhancing
services are absent. However, the effect of microcredit on household income Y may become
statistically significant when Z= 1 or when the policies or services are in place. Another possible
outcome which is observed in the results, is that the coefficient for microcredit, M is statistically
significant on its own (Z= 0) but becomes larger when Z= 1.
In the spirit of the MLR model and to remain consistent with the language of Bramber,
Clark and Golder (2005), I will limit my interpretation of the results to a discussion about the
empirical associations between the variables and the marginal effects on the dependent variable.
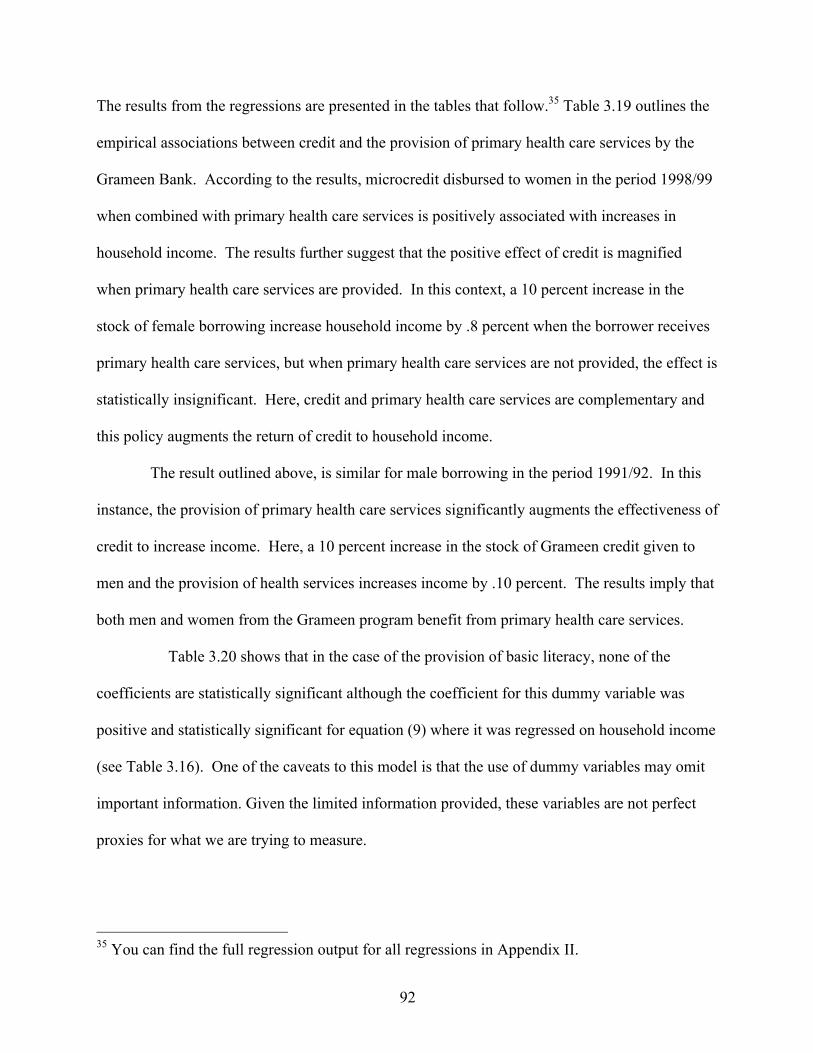
92
The results from the regressions are presented in the tables that follow.35 Table 3.19 outlines the
empirical associations between credit and the provision of primary health care services by the
Grameen Bank. According to the results, microcredit disbursed to women in the period 1998/99
when combined with primary health care services is positively associated with increases in
household income. The results further suggest that the positive effect of credit is magnified
when primary health care services are provided. In this context, a 10 percent increase in the
stock of female borrowing increase household income by .8 percent when the borrower receives
primary health care services, but when primary health care services are not provided, the effect is
statistically insignificant. Here, credit and primary health care services are complementary and
this policy augments the return of credit to household income.
The result outlined above, is similar for male borrowing in the period 1991/92. In this
instance, the provision of primary health care services significantly augments the effectiveness of
credit to increase income. Here, a 10 percent increase in the stock of Grameen credit given to
men and the provision of health services increases income by .10 percent. The results imply that
both men and women from the Grameen program benefit from primary health care services.
Table 3.20 shows that in the case of the provision of basic literacy, none of the
coefficients are statistically significant although the coefficient for this dummy variable was
positive and statistically significant for equation (9) where it was regressed on household income
(see Table 3.16). One of the caveats to this model is that the use of dummy variables may omit
important information. Given the limited information provided, these variables are not perfect
proxies for what we are trying to measure.
35 You can find the full regression output for all regressions in Appendix II.
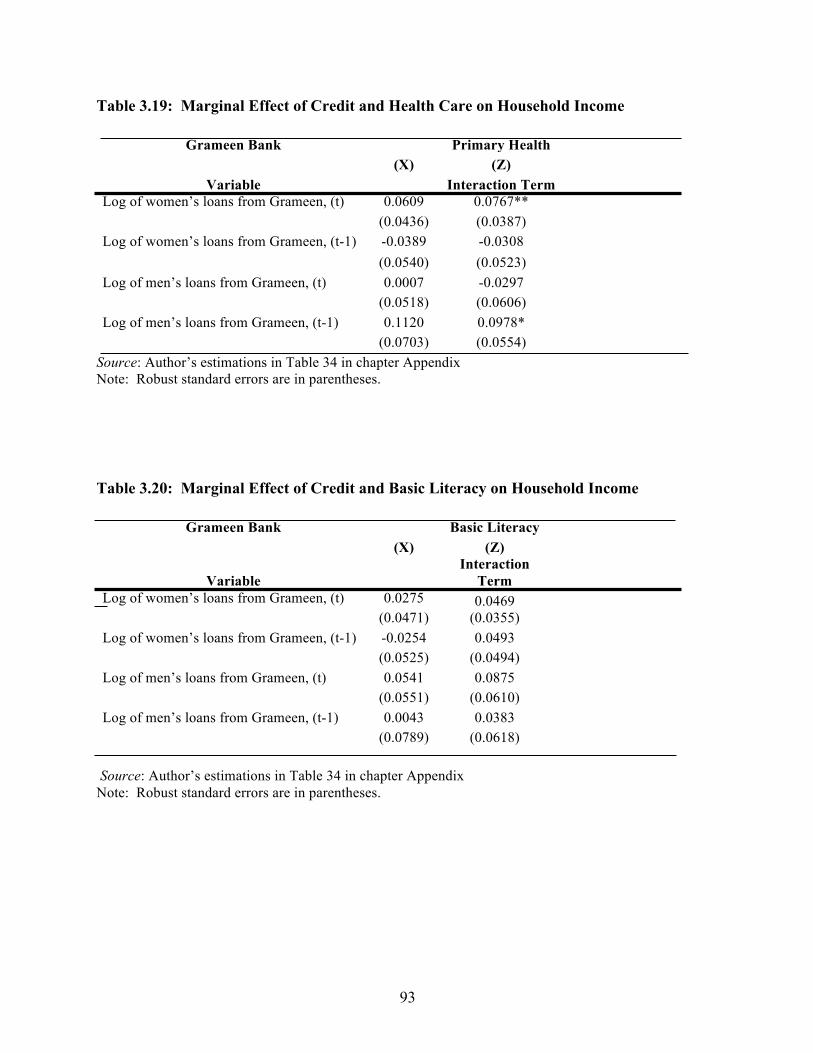
93
Table 3.19: Marginal Effect of Credit and Health Care on Household Income
Grameen Bank
Primary Health
(X) (Z)
Variable
Interaction Term Log of women’s loans from Grameen, (t) 0.0609 0.0767** (0.0436) (0.0387) Log of women’s loans from Grameen, (t-1) -0.0389 -0.0308 (0.0540) (0.0523) Log of men’s loans from Grameen, (t) 0.0007 -0.0297 (0.0518) (0.0606) Log of men’s loans from Grameen, (t-1) 0.1120 0.0978*
(0.0703) (0.0554) Source: Author’s estimations in Table 34 in chapter Appendix
Note: Robust standard errors are in parentheses. Table 3.20: Marginal Effect of Credit and Basic Literacy on Household Income
Grameen Bank
Basic Literacy
(X) (Z)
Variable
Interaction Term
Log of women’s loans from Grameen, (t) 0.0275 0.0469 (0.0471) (0.0355) Log of women’s loans from Grameen, (t-1) -0.0254 0.0493 (0.0525) (0.0494) Log of men’s loans from Grameen, (t) 0.0541 0.0875 (0.0551) (0.0610) Log of men’s loans from Grameen, (t-1) 0.0043 0.0383
(0.0789) (0.0618)
Source: Author’s estimations in Table 34 in chapter Appendix Note: Robust standard errors are in parentheses.
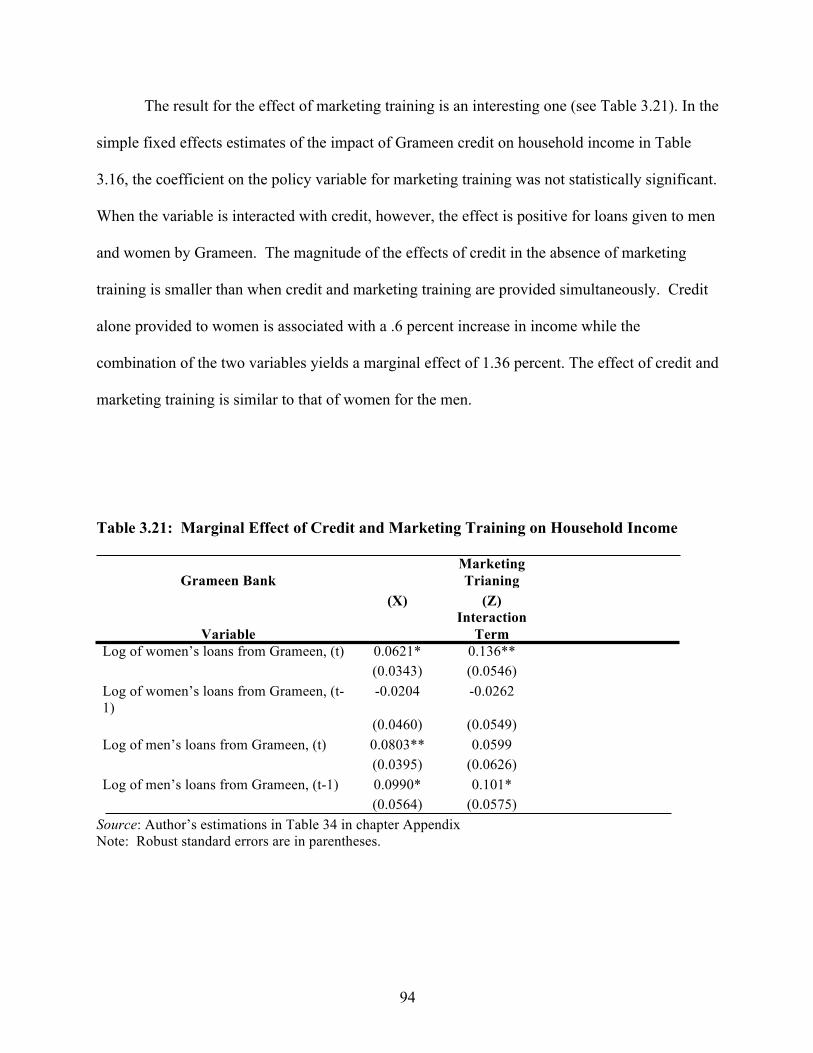
94
The result for the effect of marketing training is an interesting one (see Table 3.21). In the
simple fixed effects estimates of the impact of Grameen credit on household income in Table
3.16, the coefficient on the policy variable for marketing training was not statistically significant.
When the variable is interacted with credit, however, the effect is positive for loans given to men
and women by Grameen. The magnitude of the effects of credit in the absence of marketing
training is smaller than when credit and marketing training are provided simultaneously. Credit
alone provided to women is associated with a .6 percent increase in income while the
combination of the two variables yields a marginal effect of 1.36 percent. The effect of credit and
marketing training is similar to that of women for the men.
Table 3.21: Marginal Effect of Credit and Marketing Training on Household Income
Grameen Bank
Marketing Trianing
(X) (Z)
Variable
Interaction Term
Log of women’s loans from Grameen, (t) 0.0621* 0.136** (0.0343) (0.0546) Log of women’s loans from Grameen, (t-
1) -0.0204 -0.0262
(0.0460) (0.0549) Log of men’s loans from Grameen, (t) 0.0803** 0.0599 (0.0395) (0.0626) Log of men’s loans from Grameen, (t-1) 0.0990* 0.101*
(0.0564) (0.0575) Source: Author’s estimations in Table 34 in chapter Appendix
Note: Robust standard errors are in parentheses.

95
According to the results in Table 3.22, skill training is a service and or policy that seems
to complement credit in a positive way but the results are not statistically significant. Similar to
previous results, loans given to women borrowers by the Grameen Bank are associated with
increases in household income independent of skill training, although the training interaction
term is positively correlated with income but not statistically significant. A 10 percent increase
in the stock of current credit given to women by the Grameen bank, increase household income
by .8 percent.
Table 3.22: Marginal Effect of Credit and Skill Training on Household Income
Skill Training
Grameen Bank
(X) (Z)
Variable
Interaction Term
Log of women’s loans from Grameen, (t) 0.0860* 0.0475 (0.0519) (0.0436) Log of women’s loans from Grameen, (t-
1) -0.0141 -0.0554
(0.0479) (0.0459) Log of men’s loans from Grameen, (t) 0.0991 0.0377 (0.0711) (0.0618) Log of men’s loans from Grameen, (t-1) 0.0509 -0.0563 (0.0749) (0.0674) Source: Author’s estimations in Table 34 in chapter Appendix
Note: Robust standard errors are in parentheses.
96
The effect of providing “other services” is somewhat puzzling. From looking at Table
3.7 presented previously, one trend to observe in the two periods is that all of the three MFI
significantly reduced the provision of other services. As noted earlier, one caveat of using
dummy variables to represent services is that we are bound to omit important information. In
terms of the services in this category, it is possible that the three MFIs shifted their services to
more specific services like skill training for example. In this case, it is possible that the
provision of some general services is reduced in order to release resources for the provision of
more specific services like education and job related training.
An interesting result is observed for the interaction effect of Grameen credit and other
services (see Table 3.23). For credit disbursed to women in the earlier period, the provision of
other services augmented the effectiveness of past loans in increasing income. Without these
services, the effect of credit on household income is statistically insignificant. However, when
this credit is complemented with other services, the increase in income becomes 1.4 percent and
this interaction effect is statistically significant. Loans disbursed in period 1998/99 alone are
associated with an increase in household income in the absence of other services.
The results for the provision of services by BRAC are interesting in terms of the
differential effects observed by gender (see Tables 3.24-3.28). Worth recalling is the fact that in
the simple regression (see Table 3.17) the coefficients for the credit variable for the men were
positive and statistically significant across different specifications of the model. Furthermore,
the variables for BRAC credit issued to men in both periods have the largest coefficients and
account for the greatest marginal impact (i.e. 1.8 percent ) on household income in terms of the
provision of just credit.
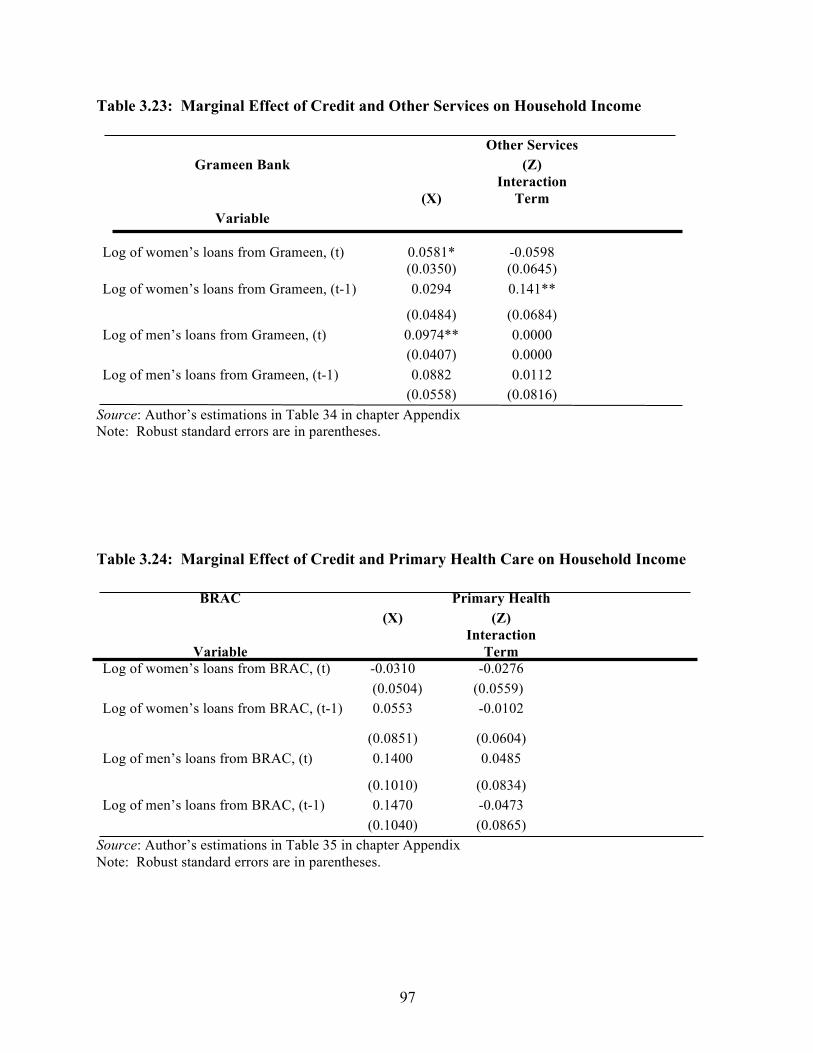
97
Table 3.23: Marginal Effect of Credit and Other Services on Household Income
Other Services
Grameen Bank
(Z)
(X)
Interaction Term
Variable
Log of women’s loans from Grameen, (t)
0.0581*
-0.0598 (0.0350) (0.0645) Log of women’s loans from Grameen, (t-1) 0.0294 0.141**
(0.0484) (0.0684) Log of men’s loans from Grameen, (t) 0.0974** 0.0000 (0.0407) 0.0000 Log of men’s loans from Grameen, (t-1) 0.0882 0.0112
(0.0558) (0.0816) Source: Author’s estimations in Table 34 in chapter Appendix
Note: Robust standard errors are in parentheses.
Table 3.24: Marginal Effect of Credit and Primary Health Care on Household Income
BRAC
Primary Health
(X) (Z)
Variable
Interaction Term
Log of women’s loans from BRAC, (t) -0.0310 -0.0276 (0.0504) (0.0559)
Log of women’s loans from BRAC, (t-1) 0.0553 -0.0102
(0.0851) (0.0604) Log of men’s loans from BRAC, (t) 0.1400 0.0485
(0.1010) (0.0834) Log of men’s loans from BRAC, (t-1) 0.1470 -0.0473
(0.1040) (0.0865)
Source: Author’s estimations in Table 35 in chapter Appendix Note: Robust standard errors are in parentheses.
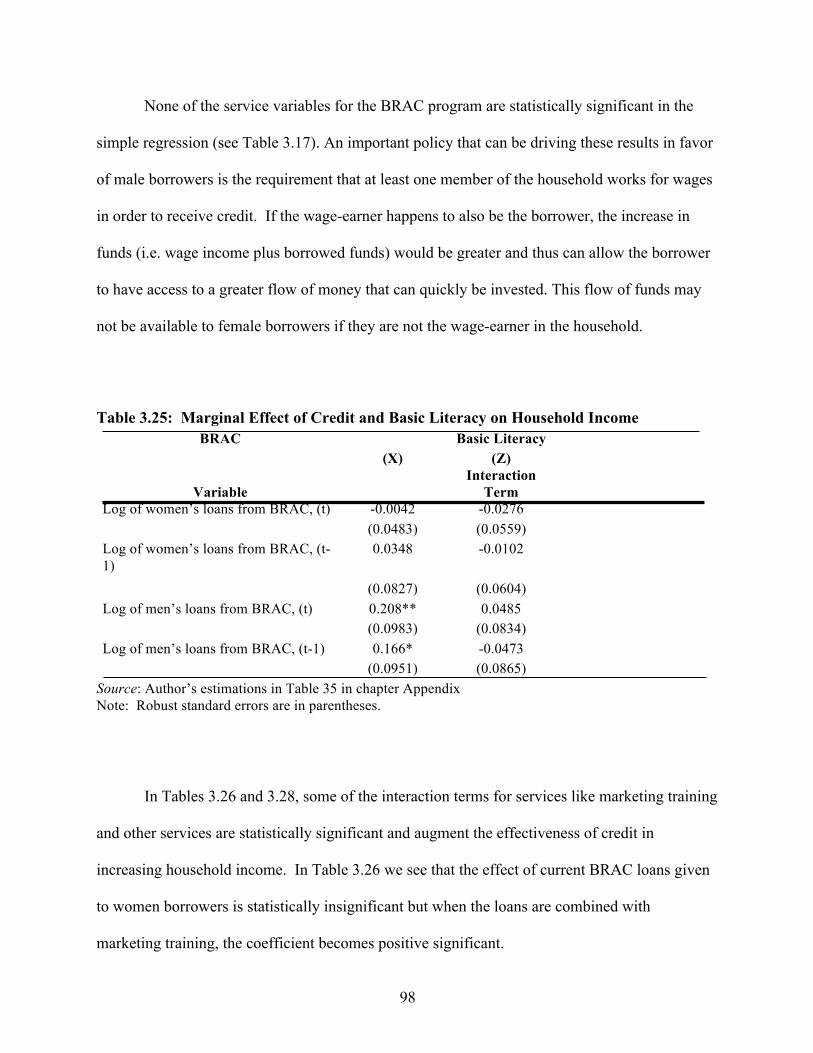
98
None of the service variables for the BRAC program are statistically significant in the
simple regression (see Table 3.17). An important policy that can be driving these results in favor
of male borrowers is the requirement that at least one member of the household works for wages
in order to receive credit. If the wage-earner happens to also be the borrower, the increase in
funds (i.e. wage income plus borrowed funds) would be greater and thus can allow the borrower
to have access to a greater flow of money that can quickly be invested. This flow of funds may
not be available to female borrowers if they are not the wage-earner in the household.
Table 3.25: Marginal Effect of Credit and Basic Literacy on Household Income
BRAC
Basic Literacy
(X) (Z)
Variable
Interaction Term
Log of women’s loans from BRAC, (t) -0.0042 -0.0276 (0.0483) (0.0559) Log of women’s loans from BRAC, (t-
1) 0.0348 -0.0102
(0.0827) (0.0604) Log of men’s loans from BRAC, (t) 0.208** 0.0485 (0.0983) (0.0834) Log of men’s loans from BRAC, (t-1) 0.166* -0.0473 (0.0951) (0.0865) Source: Author’s estimations in Table 35 in chapter Appendix
Note: Robust standard errors are in parentheses.
In Tables 3.26 and 3.28, some of the interaction terms for services like marketing training
and other services are statistically significant and augment the effectiveness of credit in
increasing household income. In Table 3.26 we see that the effect of current BRAC loans given
to women borrowers is statistically insignificant but when the loans are combined with
marketing training, the coefficient becomes positive significant.
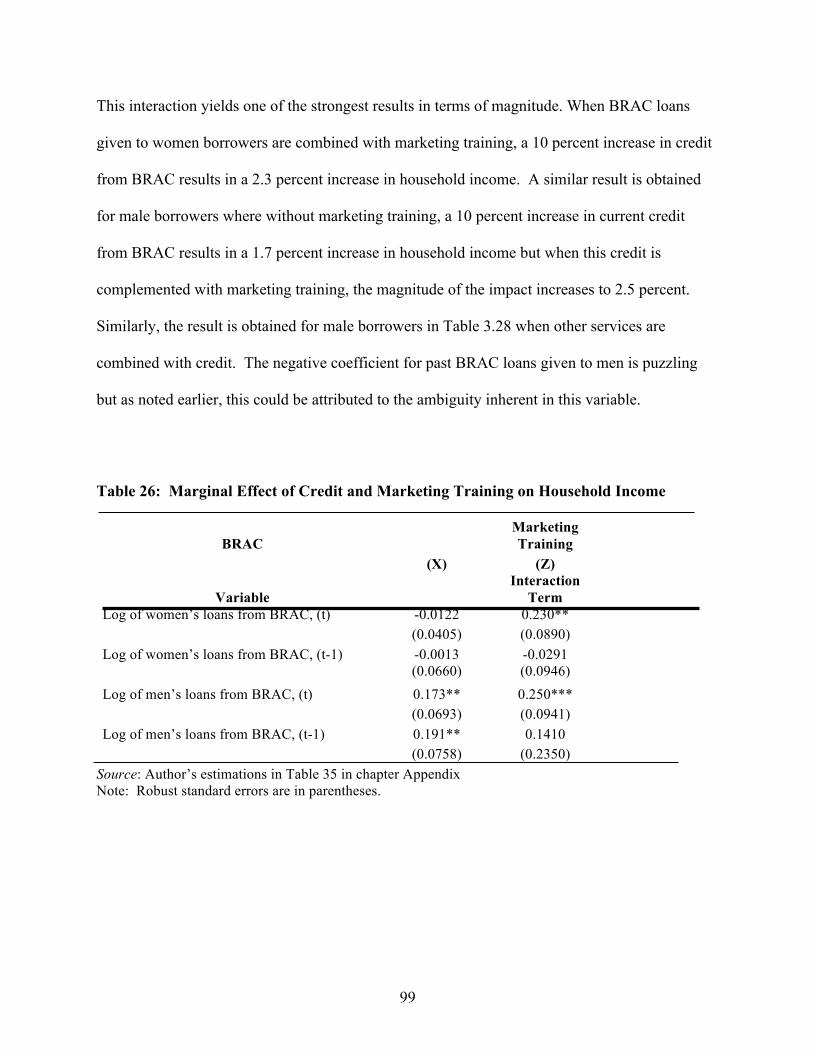
99
This interaction yields one of the strongest results in terms of magnitude. When BRAC loans
given to women borrowers are combined with marketing training, a 10 percent increase in credit
from BRAC results in a 2.3 percent increase in household income. A similar result is obtained
for male borrowers where without marketing training, a 10 percent increase in current credit
from BRAC results in a 1.7 percent increase in household income but when this credit is
complemented with marketing training, the magnitude of the impact increases to 2.5 percent.
Similarly, the result is obtained for male borrowers in Table 3.28 when other services are
combined with credit. The negative coefficient for past BRAC loans given to men is puzzling
but as noted earlier, this could be attributed to the ambiguity inherent in this variable.
Table 26: Marginal Effect of Credit and Marketing Training on Household Income
BRAC
Marketing Training
(X) (Z)
Variable
Interaction Term
Log of women’s loans from BRAC, (t) -0.0122 0.230** (0.0405) (0.0890) Log of women’s loans from BRAC, (t-1) -0.0013
(0.0660) -0.0291 (0.0946)
Log of men’s loans from BRAC, (t) 0.173** 0.250***
(0.0693) (0.0941)
Log of men’s loans from BRAC, (t-1) 0.191** 0.1410 (0.0758) (0.2350) Source: Author’s estimations in Table 35 in chapter Appendix
Note: Robust standard errors are in parentheses.

100
Table 3.27: Marginal Effect of Credit and Skill Training on Household Income
BRAC
Skill Training
(X) (Z)
Variable
Interaction Term
Log of women’s loans from BRAC, (t) -0.0228 -0.0131 (0.0484) (0.0532) Log of women’s loans from BRAC, (t-1) 0.0129 0.0283
(0.0714) (0.0483) Log of men’s loans from BRAC, (t) 0.173* 0.1020 (0.1050) (0.0846) Log of men’s loans from BRAC, (t-1) 0.1180 -0.0397 (0.1090) (0.0807) Source: Author’s estimations in Table 35 in chapter Appendix
Note: Robust standard errors are in parentheses. Table 3.28: Marginal Effect of Credit and Other Services on Household Income
BRAC
Other Services
(X) (Z)
Variable
Interaction Term
Log of women’s loans from BRAC, (t) -0.0197 0.0143 (0.0414) (0.0701) Log of women’s loans from BRAC, (t-1) -0.0185 -0.0549
(0.0694) (0.0806) Log of men’s loans from BRAC, (t) 0.133* 0.146**
(0.0753) (0.0655)
Log of men’s loans from BRAC, (t-1) 0.0524 -0.158*
(0.1030) (0.0833)
Source: Author’s estimations in Table 35 in chapter Appendix Note: Robust standard errors are in parentheses.
101
The coefficients for the RD-12 program credit variables are not statistically significant in
the simple regression (see Table 3.18). The same holds for the most part for the interaction term
model (see Table 3.36 in Appendix II). This result is consistent for both female and male
borrowers. In terms of the institutional design of RD-12 as an MFI, the structure of the
institution is that of a cooperative with large separate solidarity groups for men and women. As
previously noted, this institutional set up may be contributing to the different impact this credit
has as compared to other institutions like Grameen and BRAC. The requirement of a 5 percent
deposit to a group fund and the purchase of shares may be causing more saving than investment
and this can adversely impact the return on the funds borrowed and hence overall household
income. As noted earlier, one caveat of using dummy variables to represent policies is that we
could potentially omit important information. This omitted variable bias could be responsible for
the odd result observed for the impact of other services on household income. In Table 3.36, we
observe that the dummy variable for other services is positively associated with increases in
household income. However, when this dummy variable is interacted with past credit from RD-
12 obtained by male borrowers, the coefficient becomes negative. Both of these results are
statistically significant. One possible explanation could be that the services that are provided
alone are associated with increases in income but when combined with credit, they impact
income negatively. This negative effect could be explained by the fact that the services offered
may not be complementary to microcredit. It could be that the services offered are unrelated to
the activities microcredit tends to fund. In this case, a negative interaction effect is feasible.
The results presented in this section suggest that the provision of capability-enhancing
services, particularly, primary healthcare, basic literacy and skill training by the Grameen Bank
(See Table 3.16) contribute to increases in household income.
102
Similarly, basic literacy, skill training and other services provided by BRAC (See Table 3.18),
are associated with increasing the effectiveness of microcredit in increasing household income.
The results are robust which suggest that the policies employed by the MFIs matter and that
these policies can complement the effectiveness of microcredit in poverty reduction.
In terms of the stability of the results, one of the issues that arises with using interactions
in a multiple linear regression model is that the model tends to be vulnerable to spurious
multicollinearity. This issue can cause the coefficients of the variables to be unstable across
methods, which can complicate the interpretation of the results. To minimize the problems this
issue can cause, I carefully looked at the correlation matrix for each regression method used to
see if multicollinearity was an issue. In each correlation matrix, most correlations among the
predictors did not exceed .4 and the few that were .9 were dropped from the regression to see if
the results changed.
One possible way to further validate the results obtained in the study is to employ more
sophisticated econometric methods. With such methods, we may be able to make further sense
of the empirical relationship between the services provided by the MFI, credit and the overall
effect on household income. The employment of such methods is a goal that will be pursued in
future versions of this paper.
The fixed effects estimates presented in the tables above were used to calculate the
marginal returns to credit for selected capability-enhancing services (specifically the ones that
are statistically significant). The point stressed earlier in the discussion about the potential for
the services provided by the MFIs and NGOs to augment microcredit’s return to income is
observed here.
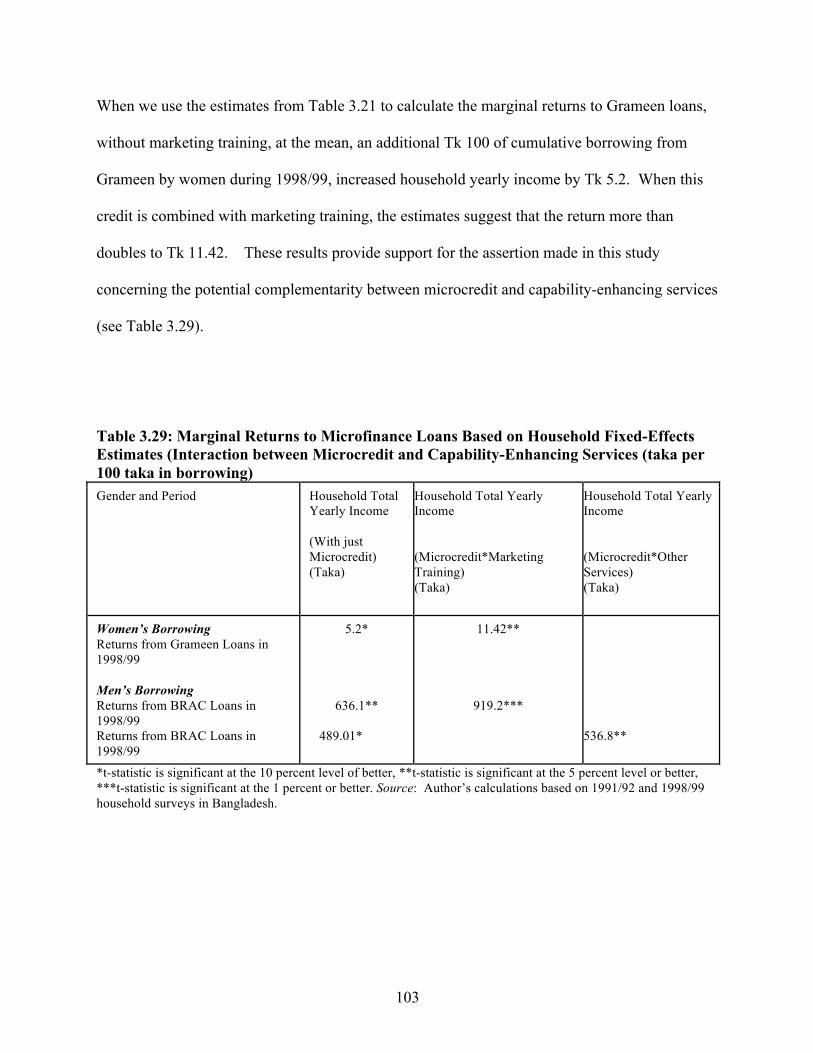
103
When we use the estimates from Table 3.21 to calculate the marginal returns to Grameen loans,
without marketing training, at the mean, an additional Tk 100 of cumulative borrowing from
Grameen by women during 1998/99, increased household yearly income by Tk 5.2. When this
credit is combined with marketing training, the estimates suggest that the return more than
doubles to Tk 11.42. These results provide support for the assertion made in this study
concerning the potential complementarity between microcredit and capability-enhancing services
(see Table 3.29).
Table 3.29: Marginal Returns to Microfinance Loans Based on Household Fixed-Effects Estimates (Interaction between Microcredit and Capability-Enhancing Services (taka per 100 taka in borrowing) Gender and Period Household Total
Yearly Income (With just Microcredit) (Taka)
Household Total Yearly Income (Microcredit*Marketing Training) (Taka)
Household Total Yearly Income (Microcredit*Other Services) (Taka)
Women’s Borrowing Returns from Grameen Loans in 1998/99 Men’s Borrowing Returns from BRAC Loans in 1998/99 Returns from BRAC Loans in 1998/99
5.2*
636.1**
489.01*
11.42**
919.2***
536.8**
*t-statistic is significant at the 10 percent level of better, **t-statistic is significant at the 5 percent level or better, ***t-statistic is significant at the 1 percent or better. Source: Author’s calculations based on 1991/92 and 1998/99 household surveys in Bangladesh.
104
Using the results observed from Tables 3.26 and 3.28 (tables presented earlier in the
text) for the male borrowers, at the mean, an additional Tk 100 of cumulative borrowing from
BRAC by men during 1998/99, increased household yearly income by Tk 636.1. When this
credit is complemented with marketing training, however, the marginal return increases to Tk
919.2 (see Table 3.29). Using the estimates from Table 3.28, we obtain a marginal return of Tk
489.01 for BRAC male borrowers during 1998/99, but when credit is combined with other
services, this return increases to Tk 536.8.
11. Conclusion Despite existing debate about the magnitude of the impact of microfinance on poverty
reduction, there is consensus in the literature that microfinance benefits the poor in many ways.
Such benefits range from reducing vulnerability to income shocks to empowering women and
increasing income and expenditures. Given these positive impacts, future research should be
geared towards finding ways to improve the effectiveness of microcredit in reducing poverty.
The capability approach to micro lending suggested in this study is one that advocates for more
provision of capability-enhancing services.
In the view of Amartya Sen, a view that is strongly supported throughout this
dissertation, the magnitude of development will be greater when development strategies are
complemented with the provision of “substantive” and “instrumental” freedoms. In terms of
using microcredit as a poverty reduction tool, a good point of departure should be to establish the
enabling conditions that allow the individual borrower as well as the funds that they borrow to
flourish.
105
This study attempts to initiate a probe into the empirical relationship between the
capability-enhancing services that MFIs provide and the effectiveness of credit in changing
household outcomes. These types of analyses are prevalent in the banking literature and
policymakers have benefited from learning about the impact of financial intermediation which is
inclusive of the services that banks provide. Microcredit can be considered a type of financial
intermediation in the rural sectors of poor countries and as such, the services that they provide
are expected to play a role in the overall impact of MFIs (Kaboski and Towsend, 2005).
The results presented in this study suggest that there is a positive association between
the issue of credit along with the provision of capability-enhancing services. Other key findings
in this study lead to interesting considerations for future research. Such considerations should
include the reasons why there may be differential gender impacts and why some services are
more effective than others. As more data becomes available on the services that MFIs provide,
further research can lead to more definitive conclusions that can confirm or invalidate the
findings in this study. Also, given that for BRAC and RD-12 programs the results were not
statistically significant for the most part, the question remains as to why some microfinance
institutions are successful and others are not. 36
36 This question was also postulated in Kaboski and Towsend (2005)
106
CHAPTER IV
Microfinance and its Effect on Income Inequality: Evidence from Rural Bangladesh
1. Background In the past couple of decades, microfinance has been used as a tool for empowering the
poor and fighting poverty around the world. Despite ongoing criticism, microfinance has
continued to gain momentum and programs continue to expand throughout the world. The
outreach of microfinance schemes have expanded to include online lending exchanges carried
out by organizations such as Kiva, Microplace and The Mix. The growth and significance of
microfinance as a poverty-alleviating tool has generated substantial academic inquiry about the
impact of these programs on borrower welfare.
Despite the extensive literature on microfinance, given the inconsistency of the findings,
we are still left with a general sense of inquiry as to the extent to which microfinance benefits
poor borrowers and the communities in which they live. Some studies find positive socio-
economic impacts such as income stability and growth, increased employment, reduced income
inequality, improvements in health, nutrition and schooling, women’s empowerment and
stronger social networks (Beck et al., 2004; Khandker, 2003). However, there are other studies
that suggest negative impacts such as higher interest rates, constant poverty levels, exploitation
of women, increased inequality, increased dependencies and the discouragement of sustainable
local economic and social development (Copestake, 2002; Rogaly, 1996).

107
Recent studies such as that of Khandker (2005), examined the effects of microfinance on
poverty reduction at both the participant and village levels using panel data from Bangladesh.
The results of this study show that access to microfinance helps reduce poverty at the household-
level, especially for female participants. In terms of the effects on the local economy, the study
concluded that microfinance has a positive impact at the village-level because it raises per capita
household consumption for both participants and nonparticipants in the villages where the
programs operate. Other studies also report positive impacts of microfinance in Bangladesh (e.g.
Hashemi, Schuler, and Riley 1996; Schuler and Hashemi 1994). There is a consensus that
microfinance increases consumption, results in higher productivity and leads to consumption
smoothing (Khandker, 1998; Parker and Nagarejan, 2001; Zaman, 2001; Coung et al., 2007).
Impact studies on microfinance have focused on borrower welfare. While the focus on
borrower welfare is both warranted and essential, it is also important to examine the potential
spillover effects of microfinance. The reduction of credit constraints is expected to affect
borrowers, but these effects may also induce other general equilibrium effects that will impact
non-borrowers and the community as a whole. A common finding in the literature, and in this
dissertation, is that microfinance does not affect all members of a village equally. This is
evidenced in Chapter 1 where the findings suggested differential impacts by gender, labor assets
and education assets. Given these differing impacts, an important outcome to explore is how
microfinance affects incomes, particularly, the effect of microfinance on income inequality. In
this context, examining the factors that increase or decrease income inequality would help
policymakers in the design of development strategies that would reduce poverty and induce
welfare effects beyond borrowers. Most impact studies have been conducted at the household
level and focus on the effect of microfinance on household income and consumption.
108
Given data limitations, the spillover effects of microfinance have not been thoroughly
explored. Such spillover effects include the increase of entrepreneurship, employment and
aggregate incomes as a result of access to credit. Access to credit can increase employment
opportunities as new entrepreneurs hire other workers. This new employment may result in a
host of other transactions such that there is an income multiplier effect significant enough to
ignite economic development. These are all general equilibrium effects that are expected to come
about as a result of microfinance but that are difficult to measure given the intensity of data
needed.
The aforementioned general equilibrium effects are beyond the scope of this study but
one way this study attempts to explore effects that go beyond borrower welfare is to explore the
factors that contribute to income inequality at the village level. Measuring the correlation
between microfinance and income inequality would allow us to explore aggregate impacts that
go beyond borrower welfare. Very few studies on the impact of microfinance have explored the
relationship between access to microfinance and income inequality.
This study contributes to the existing literature on microfinance in that it serves as an
initial inquiry into the aggregate effects of microfinance. A prevalent criticism of microfinance
is that it does not reduce poverty at the aggregate level given the small size of the loans and the
lack of education, managerial ability and investment opportunities for the poor. In this sense, if a
development goal is to lift people out of poverty and close the income gap among the population,
inquiry into income inequality would be an appropriate point of departure.
109
In this study, the main focus is on village effects rather than on individual borrower or
household effects. Focusing on the implications of intra-village income inequality allows us to
reach broader conclusions about the impact of microfinance and it would serve as a starting point
to begin analyzing some of the general equilibrium effects that may be induced by access to
microfinance. To conduct this study, I use village-level panel data from Bangladesh for the
periods 1991-92 and 1998-99 (more details are provided in section 2). For the analysis, I employ
several econometric methodologies to explore the effect of microfinance on intra-village income
inequality. I first use a Pooled OLS technique to empirically test the association between village
characteristics, credit, and two dependent variables: average village income and village Gini
indices. The Gini index for a village is based on household income data within the village.
Secondly, I use a village fixed-effect method in order to control for selection bias and
unobserved effects that may bias the results. The credit variables, which are the coefficients of
interest, are separated by the source of microfinance and/or microfinance institution and gender
in order to capture differential effects by program.
The overall findings in this study suggest that microfinance, particularly when measured
by loan source, does contribute to income inequality at the village-level. The ownership of assets
such as nonagricultural and transport assets is also positively associated with an increase in
income inequality. An interesting and robust result is the negative correlation between education
and income inequality. The results suggest that higher educational achievement reduces income
inequality. The organization of the study is as follows; section 1 presents background
information about income inequality and microfinance, section 2 outlines the data used in the
study, section 3 describes the theoretical model and estimation strategy employed, section 4
discusses the results, and section 5 concludes the chapter.
110
1.1 Microfinance and Inequality
Economic inequality, or “wealth and income differences” represents disparities in the
distribution of income and other economic assets (Tchouassi, 2011). Generally, the term
economic inequality refers to equality of outcome and is usually linked to the idea of equal
opportunity (ibid). According to Tchouassi (2011), the concept of inequality can be explored
within the realm of three types of processes and three different dimensions: (1) economic, which
refers to income, employment and access to physical assets; (2) social, which refers to access to
health, education and social security; and (3) political, which refers to the right to vote, access to
political power and legal institutions. The three different dimensions include geography (across
regions), location (rural/urban) and population groups (gender, ethnicity and race). In terms of
measuring differences in income equality, typically, the Gini coefficient is used.
Income inequality is a variable that is measured and closely monitored throughout the
world because it has important implications for economic growth and development. Studies
have found that inequality and economic growth are negatively correlated and that individuals
with income and wealth below a certain threshold are unable to acquire human capital and in turn
this limits economic growth (see Clarke, 1995; Peterson and Tabellini, 1994; Galor and Zeira,
1993; Beck, Demirguc-Kunt, Levine 2007). Although most of these studies have traced the
linkages between inequality and economic growth at the macro level, similar results can be
expected at the micro level.
111
Microfinance has been considered an important development policy that aims to reduce
poverty, vulnerability and inequality. The assumption is that if the poor receives more credit,
inequality and vulnerability would be reduced (Stewart et al., 2010). The idea here is that
financial depth eases the credit constraints on the poor and vulnerable populations and increases
productivity of assets. Increased productivity in turn contributes to poverty reduction (Hulme
and Mosley, 1996; World Bank, 2001; Jalilian and Kirkpatrick, 2002; Kai and Hamori, 2009b).
Other studies contradict the aforementioned studies by showing that financial depth only benefits
the rich and as a result, income inequality and vulnerability is increased (Beck et al., 2004).
Recent studies, such as that of Ahlin and Jiang (2008), develop a model in which
microfinance is used as a proxy for financial development. The aim of their study was to explore
whether microfinance could bring long-term development and reduce income inequality for a
country. The authors made the distinction between entrepreneurship and self-employment and
argued that these two concepts are not the same. They defined entrepreneurship as an activity
that requires saving and the acquisition of new labor and capital, whereas self-employment
requires little or no saving, minimal capital and mainly one’s own labor.
Microcredit, the authors argued, is based on self-employment schemes and as such,
without saving and significant capital accumulation, long-term economic development is
difficult to come about. In terms of income inequality, the authors argue that if poor borrowers
“graduate” from self-employment into entrepreneurship, this in turn will decrease income
inequality because it would raise savings, create employment and increase the incomes of the
newly hired individuals. This argument is relevant for this study in that it can explain the
contradicting results found here and in the literature.
112
In this sense, it would then be possible for microcredit to increase inequality if the self-employed
does not generate income to close the income gap or it can reduce inequality if entrepreneurship
flourishes. Green et al. (2006) also make a similar argument by asserting that improvements in
access to credit among the poor can reduce poverty and thus close the income gap among the
population.
Cross-country studies on the empirical relationship between microfinance and inequality
show that microfinance has either an increasing effect or a decreasing effect on income
inequality. Tchouassi (2011), for instance, examines the relationship of microfinance, inequality
and vulnerability in 11 developing countries in Central Africa. The findings in this study show
that the number or intensity of microfinance institutions has an “equalizing” or negative impact
on the Gini index in Central Africa countries. Kai and Hamori (2009) echo these findings. They
use a cross-country regression methodology to examine the impact of microfinance on inequality
in 61 developing countries. Using the number of microfinance institutions as a proxy for the
intensity of microfinance in a country, they show that microfinance has a decreasing effect on
inequality. In this context, they conclude that since microfinance lowers inequality, it can be
used as a effective redistribution tool. Another study supporting the aforementioned findings is
that of Cuong, Bigman, den Berg, and Thieau (2007). They examine the effect of micro loans
disbursed to the poor by the Vietnam Bank for Social Policies (VBSP), on household welfare and
find that microfinance is associated with a small decrease in income inequality.
Consensus about the relationship between microfinance and income inequality is lacking
and the findings are as mixed as those about the impact of microfinance on borrower welfare.
There are studies such as the ones discussed above that find that access to microfinance reduces
income inequality but others find that inequality is actually enhanced.
113
Copestake (2002), for instance, explores the Zambian Copperbelt and finds that impact on
income distribution depends upon who obtains loans, who graduates to larger loans, who exits
and group dynamic. The findings suggest that although there are some initial increases in
business income among borrowers, microfinance increases income inequality. This inequality in
income, the study shows, is determined by factors such as who receives the loans, who is able to
get larger loans, and the dynamics of the lending group. The study concludes by asserting that
there are many reasons why microcredit may have a “polarizing” or increasing effect on
inequality. One main reason is that there may be discrimination in favor of richer clients who
benefit from better access to credit and the exclusion of poorer people. If this is the case, or if
there are differential impacts from access to credit, then it is possible that in some cases
inequality increases and in other cases it decreases or it may remain constant.
Exploring the relationship between microfinance and income inequality is important for
many reasons. One important reason, particularly for poor countries, is that high income
inequality is associated with crime and political instability. Another reason is that inequality
hampers the processes of economic development and poverty reduction (Kai and Hamori, 2009).
If income inequality creates a barrier for economic growth as some studies suggest, then
reducing income inequality should be a development policy initiative. In this context,
establishing some sort of consensus about the relationship between microfinance and income
inequality will contribute to development strategies that promote a balanced income growth that
would result in substantial poverty reduction.
114
2. Data This study relies on the 1991/92 and the1998/99 household surveys conducted by the
Bangladesh Institute of Development Studies (BIDS) and the World Bank. This household-level
data was aggregated into village-level data for the purpose of this study. The surveys covered
1,798 households drawn from 87 villages in 29 thanas.38 The 1991/92 survey was conducted
during three cropping seasons: round 1 during Aman rice (November-February), round 2 during
Boro rice (March-June), and round 3 during Aus rice (July-October). The 1998/99 survey was
collected only once during this period (Pitt and Khandker ,1998 and Khandker , 2005).
The purpose of this survey was to generate the data for an analysis of three major credit
programs: the Grameen Bank, Bangladesh Rural Advancement Committee (BRAC), and the
Rural Development-12 program of the Bangladesh Rural Development Board (BRDB). Villages
where these programs operated were surveyed as well as non-program villages where no micro
lending or any similar lending activities took place. Target households and non-target
households were surveyed. Target households are those who meet the program eligibility
criteria, which is to own less than or equal to half of an acre of land. Non-target households are
those who do not meet the landholding criteria. Non-target households were surveyed in both
program villages and non-program villages (ibid).
Out of the 29 thanas covered, 24 were program thanas (8 from each of the three
programs) and 5 were non-program thanas. The thanas included in the survey were selected
from 391 rural thanas out of 460 thanas. Three villages in each program thana were randomly
selected from a group of program villages where a program had been in operation for at least
38 A thana is an administrative unit that is smaller than a district and consists of a number of villages. In Bangladesh, you have “Divisions” and under those divisions you have “Zilas”. Thanas are under the umbrella of zilas.
115
three years. Three villages in each of the non-program thanas were also randomly selected.
These villages were drawn from the village census of the Government of Bangladesh. In terms
of the village survey design, villages with fewer than 51 number of households and villages with
more than 600 households, were excluded (ibid).
The households surveyed in 1991/92 were revisited in 1998/99. This time, however, the
households were interviewed in one round, rather than in three. Among the 1,769 households
surveyed in 1991/92, 113 could not be interviewed in 1998/99 and only 1,656 households were
available for the re-survey. Included in the re-survey were new households from previous
villages and newly included villages. Also three non-target households were randomly selected
from each of the previous 87 villages. Also included, are three new thanas that were randomly
selected from the southern and southeastern regions that were seriously affected by cyclone in
1991/92. These thanas were excluded in the first round survey. From the new thanas, three
villages were also drawn randomly, adding an additional 9 villages. In the new villages, 20
households were drawn from target and non-target households. In total, 2,599 households were
surveyed in 1998/99. 39
The distribution of households by program membership is presented in Table 4.1. Out of
all the households surveyed in 1991/92, 11.6 percent were BRAC members, 8.5 percent were
Grameen Bank members and 6.2 percent were RD-12 members. In the 1998/99 survey, the
number of Grameen Bank borrowers increased to 14.3 percent; the number of BRAC borrowers
actually decreased to 9.3 percent and RD-12 project borrowers also decreased to 3.6 percent.
The interesting trend we see in the 1998/99 survey is the increasing presence of other NGOs,
with 11.1 percent of participating members.
39 Details of these surveys were provided by Pitt and Khandker (1998) and Khandker (2005).
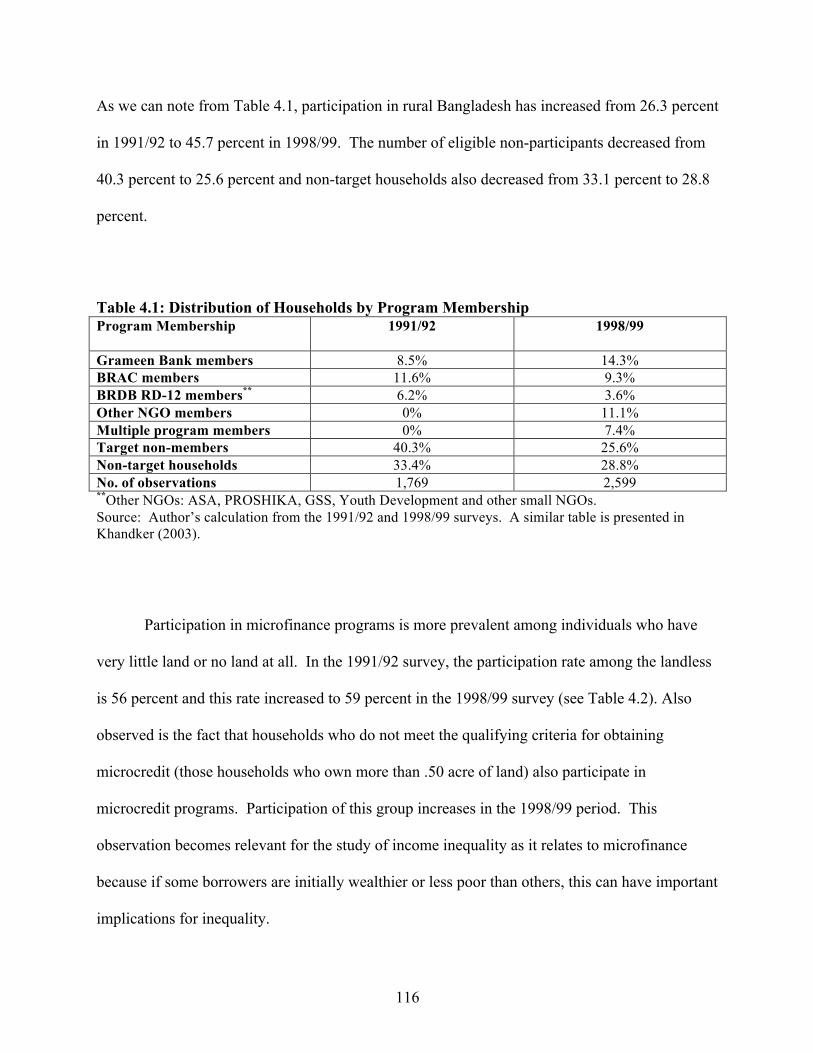
116
As we can note from Table 4.1, participation in rural Bangladesh has increased from 26.3 percent
in 1991/92 to 45.7 percent in 1998/99. The number of eligible non-participants decreased from
40.3 percent to 25.6 percent and non-target households also decreased from 33.1 percent to 28.8
percent.
Table 4.1: Distribution of Households by Program Membership Program Membership
1991/92 1998/99
Grameen Bank members 8.5% 14.3% BRAC members 11.6% 9.3% BRDB RD-12 members** 6.2% 3.6% Other NGO members 0% 11.1% Multiple program members 0% 7.4% Target non-members 40.3% 25.6% Non-target households 33.4% 28.8% No. of observations 1,769 2,599 **Other NGOs: ASA, PROSHIKA, GSS, Youth Development and other small NGOs. Source: Author’s calculation from the 1991/92 and 1998/99 surveys. A similar table is presented in Khandker (2003).
Participation in microfinance programs is more prevalent among individuals who have
very little land or no land at all. In the 1991/92 survey, the participation rate among the landless
is 56 percent and this rate increased to 59 percent in the 1998/99 survey (see Table 4.2). Also
observed is the fact that households who do not meet the qualifying criteria for obtaining
microcredit (those households who own more than .50 acre of land) also participate in
microcredit programs. Participation of this group increases in the 1998/99 period. This
observation becomes relevant for the study of income inequality as it relates to microfinance
because if some borrowers are initially wealthier or less poor than others, this can have important
implications for inequality.
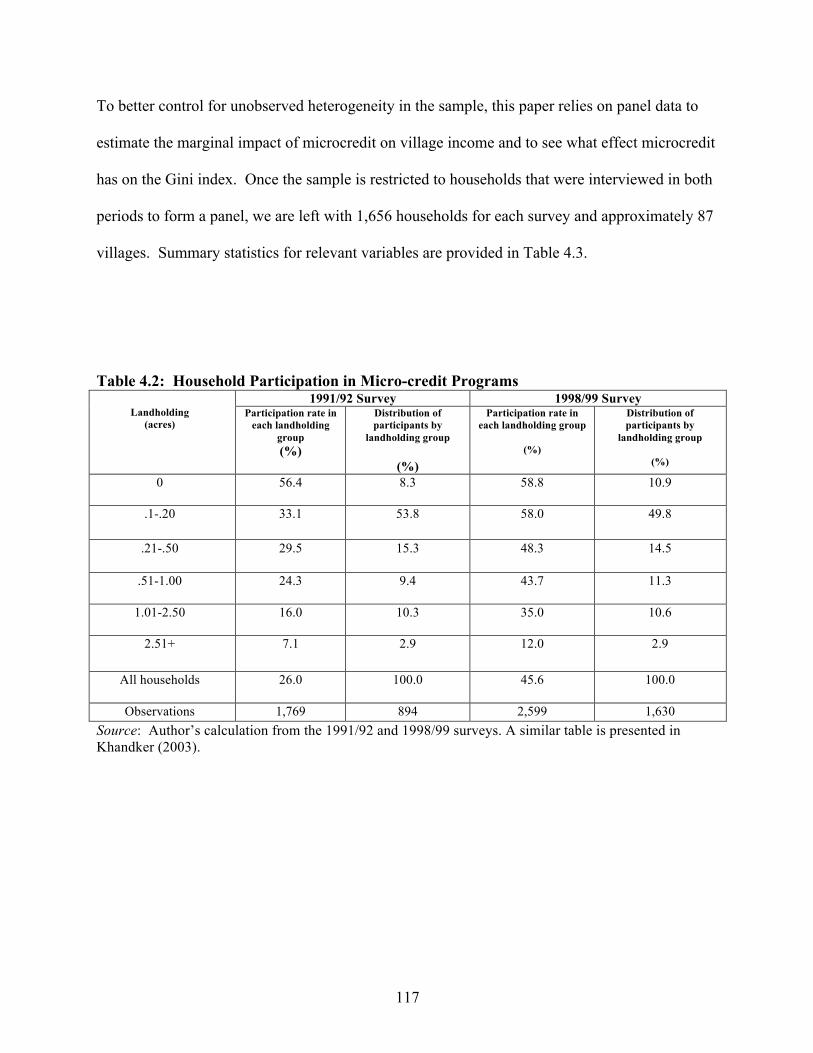
117
To better control for unobserved heterogeneity in the sample, this paper relies on panel data to
estimate the marginal impact of microcredit on village income and to see what effect microcredit
has on the Gini index. Once the sample is restricted to households that were interviewed in both
periods to form a panel, we are left with 1,656 households for each survey and approximately 87
villages. Summary statistics for relevant variables are provided in Table 4.3.
Table 4.2: Household Participation in Micro-credit Programs
Landholding
(acres)
1991/92 Survey 1998/99 Survey Participation rate in
each landholding group (%)
Distribution of participants by
landholding group
(%)
Participation rate in each landholding group
(%)
Distribution of participants by
landholding group
(%)
0
56.4
8.3
58.8
10.9
.1-.20
33.1
53.8
58.0
49.8
.21-.50
29.5
15.3
48.3
14.5
.51-1.00
24.3
9.4
43.7
11.3
1.01-2.50
16.0
10.3
35.0
10.6
2.51+ 7.1 2.9 12.0 2.9
All households 26.0 100.0 45.6 100.0
Observations 1,769 894 2,599 1,630 Source: Author’s calculation from the 1991/92 and 1998/99 surveys. A similar table is presented in Khandker (2003).
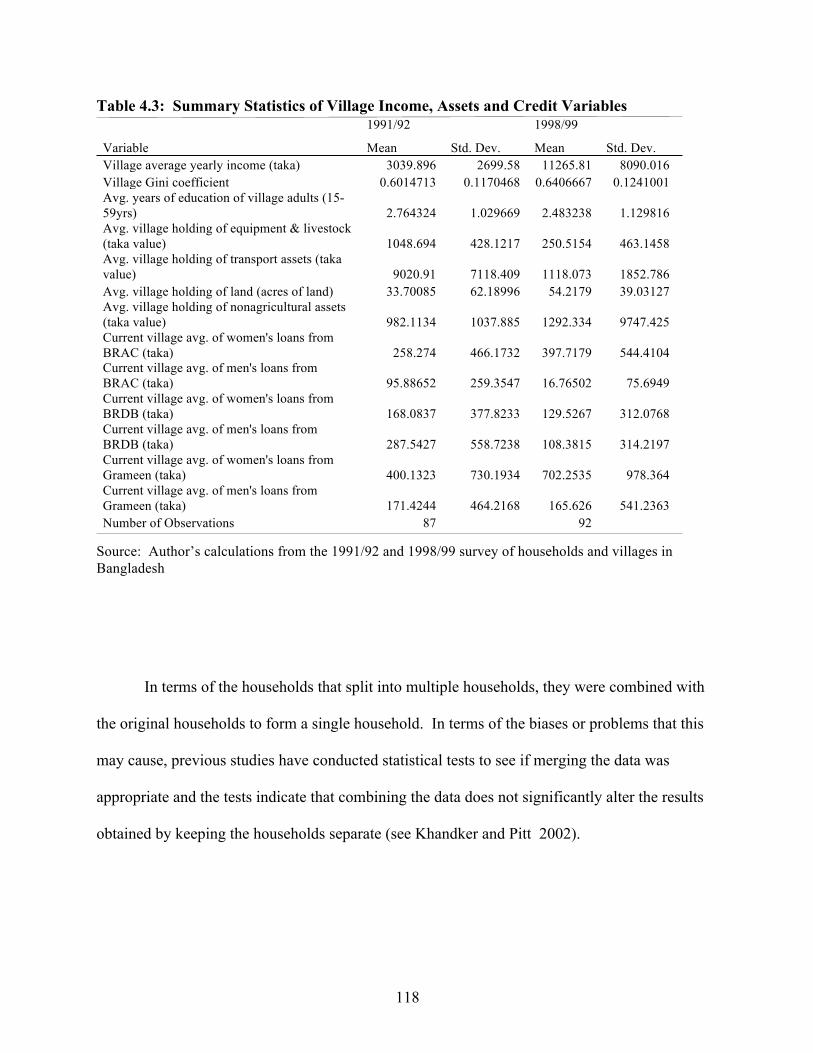
118
Table 4.3: Summary Statistics of Village Income, Assets and Credit Variables 1991/92 1998/99
Variable Mean Std. Dev. Mean Std. Dev. Village average yearly income (taka) 3039.896 2699.58 11265.81 8090.016 Village Gini coefficient 0.6014713 0.1170468 0.6406667 0.1241001 Avg. years of education of village adults (15-59yrs) 2.764324 1.029669 2.483238 1.129816 Avg. village holding of equipment & livestock (taka value) 1048.694 428.1217 250.5154 463.1458 Avg. village holding of transport assets (taka value) 9020.91 7118.409 1118.073 1852.786 Avg. village holding of land (acres of land) 33.70085 62.18996 54.2179 39.03127 Avg. village holding of nonagricultural assets (taka value) 982.1134 1037.885 1292.334 9747.425 Current village avg. of women's loans from BRAC (taka) 258.274 466.1732 397.7179 544.4104 Current village avg. of men's loans from BRAC (taka) 95.88652 259.3547 16.76502 75.6949 Current village avg. of women's loans from BRDB (taka) 168.0837 377.8233 129.5267 312.0768 Current village avg. of men's loans from BRDB (taka) 287.5427 558.7238 108.3815 314.2197 Current village avg. of women's loans from Grameen (taka) 400.1323 730.1934 702.2535 978.364 Current village avg. of men's loans from Grameen (taka) 171.4244 464.2168 165.626 541.2363 Number of Observations 87 92
Source: Author’s calculations from the 1991/92 and 1998/99 survey of households and villages in Bangladesh
In terms of the households that split into multiple households, they were combined with
the original households to form a single household. In terms of the biases or problems that this
may cause, previous studies have conducted statistical tests to see if merging the data was
appropriate and the tests indicate that combining the data does not significantly alter the results
obtained by keeping the households separate (see Khandker and Pitt 2002).
119
For the purpose of this study, household-level data was collapsed to village-level data in order to
measure the effects of microcredit on village outcomes. In terms of village income, this variable
was derived by aggregating household incomes in each village to get average income for each
village. The aggregated data resulted in a panel of 87 villages.
2.1 Measuring Inequality and Poverty
Economists use two fundamental measures of income distribution to explore issues of
income inequality. The two measures are, the personal or size distribution of income and the
functional or distributive factor share distribution of income (Todaro and Smith, 2009, p. 210).
The personal or size distribution of income is the measure typically employed by
economists. The personal income measure focuses on the incomes of individual persons or
households and the total incomes they receive. To explore personal income, economists and
statisticians arrange all individuals by ascending personal incomes and then separate the total
population into different groups. A common method of dividing the population into groups is to
divide the population into quintiles (fifths) or deciles (tenths). Income levels are arranged in
ascending income levels and then the income share received by each individual or group is
determined (ibid).
A common way to examine personal income statistics is to construct a Lorenz curve.
Figure 4.1 illustrates a Lorenz curve (top) and a Generalized Lorenz curve (bottom). In the
Lorenz curve, the cumulative proportion of income recipients is plotted on the horizontal axis.
120
We can see that at point .2, we have the lowest (poorest) 20% of the population; at point .6 we
have the bottom 60%; and at the very right of the axis, all 100% of the population has been
accounted for. The vertical axis illustrates the cumulative income share received by each
proportion of the population. We can represent perfect equality by drawing a diagonal line from
the left corner (the origin) of the square, all the way to the upper right corner of the square.
Source: Author’s calculations from the 1991/92 and 1998/99 surveys of households in Bangladesh
Figure 4.1: Lorenz Curves—Microfinance Borrowing Households in Bangladesh
The farther away the Lorenz curve is from the diagonal line (perfect equality), the greater
the degree of inequality is displayed (Todaro and Smith, 2009, p. 212). The Gini coefficient can
be derived from the Lorenz curve and it equals twice the area between the Lorenz curve and the
45 degree line (Jenkins, 2006).40
40 http://econpapers.repec.org/paper/bocusug06/07.htm. Accessed October 29, 2012.
0.2
.4.6
.81
Incom
e sha
re of
poore
st 10
0p%
0 .2 .4 .6 .8 1Cumulative population share, p
Year==92 Year==99
050
0010
000
Mean
inco
me am
ong p
oores
t 100
p%
0 .2 .4 .6 .8 1Cumulative population share, p
Year==92 Year==99
Generalized Lorenz Curve
Lorenz CurveInequality Comparisons Among Microfinance Borrowing Households: 1992, 1999
121
The Generalized Lorenz curve (bottom graph in Figure 4.1) is similar to the Lorenz curve but it
is scaled up at each point by the cumulative mean income of the population. Units are arranged
in ascending order of income (ibid). As can be noted from Figure 4.1, the data displays the
presence of income inequality among microcredit borrowing households. This fact is not
uncommon since countries and therefore households, typically do not exhibit perfect equality or
perfect inequality in their distribution of income (Todaro and Smith, 2009, p. 212).
In terms of inequality among microfinance borrowers, the Lorenz curve (top) suggests that
between the periods 1992 and 1999 income inequality remained relatively constant for the
households in the bottom (poorest) 20% of the population. In other words, the poorest borrowers
were no better or worse off between the two periods. Figure 4.1 also suggests that income
inequality among the top earners slightly decreased (see dash line in both diagrams). The
Generalized Lorenz curve also suggests that nominal incomes increased more for households in
the 50th percentile of income and above.
3. Theoretical Model and Estimation Strategy
In assessing the effectiveness of any development program or service, one issue that
instantly arises with impact evaluation is the biases that could come from endogenous
participation in such programs. In the impact assessment literature, the typical sources of
correlation are referred to as program placement bias and household selection bias (Pitt,
Rosenzweig, & Gibbons, 1993; Ravallion, 1999). If there is a systematic geographical bias in the
way the program targets the population, a program placement bias is created.
122
This is certainly the case in Bangladesh where poor households are specifically targeted and
happen to live in areas where poverty is more prevalent. A household selection bias would also
occur if participation in the program is correlated with unobserved individual characteristics. In
this study, the concern is the potential bias on the credit estimate created by the correlation
between unobserved heterogeneity and micro loans. A major challenge facing development
programs, particularly microcredit programs, is that policy conclusions are difficult because the
results of impact studies are sensitive to the empirical method used to estimate program effects.
In this context, there are compelling reasons to employ alternative methods to estimate program
impacts and determine whether microfinance benefits participants and their communities.
3.1 Pooled OLS Regression Model: Effect of Microcredit on Village Income As a point of departure in the estimations, I begin by pooling the data in the two periods
in order to take advantage of the increased number of observations that results from this
econometric technique. Since we only have approximately 87 villages in each period, pooling
the data may result in better estimates. I begin with an income equation that relates village
income yt in year t to the village’s asset endowment and characteristics X, the amount of loan M
received by the village, and a random error ε:
!!" = !!!!" + !!!!"! + !!!!"! + !!" (1)
where yjt is average village income in village j, which is assumed to depend on village
characteristics and village current borrowing. X is a vector of village assets and characteristics.
123
MF and MM respectively are vectors of average current microcredit received by village female
and male borrowers from different programs. Parameters !! and !! measure the effects of credit
(stock) for loans given to all female and male borrowers in the village by each of the microcredit
programs. Loans are separated by gender because since credit markets are imperfect and labor
markets are different for men and women, the impact of microfinance borrowing is expected to
differ by gender.
Equation (1), if estimated in this standard way, would suffer from the biases discussed
earlier since it is likely that exogenous factors will affect household and village level income. To
the extent these factors cause the error term in (1) to be correlated across all periods for a
particular village, cross-section estimates that do not account for this correlation will not be
efficient. If the omitted variables are correlated with village income, then estimating equation
(1) with methods such as cross-section will in fact yield biased results (see Mundlak, 1978 and
Hsiao, 1986).
3.2 Fixed-Effect Estimator: Effect of Microcredit on Village Income To eliminate the potential biases discussed above, the income equation is expanded to
capture village level unobserved heterogeneity. The income equation is rewritten:
!!" = !!!!" + !!!!"! + !!!!"! + !! + !!" (2)
124
The term φj is the village unobserved effect, which include village characteristics such as the
managerial ability of the population in a village, land quality and external factors such as local
conditions or the presence of other government programs. εjt is the error term and is potentially
serially correlated with X and M. To estimate the above equation, a village fixed-effect (FE)
estimator is used.
As mentioned previously, the first issue that arises is the homogeneity of village effects.
Here, the null hypothesis of homogeneity is that φj is constant for all j. If this is not the case,
cross-sectional estimators such as pooled OLS are inconsistent and may yield biased coefficient
estimates. To help us determine which model yields the most consistent estimates, we employed
a Hausman test (see Hausman, 1978 and Hsiao, 1986). According to the results of this test, the
null hypothesis of homogeneity, which says that φj is constant for all i, must be rejected.
Therefore, this analysis looks at the results from the pooled OLS regressions but relies on the FE
estimator to analyze the empirical correlation between microfinance and village income.
3.3 Pooled OLS Regression Model: Effect of Microcredit on Village Income Inequality Once I look at the effects of microcredit on village-level income to see if microcredit has
a statistically significant effect on village income, I proceed to examine whether microfinance is
associated with intra-village income inequality. I start with an equation that relates income
inequality ( as measured by the Gini coefficient).
125
GINIjt in year t, dependent on the village’s asset endowment and characteristics X, the amount of
loan received by the village, M, and a random error ε:
!"#"!" = !!!!" + !!!!"! + !!!!"! + !!" (3)
where GINIjt is the village j GINI coefficient, which is assumed to depend on village
characteristics and village microcredit borrowing. X is a vector of village assets and
characteristics. MF and MM respectively are vectors of the average current micro loans received
by female and male borrowers from different programs in each village. Parameters !!, and !!,
measure the effects of credit (stock) for loans given to female and male borrowers in each village
by each of the microcredit programs.
3.4 Fixed-Effect Estimator: Effect of Microcredit on Village Income Inequality As previously noted, the above equation is vulnerable to the biases discussed earlier
since it is likely that exogenous factors will also affect village level income. To mitigate the
potential biases discussed above, the income inequality equation is expanded to capture village
level unobserved heterogeneity.
The income inequality equation is rewritten:
!"#"!" = !!!!" + !!!!"! + !!!!"! + !! + !!" (4)
126
The term φj is the village unobserved effect, which include village characteristics such as the
managerial ability of the population in a village, land quality and external factors such as local
conditions or the presence of other government programs. εjt is the error term and is potentially
serially correlated with X and M. To estimate the above equation, a village fixed-effect (FE)
estimator is used.
4. Results
In this section, the results of the regression equations outlined in Section 3 are presented
and discussed. The first set of results includes the effect of microcredit on village income using
both Pooled OLS and a village fixed effect estimator. Since previous chapters in this dissertation
examined the impact of microfinance on household-level income, it seemed warranted to
examine whether earlier results could be confirmed at the village-level. The second set of results
are obtained from the regressions using the Gini coefficient as a dependent variable to examine
the effect of microcredit on village income inequality. Similarly to the first set of results, Pooled
OLS and fixed-effects strategies are employed to estimate the effect of microcredit on income
inequality.
4.1 Pooled OLS Regression Model: Effect of Microcredit on Village Income The results from the Pooled OLS regression model suggest that ownership of assets as
well as access to microfinance are associated with increases in income at the village level (see
Table 4.4). In terms of assets, the ownership of equipment and livestock is negatively
associated with increases in village income.
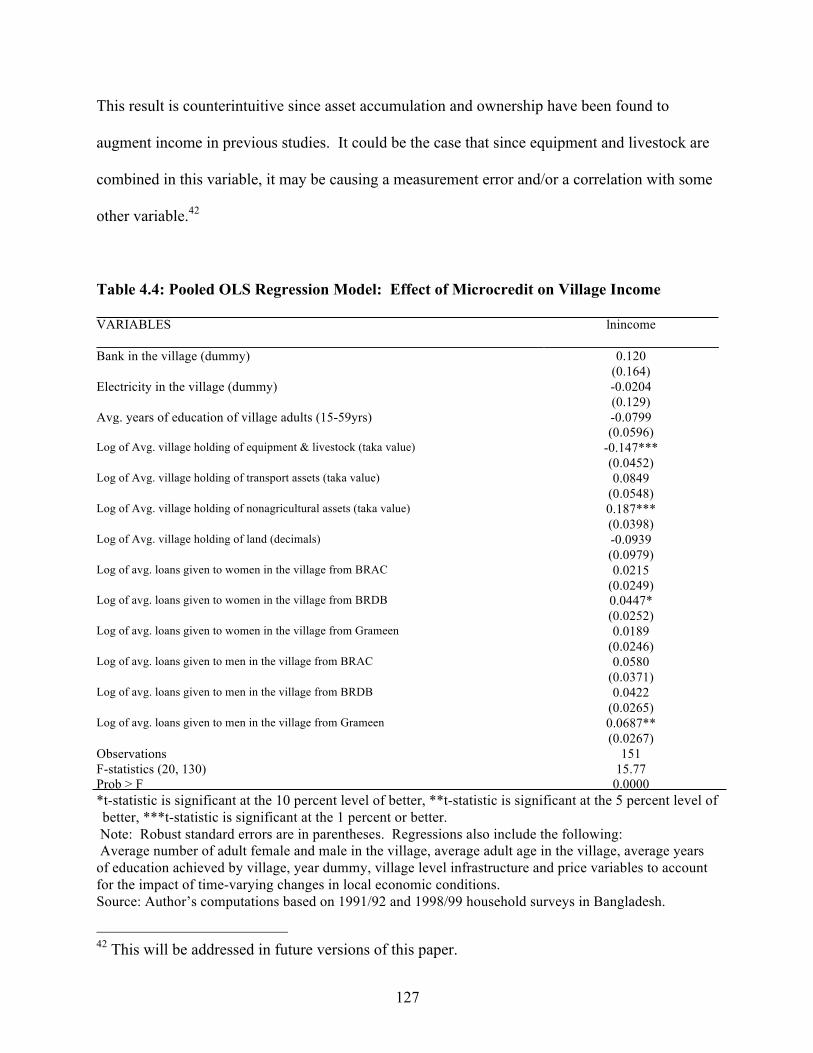
127
This result is counterintuitive since asset accumulation and ownership have been found to
augment income in previous studies. It could be the case that since equipment and livestock are
combined in this variable, it may be causing a measurement error and/or a correlation with some
other variable.42
Table 4.4: Pooled OLS Regression Model: Effect of Microcredit on Village Income
VARIABLES lnincome Bank in the village (dummy) 0.120 (0.164) Electricity in the village (dummy) -0.0204 (0.129) Avg. years of education of village adults (15-59yrs) -0.0799 (0.0596) Log of Avg. village holding of equipment & livestock (taka value) -0.147*** (0.0452) Log of Avg. village holding of transport assets (taka value) 0.0849 (0.0548) Log of Avg. village holding of nonagricultural assets (taka value) 0.187*** (0.0398) Log of Avg. village holding of land (decimals) -0.0939 (0.0979) Log of avg. loans given to women in the village from BRAC 0.0215 (0.0249) Log of avg. loans given to women in the village from BRDB 0.0447* (0.0252) Log of avg. loans given to women in the village from Grameen 0.0189 (0.0246) Log of avg. loans given to men in the village from BRAC 0.0580 (0.0371) Log of avg. loans given to men in the village from BRDB 0.0422 (0.0265) Log of avg. loans given to men in the village from Grameen 0.0687** (0.0267) Observations 151 F-statistics (20, 130) 15.77 Prob > F 0.0000 *t-statistic is significant at the 10 percent level of better, **t-statistic is significant at the 5 percent level of better, ***t-statistic is significant at the 1 percent or better.
Note: Robust standard errors are in parentheses. Regressions also include the following: Average number of adult female and male in the village, average adult age in the village, average years of education achieved by village, year dummy, village level infrastructure and price variables to account for the impact of time-varying changes in local economic conditions. Source: Author’s computations based on 1991/92 and 1998/99 household surveys in Bangladesh.
42 This will be addressed in future versions of this paper.

128
Ownership of non-agricultural assets is associated with increases in income in the
village. The results suggest that a 10 percent increase in the value of non-agricultural assets
increases income by 1.9 percent. In terms of microcredit, the results from this regression
confirm the results obtained previously. Microcredit, particular the credit disbursed by BRDB
and the Grameen Bank is associated with generating income at the village-level. The findings
indicate that one additional female borrower in the village with a 10 percent increase in credit
from BRDB contributed to a .4 percent increase in average village income. Similarly, one
additional male borrower in the village with a 10 percent increase in credit from the Grameen
Bank contributed to a .6 percent increase in average village income.
The coefficients for the other credit variables in the regression were not statistically
significant. This result can be partly attributed to the fact that microfinance institutions are
different and as such, the way credit is delivered and services are administered can have an
impact on the effectiveness of credit in creating economic growth at the village-level. This issue
was explored in Chapter 3. The role of assets in income generation should also be noted since
the coefficients on the asset variables are significantly larger than those from the credit variable.
These findings suggest that assets play a significant role in income generation at the village-
level, at times, more so than access to microcredit.
4.2 Fixed-Effect Estimator: Effect of Microcredit on Village Income As previously discussed, the Hausman test employed indicated that the errors in the
equations are correlated for this data, therefore this panel data analysis uses the village fixed-
effect method. The results for this regression presented in Table 4.5 are more robust than for the
Pooled OLS method.
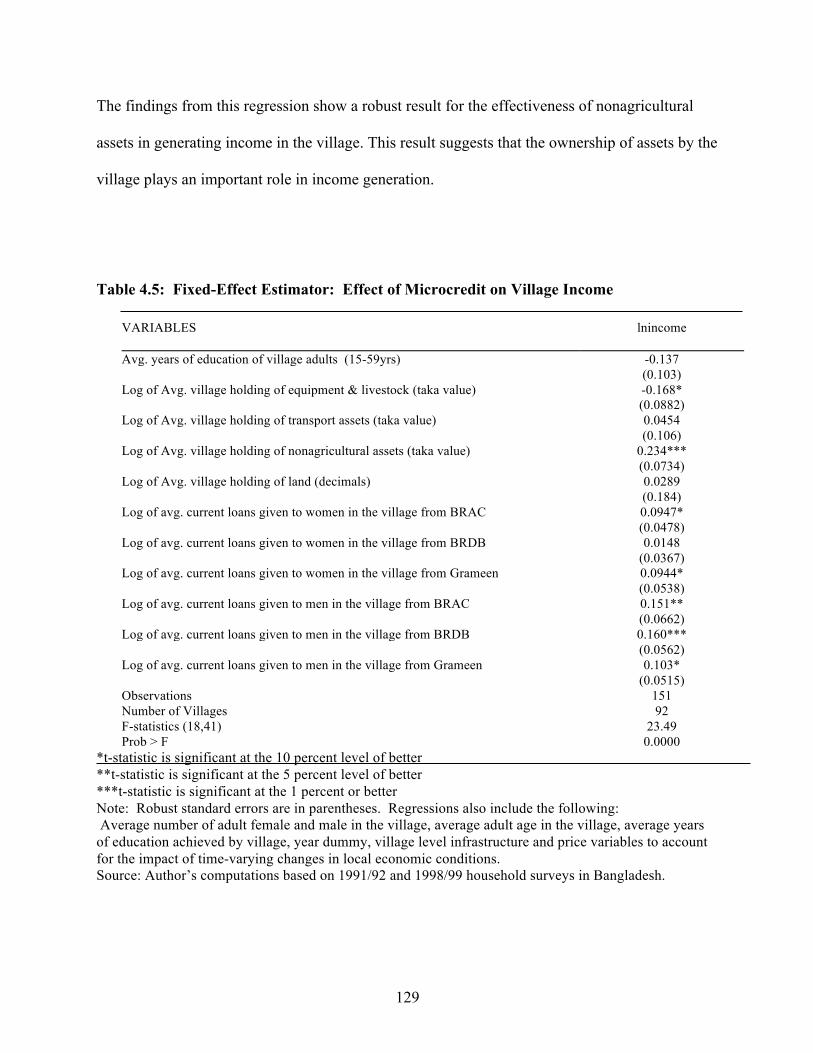
129
The findings from this regression show a robust result for the effectiveness of nonagricultural
assets in generating income in the village. This result suggests that the ownership of assets by the
village plays an important role in income generation.
Table 4.5: Fixed-Effect Estimator: Effect of Microcredit on Village Income
*t-statistic is significant at the 10 percent level of better **t-statistic is significant at the 5 percent level of better ***t-statistic is significant at the 1 percent or better Note: Robust standard errors are in parentheses. Regressions also include the following: Average number of adult female and male in the village, average adult age in the village, average years of education achieved by village, year dummy, village level infrastructure and price variables to account for the impact of time-varying changes in local economic conditions. Source: Author’s computations based on 1991/92 and 1998/99 household surveys in Bangladesh.
VARIABLES lnincome Avg. years of education of village adults (15-59yrs) -0.137 (0.103) Log of Avg. village holding of equipment & livestock (taka value) -0.168* (0.0882) Log of Avg. village holding of transport assets (taka value) 0.0454 (0.106) Log of Avg. village holding of nonagricultural assets (taka value) 0.234*** (0.0734) Log of Avg. village holding of land (decimals) 0.0289 (0.184) Log of avg. current loans given to women in the village from BRAC 0.0947* (0.0478) Log of avg. current loans given to women in the village from BRDB 0.0148 (0.0367) Log of avg. current loans given to women in the village from Grameen 0.0944* (0.0538) Log of avg. current loans given to men in the village from BRAC 0.151** (0.0662) Log of avg. current loans given to men in the village from BRDB 0.160*** (0.0562) Log of avg. current loans given to men in the village from Grameen 0.103* (0.0515) Observations 151 Number of Villages 92 F-statistics (18,41) 23.49 Prob > F 0.0000
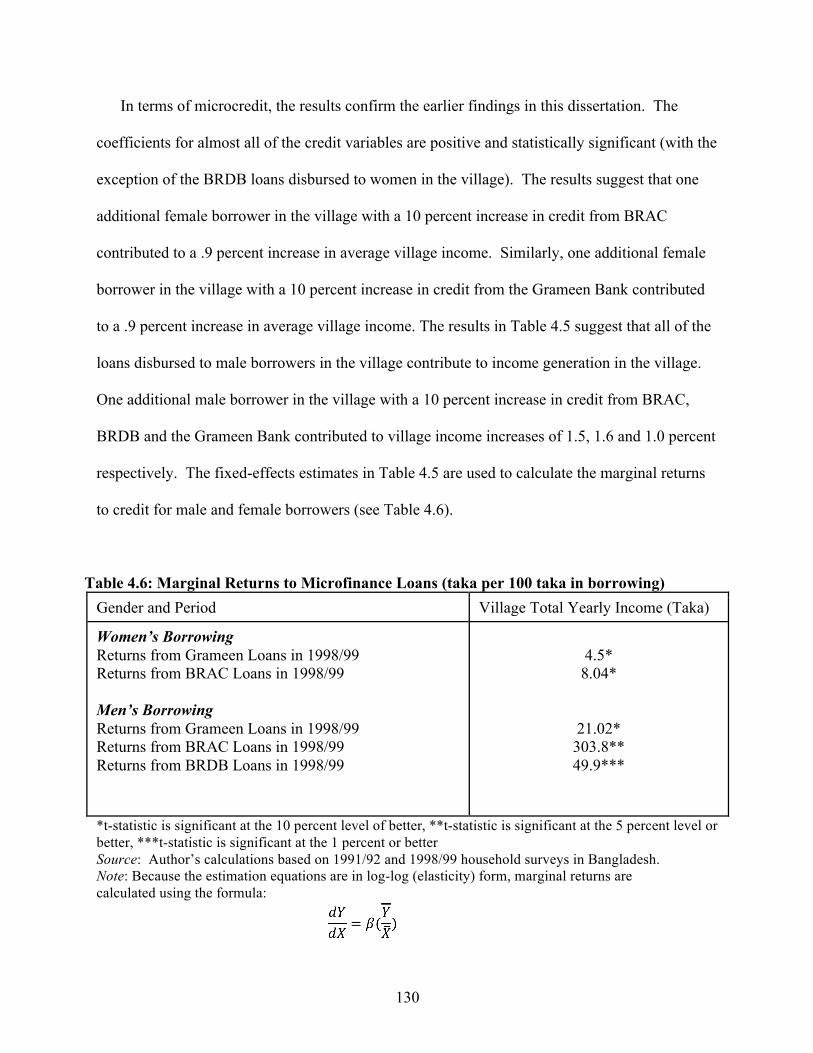
130
In terms of microcredit, the results confirm the earlier findings in this dissertation. The
coefficients for almost all of the credit variables are positive and statistically significant (with the
exception of the BRDB loans disbursed to women in the village). The results suggest that one
additional female borrower in the village with a 10 percent increase in credit from BRAC
contributed to a .9 percent increase in average village income. Similarly, one additional female
borrower in the village with a 10 percent increase in credit from the Grameen Bank contributed
to a .9 percent increase in average village income. The results in Table 4.5 suggest that all of the
loans disbursed to male borrowers in the village contribute to income generation in the village.
One additional male borrower in the village with a 10 percent increase in credit from BRAC,
BRDB and the Grameen Bank contributed to village income increases of 1.5, 1.6 and 1.0 percent
respectively. The fixed-effects estimates in Table 4.5 are used to calculate the marginal returns
to credit for male and female borrowers (see Table 4.6).
Table 4.6: Marginal Returns to Microfinance Loans (taka per 100 taka in borrowing) Gender and Period Village Total Yearly Income (Taka)
Women’s Borrowing Returns from Grameen Loans in 1998/99 Returns from BRAC Loans in 1998/99 Men’s Borrowing Returns from Grameen Loans in 1998/99 Returns from BRAC Loans in 1998/99 Returns from BRDB Loans in 1998/99
4.5* 8.04*
21.02* 303.8** 49.9***
*t-statistic is significant at the 10 percent level of better, **t-statistic is significant at the 5 percent level or better, ***t-statistic is significant at the 1 percent or better Source: Author’s calculations based on 1991/92 and 1998/99 household surveys in Bangladesh. Note: Because the estimation equations are in log-log (elasticity) form, marginal returns are calculated using the formula:
131
Table 4.6 suggests that at the mean, an additional Tk 100 of borrowing in the period
1998/99 from Grameen by women in the village increased village yearly income by Tk 4.5 and
borrowing from BRAC in the same period increased village yearly income by 8.04. The
marginal returns for men are much larger . At the mean, an additional Tk 100 of borrowing in
the period 1998/99 from Grameen by men in the village increased village yearly income by Tk
21.02 and borrowing from BRAC and BRDB in the same period increased village yearly income
by Tk 303.8 and Tk 49.9 respectively. As we can see, the marginal return to credit for credit
received by men from BRAC is quite substantial in terms of its effect on village income.
4.3 Pooled OLS Regression Model: Effect of Microcredit on Village Income Inequality In order to explore the effect of microfinance loans on village income inequality, I run the
village income inequality regressions using both the Pooled OLS and the village fixed-effect
methods. The results from the first method are presented in Table 4.7. An interesting result that
stands out from Table 4.7 is the coefficient for average years of education of village adults. The
findings suggest that a one-unit increase in average years of education in the village decreases
village income inequality or the Gini coefficient by .0353.
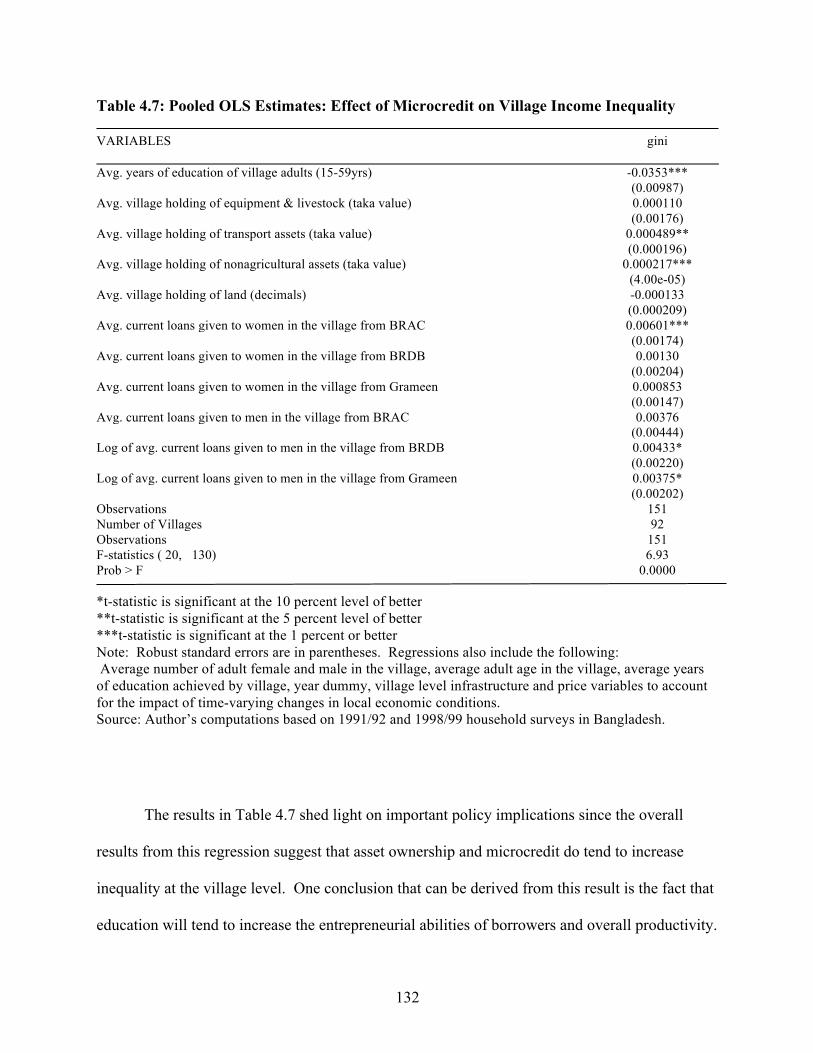
132
Table 4.7: Pooled OLS Estimates: Effect of Microcredit on Village Income Inequality VARIABLES gini Avg. years of education of village adults (15-59yrs) -0.0353*** (0.00987) Avg. village holding of equipment & livestock (taka value) 0.000110 (0.00176) Avg. village holding of transport assets (taka value) 0.000489** (0.000196) Avg. village holding of nonagricultural assets (taka value) 0.000217*** (4.00e-05) Avg. village holding of land (decimals) -0.000133 (0.000209) Avg. current loans given to women in the village from BRAC 0.00601*** (0.00174) Avg. current loans given to women in the village from BRDB 0.00130 (0.00204) Avg. current loans given to women in the village from Grameen 0.000853 (0.00147) Avg. current loans given to men in the village from BRAC 0.00376 (0.00444) Log of avg. current loans given to men in the village from BRDB 0.00433* (0.00220) Log of avg. current loans given to men in the village from Grameen 0.00375* (0.00202) Observations 151 Number of Villages 92 Observations 151 F-statistics ( 20, 130) 6.93 Prob > F 0.0000 *t-statistic is significant at the 10 percent level of better **t-statistic is significant at the 5 percent level of better ***t-statistic is significant at the 1 percent or better Note: Robust standard errors are in parentheses. Regressions also include the following: Average number of adult female and male in the village, average adult age in the village, average years of education achieved by village, year dummy, village level infrastructure and price variables to account for the impact of time-varying changes in local economic conditions. Source: Author’s computations based on 1991/92 and 1998/99 household surveys in Bangladesh.
The results in Table 4.7 shed light on important policy implications since the overall
results from this regression suggest that asset ownership and microcredit do tend to increase
inequality at the village level. One conclusion that can be derived from this result is the fact that
education will tend to increase the entrepreneurial abilities of borrowers and overall productivity.
133
As such, it is expected that as the village population as a whole becomes more educated, incomes
will simultaneously grow and thus potentially reduce the income gap among the villagers. In
terms of asset holdings, a one-unit increase in both transport assets and nonagricultural assets
increase village income inequality by .0005 and .0002 respectively. Microcredit has a similar
effect in terms of widening income inequality at the village level.
The findings suggest that when one additional female borrower in the village obtains a
one-unit increase in credit from BRAC this contributed to a .006 increase in village income
inequality. In terms of loans given to male borrowers in the village, a one-unit increase in
microcredit from BRDB and the Grameen Bank, increases village income inequality by .004 and
.004 respectively. The results from this regression suggest that increases in average years of
schooling in the village decreases income inequality while access to microcredit for both men
and women in the village increase income inequality.
From a policy perspective, if income inequality is viewed as a barrier for creating
economic growth within a village, it would be beneficial to create incentives for increasing
education along with the disbursement of credit. In this context the results we have discussed so
far suggest that microcredit increases income and income inequality while education reduces
income inequality. With a combination of both microcredit and education, it may be possible to
achieve a more equalizing income effect in the villages where microfinance institutions operate.
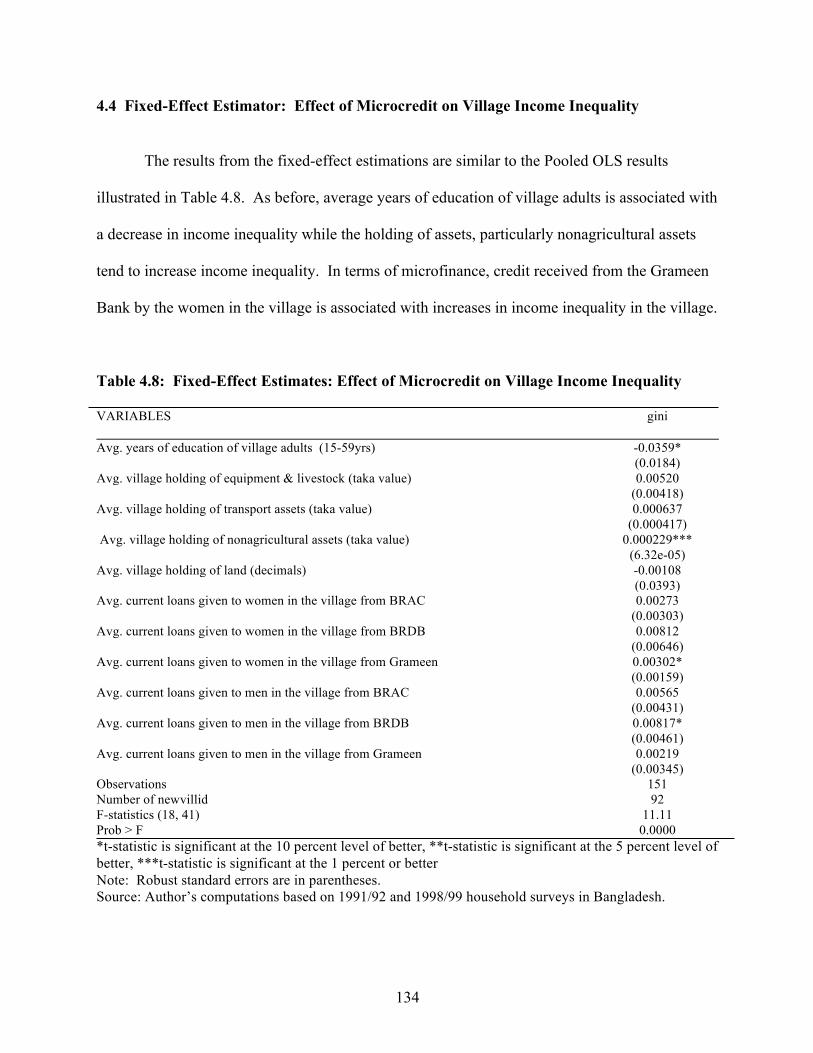
134
4.4 Fixed-Effect Estimator: Effect of Microcredit on Village Income Inequality The results from the fixed-effect estimations are similar to the Pooled OLS results
illustrated in Table 4.8. As before, average years of education of village adults is associated with
a decrease in income inequality while the holding of assets, particularly nonagricultural assets
tend to increase income inequality. In terms of microfinance, credit received from the Grameen
Bank by the women in the village is associated with increases in income inequality in the village.
Table 4.8: Fixed-Effect Estimates: Effect of Microcredit on Village Income Inequality
VARIABLES gini Avg. years of education of village adults (15-59yrs) -0.0359* (0.0184) Avg. village holding of equipment & livestock (taka value) 0.00520 (0.00418) Avg. village holding of transport assets (taka value) 0.000637 (0.000417) Avg. village holding of nonagricultural assets (taka value) 0.000229*** (6.32e-05) Avg. village holding of land (decimals) -0.00108 (0.0393) Avg. current loans given to women in the village from BRAC 0.00273 (0.00303) Avg. current loans given to women in the village from BRDB 0.00812 (0.00646) Avg. current loans given to women in the village from Grameen 0.00302* (0.00159) Avg. current loans given to men in the village from BRAC 0.00565 (0.00431) Avg. current loans given to men in the village from BRDB 0.00817* (0.00461) Avg. current loans given to men in the village from Grameen 0.00219 (0.00345) Observations 151 Number of newvillid 92 F-statistics (18, 41) 11.11 Prob > F 0.0000 *t-statistic is significant at the 10 percent level of better, **t-statistic is significant at the 5 percent level of better, ***t-statistic is significant at the 1 percent or better Note: Robust standard errors are in parentheses. Source: Author’s computations based on 1991/92 and 1998/99 household surveys in Bangladesh.
135
The results from Table 4.8 suggest that a one-unit increase in Grameen credit disbursed
to women in the village increases income inequality by .003. Similarly, a one-unit increase in
BRDB credit disbursed to men in the village increases income inequality by .008. It would be of
interest to explore the characteristics of borrowers and the sources of income in order to
decompose inequality and trace some of these dynamic effects.
5. Conclusion
Having explored the empirical relationship between microfinance and borrower welfare
as measured by the effect on household income in previous chapters, this chapter serves to
expand impact analysis by examining effects beyond individual borrowers. To do this, I estimate
the effect of microcredit and other village characteristic on village income inequality.
I find robust evidence that suggest that microcredit augments income at the village level.
The results suggest that microfinance also increases income inequality at the village-level. This
was evident across most model specifications and econometric methods. Increases in holdings of
nonagricultural assets also tend to increase village income inequality. Another robust result is
the empirical association between higher educational achievement and decreases in income
inequality at the village-level.
One important implication we can gather from these results is the fact that assets are not
homogeneous in terms of the return to income or the contribution they may have to changes in
income inequality. The results obtained here are reasonable in terms of what we would expect.
136
We would expect that education assets would have a decreasing or equalizing effect on income
inequality since higher education levels are typically associated with greater managerial ability,
higher productivity and subsequently, higher incomes. Other assets, such as equipment and
livestock tend to fluctuate both in value and in quantities (this is true particularly in Bangladesh
where weather conditions tend to be severe and destructive) and as such we would expect that
the contribution of these assets to income generation would vary over time. In this context,
obtaining consistent results for these assets would be difficult.
The results and analysis presented in this chapter are preliminary, but they raise important
questions. First, if microfinance helps poor households generate income, why do we observe, as
suggested by the empirical results here, an increase in income inequality as a result of access to
microcredit? Intuitively, if microfinance benefits the poorest borrowers, one would expect
income inequality to decrease. One possible explanation for the results observed here is the fact
that in the sample, there was a significant number of non-target households who received
microcredit loans from the three programs analyzed in this study. As mentioned earlier, a non-
target borrower or a borrower who does not qualify to receive a micro loan, is a person who
owns more than half an acre of land. A poor borrower in this study is defined as a borrower who
owns half an acre of land or less. If we look at Table 4.2, presented earlier, we would observe
that in the 1991/92 survey, the participation rate in the group that owns .51-1.00 acre of land is
24.3%, 16.0% in the group owning 1.01-2.50 acres of land and 7.1% in the group owning 2.51+
acres of land. The participation rate among these wealthier borrowers increased significantly in
the 1998/99 re-survey.
137
In the 1998/99 survey, the participation rate in the group that owns .51-1.00 acre of land is
43.7%, 35.0% in the group owning 1.01-2.50 acres of land and 12.0% in the group owning 2.51+
acres of land. If these households were resource wealthy (as defined by the World Bank/BIDS
study) before they obtained the micro loan, it is possible for microcredit’s return to be greater
than that of poorer borrowers. Given this scenario, it is also possible for the income gap between
these groups to become wider. If this is the case, the results observed in this study, namely that
microfinance has a positive and statistically significant effect on intra-village inequality, are not
counterintuitive.
Another question prompted by the results obtained in this chapter is whether microcredit
loans are associated with a positive and statistically significant effect on income for all income
quantiles. The magnitude of this effect would also be worthy of analysis. The findings in this
chapter contribute to the understanding of the relationship between microfinance and income
inequality but they do not end the discussion.
As mentioned in the earlier sections of this paper, the literature on this topic presents
mixed results as to the effect microfinance has on income inequality. Future research should
focus on short-term and long-term effects concerning issues within-household inequality and
distribution as well as village-level effects. Other issues that should be addressed in future
research is whether the institutional policies and delivery methods of the microfinance institution
(MFI) have any effect on income inequality.

138
Looking at the empirical relationship between microfinance and income inequality serves
as a point of departure for exploring the general equilibrium effects of microfinance.
Establishing consensus about these general equilibrium effects is important for future economic
development because if income inequality is viewed as having negative consequences for
development as well as social indicators of welfare, it must be addressed in future research.
If microfinance has the effect of increasing inequality within a village, then this is an issue that
needs further examination because as previously stated, this can undermine economic
development and poverty reduction efforts.
139
CHAPTER V
Microfinance as a Development and Poverty Reduction Tool: Concluding Remarks
This dissertation examined the empirical relationship between microfinance and
economic outcomes for households and villages in Bangladesh. The main objective was to
explore how microfinance contributes to income and how the services provided by microfinance
programs enhance the effectiveness of microcredit in increasing household income. Once a
general empirical relationship between microfinance and income was established, this study was
expanded to analysis at the village level to see if spillover effects could be traced as a result of
access to microfinance loans. The study of spillover effects was limited to an inquiry as to
whether microfinance creates income inequality at the village level and whether there are other
factors that contribute to income inequality.
The topics chosen for this dissertation contribute to the current literature on microfinance
in important ways. In the study presented in chapter 2, household-level panel data from
Bangladesh was used to trace the marginal effect of microcredit on household income. The
motivation for this study stemmed from the idea that if income growth is important for poverty
reduction, then looking at whether microfinance loans contribute to increases in income would
be a relevant research question. Other studies that use this dataset have examined the impact of
microfinance on household consumption expenditure (i.e. Khandker 2005). Since both income
and consumption are used to measure poverty, one of the objectives of this study was to see if
the results in Khandker (2005) could be confirmed.
140
The findings in this study confirm the results in Khandker (2005) and provide further
robustness to the evidence on the effectiveness of microfinance in poverty alleviation. In the
Khandker (2005) study, the findings suggested that microfinance benefits women borrowers
more than men. In this study, the results suggest that both men and women benefit from
receiving microfinance loans. Furthermore, this study suggests that the greatest benefit from
receiving microfinance loans accrues to households who are resource poor (i.e. own =.50 acres
of land) and households that are less educated (i.e. <4yrs of schooling).
The results from the study in chapter 2, have important policy implications for
microcredit as a development strategy and as poverty reduction tool. The results suggest that as
an economic development strategy, microfinance can contribute to higher earnings and thereby
encourage the use of these loans for entrepreneurial activities. In terms of poverty, if loans
contribute to increases in income, then this is a positive step towards less poverty and more
economic prosperity.
The findings in chapter 2, also provide some ground for further research on the impact of
microfinance. The findings suggest that given the small magnitude of the impact, the provision
of credit alone will not create significant poverty reduction. In this context, in order to increase
the magnitude of the impact, microcredit should be complemented with education, training,
investment opportunities and gender equality. The extent to which microfinance institutions
should be responsible for providing these conditions is not the issue here. Rather, this study
advocates for the provision of a social and economic environment that would be conducive for
the poor to flourish both as entrepreneurs and as people.
141
The study presented in chapter 3, extends the analysis in chapter 2 by exploring whether
the services provided by MFIs, particularly, BRAC, BRDB and the Grameen Bank, have any
effect on the effectiveness of credit in increasing household income. In this chapter, the
capability framework of Amartya Sen was used to argue that development, as well as positive
economic outcomes for borrowers, requires the removal of the major barriers that cause
“unfreedoms” such as tyranny, poor economic opportunities, systematic social deprivation,
neglect of public facilities as well as oppression (Sen 1999, p. 3). In this context, it is argued that
without the provision of “capabilities”, or the set of opportunities that would allow borrowers to
flourish, microfinance will not be effective in significant poverty reduction.
Due to data limitations, the objective of this study was not to measure how freedoms or
capabilities are enhanced by microcredit but rather how the provision of capability-enhancing
services and microcredit enhance economic outcomes. This study contributes to the literature on
microfinance in that it provides a link that seems to be missing in the literature. The missing link
appears to be the connection or complementarities between capability-enhancing services and
microfinance. For a country like Bangladesh, particularly in rural areas, where extensive social
and economic deprivation exists, the combination of microcredit with a set of opportunities such
as education and training can play a significant role in the effectiveness of credit in reducing
poverty. The results obtained in this study suggest that the services provided by MFIs can
complement or enhance the effectiveness of micro loans in augmenting household income. In
this context, the results presented here imply that credit policies should include the provision of
other services that may help the borrower attain positive returns both socially and economically.
The results also imply that economic development, as measured by income is enhanced by the
provision of complementary services.
142
Chapter 4 enhances this dissertation by expanding the empirical analysis of the
relationship between microfinance and economic outcomes (income) at the borrower level to the
village level. The objective here was to look beyond borrower welfare and to explore whether
microfinance has any impact on village outcomes. Two village outcomes were explored: (i) the
effect of microcredit on average village income, and (ii) the effect of microcredit on intra-village
income inequality. The idea here was to see if microcredit has an impact beyond individual
borrowers and on the community as whole and whether microcredit polarizes in terms of income
equality.
Income inequality is a variable that is closely monitored by policymakers because it has
important implications for economic growth and development. At the macroeconomic level,
income inequality has been linked to negative economic growth and one of the reasons is that if a
large percentage of the population is at the bottom of the income latter, then economic growth
will lag and possibly decline. These effects can also be expected at the village level because if
income is not accruing somewhat evenly or balanced to everyone in the village, then economic
transactions will lag and slow economic growth and development in those communities.
Chapter 4 presents robust results for the effect of microfinance on village income and
income inequality. The findings suggest that microfinance does contribute to increases in
income at the village-level and that it also increases income inequality. The results also suggest
that increases in the stock (or value) of nonagricultural assets also increase village income
inequality. The only factor that is empirically associated with decreases in income inequality is
education.
143
The overall findings in Chapter 4 suggest that microfinance is an adequate policy in terms
of promoting income growth at the village-level but it does tend to polarize incomes. In this
context, the results also suggest that if we complement microcredit with more education and
more investment opportunities for asset accumulation, we may be able to achieve a more
equalizing effect in terms of village incomes. The findings also provide a basis for further
research into the association between access to microcredit and income inequality.
The motivation behind the work employed in this dissertation stemmed from the belief
that microfinance as designed by Muhammad Yunus is a good policy for reducing poverty.
Microfinance is also an appropriate tool for encouraging entrepreneurship and fueling economic
development at the community level. The main objective of this study was to further explore the
empirical and intuitive relationship between microcredit and economic outcomes at the
individual and at the village level in order to contribute to the discussion and debate about the
effectiveness of microcredit in alleviating poverty.
The premise that leads to the conclusion of this study is that microfinance is an
appropriate policy for alleviating poverty but more is needed to attain significant poverty
reduction. The provision of funds to the poor for the acquisition of start-up capital is essential,
but those funds must be complemented with a “capability” set such as education, training and
equal opportunity for female and male borrowers. In this context, policymakers should look at
ways to invest in human capital while making credit accessible to the poor.
144
REFERENCES
Abdullah, T., and Zeidenstein, S. A. (1982). “Village women of Bangladesh: Prospects for
change. Oxford: Pergamon Press. Ahlin, Christian and Neville Jiang (2008). “Can Micro-Credit Bring Development?” Journal of
Development Economics. 86.1: 1-21. Aiken, Leona, and West, Stephen (1991). Multiple Regression: Testing and
Interpreting Interactions. London: Sage. Alamgir, Dewan A.H. (2009). “State of Microfinance in Bangladesh”. Institute
of Microfinance. Prepared as part of the project on State of Microfinance in SAARC Countries.
Ameringer, Charles, (1982). Democracy in Costa Rica. New York: Praeger Publishers. Amin S., Rai A.S., Ropa G. (2003). “Does Microcredit Reach the Poor and
Vulnerable? Evidence from Northern Bangladesh”. Journal of Development Economics, vol. 70, pp. 59-82.
Aportela, Fernado (1998). “Effect of Financial Access on Savings by
Low-Income People.” Working paper, Massachusetts Institute of Technology. Auwal, M. A. (1996). “Promoting microcapitalism in the service of the poor: The Grameen
model and its cross-cultural adaptation. The Journal of Business Communication, 33(1), 27-49.
Beck, Thorsten, Asli Demirguc-Kunt, and Ross Levine (2007). “Finance, Inequality, and the
Poor.” Journal of Economic Growth. 12(1): 27-49. Beck, T., Deminguc-Kunt, A., & Levine, R (2004). “Finance, Inequality and Poverty: Cross-
Country Evidence. NBER Working Paper 10979. Behrman, J. (1996), “The impact of health and nutrition on education”, The World Bank
Research Observer, 11(1), 23-27. Benegas, O. Jarrin, S. Escobar de Pabon, S. Rojas, B. Nusselder, H and
Sanders, A. (2002) HIVOS. “Outreach and Impact of Microcredit: Case Studies of Banco Solidario (Ecuador) and Caja los Andes (Bolivia) Centro de Estudios par el Desarrollo Rural Free University of Amsterdam, mimeo San Jose.
Bramber, Clark and Golder, (2005). “Understanding Interaction Models:
Improving Empirical Analyses”. Political Analysis, 14:63-82.
145
Burjorjee, Deena M., Deshpande, Rani, and Weidemann, C. Jean (2002), "Supporting Women's Livelihoods Microfinance that Works for the Majority. A Guide to Best Practices", United Nations Capital Development Fund, Special Unit for Microfinance.http://www.uncdf.org/english/microfinance/pubs/thematic_papers/gender/su pporting/part _1.php
Chen, M.A. and Snodgrass, D. (2001). “Managing Resources, Activities, and
Risk in Urban India: The Impact of SEWA Bank. Washington D.C.: AIMS. September, 2001
Clarke, George (1995). “More Evidence on Income Distribution and Growth.” Journal of
Development Economics. 47: 403-427. Coleman, Brett (1999). “The Impact of Group Lending in Northeast Thailand”.
Journal of Development Economics, 45, pp. 105-141. Copestake, James (2002). “Inequality and the Polarizing Impact of Microcredit: Evidence from
Zambia’s Copperbelt.” Journal of International Development. 14.6: 743-755. Cuong, Nguyn Viet, David Bigman, Marrit Van den Berg, and Vu Thieu (2007). “Impact of
Micro-Credit on Poverty and Inequality: The Case of the Vietnam Bank for Social Policies.” Paper submitted to Microfinance: What Do We Know?, Gorningen, Netherlands.
Deneulin, Severine (2006). The Capability Approach and the Praxis of
Development. Palgrave Macmillan. Dreze, Jean and Sen, Amartya (2002). India: Development and Participation.
Delhi: Oxford University Press. Dunn, E. and Arbuckle, J.G. (2001b). “The Impacts of Microcredit: A Case
Study from Peru, Assessing the Impact of Microenterprise Services (AIMS), mimeo, Management Systems International, Washington D.C.
Duong, Ph.B. and Izumida, Y. (2002). “Rural Development Finance in Vietnam:
A Microeconometric Analysis of Household Surveys”. World Development, vol 30, no. 2, pp. 319-335.
Fernando, N. (2002). “Microfinance Industry in Asia: Current Status, Recent
Trends and Some Thoughts on the Future”. Available on: http://www.adb.org/sds/doc/micNFernado.pdf
Friedrich, Robert (1982). “In Defense of Multiplicative Terms in Multiple
Regression Equations.” American Journal of Political Science 26:797-833.
146
Galor, Oded and Joseph Zeira (1993). “Income Distribution and Macroeconomics.” Review of Economic Studies. 60: 35-52.
Gertler, P., Levine, D.I., Moreti, E. (2003). “Do Microfinance Programs Help
Families Insure Consumption Against Illness? University of California, Berkeley, Center for International Development Economics Research (CIDER), Working Paper No. CO3-129.
Green CJ, Kirkpatrick CH, Murinde V (2006). “Finance for Small Enterprise Growth and
Poverty Reduction in Developing Countries.” Journal of International Development. 18(7): 1017-1030.
Greene, William H., (2003). Econometric Analysis, Fith Edition, Prentic Hall,
Upper Saddle River, New Jersey, pp. 123-124. Griffin, Keith and McKinley, Terry (1994). Implementing a Human
Development Strategy. London: Macmillan. Haque, K. M. (2006). “Microfinance in Bangladesh: Major Achievements and
New Challenges. Paper proceedings of the SAARCFINANCE Governors’ Symposium on Microfinance held in Dhaka, Bangladesh, 15-16 February 2006.
Hashemi, Syed M., Sidney R. Schuler and Ann P. Riley (1996). “Rural Credit Programs and
Women’s Empowerment in Bangladesh”, World Development 24 (April): 635-53. Hausman, J.A., “Specification test in econometrics” (1978), Econometrica 46(6), 1251-1271. Heckscher, Eli. (1919). "The Effects of Foreign Trade on the Distribution
of Income," Ekonomisk Tidskrift, Vol. 21, pp. 497-512 Hossain, M. and Sen, B. (1992). “Rural Poverty in Bangladesh: Trends
and Determinants”. Asian Development Review, 10(1), 1-34. Hossain, M., Sen, B., and Rahman, H.Z. (2000). “Growth and Distribution
of Rural Income in Bangladesh.” Economic and Political Weekly, 35(52-53), 43-61.
Hsiao, C., “Analysis of Panel Data” (1986), Cambridge Univ. Press. Hulme, D. and Moseley, P. (1996). “Finance Against Poverty, Volumes 1 and
2, Routledge: London. Jalilian H, Kirkpatrick C (2002). “Financial Development and Poverty Reduction in Developing
Countries.” International Journal of Finance and Economics. 7(2): 97-108.
147
Jolly, Richard and Mehrotra, Santosh (eds) (1997). Development with a Human Face. Oxford: Clarendon Press.
Jenkins, Stephen P. (2006). “Variance estimation for quintile group shares, cumulative shares, and Gini coefficient”. United Kingdom Stata Users' Group Meetings 2006 from Stata Users Group. http://econpapers.repec.org/paper/bocusug06/07.htm. Accessed October 29, 2012.
Kamaluddin, S. (1993, March 18). “Lender with a mission. Bangladesh’s Grameen Bank targets poorest of the poor”. Far Eastern Economic Review, 156 (11), 38-40.
Kai H. Hamuri S (2009b). “Globalization, Financial Depth and Inequality in Sub-Saharan
Africa.” Economic Bulletin. 29(3): 2025-2037. Khan, H. (1998). “Women and community development in Bangladesh”. In M. F. Levy Each in
her own way: Five women leaders of the developing world (pp. 31-59). Boulder, CO: Lynne Riener Publishers.
Khandker, Shahidur R., and Khalily, Baqui (1996). “The Bangladesh Rural
Advancement Committee’s Credit Programs: Performance and Sustainability. World Bank Discussion Paper 324. Washington, D.C.
Khandker, Shahidur R., Khalily, Baqui, and Zahed, Khan (1995). “Grameen
Bank: Performance and Sustainability. World Bank Discussion Paper 306. Washington, D.C.
Khandker, Shaidur R., Zahed, Khan and Khalily, Baqui, (1995). “Sustainability
of a Government Targeted Credit Program: Evidence from Bangladesh. World Bank Discussion Paper 316. Washington, D.C.
Khandker, Shahidur R (1998). “Fighting Poverty with Micro credit: Experience in Bangladesh”,
New York: Oxford University Press. Khandker, Shahidur R (2005). “Microfinance and Poverty: Evidence Using Panel Data from
Bangladesh”, The World Bank Economic Review, 17(2), 263-286. Khandker, Shahidur R (2003). “Microfinance and Poverty: Evidence Using Panel Data from
Bangladesh”, The World Bank, Policy Research Working Paper #2945. Khandker, Shahidur R. and Mark M. Pitt (2002). “The Impact of Group-Based Credit on Poor
Households: An Analysis of Panel Data from Bangladesh.” (mimeo) King, Robert E. and Levine, Ross (1993a), “Financial Intermediation and Economic
Development.” in Financial Intermediation in the Construction of Europe. Editors: Colin Mayer and Xavier Vives. London: Centre for Economic Policy and Research, pp. 156-89.
148
King, Robert E. and Levine, Ross (1993b), “Finance and Growth: Schumpeter Might Be Right,” Quarterly Journal of Economics, 108(3), pp. 717-37.
King, Robert E. and Levine, Ross (1993c), “Finance, Entrepreneurship, and Growth: Theory and
Evidence.” Journal of Monetary Economics, December, 32(3), pp. 513-42. Koboski, Joseph, P. and Townsend, Robert M. (2005). “Policies and Impact: An
Analysis of Village-Level Microfinance Institutions Koenker, Roger (2000). “Quantile Regression”. International Encyclopedia of the Social
Sciences. Edited by Stephen Fienberg and Jay Kadane. Available at https://docs.google.com/viewer?a=v&q=cache:R7b-T014nv0J:www.econ.uiuc.edu/~roger/research/rq/rq.pdf+check+function+quantile+regression&hl=en&gl=us&pid=bl&srcid=ADGEESiTIsRgYe4xs73asQ1yEk9J2rRaVuDH66BZJLoWuRLhfYTSC6zRReW73Hxe7Bi4waZVyjhss2nbmhhM2rrxUgwhhFKdClzZwSnW69y7MfidWM5ywju5vYvrkvvOeW8S10BkkSiK&sig=AHIEtbSZFVI8p8Rq_TWIbIy7BpMaeqGt1w. Accessed October 26, 2012.
Levine, Ross (1997), “Financial Development and Economic Growth.” Journal of Economic
Literature, 35(2), pp. 688-726. Levine, Ross (1998), “The Legal Environment, Banks, and Long-Run Economic Growth.”
University of Virginia, January, mimeo. Lucas, Robert E. Jr. (1988), "On the Mechanics of Economic Development," Journal of
Monetary Economics, 22(1), pp. 3-42. Microfinance Institute, (2010). “Microfinance in SAARC Countries”. Overview Report. Morduch, Jonathan and Haley, Barbara (2002). “Analysis of the Effects of
Microfinance on Poverty Reduction”. NYU Wagner Working Paper No. 1014. Available at: http://pdf.wri.org/ref/morduch_02_analysis_effects.pdf. Accessed on June 2011.
Morduch J (1998). “Does Microfinance Really Help the Poor? New Evidence from Flagship
Programs in Bangladesh.” New York University, nyu.edu/projects/morduch/.../Does_Microfinance_Really_Help.pdf. Accessed May 2011.
Mosley, P. (2001). “Microfinance and Poverty in Bolivia”. Journal of
Development Studies, vol 37, No. 4, pp. 101-132 Mundlak, Yair, (1978). “On the Pooling of Time Series and Cross Section
Data”. Econometrica, Vol. 46, No. 1, pp. 69-85.
149
Navajas, S., Schreiner, M., Meyer, R.L, Gonzalez-Vega, C. and Rodrigez-Mesa, J. (2000). “Microcredit and the Poorest of the Poor: Theory and Evidence from Bolivia” World Development, 28, pp. 333-346.
Navajas, Sergio and Tejerina Luis (2006). “Microfinance in Latin America
and the Caribbean: How Large is the Market?”. Inter-American Development Bank, Sustainable Development Department Best Practice Series, MSM-135, Washington D.C.
North Carolina State University
http://search.ncsu.edu/?cx=015938034614832269431%3Av_-81jqd7vq&cof=FORID%3A11&q=multiple+regression&search-submit.x=0&search-submit.y=0. Accessed July 2011.
Ohlin, Bertil. (1933). Interregional and International Trade, Harvard University
Press, Cambridge, 1933 Pagano, Marco (1993), “Financial Markets and Growth: An Overview.” European Economic
Review, 37, pp. 613-22. Papa, M. J., Auwal, M. A., and Singhal, A. (1995). “Dialectic of control and emancipation in
organizing for social change. A multitheoretic study of the Grameen Bank in Bangladesh”. Communications Theory, 5(3), 189-223.
Park, A. and Ren, C. (2001). “Microfinance with Chinese Characteristics.
World Development, vol. 29, no. 1, pp. 39-52. Parker, J., & Nagarajan, G. (2001). “Can Microfinance Meet the Poor’s Needs in Times of
Natural Disaster?” Microenterprise Best Practices, Development Alternatives, Inc. Pearson, Karl (1908), editor. “A Second Study of the Statistics of
Pulmonary Tuberculosis: Marital Infection”. (London, 1908). Persson, Torsten and Guido Tabellini (1994). “Is Inequality Harmful for Growth?” American
Economic Review. 84.3: 600-621. Pitt, Mark M. and Khandker, Shaidur R. (1998). “The Impact of Group-Based Credit Programs
on Poor Households in Bangladesh: Does the Gender of Participants Matter?”, Journal of Political Economy, 106(5), 958-996.
Pitt, M., Rosenzweig, M., & Gibbons, D. (1993). “The determinants and consequences of the
placement of programs in Indonesia. World Bank Economic Review, 7(3), 319-348. Pit, M.M., Khandker Sh.R., Chowdhury, O.H., Millimet, D.L. (2003). “Credit Programs for the Poor and the Health Status of Children in Rural Bangladesh”.
International Economic Review, vol. 44, No. 1, pp. 87-118.
150
Rahman, Zillur, and Hossain, eds. (1995). “Rethinking Poverty: Bangladesh as a Case Study. New Delhi: Sage Publications.
Ravallion, M. (1999). “The mystery of the vanishing benefits: Ms speedy analyst’s introduction
to evaluation”, Policy Research Working Paper No. 2153. Washington, DC: The World Bank.
Ravallion, Martin, and Sen Binayak, (1995). “When Methods Matter:
Towards a Resolution of the Debate about Bangladesh’s Poverty Meaures.” Policy Research Working Paper 1259. World Bank, Washington D.C.
Raviez, R. Mariso (2000). “Searching for Sustainable Microfinance: A Review
of Five Indonesian Initiatives.” Working Paper, Development Economics Research Group, World Bank.
Rogaly, B (1996). “Microfinance Evangelism, Destitute Women and the Hard Selling of a New
Anti-Poverty Formula.” Development in Practice, 6(2): 100-112. Sadoulet, Elisabeth, de Janvry, Alain and Davis, Benjamin (2001). “Cash Transfer Programs
with Income Multipliers: PROCAMPO in Mexico”, World Development, 29(6), 1043-1056.
Sahn, D., & Alderman, H. (1995). “The effect of food subsidies on labor supply in Sri Lanka. In:
D. van de Walle, & K. Nead (Eds), Public spending and the poor. Baltimore: The John Hopkins University Press.
Schuler, Sidney R., and Syed M. Hashemi (1994). “Credit Programs, Women’s Empowerment,
and Contraceptive Use in Rural Bangladesh”, Studies in Family Planning 25 (March/April): 65-76.
Schuler, S.R. and Hashemi S.M. (1995). “Family planning outreach and credit programs in rural
Bangladesh”. Human Organization, 54(4), 455-461. Shehabuddin, R. (1992). “The impact of Grameen Bank in Bangladesh. Empowering rural
women”. Dhaka: Grameen Bank. Sen, Amartya, (1999). Development as Freedom. Oxford: Oxford University Press. Sen, Binayak, (2003). “Drivers of Escape and Descent: Changing Household
Fortunes in Rural Bangladesh”. World Development, Vol. 31, No. 3, pp. 513-534. Stewart, Frances, (1995a). Adjustment and Poverty: Options and Choices.
London, Routledge.
151
Steward R, Van Rooyen C, Majoro M, de Wet T (2010). “What is the Impact of Microfiance on Poor People? A Systematic Review of Evidence from Sub-Saharan Africa.” The EPPI-Centre, Institute of Education, University of London.
Subbarao, K. (1997). “Public works as an anti-porverty program: an overview of cross-country
experiences”, American Journal of Agricultural Economics, 79(2), 678-683. Tanzi, Vito, (1999). “Does the World Need a World Tax Organization?”
in Assaf Razin and Efrim Sadka, editors, The Economics of Globalization (Cambridge University Press), pp. 173-86.
Tchouassi, Gerard (2011). “Microfinance, Inequality and Vulnerability: Empirical Analysis
from Central African Countries.” Journal of Development and Agricultural Economics, Vol. 3(4), pp. 150-156.
Thapa, Ganesh (2007). “Sustainability and Governance of Microfinance
Institutions: Recent Experiences and Some Lessons for Southeast Asia”. Asian Journal of Agriculture and Development, Vol. 4, No. 1.
Todaro, Michael P., Smith, Stephen C. (2008). Economic Development, Tenth Edition, Pearson
Addison Wesley, pp. 210-215. United Nations Development Programme (2011). Human Development Index.
Available at: http://www.undp.org. Accessed July 2011. Weiss, John and Montgomery Heather (2004). “Great Expectations:
Microfinance and Poverty Reduction in Asia and Latin America”. ADB Institute Discussion Paper No. 15
Westley, G. (2006). “Strategies and Structures for Commercial Banks in
Microfinance”. S Inter-American Development Bank . Sustainable Department Best Practices Series, MSM-123.. Washington D.C.
Woller, Gary and Parsons, Robert (2002). Assessing the Community Economic Impact of
Nongovernmental Development Organizations”, Nonprofit and Voluntary Sector Quarterly, 31(3), 419-428.
152
World Bank (2001). World Development Report 2000/2001. Oxford University Press, New York.
http://www.worldbank.org.bd/WBSITE/EXTERNAL/COUNTRIES/SOUTHASIAEXT/BANGLADESHEXTN/0,,contentMDK:23209442~menuPK:295765~pagePK:2865066~piPK:2865079~theSitePK:295760,00.html. Accessed August 2011.
1http://www.worldbank.org.bd/WBSITE/EXTERNAL/COUNTRIES/SOUTHASIAEXT/BANGLADESHEXTN/0,,contentMDK:22977793~pagePK:141137~piPK:141127~theSitePK:295760,00.html. Accessed August 2011.
Wright, Gerald, (1976). “Linear Models for Evaluating Conditional Relationships.” American Journal of Political Science 2:349-373.
Wydick, B. (1999). “The effect of microenterprise lending on child schooling in Guatemala”,
Economic Development and Cultural Change, 47(4), 853-869 Yunus, M. (1994a). Grameen Bank. “Does the capitalist system have to bet the handmaiden of
the rich?”. Dhaka: Grameen Bank. Zaman, H. (2001). “Assessing the Poverty and Vulnerability Impact of Micro-Credit in
Bangladesh: A Case Study of BRAC.” Background paper for the WDR 2000/2001. Zeller, M and Meyer, R.L. (2002) editors. “The Triangle of Microfinance:
Financial Sustainability, Outreach and Impact”. John Hopkins for the International Food Policy Research institute, Baltimore.
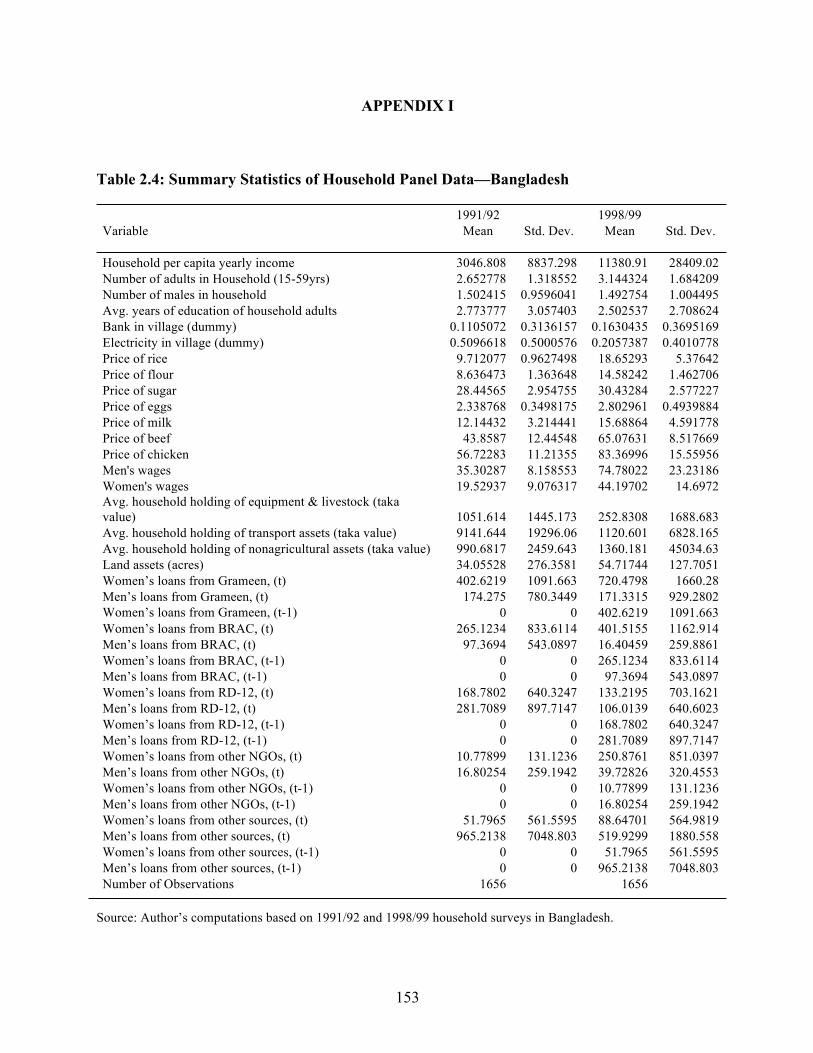
153
APPENDIX I
Table 2.4: Summary Statistics of Household Panel Data—Bangladesh
1991/92
1998/99
Variable Mean Std. Dev. Mean Std. Dev.
Household per capita yearly income 3046.808 8837.298 11380.91 28409.02 Number of adults in Household (15-59yrs) 2.652778 1.318552 3.144324 1.684209 Number of males in household 1.502415 0.9596041 1.492754 1.004495 Avg. years of education of household adults 2.773777 3.057403 2.502537 2.708624 Bank in village (dummy) 0.1105072 0.3136157 0.1630435 0.3695169 Electricity in village (dummy) 0.5096618 0.5000576 0.2057387 0.4010778 Price of rice 9.712077 0.9627498 18.65293 5.37642 Price of flour 8.636473 1.363648 14.58242 1.462706 Price of sugar 28.44565 2.954755 30.43284 2.577227 Price of eggs 2.338768 0.3498175 2.802961 0.4939884 Price of milk 12.14432 3.214441 15.68864 4.591778 Price of beef 43.8587 12.44548 65.07631 8.517669 Price of chicken 56.72283 11.21355 83.36996 15.55956 Men's wages 35.30287 8.158553 74.78022 23.23186 Women's wages 19.52937 9.076317 44.19702 14.6972 Avg. household holding of equipment & livestock (taka value) 1051.614 1445.173 252.8308 1688.683 Avg. household holding of transport assets (taka value) 9141.644 19296.06 1120.601 6828.165 Avg. household holding of nonagricultural assets (taka value) 990.6817 2459.643 1360.181 45034.63 Land assets (acres) 34.05528 276.3581 54.71744 127.7051 Women’s loans from Grameen, (t) 402.6219 1091.663 720.4798 1660.28 Men’s loans from Grameen, (t) 174.275 780.3449 171.3315 929.2802 Women’s loans from Grameen, (t-1) 0 0 402.6219 1091.663 Women’s loans from BRAC, (t) 265.1234 833.6114 401.5155 1162.914 Men’s loans from BRAC, (t) 97.3694 543.0897 16.40459 259.8861 Women’s loans from BRAC, (t-1) 0 0 265.1234 833.6114 Men’s loans from BRAC, (t-1) 0 0 97.3694 543.0897 Women’s loans from RD-12, (t) 168.7802 640.3247 133.2195 703.1621 Men’s loans from RD-12, (t) 281.7089 897.7147 106.0139 640.6023 Women’s loans from RD-12, (t-1) 0 0 168.7802 640.3247 Men’s loans from RD-12, (t-1) 0 0 281.7089 897.7147 Women’s loans from other NGOs, (t) 10.77899 131.1236 250.8761 851.0397 Men’s loans from other NGOs, (t) 16.80254 259.1942 39.72826 320.4553 Women’s loans from other NGOs, (t-1) 0 0 10.77899 131.1236 Men’s loans from other NGOs, (t-1) 0 0 16.80254 259.1942 Women’s loans from other sources, (t) 51.7965 561.5595 88.64701 564.9819 Men’s loans from other sources, (t) 965.2138 7048.803 519.9299 1880.558 Women’s loans from other sources, (t-1) 0 0 51.7965 561.5595 Men’s loans from other sources, (t-1) 0 0 965.2138 7048.803 Number of Observations 1656
1656
Source: Author’s computations based on 1991/92 and 1998/99 household surveys in Bangladesh.
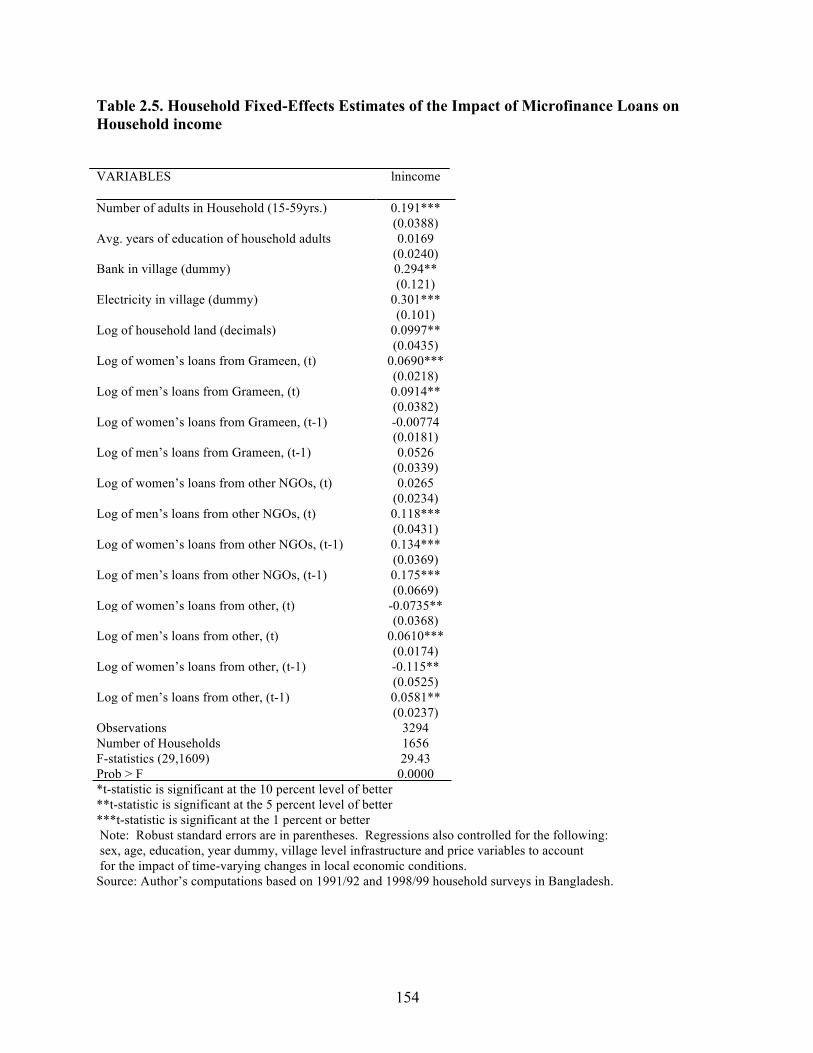
154
Table 2.5. Household Fixed-Effects Estimates of the Impact of Microfinance Loans on Household income
*t-statistic is significant at the 10 percent level of better **t-statistic is significant at the 5 percent level of better ***t-statistic is significant at the 1 percent or better Note: Robust standard errors are in parentheses. Regressions also controlled for the following: sex, age, education, year dummy, village level infrastructure and price variables to account for the impact of time-varying changes in local economic conditions. Source: Author’s computations based on 1991/92 and 1998/99 household surveys in Bangladesh.
VARIABLES lnincome Number of adults in Household (15-59yrs.) 0.191*** (0.0388) Avg. years of education of household adults 0.0169 (0.0240) Bank in village (dummy) 0.294** (0.121) Electricity in village (dummy) 0.301*** (0.101) Log of household land (decimals) 0.0997** (0.0435) Log of women’s loans from Grameen, (t) 0.0690*** (0.0218) Log of men’s loans from Grameen, (t) 0.0914** (0.0382) Log of women’s loans from Grameen, (t-1) -0.00774 (0.0181) Log of men’s loans from Grameen, (t-1) 0.0526 (0.0339) Log of women’s loans from other NGOs, (t) 0.0265 (0.0234) Log of men’s loans from other NGOs, (t) 0.118*** (0.0431) Log of women’s loans from other NGOs, (t-1) 0.134*** (0.0369) Log of men’s loans from other NGOs, (t-1) 0.175*** (0.0669) Log of women’s loans from other, (t) -0.0735** (0.0368) Log of men’s loans from other, (t) 0.0610*** (0.0174) Log of women’s loans from other, (t-1) -0.115** (0.0525) Log of men’s loans from other, (t-1) 0.0581** (0.0237) Observations 3294 Number of Households 1656 F-statistics (29,1609) 29.43 Prob > F 0.0000
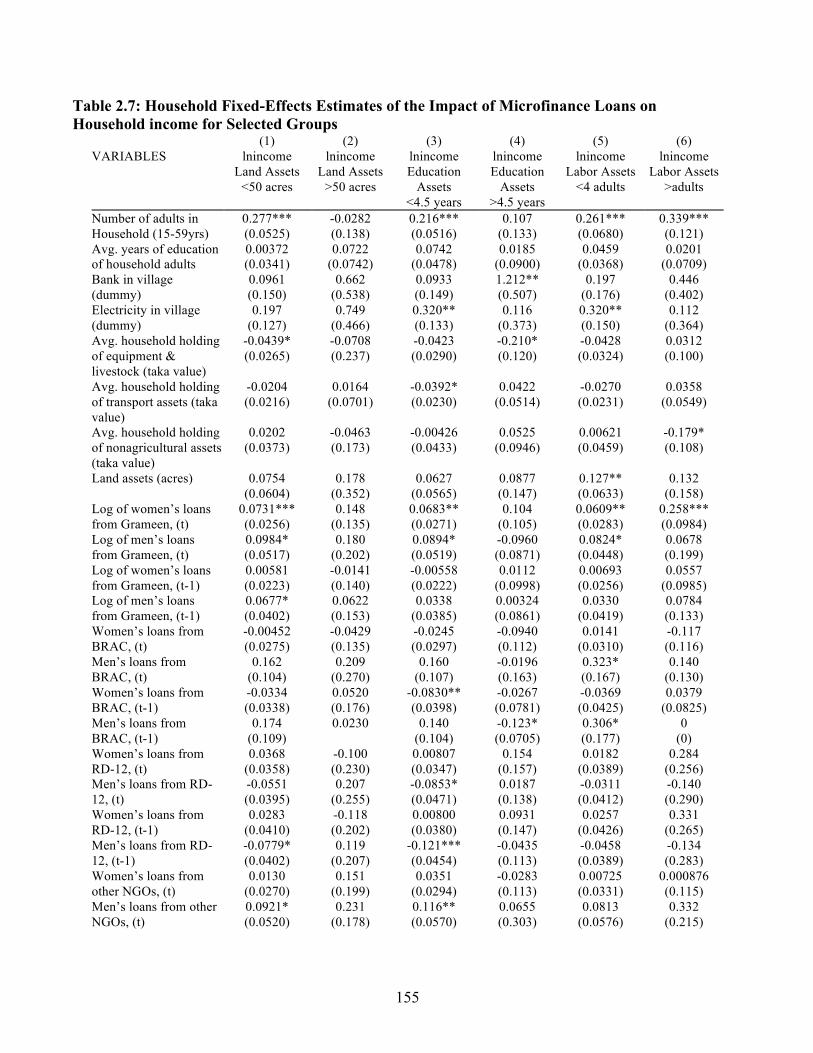
155
Table 2.7: Household Fixed-Effects Estimates of the Impact of Microfinance Loans on Household income for Selected Groups
(1) (2) (3) (4) (5) (6) VARIABLES lnincome lnincome lnincome lnincome lnincome lnincome Land Assets
<50 acres Land Assets
>50 acres Education
Assets <4.5 years
Education Assets
>4.5 years
Labor Assets <4 adults
Labor Assets >adults
Number of adults in Household (15-59yrs)
0.277*** (0.0525)
-0.0282 (0.138)
0.216*** (0.0516)
0.107 (0.133)
0.261*** (0.0680)
0.339*** (0.121)
Avg. years of education of household adults
0.00372 (0.0341)
0.0722 (0.0742)
0.0742 (0.0478)
0.0185 (0.0900)
0.0459 (0.0368)
0.0201 (0.0709)
Bank in village (dummy)
0.0961 (0.150)
0.662 (0.538)
0.0933 (0.149)
1.212** (0.507)
0.197 (0.176)
0.446 (0.402)
Electricity in village (dummy)
0.197 (0.127)
0.749 (0.466)
0.320** (0.133)
0.116 (0.373)
0.320** (0.150)
0.112 (0.364)
Avg. household holding of equipment & livestock (taka value)
-0.0439* (0.0265)
-0.0708 (0.237)
-0.0423 (0.0290)
-0.210* (0.120)
-0.0428 (0.0324)
0.0312 (0.100)
Avg. household holding of transport assets (taka value)
-0.0204 (0.0216)
0.0164 (0.0701)
-0.0392* (0.0230)
0.0422 (0.0514)
-0.0270 (0.0231)
0.0358 (0.0549)
Avg. household holding of nonagricultural assets (taka value)
0.0202 (0.0373)
-0.0463 (0.173)
-0.00426 (0.0433)
0.0525 (0.0946)
0.00621 (0.0459)
-0.179* (0.108)
Land assets (acres) 0.0754 0.178 0.0627 0.0877 0.127** 0.132 (0.0604) (0.352) (0.0565) (0.147) (0.0633) (0.158) Log of women’s loans from Grameen, (t)
0.0731*** (0.0256)
0.148 (0.135)
0.0683** (0.0271)
0.104 (0.105)
0.0609** (0.0283)
0.258*** (0.0984)
Log of men’s loans from Grameen, (t)
0.0984* (0.0517)
0.180 (0.202)
0.0894* (0.0519)
-0.0960 (0.0871)
0.0824* (0.0448)
0.0678 (0.199)
Log of women’s loans from Grameen, (t-1)
0.00581 (0.0223)
-0.0141 (0.140)
-0.00558 (0.0222)
0.0112 (0.0998)
0.00693 (0.0256)
0.0557 (0.0985)
Log of men’s loans from Grameen, (t-1)
0.0677* (0.0402)
0.0622 (0.153)
0.0338 (0.0385)
0.00324 (0.0861)
0.0330 (0.0419)
0.0784 (0.133)
Women’s loans from BRAC, (t)
-0.00452 (0.0275)
-0.0429 (0.135)
-0.0245 (0.0297)
-0.0940 (0.112)
0.0141 (0.0310)
-0.117 (0.116)
Men’s loans from BRAC, (t)
0.162 (0.104)
0.209 (0.270)
0.160 (0.107)
-0.0196 (0.163)
0.323* (0.167)
0.140 (0.130)
Women’s loans from BRAC, (t-1)
-0.0334 (0.0338)
0.0520 (0.176)
-0.0830** (0.0398)
-0.0267 (0.0781)
-0.0369 (0.0425)
0.0379 (0.0825)
Men’s loans from BRAC, (t-1)
0.174 (0.109)
0.0230 0.140 (0.104)
-0.123* (0.0705)
0.306* (0.177)
0 (0)
Women’s loans from RD-12, (t)
0.0368 (0.0358)
-0.100 (0.230)
0.00807 (0.0347)
0.154 (0.157)
0.0182 (0.0389)
0.284 (0.256)
Men’s loans from RD-12, (t)
-0.0551 (0.0395)
0.207 (0.255)
-0.0853* (0.0471)
0.0187 (0.138)
-0.0311 (0.0412)
-0.140 (0.290)
Women’s loans from RD-12, (t-1)
0.0283 (0.0410)
-0.118 (0.202)
0.00800 (0.0380)
0.0931 (0.147)
0.0257 (0.0426)
0.331 (0.265)
Men’s loans from RD-12, (t-1)
-0.0779* (0.0402)
0.119 (0.207)
-0.121*** (0.0454)
-0.0435 (0.113)
-0.0458 (0.0389)
-0.134 (0.283)
Women’s loans from other NGOs, (t)
0.0130 (0.0270)
0.151 (0.199)
0.0351 (0.0294)
-0.0283 (0.113)
0.00725 (0.0331)
0.000876 (0.115)
Men’s loans from other NGOs, (t)
0.0921* (0.0520)
0.231 (0.178)
0.116** (0.0570)
0.0655 (0.303)
0.0813 (0.0576)
0.332 (0.215)
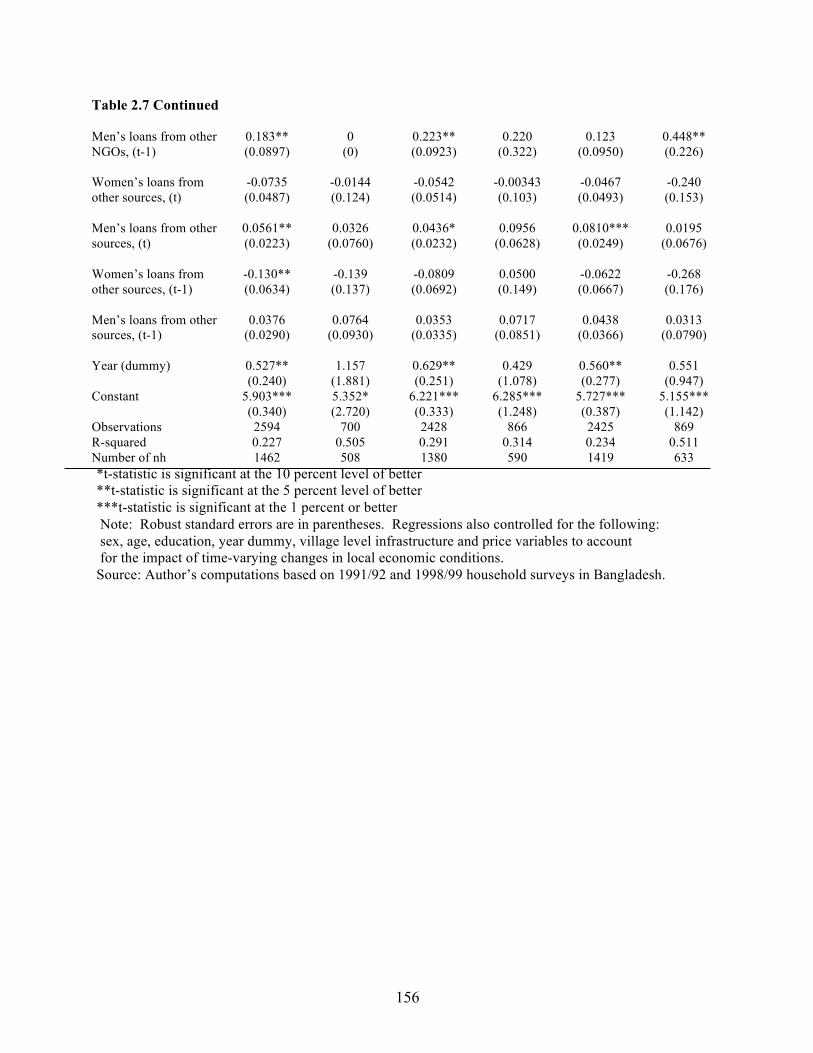
156
Table 2.7 Continued Men’s loans from other NGOs, (t-1)
0.183** (0.0897)
0 (0)
0.223** (0.0923)
0.220 (0.322)
0.123 (0.0950)
0.448** (0.226)
Women’s loans from other sources, (t)
-0.0735 (0.0487)
-0.0144 (0.124)
-0.0542 (0.0514)
-0.00343 (0.103)
-0.0467 (0.0493)
-0.240 (0.153)
Men’s loans from other sources, (t)
0.0561** (0.0223)
0.0326 (0.0760)
0.0436* (0.0232)
0.0956 (0.0628)
0.0810*** (0.0249)
0.0195 (0.0676)
Women’s loans from other sources, (t-1)
-0.130** (0.0634)
-0.139 (0.137)
-0.0809 (0.0692)
0.0500 (0.149)
-0.0622 (0.0667)
-0.268 (0.176)
Men’s loans from other sources, (t-1)
0.0376 (0.0290)
0.0764 (0.0930)
0.0353 (0.0335)
0.0717 (0.0851)
0.0438 (0.0366)
0.0313 (0.0790)
Year (dummy) 0.527** 1.157 0.629** 0.429 0.560** 0.551 (0.240) (1.881) (0.251) (1.078) (0.277) (0.947) Constant 5.903*** 5.352* 6.221*** 6.285*** 5.727*** 5.155*** (0.340) (2.720) (0.333) (1.248) (0.387) (1.142) Observations 2594 700 2428 866 2425 869 R-squared 0.227 0.505 0.291 0.314 0.234 0.511 Number of nh 1462 508 1380 590 1419 633 *t-statistic is significant at the 10 percent level of better **t-statistic is significant at the 5 percent level of better ***t-statistic is significant at the 1 percent or better Note: Robust standard errors are in parentheses. Regressions also controlled for the following: sex, age, education, year dummy, village level infrastructure and price variables to account for the impact of time-varying changes in local economic conditions. Source: Author’s computations based on 1991/92 and 1998/99 household surveys in Bangladesh.
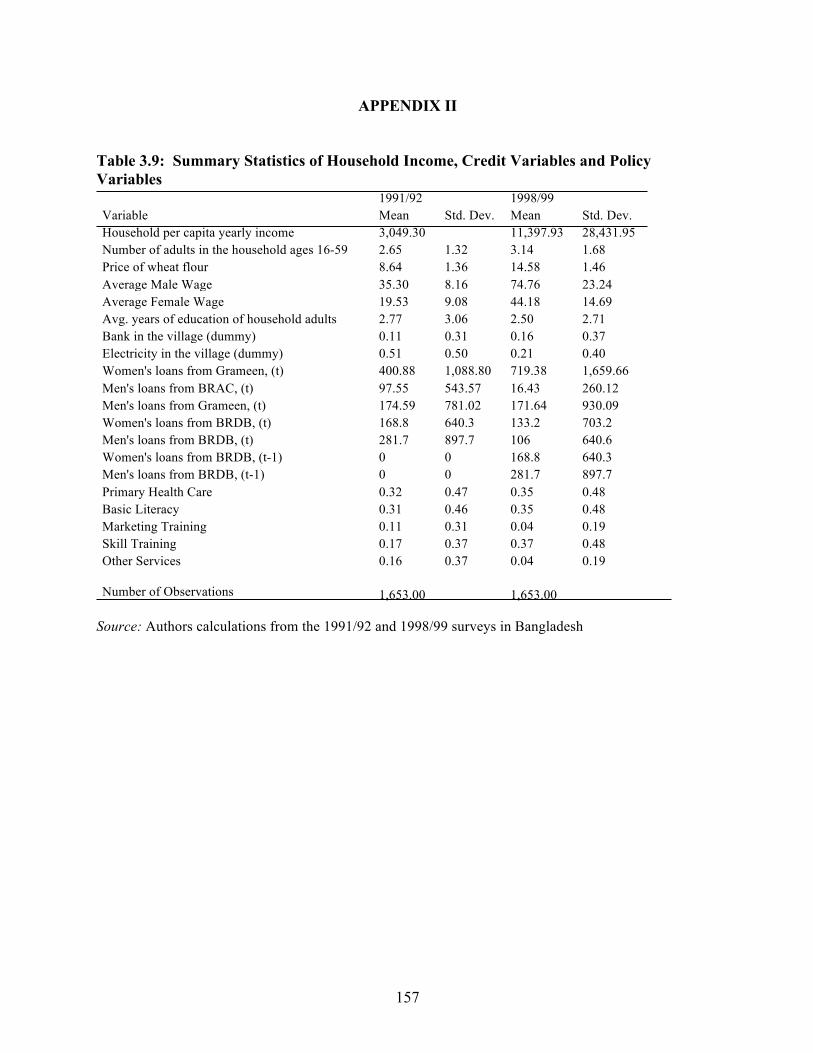
157
APPENDIX II Table 3.9: Summary Statistics of Household Income, Credit Variables and Policy Variables 1991/92 1998/99 Variable Mean Std. Dev. Mean Std. Dev. Household per capita yearly income 3,049.30 11,397.93 28,431.95 Number of adults in the household ages 16-59 2.65 1.32 3.14 1.68 Price of wheat flour 8.64 1.36 14.58 1.46 Average Male Wage 35.30 8.16 74.76 23.24 Average Female Wage 19.53 9.08 44.18 14.69 Avg. years of education of household adults 2.77 3.06 2.50 2.71 Bank in the village (dummy) 0.11 0.31 0.16 0.37 Electricity in the village (dummy) 0.51 0.50 0.21 0.40 Women's loans from Grameen, (t) 400.88 1,088.80 719.38 1,659.66 Men's loans from BRAC, (t) 97.55 543.57 16.43 260.12 Men's loans from Grameen, (t) 174.59 781.02 171.64 930.09 Women's loans from BRDB, (t) 168.8 640.3 133.2 703.2 Men's loans from BRDB, (t) 281.7 897.7 106 640.6 Women's loans from BRDB, (t-1) 0 0 168.8 640.3 Men's loans from BRDB, (t-1) 0 0 281.7 897.7 Primary Health Care 0.32 0.47 0.35 0.48 Basic Literacy 0.31 0.46 0.35 0.48 Marketing Training 0.11 0.31 0.04 0.19 Skill Training 0.17 0.37 0.37 0.48 Other Services 0.16 0.37 0.04 0.19 Number of Observations
1,653.00 1,653.00
Source: Authors calculations from the 1991/92 and 1998/99 surveys in Bangladesh
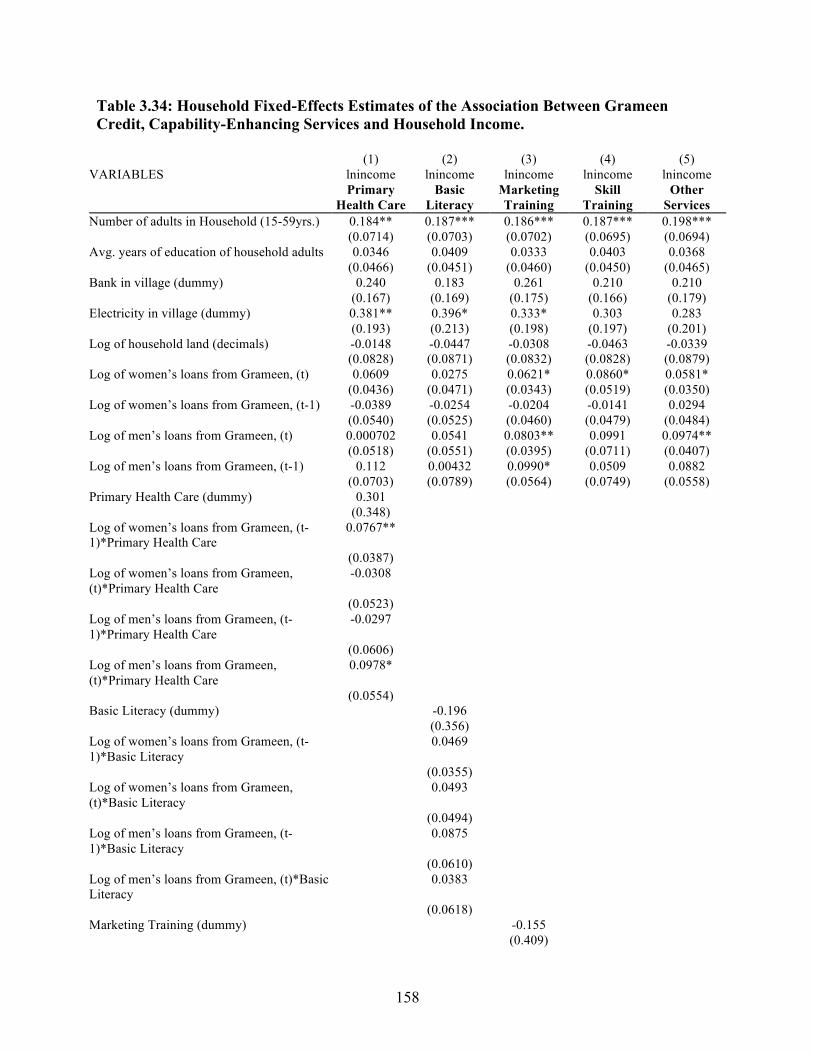
158
Table 3.34: Household Fixed-Effects Estimates of the Association Between Grameen Credit, Capability-Enhancing Services and Household Income.
(1) (2) (3) (4) (5) VARIABLES lnincome lnincome lnincome lnincome lnincome Primary
Health Care Basic
Literacy Marketing Training
Skill Training
Other Services
Number of adults in Household (15-59yrs.) 0.184** 0.187*** 0.186*** 0.187*** 0.198*** (0.0714) (0.0703) (0.0702) (0.0695) (0.0694) Avg. years of education of household adults 0.0346 0.0409 0.0333 0.0403 0.0368 (0.0466) (0.0451) (0.0460) (0.0450) (0.0465) Bank in village (dummy) 0.240 0.183 0.261 0.210 0.210 (0.167) (0.169) (0.175) (0.166) (0.179) Electricity in village (dummy) 0.381** 0.396* 0.333* 0.303 0.283 (0.193) (0.213) (0.198) (0.197) (0.201) Log of household land (decimals) -0.0148 -0.0447 -0.0308 -0.0463 -0.0339 (0.0828) (0.0871) (0.0832) (0.0828) (0.0879) Log of women’s loans from Grameen, (t) 0.0609 0.0275 0.0621* 0.0860* 0.0581* (0.0436) (0.0471) (0.0343) (0.0519) (0.0350) Log of women’s loans from Grameen, (t-1) -0.0389 -0.0254 -0.0204 -0.0141 0.0294 (0.0540) (0.0525) (0.0460) (0.0479) (0.0484) Log of men’s loans from Grameen, (t) 0.000702 0.0541 0.0803** 0.0991 0.0974** (0.0518) (0.0551) (0.0395) (0.0711) (0.0407) Log of men’s loans from Grameen, (t-1) 0.112 0.00432 0.0990* 0.0509 0.0882 (0.0703) (0.0789) (0.0564) (0.0749) (0.0558) Primary Health Care (dummy) 0.301 (0.348) Log of women’s loans from Grameen, (t-1)*Primary Health Care
0.0767**
(0.0387) Log of women’s loans from Grameen, (t)*Primary Health Care
-0.0308
(0.0523) Log of men’s loans from Grameen, (t-1)*Primary Health Care
-0.0297
(0.0606) Log of men’s loans from Grameen, (t)*Primary Health Care
0.0978*
(0.0554) Basic Literacy (dummy) -0.196 (0.356) Log of women’s loans from Grameen, (t-1)*Basic Literacy
0.0469
(0.0355) Log of women’s loans from Grameen, (t)*Basic Literacy
0.0493
(0.0494) Log of men’s loans from Grameen, (t-1)*Basic Literacy
0.0875
(0.0610) Log of men’s loans from Grameen, (t)*Basic Literacy
0.0383
(0.0618) Marketing Training (dummy) -0.155 (0.409)
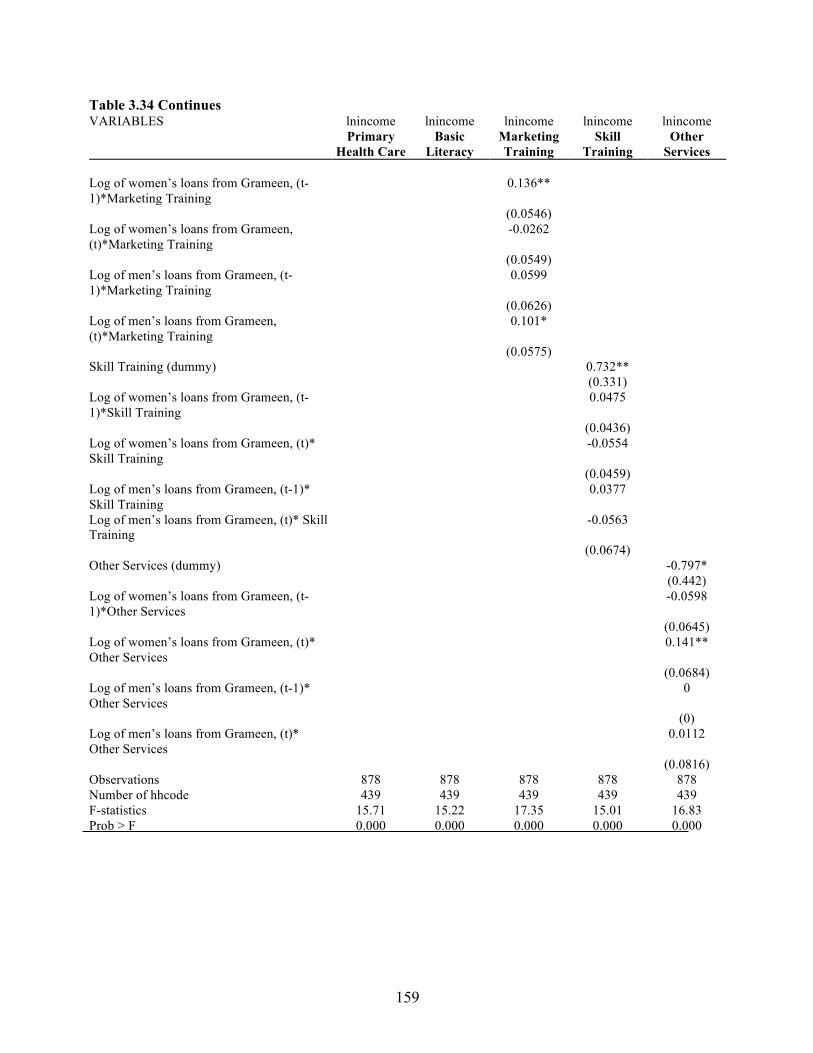
159
Table 3.34 Continues VARIABLES lnincome lnincome lnincome lnincome lnincome Primary
Health Care Basic
Literacy Marketing Training
Skill Training
Other Services
Log of women’s loans from Grameen, (t-1)*Marketing Training
0.136**
(0.0546) Log of women’s loans from Grameen, (t)*Marketing Training
-0.0262
(0.0549) Log of men’s loans from Grameen, (t-1)*Marketing Training
0.0599
(0.0626) Log of men’s loans from Grameen, (t)*Marketing Training
0.101*
(0.0575) Skill Training (dummy) 0.732** (0.331) Log of women’s loans from Grameen, (t-1)*Skill Training
0.0475
(0.0436) Log of women’s loans from Grameen, (t)* Skill Training
-0.0554
(0.0459) Log of men’s loans from Grameen, (t-1)* Skill Training
0.0377
Log of men’s loans from Grameen, (t)* Skill Training
-0.0563
(0.0674) Other Services (dummy) -0.797* (0.442) Log of women’s loans from Grameen, (t-1)*Other Services
-0.0598
(0.0645) Log of women’s loans from Grameen, (t)* Other Services
0.141**
(0.0684) Log of men’s loans from Grameen, (t-1)* Other Services
0
(0) Log of men’s loans from Grameen, (t)* Other Services
0.0112
(0.0816) Observations 878 878 878 878 878 Number of hhcode 439 439 439 439 439 F-statistics 15.71 15.22 17.35 15.01 16.83 Prob > F 0.000 0.000 0.000 0.000 0.000
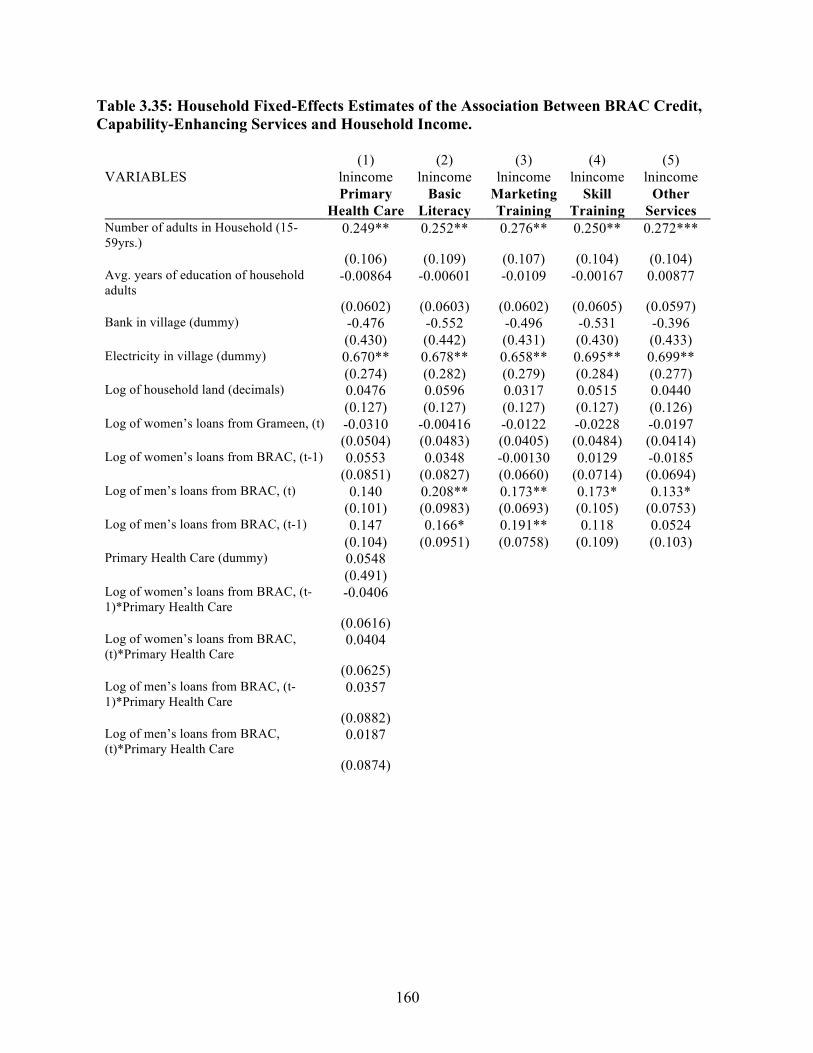
160
Table 3.35: Household Fixed-Effects Estimates of the Association Between BRAC Credit, Capability-Enhancing Services and Household Income.
(1) (2) (3) (4) (5) VARIABLES lnincome lnincome lnincome lnincome lnincome Primary
Health Care Basic
Literacy Marketing Training
Skill Training
Other Services
Number of adults in Household (15-59yrs.)
0.249** 0.252** 0.276** 0.250** 0.272***
(0.106) (0.109) (0.107) (0.104) (0.104) Avg. years of education of household adults
-0.00864 -0.00601 -0.0109 -0.00167 0.00877
(0.0602) (0.0603) (0.0602) (0.0605) (0.0597) Bank in village (dummy) -0.476 -0.552 -0.496 -0.531 -0.396 (0.430) (0.442) (0.431) (0.430) (0.433) Electricity in village (dummy) 0.670** 0.678** 0.658** 0.695** 0.699** (0.274) (0.282) (0.279) (0.284) (0.277) Log of household land (decimals) 0.0476 0.0596 0.0317 0.0515 0.0440 (0.127) (0.127) (0.127) (0.127) (0.126) Log of women’s loans from Grameen, (t) -0.0310 -0.00416 -0.0122 -0.0228 -0.0197 (0.0504) (0.0483) (0.0405) (0.0484) (0.0414) Log of women’s loans from BRAC, (t-1) 0.0553 0.0348 -0.00130 0.0129 -0.0185 (0.0851) (0.0827) (0.0660) (0.0714) (0.0694) Log of men’s loans from BRAC, (t) 0.140 0.208** 0.173** 0.173* 0.133* (0.101) (0.0983) (0.0693) (0.105) (0.0753) Log of men’s loans from BRAC, (t-1) 0.147 0.166* 0.191** 0.118 0.0524 (0.104) (0.0951) (0.0758) (0.109) (0.103) Primary Health Care (dummy) 0.0548 (0.491) Log of women’s loans from BRAC, (t-1)*Primary Health Care
-0.0406
(0.0616) Log of women’s loans from BRAC, (t)*Primary Health Care
0.0404
(0.0625) Log of men’s loans from BRAC, (t-1)*Primary Health Care
0.0357
(0.0882) Log of men’s loans from BRAC, (t)*Primary Health Care
0.0187
(0.0874)
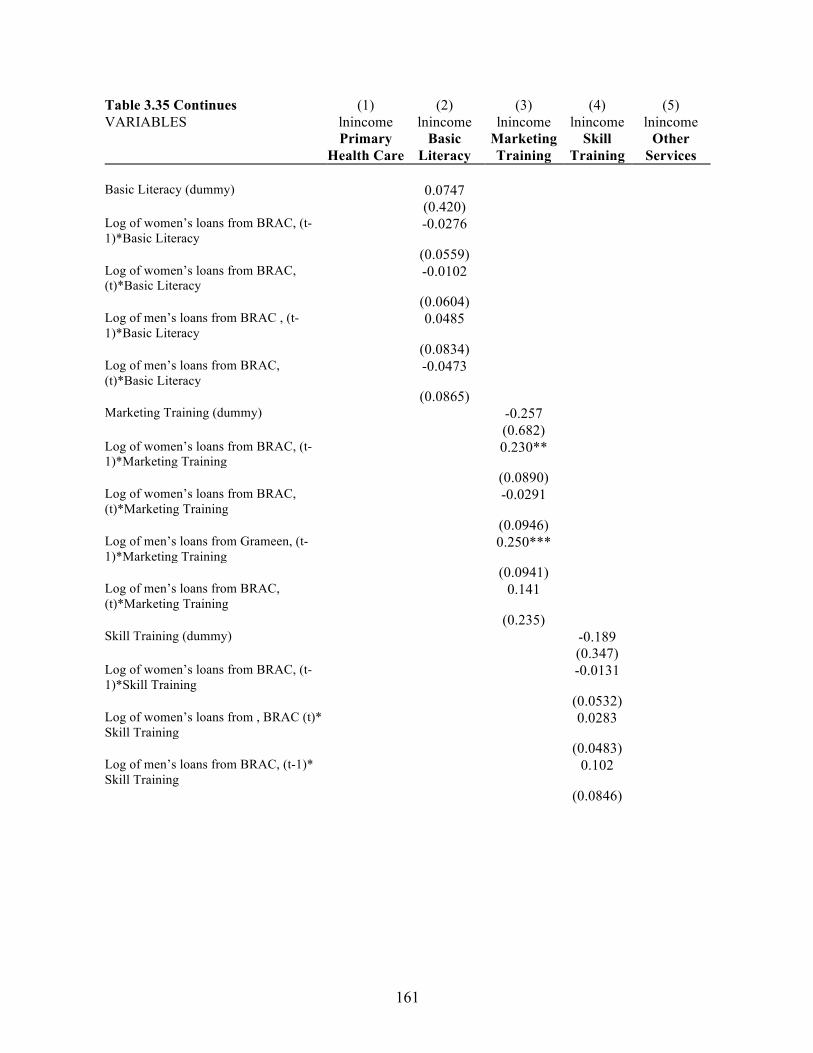
161
Table 3.35 Continues (1) (2) (3) (4) (5) VARIABLES lnincome lnincome lnincome lnincome lnincome Primary
Health Care Basic
Literacy Marketing Training
Skill Training
Other Services
Basic Literacy (dummy) 0.0747 (0.420) Log of women’s loans from BRAC, (t-1)*Basic Literacy
-0.0276
(0.0559) Log of women’s loans from BRAC, (t)*Basic Literacy
-0.0102
(0.0604) Log of men’s loans from BRAC , (t-1)*Basic Literacy
0.0485
(0.0834) Log of men’s loans from BRAC, (t)*Basic Literacy
-0.0473
(0.0865) Marketing Training (dummy) -0.257 (0.682) Log of women’s loans from BRAC, (t-1)*Marketing Training
0.230**
(0.0890) Log of women’s loans from BRAC, (t)*Marketing Training
-0.0291
(0.0946) Log of men’s loans from Grameen, (t-1)*Marketing Training
0.250***
(0.0941) Log of men’s loans from BRAC, (t)*Marketing Training
0.141
(0.235) Skill Training (dummy) -0.189 (0.347) Log of women’s loans from BRAC, (t-1)*Skill Training
-0.0131
(0.0532) Log of women’s loans from , BRAC (t)* Skill Training
0.0283
(0.0483) Log of men’s loans from BRAC, (t-1)* Skill Training
0.102
(0.0846)
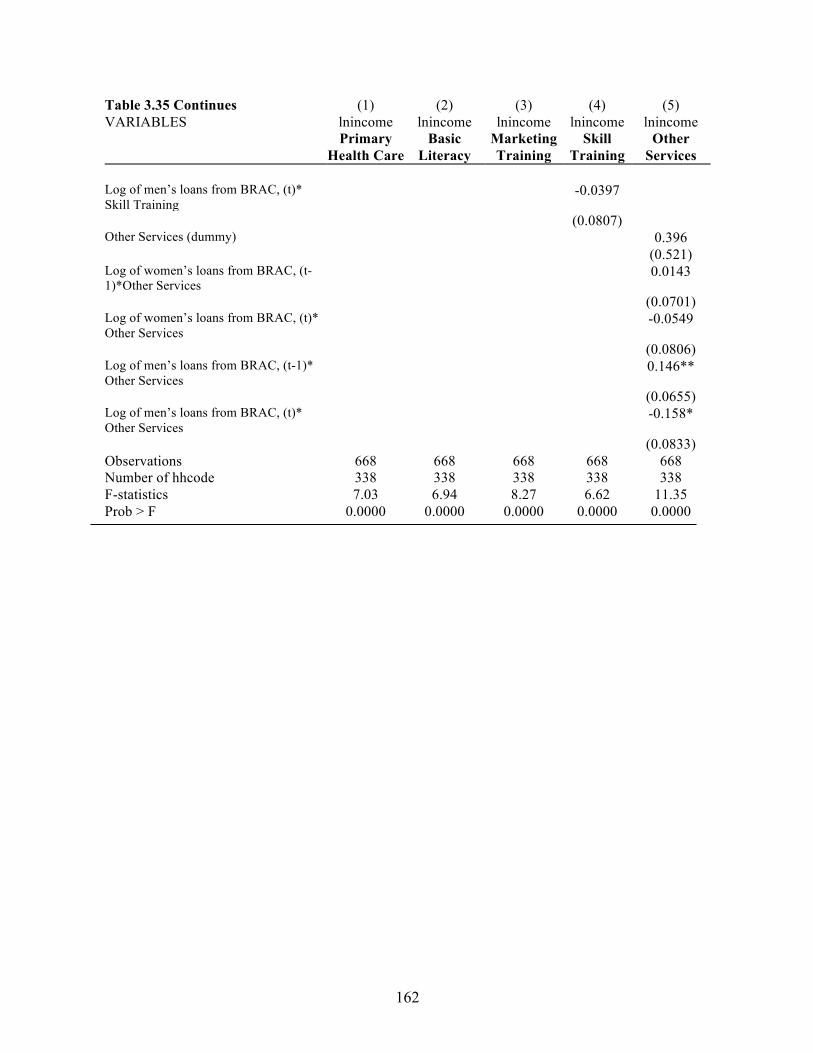
162
Table 3.35 Continues (1) (2) (3) (4) (5) VARIABLES lnincome lnincome lnincome lnincome lnincome Primary
Health Care Basic
Literacy Marketing Training
Skill Training
Other Services
Log of men’s loans from BRAC, (t)* Skill Training
-0.0397
(0.0807) Other Services (dummy) 0.396 (0.521) Log of women’s loans from BRAC, (t-1)*Other Services
0.0143
(0.0701) Log of women’s loans from BRAC, (t)* Other Services
-0.0549
(0.0806) Log of men’s loans from BRAC, (t-1)* Other Services
0.146**
(0.0655) Log of men’s loans from BRAC, (t)* Other Services
-0.158*
(0.0833) Observations 668 668 668 668 668 Number of hhcode 338 338 338 338 338 F-statistics 7.03 6.94 8.27 6.62 11.35 Prob > F 0.0000 0.0000 0.0000 0.0000 0.0000
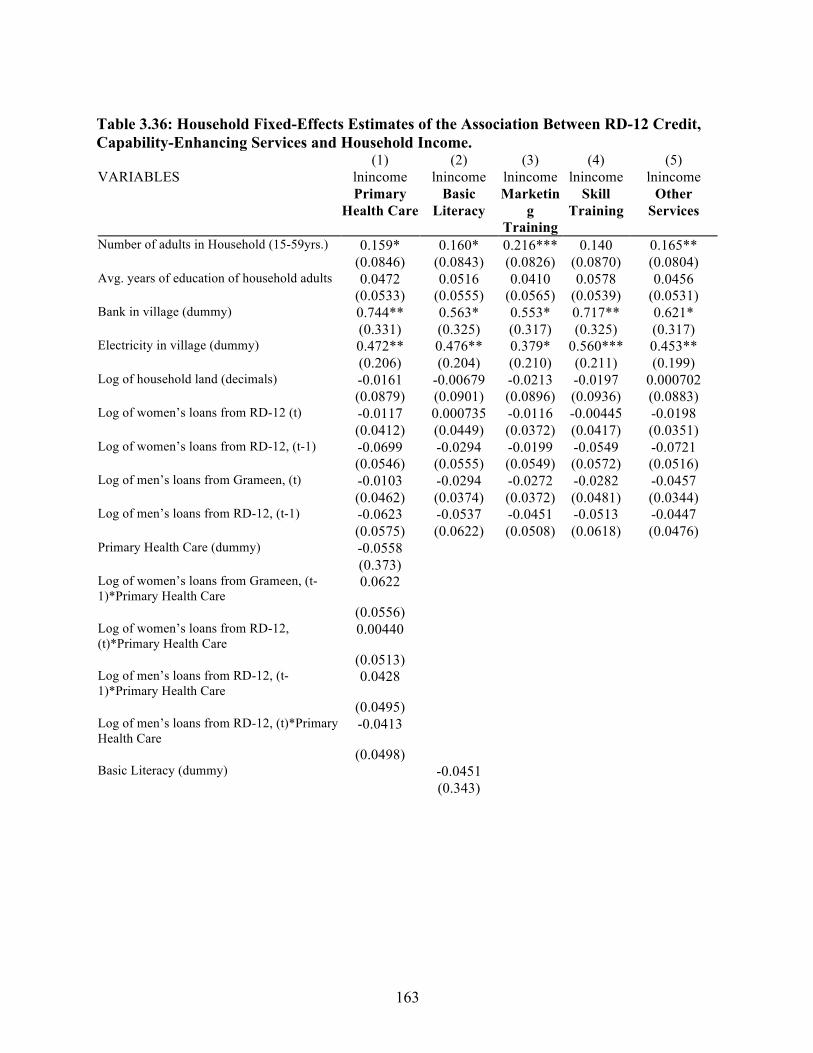
163
Table 3.36: Household Fixed-Effects Estimates of the Association Between RD-12 Credit, Capability-Enhancing Services and Household Income. (1) (2) (3) (4) (5) VARIABLES lnincome lnincome lnincome lnincome lnincome Primary
Health Care Basic
Literacy Marketin
g Training
Skill Training
Other Services
Number of adults in Household (15-59yrs.) 0.159* 0.160* 0.216*** 0.140 0.165** (0.0846) (0.0843) (0.0826) (0.0870) (0.0804) Avg. years of education of household adults 0.0472 0.0516 0.0410 0.0578 0.0456 (0.0533) (0.0555) (0.0565) (0.0539) (0.0531) Bank in village (dummy) 0.744** 0.563* 0.553* 0.717** 0.621* (0.331) (0.325) (0.317) (0.325) (0.317) Electricity in village (dummy) 0.472** 0.476** 0.379* 0.560*** 0.453** (0.206) (0.204) (0.210) (0.211) (0.199) Log of household land (decimals) -0.0161 -0.00679 -0.0213 -0.0197 0.000702 (0.0879) (0.0901) (0.0896) (0.0936) (0.0883) Log of women’s loans from RD-12 (t) -0.0117 0.000735 -0.0116 -0.00445 -0.0198 (0.0412) (0.0449) (0.0372) (0.0417) (0.0351) Log of women’s loans from RD-12, (t-1) -0.0699 -0.0294 -0.0199 -0.0549 -0.0721 (0.0546) (0.0555) (0.0549) (0.0572) (0.0516) Log of men’s loans from Grameen, (t) -0.0103 -0.0294 -0.0272 -0.0282 -0.0457 (0.0462) (0.0374) (0.0372) (0.0481) (0.0344) Log of men’s loans from RD-12, (t-1) -0.0623 -0.0537 -0.0451 -0.0513 -0.0447 (0.0575) (0.0622) (0.0508) (0.0618) (0.0476) Primary Health Care (dummy) -0.0558 (0.373) Log of women’s loans from Grameen, (t-1)*Primary Health Care
0.0622
(0.0556) Log of women’s loans from RD-12, (t)*Primary Health Care
0.00440
(0.0513) Log of men’s loans from RD-12, (t-1)*Primary Health Care
0.0428
(0.0495) Log of men’s loans from RD-12, (t)*Primary Health Care
-0.0413
(0.0498) Basic Literacy (dummy) -0.0451 (0.343)
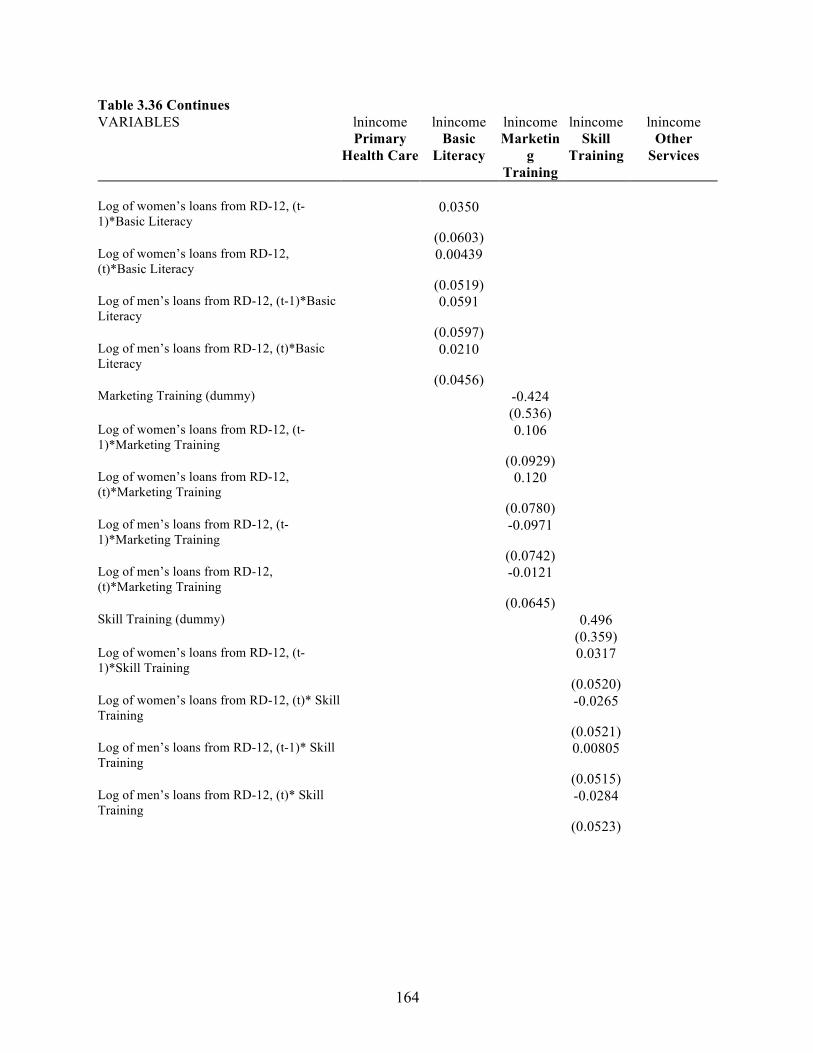
164
Table 3.36 Continues VARIABLES lnincome lnincome lnincome lnincome lnincome Primary
Health Care Basic
Literacy Marketin
g Training
Skill Training
Other Services
Log of women’s loans from RD-12, (t-1)*Basic Literacy
0.0350
(0.0603) Log of women’s loans from RD-12, (t)*Basic Literacy
0.00439
(0.0519) Log of men’s loans from RD-12, (t-1)*Basic Literacy
0.0591
(0.0597) Log of men’s loans from RD-12, (t)*Basic Literacy
0.0210
(0.0456) Marketing Training (dummy) -0.424 (0.536) Log of women’s loans from RD-12, (t-1)*Marketing Training
0.106
(0.0929) Log of women’s loans from RD-12, (t)*Marketing Training
0.120
(0.0780) Log of men’s loans from RD-12, (t-1)*Marketing Training
-0.0971
(0.0742) Log of men’s loans from RD-12, (t)*Marketing Training
-0.0121
(0.0645) Skill Training (dummy) 0.496 (0.359) Log of women’s loans from RD-12, (t-1)*Skill Training
0.0317
(0.0520) Log of women’s loans from RD-12, (t)* Skill Training
-0.0265
(0.0521) Log of men’s loans from RD-12, (t-1)* Skill Training
0.00805
(0.0515) Log of men’s loans from RD-12, (t)* Skill Training
-0.0284
(0.0523)
165
Table 3.36 Continues VARIABLES lnincome lnincome lnincome lnincome lnincome Primary
Health Care Basic
Literacy Marketin
g Training
Skill Training
Other Services
Other Services (dummy) 0.963* (0.572) Log of women’s loans from RD-12, (t-1)*Other Services
0.0696
(0.0989) Log of women’s loans from RD-12, (t)* Other Services
-0.0533
(0.0646) Log of men’s loans from RD-12, (t-1)* Other Services
-0.319***
(0.111) Log of men’s loans from RD-12, (t)* Other Services
-0.00240
(0.0747) Observations 577 577 577 577 577 Number of hhcode 289 289 289 289 289 F-statistics 7.45 7.30 7.11 8.79 9.11 Prob > F 0.000 0.000 0.000 0.000 0.000