dissertation the role of chief executive officer
TRANSCRIPT
DISSERTATION
THE ROLE OF CHIEF EXECUTIVE OFFICER
Submitted by
Margaret B. Glick
School of Education
In partial fulfillment of the requirements
For the Degree of Doctor of Philosophy
Colorado State University
Fort Collins, Colorado
Spring 2011
Doctoral Committee:
Advisor: Thomas J. Chermack
Gene W. Gloeckner
Susan A. Lynham
Jennifer K. Bond
Copyright by Margaret B. Glick 2011
All Rights Reserved
ii
ABSTRACT OF DISSERTATION
THE ROLE OF CHIEF EXECUTIVE OFFICER
The purpose of this study was to address the gap between what is reported in the
literature and what is known in current practice on the role of CEO. Research on the role
of CEO is conflicting and outdated, and the theory deduced by Mintzberg in the 1970s
has not been continually refined and updated, a necessary process for maintaining the
usefulness of a theory (Lynham, 2002). A major goal of this research was to use the
insights provided by CEOs to improve our general understanding of the major roles
played by CEOs and how they generally allocate their time in various critical functions.
CEOs are known for being a difficult population to research, yet this study has shown
they are not inaccessible.
This research was also intended to serve those responsible for identifying CEO
candidates, recruiting CEOs, coaching CEOs, sustaining an organization‘s leadership
system, and developing performance matrices for Boards of Directors who are ultimately
responsible for making sure the CEO is effective and efficient.
To investigate the role of CEO a survey instrument was developed based on 31
roles identified in the literature. The survey was sent to CEOs selected from a purchased
database by e-mail. The study focused on three research questions with the purpose of
understanding the role of CEO, how CEOs allocate their time to roles, and what new
iii
roles are identified by CEOs. Eight research hypotheses were tested to understand the
impact of gender, company ownership status, age, years in current job, years as CEO, and
company size, on the roles agreed with and time allocations. There were a number of
statistically significant findings with small effect sizes. The most significant differences
were among company sizes, defined by number of employees. Because the survey
instrument was developed specifically for this study it does not have a consistent or
lengthy track record of valid and reliable survey scores, however, results from a factor
analysis reveal high initial scores and a good basis for further instrument refinement and
development.
This study had implications for CEO role theory. The results provide evidence for
adjusting Mintzberg‘s prior theorizing about the role of CEO, and in this study, many of
the roles Mintzberg found were strongly supported, yet some were not. The roles of other
researchers and new roles suggested by study participants add depth to Mintzberg‘s work
and serve to update his theory for modern times. The impact of industry on the role of
CEO may provide help to CEOs who change industries during their careers. Finally, this
study provides implications for practice by providing benchmark data for working CEOs
about what their role is and how other CEOs allocate their time to these roles.
iv
ACKNOWLEDGEMENTS
For Pearl, you have been a constant and faithful companion on this journey.
For Scott, you are the love of my life and I thank God for you every day.
For my late dad, Tom Frisby and my mom, Sadie Frisby, who taught me I could do
anything I set my mind to, and for my late father-in-law Randall, and mother-in-law
Doris Glick, thank you for being my extra set of parents.
I am deeply thankful for a graduate committee that was supportive of my research project
as well as my personal goals:
My advisor, Tom Chermack, I can‘t thank you enough for everything you have done. I
am deeply grateful for your wisdom and support.
My methodologist, Gene Gloeckner, thanks for your help and encouragement. You are
like family to Scott and me.
Susan Lynham, you are an inspiration to me. Thank you for believing in me, being a
mentor, and a friend.
Jennifer Bond, thanks for stepping in and being there with your wisdom about surveying
CEOs.
Thank you to Mike Thoren, an inspiring CEO, and a wonderful friend.
Thank you to Stephanie Mace and Wendy Bodwell for your friendship and support.
Thank you to Dr. Henry Mintzberg for a lifetime of work on this topic and for responding
to my e-mails.
v
TABLE OF CONTENTS
ABSTRACT OF DISSERTATION ................................................................................ ii
ACKNOWLEDGEMENTS ........................................................................................... iv
TABLE OF CONTENTS .................................................................................................v
LIST OF TABLES ...................................................................................................... viii
CHAPTER ONE: INTRODUCTION AND BACKGROUND .........................................1
The Problem and the Need for This Study........................................................................1
The Problem Description and Statement ......................................................................4
Existing Research on the Problem ............................................................................6
Research Questions ......................................................................................................9
Study Purpose and Significance ................................................................................. 10
Delimitations ......................................................................................................... 13
Assumptions .......................................................................................................... 13
Definition of Terms ............................................................................................... 13
Researcher‘s Perspective ........................................................................................ 15
CHAPTER TWO: REVIEW OF THE LITERATURE ................................................... 16
Introduction ............................................................................................................... 16
Literature Review Methodology ............................................................................. 17
Part One: An Overview of the History of CEOs ......................................................... 18
Part Two: Theoretical Foundations for Studying The Role of CEO ............................ 21
Underlying Theories for HRD ................................................................................ 21
Role Theory ........................................................................................................... 23
Organizational Role Theory ................................................................................... 25
The Contribution of Role Theory in Informing Research on the Role of CEO ........ 27
Theories of Leadership........................................................................................... 28
Strategic Leadership Theory .................................................................................. 29
vi
Transformational Leadership ................................................................................. 29
Theories of Responsible Leadership for Performance ............................................. 30
The Contribution of Leadership Theories in Informing Research on the Role of CEO
.............................................................................................................................. 31
The Seminal Research of Mintzberg: A Theory of the Role of CEO........................... 32
Mintzberg‘s Methodology: Structured Observation ................................................ 33
Mintzberg‘s Contingency Theory ........................................................................... 36
The Purpose of Mintzberg‘s Research .................................................................... 36
Six Characteristics of the Work of CEOs ............................................................... 37
Part Three: Research on the Role of CEOs: The Emergence of Six Categories of Roles
.................................................................................................................................. 40
The Informational Roles ........................................................................................ 48
The Interpersonal Roles ......................................................................................... 51
The Decisional Roles ............................................................................................. 52
The Operational Roles ........................................................................................... 55
The Strategic Roles ................................................................................................ 57
The Diplomacy Roles ............................................................................................ 59
Contemporary Research: External Complexities and Their Impact on The Role of CEO
.................................................................................................................................. 62
Changes in the External Environment .................................................................... 64
Summary and Conclusions ......................................................................................... 67
CHAPTER THREE: METHODOLOGY ....................................................................... 69
Introduction ............................................................................................................... 69
Research Philosophy .................................................................................................. 75
Population and Sample .............................................................................................. 76
Sampling Procedures and External Validity ........................................................... 77
External Validity .................................................................................................... 78
The Pilot Study .......................................................................................................... 79
Instrumentation .......................................................................................................... 85
Measurement Validity and Reliability ........................................................................ 85
Data Collection .......................................................................................................... 90
vii
Research Questions and Data Analysis ...................................................................... 90
Limitations and Weaknesses ...................................................................................... 92
Summary ................................................................................................................... 93
CHAPTER FOUR: RESULTS ...................................................................................... 94
Description of Sample ............................................................................................... 94
Demographics ........................................................................................................ 96
Exploratory Factor Analysis ................................................................................... 97
Research Questions .................................................................................................. 107
Research Hypotheses Testing ............................................................................... 114
CHAPTER FIVE: DISCUSSION OF FINDINGS ....................................................... 143
Conclusions ............................................................................................................. 144
Discussion – Three Research Questions ............................................................... 144
Eight Research Hypotheses .................................................................................. 153
Summary of the Findings ......................................................................................... 159
Agreement with Roles .......................................................................................... 159
Time Allocated to the Role Categories ................................................................. 160
Limitations of the Study ....................................................................................... 162
Implications and Recommendations for Future Research ......................................... 164
Conclusion ........................................................................................................... 168
REFERENCES ............................................................................................................ 170
APPENDIX A ............................................................................................................. 181
APPENDIX B ............................................................................................................. 183
APPENDIX C ............................................................................................................. 185
APPENDIX D ............................................................................................................. 186
APPENDIX E .............................................................................................................. 187
APPENDIX F .............................................................................................................. 188
APPENDIX G ............................................................................................................. 189
viii
LIST OF TABLES
Table 1. Example Activities that Describe Mintzberg‘s 10 CEO Roles, Adapted from
Nature of Managerial Work, 1973 ................................................................................. 35
Table 2. Summary of 20 Studies Using Mintzberg‘s Theory for the Conceptual
Framework ................................................................................................................... 41
Table 3. Research Questions, Variables, and Appropriate Statistics for Analysis............ 72
Table 4. Research Conducted on the Role of CEO: Sample Size ................................... 80
Table 5. Frequency Table – Responses to Operational Roles .......................................... 84
Table 6. Role of CEO as Described by Previous Studies ................................................ 86
Table 7. Six Role Categories Described Through Constant Comparative Analysis ......... 88
Table 8. Role of CEO Survey Response Rates ............................................................... 95
Table 9. Demographic Data Provided by Survey Respondents ....................................... 98
Table 10. Demographics of Companies Included in Survey ......................................... 100
Table 11. Rotated Component Matrix .......................................................................... 102
Table 12. Eigenvalues and Variances Explained .......................................................... 103
Table 13. Component Means, Standard Deviations, Reliabilities, Variances, and Item
Loadings for the CEO Role Survey .............................................................................. 104
Table 14. Agreement with Informational Role Categories ............................................ 107
Table 15. Agreement with Interpersonal Role Categories ............................................. 108
Table 16. Agreement with Decisional Role Categories................................................. 108
Table 17. Agreement with Operational Role Categories ............................................... 109
ix
Table 18. Agreement with Strategic Role Categories ................................................... 110
Table 19. Agreement with Diplomacy Role Categories ................................................ 110
Table 20. Agreement With the Six Roles Eliminated Through Factor Analysis ............ 111
Table 21. Descriptive Statistics, Agreement With 31 Roles .......................................... 112
Table 22. Frequencies – Hours Reported in the Six Role Categories During an Average
Week ........................................................................................................................... 113
Table 23. Descriptive Statistics: Hours Reported in Six Role Categories During an
Average Week ............................................................................................................. 113
Table 24. Differences between Males and Females on Role Agreement ....................... 116
Table 25. Differences between Male and Female CEOs in Terms of Time Spent in Six
Role Categories ........................................................................................................... 117
Table 26. Majority of Time Spent in the Role Categories – Males and Females ........... 118
Table 27. Majority of Time Approximations in the Role Categories – Private Versus
Public Companies ........................................................................................................ 119
Table 28. Means and Standard Deviations Comparing Four Degree Majors or Industry
Focus of CEO Participants and Agreement with Role Categories ................................. 121
Table 29. One-Way Analysis of Variance Summary Table Comparing a CEOs Degree
Major or Industry Background on Agreement with Six Role Categories ...................... 122
Table 30 .Differences between CEOS With and Without Other C-levelEexecutives and
their Approximations of Time in the Six Role Categories ............................................ 124
Table 31. Means, Standard Deviations, and Intercorrelations for the Informational Roles
and Predictor Variables (N = 934) ............................................................................... 125
x
Table 32. Simultaneous Multiple Regression Analysis Summary for Age, Yrs. In Current
Job, Yrs. As CEO, Last Degree Earned, and Company Size in Predicting Agreement with
the Informational Role Category .................................................................................. 126
Table 33. Means, Standard Deviations, and Intercorrelations for the Interpersonal Roles
and Predictor Variables (N = 944) ............................................................................... 127
Table 34. Simultaneous Multiple Regression Analysis Summary for Age, Yrs. In Current
Job, Yrs. As CEO, Last Degree Earned, and Company Size in Predicting Agreement with
the Interpersonal Role Category ................................................................................... 128
Table 35. Means, Standard Deviations, and Intercorrelations for the Strategic Roles and
Predictor Variables (N = 908) ...................................................................................... 129
Table 36. Simultaneous Multiple Regression Analysis Summary for Age, Yrs. In Current
Job, Yrs. As CEO, Last Degree Earned, and Company Size in Predicting Agreement with
the Strategic Role Category ......................................................................................... 130
Table 37. Means, Standard Deviations, and Intercorrelations for the Diplomacy Roles and
Predictor Variables (N = 937) ...................................................................................... 131
Table 38. Simultaneous Multiple Regression Analysis Summary for Age, Yrs. In Current
Job, Yrs. As CEO, Last Degree Earned, and Company Size in Predicting Agreement with
the Diplomacy Role Category ...................................................................................... 132
Table 39. Differences between CEOs From Private versus Public Companies on Role
Agreement. .................................................................................................................. 133
Table 40. Differences between Private and Public Company CEOs on Time Spent in the
Six Role Categories ..................................................................................................... 134
xi
Table 41. Differences between CEOs from the Random versus Convenience Sample on
Role Agreement ........................................................................................................... 135
Table 42. Differences Between CEOs from the Random versus Convenience Sample on
Time Spent in Six Role Categories .............................................................................. 136
Table 43. Means and Standard Deviations Comparing Three Levels of Company Size 139
Table 44. One-Way Analysis of Variance Summary Table Comparing a CEOs Company
Size on Agreement with Six Role Categories ............................................................... 140
Table 45. Comparison Data: Time Allocations to Role Categories ............................... 161
1
CHAPTER ONE: INTRODUCTION AND BACKGROUND
This chapter introduces the problem statement that is the focus of this study.
Additionally, this chapter: 1) provides evidence of the problem and the need for this
study; 2) introduces the problem statement; 3) briefly discusses research on the problem;
4) presents the research questions that are the foundation for the study; and 5) describes
the purpose and the significance of the study. Finally, definitions of key terms and the
researcher‘s perspective are provided.
The Problem and the Need for This Study
One of the most important and influential roles in any organization is that of Chief
Executive Officer (CEO), yet research on this role remains ambiguous, conflicted, and
outdated. It is ambiguous to the extent the role is still uncertain and remains
unsubstantiated by empirical research (Edersheim, 2007; Hales, 1986; Lafley, 2009). It is
conflicted by contradicting research and by authors of popular literature claiming to know
what the role is (Ireland & Hitt, 1999), but with no empirical evidence supporting the
claims (Edersheim, 2007; Hales, 1986; Lafley, 2009). Finally, it is outdated in the sense
we continue to rely on models and theories from the late 1960s and early 1970s to guide
scholarly research on the role of CEO, seemingly ignoring the complexities of business
today and how these complexities have changed the world of work (Breene, Nunes, &
Shill, 2007; Hales, 1986).
2
During a 2003 interview, Peter Drucker commented that ―the role of CEO needed
to be the next focus of management research‖ and former CEO of Proctor and Gamble,
A. G. Lafley referred to the CEO role as ―Drucker‘s unfinished chapter‖ (Edersheim,
2007, p. 40). Much of the focus on CEOs during the past ten years has been negative due
to the widely-publicized failures of WorldCom, Enron, Arthur Andersen, and Tyco
(Matsumura & Shin, 2005; Zhang & Wiersema, 2009). These scandals were associated in
the press with CEO compensation, bringing executive compensation into the limelight.
Critics of CEO compensation packages suggest the pay is too high, it has no link to
organizational performance, and that the relative increases in compensation are immoral
and unethical (Matsumara & Shin, 2005). The bailout of banking and automotive
manufacturers during 2009 and 2010 continued to place CEOs and their compensation
packages in the news. In the turmoil of today‘s economy and in light of the tainted
reputation of CEOs, understanding the role of CEOs and how they spend their time seems
a worthy research topic.
CEOs may lead companies with extremely significant economies (Edersheim,
2007). Not only can these CEOs influence the course of their companies, employees, and
markets, in some cases they also influence the course of entire countries and regions of
the world (Boatright, 2009; Edersheim, 2007; Lynham & Cunningham, 2006). During
2006 it was estimated that ―of the hundred largest economic entities in the world, 46 were
countries, and 54 were companies‖ (Edersheim, 2007, p. 40). As manufacturing and
service centers have shifted off-shore the CEO role has also shifted to that of a global
leader. While there is much negative focus on CEO compensation, companies spend
hundreds of thousands of dollars in recruitment fees to hire these individuals, creating a
3
tension between public perception and corporate boards (Case, 2009; Matsumara & Shin,
2005).
Each of us is impacted by organizations and the CEOs who lead them. From our
basic needs for a safe food supply, clean water, and shelter to our desire for high-
definition televisions, I-Phones, and designer jeans, all of these needs are produced or
manufactured by corporations and organizations that are led by CEOs and Boards of
Directors (Kleiner, 2008). We support corporations with the purchasing power of both
our discretionary and non-discretionary spending, and our investment in retirement
accounts, yet little is known about the role of these leaders or how they focus their time
(Edersheim, 2007; Hales, 1999; Lafley, 2009).
Organizations and the CEOs who lead them have numerous stakeholders. These
stakeholders may be impacted significantly by decisions made by CEOs and Boards of
Directors. The list of stakeholders includes but is not limited to, consumers, suppliers,
investors, employees, including HR directors and other C-level executives, and Boards of
Directors. The need for this study is rooted in the need for CEOs to understand what their
roles are and how they should spend their time. Existing research is outdated and does not
provide CEOs with updated roles or time allocations. The resulting data from this study
may serve HR Directors who create job descriptions, performance appraisals, and
succession plans for CEOs. It may serve Boards of Directors, responsible for hiring and
evaluating CEOs. It may also serve the CEOs by helping them to understand their
existing roles and how time might best be allocated to major categories of roles. A CEOs
understanding of their own role may serve them well in meeting the needs of the
4
remaining stakeholders, including their employees, consumers, suppliers, investors, and
Boards of Directors.
The Problem Description and Statement
Popular literature offers an abundance of how-to-be a CEO advice, yet the advice
tends not to be based on empirical research (Hales, 1986). Little is known about the
impact popular literature has on the ability of CEOs to lead their organizations. However
failure to perform in the role results in the frequent churn (turnover) we see in CEO
positions (Jacovitz, 2006). One-third of all CEOs in charge of U.S. organizations are
terminated from their jobs, voluntarily or involuntarily, within three years of being hired
(Coyne & Rao, 2005). In 2006 the number of CEOs changing jobs was 2,088 in the U.S.,
an increase of over 47% from 2005 (Jacovitz, 2006). According to a 2006 study by Booz
Allen Hamilton Inc. turnover rates for CEOs in 2006 were 16.2% (Mooney, Dalton,
Dalton, & Certo, 2007). CEOs may be forced out of their jobs by their Board of Directors
for a variety of reasons including poor performance and poor fit with the organization,
yet these are seldom reasons made public (Charan, 2005). Accounting irregularities,
insider trading, and other unethical or illegal acts are more apt to make headlines and get
the attention of the public, eroding a company‘s reputation quickly (Ertugrul & Krishnan,
2011). Additionally, ignoring customers, tolerating low performers, denying the reality of
bad news, and failing to execute programs critical to organizational success are reasons
CEOs lose their jobs (Murphy, 2005).
During 2008 it was estimated that 1,484 CEOs left their jobs, an average of 6 each
business day. The turnover rate for CEOs stabilized in 2009 at 14.3% (Favaro, Karlsson,
& Neilson, 2010). CEOs unable to perform leave companies with the financial burden of
5
expensive severance packages and recruitment costs (Walsh, 2008). Ineffective CEOs
who are not dismissed have the potential for creating even more financial burden on
organizations, earning high salaries without return for the organization, its stakeholders,
and society.
Turnovers are expensive and eventually investors and consumers pay the price
(Jensen & Murphy, 1990). High CEO salaries, stock option plans, extravagant bonuses,
and pricey severance packages frequently make the news, a result of recent government
bailouts of the banking and automobile industries (Walsh, 2008). The ratio of pay
between CEOs and typical workers has increased from 100 times in 1990 to between 350
and 570 times in 2009, primarily a result of an increase in stock options in CEO
compensation packages (Hall & Murphy, 2003; Harris, 2009). Changes in the way CEOs
are compensated, that is an increase in equity-based pay, may be explained in part by the
ever-changing environment in which companies conduct business.
The external business environment has been described as volatile, uncertain,
complex, and ambiguous (Johansen, 2007; IBM Institute for Business Value, 2010). With
unemployment in the U.S. over 9% during July, 2010 (U.S. Bureau of Labor Statistics),
the country is struggling for economic recovery. CEOs play an especially vital role, as
they are expected to provide leadership that produces jobs, quality products and services,
and return on investment to shareholders (Boatright, 2009; Case, 2009). CEOs are
therefore expected to be efficient and effective leaders with significant impact on the
performance of the organizations they lead (Boatright, 2009).
The business environment has changed dramatically since the 1970s; technology
has changed the way companies do business; the economy is more globalized; and the
6
workforce has changed and continues to change in ways that no one could have
imagined. Leading through this organizational ―permanent white water‖ (Vaill, 1996, p.
10) may be one of the most important roles a CEO must play. A study conducted in 2002
examined whether the rhetorical claims about the emergence of new and different
managerial work could be substantiated by empirical evidence (Tengblad, 2006). The
research suggests that the role of CEO has changed from an administrative/desk-work job
to the job of institutional and global leader. However a change in the role of CEO
conflicts with early research by Mintzberg in 1973 suggesting the roles of CEO and of
managers in general, were ―timeless‖ (Tengblad, 2006, p. 1452).
During the 1980s and 1990s research on CEOs shifted its focus to research on
CEO compensation, succession plans, corporate social responsibility, and the separation
of the CEO and Chairman of the Board roles. This shift in focus is due largely to
increased regulatory pressures faced by CEOs along with strong criticism from the public
of their compensation packages (Boatright, 2009; Matsumura & Shin, 2005). The need to
study and understand the role of CEO is more important today than it has ever been, yet
extant theory and research informing understanding and practice on the role of CEO is
outdated and ill-suited to the task. This results in the problem that is the focus of this
study, namely: that the research on the role of CEO is conflicting and outdated.
Existing Research on the Problem
Initial work on the roles of managers began in 1916 by Henri Fayol and was
followed by other authors of the classical school who approached management as a
science (Mintzberg, 1973). The role of CEO was detailed in Mintzberg‘s book The
Nature of Managerial Work. Mintzberg utilized methods of the work activity school
7
whereby the detailed activities of CEOs were analyzed into three role categories
comprised of 10 roles. In contrast to the notion of management as science and considered
a seminal work on the role of CEOs, this research became the basis for many studies on
the work of all managers, not just executives or CEOs. However, the significance of the
differences between managers and CEOs is evidenced not only in the work they do, but
in
the conceptions they hold, deep in their psyches, of chaos and order. Managers
embrace process, seek stability and control, and instinctively try to resolve
problems quickly . . . Leaders, in contrast, tolerate chaos and lack of structure and
are willing to delay closure in order to understand the issues more fully (Zaleznik,
1977, p. 74).
While Mintzberg‘s landmark study provides a conceptual framework for
extensive research into the work of managers in general, the research was specifically
conducted on the work, in the forms of roles and variables, of five CEOs. Although the
majority of studies on managerial roles in organizations have focused on middle and
lower-level managers, the focus of this study is specifically on the role of CEOs and is
not intended to address the role of other managerial positions.
Following are three role categories and corresponding 10 roles induced by
Mintzberg‘s (1973) research:
1) interpersonal roles: figurehead, liaison, and leader;
2) informational roles: monitor, disseminator, and spokesperson; and
3) decisional roles: entrepreneur, disturbance handler, resource allocator, and
negotiator.
8
In addition to the 10 roles, Mintzberg developed a Contingency Theory of Managerial
Work in which he determined the work of CEOs is influenced by four variables, namely,
the environment, the job, the person, and the situation.
Mintzberg‘s research was the impetus and framework for many studies on the
work, the role, and the characteristics of CEOs (Carter, 1982; Howe, 1988; Kurke &
Aldrich, 1983; Lau, Pavett, & Newman, 1979; Snyder & Wheelen, 1981; Whitely, 1978).
Some studies utilized and expanded upon the original model and some put forth new
models to explain the role of CEO (Hart & Quinn, 1993; Howe, 1988; Lau et al., 1979;
Snyder & Wheelen, 1981; Tengblad, 2006). Some claim that Mintzberg ―got it [the role
of CEO] right‖ (Kurke & Aldrich, 1983, p. 975) and Mintzberg‘s theory of roles is
―timeless‖ (Tengblad, 2006, p. 1452). Others suggest further development of Mintzberg‘s
theory is necessary to fully understand the role of CEO and how CEOs spend their time
(Hales, 1986; Hart & Quinn, 1993). Furthermore, social and applied theory is contextual
and temporal, and as a result requires continuous refinement, re-development, and re-
confirmation (Lynham, 2002):
in order for the theoretical framework to evoke trust and confidence, the initial
explanation of the phenomenon, problem, or issue embedded in the framework
must be applied to and empirically confirmed in the world in which the
phenomenon, issue, or problem occurs (p. 232).
The context of the world in which we do business has changed dramatically, thus
we are left with a substantial gap in our theory about the role of CEO and how CEOs
spend their time. Managing has been referred to as a ―theory in search of evidence‖
(Hales, 1999, p. 339). While Mintzberg‘s research provided a framework for studying
and understanding the role of CEO in the 1970s and 1980s, the theory and much of the
informing research is now 30 - 40 years old. Research conducted to support Mintzberg‘s
9
theory has been described as ―richly descriptive and insightful, but largely self-contained,
studies‖ (Hales, 1999, p. 337). It has also been criticized for numerous limitations and
omissions, failure to find similarities while focusing only on differences, data that are
only descriptive, identification of variations that still require explanation, and rarely
going beyond demonstrating correlation with other variables to advance possible
substantive causal connections (Hales, 1999; Martinko & Gardner, 1985). These
deficiencies help further illuminate definition of research questions that are the
foundation of this study.
Research Questions
To gain an understanding of how working CEOs perceive their roles the
overarching research question was:
1) What is the role of CEO in the U.S.?
To gain an understanding about how CEOs allocate their time, the following question
was asked:
2) How much time do CEOs estimate they spend in six categories of roles?
On the survey participants were asked to add roles that were missing in order to explore
the following question:
3) What roles are identified by CEOs that were not identified in the literature on the role
of CEO?
In addition to the three research questions, the following hypotheses were tested:
H1) There is no difference between gender, agreement with the 31 role descriptions, and
time allocated to the six role categories.
10
H1a) Female CEOs will report they spend more time in interpersonal roles than their
male counterparts.
H1b) Female CEOs will report they spend less time in operational roles than their male
counterparts.
H2) CEOs from public companies will report they spend less than 10% of their time in
strategic role categories.
H3) Agreement with and time spent in the role categories will not differ depending upon
the CEOs degree major or industry background.
H4) There will be no difference in the way CEOs spend their time between CEOs with
other C-level executives working for them, and those without C-level executives.
H5) There will be an association between age, years in current job, years as a CEO, last
degree earned, company size and agreement with each role category.
H6) There will be no difference in the responses on role agreement and time spent in the
role categories between CEOs from privately-held versus publicly-held companies.
H7) There will be no difference in the responses on role agreement and time allocations
to role categories between a convenience sample of CEOs and a random sample of
CEOs.
H8) There will be no difference in the responses on role agreement and time allocations
between CEOs from small companies and CEOs from large companies.
Study Purpose and Significance
Given the informing problems and guiding research questions and hypotheses, the
purpose of this study was to address the gap between what is reported in the literature and
11
what is known in current practice on the role of CEO. It was hoped insights provided by
CEOs would improve understanding of their role. Additionally, it was hoped Mintzberg‘s
(1973) theory of the role of CEO would be informed by this research project; theories
generally require a constant process of refinement and development to inform them
(Lynham, 2002). There is a gap in research and literature on the role of CEO and the
intent of this research project was to inform the gap with current research.
It seems possible that gaps exist due to lack of access to working CEOs or the fear
CEOs will be unresponsive to requests for survey responses or interviews (Beggs &
Doolittle, 1988). Access issues have made it difficult to study CEOs from a variety of
disciplines, not just Human Resource Development (HRD), and provided many
challenges to this research project (Rosser, 2005; Thomas, 1995; Useem, 1995). Some
studies on CEOs utilized biographies or autobiographies, public information provided in
proxy statements and annual reports, surveys of employees, CEO job advertisements, and
information from public interviews and speeches as methods to access information about
CEOs (Ahmed, 2005; Steiner, Kunin, & Kunin, 1981; Wood & Vilkinas, 2003). Much of
Jim Collins‘ (2001) research on CEOs utilized data from publicly traded companies
widely available to the general public from the Securities and Exchange Commission
website. A successful research project on working CEOs may encourage future research
on a population that seems very inaccessible.
Data collected from CEOs may bridge a knowledge gap between research and
practice by providing the CEOs‘ perspective about what the role of CEO really is (Ruona
& Lynham, 2004). This research will serve HRD practitioners who may be responsible
for the process of identifying CEO candidates, coaching CEOs, sustaining an
12
organization‘s leadership system, and developing performance matrices for Boards of
Directors who are ultimately responsible for ensuring effective and efficient CEO role
behavior in the form of productivity, achievement, and goal attainment.
The ability of CEOs to perform effectively in the role has significant implications
for the organizations they lead (Edersheim, 2007; Hales, 1996; Hart & Quinn, 1993;
Lafley, 2009; Matsumura & Shin, 2005; Mintzberg, 1973). Organizations are relied upon
to meet not only the wants and desires of society, but also the most basic needs including
food, water, and shelter. The success of CEOs has direct impact on the financial
performance of organizations and financial performance has a direct impact on the stock
market, the banking industry, and financial markets overall. In some cases CEOs may
lead organizations with economies larger than small countries, so the potential impact
they have in their role can be substantial (Edersheim, 2007; Hales, 1996; Hart & Quinn,
1993; Lafley, 2009; Lynham & Cunningham, 2006; Matsumura & Shin, 2005;
Mintzberg, 1973).
Human Resource (HR) directors and vice presidents can strategically impact and
influence the direction of their organizations by emphasizing the importance of selecting
and hiring the right CEO (Allgood & Farrell, 2003; Torraco & Swanson, 1995). For
Boards of Directors, clarity of role provides tools for evaluating CEO quality and
performance. For CEOs, understanding role expectations and focusing on the most
productive roles will improve both individual and organizational performance in a
chaotic business environment. Additionally, knowledge of what other CEOs consider
important roles and how they allocate time to these roles could provide strategic insight
for benchmarking performance against other CEOs and the organizations they lead.
13
Delimitations
This study was delimited to CEOs randomly selected from a list of companies
with U.S. mailing addresses and accessed from a purchased database. Because of the
focus on CEOs, and the selection of a database with U.S. addresses, the study cannot be
considered applicable to middle or lower-level managers or to CEOs in other countries.
Assumptions
The following assumptions are important to this study:
1) A valid and reliable instrument will be utilized to gather data.
2) A sample of CEOs will be willing to complete a survey and return it.
3) CEOs will be able to provide an accurate representation of their roles and the
amount of time spent in each role.
4) The study is confidential, that is, who responds to the survey will not be
known.
5) Honesty in time estimations will not be known.
6) Differences in time allocation and actual effort will not be known.
Definition of Terms
This study utilizes definitions derived from the review of literature. A list of terms
and the working definitions applicable to this particular study are presented below.
Chief Executive Officer (CEO): The top person in an organization‘s hierarchy.
C-Executives: Chief Executive Officer, Chief Financial Officer (CFO), Chief
Operations Officer (COO), Chief Information Officer (CIO), or Chief Technology
Officer (CTO).
14
Equity-based compensation: Stock options and restricted stock frequently
received by executives as part of their total compensation package.
Human resource development: ―a process of developing and unleashing expertise
for the purpose of improving individual, team, work process, and organizational
system performance‖ (Swanson & Holton, 2009, p. 4).
This study uses the following definitions of variables presented by Kahn, Wolf, Quinn, &
Snoek, (1964, pp. 12-26) in their book titled Organizational Stress: - Studies in Role
Conflict and Ambiguity:
Office: the place where business roles are carried out
Role: a set of activities, behaviors
Role set: the other people impacted by a particular role, other employees or
supervisor
Focal person: the person carrying out the specific role
Role senders: collectively, they constitute the role set and they provide
expectations to the focal person
Role pressures: role senders‘ expectations for role performance
Role conflict: when expected role behaviors are inconsistent, five different types
of role conflict may occur: 1) intrasender conflict (inconsistent expectations from
one person in a role set); 2) intersender conflict (inconsistent expectations from
two or more persons in a role set); 3) interrole conflict (inconsistent expectations
from members of two or more role sets); 4) person-role conflict (inconsistent
expectations between one or more persons from a role set and expectations within
the focal person‘s subjective role); and 5) other complex forms, including role
overload.
Role ambiguity: when a role lacks clarity or adequate information for the
individual to understand the expected role behavior; types of role ambiguity are:
1) task ambiguity (unclear job description, job goals or methods to achieve); and
2) ambiguity regarding the impact one‘s job has on the effectiveness of self, the
role set or the entire organization
15
Researcher‘s Perspective
My experience working in the roles of Controller, Chief Accounting Officer, and
Chief Financial Officer afforded me the unique opportunity to work closely with, and
sometimes directly for, CEOs of the organizations that employed me. I have witnessed
extremely hard-working and dedicated CEOs resurrect businesses that seemed doomed to
fail and make them successful enough to engage in initial public offerings. I have
watched CEOs in struggling start-ups take huge personal risks to keep their employees
working and their own dreams alive. I have watched CEOs agonize over difficult
personnel decisions and I have also seen them show little regard for their employees. I
have witnessed CEOs struggle through mergers, acquisitions, and liquidations. I have
been personally and deeply impacted by those always willing to do the right thing, even
at a personal cost, and those that asked me to do the wrong thing, from whom I walked
away. These unique experiences influence my perspective of what roles the CEO plays,
what impacts those roles, and what qualities of character make for the most effective
CEOs. As a researcher, I seek to learn what CEOs perceive about their roles and I hope
that this project will, in some small way, provide a deeper understanding for CEOs, for
HRD professionals, for the organizations they lead and serve, and for the stakeholders.
16
CHAPTER TWO: REVIEW OF THE LITERATURE
Introduction
The purpose of this study was to address the gap between extant informing
research and literature and what is known in current practice on the role of CEO. Chapter
two begins with the methodology employed to conduct the literature review. Part one
explores the history of CEOs and introduces the importance of their positions in business
today. Part two begins with a brief explanation of the underlying theories for HRD. It is
suggested there is a gap in these theories related to role theory, thus, HRD may benefit
from research on roles and the theories that support the role of CEO. A review of
literature on role theory defines what role theory is and describes its evolution and
importance in informing the role of CEO and its study. A brief review of organizational
role theory provides further delineation of the importance of roles within organizations.
Finally, the seminal research to induce a theory about the role of CEO performed by
Mintzberg (1968; 1973) is presented in detail as the starting framework for the roles and
role categories that are the focus of this study. Part three introduces six categories of CEO
roles and 31 specific roles, supported by research conducted on the CEO to date.
Throughout part two and three the research questions and hypotheses emerge. Part three
ends with a discussion of the most recent research conducted using Mintzberg‘s
framework to study the impact of complexities in the external business environment on
the role of CEO. Finally, the importance of this chapter is the introduction of the gap in
17
both the early and current literature which supports the problem statement from Chapter
One, namely, that the research on the role of CEO is conflicting and outdated.
Literature Review Methodology
The review of literature was conducted to find the most recent knowledge on the
role of CEO. The methodology included a search of electronic databases including
Digital Dissertations, Business Source Premier, Academic Search Premier, Google
Scholar, Psyc Info, and Web of Science from the Morgan Library at Colorado State
University. The search included ―Chief Executive Officer‖, ―CEO‖, and ―role‖, or ―role
theory‖ in the keywords fields. The name ―Mintzberg‖ was used as a title search. A title
search was conducted on ―Chief Executive Officer‖ or ―CEO‖ producing over 8,000
results. This search was narrowed by including the phrases ―self reflection‖,
―themselves‖, and ―reflection‖. With the assistance of a research librarian at Morgan
Library at Colorado State University these phrases were selected to narrow the focus to
the role of CEO from the perception of CEOs.
Digital dissertations contained 21 dissertations with ―Mintzberg‖ in the title. After
a review of the abstracts for additional details, the search was narrowed to 10 possible
dissertations for review. These dissertations were either downloaded from Proquest or
were requested in hard copy using inter-library loan. The dissertations not selected for
detailed review were not available, were written in a language other than English, or were
not specific to CEOs. A more detailed review of the 10 dissertations resulted in a final
selection of four dissertations that were focused specifically on CEOs or on executives at
the top of the organization. Mintzberg‘s dissertation from 1968 was added to this list.
18
Dissertations with a focus on middle or lower-level managers were excluded from this
literature review.
The database search resulted in 250 journal articles with relevance to the topics of
the history of CEOs, the role of CEO, changes to the role of CEO, and role theory
informing the role of CEO. A few additional articles were selected for their applicability
to CEO turnover, CEO succession planning, CEO compensation, corporate social
responsibility, and the impact of these variables on the role of CEO. Over 60 refereed
journal articles were selected for their relevance to the role of CEO and are presented in
this review of literature.
Role theory is a mature topic researched by practitioners in psychology,
sociology, social psychology, and anthropology. The role of executives in organizations
also has a long history. A search of books at the Morgan Library at Colorado State
University resulted in several seminal books on the topics of role theory and the history
of executives in organizations utilized in this literature review. Additional books or book
chapters were selected for their applicability to the role of CEO and the implications of
this role in the study of HRD. These books provide a substantial base for understanding
the discipline of HRD. The dissertations, journal articles, books, and book chapters were
analyzed and synthesized to inform the review of literature that follows, beginning with a
brief overview of the history of CEOs.
Part One: An Overview of the History of CEOs
The process of studying the role of CEOs should begin with an understanding of
who these individuals are and how their roles have evolved. The robber barons or
railroad magnates, of the late nineteenth century are considered the earliest CEOs in the
19
U.S. While mostly viewed as a group of thugs, there was an air of romance about these
individuals who created great wealth for themselves (Tedlow, Bettcher, & Purrington,
2003). Descriptions include terms like ―parvenus,‖ however, ―they were also men of
heroic audacity and magnificent exploitive talents—shrewd, energetic, aggressive,
rapacious, domineering, insatiable‖ (Hofstadter, 1948, p. 213.) It has been implied that
the mold was broken after this group of executives retired or died, and that their
successors, CEOs of the 1920s, came from a much smaller mold, perhaps suggesting
successor CEOs were not as exciting or as interesting as their predecessors had been
(Wiebe, 1962, as cited in Tedlow et al., 2003). Most CEOs were referred to as
―President‖ until the 1940s when the Chief Executive Officer title became vogue
(Galambos, 1995, p. 189).
During the 1940s corporations moved away from a centralized structure and
began to assume a multidivisional one, resulting in organizations that were more
decentralized than those of the early 1900s (Galambos, 1995; Tedlow et al., 2003).
Family ownership began to lose influence due to the aging of company founders, thus
―professional CEOs, bred in new management schools, took the reins of corporate
America‖ (Hawkins, 1997, p. 146). The structural change and ownership changes marked
the beginning of a new type of relationship between the CEO and the organization, where
the CEO was depended upon for strategic decision making and managing relationships
with the Board of Directors and others outside the organization (Galambos, 1995).
Increased organizational complexity required the addition of Chief Operating Officers
(COOs) to the hierarchy to handle the day-to-day (as opposed to strategic) operations and
decision making. The decentralized organization became the most common form of
20
corporate structure in the U.S. following World War II. Its complexity constrained the
CEO position as the responsibilities expanded at the same time authority was being
restricted by increasing governmental rules and regulations (Galambos, 1995).
External events, too, impacted the role of the CEO when companies began to
expand to the global marketplace after World War II. These events simultaneously
increased responsibilities and reduced authority of CEOs. In the 1960s global competition
began to squeeze U.S. corporations, while government regulations at home squeezed the
CEOs‘ authority. State and federal regulations on interstate commerce became more
restrictive and the concomitant ability of the government to provide for and take away
from business became more evident (Galambos, 1995; Greenfeld, Winder, & Williams,
1988). Taxes, subsidies, regulation, deregulation, anti-trust laws, environmental
regulations, personnel regulations, and fixing prices—all potential governmental impacts
now had to be managed by the CEO (Galambos, 1995; Greenfeld et al., 1988).
During the global expansion of corporations that began in the 1990s the
complexity of business added to the complexity of the role of CEO. Over the course of
four decades the role of the CEO has come under consecutive and significant pressure—
pressure which has resulted in successive changes in the nature of the role, and
subsequent implications for its study and practice. The importance of the CEO position
rests not only in the perceived power of this role, but in the actual power some
individuals in this role have to impact economies and consumers that depend on them
(Edersheim, 2007; Lafley, 2009). This exploration into the role of CEO begins with a
description of the informing theories for the practice of HRD, role theory, its evolution to
21
organizational role theory, Mintzberg‘s theory on the role of CEO, and a discussion of
how this body of theories help inform the topic.
Part Two: Theoretical Foundations for Studying The Role of CEO
Part two begins with a description of the underlying theories supporting the
discipline of HRD. It follows with a description of role theory and organizational role
theory and how these foundational theories inform research on the role of CEO. A brief
exploration is made into leadership theories that inform this study. Finally, Mintzberg‘s
seminal research describes his theory of the role of CEO.
Underlying Theories for HRD
HRD is ―a process of developing and unleashing expertise for the purpose of
improving individual, team, work process, and organizational system performance‖, and
the purpose of HRD is to ―focus on the resources that humans bring to the success
equation—both personal success and organizational system success‖ (Swanson & Holton,
2009, p. 4). Three underlying theories provide the foundation for improved performance,
and are the basis for Swanson‘s three legged stool. These include economic theory,
systems theory, and psychological theory (Swanson & Holton, 2009). The economic
theory component includes scarce resource theory, sustainable resource theory, and
human capital theory. The systems theory component includes general systems theory,
chaos theory, and futures theory. The psychological theory component includes Gestalt
psychology, behavioral psychology, and cognitive psychology. However it is suggested
the psychology leg of Swanson‘s stool is missing the aspect of social psychology that
includes role theory (Swanson & Holton, 2009). Specifically Swanson‘s three-legged
stool is lacking a theory about how roles are formed and developed. It could be argued
22
organizational role theory needs both development and confirmation as a fundamental
theory supporting the practice of HRD (Swanson & Holton, 2009).
Swanson‘s Taxonomy of Performance (2007) suggests the foundation of
performance is the ability to understand the language of an existing process or system.
Once understanding is obtained operating the process or system is essential.
Troubleshooting the process or system includes the ability to identify and alleviate
problems in an existing process or system. Swanson‘s first three levels of performance,
that is, understanding, operating, and troubleshooting, are considered the responsibility of
managers. The next two levels in Swanson‘s taxonomy, improve and invent are
considered the responsibility of leaders or CEOs. These levels exist to change processes
or systems to make them more effective and to develop new processes or systems,
improving the performance of the entire organization (Swanson, 2007). While Swanson‘s
taxonomy (2007) suggests that there are significant differences in the roles of managers
and leaders missing from the HRD foundation is a theory that explains how roles are
developed and defined within organizations (Swanson & Holton, 2009).
Role definition is important for individual and organizational performance
because roles help define how work gets accomplished (Hart & Quinn, 1993; Katz &
Kahn, 1966). One of the first steps in improving performance is the process of
understanding the work design, including job descriptions and performance metrics
within an organization (Gilley, Boughton, & Maycunich, 1999). Furthermore, ―findings
show that the particular roles played by the top manager are important predictors of firm
performance‖ (Hart & Quinn, 1993, p. 569). Role definition for CEOs seems to have
changed over time, influenced by changes in the business environment including changes
23
in how CEOs are compensated, recruited, and replaced. Contemporary research indicates
both internal and external factors influence all organizational roles including desires for
work-life balance. This balance can be disrupted by the complexity of today‘s family
structures, increased cultural, gender, and age diversity in the labor market, and the
increased use of technology enabling workers to be connected to work 24 hours a day
(Marginson & Bui, 2009; Wickham & Parker, 2006). It is likely that both internal and
external pressures are impacting and shaping the role of CEO. These pressures on CEOs
are complicated by the pressure for organizational and individual performance. The
tension created by internal and external pressure further substantiates the need to study
the role of CEO, helping these individuals make their efforts more focused and effective.
Role Theory
To understand the role of CEO and the importance of roles in organizations, it is
important to understand the underlying theory informing the concept of role. The concept
of role began in the theatre where participants each play a part or role. The social
sciences adopted the concept of role and it evolved into a body of knowledge, a theory, a
research endeavor, and a domain of study that included perspective and language (Biddle
& Thomas, 1966). Whether or not role theory has continued to evolve and develop as a
theory remains in question (Stryker & Statham, 1985).
The word role is derived from the latin word rotula meaning the little wheel or
round log. This round wheel was used for attaching sheets of paper or parchment creating
a scroll. These scrolls were used in Greece and Rome to record the parts that prompters
read to actors during a play. Towards the 16th century when the modern stage emerged
the parts of actors were read from roles. Each scene part became a role (Biddle &
24
Thomas, 1966). Role theory is defined as a set of behaviors or actions engaged in by
individuals who ―are members of social positions and hold expectations for their own
behaviors and those of other persons‖ (Biddle, 1986, p. 67). For purposes of this study
the role of CEO is not restricted to a single activity or behavior, but may be discovered by
the research to be a series of activities and behaviors that comprise the role of CEO. To
understand the role of CEO an exploration of role theory is helpful because ―a theory
simply explains what a phenomenon is and how it works‖ (Torraco, 1997, p. 115).
Therefore, a theory about roles explains what they are (a set of behaviors and actions) and
how they work (expectations for roles are established socially or organizationally).
Role theory has origins in sociology, psychology, social psychology, and
anthropology and dates as far back as 1893 to Durkheim‘s classic description of the
division of labor, Sumner‘s differentiation of individual behaviors and community
behaviors in 1906, and Piaget‘s description of the study of rules and rule compliant
behaviors in 1932 (Biddle & Thomas, 1966). It was during the 1930s that the term role
began to emerge in technical writings as descriptions of role problems. Mead discussed
the concept of role-taking in Mind, Self and Society, which was published in 1934. Linton
(1936) strongly influenced the idea that there is a relationship between role performance
and individual behavior and implied ―role was one linkage between individual behavior
and social structure‖ (Biddle & Thomas, 1966, p. 7). As a theory, role theory has been
described as a ―theoretical approach‖ at best, or a ―framework: directives for examining
certain features of the empirical world that are likely to be significant in the development
of an eventual theory‖ (Stryker & Statham, 1985, p. 312). It is suggested role theory lacks
―a set of assumptions or postulates with which one approaches some part of the empirical
25
world, a set of concepts in terms of which this part of the world is described, and a set of
propositions, emerging from the assumptions and relating the concepts, about the way
this part of the world ‗works‘ which are checked against observations of that world‖
(Stryker, 1959, p. 111).
Terminology that links roles in organizations began to appear in research after
World War II, when role theory began to be more closely associated with occupational
settings than with social settings (Biddle & Thomas, 1966). More recently, the literature
has classified role theory into five different views: functional, symbolic-interactionist,
structural, organizational, and cognitive role theory (Biddle, 1986). Stryker and Statham
(1985) believe that a combination of role theory and symbolic interactionism (in which
roles are constructed as the play evolves) provides a more complete and integrated
framework for discussing the concept of role within social settings—however, a complete
discussion on the history and development of role theory within social psychology is
beyond the scope of this dissertation. Biddle (1986) suggests that the classification of role
theory most useful in informing the role of CEO (or any individual within an
organization) is organizational role theory.
Organizational Role Theory
Even if criticized as lacking full development as a theory (Stryker & Statham,
1985), organizational role theory does provide a conceptual framework for understanding
that roles emerge from specific hierarchical positions in an organization and are created
by the ―normative expectations‖ of the organization and its members (Biddle, 1986,
p.73). The majority of research in the field of role theory has been generated due to the
interest of researchers in roles within the settings of formal organizations. A formal
26
organization is defined as a group of individuals who come together to achieve a common
purpose (Biddle, 1986). This organizational view of role theory is centered on the
definition that organizations are ―preplanned, task-oriented, and hierarchical‖ (Biddle,
1986, p.73). While norms of behavior may vary, one of the limitations of organizational
role theory is the lack of discussion about the evolution or changing of roles by
―nonnormative expectations‖ (Biddle., 1986, p. 74). This limitation is bounded by the
assumption that organizations are both static and logical (Biddle, 1986). Mintzberg
attempted to address impacts on roles through his Contingency Theory of Managerial
Work (which suggested certain variables impact the role of CEO). However he believed
that the role of CEO and of managers in general, was timeless (Mintzberg, 1973).
Mintzberg further described role as ―a fuzzy concept‖ explaining that ―program‖ would
be a better concept to use in defining a job (p. 266).
Organizational role theory may have been first described by Gross, Mason, and
McEachern (1958) and Kahn et al., (1964). In addition to expanding the theory with a
dictionary of terms, Gross et al. (1958) suggested a theme common to many researchers:
―role consensus‖ which he stated ―exists on the expectations applied to the incumbents of
particular social positions‖ (p. 21). Role consensus implies that roles from multiple
stakeholders are not in conflict. However role conflict has been found to have a negative
impact on job performance (ρ < .01) and is an important construct in the research on
organizational role theory, completely contradicting the idea that role consensus among
multiple stakeholders exists (Marginson & Bui, 2009).
Furthermore, it is unlikely role consensus in terms of the role of CEO exists.
Some research purports there are 10 roles of the CEO (Mintzberg, 1973), others suggest
27
four roles (Hart & Quinn, 1993). Popular literature suggests there may be only one role of
the CEO (Lafley, 2009; Steiner, et al., 1981). Lack of consensus on the meaning of the
word role may account for some of this confusion as it is often confused with the word
responsibility (Mintzberg, 1973). The dictionary of common language created by Gross
et al. (1958) in terms of role theory was not necessarily agreed upon by all researchers.
Kahn et al. (1964) focused on role dynamics, specifically the constructs of role conflict
and role ambiguity, and their impact on organizational stress. Both constructs have been
researched extensively with contradictory results (Fisher & Gitelson, 1983; Jackson &
Schuler, 1985; Kahn et al., 1964; King & King, 1990; Marginson & Bui, 2009; Rizzo,
House & Lirtzman, 1970).
The Contribution of Role Theory in Informing Research on the Role of CEO
Even without common language to describe organizational role theory, most
authors agree on three basic foundations supporting the theory. The basic theory about
roles in organizations is: 1) individuals within a specific setting (organization), 2) exhibit
specific behaviors (roles), 3) based on behaviors (roles) expected of them (Biddle, 1986;
Gross et al., 1958; Katz & Kahn, 1966). Research supporting the theory suggests an
individual‘s behavior at work is not random, is influenced by the expectations of others,
by the individual‘s expectations of themselves, and by the individuals‘ own perception of
their role. Research on roles provides evidence that when specific role expectations are
not met a stressful situation ensues, termed role conflict for the focal person (Biddle,
1986; Gross, et al., 1958; Katz & Kahn, 1966).
The importance of role theory to researching the role of CEO is the foundation it
provides for understanding the hierarchy of roles within organizations and the problems
28
that ensue when roles are misunderstood or misinterpreted. At the apex of the
organization, the CEO is considered to be the organization‘s chief leader (Boal &
Hooijberg, 2001). In order to understand the leader role, a brief exploration of leadership
theories specific to executives provides an additional framework for studying the role of
CEO. It is beyond the scope of this dissertation to provide a thorough review of all
theories of leadership, however there are a few foundational theories with importance to
the study of CEOs. These theories are presented in the following section.
Theories of Leadership
The leadership role is believed to be one of the most important roles of a CEO
with a reach that spans all other roles. This belief makes a brief description of leadership
theories necessary for informing research on CEOs (Goleman, Boyatzis, & McKee, 2002;
Mintzberg, 1973; Steiner et al., 1981). CEOs perform in the upper echelon of the
organizations they lead. Upper echelon theory helps to explain the influence of top
leaders on organizational development, suggesting CEOs and other top leaders are able to
reflect their thoughts and values into an organization. This ability is based on how much
discretion these leaders have to act independently, that is, CEOs who act independently
are more able to influence the organization (Boal & Hooijberg, 2001; Hambrick &
Mason, 1984; Hiller, Resick, Weingarden, & Whitman, 2009). Upper echelon theory
evolved into strategic leadership theory, which suggests organizations are truly
reflections of their top leaders. Taking these theories one step further, positive agency
theory purports leaders act in their own best interests, as opposed to the best interests of
the organization (Boal & Hooijberg, 2001). To increase alignment between the goals of
leaders and those of stakeholders, Boards of Directors use incentive systems tied to
29
organizational performance to influence top leadership (Boal & Hooijberg, 2001).
Leadership theory in general describes leaders at all levels of an organization (not
necessarily CEOs), however strategic leadership theory refers only to top organizational
leaders (Vera & Crossan, 2004).
Strategic Leadership Theory
Unique to strategic leadership theory are the concepts of adaptive capacity, or the
ability to change (Cummings & Worley, 2009), and absorptive capacity, or the ability to
learn. Absorptive capacity requires that the individual constantly experiment, tolerate
small failures, and engage in double-loop learning (Argyris & Schon, 1978; Boal &
Hooijberg, 2001). Handling the rapid change and complexity of today‘s business
environment suggests that leaders need to become ambidextrous, or to develop ―the
capacity to simultaneously implement diverse courses of action: incremental and
discontinuous innovation, exploration and exploitation, flexibility and control, and feed-
forward and feedback learning‖ (Vera & Crossan, 2004, p. 227). Bodwell and Chermack
(2010) suggest ―ambidexterity eliminates the need for organizations [or CEOs] to choose
between opposites or to focus on ‗trade-offs‘‖ (p. 197). From strategic leadership theory
transformational leadership evolved, including the concepts of complexity and the ability
to handle juxtaposing positions (Bass, 1985; 1998). The transformational leadership style
is described in the following section.
Transformational Leadership
The transformational leader stands in stark contrast to the transactional leader
who focuses on internal processes and managing others to get the job done (Bass, 1990;
Vera & Crossan, 2004). Instead, the transformational leader ―asks followers to transcend
30
their own self-interests for the good of the group, organization, or society; to consider
their longer-term needs to develop themselves, rather than their needs of the moment; and
to become more aware of what is really important‖ (Bass, 1990, p. 53). Transformational
leaders are identified as being ―charismatic, inspirational, intellectually stimulating, and
individually considerate‖ (Vera & Crossan, 2004, p. 224). Described as selfless or
servant leadership, transformational leadership focuses on the development of all
members of an organization into leaders (Bass, 1990). Emerging theories resulting from
transformational leadership include the complexity theories of behavioral and cognitive
complexity introduced by Hart and Quinn (1993) and explored in more detail by Zacarro
(2001). Transformational leadership has a focus on integrity however integrity alone will
not insure strong organizational performance. Leaders often struggle with the desire to do
the right thing while at the same time making sure the organization performs financially.
Lynham‘s (1998, 2000) theory of responsible leadership for performance addresses this
tension.
Theories of Responsible Leadership for Performance
Ambiguity in theories of leadership calls for both firm performance and
selflessness (Lynham, 1998). The selfishness of human nature conflicts with the ability to
be a servant leader, especially when complicated by the demand for corporate
performance from shareholders and boards of directors. It is not difficult to imagine how
executives become tempted to force earnings when their personal wealth can be
substantially influenced by a strong stock price (Boatright, 2009; Jensen & Murphy,
1990). To resolve the conflict between selfish needs and the needs for performance,
Lynham has suggested a new model of ―Responsible Leadership for Performance‖ (1998,
31
p. 208). The need for a new model stems from the leadership dilemma that remains in
many organizations, lack of evidence that leadership development programs sustain real
results, increased complexity in business, and increased rate of change in which leaders
must act (Antonioni, 2003; Block, 1993; Lynham, 1998; Zaccaro, 2001).
Gone are the days of prescriptive recipes of leadership. Organizations will need
leadership that is able to think and act fundamentally differently, able to integrate
critical thinking with critical practice. Organizations will need to shift away from
the pursuit of control, discrete boundaries and recognizable problems towards
greater complexity, global competition, continuous quantum change and
collaborative team orientations. These shifts herald an increasing gap between
current leadership practices and future leadership needs. The competencies
needed of and for leadership will be different. They will need to integrate the
apparent paradox of performance demands and the realities of humanity – in other
words, of people and performance (Lynham, 1998, p. 209).
Lynham (1998) also suggests that leadership systems should be developed to
answer the problem of succession planning. It is not uncommon for organizations to
undergo substantial changes due to the change of one individual at the top. This is
disruptive and often very unproductive for the organization (Case, 2009). A recent article
about the replacement of HP CEO Mark Hurd suggested that the CEO position should be
a ―team job‖ arguing that
A rotational CEO position would put boards in control of the CEO spot, rather
than the other way around. Instead of paying huge sums to – and relying
exclusively on – a single individual, boards would groom multiple individuals of
diverse skills useful for finite durations, with paychecks to match. Investors
would benefit knowing the company had several qualified and/or tested CEOs
from which to choose. Perhaps, by failing to engage in adequate succession
planning and to rein in pay, boards have, inadvertently, pointed us to a better,
more cost-effective model at the top (Bloxham, 2010, p. 3).
The Contribution of Leadership Theories in Informing Research on the Role of CEO
The theories of leadership described in the literature suggest that the leadership
role of CEOs is an evolving role. The newer models suggest CEOs are leaders not only
32
within their organizations but also globally, and as global citizens the role is even more
important (Antonioni, 2003; Matsumura & Shin, 2005). It seems the need for these
evolved models of leadership could not have been imagined by Mintzberg during the
1960s or 1970s. Furthermore, he could not have anticipated the magnitude of changes
that would occur in the 40 years following his research on five CEOs, yet his study
continues to provide a conceptual framework for contemporary research on the role of
CEO. His work was an attempt to create a theory about the role of CEO by observing
what CEOs did at work. A description of his research and the resulting theory on the role
of CEO is presented in the following section.
The Seminal Research of Mintzberg: A Theory of the Role of CEO
Mintzberg‘s work began as a result of his interest as a child in what his father did
at the office. The purpose of his research was to determine what CEOs really do at work,
not to theorize about what they should do to be effective. Mintzberg recognized a gap in
the literature where generalities about the CEO‘s or manager‘s job were made, yet no
empirical data informed the general theories about what the job was. A structured
observational study of five CEOs resulted in Mintzberg‘s dissertation in 1968: The
Manager at Work—Determining his activities, roles, and programs by structured
observation. In 1973, after putting some time between himself and the research,
Mintzberg released a book titled: Nature of Managerial Work. This book is considered a
landmark study on the role of CEOs with impacts extending into the role of managers at
all hierarchical levels. The following discussion details Mintzberg‘s methodology and
research purpose and describes in detail the six characteristics of the work of CEOs.
33
Mintzberg‘s Methodology: Structured Observation
Mintzberg‘s intention in applying the structured observation method was the
inductive development of a theory about the role of managers (Mintzberg, 1973).
Specifically, he observed five male CEOs: a chairman and chief executive from a major
consulting firm, a president of a research and development firm engaged in high
technology solutions for industry and the military, a director of a large urban hospital, a
president of a manufacturing company producing consumer goods, and a superintendent
of a large suburban school district (Mintzberg, 1973).
Each subject was observed for one week while at work. The observations resulted
in a chronology record, a mail record, and a contact record. The chronology record
summarized the amount of time each participant spent on desk work, telephone calls,
scheduled meetings, unscheduled meetings, and tours. The mail record summarized the
type and amount of mail each subject received and read at work during the week of
observation. The contact record summarized the type of contacts: verbal, telephone,
scheduled meeting, unscheduled meeting and who the contact was: subordinates,
directors, clients, suppliers, peer/trade organizations, independents, and other. The
purpose of the contact was categorized as organizational, scheduling, ceremony, board
work, status requests and solicitations, action requests, manager requests, observational
tours, receiving information, giving information, review, strategy, and negotiation. The
total time was presented in hours and as a percentage of the total time worked.
The activities from each record were categorized, and from the process of
categorization Mintzberg‘s 10 roles were delineated. Table 1 was adapted from
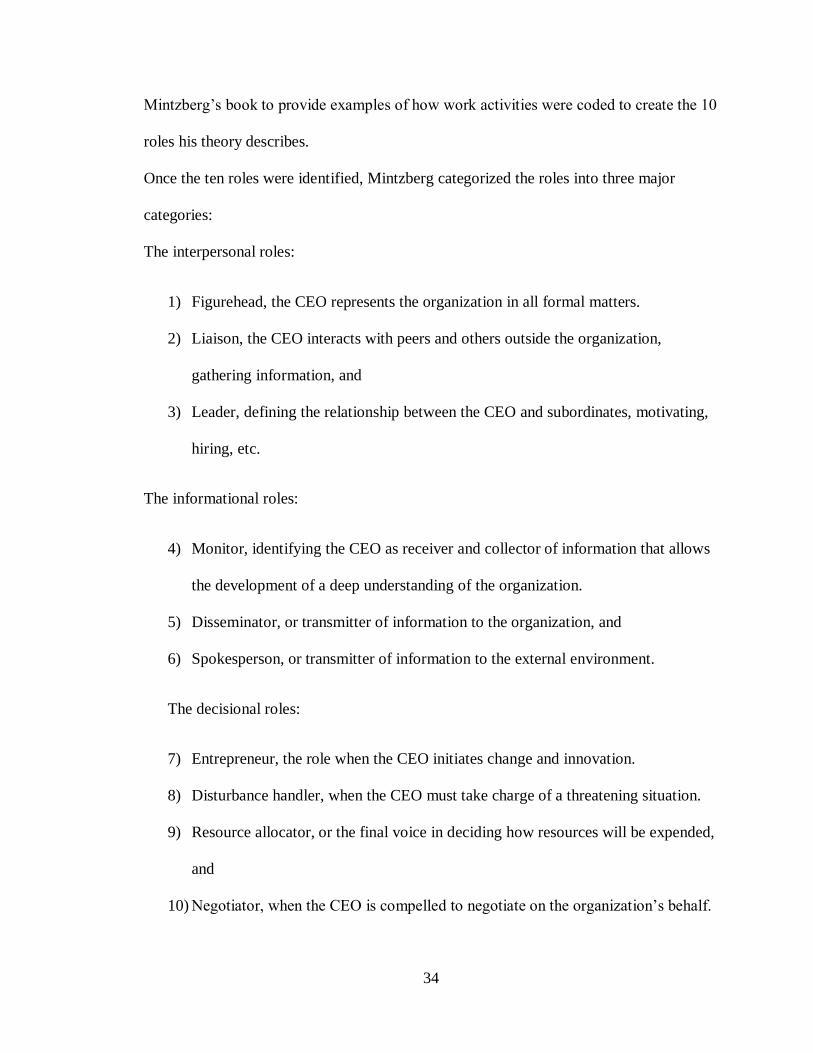
34
Mintzberg‘s book to provide examples of how work activities were coded to create the 10
roles his theory describes.
Once the ten roles were identified, Mintzberg categorized the roles into three major
categories:
The interpersonal roles:
1) Figurehead, the CEO represents the organization in all formal matters.
2) Liaison, the CEO interacts with peers and others outside the organization,
gathering information, and
3) Leader, defining the relationship between the CEO and subordinates, motivating,
hiring, etc.
The informational roles:
4) Monitor, identifying the CEO as receiver and collector of information that allows
the development of a deep understanding of the organization.
5) Disseminator, or transmitter of information to the organization, and
6) Spokesperson, or transmitter of information to the external environment.
The decisional roles:
7) Entrepreneur, the role when the CEO initiates change and innovation.
8) Disturbance handler, when the CEO must take charge of a threatening situation.
9) Resource allocator, or the final voice in deciding how resources will be expended,
and
10) Negotiator, when the CEO is compelled to negotiate on the organization‘s behalf.
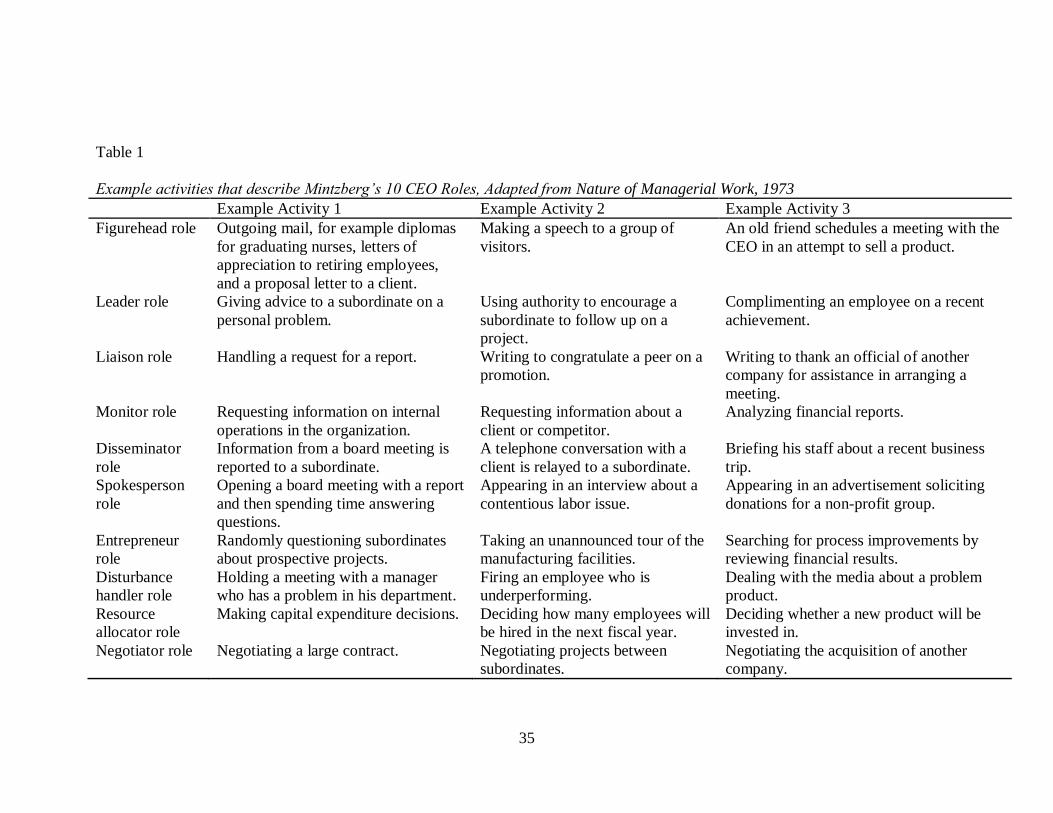
35
Table 1
Example activities that describe Mintzberg’s 10 CEO Roles, Adapted from Nature of Managerial Work, 1973
Example Activity 1 Example Activity 2 Example Activity 3
Figurehead role Outgoing mail, for example diplomas
for graduating nurses, letters of
appreciation to retiring employees,
and a proposal letter to a client.
Making a speech to a group of
visitors.
An old friend schedules a meeting with the
CEO in an attempt to sell a product.
Leader role Giving advice to a subordinate on a
personal problem.
Using authority to encourage a
subordinate to follow up on a
project.
Complimenting an employee on a recent
achievement.
Liaison role Handling a request for a report. Writing to congratulate a peer on a
promotion.
Writing to thank an official of another
company for assistance in arranging a
meeting.
Monitor role Requesting information on internal
operations in the organization.
Requesting information about a
client or competitor.
Analyzing financial reports.
Disseminator
role
Information from a board meeting is
reported to a subordinate.
A telephone conversation with a
client is relayed to a subordinate.
Briefing his staff about a recent business
trip.
Spokesperson
role
Opening a board meeting with a report
and then spending time answering
questions.
Appearing in an interview about a
contentious labor issue.
Appearing in an advertisement soliciting
donations for a non-profit group.
Entrepreneur
role
Randomly questioning subordinates
about prospective projects.
Taking an unannounced tour of the
manufacturing facilities.
Searching for process improvements by
reviewing financial results.
Disturbance
handler role
Holding a meeting with a manager
who has a problem in his department.
Firing an employee who is
underperforming.
Dealing with the media about a problem
product.
Resource
allocator role
Making capital expenditure decisions. Deciding how many employees will
be hired in the next fiscal year.
Deciding whether a new product will be
invested in.
Negotiator role Negotiating a large contract. Negotiating projects between
subordinates.
Negotiating the acquisition of another
company.
36
Each role was described as observable, for example, it is possible to witness a
CEO handling a disturbance. Each of the contacts and pieces of mail that Mintzberg
observed in his study were accounted for in his role theory. Most importantly, Mintzberg
refers to the roles as being separate yet forming an integrated role. The roles were
referred to as forming a ―gestalt—an integrated whole‖ (Mintzberg, 1973, p. 58). One
role cannot be removed without an impact on the other roles. Of the six categories used in
this research study, three categories (Informational, Interpersonal, and Decisional)
represent the work of Mintzberg.
Mintzberg‘s Contingency Theory
In addition to the theory encompassing 10 roles, Mintzberg concluded there is a
Contingency Theory of Managerial Work, meaning how the five CEOs spent their time
was dependent upon certain contingencies or variables. The four variables described by
Mintzberg are:
1) Environment, including external factors like the economy, industry or internal
factors specific to the organization.
2) Job, where it is situated in the organizational hierarchy and who is supervised.
3) Person, including personality and management style, and
4) Situation, specifically whether the organization is in a period of stability or
change.
The Purpose of Mintzberg‘s Research
The purpose of Mintzberg‘s research was to describe the role of CEO in as much
detail as possible. He specifically described his book in these terms:
37
It is a book about managers---those people formally in charge of organizations or
their subunits. This excludes many of those in ―middle management,‖ but
includes people with titles such as president, prime minister, foreman, dean,
department head, and archbishop. This is not a book about what effective
managers do or what styles they exhibit. It focuses on the basic question—what
do managers do? The aim, in different words, is to develop a job description that
will have meaning to those who believe that management can be approached as a
science (p. 4).
Six Characteristics of the Work of CEOs
Mintzberg did not believe management was a science. He was looking for a
theory of management that could be operationalized by looking at those who actually
performed the work (Mintzberg, 1973). In addition to the roles and variables, Mintzberg
described six sets of characteristics in the work of the CEOs he observed. These
characteristics are described as ―much work at an unrelenting pace‖ (p. 29), ―activity
characterized by brevity, variety, and fragmentation‖ (p. 31), ―preference for live action‖
(p. 35), ―attraction to the verbal media‖ (p. 38), ―between his organization and a network
of contacts‖ (p. 44), and a ―blend of rights and duties‖ (p. 48).
The idea that CEOs never stop working was consistent with Carlson‘s (1951)
work and Carlson also commented about the pace of the executives:
For the chief executives themselves this excessive working load has many
unpleasant effects. It means that their opportunities to be with their families or to
see their private friends are severely curtailed, and it entails travelling in night
trains and evenings and weekends spent away from home. In some cases it also
causes a certain intellectual isolation . . . They seldom have time to read anything
but technical and economic literature or to go to a theatre or a concert (p. 75).
The CEOs observed by Mintzberg (1973) and Carlson (1951) appeared to have
choices about interruptions or fragmentation, frequently relying upon assistants to serve
as barriers to unwanted interruption. However, it was suggested that interruptions were
not discouraged by the CEOs in an attempt to keep information flowing in the
38
organization (Mintzberg, 1973; 2009). It was also suggested interruptions are the reason
why CEOs spend so little time on long-term planning and strategy (Carlson, 1951;
Mintzberg, 1973; 2009).
The thirst for constant information was supported by the ―preference for live
action‖ or interest in receiving the most up-to-date information when it happens
(Mintzberg, 1973, p. 35). It was suggested CEOs prefer verbal communication as
opposed to written communication. The CEO was referred to as the individual who
bridges the world outside the organization to the world inside the organization and
translates changes on the outside into meaning for the employees inside (Mintzberg,
1973).
Finally, the CEO was described as having minimal control over what he must do,
that is, the needs of the organization, its employees, and outside stakeholders largely
drive the work the CEO performs on a daily basis. On the other hand, the CEO normally
has final decision-making authority, a power usually reserved for this position alone
(Mintzberg, 1973). One of Mintzberg‘s final conclusions was ―Managers‘ jobs are
remarkably alike. The work of foremen, presidents, government administrators, and other
managers can be described in terms of ten basic roles and six sets of working
characteristics‖ (p. 4).
In summarizing the work of Mintzberg the level of detail and effort expended in
his study of five CEOs is very impressive. The description of the work performed and the
categorization into roles has survived 40 years of research into management work.
Mintzberg‘s research also provided the conceptual framework for a substantial amount of
subsequent research on the role of managers, however, for purposes of this literature
39
review studies specific to lower and middle-level managers were excluded. The
importance of Mintzberg‘s research to this study is the theory he developed about the role
of CEO, specifically, the ten CEO roles he identified, and the three role categories in
which Mintzberg cataloged the ten roles.
Following the release of Mintzberg‘s book in 1973 there were numerous
dissertations and journal articles written to further substantiate his theory about CEOs and
managers in general. A substantial amount of this research was focused on middle and
lower-level managers, however, 20 studies based on Mintzberg‘s work were selected for
this review of literature based on their focus on Chief Executive Officers. Part of the
explanation for fewer studies on CEOs may be based on the difficulty in obtaining access
to CEOs versus the ease at which access to middle and lower-level managers can be
obtained (Beggs & Doolittle, 1988; Martinko & Gardner, 1985). It is also possible that
interest in the role of CEO and how CEOs spend their time dwindled in the mid-1980s as
issues of CEO compensation became more prevalent.
The lack of substantial, empirical research to refine Mintzberg‘s theory on the
role of CEOs has prevented the theory from developing into one that is applicable to
CEOs today. According to Lynham (2002), a theory requires a constant process of
evaluating, testing, and refining to remain viable and trustworthy. Role theory,
organizational role theory, leadership theory, and Mintzberg‘s theory of the role of CEO
provide the important underlying framework for the conduct of this research. From
detailed examination of the research on the role of CEO six categories of roles have
emerged. These six categories form the basis for this study and are presented in part three
40
of this chapter. A summary of the research studies used as the basis for the 31 roles and
six role categories is provided in Table 2.
Part two described the underlying theories supporting the discipline of HRD. It
followed with a description of role theory, organizational role theory, and leadership
theory, and how these foundational theories inform research on the role of CEO. Finally,
Mintzberg‘s seminal research described research and the resulting theory of the role of
CEO. Research on the role of CEOs is the focus of part three of this chapter.
Part Three: Research on the Role of CEOs: The Emergence of Six Categories of Roles
Part three explores research on the role of CEOs, defining the 31 roles and six role
categories that emerge from the research. Definitions of the 31 roles are supported by
research that has helped link the roles to CEOs. Contemporary research is described in
terms of the influence external complexities have on the role of CEO. This review of the
research provides further support for the problem statement of this study: that research
on the role of CEO is conflicting and outdated.
The review of literature contributed to this study in two significant ways. From
the research emerged 31 roles that are the basis for the survey instrument developed for
this research study with the purpose of answering research question #1: What is the role
of CEO in the U.S.? Furthermore the review of literature and the process of constant
comparative analysis resulted in the identification of six major role categories comprising
the role of CEO. These six role categories provide a systematic way of synthesizing the
research on the 31 roles and create a simplistic system for understanding and thinking
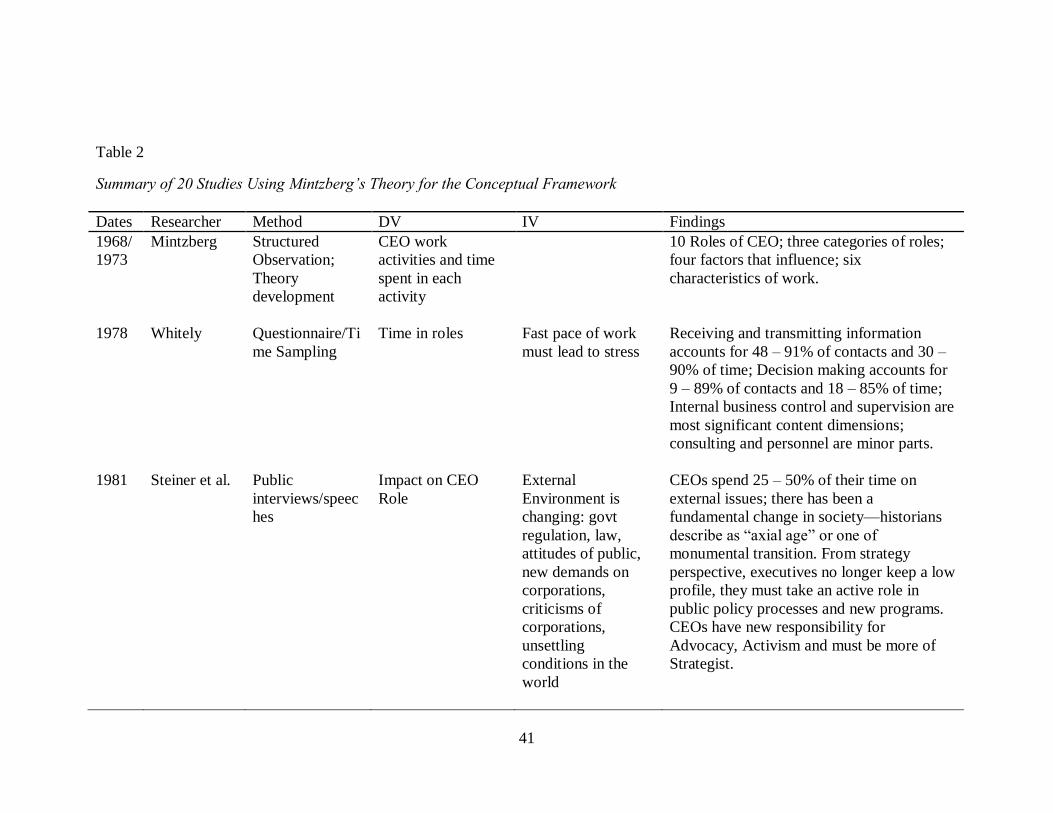
41
Table 2
Summary of 20 Studies Using Mintzberg’s Theory for the Conceptual Framework
Dates Researcher Method DV IV Findings
1968/
1973
Mintzberg Structured
Observation;
Theory
development
CEO work
activities and time
spent in each
activity
10 Roles of CEO; three categories of roles;
four factors that influence; six
characteristics of work.
1978 Whitely Questionnaire/Ti
me Sampling
Time in roles Fast pace of work
must lead to stress
Receiving and transmitting information
accounts for 48 – 91% of contacts and 30 –
90% of time; Decision making accounts for
9 – 89% of contacts and 18 – 85% of time;
Internal business control and supervision are
most significant content dimensions;
consulting and personnel are minor parts.
1981 Steiner et al. Public
interviews/speec
hes
Impact on CEO
Role
External
Environment is
changing: govt
regulation, law,
attitudes of public,
new demands on
corporations,
criticisms of
corporations,
unsettling
conditions in the
world
CEOs spend 25 – 50% of their time on
external issues; there has been a
fundamental change in society—historians
describe as ―axial age‖ or one of
monumental transition. From strategy
perspective, executives no longer keep a low
profile, they must take an active role in
public policy processes and new programs.
CEOs have new responsibility for
Advocacy, Activism and must be more of
Strategist.
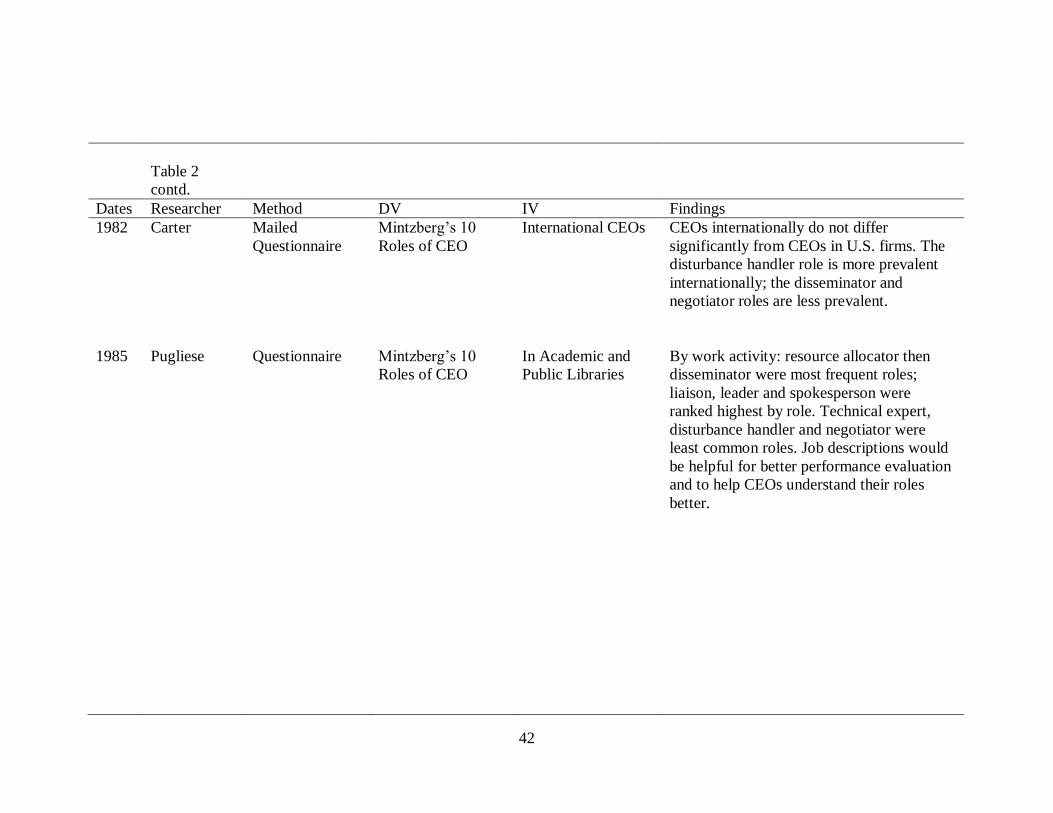
42
Table 2
contd.
Dates Researcher Method DV IV Findings
1982 Carter Mailed
Questionnaire
Mintzberg‘s 10
Roles of CEO
International CEOs CEOs internationally do not differ
significantly from CEOs in U.S. firms. The
disturbance handler role is more prevalent
internationally; the disseminator and
negotiator roles are less prevalent.
1985 Pugliese Questionnaire Mintzberg‘s 10
Roles of CEO
In Academic and
Public Libraries
By work activity: resource allocator then
disseminator were most frequent roles;
liaison, leader and spokesperson were
ranked highest by role. Technical expert,
disturbance handler and negotiator were
least common roles. Job descriptions would
be helpful for better performance evaluation
and to help CEOs understand their roles
better.
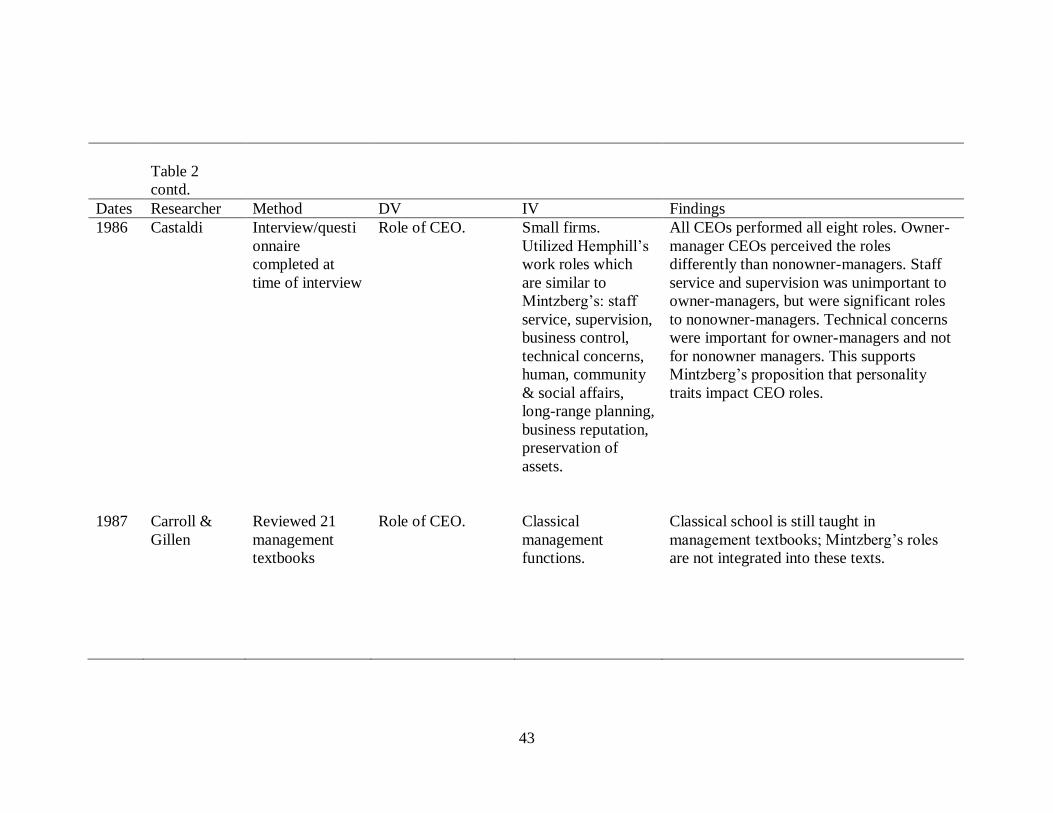
43
Table 2
contd.
Dates Researcher Method DV IV Findings
1986 Castaldi Interview/questi
onnaire
completed at
time of interview
Role of CEO. Small firms.
Utilized Hemphill‘s
work roles which
are similar to
Mintzberg‘s: staff
service, supervision,
business control,
technical concerns,
human, community
& social affairs,
long-range planning,
business reputation,
preservation of
assets.
All CEOs performed all eight roles. Owner-
manager CEOs perceived the roles
differently than nonowner-managers. Staff
service and supervision was unimportant to
owner-managers, but were significant roles
to nonowner-managers. Technical concerns
were important for owner-managers and not
for nonowner managers. This supports
Mintzberg‘s proposition that personality
traits impact CEO roles.
1987 Carroll &
Gillen
Reviewed 21
management
textbooks
Role of CEO. Classical
management
functions.
Classical school is still taught in
management textbooks; Mintzberg‘s roles
are not integrated into these texts.
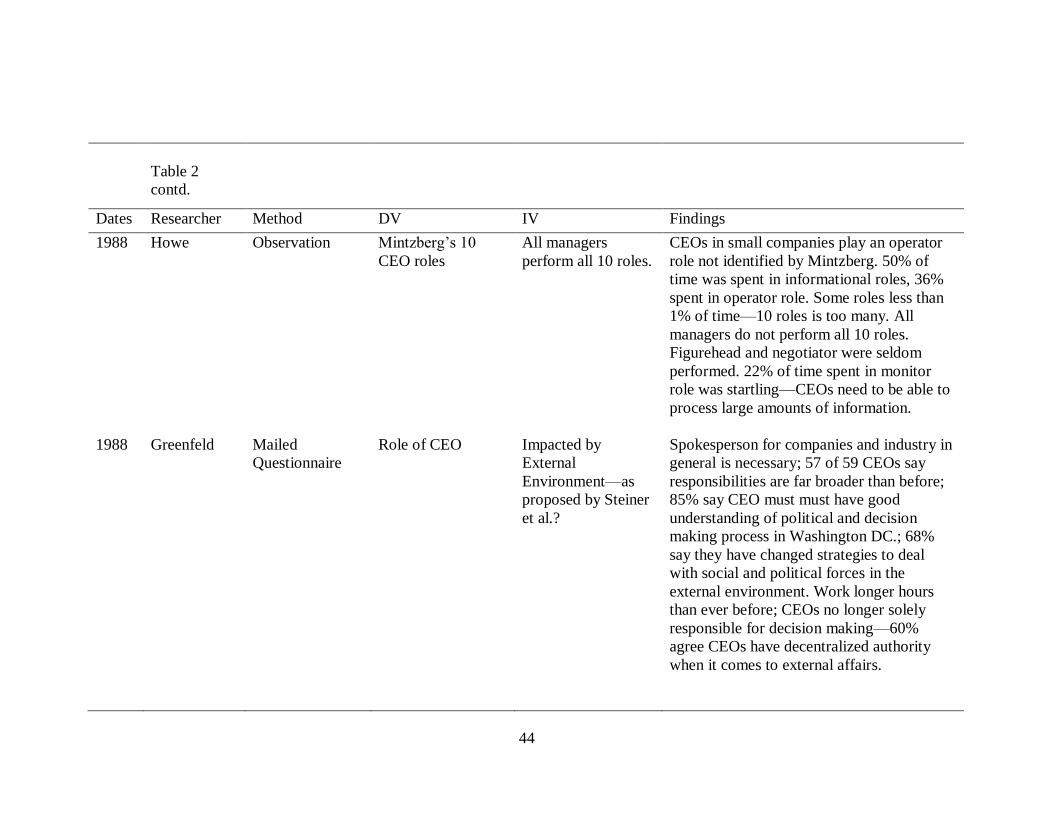
44
Table 2
contd.
Dates Researcher Method DV IV Findings
1988 Howe Observation Mintzberg‘s 10
CEO roles
All managers
perform all 10 roles.
CEOs in small companies play an operator
role not identified by Mintzberg. 50% of
time was spent in informational roles, 36%
spent in operator role. Some roles less than
1% of time—10 roles is too many. All
managers do not perform all 10 roles.
Figurehead and negotiator were seldom
performed. 22% of time spent in monitor
role was startling—CEOs need to be able to
process large amounts of information.
1988 Greenfeld Mailed
Questionnaire
Role of CEO Impacted by
External
Environment—as
proposed by Steiner
et al.?
Spokesperson for companies and industry in
general is necessary; 57 of 59 CEOs say
responsibilities are far broader than before;
85% say CEO must must have good
understanding of political and decision
making process in Washington DC.; 68%
say they have changed strategies to deal
with social and political forces in the
external environment. Work longer hours
than ever before; CEOs no longer solely
responsible for decision making—60%
agree CEOs have decentralized authority
when it comes to external affairs.
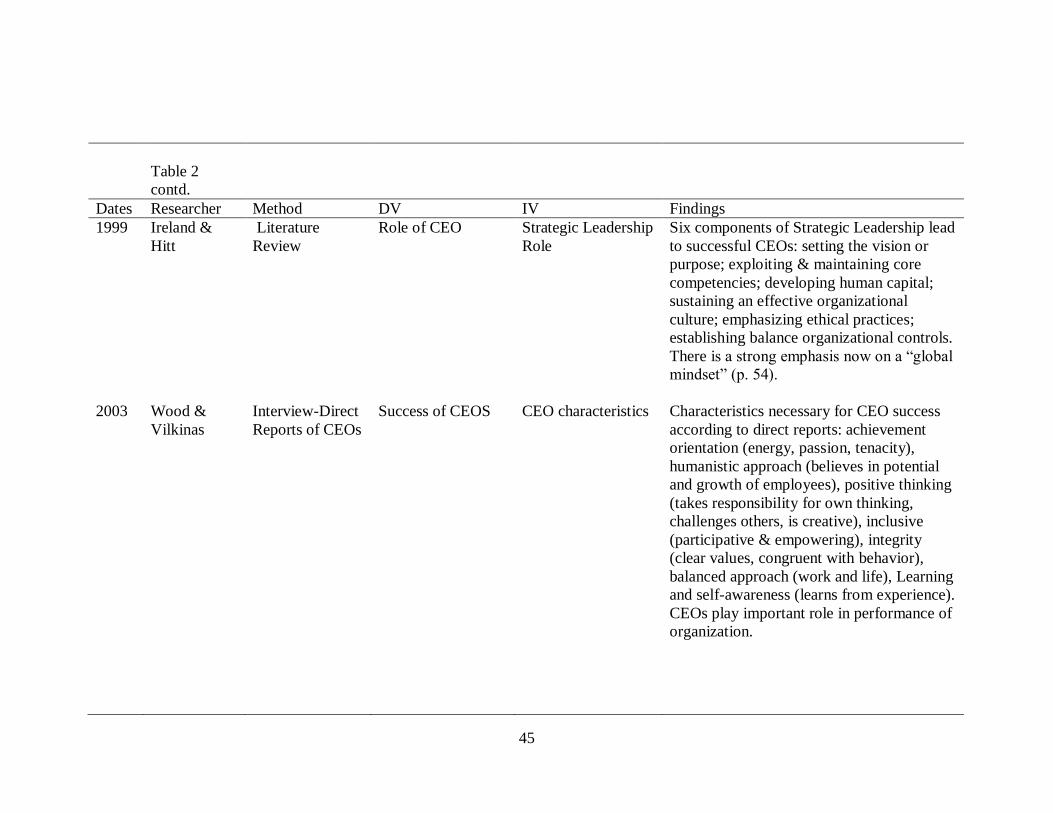
45
Table 2
contd.
Dates Researcher Method DV IV Findings
1999 Ireland &
Hitt
Literature
Review
Role of CEO Strategic Leadership
Role
Six components of Strategic Leadership lead
to successful CEOs: setting the vision or
purpose; exploiting & maintaining core
competencies; developing human capital;
sustaining an effective organizational
culture; emphasizing ethical practices;
establishing balance organizational controls.
There is a strong emphasis now on a ―global
mindset‖ (p. 54).
2003 Wood &
Vilkinas
Interview-Direct
Reports of CEOs
Success of CEOS CEO characteristics Characteristics necessary for CEO success
according to direct reports: achievement
orientation (energy, passion, tenacity),
humanistic approach (believes in potential
and growth of employees), positive thinking
(takes responsibility for own thinking,
challenges others, is creative), inclusive
(participative & empowering), integrity
(clear values, congruent with behavior),
balanced approach (work and life), Learning
and self-awareness (learns from experience).
CEOs play important role in performance of
organization.
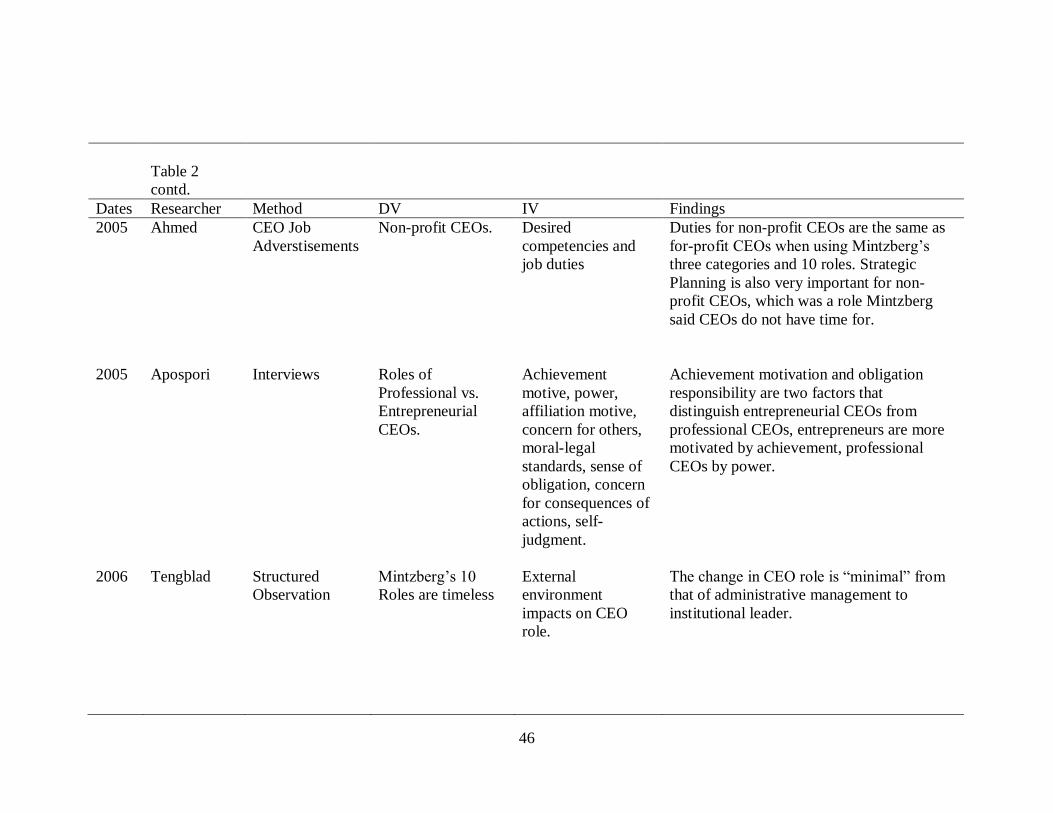
46
Table 2
contd.
Dates Researcher Method DV IV Findings
2005 Ahmed CEO Job
Adverstisements
Non-profit CEOs. Desired
competencies and
job duties
Duties for non-profit CEOs are the same as
for-profit CEOs when using Mintzberg‘s
three categories and 10 roles. Strategic
Planning is also very important for non-
profit CEOs, which was a role Mintzberg
said CEOs do not have time for.
2005 Apospori Interviews Roles of
Professional vs.
Entrepreneurial
CEOs.
Achievement
motive, power,
affiliation motive,
concern for others,
moral-legal
standards, sense of
obligation, concern
for consequences of
actions, self-
judgment.
Achievement motivation and obligation
responsibility are two factors that
distinguish entrepreneurial CEOs from
professional CEOs, entrepreneurs are more
motivated by achievement, professional
CEOs by power.
2006 Tengblad Structured
Observation
Mintzberg‘s 10
Roles are timeless
External
environment
impacts on CEO
role.
The change in CEO role is ―minimal‖ from
that of administrative management to
institutional leader.
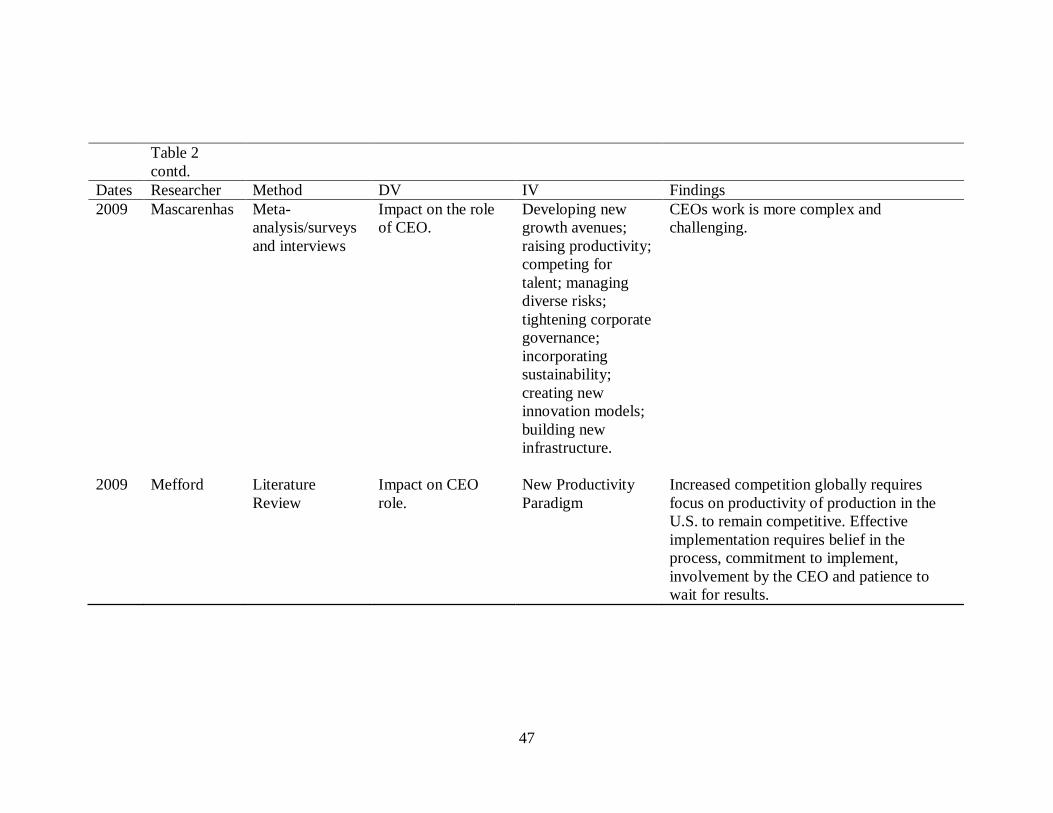
47
Table 2
contd.
Dates Researcher Method DV IV Findings
2009 Mascarenhas Meta-
analysis/surveys
and interviews
Impact on the role
of CEO.
Developing new
growth avenues;
raising productivity;
competing for
talent; managing
diverse risks;
tightening corporate
governance;
incorporating
sustainability;
creating new
innovation models;
building new
infrastructure.
CEOs work is more complex and
challenging.
2009 Mefford Literature
Review
Impact on CEO
role.
New Productivity
Paradigm
Increased competition globally requires
focus on productivity of production in the
U.S. to remain competitive. Effective
implementation requires belief in the
process, commitment to implement,
involvement by the CEO and patience to
wait for results.
48
about the role of CEO. These role categories are used in the survey instrument to answer
research question #2: How much time do CEOs estimate they spend in six categories of
roles?
The six role categories consist of informational, interpersonal, decisional,
operational, strategic, and diplomacy roles. They are presented in detail in the following
section. The presentation of the role categories begins with Mintzberg‘s (1973) three
categories. The next three categories were described in the research and were developed
by utilizing constant comparative analysis. Constant comparative analysis ―is an
inductive (from specific to broad) data analysis procedure in grounded theory research of
generating and connecting categories by comparing incidents in the data to other
incidents, incidents to categories, and categories to other categories‖ (Creswell, 2002, p.
451). This analysis was made by reviewing the detailed descriptions of each role
presented in the literature, and then grouping the similar descriptions together, forming
the categories of roles. The discussion of the six role categories begins with the
informational roles.
The Informational Roles
A significant amount of a CEO‘s time is spent communicating with others, either
receiving or providing information from individuals inside and external to the
organization (Carlson, 1951; Mintzberg, 1968; 1973; Tengblad, 2006; Whitely, 1978). It
is estimated that CEOs spend between 22 and 91% of their time either receiving or
providing information (Mintzberg, 1973; Rastetter, 1985; Tengblad, 2006; Whitely,
1978). This wide-range in values may be attributed to any number of factors. Three
researchers (Mintzberg, Tengblad, and Whitely) used structured observation, so
49
differences in methodology are unlikely. The differences may be more related to
individual personality, small sample sizes, or organizational characteristics that impact
the role.
The informational role category includes the following four roles:
Monitor: The CEO receives and collects information enabling the development of a
thorough understanding of the organization (Mintzberg, 1973).
Disseminator: The CEO transmits special information into the organization (Mintzberg,
1973)
Spokesperson: The CEO disseminates the organization‘s information into the business
world (Mintzberg, 1973)
Commander: The CEO gives orders to employees (Gulick, 1937 as cited in Mintzberg,
1973).
The role of monitor was first used by Sayles (1964) but this role was also
identified by Mintzberg (1973) and Rastetter (1985). In some cases up to 39% of a CEO‘s
time was spent in the monitor role (Rastetter, (1985). In the monitor role five different
kinds of information were processed (Mintzberg, 1973). Information either pertained to
internal operations, external events, analyses, ideas and trends, or pressures. Internal
operations and external events are self-explanatory terms. Analyses included information
from financial reports and trade organizations that required further explanation. Ideas and
trends resulted from attendance at conferences and contact with other executives in
similar industries. Pressures come from within the organization as well as from external
50
sources and can include a subordinate‘s request for additional power or requests from
outside individuals or organizations for time and/or financial support.
In the disseminator role the CEO provides information from external sources into
the organization or coordinates the communication of information within the
organization. Research on the spokesperson role has resulted in conflicting results. In
some cases it has been considered the least important role (Beggs & Doolittle, 1988) and
others have found it to be the primary focus of the CEO (Greenfeld et al., 1988). As
spokesperson for the organization the CEO is communicating information to individuals
outside the organization. This can include the board of directors or what Mintzberg
(1973) referred to as ―the organization‘s public‖ (p. 76). The organization‘s public may
be described today as the organization‘s stakeholders. Stakeholders are defined as ―a
person or group having a vested interest in the organization‘s functioning and objectives‖
(Cummings & Worley, 2009, p. 754). This could be a vendor, customer, employee,
investor, or others directly or indirectly impacted by the organization‘s business. Three
classes of stakeholder can be identified by one or more of the following characteristics:
―(1) the stakeholder‘s power to influence the firm, (2) the legitimacy of the stakeholder‘s
relationship with the firm, and (3) the urgency of the stakeholder‘s claim on the firm‖
(Mitchell, Agle & Wood, 1997, p. 854).
The final role in the informational category is the commander role derived from
Fayol and described as the role in which the CEO gives orders to employees (Fayol,
1916, as cited in Mintzberg, 1973). Fayol recognized five roles: commander, controller,
planner, organizer, and controller in his research and these roles became the foundation
for on-going research by Gulick (1937), and Mintzberg (1968; 1973).
51
The Interpersonal Roles
The interpersonal roles are linked closely with the informational roles because
much of the contact a CEO has with others is during the process of either receiving or
providing information (Carlson, 1951; Mintzberg, 1973; Tengblad, 2006). Study
participants have indicated they spend between 65 and 90 percent of their time in contact
with others (Carlson, 1951; Mintzberg; 1973; Whitely, 1978) and in some cases up to
55% of a CEO‘s time is spent in the leader role (Quarterman, Allen, & Becker, 2005).
The interpersonal role category includes the following three roles:
1) Leader: The CEO leads and motivates subordinates (Mintzberg, 1973).
2) Motivator: The CEO creates and sets a sense of excitement and vitality in the
organization, challenging people to gain new competencies and achieve higher
levels of performance (Hart & Quinn, 1993).
3) Director: The CEO makes sure the right people are in the right place at the right
time doing the right things (Gulick, 1937, as cited in Mintzberg, 1973).
The leader role requires little explanation and may be the most important role of
the CEO (Edersheim, 2007; Lafley, 2009; Mintzberg, 1973; Quarterman et al., 2005).
The motivator role, described by Hart and Quinn (1993) has an internal, flexible focus,
and is described as the role in which the CEO is ―managing meaning‖ (p. 552). In a study
of 916 CEOs the motivator role was most strongly associated with organizational
effectiveness and had a positive association with business and financial performance, yet
it was one of the roles CEOs spent the least amount of time in (Hart & Quinn, 1993). The
director role emerged from Gulick‘s (1937) work and could also be described as a
resource allocator role where human, rather than financial, resources are being directed.
52
Managing both financial and human resources is also part of the decisional roles, which
are considered next.
The Decisional Roles
Given the complexity of today‘s competitive environment and the speed at which
technology changes, one of the most important characteristics a leader must have is the
ability to be ambidextrous. That is, CEOs need to be able to consider two conflicting
ideas at the same time, make quick decisions, and be entrepreneurial and innovative at all
times (Bodwell & Chermack, 2010). The decisional and entrepreneurial roles have been
suggested to be the most important roles of a CEO (Beggs & Doolittle, 1988; Mintzberg,
1973). An entrepreneurial approach suggests innovation as a major component of the
CEO role with an emphasis on maximizing profit (Galambos, 1995). This emphasis is
consistent with the unprogrammed nature of managerial work where the most significant
impacts on the organization are those made in the decision theory framework (Mintzberg,
1973). The complexity of the decision making process implies individual characteristics
of the person in the role of CEO may be more important than the roles expected of the
individual (Hart & Quinn, 1993; Mintzberg, 1973; Zaccaro, 2001).
Decision making is influenced by existing mental models of individuals in
decision making roles (Chermack, 2003). Mental models are defined as the biases,
beliefs, experiences, and values of the individual (Ford & Sterman, 1998; Senge, 1990).
Furthermore, ―mental models embody how individuals see the world, how individuals
know and think about the world, and how individuals act in the world‖ (Chermack, 2003,
p. 410). Thus the decisional roles may be informed more by studying the unique aspects
of the individual and not necessarily the role itself. This suggests the importance of
53
cognitive and personality aspects of the individual who serves as CEO (Hart & Quinn,
1993). The decisional role category contains the following eight roles:
1) Entrepreneur: The CEO initiates change within the organization (Mintzberg,
1973).
2) Disturbance handler: The CEO takes charge of the organization when it is
threatened (Mintzberg, 1973).
3) Conflict handler: The CEO handles conflicts that arise between individuals
and outside organizations (Castaldi, 1986).
4) Resource allocator: The CEO decides where the organization will expend
efforts and resources (Mintzberg, 1973).
5) Task master: The CEO has a strong focus on results, or getting the job done
(Hart & Quinn, 1993).
6) Staffer: The CEO makes sure the right people are hired for the right positions
(Gulick, 1937).
7) Negotiator: The CEO is compelled to enter negotiations on behalf of the
organization (Mintzberg, 1973).
8) Problem solver: The CEO serves to solve the organization‘s problems (Lau et
al., 1979).
Decision making can comprise between 18 and 85% of a CEO‘s time and
between nine and 89% of the reasons for interpersonal exchanges (Mintzberg, 1973;
Whitely, 1978). Mintzberg estimated that approximately 21% of the time he observed
was spent in decision making roles. Research to ―replicate, supplement and extend
Mintzberg‘s findings‖ focused on seven managers, two were CEOs (Whitely, 1978, p.
54
195). The construct of stress was researched as a factor impacting the 10 roles based on
Mintzberg‘s assertion about the fast pace and fragmentation of the CEOs‘ work
(Mintzberg, 1973; Whitely, 1978). The researcher concluded stress did not contribute
negatively to the work of the CEO due to the fact managers, especially CEOs, enjoy a
great deal of autonomy in their positions. This autonomy provides flexibility that offsets
the negative impact of stress, and is consistent with research findings where
empowerment was discovered to offset negative impacts of role conflict, and job
autonomy contributed to a higher level of job performance (Marginson & Bui, 2009;
Morgeson, Delaney-Klinger, & Hemingway, 2005).
Hart and Quinn (1993) identified the task master role, with an external,
predictable focus, ―concerned about firm performance and results‖ (p. 553). Their
findings indicated task master was the role most frequently engaged in, but had the least
impact on the three performance indicators they studied (business, organizational, and
financial).
The problem solver, conflict handler, and disturbance handler roles seem to
conflict with Senge‘s emphasis on altering mental models in order to make better
decisions (Senge, 1994). This suggests that an orientation towards problem solver may be
very limiting to a CEO‘s ability to make effective decisions.
Problem solvers are fundamentally reactive – they wait until a problem is defined,
then seek a solution. A problem-solving orientation tends to limit creativity in
certain ways. When executives are trying to solve a problem, they focus their
efforts on defining the problem, on understanding its extent. By thinking about
solving problems, rather than dissolving them, executives often reinforce a
problem‘s existence (Senge, 1994, p. 17).
55
The Operational Roles
The role of operator was added to Mintzberg‘s list while testing the assertion that
all managers spend time in the 10 roles identified by Mintzberg (Howe, 1988). Utilizing a
combination of structured observation and a questionnaire with CEOs from small and
medium-sized insurance companies, the researcher concluded all managers do not
perform all roles however CEOs in small companies play an operator role Mintzberg did
not recognize. It has been recommended the 10 roles described by Mintzberg be re-
constructed in more parsimonious terms (Howe, 1988). Hart & Quinn (1993) used only
four roles, including the analyzer role in their study of the effectiveness of CEOs.
Analyzer, with an internal, predictable focus, ―sets the context and shapes the decisions
made by the operating system‖ (Hart & Quinn, 1993, p. 553); The Analyzer role was a
strong predictor of business performance, but was found to be only weakly related to
organizational performance and not related to financial performance.
Executives in both the private and public sectors were researched by Lau et al.,
(1979) in The nature of managerial work: A comparison of public and private sector
jobs. Using a questionnaire to gather data on the job content described by Mintzberg‘s 10
roles, an additional role was added, ―technical expert‖ (Lau et al., 1979, p. 340). The
technical expert role emerged from an earlier study of Navy civilian executives. The
researchers concluded Mintzberg‘s roles were very similar in terms of job content and the
characteristics described by Mintzberg (i.e., fragmented, high pressure, propensity to
react quickly) were seen in both the public and private sector CEOs. The suggestion by
Mintzberg (1973) that roles might be different for executives working in public versus
private sector organizations appears unsupported by this research (Lau et al., 1979). An
56
important finding was the roles the CEOs did not have time for, including ―reflective,
systematic planning‖ and self-development and learning (Lau et al., 1979, p. 343).
In a study of CEOs in small firms, Castaldi (1986) found large differences in the
roles engaged in by CEOs who were owner-managers versus non-owner managers. This
finding lends support to Mintzberg‘s contingency theory that both the person and the job
impact the roles a CEO will engage in (Mintzberg, 1973). From the person perspective,
the entrepreneur or company owner engaged more in an operational role than the non-
owner. From the job perspective the company owner engaged more in technical issues
related to product and market and perceived staff supervising as less important.
Conversely, non-owner CEOs perceived staff supervision was important and placed less
emphasis on operational and technical issues. Long-range planning and asset preservation
also received more focus from the owner-CEOs, an idea support by management theory,
but rejected by Mintzberg. The Castaldi (1986) study was supported by a similar study of
Greek CEOs in which it was concluded achievement motivation and obligation-
responsibility are two factors distinguishing entrepreneurial CEOs (owners) from
professional CEOs (non-owners) (Apospori, Papalexandris, & Galanaki, 2005). These
studies, along with others that tested Mintzberg‘s contingency framework, prompted
research hypotheses 1, 1a and 1b, 2, 5, 6, and 8, all related to differences due to gender,
ownership status of the company, age, years in current job, years as a CEO, and company
size. In summary, the operational category consists of six roles:
1) Organizer: The CEO makes sure deadlines are met (Fayol, 1916).
57
2) Analyzer: The CEO focuses on efficient management of the internal operating
system in the interest of serving existing products/markets (Hart & Quinn,
1993).
3) Controller: The CEO makes sure projects are completed on time (Fayol,
1916).
4) Operator: The CEO makes sure day-to-day operations are being completed in
a satisfactory (Howe, 1988).
5) Technical Expert: The CEO is the expert on product and market (Lau et al.,
1979).
6) Consultant: The CEO provides advice on issues that arise within the
organization (Lafley, 2009).
While the operating role category focuses on the business today, the strategic
roles focus more on the future. Two of the strategic roles were identified by Fayol (1916)
and Gulick (1937): coordinator and planner, but further definition of the strategic roles
began to emerge from research beginning in the late 1970s and early 1980s. A description
of the strategic role categories follows.
The Strategic Roles
Early research on CEOs suggested they did not have time for long-term strategic
planning (Carlson, 1951; Mintzberg, 1973). The lack of time for long-range planning was
a result of frequent interruptions during the CEOs day leading to a lack of undisturbed
time in which to plan (Carlson, 1951; Mintzberg, 1973). This conflicts with the
suggestion that strategy is the role of the CEO, documented in much of the literature
about the role of CEO, but with little supporting data (Breene et al., 2007; Ireland & Hitt,
58
1999; Stata, 1988). The vision setter role with an external, flexible focus on ―creating a
sense of identity and mission—the definition and articulation of the firm‘s basic purpose
and future direction‖ was included in research focused on CEO performance,
effectiveness, and financial performance however, the findings were mixed (p. 551). The
vision setter role was associated with business performance and organizational
effectiveness, but not with financial performance and was discovered to be one of the
roles CEOs worked in the least (Hart & Quinn, 1993). This suggestion that strategic
planning has no impact on financial performance is counter-intuitive and further research
to verify or deny this finding is needed.
A focus on strategy as the role of the CEO was suggested by Ireland and Hitt
(1999) in their description of six components of effective strategic leadership. These
components include: crafting a purpose or vision for the firm; exploiting and maintaining
core competencies; developing human capital; sustaining an effective organizational
culture; emphasizing ethical practices; and establishing balanced organizational controls.
The strategic role category is comprised of the following six roles:
1) Coordinator: The CEO makes sure all efforts are coordinated towards the
goals and strategic plan of the organization (Fayol, 1916; Gulick, 1937).
2) Innovator: The CEO guides the organization into new cycles of innovation in
U.S. markets and in overseas markets (Galambos, 1995).
3) Planner: The CEO does both short-term and long-term planning for the
organization (Fayol, 1916 ; Gulick, 1937).
4) Vision Setter: The CEO creates the sense of identify and mission for the
organization (Hart & Quinn, 1993).
59
5) Strategist: The CEO crafts the organization‘s strategy (Stata, 1988).
6) Transformer: The CEO transforms the organization as markets and the
external environment change (Galambos, 1995).
7) Creator and maintainer of culture: The CEO establishes and ensures the
organization‘s culture is consistent with its strategic focus and plan (Sashkin
& Fullmer, 1988).
The strategic roles developed as the business environment became more complex
in the late 1970s and early 1980s. The complexity and pressure exerted on CEOs by the
external environment along with the size and complexity of multi-national organizations
seems to have changed the role of the CEO (Boatright, 2009; Steiner et al., 1981). The
diplomacy roles are a result of the responsibility to multiple stakeholders, further
delineated as a global citizenship role. While two of the diplomacy roles were conceived
by Mintzberg in 1973 as informational roles, the descriptions of these roles align more
closely with the link or statesman role identified by Lafley (2009). The diplomacy roles
are the topic of the next section.
The Diplomacy Roles
The diplomacy roles emerged from studying impacts of the external environment
and the shift in the role of CEO to one of global citizenship. External complexities have
led to changes in the way CEOs must interact with the world (Lafley, 2009).
Globalization of businesses, increased complexity, expansion of the corporate
stakeholder group, and company economies exceeding those of small countries have
resulted in the need for the CEO to be a diplomat or statesperson, linking the outside
world to the world inside the organization (Edersheim, 2007; Lafley, 2009). The
60
diplomacy role category includes the following three roles, two of which were originally
identified by Mintzberg (1973):
1) Link/Statesperson: The CEO links the external world to the world inside the
organization (Lafley, 2009).
2) Figurehead: The CEO represents the organization in all formal matters
(Mintzberg, 1973).
3) Liaison: The CEO interacts with peers and others outside the organization to gain
favors and information (Mintzberg, 1973).
In an effort to understand the impact of external influences proposed by Steiner et
al., (1981), Greenfeld et al. (1988) sought to know what priority CEOs were giving to the
external environment of their organizations. Specifically the researchers wanted to know
if the CEOs in their study would agree with the findings of Steiner et al. (1981) about the
influence of external factors on the role of CEO. Questionnaires were sent to 200 CEOs
from the 1986 Baltimore Business Journal’s Book of Lists, resulting in 59 usable
responses. Most of the CEOs surveyed agreed or strongly agreed with the Steiner et al.‘s
1981 findings: the requirements put on CEOs are more extensive than they have been in
the past and more time is spent on external issues; CEOs must have an understanding of
the political process in Washington, DC; strategies have been changed to deal with
additional government regulation; and more time is spent working than ever before
(Greenfeld et al., 1988; Steiner et al., 1981).
In an editorial, Kanter (1989) supported the findings of Steiner et al. (1981) and
Greenfeld et al. (1988) by stating that for ―obvious reasons‖ managers are ―reinventing
their profession as they go‖ (p. 85). The obvious reasons included increasing competition
61
globally, acquisitions, divestitures, and mergers focused at combining business activities
while reducing staff and levels of hierarchy, and a greater focus on compensation
packages based on actual performance (Greenfeld et al., 1988; Kanter, 1989; Steiner et
al., 1981).
It is not apparent that previous researchers asked CEOs to suggest roles that might
have been missing from surveys. Most researchers asked questions about Mintzberg‘s 10
roles and in one case they developed their own set of roles upon which to base their
studies (Ahmed, 2005; Beggs & Doolittle, 1988; Carter, 1982; Hart & Quinn, 1993;
Howe, 1988; Kurke & Aldrich, 1983; Lau et al., 1979; Mintzberg, 2009; Pugliese, 1985;
Snyder & Wheelen, 1981; Tengblad, 2006; Whitely, 1978). In some cases the researchers
asked CEOs to rank the roles in terms of importance, rather than asking for time
estimations of the roles. These strategies employed by other researchers led to the
development of research question #3: What roles are identified by CEOs that were not
identified in the literature on the role of CEO?
The most current research conducted by Tengblad (2006) and Mintzberg (2009)
was based on the idea that the CEO role remains timeless and is unaffected by the
complexities in the business environment. It seems unlikely that the role of CEO has not
been impacted by changes in the business and regulatory environment over the past 40
years. Mintzberg‘s theory was contextual in nature, as all theories are, thus it is important
to understand the perspective from which Mintzberg‘s research was conducted (Lynham,
2002). These studies, suggesting the role of CEO has not changed, are presented in the
following section.
62
Contemporary Research: External Complexities and Their Impact on The Role of CEO
Two contemporary studies suggest that complexities in the external environment
have not changed the role of CEO. In 2006 Tengblad published a comparative study to
inform Mintzberg‘s theory on the impact of 30 years of change. The purpose of this study
was to determine ―the extent to which managerial work (at the executive level) is subject
to change‖ (Tengblad, 2006, p. 1438). The problem studied was based on two conflicting
views about the role of CEO. Studies by Carlson (1951), Mintzberg (1973), and Kurke
and Aldrich (1983) suggested the roles they described would be the same over time.
More current research suggests dramatic changes in the structure of organizations, the
business environment, and technology has caused changes to the role of CEO.
(Edersheim, 2007; Galambos, 1995; Hart & Quinn, 1993; Lafley, 2009).
Observing four CEOs for a full week during the late 1990s, Tengblad wanted to
compare the work behaviors of his participants to those observed by Mintzberg. The
findings resulted in the following differences:
1) CEOs worked longer hours, travelled more, and spent less time at their desks.
2) There were more meetings with more people in attendance.
3) There were more meetings with subordinates, fewer with suppliers and clients.
4) More time was spent providing information and communicating expectations,
including vision, strategy, intentions, and performance targets.
5) There was more participation in formal ceremonies.
The researcher described these changes as a shift in the role of CEO from
administrative management to institutional leadership, but concluded the shift was an
insignificant change in the role of CEO (Tengblad, 2006). Cultural and political
63
differences between Europe and the U.S. may explain why researchers in the U.S. argue
the change from an administrative emphasis to a leadership emphasis does indicate a
significant shift has occurred for the role of CEO (Beggs & Doolittle, 1988; Boatright,
2009; Jensen & Murphy, 1990; Steiner et al., 1981).
Mintzberg (2009) supported the findings of Tengblad (2006). Defining a manager
as ―someone responsible for a whole organization or some identifiable part of it‖ (p. 12),
thus expanding the role to individuals in division-level or department-level CEO-like
positions, Mintzberg studied an additional 12 CEOs during 2003. His focus was the level
of impact changes in the business environment made on the role of CEO. Mintzberg
(2009) concluded these changes were not significant. He recognized that many things in
the business environment were changing and stressed the importance of the CEO role in
linking the organization to the external environment (consistent with Lafley, 2009),
however he stood by his earlier conclusions about the role of CEO:
Has any of that changed now? We might like to think so, but the evidence
suggests otherwise. Were management a science, even a profession, it would
change. (Medical practice changes constantly.) But management is neither. So
aside from the fads that come and go, many of them dysfunctional, managing
carries merrily along. Even the new information technologies, especially e-mail—
the one thing that does seem to be rendering significant change—may actually be
reinforcing long-standing characteristics of managerial work . . . (p. 14).
The context of these comments is important to consider. Over the years Mintzberg‘s
focus shifted from the work not just of CEOs, but to the work of all managers, even
though CEOs comprised a portion of the managers he studied. The argument stands that
managers and CEOs are distinctly different in the work they do and the way they think
(Zaleznik, 1977).
64
Changes in the External Environment
Many researchers disagree with Tengblad (2006) and Mintzberg (2009), arguing
that changes in the business environment have caused substantial changes in the role of
CEO (Beggs & Doolittle, 1988; Boatright, 2009; Edersheim, 2007; Jensen & Murphy,
1990; Lafley, 2009; Steiner et al., 1981). In the years following 1973, the business
environment changed rapidly as a result of technology, globalization, excess capacity,
increased productivity, and instability (Breene et al., 2007; Boatright, 2009; Jensen &
Murphy, 1990). These changes impacted the expectations for the role of the CEO and
contributed to the complexity the CEO was supposed to manage (Breene, et al., 2007;
Boatright, 2009; Hart & Quinn, 1993; Jensen & Murphy, 1990). It was suggested the role
of CEO began to evolve into one of value and wealth creation, where the CEO was
expected to operate the business as if he/she owned it. This evolution in roles is a reversal
from the belief that the role of CEO was bureaucrat or technocrat (Boatright, 2009).
Major changes were also made to executive compensation plans, including the addition
of stock options. Stock-based compensation plans are one way of ensuring CEOs have
skin in the game (Boatright, 2009). It seems evident that researchers do not agree on the
impact the complexity of the external environment has had in changing the role of CEO.
Much of the growth in business during the 1960s and 1970s was due to business
expansion that resulted in many of the economic challenges of the 1980s and 1990s,
including excess capacity and out-sourcing of jobs (Boatright, 2009; Jensen & Murphy,
1990). For companies to expand their wealth in the years after 1973, they had to
downsize their expenses and their organizations. Too much downsizing created a
potential for the CEO to lose their job which was a huge disincentive. Companies that did
65
not downsize were vulnerable to hostile takeovers by corporate raiders. To encourage
downsizing and to reward downsizing that would put the CEO job at risk, CEO
compensation plans were structured in a manner to compensate the CEO for sacrificing
their own jobs if necessary (Boatright, 2009; Jensen & Murphy, 1990).
Non-economic pressure from sources external to the organization can be just as
important to the complexity of the business environment (Steiner et al., 1981). Social
consciousness impacts consumer decisions and CEOs are expected to make corporate
social responsibility a priority in their decisions (Lynham, 1998; Waldman, Siegel, &
Javidan, 2006). Additionally CEOs are responsible not only to stockholders but to a much
wider group of stakeholders than ever before (Bing, Kehrhahn, & Short, 2003). This
group of stakeholders includes employees whose changes in attitudes, expectations, and
demands put additional pressure on the CEO (Steiner et al., 1981)
The complexity of the business landscape remains in place today (Breene et al.,
2007; Favaro et al., 2010) while ―the CEOs work is becoming more complex and
challenging‖ (Mascarenhas, 2009, p. 250). Included in the challenges are the needs to
develop new avenues for corporate growth, increase worker productivity, compete for
talented employees, manage unique risk, tighten corporate governance, create sustainable
business models along with innovation models, build new infrastructure, and lead in
virtual environments (Bennett & Bierema, 2010; Mascarenhas, 2009). The rapid
development of industry in countries like China and India, where labor and other
production costs are much lower than in the U.S. adds to the challenge for maintaining
competitiveness (Mefford, 2009). Steiner et al. (1981) may have best described the
changes occurring after the 1970s causing a significant shift in the role of CEO:
66
We may well be in the midst of what cultural historians describe as an ‗axial age‘,
or one of monumental transition. At least, so far as business is concerned there is
little doubt that the rules of the game have changed dramatically from even a
decade ago. The scope of environmental concerns has enormously expanded for
the CEO of the large company and his priorities of attention have altered
significantly within the past few years (p. 11).
Three decades following these comments academics are being called upon to
―reorient their research and teaching agendas towards these pressing, top management
concerns‖ (Mascarenhas, 2009, p. 250). These concerns include the need to increase
productivity, develop growth, develop talent, manage risk, tighten corporate governance,
and increase sustainability---all representing significant challenges to the role of CEO.
Understanding the role of CEO is one aspect of research that may be useful for helping
CEOs and their organizations ―better navigate the turbulent times ahead‖ (Mascarenhas,
2009, p. 250).
Large corporations often conduct their own research into CEOs, as evidenced by a
recent study of the IBM Institute for Business Value and IBM Strategy and Change.
Conducting interviews of 1,541 CEOs from September, 2009, through January, 2010,
IBM released the fourth edition of their Global CEO Study series in May, 2010. While
not directly focused on the role of CEOs, participants identified three strategies necessary
for capitalizing on the complexity of today‘s business landscape (IBM Institute for
Business Value, 2010).
Creativity was identified as the most important leadership aspect of CEOs:
Creative leaders invite disruptive innovation, encourage others to drop outdated
approaches and take balanced risks. They are open-minded and inventive in
expanding their management and communication styles, particularly to engage
with a new generation of employees, partners and customers (p. 10).
67
The ability to reinvent customer relationships was identified as a critical strategy
for CEO effectiveness:
In a massively interconnected world, CEOs prioritize customer intimacy as never
before. Globalization, combined with dramatic increases in the availability of
information, has exponentially expanded customer‘s options. CEOs said that
ongoing engagement and co-creation with customers produce differentiation.
They consider the information explosion to be their greatest opportunity in
developing deep customer insights (p. 10).
To deal with complexity it was suggested that CEOs needed to build operating
dexterity:
CEOs are revamping their operations to stay ready to act when opportunities or
challenges arise. They simplify and sometimes mask complexity that is within
their control and help customers do the same. Flexible cost structures and
partnering capabilities allow them to rapidly scale up or down (p. 10).
The CEOs interviewed indicated a degree of doubt in their own abilities to handle
the ―rapidly escalating complexity‖ in the business world today (IBM Institute for
Business Value, 2010, p. 13).
Summary and Conclusions
In many ways the work that has been done to clarify the role of CEO is still
incomplete (Edersheim, 2007; Hart & Quinn, 1993). Immediately following the release of
Mintzberg‘s book in 1973 many researchers tried to verify the roles Mintzberg proposed
however few attempts have been made to update the 10 roles. Furthermore, there does not
appear to be a model or theory that integrates a complete set of roles that contribute to an
effective executive (Hart & Quinn, 1993; Howe, 1988; Mintzberg, 1973, 2009; Snyder &
Wheelen, 1981) and few empirical studies have attempted to make the connection
between the role of CEO and the performance of the organizations they lead. Peter
Drucker‘s attraction to the role of CEO ―became almost an obsession‖ in the last years of
68
his life, marked by the 21st
century—a time when the speed of change left very little
room for errors in top management (Edersheim, 2007, p. 40). In a 2003 interview
Drucker commented ―the CEO role needed to be the next focus of management research‖
(Edersheim, 2007, p.40). This comment aptly and succinctly underscores the need to
research the role of CEO. The majority of studies on the role of CEO date back 40 years
and have lost relevance for CEOs today. While CEOs are being studied extensively in
other areas, there remains a basic need to understand the role of the CEO. These
conclusions support the problem put forth for this study, namely: that research on the
role of CEO is conflicting and outdated.
This chapter has presented the methodology used to conduct the review of
literature. Additionally, it provided an analysis and synthesis of literature covering a brief
overview of the history of CEOs and existing theories that inform research on the role of
CEO. From the review of literature six role categories and 31 CEO roles emerged,
providing the foundation for this study. From the review of literature the research
questions and hypotheses also evolved. The most current research on the complexities of
the external environment and their impact on the role of CEO were presented.
The following chapter outlines the methodology for this research study.
Specifically, it provides the research questions and hypotheses, research design, research
philosophy, population and sample, sampling procedures and external validity, the pilot
study, instrumentation, measurement validity and reliability, data collection, and
limitations and weaknesses of the study designed to provide evidence of the role of CEO.
69
CHAPTER THREE: METHODOLOGY
Introduction
This study was designed to provide evidence of the role of CEO from the
perspective of CEOs and to analyze the amount of time CEOs spend in specific role
categories. This study was conducted using a survey design which is considered a form
of cross-sectional research. Quantitative data were collected from CEOs using self-
administered surveys through an electronic survey tool Qualtrics. Data were analyzed
testing the study‘s three research questions and eight research hypotheses using both
descriptive and inferential statistical methods. This chapter will present the methodology
for the study including: identification of the research questions and hypotheses, research
design, research philosophy, population and sample, sampling procedures and external
validity, the pilot study, instrumentation, measurement validity and reliability, data
collection, and limitations and weaknesses.
Research Questions
The overarching research question to be addressed by this study was:
RQ1) What is the role of CEO in the U.S.?
To gain an understanding about how CEOs allocate their time, the following question
was asked:
RQ2) How much time do CEOs estimate they spend in six categories of roles?
70
On the survey participants were asked to add roles that were missing in order to explore
the following question:
RQ3) What roles are identified by CEOs that were not identified in the literature on the
role of CEO?
In addition to the three research questions, the following hypotheses were tested:
H1) There is no difference between gender, agreement with the 31 role descriptions, and
time allocated to the six role categories.
H1a) Female CEOs will report they spend more time in interpersonal roles than their
male counterparts.
H1b) Female CEOs will report they spend less time in operational roles than their male
counterparts.
H2) CEOs from public companies will report they spend less than 10% of their time in
strategic role categories.
H3) Agreement with and time spent in the role categories will not differ depending upon
the CEOs degree major or industry background.
H4) There will be no difference in the way CEOs spend their time between CEOs with
other C-level executives working for them, and those without C-level executives.
H5) There will be an association between age, years in current job, years as a CEO, last
degree earned, company size and agreement with each role category.
H6) There will be no difference in the responses on role agreement and time spent in the
role categories between CEOs from privately-held versus publicly-held companies.
H7) There will be no difference in the responses on role agreement and time allocations
to role categories between a convenience sample of CEOs and a random sample of CEOs.
71
H8) There will be no difference in the responses on role agreement and time allocations
between CEOs from small companies and CEOs from large companies.
To answer these research questions and test the hypotheses a survey was
developed based on 31 role descriptions identified in the review of the literature. These
31 roles were analyzed into six role categories using constant comparative analysis to
induce six categories of roles: informational, diplomacy, interpersonal, decisional,
strategic, and operational. This analysis was made by reviewing the detailed descriptions
of each role presented in the literature, and then grouping the similar descriptions
together, forming the categories of roles.
The survey participants were asked to review the 31 roles and report whether or
not they agree with the roles as they relate to their role as CEO. A five-point Likert scale
was used ranging from strongly agree to strongly disagree. The participants were asked to
approximate the number of hours spent in the role categories during an average week.
The participants were provided space to write in any roles that were missing from the
survey, along with an approximation of the number of hours spent in those roles during
an average week. Finally, demographic information about the CEO and their organization
were collected for both comparative and associational purposes. The demographic
information collected included: age, gender, years in current job, years as CEO, last
degree earned, academic major or industry background, company size by employee
number, company size by sales revenue, industry, ownership status of company, that is,
privately- or publicly-held, whether or not they hold an additional title besides CEO, and
if yes, what that title is, and whether or not they have other C-level executives working
for them, and if yes, what those titles are. Table 3 provides a summary of the research
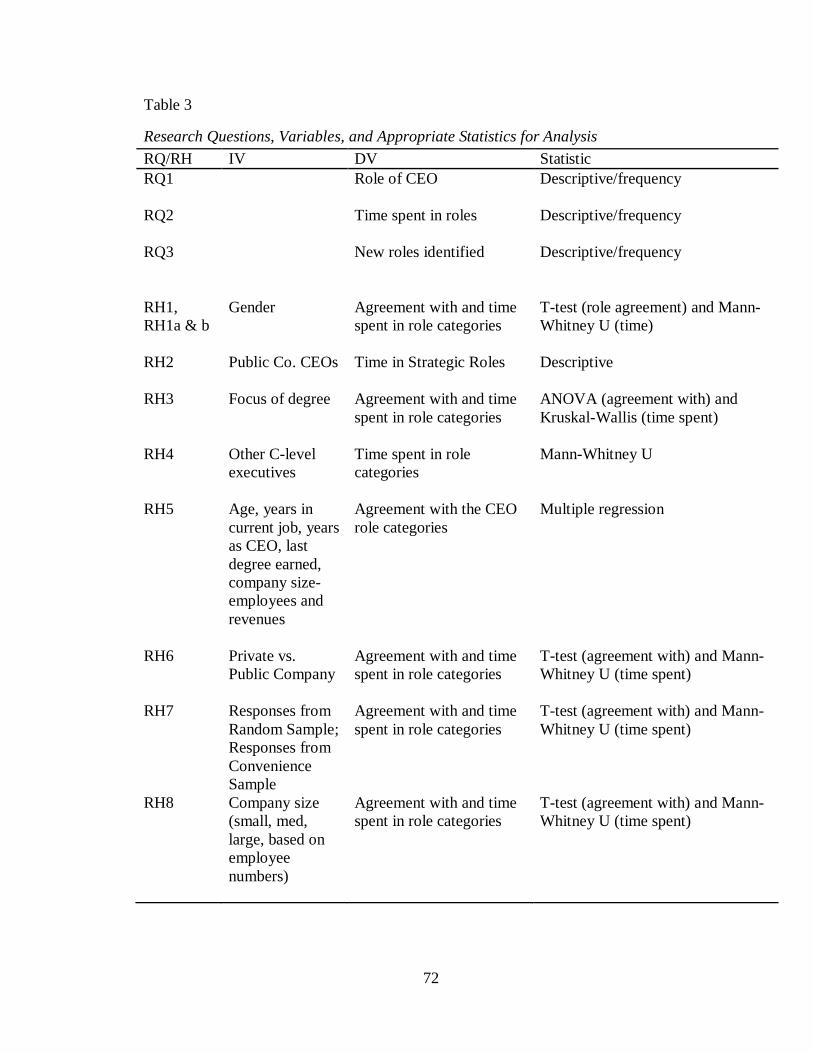
72
Table 3
Research Questions, Variables, and Appropriate Statistics for Analysis
RQ/RH IV DV Statistic
RQ1 Role of CEO Descriptive/frequency
RQ2 Time spent in roles Descriptive/frequency
RQ3 New roles identified Descriptive/frequency
RH1,
RH1a & b
Gender Agreement with and time
spent in role categories
T-test (role agreement) and Mann-
Whitney U (time)
RH2 Public Co. CEOs
Time in Strategic Roles Descriptive
RH3 Focus of degree Agreement with and time
spent in role categories
ANOVA (agreement with) and
Kruskal-Wallis (time spent)
RH4 Other C-level
executives
Time spent in role
categories
Mann-Whitney U
RH5 Age, years in
current job, years
as CEO, last
degree earned,
company size-
employees and
revenues
Agreement with the CEO
role categories
Multiple regression
RH6 Private vs.
Public Company
Agreement with and time
spent in role categories
T-test (agreement with) and Mann-
Whitney U (time spent)
RH7 Responses from
Random Sample;
Responses from
Convenience
Sample
Agreement with and time
spent in role categories
T-test (agreement with) and Mann-
Whitney U (time spent)
RH8 Company size
(small, med,
large, based on
employee
numbers)
Agreement with and time
spent in role categories
T-test (agreement with) and Mann-
Whitney U (time spent)
73
questions, dependent and independent variables, and the corresponding statistic used to
analyze the data.
Research Design
The research design used in this study was non-experimental, descriptive,
inferential, and utilized quantitative methods. The methodology was a self-reporting
survey to collect data for testing comparative and associational questions and hypotheses
about the role of CEO. E-mail was selected as the primary method for contacting
participants due to the ease of sending large numbers of e-mails at a minimum cost.
When compared to the cost of printing and mailing paper surveys along with the resulting
manual data entry, e-mail was the most economical and efficient method for conducting
the survey. Paper surveys were offered as an alternative to the on-line survey with 11
participants choosing the paper survey method. Of the paper surveys mailed, 4 surveys
were returned and included in the sample.
A majority of the research on the role of CEO has been conducted by structured
observation, where the role of a limited number of CEOs is described from the
perspective of the researcher, not necessarily from the perspective of the CEO. Structured
observation, a research method conducted by watching an individual perform work in a
natural work environment, is based on categorizing observed events in any number of
ways and is dependent upon the researchers‘ interpretation of the activities into broader
categories (Mintzberg, 1973). Certain activities can be observed, however a large portion
of the work performed by CEOs is cognitive work that cannot be observed (Martinko &
Gardner, 1985). Additionally, work performed outside the office is not likely to be
observed by the researcher; therefore, the structured observation method may miss some
74
critical activities or aspects of the role of CEO (Martinko & Gardner, 1985). Structured
observation has been criticized for its small sample sizes (evidenced by Mintzberg‘s
research on five CEOs), lack of reliability and validity, inconsistent coding
methodologies, narrow perspective of the studies, failure to identify effective versus
ineffective CEOs, lack of theory, and failure to identify the epistemological orientation of
the researcher (Martinko & Gardner, 1985).
Use of work diaries, interviews, in-basket simulation, and time sampling are other
research methods employed to study the role of CEO (Carlson, 1951; Lau et al., 1979;
Mintzberg, 1973; Shapira & Dunbar, 1980; Snyder & Wheelen, 1981; Whitely, 1978). A
few studies have surveyed CEOs directly using Mintzberg‘s 10 roles or Hart and Quinn‘s
four roles, however these surveys limited the roles the CEOs could choose from and did
not appear to ask the CEOs to add roles they thought were missing from the survey.
Assumptions
Certain assumptions are important to consider in this research study which
utilized a survey methodology. First, it is assumed the survey instrument developed and
used provided accurate and reliable data and provided roles and descriptions from
research the survey participants identified with. Second, it is assumed CEOs who
participated in this study accurately completed the survey instrument. Finally, it is
assumed the responses provided by the CEOs reflected accurate representations of CEO
roles and the estimated amount of time spent in these roles on a weekly basis. This study
incorporated sampling procedures consistent with a post-positivist research philosophy,
as outlined in the following section.
75
Research Philosophy
Based on an underlying post-positivist philosophy, the epistemology, or the
―nature of the relationship between the knower (the inquirer) and the known (or
knowable)‖ (Guba, 1990, p. 18) is modified objectivist, with an understanding that
objectivity is an ideal that may never be entirely comprehended. The ontology or ―nature
of reality‖ (Guba, 1990, p. 18) is a critical realist perspective in which it is believed that
reality exists, although humans may never completely comprehend it. The researcher
believes that the role of CEO can be known, and the best way to discover the role of CEO
is to ask CEOs. The researcher also believes there is value in this knowledge for HRD
practitioners, CEOs, and Boards of Directors. It is hoped that the researcher can publish
several articles as a result of this research and that dissemination of the knowledge gained
about the role of CEO will encourage further empirical research on CEOs.
Knowledge accumulation was accomplished using a survey of CEOs with hopes
that the response rate was large enough to make generalizations about the total population
of CEOs. The conventional benchmarks of rigor include internal and external validity,
reliability, and objectivity. The post-positivist paradigm emphasizes objectivity and thus
the values of the researcher were not considered for this study. Ethics were maintained by
utilizing random sampling and maintaining anonymity of study participants. The voice of
the study is that of the researcher objectively reporting the research findings from the
perspective of working CEOs. Certain limitations exist because of the willingness or
ability for a random selection of CEOs to respond to surveys.
76
Population and Sample
There are an estimated 400,000 CEOs in the U.S. (Martelli & Abels, 2010). This
was considered the theoretical population for purposes of this study. The total number of
accessible CEOs was limited by the availability of CEO e-mail addresses in a purchased
database and from the researcher‘s professional contacts. This number was approximately
28,000 CEOs. Internet surveys are a relatively new method of data collection and best
practices for conducting this type of research is evolving (Leong & Austin, 2006). The
entire accessible population became the selected sample due to the difficulty in
estimating response rates. Expected response rates for internet surveys ―have ranged
wildly from 0% . . . to 85.3%‖ (Leong & Austin, 2006, p. 190). InfoServices, a division
of RefUSA estimated the response rates would range from .25% to 2.0 % based on their
experience collecting data from executives using e-mail surveys.
The accessible population was identified using a variety of sources. The first
source of CEOs was a convenience sample of 127 CEOs who were professional contacts
of the researcher. This sample was expanded from 50 by asking the CEOs to recommend
other CEOs, by accessing CEO contacts from the CSU Alumni website, and by accessing
CEOs from the Linked-In database of a colleague at Colorado State University. The
second source was a random sample of approximately 250 CEOs obtained from the
Lexis-Nexis database at Morgan Library at Colorado State University. The final and
major source of CEO e-mail addresses were obtained from a purchased database.
Several alternative sources for accessing CEO e-mail addresses were identified.
These sources included the Mergent database accessible for free through the Morgan
Library at Colorado State University and a variety of databases available for sale. Several
77
companies selling databases were identified, including Lead411.net, InfoServices (a
division of RefUSA), rsalists.com, and thedatasupplier.com. An attempt was made to
partner with business organizations offering study data in exchange for help accessing
CEOs. The organizations contacted included The Academy of Management, The
American Management Association, Chief Executive Magazine, Vistage, IBM,
PriceWaterhouse-Coopers, Business Roundtable, strategy+business, and CEOsurvey.org.
These organizations either did not express interest in this partnering opportunity or did
not respond to the request.
The survey was conducted using Qualtrics software implemented by The School
of Education at Colorado State University during the summer, 2010. This software allows
the creation of a confidential, on-line survey that can be sent as a link to a large number
of e-mail addresses. It provides a back-end tool that tracks responses and collects data in
a form that can be automatically downloaded into IBM SPSS software. Data collection
began on October 28, 2010. Surveys were e-mailed over a three week period of time,
either on Tuesday or Thursday. Reminder e-mails were sent one week following the
original e-mail. Data collection ended on November 23, 2010.
Sampling Procedures and External Validity
The sampling procedures for this study were conducted in phases aimed at
maximizing the number of study participants. The first phase was comprised of a
convenience sample of 127 CEOs. The advantage of using a convenience sample is that it
is believed CEOs are more likely to respond to surveys when they are conducted by
someone they know or trust (Bartholomew & Smith, 2006). The second phase of
sampling was based on an accessible population of CEOs from a purchased database. The
78
entire accessible population was contacted. A large sample was necessary due to the
expected low response rate.
External Validity
The goal of sampling is to select a sample that is representative of the total
population so inferences can be made from the sample to the population (Gall, Gall, &
Borg, 2005; Gliner, Morgan & Leech, 2009). Having a sample that is representative is
more important than overall sample size and is an important aspect in evaluating external
validity, specifically population external validity (Gliner et al., 2009). Ecological external
validity, a second aspect of external validity, is considered adequate when the study is
conducted in a natural setting for the participants (Gliner et al., 2009). Due to the nature
of a mailed or e-mailed survey, it is assumed CEOs who choose to participate will do so
from their homes or their offices--a natural setting for them as opposed to a laboratory or
classroom. To ensure the random and convenience samples used were mutually exclusive
a complete listing of e-mail addresses was checked for duplicates using Microsoft Excel.
For purposes of this study internal validity will not be evaluated because the research is
not designed to infer a causal relationship (Gliner et al., 2009).
One potential problem with a random sample of CEOs is the sample may be
heavily weighted by male CEOs, based on the actual proportion of female to male CEOs,
especially in publicly-traded companies (Adams, Gupta, & Leeth, 2009). Stratified
random sampling could have been used to address this issue. Stratified random sampling
is a ―probability technique in which the population is divided into segments based on key
variables, sampling from each value of the key variable‖ (Gliner et al., 2009, p. 437). In
an attempt to maximize sample size stratified random sampling was not used.
79
The total desired sample size was 400, a response rate of 1.4%. It is suggested that
five times as many responses as items on a survey will provide optimal data for factor
analysis and for practical purposes (Leong & Austin, 2006) making the minimum desired
number of responses 155. Dillman recommends 383 respondents for a population of
100,000, +/- 5% sampling error, with a 50/50 split (Dillman, 2007). The recommended
sample size increases to 384, or by only one respondent, for a population of 1,000,000
and thus, while the population size increases dramatically, the recommended sample size
does not. The total actual sample size of 1,202 exceeded the recommendations of Leong
& Austin (2006) and Dillman (2007) and was believed to be a reasonable response rate
when studying CEOs and when collecting data via e-mail (Beggs & Doolittle, 1988).
Table 4 provides sample sizes from previous studies on CEOs.
The Pilot Study
After receiving Colorado State University Institutional Review Board approval
(Appendix C), a pilot study using paper (mailed) surveys was conducted in May, 2010 on
a random sample of 100 CEOs from the accessible population. An accessible population
of CEOs from companies in the U.S. was selected using Reference USA (RefUSA) from
the Fort Collins Public Library website: http://www. poudrelibraries.org and accessed
from the Morgan Library at Colorado State University. RefUSA is a leading provider of
business and consumer research and is a service of InfoGroup, an internet-based
reference service founded in 1992. RefUSA was designed to be used as a reference and
research tool for students, job seekers, and researchers. The data are continuously
updated from over 5,000 public sources and examined by hand for quality and
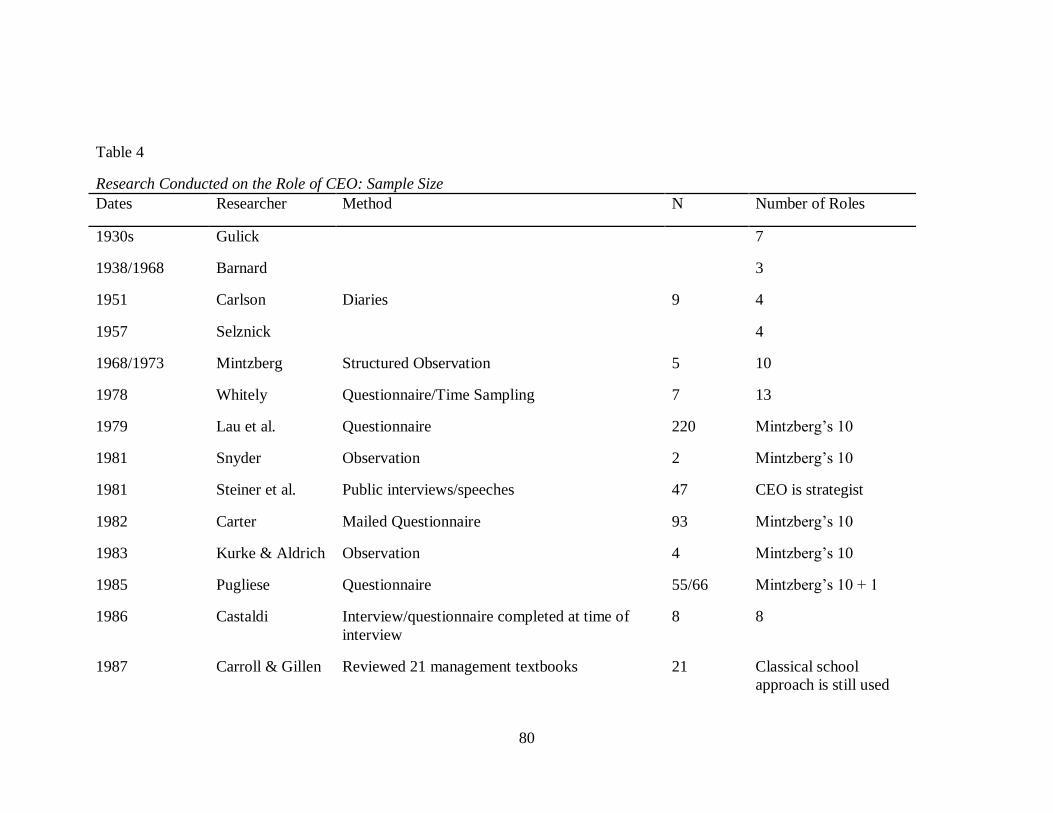
80
Table 4
Research Conducted on the Role of CEO: Sample Size
Dates Researcher Method N Number of Roles
1930s Gulick 7
1938/1968 Barnard 3
1951 Carlson Diaries 9 4
1957 Selznick 4
1968/1973 Mintzberg Structured Observation 5 10
1978 Whitely Questionnaire/Time Sampling 7 13
1979 Lau et al. Questionnaire 220 Mintzberg‘s 10
1981 Snyder Observation 2 Mintzberg‘s 10
1981 Steiner et al. Public interviews/speeches 47 CEO is strategist
1982 Carter Mailed Questionnaire 93 Mintzberg‘s 10
1983 Kurke & Aldrich Observation 4 Mintzberg‘s 10
1985 Pugliese Questionnaire 55/66 Mintzberg‘s 10 + 1
1986 Castaldi Interview/questionnaire completed at time of
interview
8 8
1987 Carroll & Gillen Reviewed 21 management textbooks 21 Classical school
approach is still used
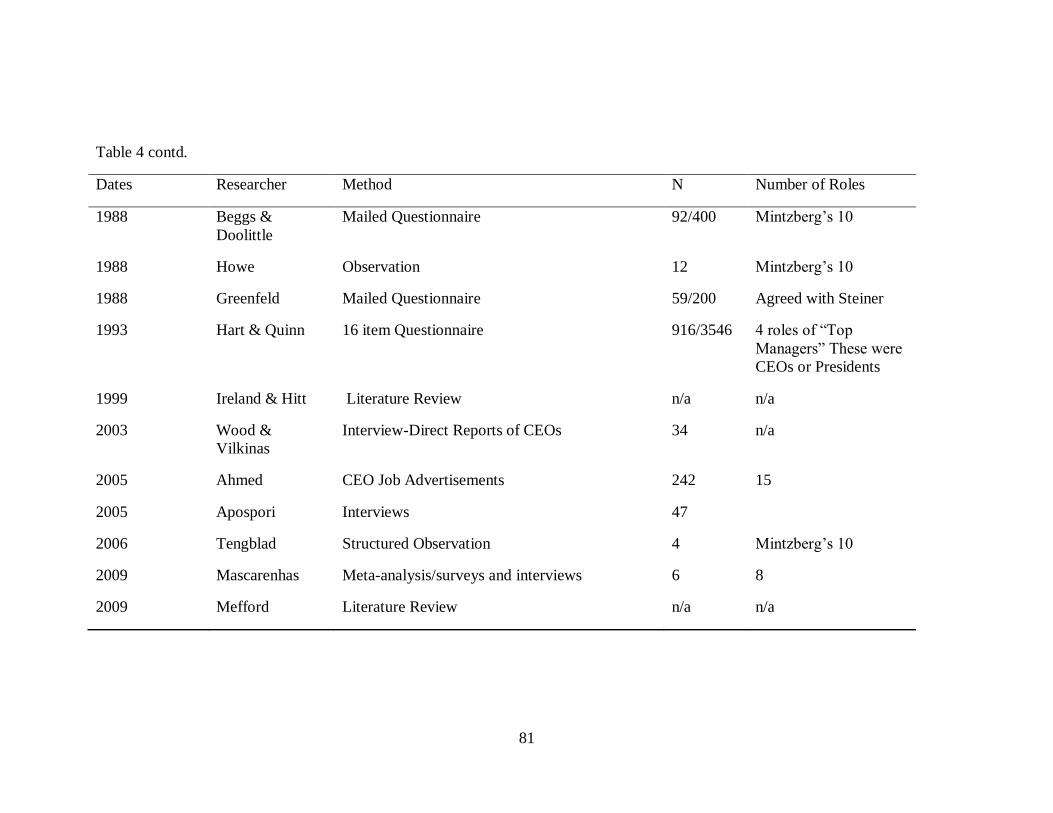
81
Table 4 contd.
Dates Researcher Method N Number of Roles
1988 Beggs &
Doolittle
Mailed Questionnaire 92/400 Mintzberg‘s 10
1988 Howe Observation 12 Mintzberg‘s 10
1988 Greenfeld Mailed Questionnaire 59/200 Agreed with Steiner
1993 Hart & Quinn 16 item Questionnaire 916/3546 4 roles of ―Top
Managers‖ These were
CEOs or Presidents
1999 Ireland & Hitt Literature Review n/a n/a
2003 Wood &
Vilkinas
Interview-Direct Reports of CEOs 34 n/a
2005 Ahmed CEO Job Advertisements 242 15
2005 Apospori Interviews 47
2006 Tengblad Structured Observation 4 Mintzberg‘s 10
2009 Mascarenhas Meta-analysis/surveys and interviews 6 8
2009 Mefford Literature Review n/a n/a
82
completeness by a staff of over 700 database specialists. RefUSA has information
available on over 14 million businesses in the U.S.
Utilizing RefUSA lists of approximately 7,300 publicly-traded and 101,000
privately-traded companies in the U.S. were created. A complete description of data
available from the RefUSA database is listed in Appendix E; however, not all data are
complete for every company, especially those companies that are privately-held. The
information that was utilized for this study included: company name, CEO first and last
name, and mailing address.
A draft of the survey instrument (Appendix A) with a letter describing the
purpose for the pilot test was mailed May 17, 2010 to participants, along with a self-
addressed, stamped envelope for returning the survey. The purpose of the pilot study was
to test response rates on a mailed survey to a random selection of participants. A sample
of the letter to pilot study participants appears in Appendix B. A follow-up postcard was
mailed June 3, 2010, to encourage responses and to offer an electronic version of the
survey via e-mail (Appendix E). As of June 30, 2010, eight surveys were returned, a
disappointing response rate of 8%. Only two of the eight respondents estimated their time
spent in each role. This indicated the survey took too long to complete and led to changes
in the way these data were collected on the final survey. The final survey categorized the
31 roles into six role categories for purposes of approximating the amount of time spent
each week by the participants.
Responses from the pilot study included four CEOs from privately-held
companies, two from publicly-held companies, one from a private-public venture, and
one from a non-profit, home health care business. Seven of the respondents were male
83
and one did not respond to gender. Three CEOs ranged in age from 41–50 and four
ranged in age from 51-60. Three respondents had spent over 20 years in their current job
and over 20 years as CEO. Additionally, three participants were in their current job
between two and five years, two between six and ten years. One had been a CEO between
two and five years, three between six and ten years, and one between 11 and 20 years.
Four participants indicated they had Bachelor of Arts degrees, three had Bachelor of
Science degrees, and one had a PhD.
The company sizes were as follows: three between zero and 50 employees, one
between 51 and 100 employees, two between 101 and 500 employees, and one had over
500 employees. In terms of sales revenues, four companies were less than $10 million,
one was between $11 and $50 million, one was between $51 and $150 million, and one
was greater than $500 million. The industries were all different, including: wholesale
beverage, economic development, internet security, CPG (no further description was
provided), home health care, retail, insurance, and granite memorial manufacturer.
It is difficult to draw any conclusions from a sample size of eight however there
were some interesting findings in the eight responses. The role category with the most
variance in response was the operational category. Of the six operational roles, four roles
resulted in conflicting responses. See Table 5 for these results. Howe (1988) suggested
that operational roles would be more prevalent in smaller companies. Of the four neutral
responses to the analyzer role, two were from small companies in terms of employees and
sales revenues, conflicting with Howe‘s (1988) results. Of the three disagree responses to
the operator role one was from a small company in terms of employees and sales
revenues. Of the two neutral responses to the technical expert role, one was from a small
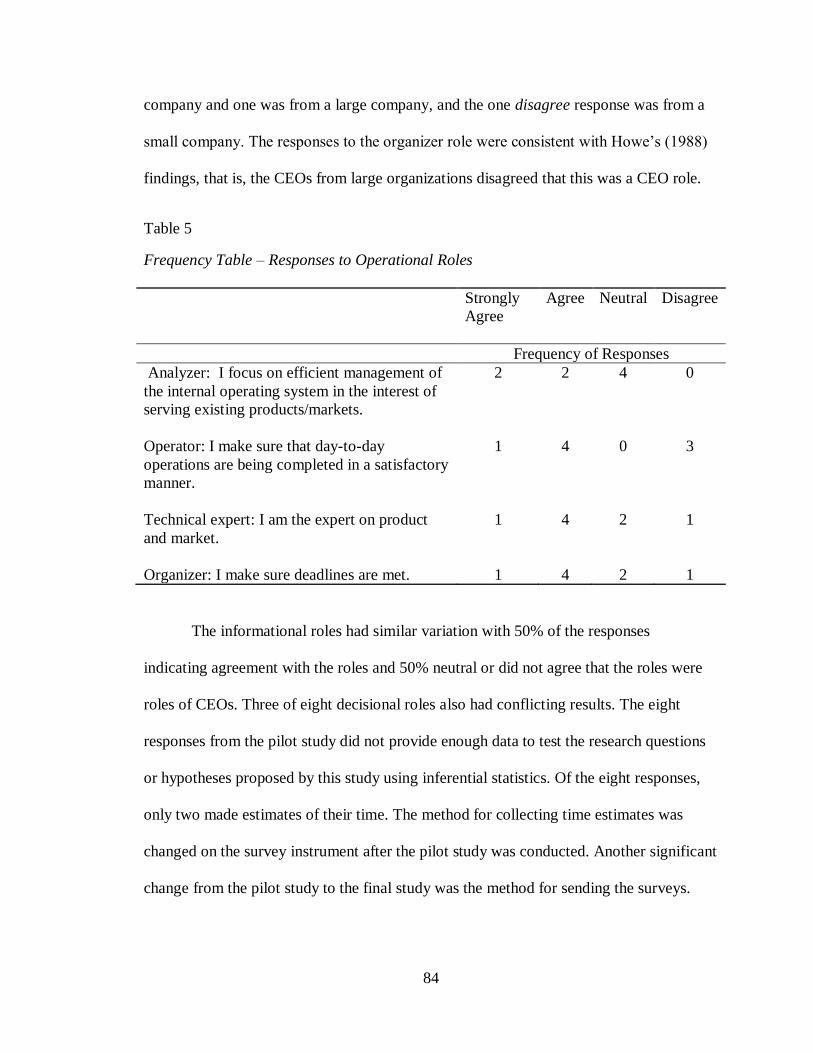
84
company and one was from a large company, and the one disagree response was from a
small company. The responses to the organizer role were consistent with Howe‘s (1988)
findings, that is, the CEOs from large organizations disagreed that this was a CEO role.
Table 5
Frequency Table – Responses to Operational Roles
Strongly
Agree
Agree
Neutral
Disagree
Frequency of Responses
Analyzer: I focus on efficient management of
the internal operating system in the interest of
serving existing products/markets.
2 2
4 0
Operator: I make sure that day-to-day
operations are being completed in a satisfactory
manner.
1
4
0
3
Technical expert: I am the expert on product
and market.
1 4 2 1
Organizer: I make sure deadlines are met. 1 4 2 1
The informational roles had similar variation with 50% of the responses
indicating agreement with the roles and 50% neutral or did not agree that the roles were
roles of CEOs. Three of eight decisional roles also had conflicting results. The eight
responses from the pilot study did not provide enough data to test the research questions
or hypotheses proposed by this study using inferential statistics. Of the eight responses,
only two made estimates of their time. The method for collecting time estimates was
changed on the survey instrument after the pilot study was conducted. Another significant
change from the pilot study to the final study was the method for sending the surveys.
85
Rather than mailing the surveys, the surveys were sent via e-mail so that a much larger
population could be reached at a much lower cost.
Instrumentation
The purpose of using a survey is to enable the researcher to make generalizations
about a population by surveying a sample of that population (Fink, 2006). A search for
instruments to survey CEOs about their perspectives on the role of CEO was not
successful and resulted in the development of a survey for this study‘s purpose. The self-
administered survey includes a list of role descriptions created by utilizing a review of the
literature. The list of roles appears in Table 6 and a list of role categories appears in Table
7.
Measurement Validity and Reliability
Measurement validity establishes evidence for using a particular instrument in a
―particular setting with a particular population for a specific purpose‖ (Gliner et al., 2009,
p. 165). Validity is based on the scores obtained from the instrument. There are three
types of evidence supporting measurement validity of an instrument: content validity,
criterion-related validity, and construct validity (Gall et al., 2005; Gliner et al., 2009).
Measurement validity is more difficult to obtain than measurement reliability. Both
reliability and consistency are necessary for measurement validity (Gliner et al., 2009).
Content evidence can be provided by using an instrument that has already been used or
by having experts review an instrument to verify its‘ content represents what the
instrument is trying to measure. This instrument has not been used previously; however,
these roles emerged from research over the past 40 years and, therefore, it is believed
there is some level of content evidence for the roles on the survey. The use of expert
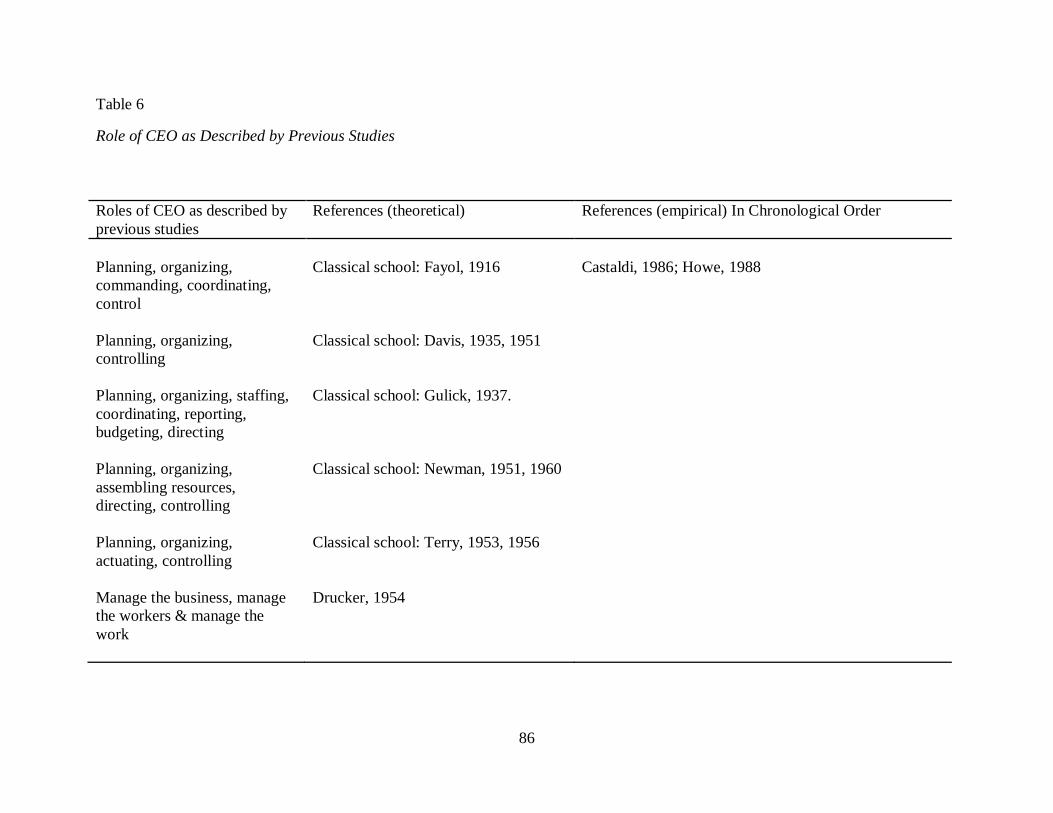
86
Table 6
Role of CEO as Described by Previous Studies
Roles of CEO as described by
previous studies
References (theoretical) References (empirical) In Chronological Order
Planning, organizing,
commanding, coordinating,
control
Classical school: Fayol, 1916
Castaldi, 1986; Howe, 1988
Planning, organizing,
controlling
Classical school: Davis, 1935, 1951
Planning, organizing, staffing,
coordinating, reporting,
budgeting, directing
Classical school: Gulick, 1937.
Planning, organizing,
assembling resources,
directing, controlling
Classical school: Newman, 1951, 1960
Planning, organizing,
actuating, controlling
Classical school: Terry, 1953, 1956
Manage the business, manage
the workers & manage the
work
Drucker, 1954
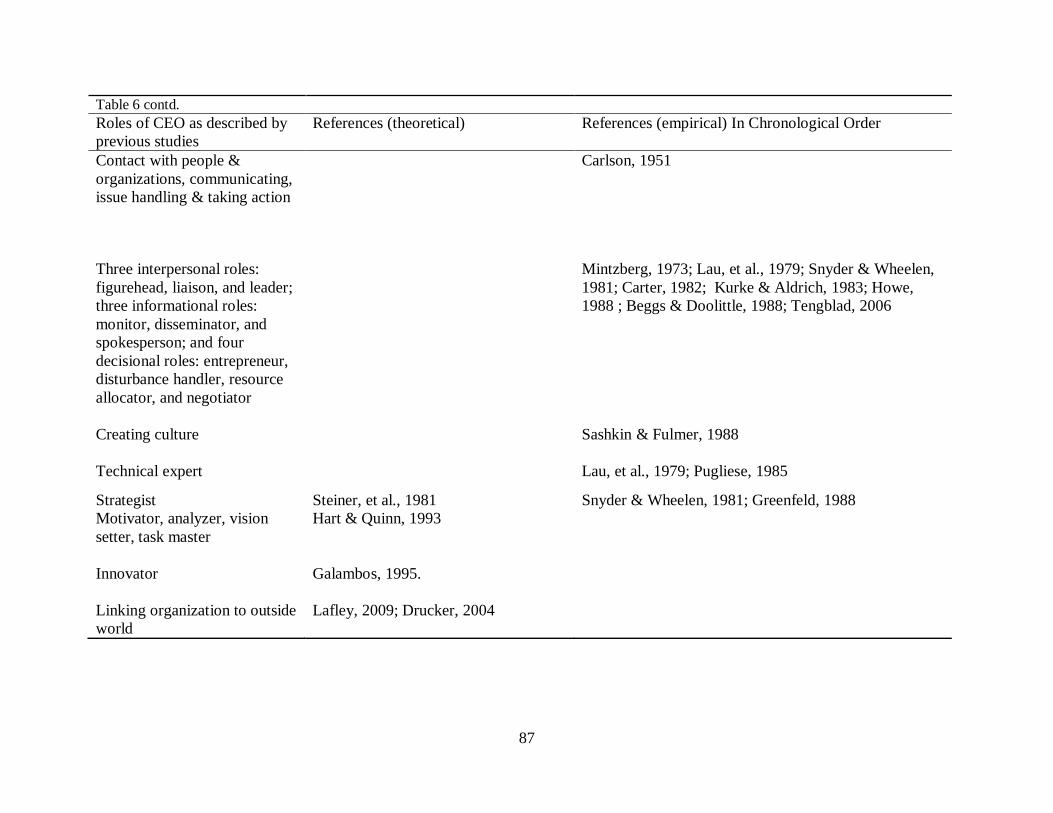
87
Table 6 contd.
Roles of CEO as described by
previous studies
References (theoretical) References (empirical) In Chronological Order
Contact with people &
organizations, communicating,
issue handling & taking action
Carlson, 1951
Three interpersonal roles:
figurehead, liaison, and leader;
three informational roles:
monitor, disseminator, and
spokesperson; and four
decisional roles: entrepreneur,
disturbance handler, resource
allocator, and negotiator
Mintzberg, 1973; Lau, et al., 1979; Snyder & Wheelen,
1981; Carter, 1982; Kurke & Aldrich, 1983; Howe,
1988 ; Beggs & Doolittle, 1988; Tengblad, 2006
Creating culture
Technical expert
Sashkin & Fulmer, 1988
Lau, et al., 1979; Pugliese, 1985
Strategist Steiner, et al., 1981 Snyder & Wheelen, 1981; Greenfeld, 1988
Motivator, analyzer, vision
setter, task master
Hart & Quinn, 1993
Innovator
Galambos, 1995.
Linking organization to outside
world
Lafley, 2009; Drucker, 2004
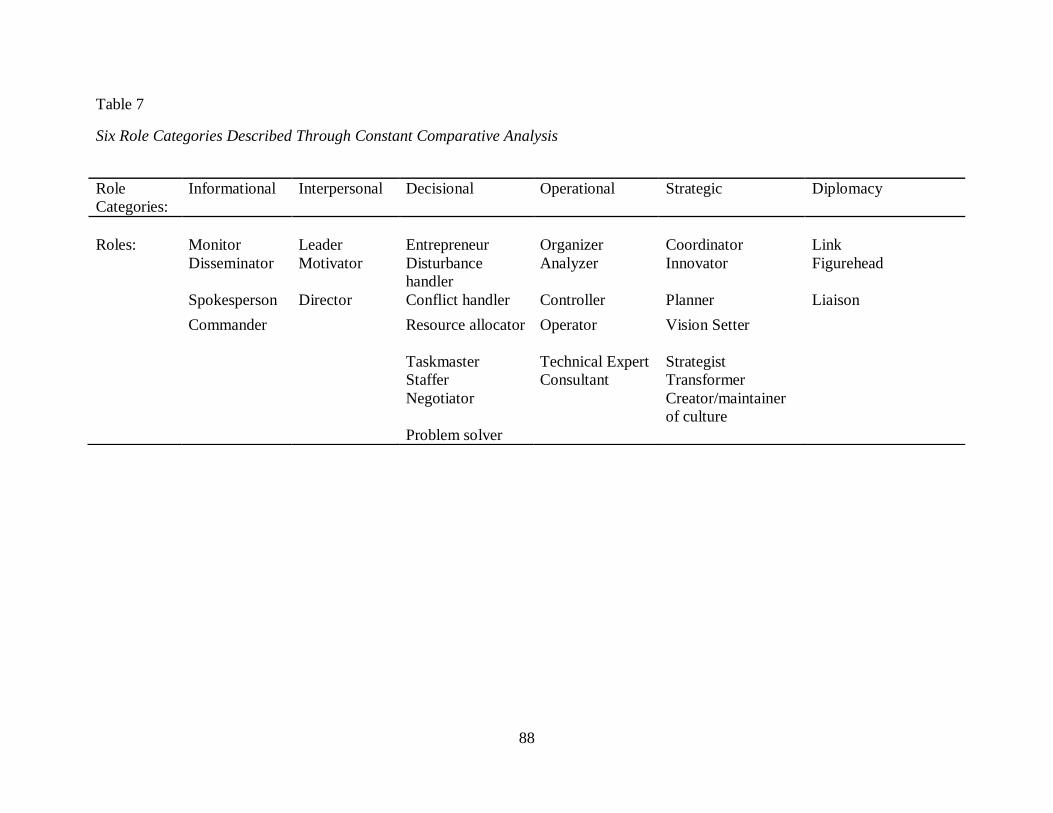
88
Table 7
Six Role Categories Described Through Constant Comparative Analysis
Role
Categories:
Informational Interpersonal Decisional Operational Strategic Diplomacy
Roles: Monitor Leader Entrepreneur Organizer Coordinator Link
Disseminator Motivator Disturbance
handler
Analyzer Innovator Figurehead
Spokesperson Director Conflict handler Controller Planner Liaison
Commander Resource allocator
Operator
Vision Setter
Taskmaster Technical Expert Strategist
Staffer Consultant Transformer
Negotiator Creator/maintainer
of culture
Problem solver
89
CEOs to review the instrument also provides content validity. The process of content
analysis was used to induce the six categories of roles by analyzing the descriptions of
the roles and grouping the descriptions that were most similar into the categories
described in the literature.
Construct validity evidence can be provided by response processes in which
participants do not answer with responses they believe to be socially desirable. It can also
be provided with evidence based on internal structure, which is tested via factor analysis.
For purposes of this study Cronbach‘s alpha was used to assess internal consistency
reliability of the roles within the major categories: informational, interpersonal,
decisional, operational, strategic, and diplomacy. Specifically, factor analysis and
Cronbach‘s coefficient alpha are used for testing internal consistency reliability by
measuring consistency in a multiple-item scale when enough responses are received
(Leech, Barrett, & Morgan, 2005). Cronbach‘s alpha is usually used ―when the researcher
has several Likert-type items (ratings from strongly disagree to strongly agree) that are
summed or averaged to make a composite score or summated scale‖ (Gliner et al., 2009).
This instrument was tested using factor analysis. Factor analysis helps determine
which items result in consistent responses from survey participants. Consistency in
responses suggests certain items are measuring the same construct and fit the categories
(Gall et al., 2005). The alpha is then based on the average correlation of each item with
every other item and is used because it provides a measure of reliability based on one
administration of a questionnaire or survey (Gliner et al., 2009). In this respect the use of
alpha could significantly reduce the number of items on the survey for future use by
removal of an item one at a time to examine the change in alpha.
90
Data Collection
Data were downloaded from Qualtrics directly into SPSS for statistical analysis,
eliminating the potential for human error from data input. All surveys with responses to
the 31 roles were considered complete. Ideally, respondents allocated their time to each
role category on a weekly basis. If this portion of the survey was skipped but the 31 role
questions and demographic data were complete, the survey was still used. The five-point
Likert scale items of strongly agree (one) to strongly disagree (five) were assigned
numerical values of one to five. The number of hours spent in each role category was
recorded as the actual number of hours indicated on the survey by the CEOs. A blank
response was not recorded with any numerical value. Demographic information was
coded using numerical values between one and five, depending on the number of levels
the variables contained. Qualitative data in the form of text were also gathered, however,
these data were not analyzed for this study due to IRB restrictions. These restrictions
included obtaining written permission from each CEO to use e-mails and other non-
solicited comments.
Upon completion of data collection exploratory data analysis was conducted to
review the responses for completeness and skewness, to look for outliers, to understand
the descriptive nature of the data, and to clean the data (Gliner et al., 2009; Leong &
Austin, 2006).
Research Questions and Data Analysis
To answer the first two research questions, ―what is the role of CEO in the U.S.?‖
and ―how much time do CEOs estimate they spend in each role category?‖ descriptive
statistics were used to identify the roles most strongly agreed with by the participants and
91
the average amount of time spent in each role category, when available. The third
question, ―what roles are identified by CEOs that were not identified by a review of
literature on the role of CEO‖ was answered using qualitative data provided by the study
participants.
RH1 was tested using an independent samples t-test on the 31 role descriptions
and Mann-Whitney U for the role categories due to the skewness of these data. The
appropriate statistic for evaluating two levels of the independent variable (gender) with a
normal or scale dependent variable, when assumptions are not markedly violated is the
independent samples t-test. The independent t-test provides the statistical significance of
the difference in gender on the independent variable. Effect size was also calculated. If
the assumptions are markedly violated the appropriate statistic is Mann-Whitney U
(Morgan, Leech, Gloeckner, & Barrett, 2011).
RH1a and RH1b were tested with descriptive statistics by comparing the time
approximations in the interpersonal and operational role categories between males and
females.
RH2 was tested using descriptive statistics.
RH3 was tested using a one-way ANOVA and Kruskal-Wallis, which was
appropriate for testing time spent in role categories as this data were skewed.
RH4 was tested using Mann Whitney-U due to the skewness of the data.
RH5 was tested using multiple regression. The statistic used to compare several
independent variables with the purpose of predicting a dependent, criterion variable is
multiple linear regression (Morgan et al., 2011). While none of the demographic
independent variables can be considered causal for the role of CEO, they may impact the
92
roles that CEOs identify and spend the majority of their time in. It may also be useful to
make comparisons to prior studies using more current data. These statistics help in
understanding the associations of multiple independent variables with the independent
variables (Morgan et al., 2011). The dependent variables considered were the agreement
with the CEO roles and the amount of time allocated to the role categories.
RH6 was tested using an independent sample t-test for the agreement with roles
and Mann-Whitney U for the approximations to role categories.
RH7 was tested using an independent sample t-test for the agreement with roles
and Mann-Whitney U for the approximations to role categories.
RH8 was tested using a one-way ANOVA, Kruskal-Wallis, and Mann-Whitney
U.
Limitations and Weaknesses
This study was delimited to CEOs in the U.S., the result of which the following
limitation is likely to ensue: the study cannot be considered applicable to middle or
lower-level managers or to CEOs in other countries.
This study was limited by the response rate ultimately achieved, impacting the
ability to generalize the results to the total population of CEOs in the U.S., or external
validity. The confidential nature of the survey is a limitation in that who chose to
complete the survey is unknown. The honesty in the time estimations are unknown and
the difference between the time allocations made on the survey and the actual effort
expended in the roles is also unknown. This study utilized a survey instrument designed
specifically for the study and therefore validity and reliability of the instrument may be
interpreted as weaknesses of the research.
93
Summary
This chapter has outlined the methodology and underlying philosophy for
conducting the research study on the role of CEO. It has described the methods used for
sampling and collecting data and has highlighted the limitations and weaknesses in the
study. The following chapter will present the sample and the results of the survey.
94
CHAPTER FOUR: RESULTS
This chapter presents the results of the survey conducted to answer the research
questions and to test the research hypotheses. This chapter describes the sample, explains
the exploratory factor analysis conducted on the survey instrument, and presents the
statistical results in the order the research questions and hypotheses were presented in
Chapter Three.
Description of Sample
The sample for this study was obtained through professional relationships and two
databases of U.S. companies containing CEO e-mail addresses. The accessible population
comprised 28,018 possible study participants however 2 e-mails were returned due to
invalid e-mail addresses. After receiving IRB approval (Appendix F), CEOs were e-
mailed a link to the survey (Appendix G) along with the appropriate IRB consent
information (Appendix H). A total of 1,768 surveys were started, 1,237 were completed,
and 1,202 were considered usable, for a total response rate of 4.29%. Table 8 is a
summary of the response rates.
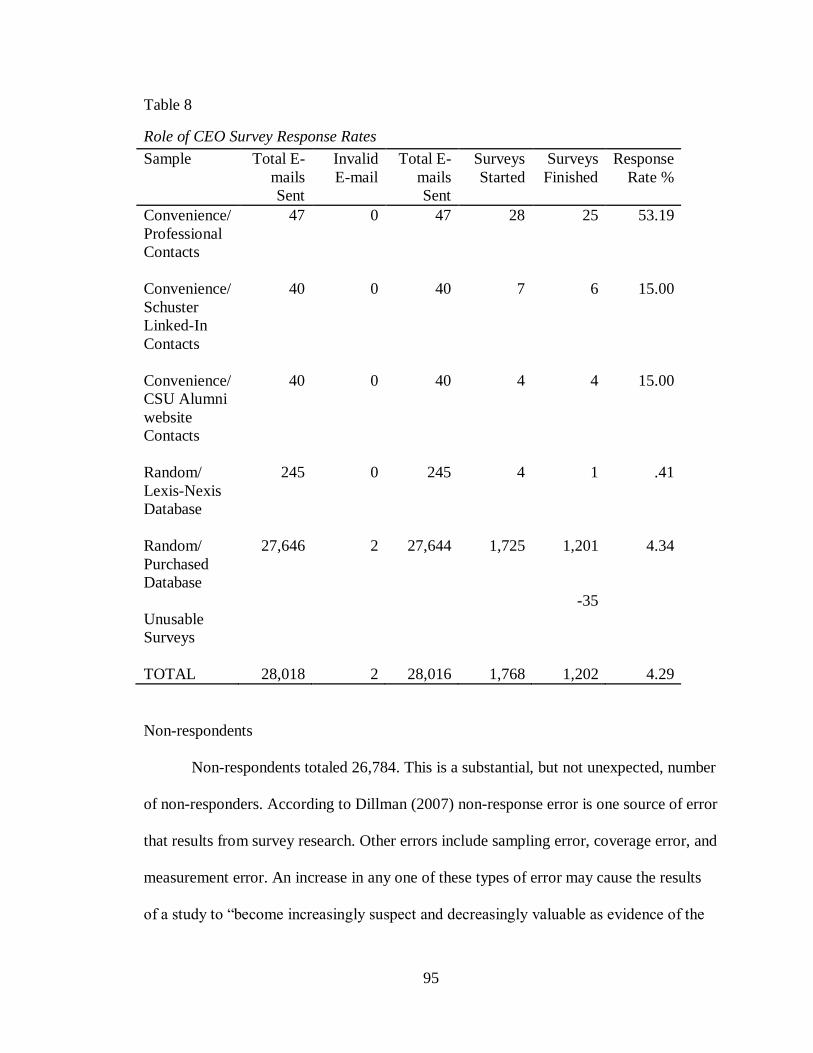
95
Table 8
Role of CEO Survey Response Rates
Sample Total E-
mails
Sent
Invalid
Total E-
mails
Sent
Surveys
Started
Surveys
Finished
Response
Rate %
Convenience/
Professional
Contacts
47 0 47 28 25 53.19
Convenience/
Schuster
Linked-In
Contacts
40 0 40 7 6 15.00
Convenience/
CSU Alumni
website
Contacts
40 0 40 4 4 15.00
Random/
Lexis-Nexis
Database
245 0 245 4 1 .41
Random/
Purchased
Database
27,646 2 27,644 1,725 1,201 4.34
Unusable
Surveys
-35
TOTAL 28,018 2 28,016 1,768 1,202 4.29
Non-respondents
Non-respondents totaled 26,784. This is a substantial, but not unexpected, number
of non-responders. According to Dillman (2007) non-response error is one source of error
that results from survey research. Other errors include sampling error, coverage error, and
measurement error. An increase in any one of these types of error may cause the results
of a study to ―become increasingly suspect and decreasingly valuable as evidence of the
96
characteristics in other audiences‖ (Dooley & Lindner, 2003, p. 100). There are several
recommended solutions for controlling for nonresponse error after follow-up procedures
have been used. These include ―ignore nonrespondents; compare respondents to
population on characteristics known before the study; compare respondents to
nonrespondents on characteristics known before the study; compare early to late
respondents; and ‗double-dip,‘ or sample, nonrespondents‖ (Dooley & Lindner, 2003, p.
102).
Lindner, Murphy, and Briers (2001) have suggested comparing the last wave of
30 respondents to early respondents as one defensible and ―generally accepted
procedure(s) for handling nonresponse error as a threat to external validity of research
findings‖ (Dooley & Lindner, 2003, p. 103). In an independent sample t-test of the first
30 and last 30 responses received there were no statistically significant differences on
agreement with role categories or time spent in the role categories between the two
groups sampled.
Demographics
The sample is comprised of 1,048 males (87.5%) and 150 females (12.5%). The
S&P Fortune 500 (2008) contained approximately 13.5% female CEOs, making this
sample seem fairly representative in terms of gender. The majority of respondents range
in age from 45 to 64, with 21.3% between 50 and 54, 20.9% between 55 and 59, and
18.7% between 60 and 64. The age distribution was also similar to the age distribution of
CEOs in S&P Fortune 500 companies. Average tenure in current job is 12.4 years and the
average tenure as a CEO is 11.6 years. Current turnover rates of CEOs suggest this
sample of CEOs has longer tenure on average. Average company size was 962 employees
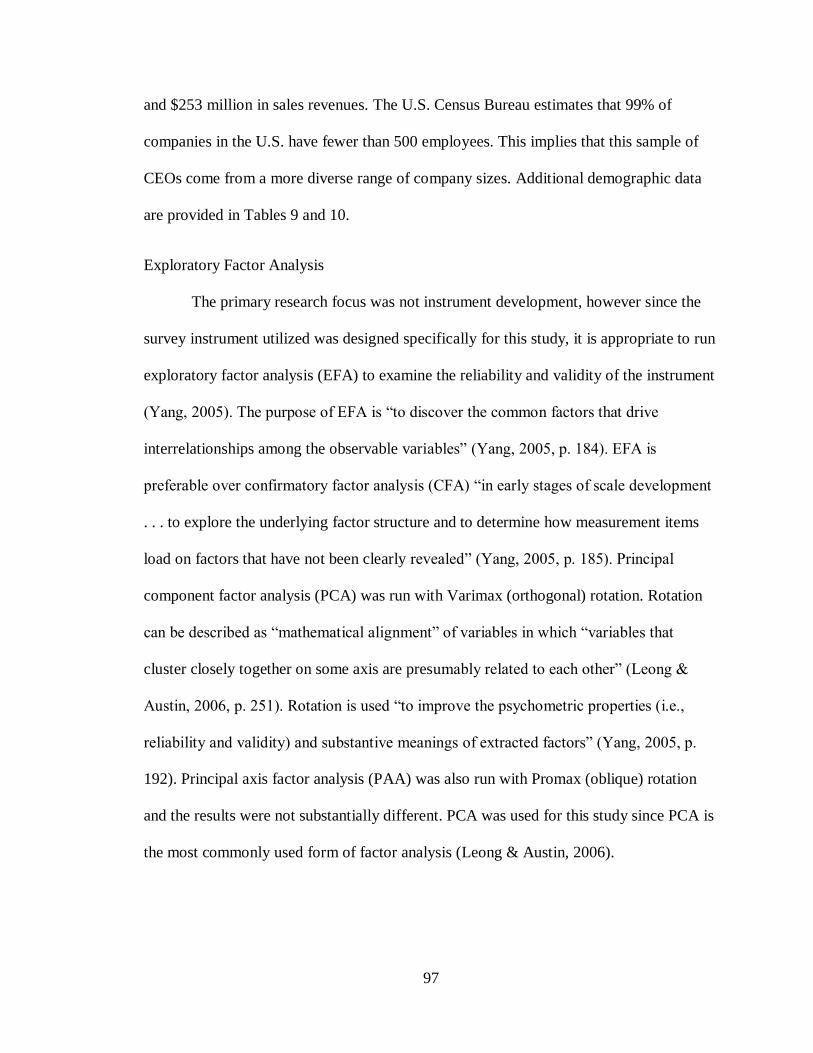
97
and $253 million in sales revenues. The U.S. Census Bureau estimates that 99% of
companies in the U.S. have fewer than 500 employees. This implies that this sample of
CEOs come from a more diverse range of company sizes. Additional demographic data
are provided in Tables 9 and 10.
Exploratory Factor Analysis
The primary research focus was not instrument development, however since the
survey instrument utilized was designed specifically for this study, it is appropriate to run
exploratory factor analysis (EFA) to examine the reliability and validity of the instrument
(Yang, 2005). The purpose of EFA is ―to discover the common factors that drive
interrelationships among the observable variables‖ (Yang, 2005, p. 184). EFA is
preferable over confirmatory factor analysis (CFA) ―in early stages of scale development
. . . to explore the underlying factor structure and to determine how measurement items
load on factors that have not been clearly revealed‖ (Yang, 2005, p. 185). Principal
component factor analysis (PCA) was run with Varimax (orthogonal) rotation. Rotation
can be described as ―mathematical alignment‖ of variables in which ―variables that
cluster closely together on some axis are presumably related to each other‖ (Leong &
Austin, 2006, p. 251). Rotation is used ―to improve the psychometric properties (i.e.,
reliability and validity) and substantive meanings of extracted factors‖ (Yang, 2005, p.
192). Principal axis factor analysis (PAA) was also run with Promax (oblique) rotation
and the results were not substantially different. PCA was used for this study since PCA is
the most commonly used form of factor analysis (Leong & Austin, 2006).
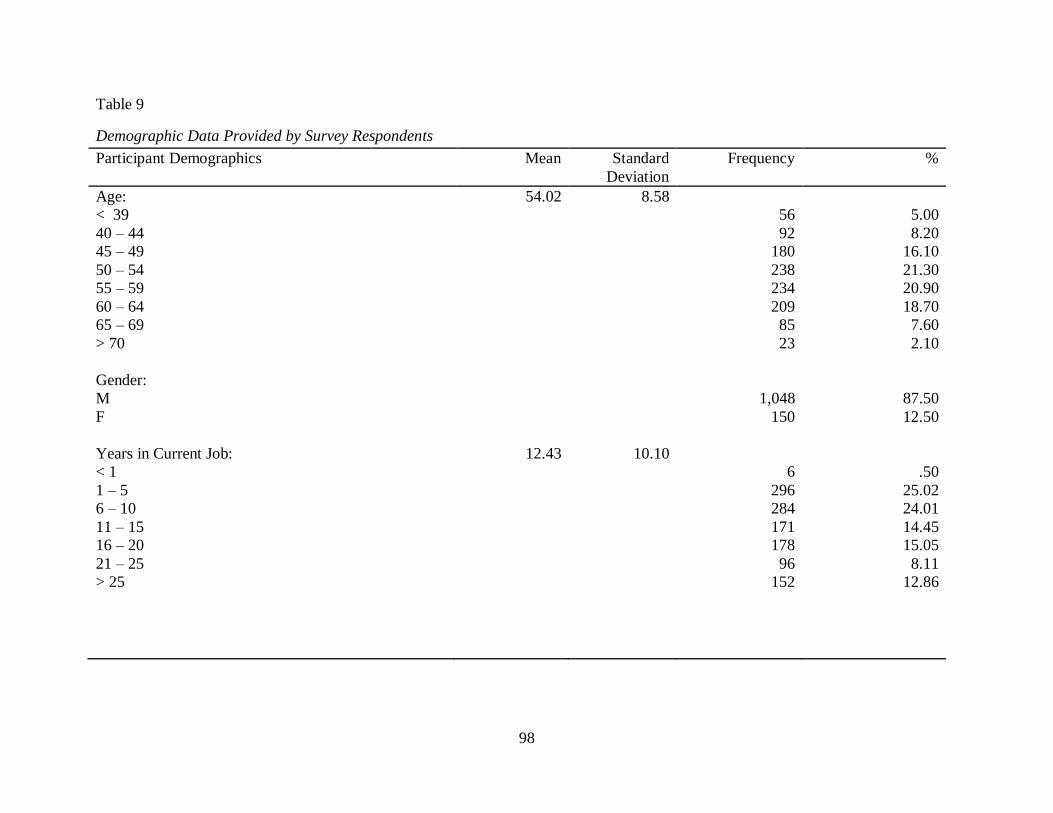
98
Table 9
Demographic Data Provided by Survey Respondents
Participant Demographics Mean Standard
Deviation
Frequency %
Age: 54.02 8.58
< 39 56 5.00
40 – 44 92 8.20
45 – 49 180 16.10
50 – 54 238 21.30
55 – 59 234 20.90
60 – 64 209 18.70
65 – 69 85 7.60
> 70 23 2.10
Gender:
M 1,048 87.50
F 150 12.50
Years in Current Job: 12.43 10.10
< 1 6 .50
1 – 5 296 25.02
6 – 10 284 24.01
11 – 15 171 14.45
16 – 20 178 15.05
21 – 25 96 8.11
> 25 152 12.86
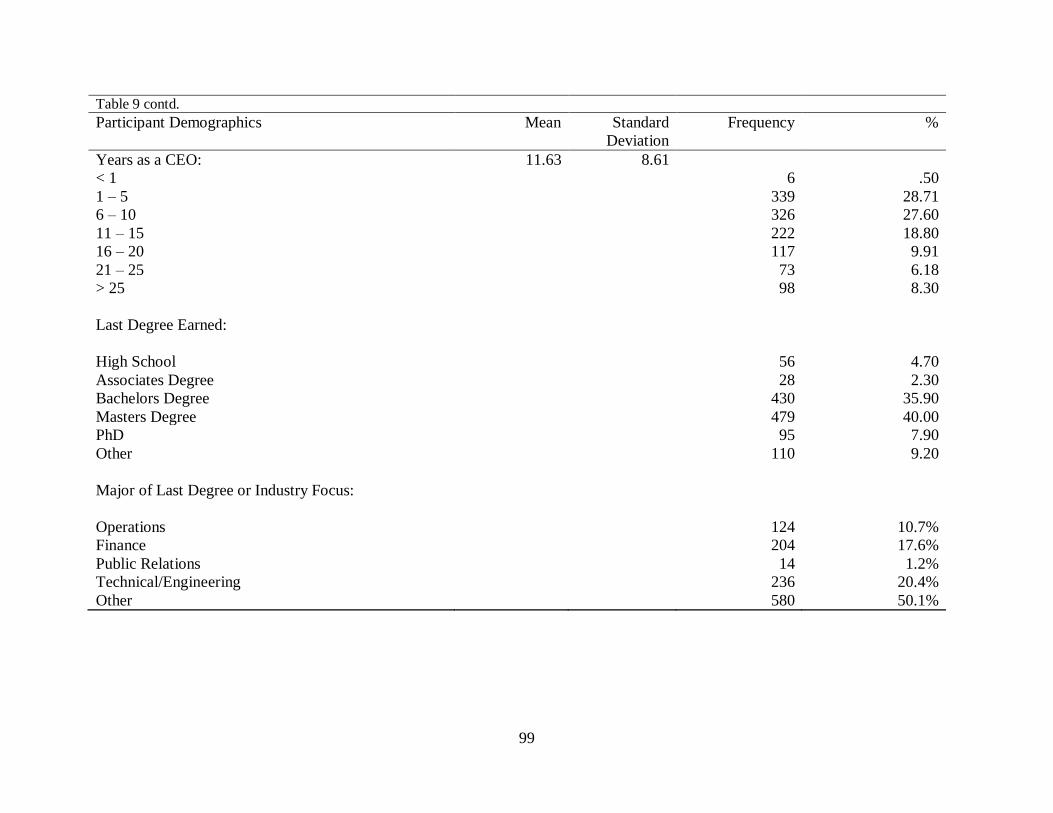
99
Table 9 contd.
Participant Demographics Mean Standard
Deviation
Frequency %
Years as a CEO: 11.63 8.61
< 1 6 .50
1 – 5 339 28.71
6 – 10 326 27.60
11 – 15 222 18.80
16 – 20 117 9.91
21 – 25 73 6.18
> 25 98 8.30
Last Degree Earned:
High School 56 4.70
Associates Degree 28 2.30
Bachelors Degree 430 35.90
Masters Degree 479 40.00
PhD 95 7.90
Other 110 9.20
Major of Last Degree or Industry Focus:
Operations 124 10.7%
Finance 204 17.6%
Public Relations 14 1.2%
Technical/Engineering 236 20.4%
Other 580 50.1%
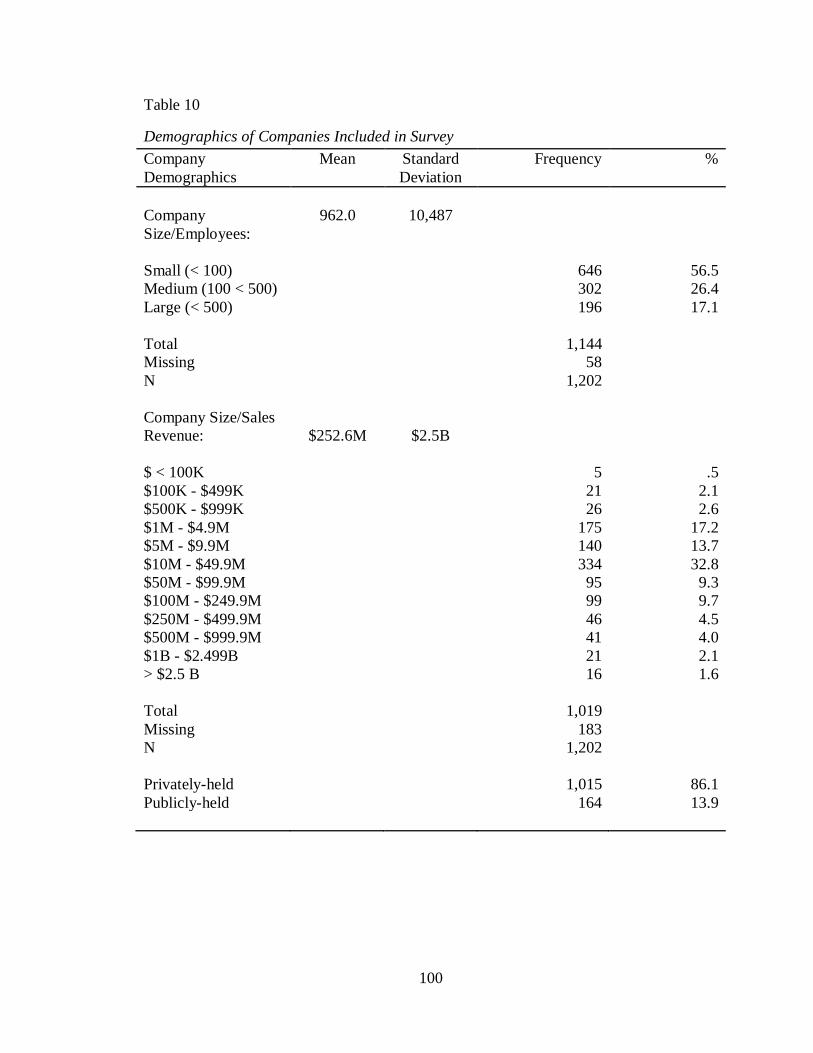
100
Table 10
Demographics of Companies Included in Survey
Company
Demographics
Mean Standard
Deviation
Frequency %
Company
Size/Employees:
962.0 10,487
Small (< 100) 646 56.5
Medium (100 < 500) 302 26.4
Large (< 500) 196 17.1
Total 1,144
Missing
N
58
1,202
Company Size/Sales
Revenue:
$252.6M
$2.5B
$ < 100K 5 .5
$100K - $499K 21 2.1
$500K - $999K 26 2.6
$1M - $4.9M 175 17.2
$5M - $9.9M 140 13.7
$10M - $49.9M 334 32.8
$50M - $99.9M 95 9.3
$100M - $249.9M 99 9.7
$250M - $499.9M 46 4.5
$500M - $999.9M 41 4.0
$1B - $2.499B 21 2.1
> $2.5 B 16 1.6
Total 1,019
Missing
N
183
1,202
Privately-held 1,015 86.1
Publicly-held 164 13.9
101
The sample size was adequate for factor analysis. Leong and Austin (2006)
recommend giving a survey to at least five times as many people as there are questions on
the survey. The KMO (Kaiser-Meyer-Olkin) measure of sampling adequacy should be
evaluated prior to running factor analysis. This statistic ―reflects the degree to which it is
likely that the common factors explain the observed correlations among the variables‖
(Leong & Austin, 2006, p. 250). A small value (less than .50) of the KMO statistic
indicates correlations between variables are not accounted for by common factors. A
score of .80 is described as ―meritorious‖ (Leong & Austin, 2006, p. 250) and the score
for this survey was .892.
Principal component analysis revealed seven components comprising 52.4% of
the total variance explained (Table 11). Using a loading of .40, appropriate for a new
survey (Yang, 2005) the 31 items sorted into seven components with 27 items retained.
Three of the roles, entrepreneur, conflict handler, and consultant did not load. The fourth
excluded role, commander, did not fit logically with the diplomacy roles and the decision
was made to exclude the role.
Three role categories did not change as a result of PCA. The interpersonal
(component #5), strategic (component #2), and diplomacy (component #4) role categories
remained intact. The decisional (component #6) role category decreased from eight to
four roles. Previously considered decisional roles, entrepreneur and conflict handler did
not load, and problem solver and negotiator loaded with spokesperson and technical
expert to create the new informational (component #3) role category. The operational
(component #1) role category decreased from six to four roles, the consultant role did not
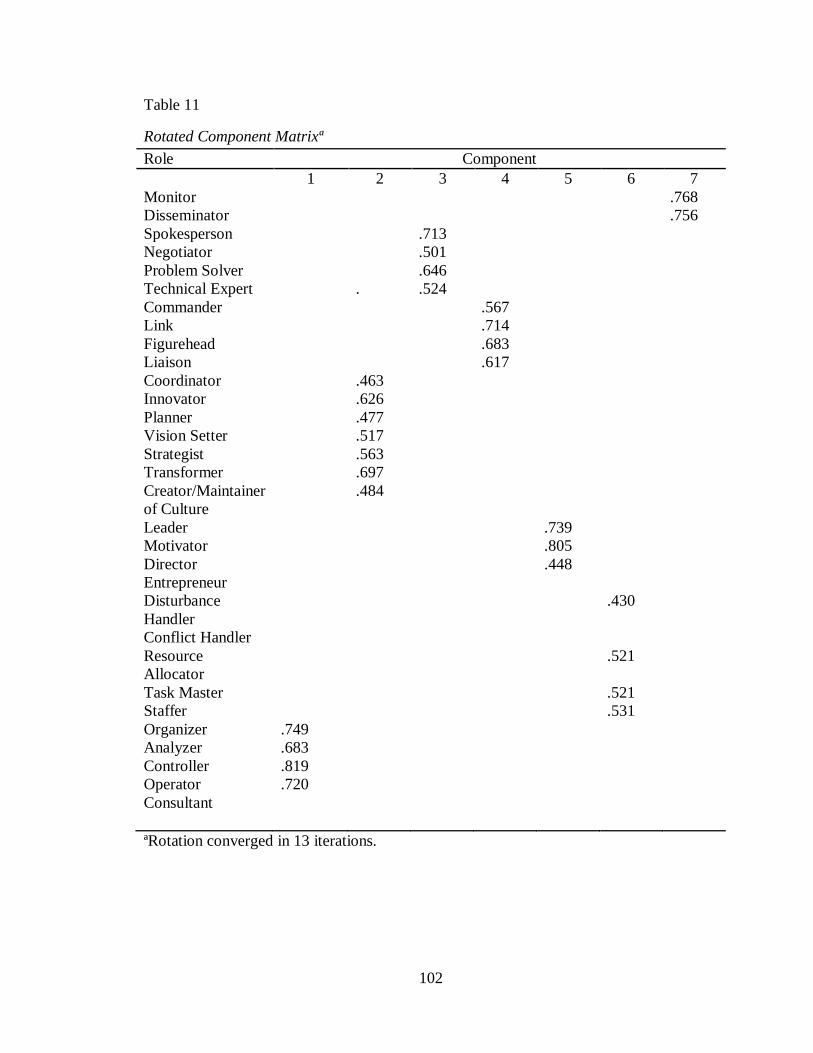
102
Table 11
Rotated Component Matrixª
Role Component
1 2 3 4 5 6 7
Monitor .768
Disseminator .756
Spokesperson .713
Negotiator .501
Problem Solver .646
Technical Expert . .524
Commander .567
Link .714
Figurehead .683
Liaison .617
Coordinator .463
Innovator .626
Planner .477
Vision Setter .517
Strategist .563
Transformer .697
Creator/Maintainer
of Culture
.484
Leader .739
Motivator .805
Director .448
Entrepreneur
Disturbance
Handler
.430
Conflict Handler
Resource
Allocator
.521
Task Master .521
Staffer .531
Organizer .749
Analyzer .683
Controller .819
Operator .720
Consultant
ªRotation converged in 13 iterations.
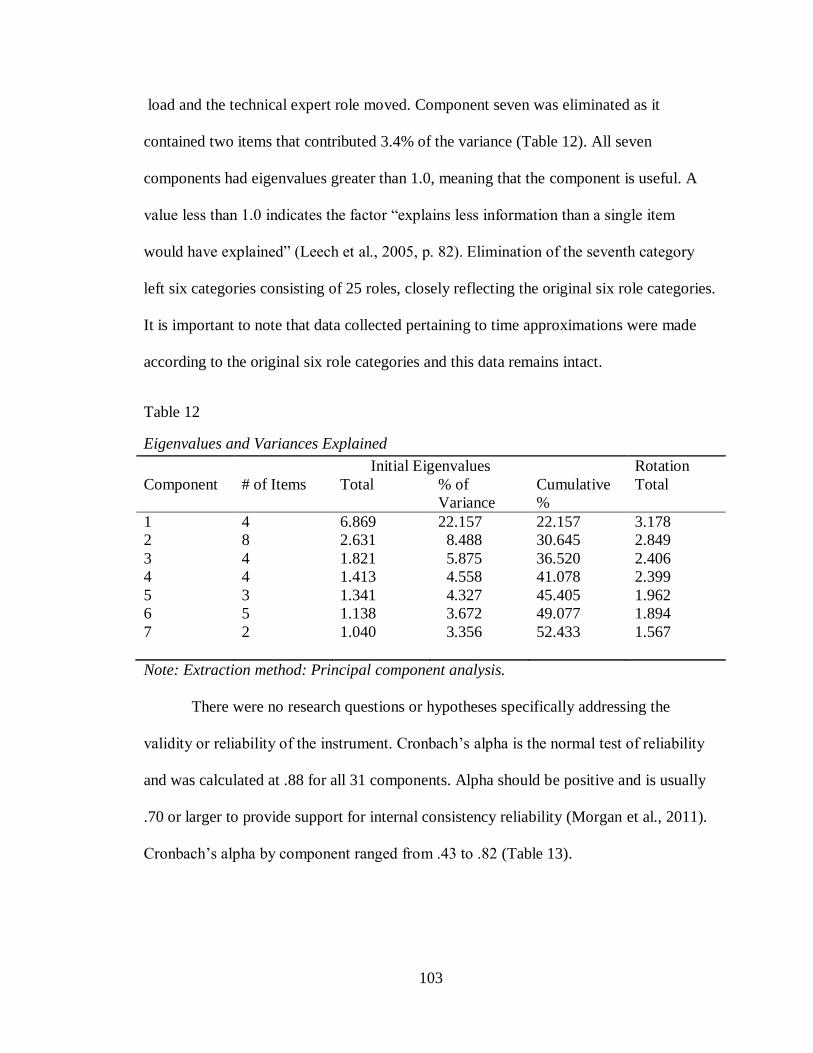
103
load and the technical expert role moved. Component seven was eliminated as it
contained two items that contributed 3.4% of the variance (Table 12). All seven
components had eigenvalues greater than 1.0, meaning that the component is useful. A
value less than 1.0 indicates the factor ―explains less information than a single item
would have explained‖ (Leech et al., 2005, p. 82). Elimination of the seventh category
left six categories consisting of 25 roles, closely reflecting the original six role categories.
It is important to note that data collected pertaining to time approximations were made
according to the original six role categories and this data remains intact.
Table 12
Eigenvalues and Variances Explained
Initial Eigenvalues Rotation
Component # of Items Total % of
Variance
Cumulative
%
Total
1 4 6.869 22.157 22.157 3.178
2 8 2.631 8.488 30.645 2.849
3 4 1.821 5.875 36.520 2.406
4 4 1.413 4.558 41.078 2.399
5 3 1.341 4.327 45.405 1.962
6 5 1.138 3.672 49.077 1.894
7 2 1.040 3.356 52.433 1.567
Note: Extraction method: Principal component analysis.
There were no research questions or hypotheses specifically addressing the
validity or reliability of the instrument. Cronbach‘s alpha is the normal test of reliability
and was calculated at .88 for all 31 components. Alpha should be positive and is usually
.70 or larger to provide support for internal consistency reliability (Morgan et al., 2011).
Cronbach‘s alpha by component ranged from .43 to .82 (Table 13).
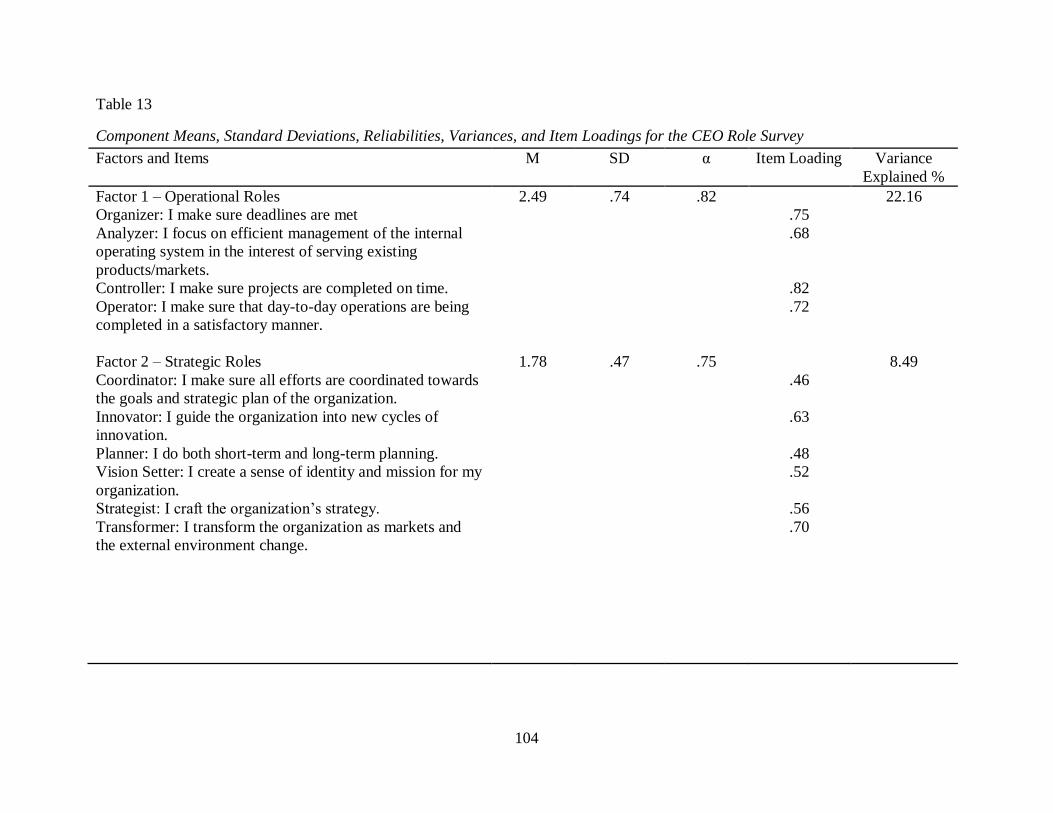
104
Table 13
Component Means, Standard Deviations, Reliabilities, Variances, and Item Loadings for the CEO Role Survey
Factors and Items M SD α Item Loading Variance
Explained %
Factor 1 – Operational Roles 2.49 .74 .82 22.16
Organizer: I make sure deadlines are met .75
Analyzer: I focus on efficient management of the internal
operating system in the interest of serving existing
products/markets.
.68
Controller: I make sure projects are completed on time. .82
Operator: I make sure that day-to-day operations are being
completed in a satisfactory manner.
.72
Factor 2 – Strategic Roles 1.78 .47 .75 8.49
Coordinator: I make sure all efforts are coordinated towards
the goals and strategic plan of the organization.
.46
Innovator: I guide the organization into new cycles of
innovation.
.63
Planner: I do both short-term and long-term planning. .48
Vision Setter: I create a sense of identity and mission for my
organization.
.52
Strategist: I craft the organization‘s strategy. .56
Transformer: I transform the organization as markets and
the external environment change.
.70
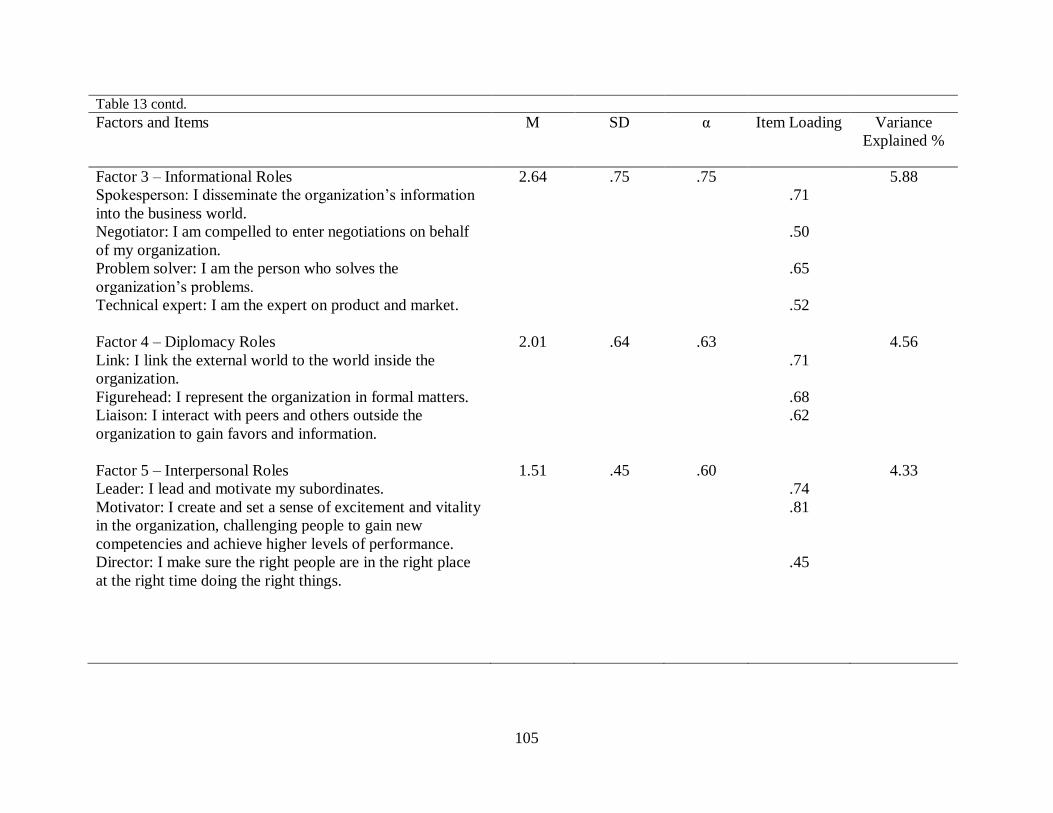
105
Table 13 contd.
Factors and Items M SD α Item Loading Variance
Explained %
Factor 3 – Informational Roles 2.64 .75 .75 5.88
Spokesperson: I disseminate the organization‘s information
into the business world.
.71
Negotiator: I am compelled to enter negotiations on behalf
of my organization.
.50
Problem solver: I am the person who solves the
organization‘s problems.
.65
Technical expert: I am the expert on product and market. .52
Factor 4 – Diplomacy Roles 2.01 .64 .63 4.56
Link: I link the external world to the world inside the
organization.
.71
Figurehead: I represent the organization in formal matters. .68
Liaison: I interact with peers and others outside the
organization to gain favors and information.
.62
Factor 5 – Interpersonal Roles 1.51 .45 .60 4.33
Leader: I lead and motivate my subordinates. .74
Motivator: I create and set a sense of excitement and vitality
in the organization, challenging people to gain new
competencies and achieve higher levels of performance.
.81
Director: I make sure the right people are in the right place
at the right time doing the right things.
.45
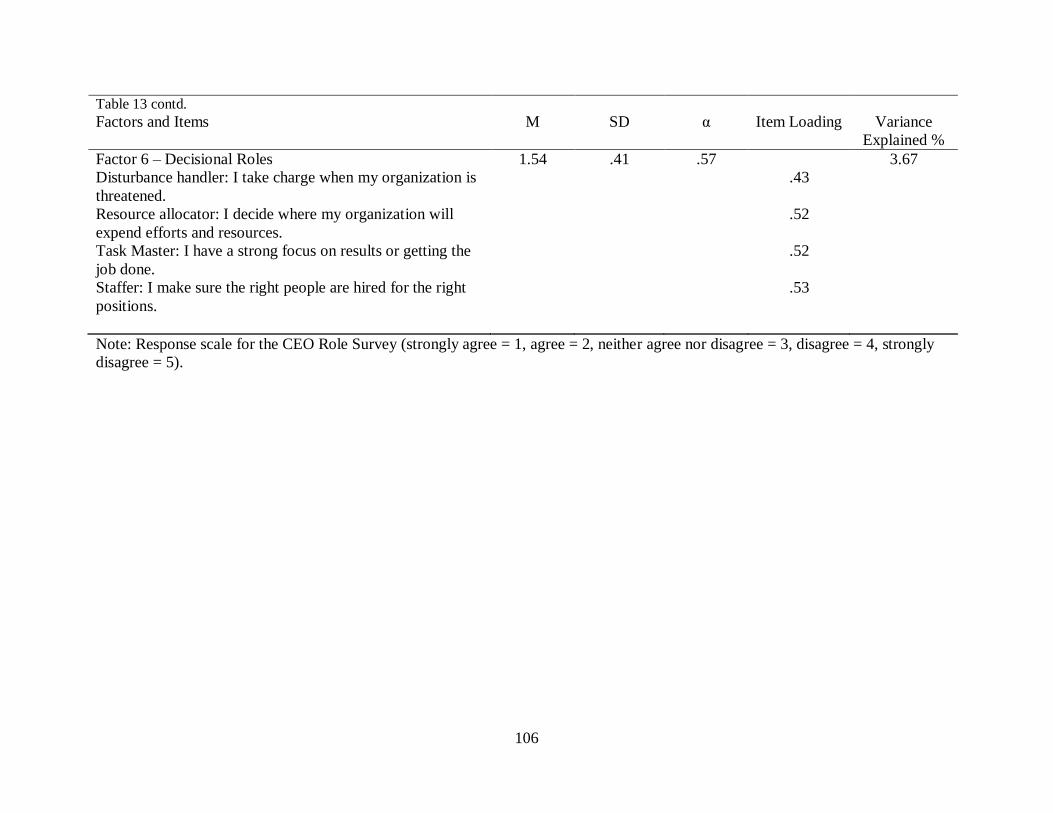
106
Table 13 contd.
Factors and Items M SD α Item Loading Variance
Explained %
Factor 6 – Decisional Roles 1.54 .41 .57 3.67
Disturbance handler: I take charge when my organization is
threatened.
.43
Resource allocator: I decide where my organization will
expend efforts and resources.
.52
Task Master: I have a strong focus on results or getting the
job done.
.52
Staffer: I make sure the right people are hired for the right
positions.
.53
Note: Response scale for the CEO Role Survey (strongly agree = 1, agree = 2, neither agree nor disagree = 3, disagree = 4, strongly
disagree = 5).
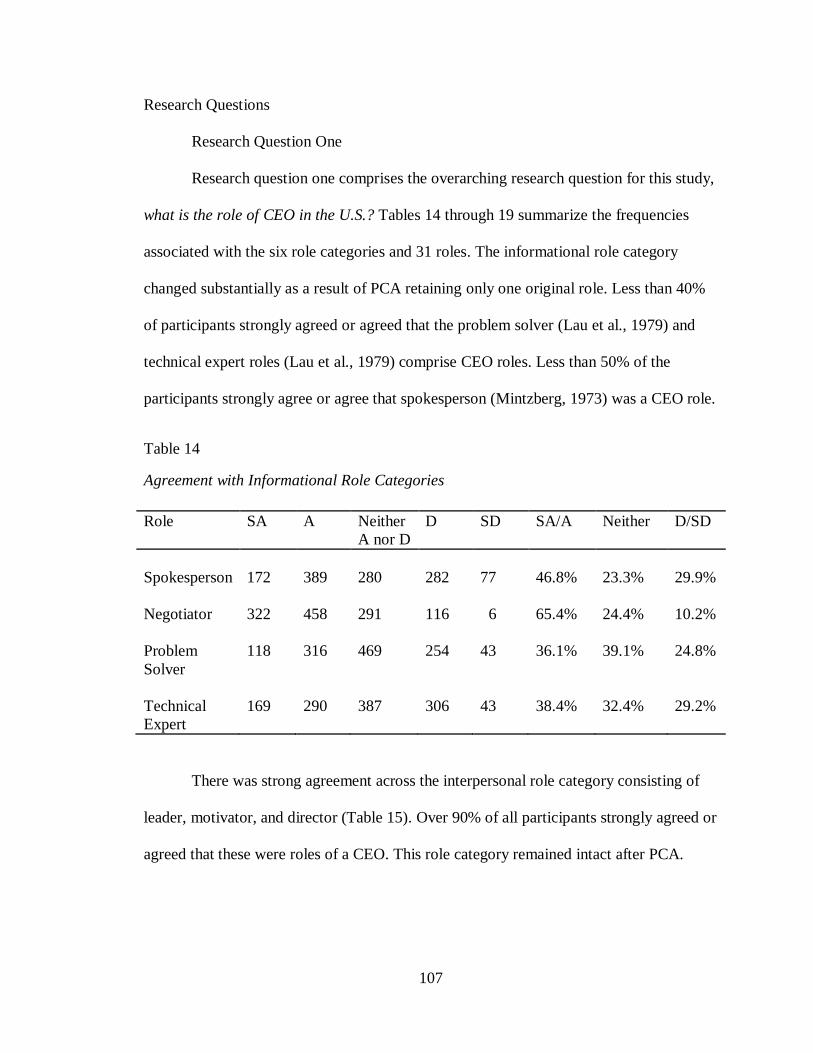
107
Research Questions
Research Question One
Research question one comprises the overarching research question for this study,
what is the role of CEO in the U.S.? Tables 14 through 19 summarize the frequencies
associated with the six role categories and 31 roles. The informational role category
changed substantially as a result of PCA retaining only one original role. Less than 40%
of participants strongly agreed or agreed that the problem solver (Lau et al., 1979) and
technical expert roles (Lau et al., 1979) comprise CEO roles. Less than 50% of the
participants strongly agree or agree that spokesperson (Mintzberg, 1973) was a CEO role.
Table 14
Agreement with Informational Role Categories
Role SA A Neither
A nor D
D SD SA/A Neither D/SD
Spokesperson
172
389
280
282
77
46.8%
23.3%
29.9%
Negotiator
322
458
291
116
6
65.4%
24.4%
10.2%
Problem
Solver
118 316 469 254 43 36.1% 39.1% 24.8%
Technical
Expert
169
290
387
306
43
38.4%
32.4%
29.2%
There was strong agreement across the interpersonal role category consisting of
leader, motivator, and director (Table 15). Over 90% of all participants strongly agreed or
agreed that these were roles of a CEO. This role category remained intact after PCA.
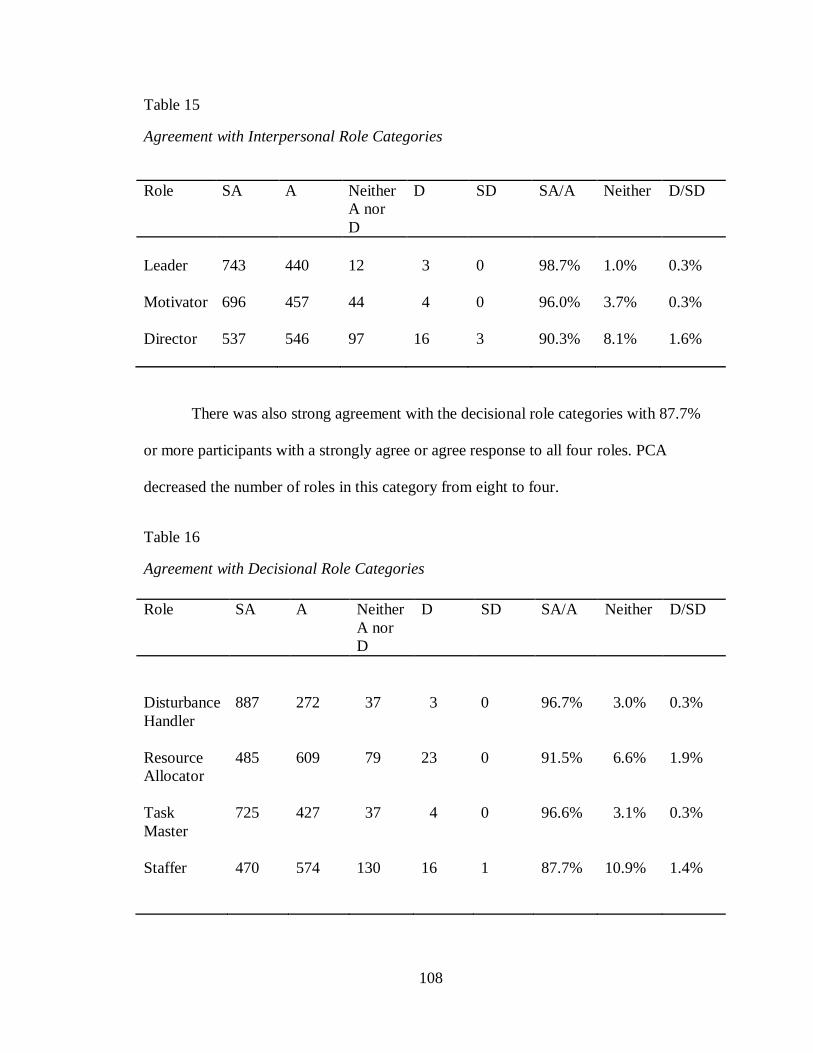
108
Table 15
Agreement with Interpersonal Role Categories
Role SA A Neither
A nor
D
D SD SA/A Neither D/SD
Leader 743 440 12 3 0 98.7% 1.0% 0.3%
Motivator
696
457
44
4
0
96.0%
3.7%
0.3%
Director
537
546
97
16
3
90.3%
8.1%
1.6%
There was also strong agreement with the decisional role categories with 87.7%
or more participants with a strongly agree or agree response to all four roles. PCA
decreased the number of roles in this category from eight to four.
Table 16
Agreement with Decisional Role Categories
Role SA A Neither
A nor
D
D SD SA/A Neither D/SD
Disturbance
Handler
887
272
37
3
0
96.7%
3.0%
0.3%
Resource
Allocator
485
609
79
23
0
91.5%
6.6%
1.9%
Task
Master
725
427
37
4
0
96.6%
3.1%
0.3%
Staffer
470
574
130
16
1
87.7%
10.9%
1.4%
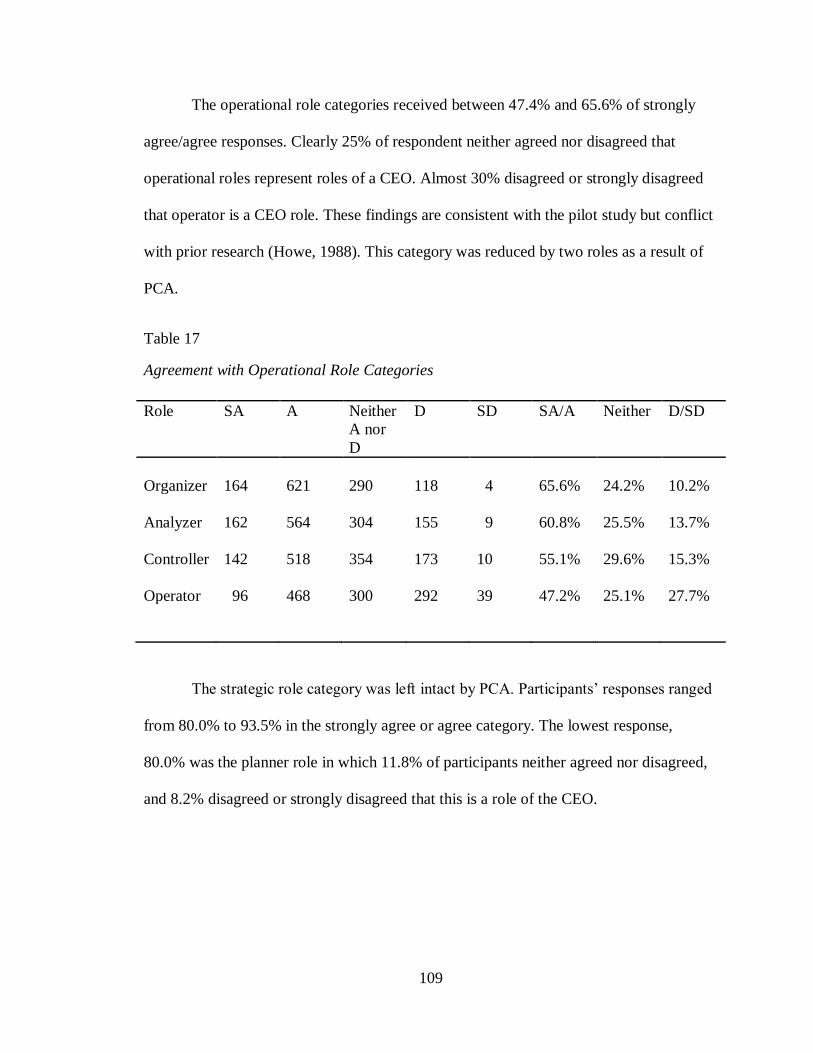
109
The operational role categories received between 47.4% and 65.6% of strongly
agree/agree responses. Clearly 25% of respondent neither agreed nor disagreed that
operational roles represent roles of a CEO. Almost 30% disagreed or strongly disagreed
that operator is a CEO role. These findings are consistent with the pilot study but conflict
with prior research (Howe, 1988). This category was reduced by two roles as a result of
PCA.
Table 17
Agreement with Operational Role Categories
Role SA A Neither
A nor
D
D SD SA/A Neither D/SD
Organizer 164 621 290 118 4 65.6% 24.2% 10.2%
Analyzer
162
564
304
155
9
60.8%
25.5%
13.7%
Controller
142
518
354
173
10
55.1%
29.6%
15.3%
Operator
96
468
300
292
39
47.2%
25.1%
27.7%
The strategic role category was left intact by PCA. Participants‘ responses ranged
from 80.0% to 93.5% in the strongly agree or agree category. The lowest response,
80.0% was the planner role in which 11.8% of participants neither agreed nor disagreed,
and 8.2% disagreed or strongly disagreed that this is a role of the CEO.
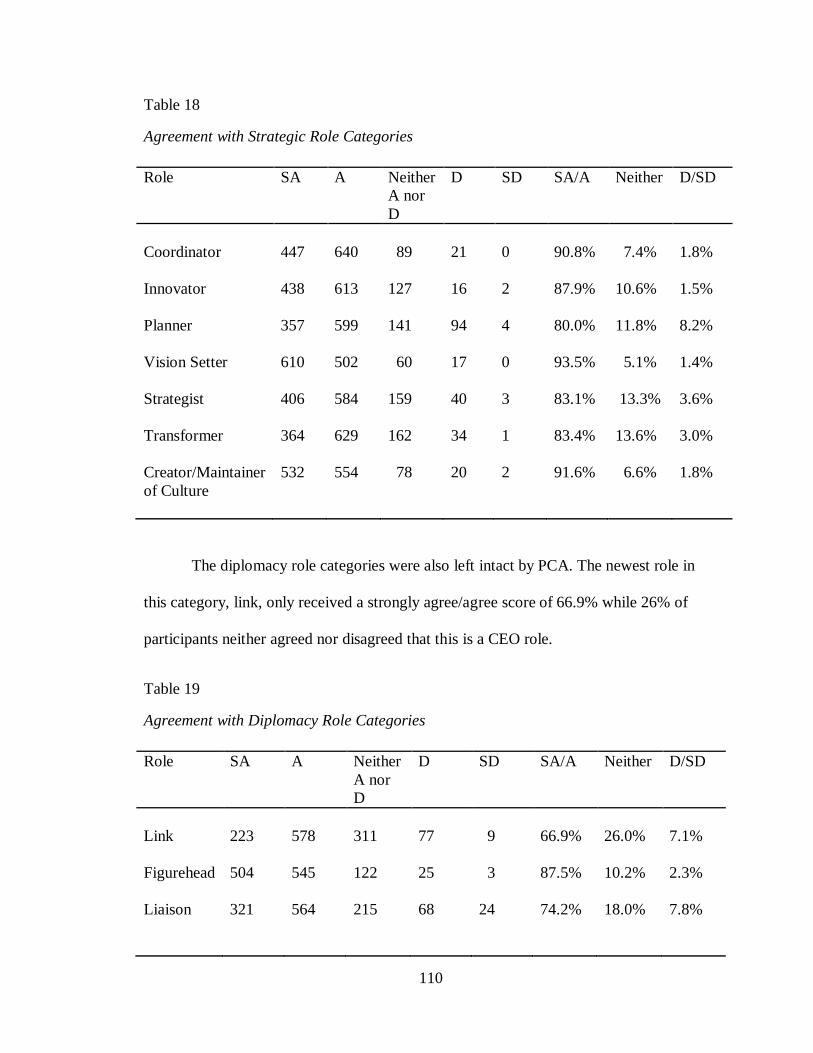
110
Table 18
Agreement with Strategic Role Categories
Role SA A Neither
A nor
D
D SD SA/A Neither D/SD
Coordinator 447 640 89 21 0 90.8% 7.4% 1.8%
Innovator
438
613
127
16
2
87.9%
10.6%
1.5%
Planner
357
599
141
94
4
80.0%
11.8%
8.2%
Vision Setter
610
502
60
17
0
93.5%
5.1%
1.4%
Strategist
406
584
159
40
3
83.1%
13.3%
3.6%
Transformer
364
629
162
34
1
83.4%
13.6%
3.0%
Creator/Maintainer
of Culture
532
554
78
20
2
91.6%
6.6%
1.8%
The diplomacy role categories were also left intact by PCA. The newest role in
this category, link, only received a strongly agree/agree score of 66.9% while 26% of
participants neither agreed nor disagreed that this is a CEO role.
Table 19
Agreement with Diplomacy Role Categories
Role SA A Neither
A nor
D
D SD SA/A Neither D/SD
Link 223 578 311 77 9 66.9% 26.0% 7.1%
Figurehead
504
545
122
25
3
87.5%
10.2%
2.3%
Liaison
321
564
215
68
24
74.2%
18.0%
7.8%
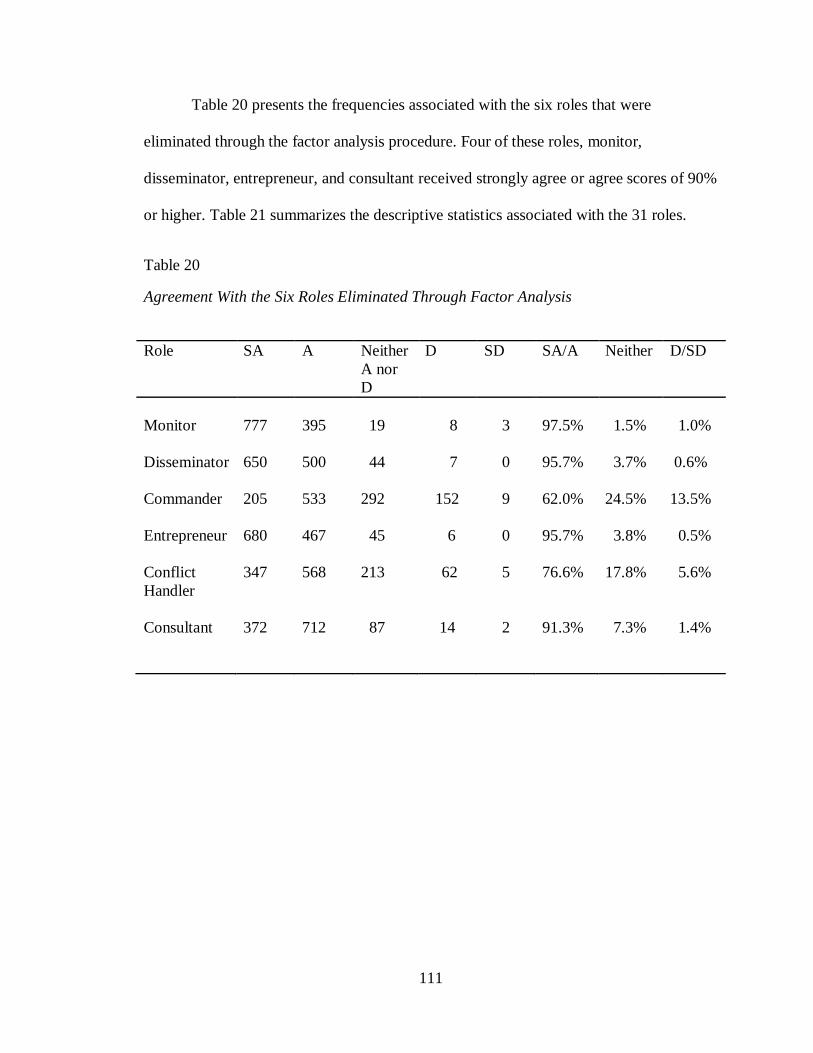
111
Table 20 presents the frequencies associated with the six roles that were
eliminated through the factor analysis procedure. Four of these roles, monitor,
disseminator, entrepreneur, and consultant received strongly agree or agree scores of 90%
or higher. Table 21 summarizes the descriptive statistics associated with the 31 roles.
Table 20
Agreement With the Six Roles Eliminated Through Factor Analysis
Role SA A Neither
A nor
D
D SD SA/A Neither D/SD
Monitor 777 395 19 8 3 97.5% 1.5% 1.0%
Disseminator 650 500 44 7 0 95.7% 3.7% 0.6%
Commander 205 533 292 152 9 62.0% 24.5% 13.5%
Entrepreneur 680 467 45 6 0 95.7% 3.8% 0.5%
Conflict
Handler
347 568 213 62 5 76.6% 17.8% 5.6%
Consultant 372 712 87 14 2 91.3% 7.3% 1.4%
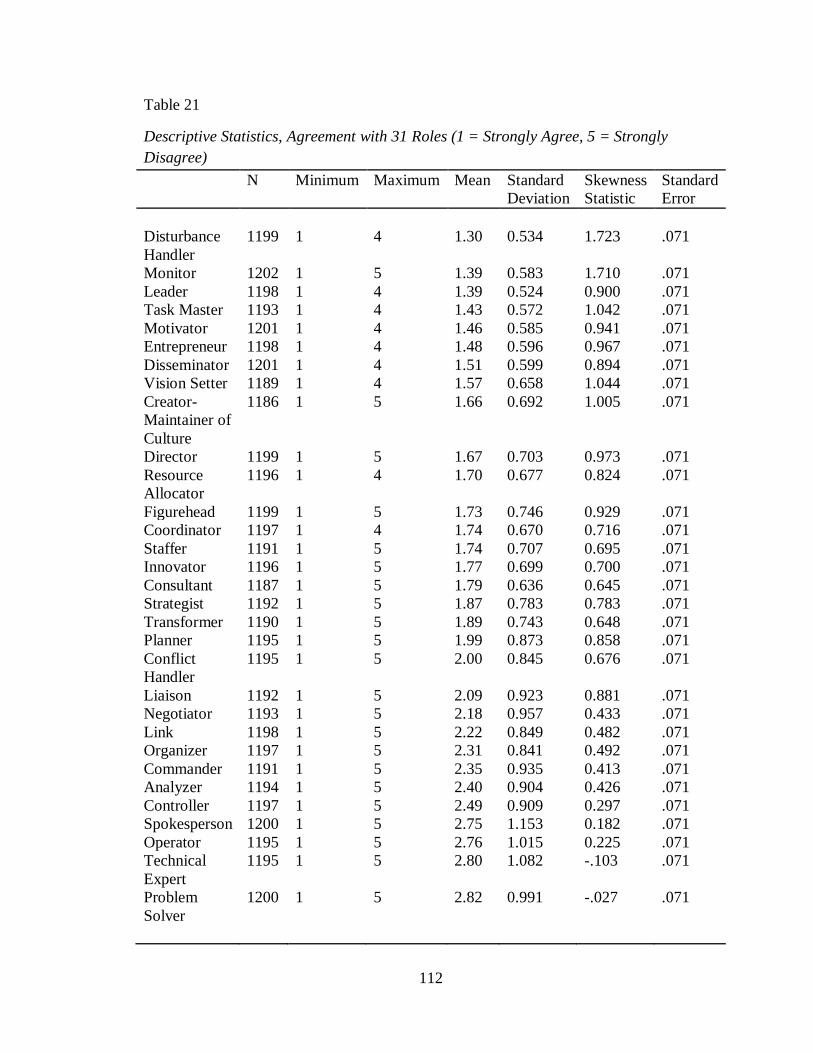
112
Table 21
Descriptive Statistics, Agreement with 31 Roles (1 = Strongly Agree, 5 = Strongly
Disagree)
N Minimum Maximum Mean Standard
Deviation
Skewness
Statistic
Standard
Error
Disturbance
Handler
1199 1 4 1.30 0.534 1.723 .071
Monitor 1202 1 5 1.39 0.583 1.710 .071
Leader 1198 1 4 1.39 0.524 0.900 .071
Task Master 1193 1 4 1.43 0.572 1.042 .071
Motivator 1201 1 4 1.46 0.585 0.941 .071
Entrepreneur 1198 1 4 1.48 0.596 0.967 .071
Disseminator 1201 1 4 1.51 0.599 0.894 .071
Vision Setter 1189 1 4 1.57 0.658 1.044 .071
Creator-
Maintainer of
Culture
1186 1 5 1.66 0.692 1.005 .071
Director 1199 1 5 1.67 0.703 0.973 .071
Resource
Allocator
1196 1 4 1.70 0.677 0.824 .071
Figurehead 1199 1 5 1.73 0.746 0.929 .071
Coordinator 1197 1 4 1.74 0.670 0.716 .071
Staffer 1191 1 5 1.74 0.707 0.695 .071
Innovator 1196 1 5 1.77 0.699 0.700 .071
Consultant 1187 1 5 1.79 0.636 0.645 .071
Strategist 1192 1 5 1.87 0.783 0.783 .071
Transformer 1190 1 5 1.89 0.743 0.648 .071
Planner 1195 1 5 1.99 0.873 0.858 .071
Conflict
Handler
1195 1 5 2.00 0.845 0.676 .071
Liaison 1192 1 5 2.09 0.923 0.881 .071
Negotiator 1193 1 5 2.18 0.957 0.433 .071
Link 1198 1 5 2.22 0.849 0.482 .071
Organizer 1197 1 5 2.31 0.841 0.492 .071
Commander 1191 1 5 2.35 0.935 0.413 .071
Analyzer 1194 1 5 2.40 0.904 0.426 .071
Controller 1197 1 5 2.49 0.909 0.297 .071
Spokesperson 1200 1 5 2.75 1.153 0.182 .071
Operator 1195 1 5 2.76 1.015 0.225 .071
Technical
Expert
1195 1 5 2.80 1.082 -.103 .071
Problem
Solver
1200 1 5 2.82 0.991 -.027 .071
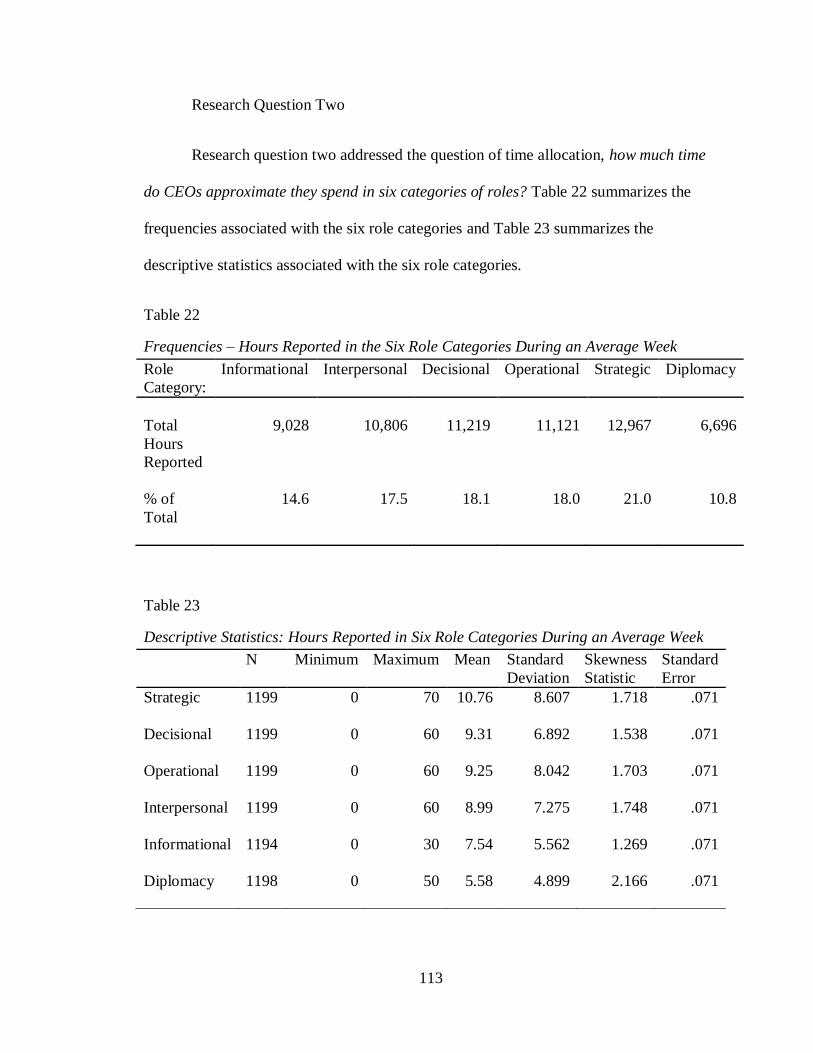
113
Research Question Two
Research question two addressed the question of time allocation, how much time
do CEOs approximate they spend in six categories of roles? Table 22 summarizes the
frequencies associated with the six role categories and Table 23 summarizes the
descriptive statistics associated with the six role categories.
Table 22
Frequencies – Hours Reported in the Six Role Categories During an Average Week
Role
Category:
Informational Interpersonal Decisional Operational Strategic Diplomacy
Total
Hours
Reported
9,028 10,806 11,219 11,121 12,967 6,696
% of
Total
14.6 17.5 18.1 18.0 21.0 10.8
Table 23
Descriptive Statistics: Hours Reported in Six Role Categories During an Average Week
N Minimum Maximum Mean Standard
Deviation
Skewness
Statistic
Standard
Error
Strategic 1199 0 70 10.76 8.607 1.718 .071
Decisional 1199 0 60 9.31 6.892 1.538 .071
Operational 1199 0 60 9.25 8.042 1.703 .071
Interpersonal 1199 0 60 8.99 7.275 1.748 .071
Informational 1194 0 30 7.54 5.562 1.269 .071
Diplomacy 1198 0 50 5.58 4.899 2.166 .071
114
Research Question Three
Research question three asked what roles are identified by CEOs that were not
identified in the literature on the role of CEO?
The following roles were identified by the survey participants: coach, mentor,
cheerleader, succession planner, consensus builder, liaison with Board of Directors,
community involvement and outreach, driver of sustainability, investor relations,
financial oversight, fund raising, enabler, chief storyteller, recruiter, thought leader,
industry positioner, and chief embodiment of the values of the organization. Many other
roles were identified that reflected the roles on the survey. Many CEOs emphasized
spending a significant amount of their time in financial roles due to the current economic
condition. This finding may imply that economic context is important in determining the
role of CEO at any given time.
Research Hypotheses Testing
Research Hypothesis One
Research hypothesis one in null form, there is no difference between gender,
agreement with the 31 role descriptions, and time allocated to the six role categories was
tested using an independent-samples t-test (role agreement) and Mann-Whitney U (time
allocated to the six role categories). Two different statistics were necessary due to
skewness of the data related to time. Table 24 indicates there were statistically significant
differences in role agreement between male and female CEOs on the operational,
strategic, and diplomacy role categories. The group means for the operational role
category indicates the average score for female CEOs (M = 2.3418) is lower than the
average score (M = 2.5097) for males. The effect size d is approximately .23 which is
115
small or smaller than typical. The lower scores for female CEOs indicate slightly more
agreement that these are roles of a CEO, as the score of 1 indicated a response of strongly
agree on the five-point Likert scale.
The group means for the strategic role category indicates the average score for
female CEOs (M = 1.6643) is lower than the average score (M = 1.7979) for males. The
effect size d is approximately .29 which is between a small (.20) and medium or typical
effect size (.50) (Gliner et al., 2009). The group means for the diplomacy role category
indicated the average score for female CEOs (M = 1.8073) is lower than the average
score (M = 2.0402) for males. The effect size d is .37 which is between a small and
medium or typical effect size. Effect size indicates ―the strength of the relationship
between the independent variable and the dependent variable, and/or the magnitude of the
difference between levels of the independent variable with respect to the dependent
variable‖ (Morgan et al., 2011, p. 99).
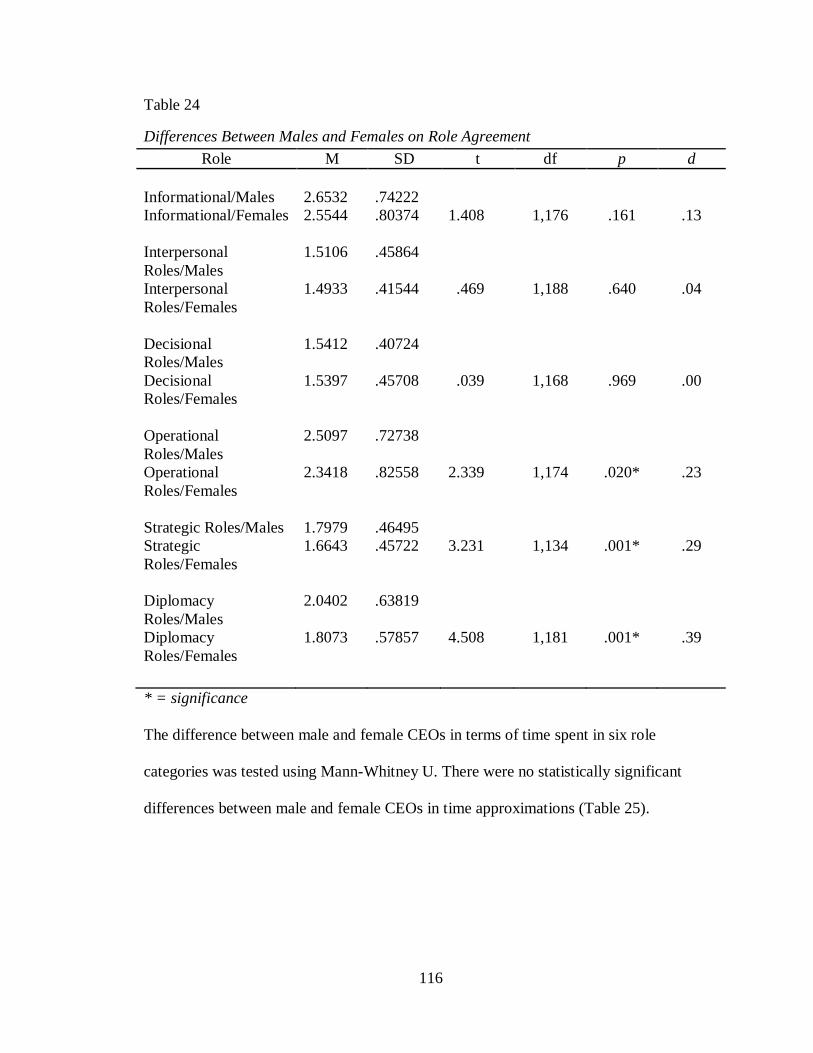
116
Table 24
Differences Between Males and Females on Role Agreement
Role M SD t df p d
Informational/Males 2.6532 .74222
Informational/Females 2.5544 .80374 1.408 1,176 .161 .13
Interpersonal
Roles/Males
1.5106 .45864
Interpersonal
Roles/Females
1.4933 .41544 .469 1,188 .640 .04
Decisional
Roles/Males
1.5412 .40724
Decisional
Roles/Females
1.5397 .45708 .039 1,168 .969 .00
Operational
Roles/Males
2.5097 .72738
Operational
Roles/Females
2.3418 .82558 2.339 1,174 .020* .23
Strategic Roles/Males 1.7979 .46495
Strategic
Roles/Females
1.6643 .45722 3.231 1,134 .001* .29
Diplomacy
Roles/Males
2.0402 .63819
Diplomacy
Roles/Females
1.8073 .57857 4.508 1,181 .001* .39
* = significance
The difference between male and female CEOs in terms of time spent in six role
categories was tested using Mann-Whitney U. There were no statistically significant
differences between male and female CEOs in time approximations (Table 25).
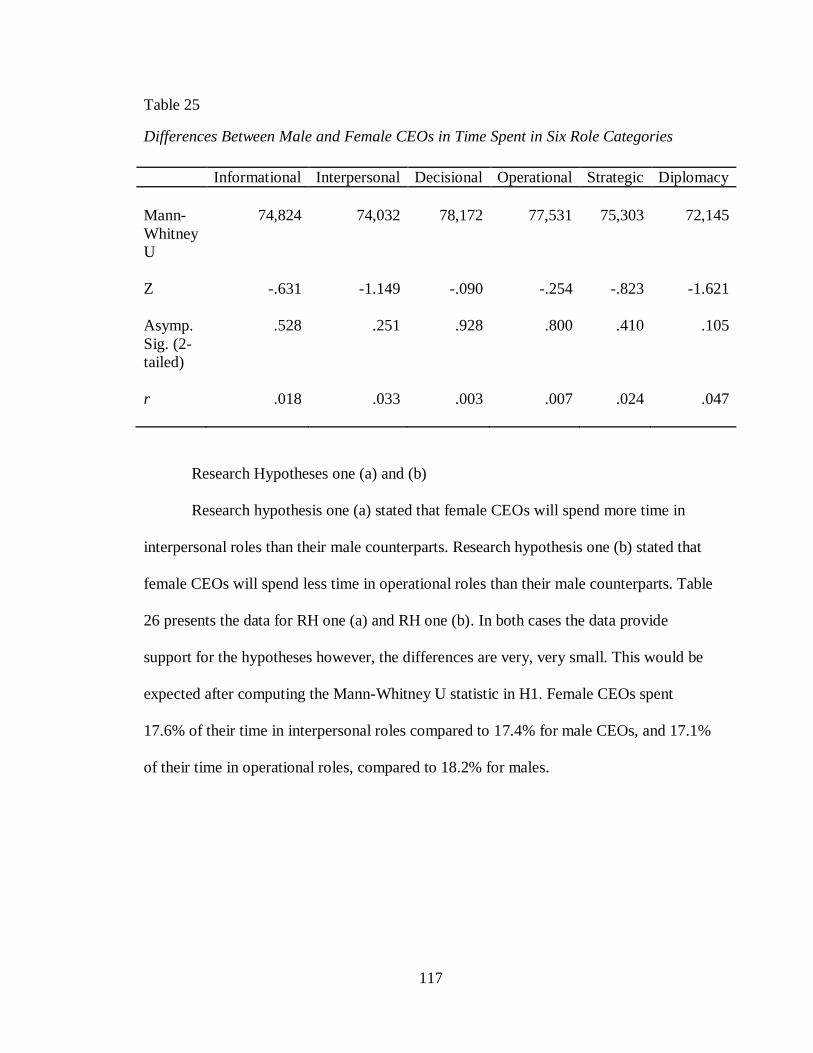
117
Table 25
Differences Between Male and Female CEOs in Time Spent in Six Role Categories
Informational Interpersonal Decisional Operational Strategic Diplomacy
Mann-
Whitney
U
74,824 74,032 78,172 77,531 75,303 72,145
Z -.631 -1.149 -.090 -.254 -.823 -1.621
Asymp.
Sig. (2-
tailed)
.528 .251 .928 .800 .410 .105
r .018 .033 .003 .007 .024 .047
Research Hypotheses one (a) and (b)
Research hypothesis one (a) stated that female CEOs will spend more time in
interpersonal roles than their male counterparts. Research hypothesis one (b) stated that
female CEOs will spend less time in operational roles than their male counterparts. Table
26 presents the data for RH one (a) and RH one (b). In both cases the data provide
support for the hypotheses however, the differences are very, very small. This would be
expected after computing the Mann-Whitney U statistic in H1. Female CEOs spent
17.6% of their time in interpersonal roles compared to 17.4% for male CEOs, and 17.1%
of their time in operational roles, compared to 18.2% for males.
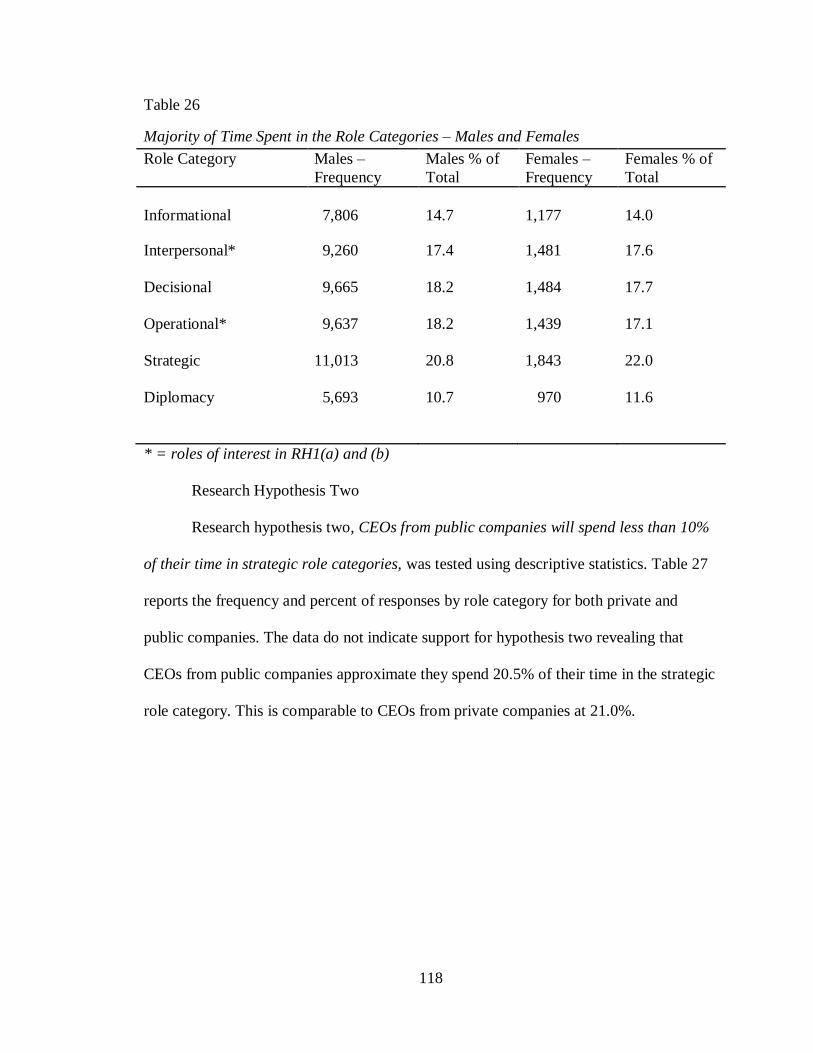
118
Table 26
Majority of Time Spent in the Role Categories – Males and Females
Role Category Males –
Frequency
Males % of
Total
Females –
Frequency
Females % of
Total
Informational 7,806 14.7 1,177 14.0
Interpersonal* 9,260 17.4 1,481 17.6
Decisional 9,665 18.2 1,484 17.7
Operational* 9,637 18.2 1,439 17.1
Strategic 11,013 20.8 1,843 22.0
Diplomacy 5,693 10.7 970 11.6
* = roles of interest in RH1(a) and (b)
Research Hypothesis Two
Research hypothesis two, CEOs from public companies will spend less than 10%
of their time in strategic role categories, was tested using descriptive statistics. Table 27
reports the frequency and percent of responses by role category for both private and
public companies. The data do not indicate support for hypothesis two revealing that
CEOs from public companies approximate they spend 20.5% of their time in the strategic
role category. This is comparable to CEOs from private companies at 21.0%.
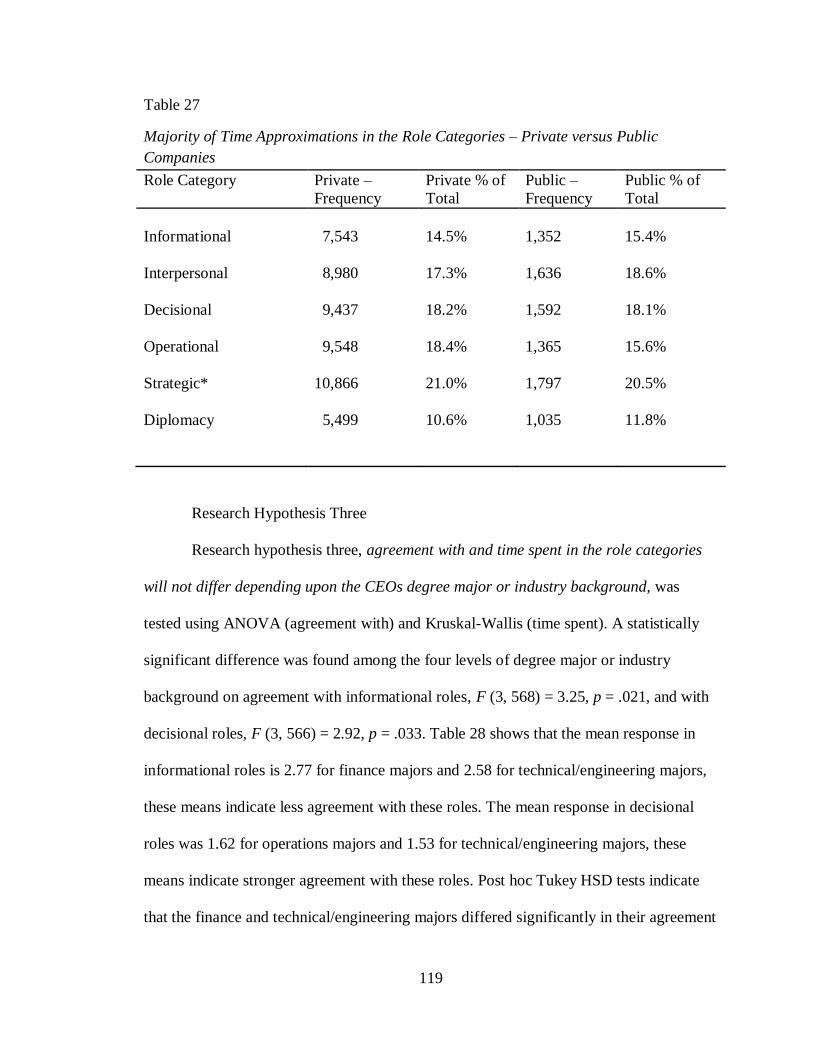
119
Table 27
Majority of Time Approximations in the Role Categories – Private versus Public
Companies
Role Category Private –
Frequency
Private % of
Total
Public –
Frequency
Public % of
Total
Informational 7,543 14.5% 1,352 15.4%
Interpersonal 8,980 17.3% 1,636 18.6%
Decisional 9,437 18.2% 1,592 18.1%
Operational 9,548 18.4% 1,365 15.6%
Strategic* 10,866 21.0% 1,797 20.5%
Diplomacy 5,499 10.6% 1,035 11.8%
Research Hypothesis Three
Research hypothesis three, agreement with and time spent in the role categories
will not differ depending upon the CEOs degree major or industry background, was
tested using ANOVA (agreement with) and Kruskal-Wallis (time spent). A statistically
significant difference was found among the four levels of degree major or industry
background on agreement with informational roles, F (3, 568) = 3.25, p = .021, and with
decisional roles, F (3, 566) = 2.92, p = .033. Table 28 shows that the mean response in
informational roles is 2.77 for finance majors and 2.58 for technical/engineering majors,
these means indicate less agreement with these roles. The mean response in decisional
roles was 1.62 for operations majors and 1.53 for technical/engineering majors, these
means indicate stronger agreement with these roles. Post hoc Tukey HSD tests indicate
that the finance and technical/engineering majors differed significantly in their agreement
120
with informational roles, yet the effect size is small or smaller than typical (p < .026, d =
.27). Post hoc Tukey HSD also indicated there were statistically significant mean
differences for operations majors and technical/engineering majors on the decisional
roles, and again the effect size is small or smaller than typical (p < .036, d = .29).
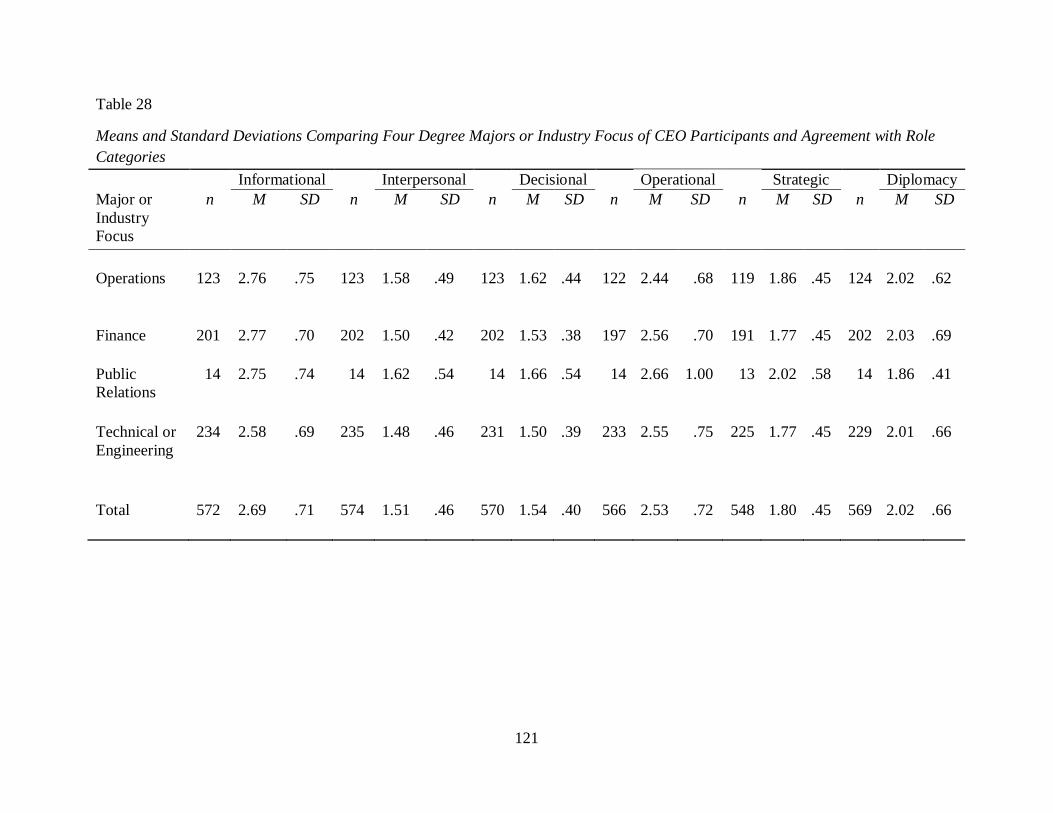
121
Table 28
Means and Standard Deviations Comparing Four Degree Majors or Industry Focus of CEO Participants and Agreement with Role
Categories
Informational Interpersonal Decisional Operational Strategic Diplomacy
Major or
Industry
Focus
n M SD n M SD n M SD n M SD n M SD n M SD
Operations 123 2.76 .75 123 1.58 .49 123 1.62 .44 122 2.44 .68 119 1.86 .45 124 2.02 .62
Finance 201 2.77 .70 202 1.50 .42 202 1.53 .38 197 2.56 .70 191 1.77 .45 202 2.03 .69
Public
Relations
14 2.75 .74 14 1.62 .54 14 1.66 .54 14 2.66 1.00 13 2.02 .58 14 1.86 .41
Technical or
Engineering
234 2.58 .69 235 1.48 .46 231 1.50 .39 233 2.55 .75 225 1.77 .45 229 2.01 .66
Total 572 2.69 .71 574 1.51 .46 570 1.54 .40 566 2.53 .72 548 1.80 .45 569 2.02 .66
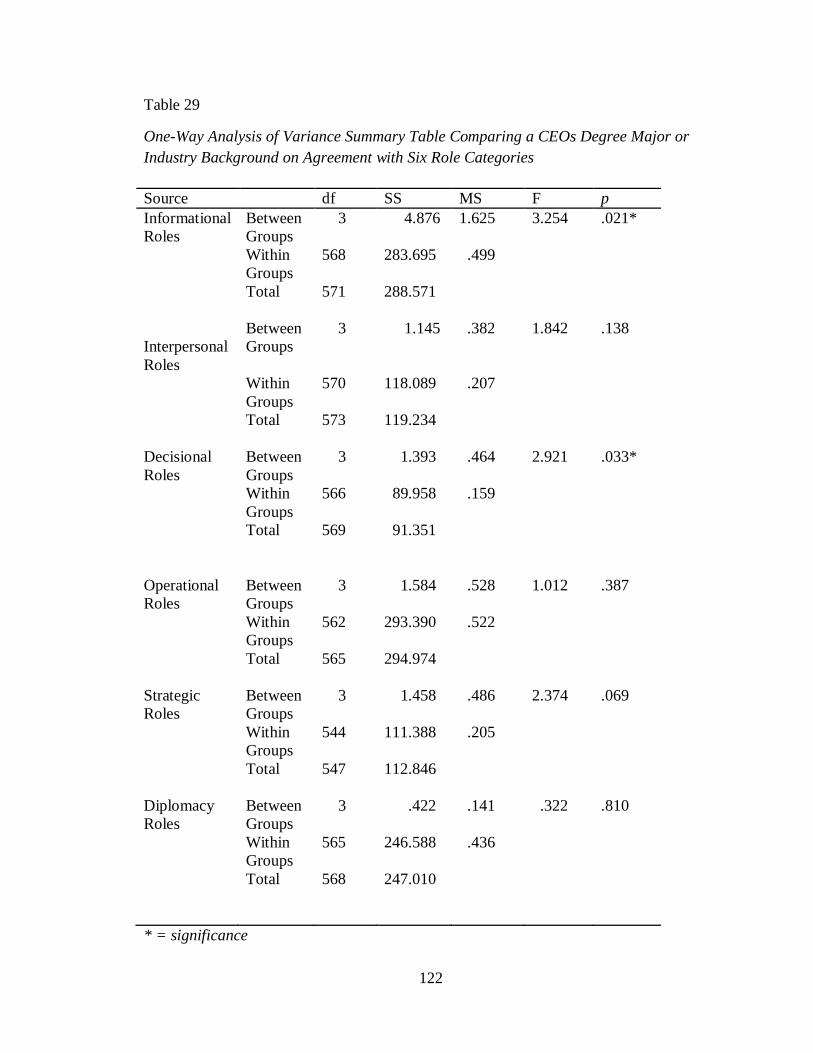
122
Table 29
One-Way Analysis of Variance Summary Table Comparing a CEOs Degree Major or
Industry Background on Agreement with Six Role Categories
Source df SS MS F p
Informational
Roles
Between
Groups
3 4.876 1.625 3.254 .021*
Within
Groups
568 283.695 .499
Total 571 288.571
Interpersonal
Roles
Between
Groups
3 1.145 .382 1.842 .138
Within
Groups
570 118.089 .207
Total 573 119.234
Decisional
Roles
Between
Groups
3 1.393 .464 2.921 .033*
Within
Groups
566 89.958 .159
Total 569 91.351
Operational
Roles
Between
Groups
3 1.584 .528 1.012 .387
Within
Groups
562 293.390 .522
Total 565 294.974
Strategic
Roles
Between
Groups
3 1.458 .486 2.374 .069
Within
Groups
544 111.388 .205
Total 547 112.846
Diplomacy
Roles
Between
Groups
3 .422 .141 .322 .810
Within
Groups
565 246.588 .436
Total 568 247.010
* = significance
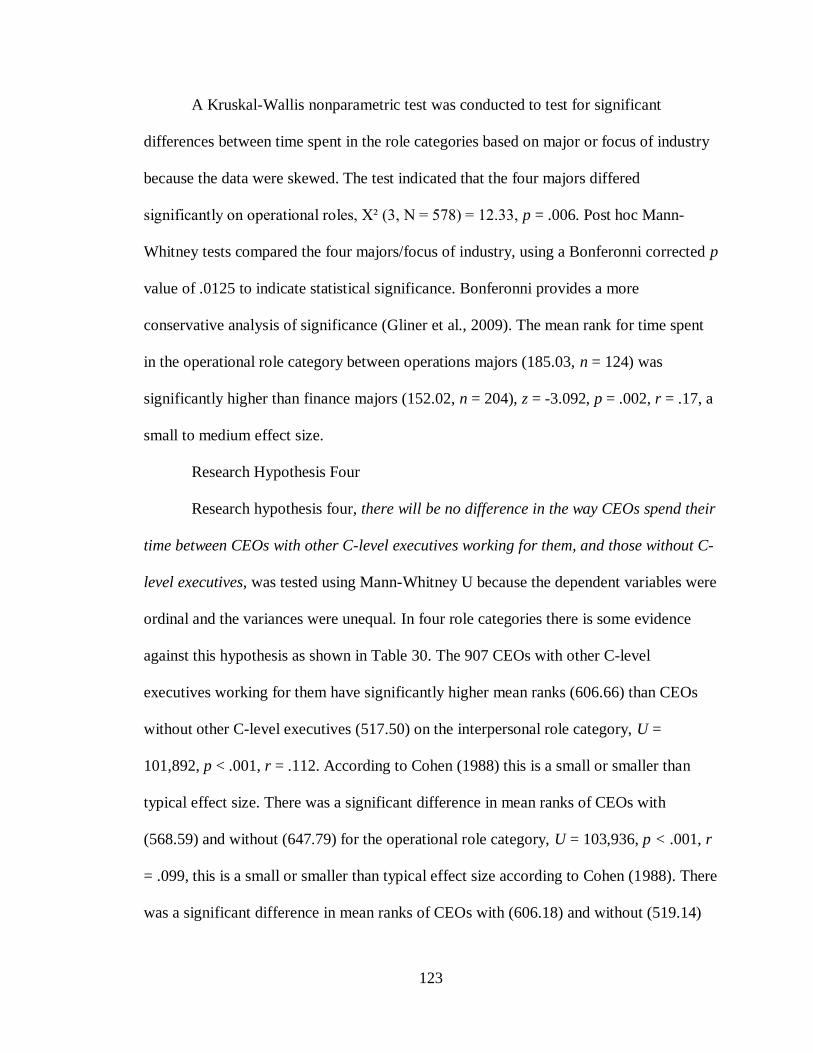
123
A Kruskal-Wallis nonparametric test was conducted to test for significant
differences between time spent in the role categories based on major or focus of industry
because the data were skewed. The test indicated that the four majors differed
significantly on operational roles, Χ² (3, N = 578) = 12.33, p = .006. Post hoc Mann-
Whitney tests compared the four majors/focus of industry, using a Bonferonni corrected p
value of .0125 to indicate statistical significance. Bonferonni provides a more
conservative analysis of significance (Gliner et al., 2009). The mean rank for time spent
in the operational role category between operations majors (185.03, n = 124) was
significantly higher than finance majors (152.02, n = 204), z = -3.092, p = .002, r = .17, a
small to medium effect size.
Research Hypothesis Four
Research hypothesis four, there will be no difference in the way CEOs spend their
time between CEOs with other C-level executives working for them, and those without C-
level executives, was tested using Mann-Whitney U because the dependent variables were
ordinal and the variances were unequal. In four role categories there is some evidence
against this hypothesis as shown in Table 30. The 907 CEOs with other C-level
executives working for them have significantly higher mean ranks (606.66) than CEOs
without other C-level executives (517.50) on the interpersonal role category, U =
101,892, p < .001, r = .112. According to Cohen (1988) this is a small or smaller than
typical effect size. There was a significant difference in mean ranks of CEOs with
(568.59) and without (647.79) for the operational role category, U = 103,936, p < .001, r
= .099, this is a small or smaller than typical effect size according to Cohen (1988). There
was a significant difference in mean ranks of CEOs with (606.18) and without (519.14)
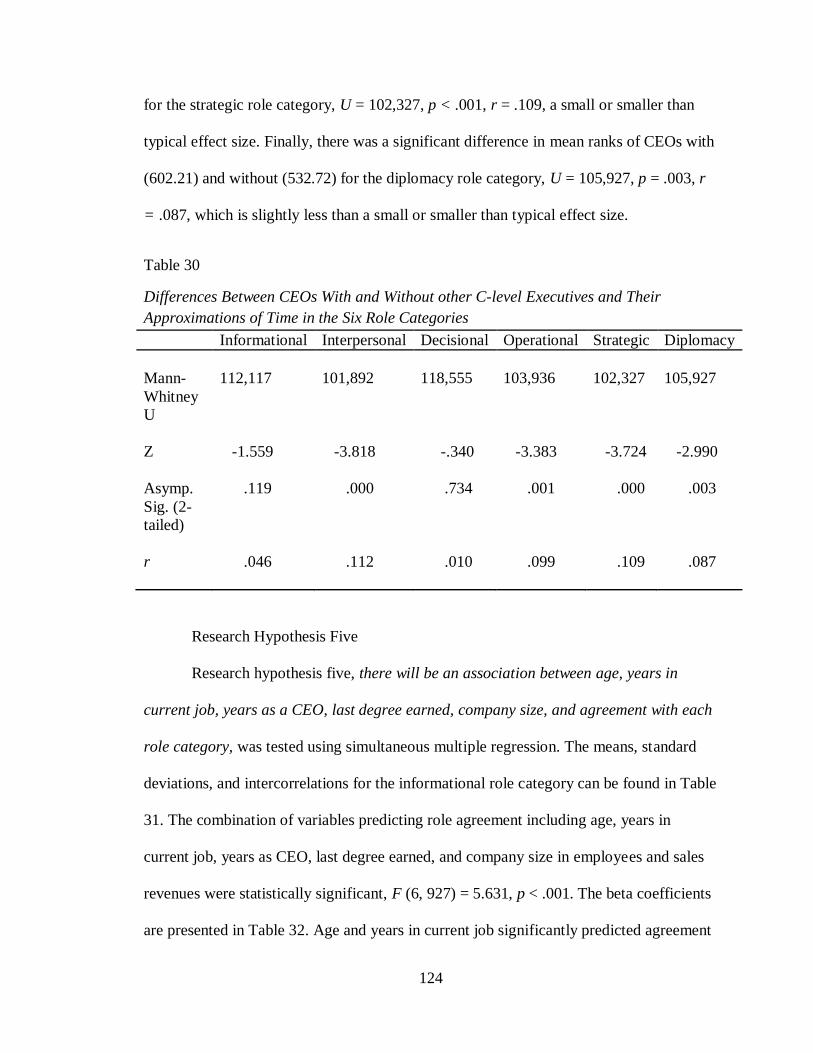
124
for the strategic role category, U = 102,327, p < .001, r = .109, a small or smaller than
typical effect size. Finally, there was a significant difference in mean ranks of CEOs with
(602.21) and without (532.72) for the diplomacy role category, U = 105,927, p = .003, r
= .087, which is slightly less than a small or smaller than typical effect size.
Table 30
Differences Between CEOs With and Without other C-level Executives and Their
Approximations of Time in the Six Role Categories
Informational Interpersonal Decisional Operational Strategic Diplomacy
Mann-
Whitney
U
112,117 101,892 118,555 103,936 102,327 105,927
Z -1.559 -3.818 -.340 -3.383 -3.724 -2.990
Asymp.
Sig. (2-
tailed)
.119 .000 .734 .001 .000 .003
r .046 .112 .010 .099 .109 .087
Research Hypothesis Five
Research hypothesis five, there will be an association between age, years in
current job, years as a CEO, last degree earned, company size, and agreement with each
role category, was tested using simultaneous multiple regression. The means, standard
deviations, and intercorrelations for the informational role category can be found in Table
31. The combination of variables predicting role agreement including age, years in
current job, years as CEO, last degree earned, and company size in employees and sales
revenues were statistically significant, F (6, 927) = 5.631, p < .001. The beta coefficients
are presented in Table 32. Age and years in current job significantly predicted agreement
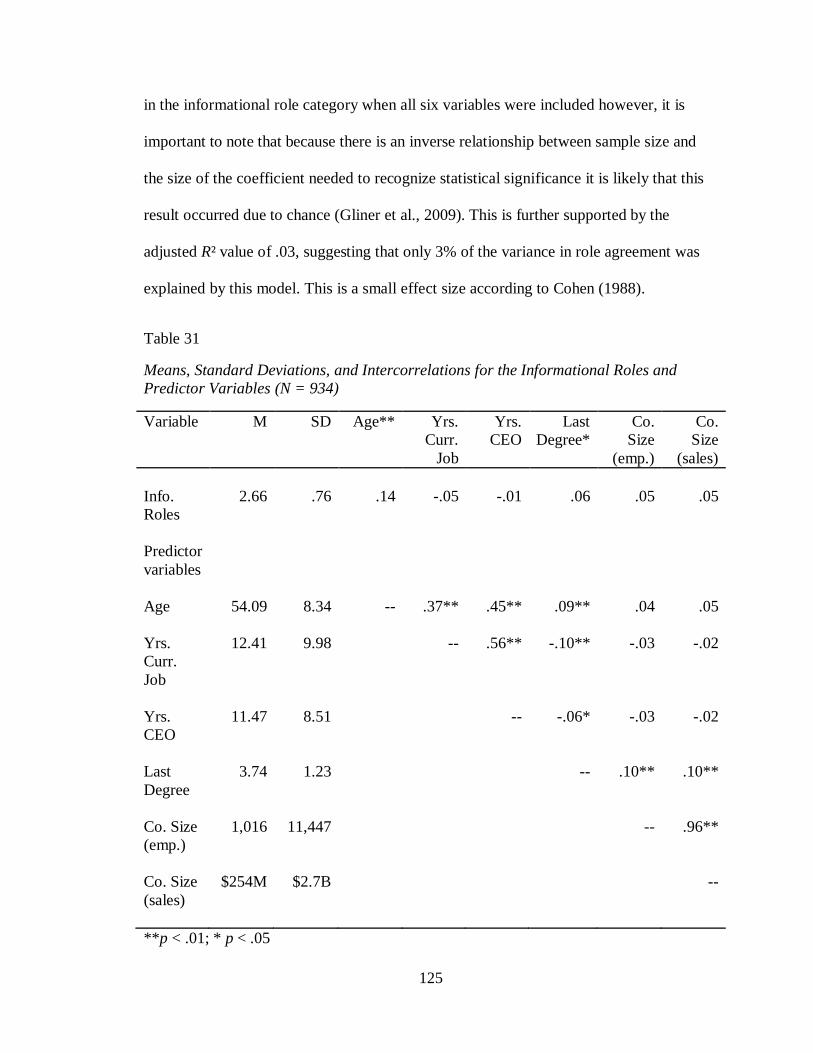
125
in the informational role category when all six variables were included however, it is
important to note that because there is an inverse relationship between sample size and
the size of the coefficient needed to recognize statistical significance it is likely that this
result occurred due to chance (Gliner et al., 2009). This is further supported by the
adjusted R² value of .03, suggesting that only 3% of the variance in role agreement was
explained by this model. This is a small effect size according to Cohen (1988).
Table 31
Means, Standard Deviations, and Intercorrelations for the Informational Roles and
Predictor Variables (N = 934)
Variable M SD Age** Yrs.
Curr.
Job
Yrs.
CEO
Last
Degree*
Co.
Size
(emp.)
Co.
Size
(sales)
Info.
Roles
2.66 .76 .14 -.05 -.01 .06 .05 .05
Predictor
variables
Age 54.09 8.34 -- .37** .45** .09** .04 .05
Yrs.
Curr.
Job
12.41 9.98 -- .56** -.10** -.03 -.02
Yrs.
CEO
11.47 8.51 -- -.06* -.03 -.02
Last
Degree
3.74 1.23 -- .10** .10**
Co. Size
(emp.)
1,016 11,447 -- .96**
Co. Size
(sales)
$254M $2.7B --
**p < .01; * p < .05
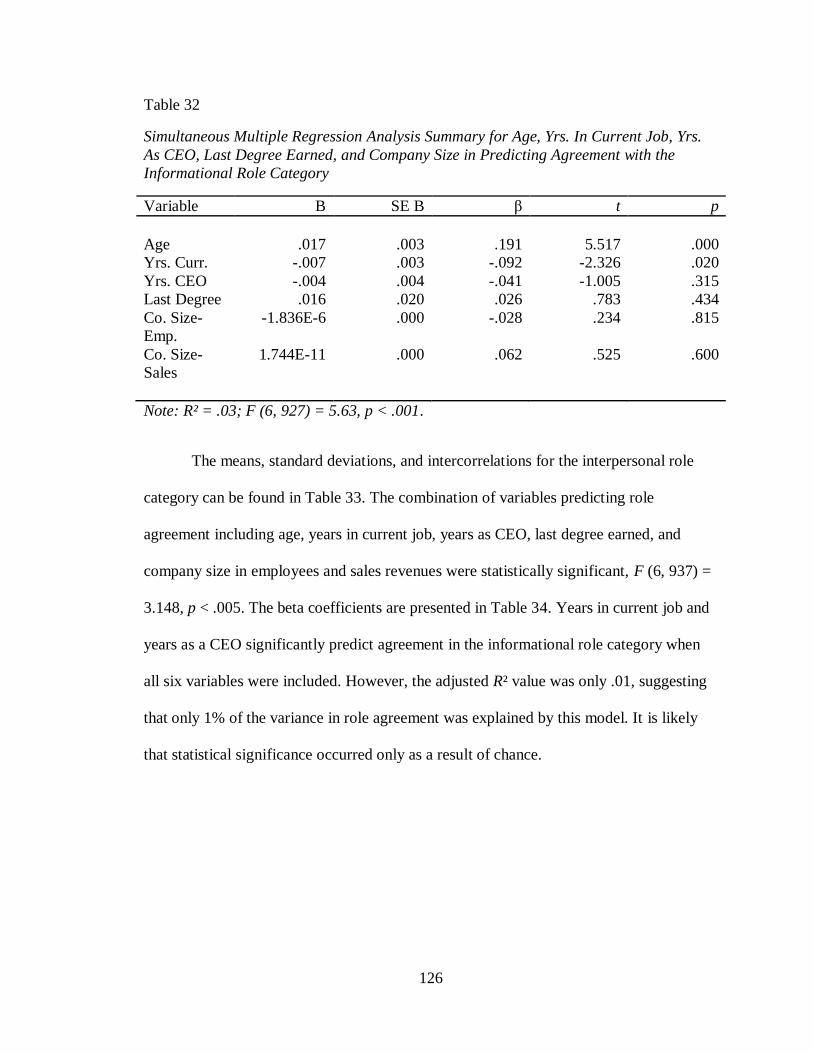
126
Table 32
Simultaneous Multiple Regression Analysis Summary for Age, Yrs. In Current Job, Yrs.
As CEO, Last Degree Earned, and Company Size in Predicting Agreement with the
Informational Role Category
Variable B SE B β t p
Age .017 .003 .191 5.517 .000
Yrs. Curr. -.007 .003 -.092 -2.326 .020
Yrs. CEO -.004 .004 -.041 -1.005 .315
Last Degree .016 .020 .026 .783 .434
Co. Size-
Emp.
-1.836E-6 .000 -.028 .234 .815
Co. Size-
Sales
1.744E-11 .000 .062 .525 .600
Note: R² = .03; F (6, 927) = 5.63, p < .001.
The means, standard deviations, and intercorrelations for the interpersonal role
category can be found in Table 33. The combination of variables predicting role
agreement including age, years in current job, years as CEO, last degree earned, and
company size in employees and sales revenues were statistically significant, F (6, 937) =
3.148, p < .005. The beta coefficients are presented in Table 34. Years in current job and
years as a CEO significantly predict agreement in the informational role category when
all six variables were included. However, the adjusted R² value was only .01, suggesting
that only 1% of the variance in role agreement was explained by this model. It is likely
that statistical significance occurred only as a result of chance.
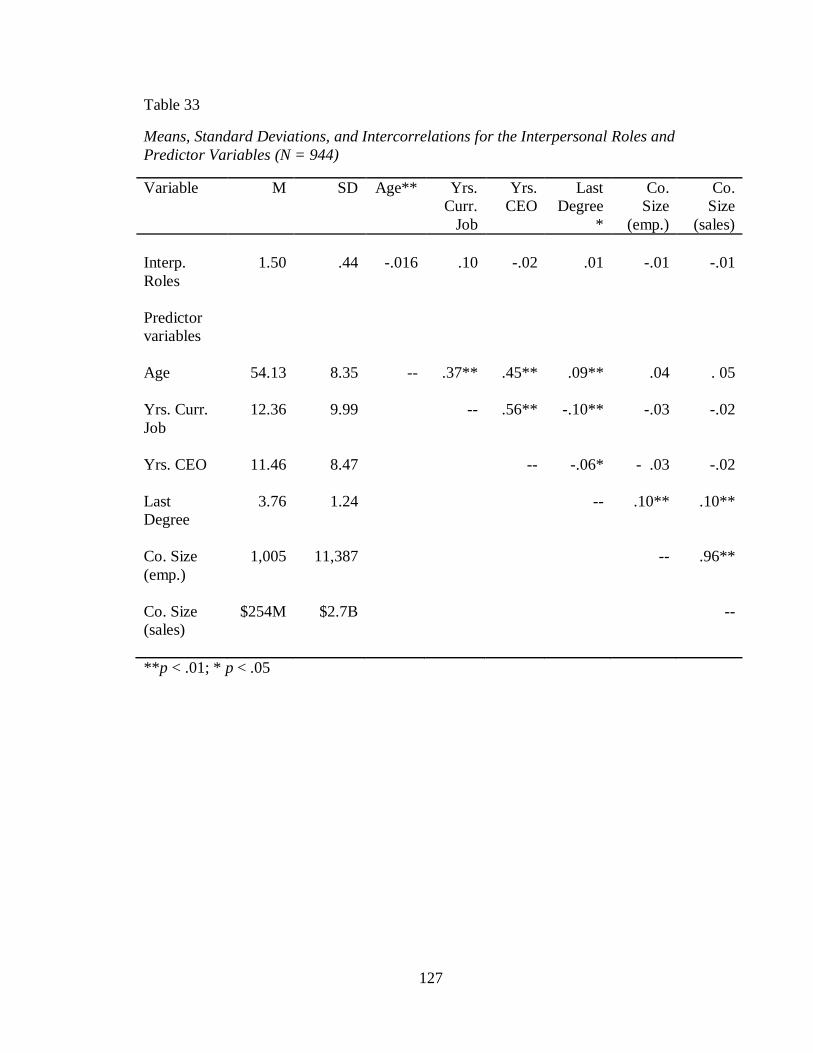
127
Table 33
Means, Standard Deviations, and Intercorrelations for the Interpersonal Roles and
Predictor Variables (N = 944)
Variable M SD Age** Yrs.
Curr.
Job
Yrs.
CEO
Last
Degree
*
Co.
Size
(emp.)
Co.
Size
(sales)
Interp.
Roles
1.50 .44 -.016 .10 -.02 .01 -.01 -.01
Predictor
variables
Age 54.13 8.35 -- .37** .45** .09** .04 . 05
Yrs. Curr.
Job
12.36 9.99 -- .56** -.10** -.03 -.02
Yrs. CEO 11.46 8.47 -- -.06* - .03 -.02
Last
Degree
3.76 1.24 -- .10** .10**
Co. Size
(emp.)
1,005 11,387 -- .96**
Co. Size
(sales)
$254M $2.7B --
**p < .01; * p < .05
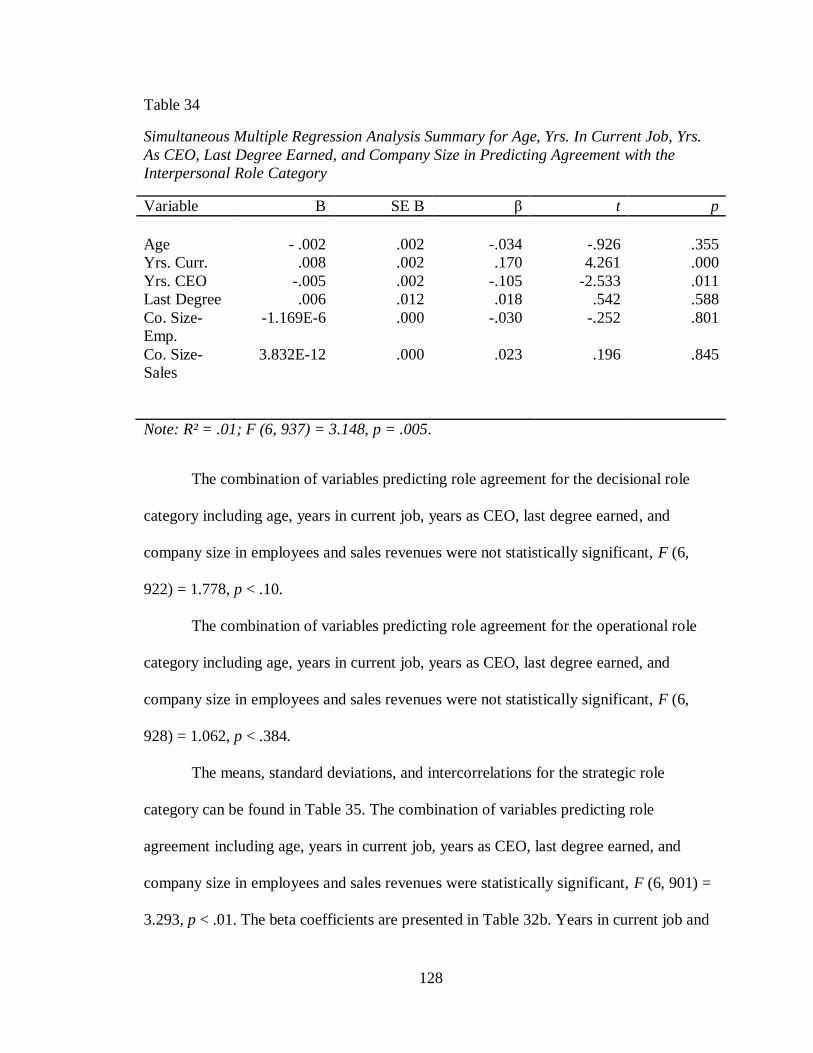
128
Table 34
Simultaneous Multiple Regression Analysis Summary for Age, Yrs. In Current Job, Yrs.
As CEO, Last Degree Earned, and Company Size in Predicting Agreement with the
Interpersonal Role Category
Variable B SE B β t p
Age - .002 .002 -.034 -.926 .355
Yrs. Curr. .008 .002 .170 4.261 .000
Yrs. CEO -.005 .002 -.105 -2.533 .011
Last Degree .006 .012 .018 .542 .588
Co. Size-
Emp.
-1.169E-6 .000 -.030 -.252 .801
Co. Size-
Sales
3.832E-12 .000 .023 .196 .845
Note: R² = .01; F (6, 937) = 3.148, p = .005.
The combination of variables predicting role agreement for the decisional role
category including age, years in current job, years as CEO, last degree earned, and
company size in employees and sales revenues were not statistically significant, F (6,
922) = 1.778, p < .10.
The combination of variables predicting role agreement for the operational role
category including age, years in current job, years as CEO, last degree earned, and
company size in employees and sales revenues were not statistically significant, F (6,
928) = 1.062, p < .384.
The means, standard deviations, and intercorrelations for the strategic role
category can be found in Table 35. The combination of variables predicting role
agreement including age, years in current job, years as CEO, last degree earned, and
company size in employees and sales revenues were statistically significant, F (6, 901) =
3.293, p < .01. The beta coefficients are presented in Table 32b. Years in current job and
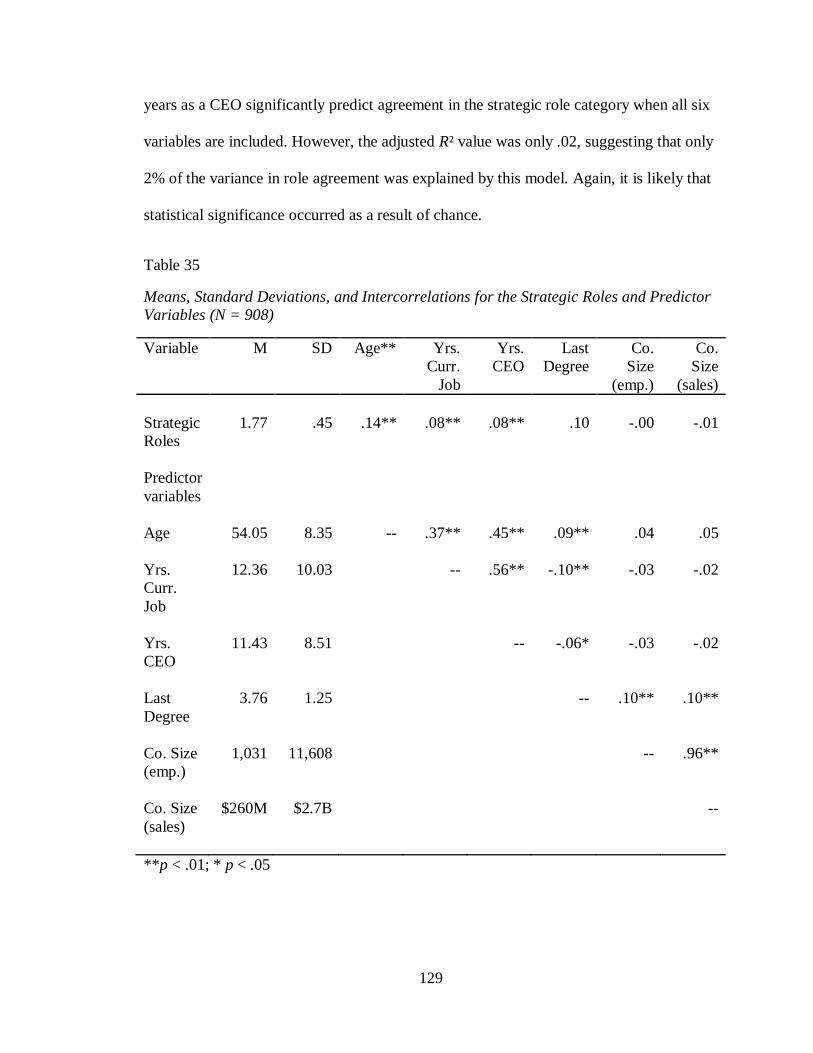
129
years as a CEO significantly predict agreement in the strategic role category when all six
variables are included. However, the adjusted R² value was only .02, suggesting that only
2% of the variance in role agreement was explained by this model. Again, it is likely that
statistical significance occurred as a result of chance.
Table 35
Means, Standard Deviations, and Intercorrelations for the Strategic Roles and Predictor
Variables (N = 908)
Variable M SD Age** Yrs.
Curr.
Job
Yrs.
CEO
Last
Degree
Co.
Size
(emp.)
Co.
Size
(sales)
Strategic
Roles
1.77 .45 .14** .08** .08** .10 -.00 -.01
Predictor
variables
Age 54.05 8.35 -- .37** .45** .09** .04 .05
Yrs.
Curr.
Job
12.36 10.03 -- .56** -.10** -.03 -.02
Yrs.
CEO
11.43 8.51 -- -.06* -.03 -.02
Last
Degree
3.76 1.25 -- .10** .10**
Co. Size
(emp.)
1,031 11,608 -- .96**
Co. Size
(sales)
$260M $2.7B --
**p < .01; * p < .05
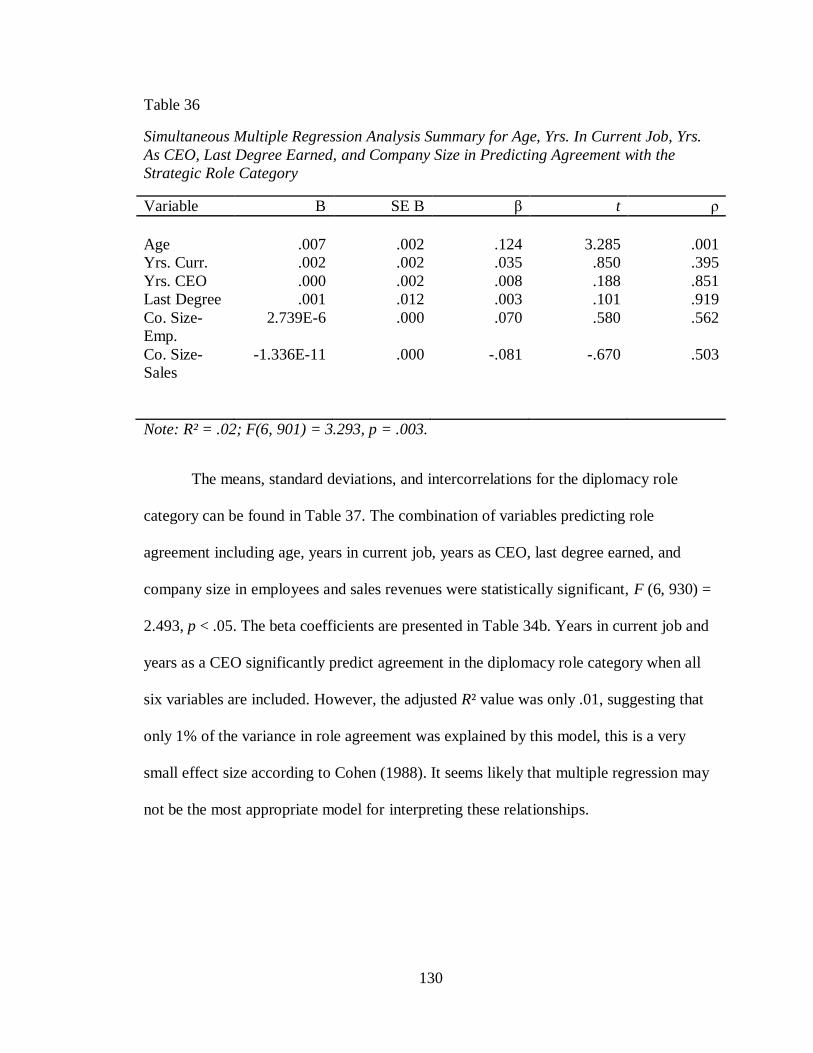
130
Table 36
Simultaneous Multiple Regression Analysis Summary for Age, Yrs. In Current Job, Yrs.
As CEO, Last Degree Earned, and Company Size in Predicting Agreement with the
Strategic Role Category
Variable B SE B β t ρ
Age .007 .002 .124 3.285 .001
Yrs. Curr. .002 .002 .035 .850 .395
Yrs. CEO .000 .002 .008 .188 .851
Last Degree .001 .012 .003 .101 .919
Co. Size-
Emp.
2.739E-6 .000 .070 .580 .562
Co. Size-
Sales
-1.336E-11 .000 -.081 -.670 .503
Note: R² = .02; F(6, 901) = 3.293, p = .003.
The means, standard deviations, and intercorrelations for the diplomacy role
category can be found in Table 37. The combination of variables predicting role
agreement including age, years in current job, years as CEO, last degree earned, and
company size in employees and sales revenues were statistically significant, F (6, 930) =
2.493, p < .05. The beta coefficients are presented in Table 34b. Years in current job and
years as a CEO significantly predict agreement in the diplomacy role category when all
six variables are included. However, the adjusted R² value was only .01, suggesting that
only 1% of the variance in role agreement was explained by this model, this is a very
small effect size according to Cohen (1988). It seems likely that multiple regression may
not be the most appropriate model for interpreting these relationships.
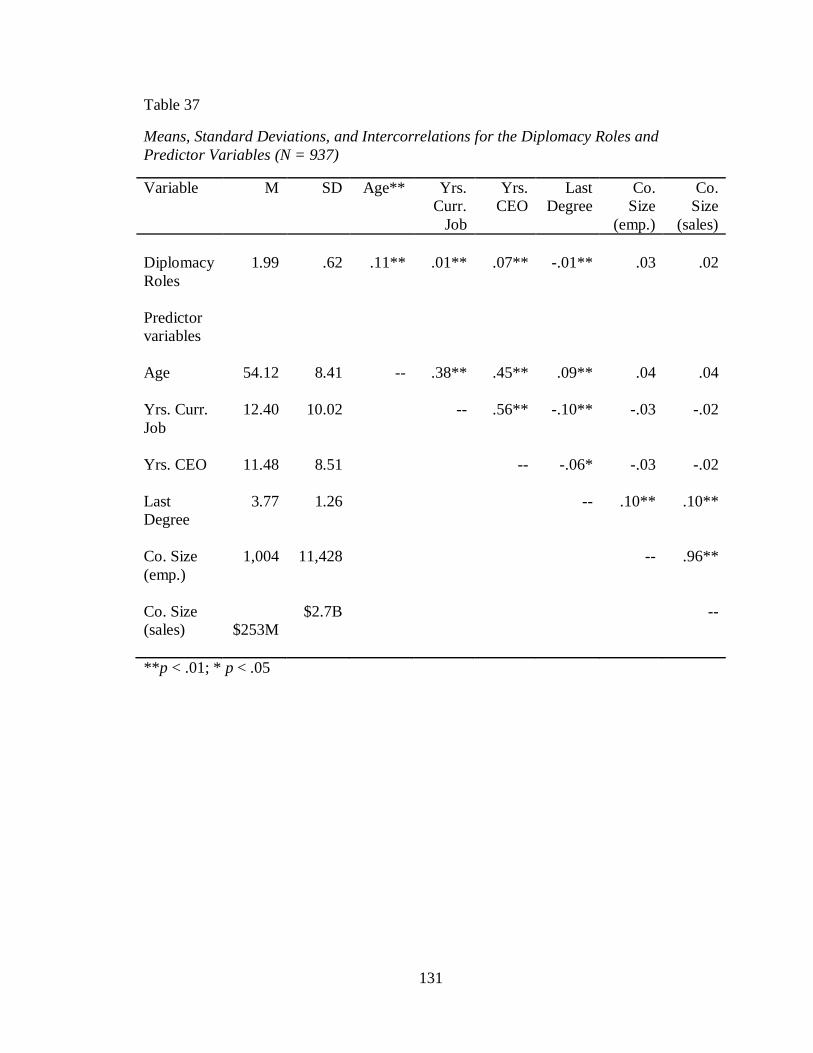
131
Table 37
Means, Standard Deviations, and Intercorrelations for the Diplomacy Roles and
Predictor Variables (N = 937)
Variable M SD Age** Yrs.
Curr.
Job
Yrs.
CEO
Last
Degree
Co.
Size
(emp.)
Co.
Size
(sales)
Diplomacy
Roles
1.99 .62 .11** .01** .07** -.01** .03 .02
Predictor
variables
Age 54.12 8.41 -- .38** .45** .09** .04 .04
Yrs. Curr.
Job
12.40 10.02 -- .56** -.10** -.03 -.02
Yrs. CEO 11.48 8.51 -- -.06* -.03 -.02
Last
Degree
3.77 1.26 -- .10** .10**
Co. Size
(emp.)
1,004 11,428 -- .96**
Co. Size
(sales)
$253M
$2.7B --
**p < .01; * p < .05
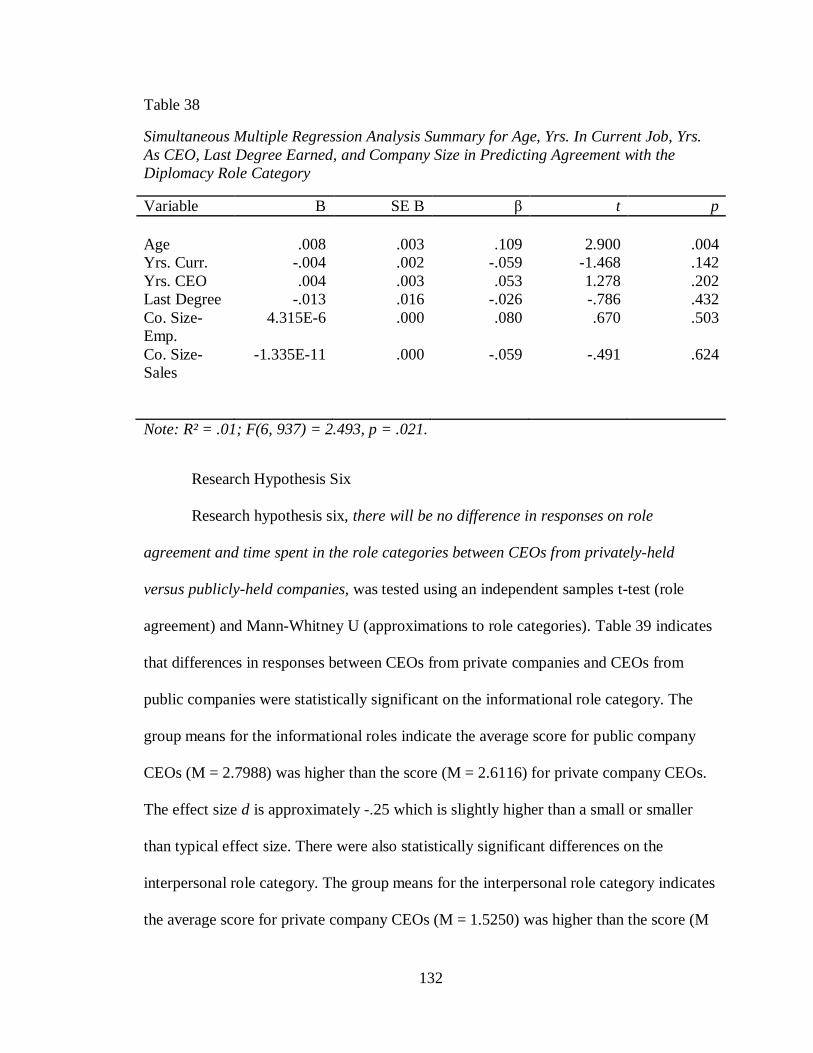
132
Table 38
Simultaneous Multiple Regression Analysis Summary for Age, Yrs. In Current Job, Yrs.
As CEO, Last Degree Earned, and Company Size in Predicting Agreement with the
Diplomacy Role Category
Variable B SE B β t p
Age .008 .003 .109 2.900 .004
Yrs. Curr. -.004 .002 -.059 -1.468 .142
Yrs. CEO .004 .003 .053 1.278 .202
Last Degree -.013 .016 -.026 -.786 .432
Co. Size-
Emp.
4.315E-6 .000 .080 .670 .503
Co. Size-
Sales
-1.335E-11 .000 -.059 -.491 .624
Note: R² = .01; F(6, 937) = 2.493, p = .021.
Research Hypothesis Six
Research hypothesis six, there will be no difference in responses on role
agreement and time spent in the role categories between CEOs from privately-held
versus publicly-held companies, was tested using an independent samples t-test (role
agreement) and Mann-Whitney U (approximations to role categories). Table 39 indicates
that differences in responses between CEOs from private companies and CEOs from
public companies were statistically significant on the informational role category. The
group means for the informational roles indicate the average score for public company
CEOs (M = 2.7988) was higher than the score (M = 2.6116) for private company CEOs.
The effect size d is approximately -.25 which is slightly higher than a small or smaller
than typical effect size. There were also statistically significant differences on the
interpersonal role category. The group means for the interpersonal role category indicates
the average score for private company CEOs (M = 1.5250) was higher than the score (M
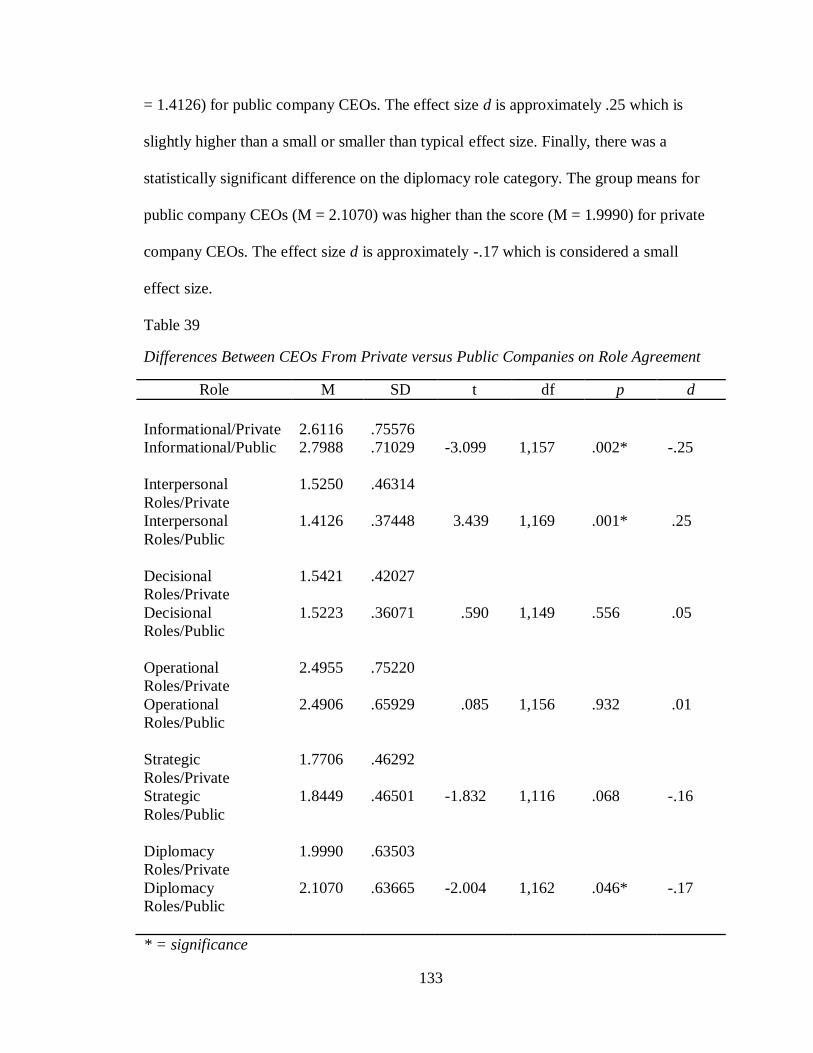
133
= 1.4126) for public company CEOs. The effect size d is approximately .25 which is
slightly higher than a small or smaller than typical effect size. Finally, there was a
statistically significant difference on the diplomacy role category. The group means for
public company CEOs (M = 2.1070) was higher than the score (M = 1.9990) for private
company CEOs. The effect size d is approximately -.17 which is considered a small
effect size.
Table 39
Differences Between CEOs From Private versus Public Companies on Role Agreement
Role M SD t df p d
Informational/Private 2.6116 .75576
Informational/Public 2.7988 .71029 -3.099 1,157 .002* -.25
Interpersonal
Roles/Private
1.5250 .46314
Interpersonal
Roles/Public
1.4126 .37448 3.439 1,169 .001* .25
Decisional
Roles/Private
1.5421 .42027
Decisional
Roles/Public
1.5223 .36071 .590 1,149 .556 .05
Operational
Roles/Private
2.4955 .75220
Operational
Roles/Public
2.4906 .65929 .085 1,156 .932 .01
Strategic
Roles/Private
1.7706 .46292
Strategic
Roles/Public
1.8449 .46501 -1.832 1,116 .068 -.16
Diplomacy
Roles/Private
1.9990 .63503
Diplomacy
Roles/Public
2.1070 .63665 -2.004 1,162 .046* -.17
* = significance
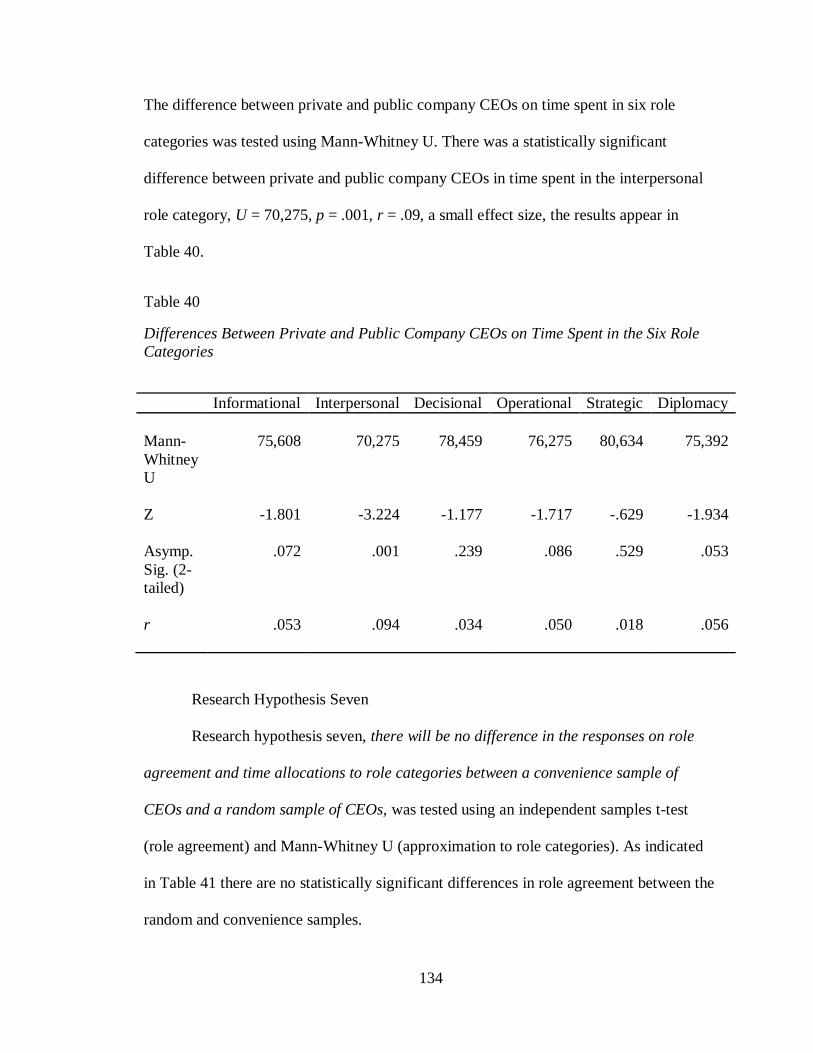
134
The difference between private and public company CEOs on time spent in six role
categories was tested using Mann-Whitney U. There was a statistically significant
difference between private and public company CEOs in time spent in the interpersonal
role category, U = 70,275, p = .001, r = .09, a small effect size, the results appear in
Table 40.
Table 40
Differences Between Private and Public Company CEOs on Time Spent in the Six Role
Categories
Informational Interpersonal Decisional Operational Strategic Diplomacy
Mann-
Whitney
U
75,608 70,275 78,459 76,275 80,634 75,392
Z -1.801 -3.224 -1.177 -1.717 -.629 -1.934
Asymp.
Sig. (2-
tailed)
.072 .001 .239 .086 .529 .053
r .053 .094 .034 .050 .018 .056
Research Hypothesis Seven
Research hypothesis seven, there will be no difference in the responses on role
agreement and time allocations to role categories between a convenience sample of
CEOs and a random sample of CEOs, was tested using an independent samples t-test
(role agreement) and Mann-Whitney U (approximation to role categories). As indicated
in Table 41 there are no statistically significant differences in role agreement between the
random and convenience samples.
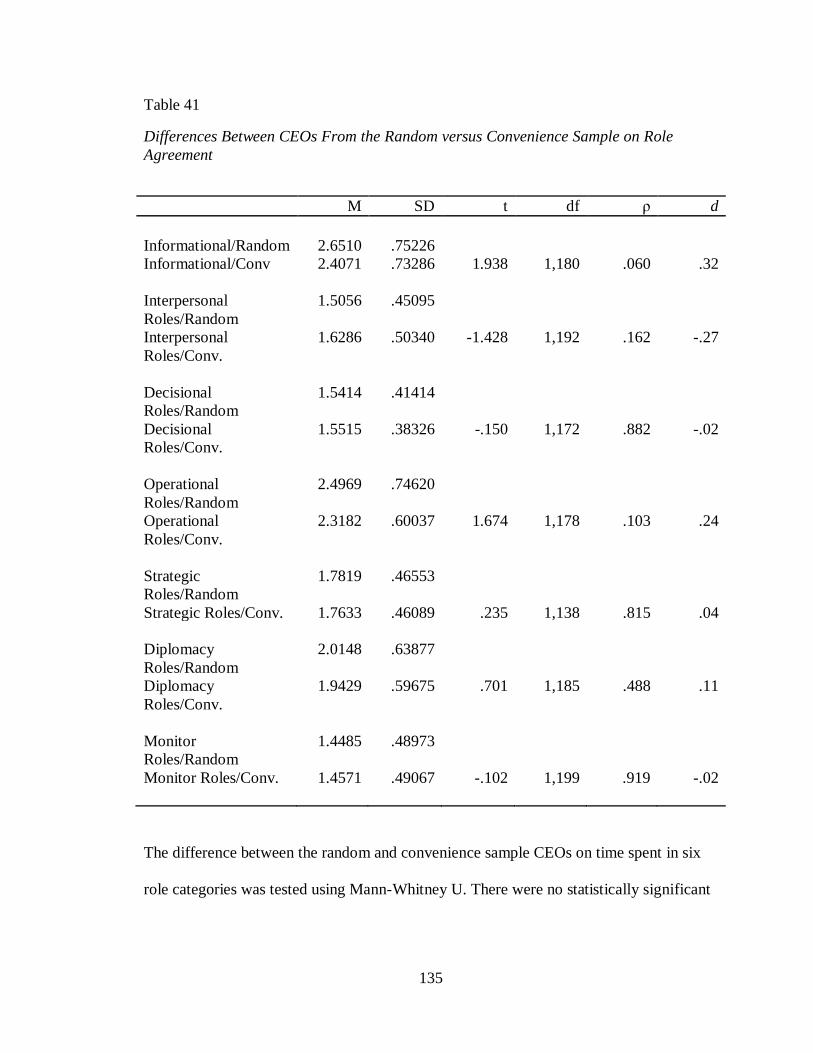
135
Table 41
Differences Between CEOs From the Random versus Convenience Sample on Role
Agreement
M SD t df ρ d
Informational/Random 2.6510 .75226
Informational/Conv 2.4071 .73286 1.938 1,180 .060 .32
Interpersonal
Roles/Random
1.5056 .45095
Interpersonal
Roles/Conv.
1.6286 .50340 -1.428 1,192 .162 -.27
Decisional
Roles/Random
1.5414 .41414
Decisional
Roles/Conv.
1.5515 .38326 -.150 1,172 .882 -.02
Operational
Roles/Random
2.4969 .74620
Operational
Roles/Conv.
2.3182 .60037 1.674 1,178 .103 .24
Strategic
Roles/Random
1.7819 .46553
Strategic Roles/Conv. 1.7633 .46089 .235 1,138 .815 .04
Diplomacy
Roles/Random
2.0148 .63877
Diplomacy
Roles/Conv.
1.9429 .59675 .701 1,185 .488 .11
Monitor
Roles/Random
1.4485 .48973
Monitor Roles/Conv. 1.4571 .49067 -.102 1,199 .919 -.02
The difference between the random and convenience sample CEOs on time spent in six
role categories was tested using Mann-Whitney U. There were no statistically significant
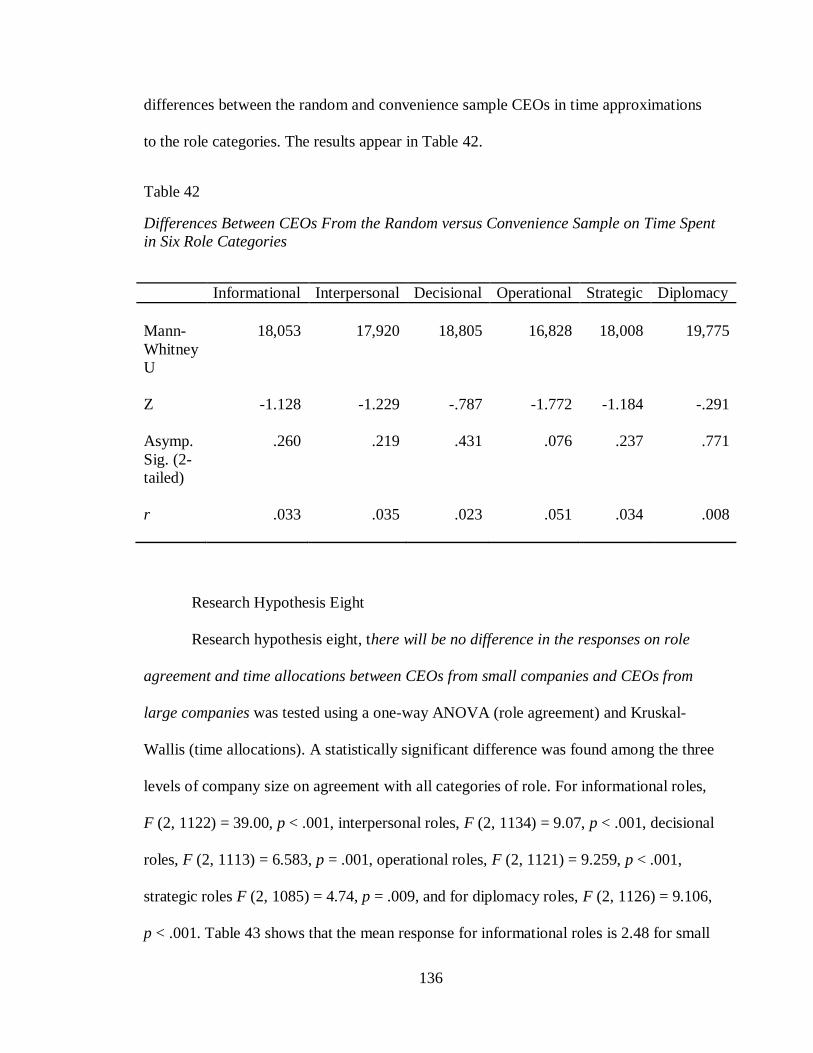
136
differences between the random and convenience sample CEOs in time approximations
to the role categories. The results appear in Table 42.
Table 42
Differences Between CEOs From the Random versus Convenience Sample on Time Spent
in Six Role Categories
Informational Interpersonal Decisional Operational Strategic Diplomacy
Mann-
Whitney
U
18,053 17,920 18,805 16,828 18,008 19,775
Z -1.128 -1.229 -.787 -1.772 -1.184 -.291
Asymp.
Sig. (2-
tailed)
.260 .219 .431 .076 .237 .771
r .033 .035 .023 .051 .034 .008
Research Hypothesis Eight
Research hypothesis eight, there will be no difference in the responses on role
agreement and time allocations between CEOs from small companies and CEOs from
large companies was tested using a one-way ANOVA (role agreement) and Kruskal-
Wallis (time allocations). A statistically significant difference was found among the three
levels of company size on agreement with all categories of role. For informational roles,
F (2, 1122) = 39.00, p < .001, interpersonal roles, F (2, 1134) = 9.07, p < .001, decisional
roles, F (2, 1113) = 6.583, p = .001, operational roles, F (2, 1121) = 9.259, p < .001,
strategic roles F (2, 1085) = 4.74, p = .009, and for diplomacy roles, F (2, 1126) = 9.106,
p < .001. Table 43 shows that the mean response for informational roles is 2.48 for small
137
companies and 2.95 for large companies. The mean response for interpersonal roles is
1.54 for small companies and 1.38 for large companies. The mean response for decisional
roles is 1.51 for small companies and 1.62 for medium companies. The mean response
for operational roles is 2.41 for small companies and 2.63 for medium companies. The
mean response for strategic roles is 1.74 for small companies and 1.84 for medium
companies. Finally, the mean response for diplomacy roles is 1.94 for small companies
and 2.12 for large companies. Post hoc Tukey HSD tests indicate that the small and large
size companies and small and medium size companies differed significantly in their
agreement with informational roles with effect size slightly higher than medium and close
to medium or typical (p < .001, d = .65) and (p < .001, d =.43), respectively. Post hoc
Tukey HSD indicated there were statistically significant mean differences for small and
large size companies on the interpersonal roles, the effect size is between a small and a
medium, or typical effect size (p < .001, d = .37). There were also statistically significant
mean differences for medium and large size companies, the effect size is closer to small
(p = .002, d = .35). Post hoc Tukey HSD indicated there were statistically significant
mean differences for small and medium size companies in the decisional roles, the effect
size is small (p = .001, d = .25). There were also statistically significant mean differences
for medium and large size companies in the decisional roles, the effect size is small (p <
.037, d = .24). In the operational roles post hoc Tukey HSD indicated statistically
significant mean differences for small and medium size companies, the effect size is
small (p < .001, d = .30). In the strategic role categories there were statistically significant
mean differences for small and medium size companies, the effect size is small (p < .007,
d = .22). Finally, post hoc Tukey HSD revealed statistically significant mean differences
138
for small and medium and small and large companies in the diplomacy roles, the effect
sizes are small, (p < .004, d = .21), and (p < .001, d = .29), respectively.
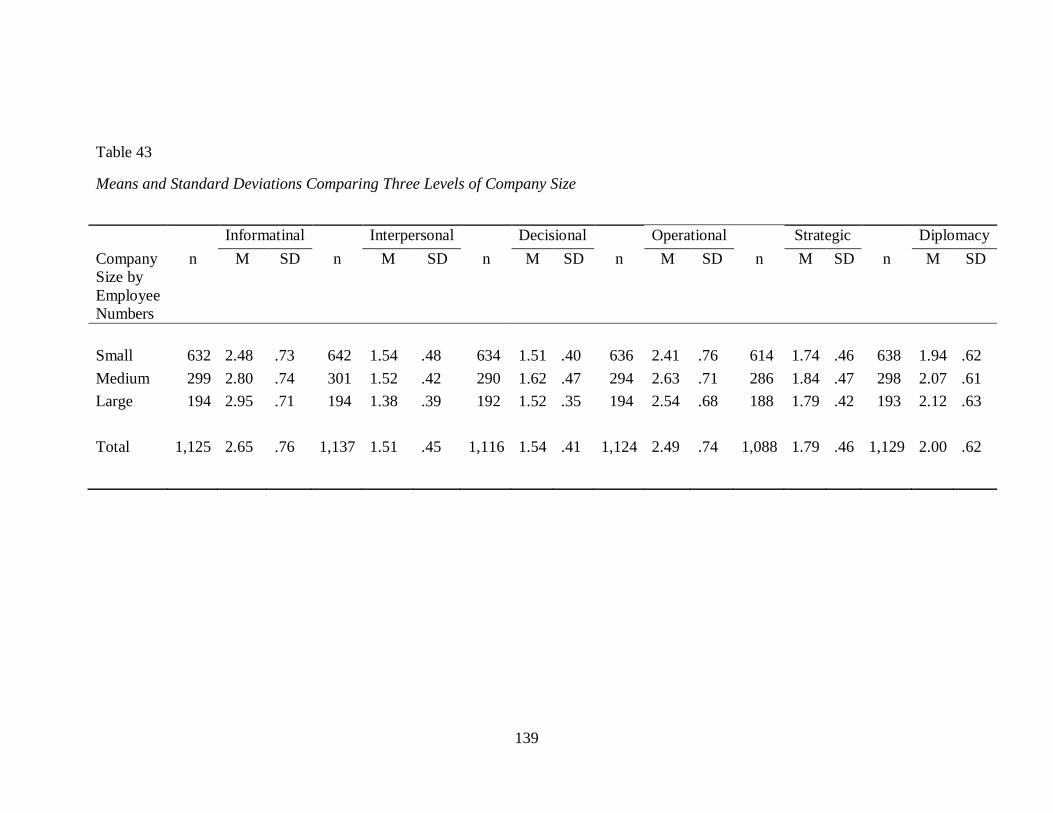
139
Table 43
Means and Standard Deviations Comparing Three Levels of Company Size
Informatinal Interpersonal Decisional Operational Strategic Diplomacy
Company
Size by
Employee
Numbers
n M SD n M SD n M SD n M SD n M SD n M SD
Small 632 2.48 .73 642 1.54 .48 634 1.51 .40 636 2.41 .76 614 1.74 .46 638 1.94 .62
Medium 299 2.80 .74 301 1.52 .42 290 1.62 .47 294 2.63 .71 286 1.84 .47 298 2.07 .61
Large 194 2.95 .71 194 1.38 .39 192 1.52 .35 194 2.54 .68 188 1.79 .42 193 2.12 .63
Total 1,125 2.65 .76 1,137 1.51 .45 1,116 1.54 .41 1,124 2.49 .74 1,088 1.79 .46 1,129 2.00 .62
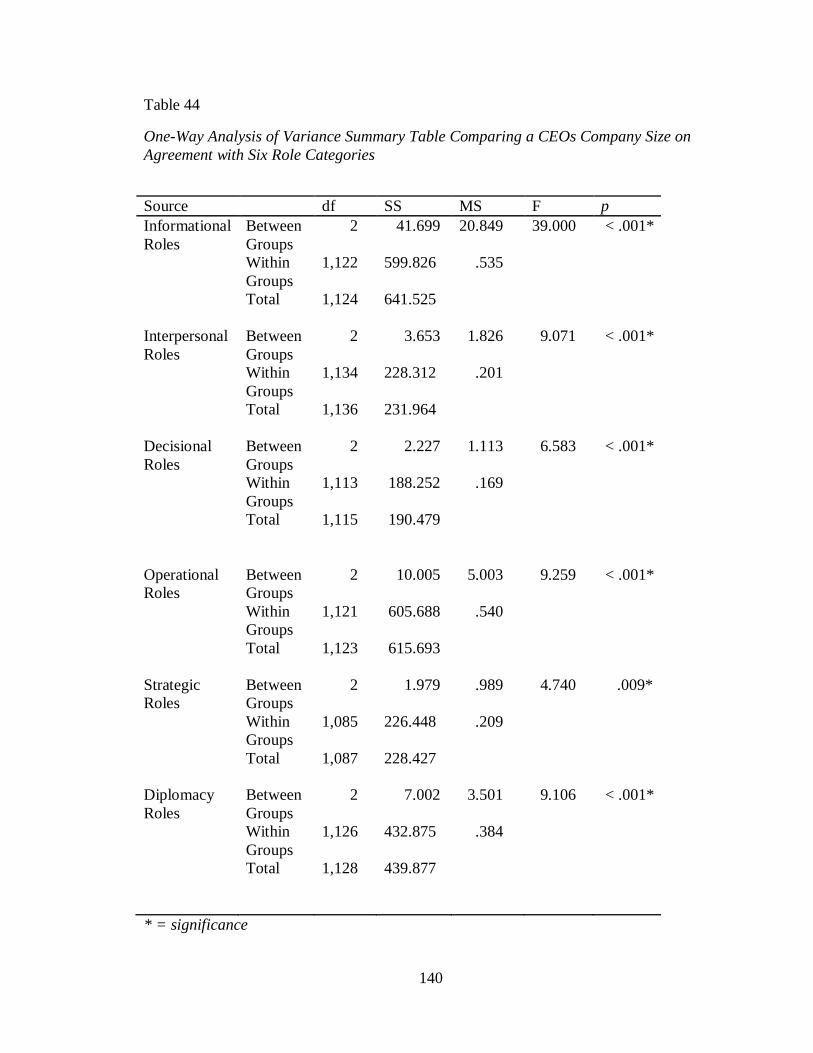
140
Table 44
One-Way Analysis of Variance Summary Table Comparing a CEOs Company Size on
Agreement with Six Role Categories
Source df SS MS F p
Informational
Roles
Between
Groups
2 41.699 20.849 39.000 < .001*
Within
Groups
1,122 599.826 .535
Total 1,124 641.525
Interpersonal
Roles
Between
Groups
2 3.653 1.826 9.071 < .001*
Within
Groups
1,134 228.312 .201
Total 1,136 231.964
Decisional
Roles
Between
Groups
2 2.227 1.113 6.583 < .001*
Within
Groups
1,113 188.252 .169
Total 1,115 190.479
Operational
Roles
Between
Groups
2 10.005 5.003 9.259 < .001*
Within
Groups
1,121 605.688 .540
Total 1,123 615.693
Strategic
Roles
Between
Groups
2 1.979 .989 4.740 .009*
Within
Groups
1,085 226.448 .209
Total 1,087 228.427
Diplomacy
Roles
Between
Groups
2 7.002 3.501 9.106 < .001*
Within
Groups
1,126 432.875 .384
Total 1,128 439.877
* = significance
141
A Kruskal-Wallis nonparametric test was conducted to test for significant
differences between time spent in the role categories based on company size because
there were unequal variances across groups. The test indicated that the three company
sizes differed significantly on interpersonal roles, Χ² (2, N = 1,143) = 30.83, p < .001, on
operational roles, Χ² (2, N = 1,143) = 19.994, p < .001, on strategic roles, Χ² (2, 1,143) =
12.479, p = .002, and on diplomacy roles, Χ² (2, N = 1,142) = 8.028, p = .018. Post hoc
Mann-Whitney tests compared the three levels of company size, using a Bonferonni
corrected p value of .017 to indicate statistical significance. Three Mann-Whitney tests
were run, comparing small and medium size companies, small and large size companies,
and medium and large size companies.
Small and Medium Size Companies. The mean rank for time spent in the
interpersonal role category between small companies (468.05, n = 643) was significantly
lower than medium companies (482.01, n = 302), z = -4.046, p < .001, r = .13, a small
effect size. The mean rank for time spent in the operational role category between small
companies (498.59, n = 646) was significantly higher than medium companies (422.96, n
= 302) z = -4.000, p < .001, r = .13, a small effect size.
Small and Large Size Companies. The mean rank for time spent in the
interpersonal role category between small companies (399.28, n = 646) was significantly
lower than large companies (492.94, n = 195), z = -4.777, p < .001, r = .17, a small effect
size. The mean rank for time spent in the operational category between small companies
(434.62, n = 646) was significantly higher than large companies (375.88, n = 195), z = -
2.987, p = .003, r = .10, a small effect size. The mean rank for time spent in the strategic
142
category between small companies (405.31, n = 646) was significantly lower than large
companies (472.97, n = 195), z = -3.447, p = .001, r = .12, a small effect size.
Medium and Large Size Companies. The mean rank for time spent in the strategic
role categories between medium companies (234.17, n = 302) was significantly lower
than large companies (271.97, n = 195), z = -2.905, p = .004, r = .13, a small effect size.
Summary
This chapter presented the findings of exploratory factor analysis with an
instrument used for the first time. The factor analysis resulted in the elimination of six of
31 roles being investigated and left three of the original six role categories intact.
Changes were made to three other role categories. A seventh factor was eliminated
because it only included two components or roles. This chapter also presented the
statistical results of three research questions and eight hypotheses investigated with data
obtained from the survey instrument. A summary and discussion of the research findings
along with recommendations for future research are presented in the following chapter.
143
CHAPTER FIVE: DISCUSSION OF FINDINGS
The purpose of this study was to address the gap between what is reported in the
literature and what is reported in current practice on the role of CEO. A major goal was
for CEOs to provide insights and help improve the understanding of their role. In addition
this study was intended to further refine and contribute to Mintzberg‘s theory on the role
of CEO. This chapter will first discuss the results related to the three research questions
and the eight hypotheses, and provides a summary of the conclusions. Finally,
implications of the study and recommendations for future research are presented.
CEOs are a notoriously difficult population to study (Beggs & Doolittle, 1988;
Thomas, 1995). Most are exceedingly busy running their companies and most have at
least one level of screening for e-mail messages. A core challenge to the execution of this
research project was creating a strategy for accessing CEOs while maximizing the
chances they might participate. When asked for advice about how to gain access to CEOs
Dr. Mintzberg responded ―No secret Maggie. Just call them.‖ He was absolutely correct.
The study has shown that CEOs are interested in learning what other CEOs say about
their role, and the nature, complexity, and variety of approaches to the position may be a
key factor in motivating CEOs to respond. The importance of this study is evidenced by
the number of CEOs who participated and by the 80 participants who requested copies of
the results. The study has shown that many of the roles described by Mintzberg (1973)
have stood the test of time for over 40 years, yet some have not. It has also shown that
144
newer roles, like the link role described by Lafley (2009) are not as strongly perceived as
CEO roles as we would have believed them to be.
Conclusions
This chapter describes the conclusions gleaned from participant responses to the
research survey. The data were gathered using an instrument developed from an
extensive review of the literature. This chapter is divided into four sections. The first
section is a discussion of the responses to the three research questions, the second section
discusses the results of testing eight research hypotheses, and the third section
summarizes the study findings. A fourth and final section discusses the study‘s
implications for theory, research, and practice on the role of CEO.
Discussion – Three Research Questions
Three core research questions framed this study. They were: 1) What is the role of
CEO in the U.S.?, 2) How much time do CEOs approximate they spend in six categories
of roles?, and 3) What roles are identified by CEOs that were not identified in the
literature on the role of CEO? This section discusses each of these questions in detail,
interpreting what the data indicated for a generalized conclusion, and analyzing possible
explanations for the responses based on the contextual nature of survey research.
Research Question One
Research question one asked – What is the role of CEO in the U.S.? Almost 99%
of participants strongly agreed or agreed that leader (Mintzberg, 1973) is a role of the
CEO. Also considered the most important role of a CEO (Edersheim, 2007; Lafley, 2009;
Mintzberg, 1973; Quarterman et al., 2005) this role was described on the survey as I lead
and motivate my subordinates. The leader role was part of the interpersonal role
145
categories, which included motivator (96% of respondents strongly agreed or agreed with
this description - I create and set a sense of excitement and vitality in the organization,
challenging people to gain new competencies and achieve higher levels of performance)
(Hart & Quinn, 1993) and director (90.3% strongly agreed or agreed with this description
- I make sure the right people are in the right place at the right time doing the right
things) (Gulick, 1937). The leadership roles resonated with participants because leader
may be the image most commonly associated with CEO. In the literature leader was
designated as one of the most important roles of a CEO, touching all other roles within an
organization (Goleman et al., 2002; Mintzberg, 1973; Steiner et al., 1981). The data
obtained in this study support this conclusion. Some participants criticized the survey for
the use of ―I‖ in describing the CEO roles, indicating that the role was less focused on the
CEO as an individual and more focused on the CEO‘s ability to lead and motivate the
teams making up their organizations.
The decisional roles also received a large percentage of strongly agreed or agreed
responses from the participants. These roles include disturbance handler (96.7% strongly
agreed or agreed with this role description - I take charge when my organization is
threatened) (Mintzberg, 1973), task master (96.6% strongly agreed or agreed - I have a
strong focus on results or getting the job done) (Hart & Quinn, 1993), resource allocator
(91.5% strongly agreed or agreed - I decide where my organization will expend efforts
and resources) (Mintzberg, 1973), and staffer (87.7% strongly agreed or agreed - I make
sure the right people are hired for the right positions) (Gulick, 1937). Participant
alignment with the decisional roles seems natural based on the CEOs unique authority to
guide the direction of the organization either through independent decision making or
146
through the process of influencing consensual decision making. CEOs are perceived as
having the final say in guiding the organization (Breene et al., 2007).
The strategic roles also received strong ratings as CEO roles. Vision Setter (Hart
& Quinn, 1993) received the most strongly agreed/agreed responses (93.5% of
participants) to the description I create a sense of identity and mission for my
organization. Also included are creator/maintainer of culture (91.6% strongly
agreed/agreed - I establish and ensure the organization’s culture is consistent with its
strategic focus and plan) (Sashkin & Fullmer, 1988), coordinator, (90.8% strongly
agreed/agreed - I make sure all efforts are coordinated towards the goals and strategic
plan of the organization) (Fayol, 1916; Gulick, 1937), innovator (87.9% strongly
agreed/agreed - I guide the organization into new cycles of innovation) (Galambos,
1995), transformer (83.4% strongly agreed/agreed - I transform the organization as
markets and the external environment change) (Galambos, 1995), strategist (83.1%
strongly agreed/agreed - I craft the organization’s strategy) (Stata, 1988), and planner
(80% strongly agreed/agreed - I do both short-term and long-term planning) (Fayol,
1916; Gulick, 1937).
Strong participant responses to the strategic roles were surprising in light of the
suggestions that CEOs do not have time for strategic planning (Carlson, 1951; Mintzberg,
1973) but may suggest a shift in the CEO role based on the challenges of difficult
economic times and increasingly complex operating environments. Many of the study
participants referred to pre-depression and post-depression sales revenue numbers and
employee numbers, suggesting that many of the organizations were deeply impacted by
the economic challenges of the past few years. While the addition of Chief Strategy
147
Officers to top management teams has been recommended (Breene, et al., 2007),
economic realities may be forcing CEOs to fill this role themselves to insure survival of
the organizations they lead. Timing of the survey may have also influenced responses to
the strategic roles. The survey was sent in late October, 2010, a time when many
companies are finalizing projections for the current year and creating financial and
operating strategies for the coming year. A strong focus on strategy at the time of taking
the survey may have influenced responses to these roles.
The diplomacy role categories were more controversial in terms of agreement by
the participants. Figurehead received the majority of strongly agree/agree responses in
this category with 87.5% (I represent the organization in formal matters) (Mintzberg,
1973). Liaison received 74.2% strongly agreed/agreed responses (I interact with peers
and others outside the organization to gain favors and information) (Mintzberg, 1973),
and link received 66.9% strongly agreed/agreed responses (I link the external world to the
world inside the organization) (Lafley, 2009). The link role was described by A. G.
Lafley, former CEO of Proctor and Gamble in 2009 as the one role that only the CEO can
perform. This new role may resonate more strongly with CEOs from large, global
organizations like Proctor and Gamble, however, in this study the CEOs from privately-
held companies actually agreed more strongly with the link role than the CEOs from
publicly-held companies.
The operational roles were fairly controversial yet organizer (I make sure
deadlines are met) (Fayol, 1916) and analyzer (I focus on efficient management of the
internal operating system in the interest of serving existing products/markets) (Hart &
Quinn, 1993) received 65.6% and 60.8% strongly agree/agree responses, respectively.
148
Controller (I make sure projects are completed on time) (Fayol, 1916) received 55.1%
strongly agree/agree responses while almost 30% of participants neither agreed nor
disagreed that this is a CEO role. Operator (I make sure that day-to-day operations are
being completed in a satisfactory manner) (Howe, 1988) was even more controversial. Of
the responses, 47.2% strongly agreed/agreed, 25.1% neither agreed nor disagreed, and
27.7% disagreed or strongly disagreed that operator is a CEO role. The controversy in
these roles may be the result of organizations that employ COOs (chief operating
officers) or other c-level executives responsible for operational activities. It is also
possible that many CEOs do not feel it is their role to direct the day-to-day activities of
their organizations and in many cases they may not have time to do this. It may be more
accurate to view the CEO role as one that guides the general direction of the organization
from a 50,000 foot view, with much less involvement in day-to-day details.
The informational role category, which was changed substantially by factor
analysis, was the most controversial. While negotiator (I am compelled to enter
negotiations on behalf of my organization) (Mintzberg, 1973) received 65.4% strongly
agree/agree responses, the remaining roles received less than 50% strongly agree/agree
responses. Of responses to the spokesperson role (I disseminate the organization’s
information into the business world) (Mintzberg, 1973), 46.8% strongly agreed/agreed,
23.3% neither agreed nor disagreed, and 29.9% disagreed or strongly disagreed that this
was a CEO role. Technical expert (I am the expert on product and market) (Lau et al.,
1979) was split 38.4% strongly agreed/agreed, 32.4% neither agreed nor disagreed, and
29.2% disagreed/strongly disagreed with this role. Finally, problem solver (I am the
person who solves the organization’s problems) (Lau et al., 1979) was split 36.1%
149
strongly agreed/agreed, 39.1% neither agreed/disagreed, and 24.8% of participants
disagreed/strongly disagreed that this is a CEO role.
In today‘s business environment the negotiator role may be delegated to corporate
attorneys more qualified to navigate the complexities of legal negotiations. This may be
the result of a much more litigious and complicated business environment today than
during the 1970s when Mintzberg identified this as a CEO role. The spokesperson role is
frequently the responsibility of the investor or public relations department and this may
partially explain disagreement with this role. The roles of technical expert and problem
solver are likely delegated to individuals more familiar with the day-to-day operations of
an organization making these roles more controversial among participants. In high-
technology and biotechnology firms engineers and scientists are frequently the experts in
the technical aspects of the business while CEOs are viewed as the experts in business
management and leadership.
Factor analysis results indicated that four roles did not load in this category and
two that loaded together were not used in the final analysis of data. Four of these roles,
monitor (I receive and collect information enabling me to develop a thorough
understanding of my organization) (Mintzberg, 1973), disseminator (I transmit special
information into the organization (Mintzberg, 1973), entrepreneur (I initiate changes
within the organization) (Mintzberg, 1973), and consultant (I provide advice on issues
that arise within the organization) (Lafley, 2009) received strongly agreed/agreed
responses in excess of 90%. Conflict handler (I handle conflicts that arise between
individuals and outside organizations) (Castaldi, 1986), and commander (I give orders to
150
employees) (Gulick, 1937), received strongly agree/agree responses from 76.6% and
62.0% of participants, respectively.
In summary, all 31 roles included on the survey received some strongly
agree/agree responses and all 31 roles also received neither agree nor disagree, disagree,
and strongly disagree responses. Roles with less than 50% strongly agree/agree responses
totaled four. Combined with the six roles rejected by factor analysis the total number of
roles could be reduced to 21. The leader role was the most agreed-upon role and problem
solver was the least agreed upon by the study participants. The interpersonal role
categories were most agreed-upon by all participants while the informational role
categories were least agreed-upon. Many of the CEO roles identified in the twentieth
century still reflect the role of the CEO in the twenty-first century, even though the
business environment has changed significantly. In addition, new roles have been
identified confirming the complex and evolving nature of the role of CEO (Lafley, 2009).
Research Question Two
Research question two asked how much time do CEOs approximate they spend in
six categories of roles? In direct conflict with Mintzberg‘s theory the participants
indicated they spend 21.0% of their time in the strategic roles (Table 22). Mintzberg
(1973) argued that CEOs do not have time for strategy. There are many possible reasons
for the substantial amount of time study participants allocated to the strategic roles. It is
possible, but hopefully unlikely, that the responses were based on how CEOs think they
should allocate their time. It is also possible that the responses had something to do with
the timing of this survey. The survey was sent late October through late November, 2010,
which is the time when many companies are finalizing current year projections and
151
creating budgets and strategic plans for the following fiscal year. The participants may
have been spending more time focused on strategy when they received this particular
survey, influencing their responses. It is also possible that in light of the current economic
conditions CEOs need to be and indeed are spending more focused time on strategy. It is
possible that the complexity and uncertainty of the business environment today has
forced CEOs to finally focus their time on strategy while leaving less urgent roles, like
operations, to COOs, CFOs, and CIOs.
Interpersonal, decisional, and operational roles received almost equal allocations
of time, 17.5%, 18.1%, and 18.0%, respectively. One might expect more time to find
more time spent in the interpersonal roles (leader, motivator, and director) based on the
strong agreement with this role category. Conversely, the controversy within the
operational roles would suggest less time might be spent in this category, however, this is
not the case. Further exploration of this inconsistency might be best studied using
interviews or other qualitative methods to understand why CEOs spend time in roles they
may not necessarily believe to be their roles.
Participants spent 14.6% of their time in the informational roles. This may be due
to the use of investor relations and public relations departments today that might not have
been used 40 years ago. Participants spent the least amount of time in diplomacy roles
(10.8%), which included link, liaison, and figurehead. The link role did not resonate
strongly with participants, perhaps because there were more privately-held company
CEOs than publicly-traded company CEOs in this study.
152
Research Question Three
Research question three asked what roles are identified by CEOs that were not
identified in the literature on the role of CEO? Other roles suggested by participants that
are different from the roles included on the survey include coach, mentor, cheerleader,
succession planner, consensus builder, liaison with Board of Directors, community
involvement and outreach, driver of sustainability, investor relations, financial oversight,
fund raising, enabler, chief storyteller, recruiter, thought leader, industry positioner, and
chief embodiment of the values of the organization. The chief storyteller role was also
suggested in the pilot study of the survey and included the description telling stories to
reinforce the culture. The Board of Directors liaison role was mentioned by several
participants as a key role of the CEO, yet participants did not feel the survey reflected
this important role.
It is not surprising that the CEOs role as liaison with the Board of Directors was
mentioned. In light of scandals like Enron, Boards are now held to higher levels of
accountability than ever before and may be more involved with the CEO than they were
prior to Sarbannes Oxley (2000). The current focus on corporate social responsibility and
increased regulatory pressure created by the Dodd-Frank Wall Street Reform and
Consumer Protection Act (the Dodd-Frank Act), intended to enhance corporate
governance, market structure, and corporate disclosure (www.BDO.com; Woods, 2011)
may increase the difficultly in accessing CEOs from publicly-traded companies. The
extensive rule-making and regulation forced upon public companies certainly may
influence the complexity of the CEO role, in addition to putting the CEO in a defensive
posture.
153
The new roles identified by participants are important for future development of
the survey instrument and for theory-building or theory refinement related to the role of
CEO. Descriptions of these roles are necessary for refining the survey instrument and
may be best obtained through a focus group of CEOs.
Eight Research Hypotheses
There were eight research hypotheses for this research study, and they were as
follows:
H1) There is no difference between gender, agreement with the 31 role descriptions, and
time allocated to the six role categories.
H1a) Female CEOs will report they spend more time in interpersonal roles than their
male counterparts.
H1b) Female CEOs will report they spend less time in operational roles than their male
counterparts.
H2) CEOs from public companies will report they spend less than 10% of their time in
strategic role categories.
H3) Agreement with and time spent in the role categories will not differ depending upon
the CEOs degree major or industry background.
H4) There will be no difference in the way CEOs spend their time between CEOs with
other C-level executives working for them, and those without C-level executives.
H5) There will be an association between age, years in current job, years as a CEO, last
degree earned, company size and agreement with each role category.
H6) There will be no difference in the responses on role agreement and time spent in the
role categories between CEOs from privately-held versus publicly-held companies.
154
H7) There will be no difference in the responses on role agreement and time allocations
to role categories between a convenience sample of CEOs and a random sample of
CEOs.
H8) There will be no difference in the responses on role agreement and time allocations
between CEOs from small companies and CEOs from large companies.
This section discusses the research results and conclusions for each of the eight
hypotheses. Possible explanations for the resulting conclusions are provided.
Research Hypothesis One
There is no difference between gender, agreement with the 31 role descriptions,
and time allocated to the six role categories was partially supported by the findings.
There were no statistically significant differences between male and female CEOs in
terms of time spent in the six role categories. Males and females showed statistically
significant differences in agreement with the operational, strategic, and diplomacy role
categories, however effect sizes were small to medium, d = .23, .29 and .39, respectively,
leading to the conclusion that there is very little practical significance in the response
differences between male and female CEOs. In all cases the female participants agreed
more strongly with the roles than their male counterparts, and female participants agreed
more strongly with all of the roles than male participants.
Most empirical research on female CEOs focuses on the glass ceiling or on
differences in compensation structure between males and females. The focus of this
study, CEO roles and time allocations to roles does not appear in current research on
CEOs. The findings of this research suggest that male and females CEOs may not be
substantially different in terms of how they execute the role of CEO. It seems logical that
155
female CEOs would need to know the role as well as their male counterparts. This is
further supported by Research Hypotheses One (a) and (b).
Research Hypotheses One (a) and One (b)
Female CEOs will spend more time in interpersonal roles than their male
counterparts and female CEOs will spend less time in operational roles than their male
counterparts were supported by the evidence, but the differences were minimal. It seems
there are only minor differences in role agreement and time allocated to roles between
male and female CEOs and this is not surprising. Female CEOs may hold the CEO
position because they understand the expectations of the role just as well as their male
counterparts.
Research Hypothesis Two
CEOs from public companies will spend less than 10% of their time in strategic
role categories was not supported by the data. CEOs from public companies were not
substantially different than CEOs from private companies in their time allocations (Table
28). This conflicts with the belief that the ownership status of a company impacts the role
of the CEO (Mintzberg, 1973). It seems that the impact of publicly-traded ownership may
not be as significant today as it was in the past. More likely, today private company
CEOs experience similar pressures as their public company counterparts, a result of the
complex business environment and strong competition.
Research Hypothesis Three
Agreement with and time spent in the role categories will not differ depending on
the CEOs degree major or industry background was not supported. There were small
differences in agreement with the informational roles between finance majors and
156
technical/engineering majors, with the latter agreeing more strongly that these are CEO
roles. There were also small differences in agreement with the decisional role category
between operations majors and technical/engineering majors, with the latter agreeing
more strongly that these are CEO roles. Overall, there was stronger agreement on the
interpersonal and decisional role categories, with means ranging from 1.48 to 1.66 (1 =
strongly agree) than the other categories. Time allocations were also different. Operations
and technical/engineering majors had higher mean ranks in the operational role category
than finance majors. In terms of practical significance, all of the effect sizes were small.
Research Hypothesis Four
There will be no difference in the way CEOs spend their time between CEOs with
other C-level executives working for them, and those without C-level executives was not
supported. There were statistically significant differences with small effect sizes in the
interpersonal, operational, strategic, and diplomacy categories. In all categories the CEOs
with other C-level executives had higher mean ranks than those without other C-level
executives, with the exception of the operational roles. This finding may indicate that
CEOs who utilize other C-level executives need to spend less time in operational roles
than those who do not.
Research Hypothesis Five
There will be an association between age, years in current job, years as a CEO,
last degree earned, company size, and agreement with each role category was not
supported by the data. These variables explained a very insignificant amount of the
variance in role agreement and time allocations across the participants. This result leads
to a very important question, what factors do influence role agreement and time spent in
157
roles by CEOs? This question remains unanswered by this research study. One could
speculate that the contextual nature of business may influence this role including the
economy, the business cycle, and the uniqueness of specific industries. Some have
indicated that the CEO‘s personality influences the role and the way time is allocated
(Hart & Quinn, 1993; Zaccaro, 2001). It is also possible that multiple regression was not
the appropriate model for understanding these relationships.
Research Hypothesis Six
There will be no difference in responses on role agreement and time spent in the
role categories between CEOs from privately-held versus publicly-held companies was
not supported. There were small differences in role agreement in the informational,
interpersonal, and diplomacy role categories. Public company CEOs agreed more
strongly with the interpersonal roles and private company CEOs agreed more strongly
with the informational and diplomacy roles. While the differences were small they seem
logical. A CEO in a publicly-traded company is more likely to be known by name than a
CEO in a privately-held company therefore, the public company CEO may identify more
strongly with the leader role due to his/her notoriety. Private company CEOs are less
likely to have investor relations or public relations departments handling information
requests; this may make the informational roles resonate more with private company
CEOs. There were small differences in time allocations between the CEOs in the
interpersonal role category.
Research Hypothesis Seven
There will be no difference in the responses on role agreement and time
allocations to role categories between a convenience sample of CEOs and a random
158
sample of CEOs was supported by the data. At the beginning of this research project the
researcher believed the most productive way to access CEOs would be through personal
contacts (Martinko & Gardner, 1985; Thomas, 1995). The problem with this approach
was the limited sample size. Thus, a database of companies that included CEO e-mail
addresses was purchased. This random sample was much more fruitful than anticipated
and led to a stronger study, yet there were no significant differences between the two
groups of respondents.
Research Hypothesis Eight
There will be no difference in the responses on role agreement and time
allocations between CEOs from small companies and CEOs from large companies was
not supported by the data. In fact there were statistically significant differences on
agreement in all role categories across three levels of company size based on employee
numbers, small, medium, and large. Company sizes were defined by the World Bank
standards of small (less than 100 employees), medium (between 100 and 500 employees),
and large (over 500 employees) (www.worldbank.com).
There were differences in time allocations between small and medium size
companies in the informational (medium effect size), operational, decisional, strategic,
and diplomacy role categories (small effect size). Small and large size companies differed
in the interpersonal (medium effect size), informational, operational, and strategic
categories (small effect sizes). Medium and large size companies differed in the
interpersonal and decisional categories (small effect sizes). These differences lend
support to research on CEO failure rates and the thesis that ―something changes when a
company reaches a certain size that makes it somehow different to manage‖ (Tuck &
159
Earle, 1996, p. 19). This may suggest that CEOs have difficulty transitioning to
companies that are substantially larger or smaller than they are accustomed to leading.
Summary of the Findings
This section will summarize the findings from the research questions and
hypotheses by discussing potential factors influencing participant agreement with the
roles and time allocated to the role categories. It will also identify questions that remain
unanswered and discuss the limitations of this study.
Agreement with Roles
Mintzberg‘s (1973) theory about the role of CEOs was a foundational theory for
the conduct of this research. All ten of the roles identified by Mintzberg received support
by the study participants as roles of the Chief Executive Officer. Factor analysis indicated
that three of the roles, monitor, disseminator, and entrepreneur, may not be measuring
what they were intended to measure. Two roles, spokesperson and negotiator were
controversial roles from the CEOs perspectives perhaps because these roles can be
delegated to investor relations and legal departments. The data revealed that the
informational role category may not be as relevant today as it was during the 1970s.
While Mintzberg (1973) disagreed with Gulick (1937) and Fayol (1916) about the
practice of management as science, their seven roles, commander, director, staffer,
organizer, controller, coordinator, and planner still received substantial support from
CEOs as roles that are reflective of the CEO. Four roles suggested by Hart & Quinn in
1993 received support as being roles of a CEO: motivator, task master, analyzer, and
vision setter. The strategic roles of innovator and transformer (Galambos, 1995),
strategist (Stata, 1988) and creator/maintainer of culture (Sashkin & Fullmer, 1988) also
160
received support as CEO roles. Link and consultant (Lafley, 2009) were supported as
CEO roles, along with conflict handler (Zaccaro, 2001). Roles receiving less support
included: technical expert (Lau et al., 1979), problem solver (Lau et al., 1979), and
operator (Howe, 1988). Of the 31 roles suggested by the literature review and used in the
survey instrument, 26 roles received strong support as being CEO roles from the study
participants.
Though not the purpose of this research it now seems possible to begin the
process of updating and refining theory that informs the role of CEO. Roles that no
longer resonate with CEOs like technical expert, problem solver, and operator may now
be considered the roles of other C-level executives within an organization. New roles
including Board of Director liaison and chief embodiment of the values of the
organization can be added as roles reflective of the changed nature of the CEO role.
Time Allocated to the Role Categories
This study is believed to be one of the first to ask CEOs to allocate their time
across role categories. Some researchers have attempted to understand how CEOs spend
their time while observing them at work while others have asked CEOs about the
importance of the ten roles identified by Mintzberg (Beggs & Doolittle, 1988; Mintzberg,
1973; Tengblad, 2006). It was surprising to find 21% of participant‘s time spent in
strategic roles and 18% of their time spent in operational roles. The operational roles
were not strongly agreed upon as the role of CEO. Table 45 provides a summary of the
time allocations from this research compared to other studies on CEOs that provided
time-related data.
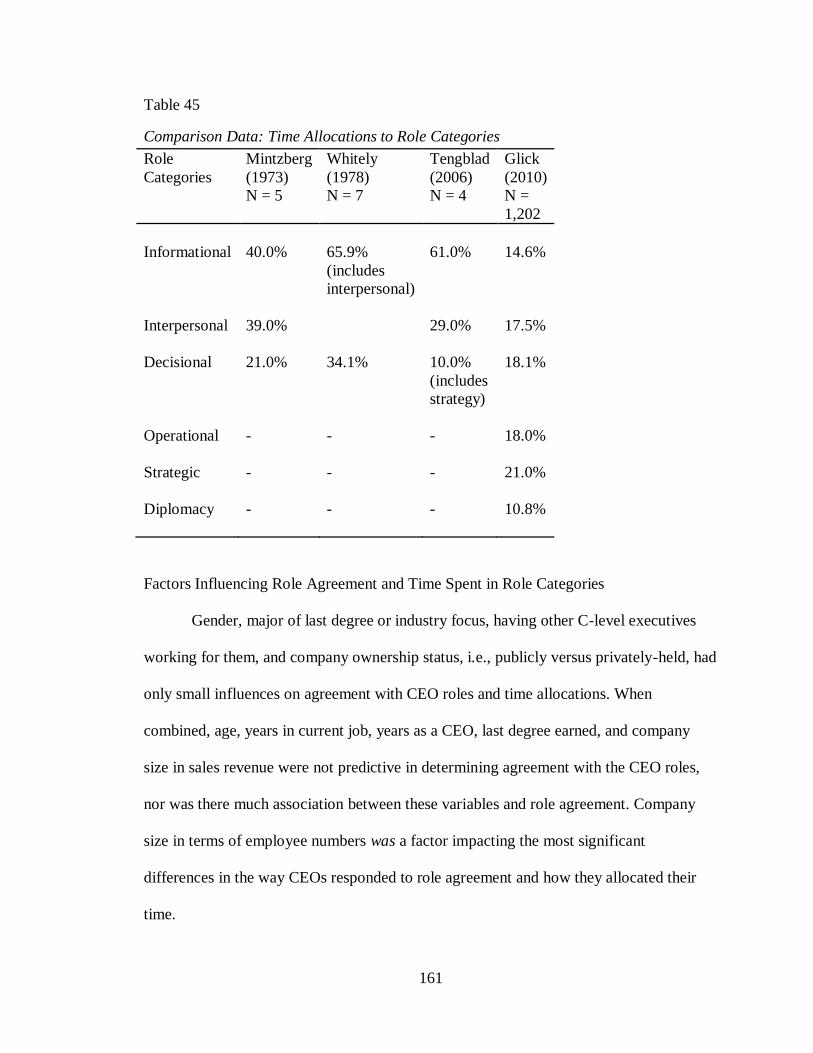
161
Table 45
Comparison Data: Time Allocations to Role Categories
Role
Categories
Mintzberg
(1973)
N = 5
Whitely
(1978)
N = 7
Tengblad
(2006)
N = 4
Glick
(2010)
N =
1,202
Informational 40.0% 65.9%
(includes
interpersonal)
61.0% 14.6%
Interpersonal 39.0% 29.0% 17.5%
Decisional 21.0% 34.1% 10.0%
(includes
strategy)
18.1%
Operational - - - 18.0%
Strategic - - - 21.0%
Diplomacy - - - 10.8%
Factors Influencing Role Agreement and Time Spent in Role Categories
Gender, major of last degree or industry focus, having other C-level executives
working for them, and company ownership status, i.e., publicly versus privately-held, had
only small influences on agreement with CEO roles and time allocations. When
combined, age, years in current job, years as a CEO, last degree earned, and company
size in sales revenue were not predictive in determining agreement with the CEO roles,
nor was there much association between these variables and role agreement. Company
size in terms of employee numbers was a factor impacting the most significant
differences in the way CEOs responded to role agreement and how they allocated their
time.
162
It is likely other factors may have more influence on the role of CEO than were
considered by this study. These factors include current economic conditions, availability
of capital, whether a company has just been sold or is in acquisition mode, and company
stability (existing companies versus start-ups). Several CEOs in this study indicated that
they were spending more time on financial issues, a direct result of the difficult economic
conditions they face. Some CEOs indicated that managing the Board of Directors took a
substantial amount of their time yet did not see this role reflected in the categories
presented in the survey.
Limitations of the Study
There were many factors that limited this study on CEOs. The database purchased
was done so based on the availability of CEO e-mail addresses, however many
companies are still able to keep this information confidential. In some cases the e-mail
addresses included info as the name so these went to a general e-mail address that most
likely never reached the CEO. Many CEOs have their e-mail screened by assistants and it
is possible many CEOs never saw the survey. While there were a wide variety of
company sizes and industries, private companies outnumbered public companies six to
one. As expected, male CEOs outnumbered female CEOs seven to one.
There are many control variables that may have provided additional depth to this
study. Industry-specific variables not controlled for in this study include geographic
region(s) of the organization, industry sector, products imported or exported by the
organization, whether or not the organization is service-oriented, organizational financial
health, business life-cycle placement and age of organization, and organizational culture,
i.e., whether it is a hierarchical or team-based organization. Individual CEO characteristic
163
variables that were not controlled for in this study include schools attended, roles
previously held, and number of job or industry changes. Additional research that controls
for these organizational or individual-specific variables may provide new insight into the
role of CEO and the way CEOs choose to spend their time.
Many of the comments received by CEOs indicated that the roles on the survey
were too limiting and did not cover the breadth of roles that CEOs are expected to engage
in. One CEO indicated that if they were doing an optimal job they would be doing all of
the roles included on the survey. It is impossible to know whether the participants
answered the questions honestly or provided the answers that they believed were most
favorable. There is also no way to know how accurate the time allocations were. The
study was conducted only from the CEOs perspective. The ability of participants to ―self-
select‖ can lead to errors including undermining ―the extent to which the composition of
the panel mirrors the composition of the general public and likely leads to biased results‖
(Dillman et al., 2007, p. 338). The expectations of boards of directors and other C-level
executives were not considered for this study. This study was limited to CEOs in the U.S.
so the results may not be indicative of CEOs from other countries. Use of the survey
instrument was a pilot study—it was designed specifically for this research, limiting its
validity and reliability (Dillman et al., 2007). Other than the data obtained through
exploratory factor analysis there are no other measures available to support the
instrument‘s validity and reliability (Gliner et al., 2009).
164
Implications and Recommendations for Future Research
This final section will discuss the implications for theory, research, and practice
while making recommendations for future research to enhance the body of knowledge
about the role of CEO.
Implications for Theory
One goal for this study was further refinement of Mintzberg‘s theory of the role of
CEO. According to Lynham (2002) theory requires an on-going process of refinement
and development which ―ensures that the relevance and rigor of the theory are
continuously attended to and improved on by theorists through further inquiry and
application in the real world‖ (p. 234). Mintzberg‘s theory was built deductively using a
―research-to-theory‖ strategy (Lynham, 2002, p. 225). During the 1970s and early 1980s
many individuals contributed to the theory by using ―theory-to-research‖ strategies, yet
many of these theories were not proven to be useful in practice, thus leaving a gap that
was the focus of this study (Lynham, 2002, p. 225).
Using the general method of theory building described by Lynham (2002) the on-
going process of theory development requires five phases including, conceptual
development (the theory was originally conceived by Mintzberg in 1973),
operationalization, confirmation or disconfirmation, and application. The
operationalization phase requires testing in real-world situations. Many doctoral students
attempted this phase leading to conflicting results, perhaps the result of small sample
sizes. Confirmation or disconfirmation is the intentional design of research for this
purpose, that is, to confirm or disconfirm a theory. This particular study has provided
data that both confirm and disconfirm Mintzberg‘s original theory. It has also provided

165
confirmation and disconfirmation by roles proposed by other researchers, hopefully
expanding and updating Mintzberg‘s original theory about the role of CEO. A next phase
for this research is the application phase in which a real-world CEO would test the
effectiveness of the time allocations and the role categories within their organization.
Finally, all theories require ongoing refinement and development to ensure their
applicability to real world situations (Lynham, 2002).
Further refinement and development of a theory of the role of CEO may be
beneficial to HRD professionals and HRD directors who are responsible for change
interventions and for creating CEO succession plans. A clear understanding of the CEOs
role and time spent in roles may be useful in interventions designed at enforcing
organizational culture while at the same time making changes necessary for the
continuing advancement of the organization. To enable the identification and
development of future CEOs a theory that explains the role of CEO under a variety of
individual and organizational variables may be extremely practical. Theory-building may
also be improved with new research that controls for organizational and individual
characteristics not addressed by this study, but discussed in the limitations section.
Implications for Research
Data collected during the survey can be utilized to further this study in several
ways. One of the unanswered questions resulting from this study is what factors do
influence role agreement and time spent in roles by CEOs? While company size based on
employee numbers resulted in statistically significant differences in responses to role
agreement and time allocations, is there additional influence based on industry? Is there a
relationship between industry, company size, and agreement with roles and time
166
allocations to role categories? While not part of my original research these findings could
be important for CEOs in specific industry categories. This information could be
particularly important for a CEO switching jobs in a new industry where roles and time
allocations may be significantly different than those in their current job. Perhaps this
information could help CEOs transition more efficiently, helping to reduce excessive
turnover.
The unsolicited qualitative data collected were not analyzed for this study. The
unsolicited insights, remarks, criticisms, and words of encouragement were some of the
most interesting data obtained, yet they were not consistent with the quantitative/post-
positivist methodological strategy of this study. To deeply understand the factors
influencing role and time allocations, in-depth discussions with CEOs are necessary.
While the hard, quantitative data are difficult to argue with, it is impossible to delve
deeper for more meaning and understanding. For example, while the data showed little
differences between male and female CEOs, intuitively it seems there must be interesting
and insightful differences in the experiences and expectations of both male and female
CEOs. These experiences can only be learned through qualitative methods. Research on
the role of CEO has been criticized for its failure to find similarities while only looking
for differences (Hales, 1999). The focus on differences may be due to the nature of
hypothesis testing. Perhaps qualitative methods would be more appropriate for
identifying similarities in the role of CEO.
Further research controlling for different individual and organizational variables
may be extremely useful for CEOs, Boards of Directors, HRD professionals, and HR
directors. Research focused on the perspective of other C-level executives may be useful
167
not only for COOs, CFOs, and CIOs, but also for the CEOs they work for, Boards of
Directors, HRD professionals, and HR directors. Especially for CEOs understanding the
gaps between their perception of their role and the way employees and Boards perceive
their role could be critical for closing the gap between role expectations and actual
performance of the role.
Implications for Practice
The results of this study could have practical implications for a variety of
stakeholders including HR directors, Boards of Directors, CEOs, and a variety of other
stakeholders who are impacted by the leadership of organizations, including employees,
investors, and the public.
HR directors could utilize the CEO role information in creating job descriptions
or evaluation plans for CEOs within their organizations. The role information could also
be used for succession planning purposes. A refined theory of the role of CEO may help
to identify roles that are necessary when certain organizational conditions exist. Boards
of Directors could use the roles and the time allocations as benchmarks for the CEOs
whose performance they evaluate. They may use the time information to compare the role
of the CEO with other C-level executives within the organization, making sure that
efforts are not duplicated.
A working CEO could use the results of this research in three different ways.
First, the roles identified and agreed-upon could be used as a benchmark for the CEOs
own job description. There may be roles identified is this study that the CEO had not
considered part of their job. Further, a CEO interested in expanding research on the role
of CEO might identify new roles, providing clarity to the role of CEO while contributing
168
knowledge that informs continual refinement of the theory. A third practical use of the
study findings is the time allocations. A CEO could use the time allocations as a
benchmark for how they spend their time at work, potentially identifying areas that are
important to the position but that need more concentrated focus. This may prevent a CEO
from spending time in roles they are most comfortable in, where they may duplicate
efforts of other c-level executives.
Employees, investors, and consumers who depend upon organizations for basic
needs as well as creature comforts are also impacted by this research. For example, CEOs
who know what the role is and how to allocate their time may be more efficient and
effective in leading their organizations. Hopefully this leads to higher quality products
and financial returns that benefit investors with direct interests in the organizations as
well as the economy in general.
Conclusion
This chapter has described the conclusions from participant responses to the
research survey by discussing responses to the three research questions and presenting the
results of testing the research hypotheses. The study findings were summarized and the
implications for theory, research, and practice were presented. While this study has not
revealed significant changes to the role of the CEO it has added new roles, confirmed and
disconfirmed CEO roles that are over 40 years old, and has supported the thesis of a
complex and evolving nature of the role of CEO. This study has provided data that
further refine Mintzberg‘s theory on the role of CEO. Data on how CEOs allocate their
time has been added to the body of knowledge on the role of CEO and have confirmed
the impact of company size on the role of CEO. Hopefully this study has created
169
opportunity and interest in future research on CEOs and has provided insight on what
CEOs today perceive as the role of Chief Executive Officer.
170
REFERENCES
Adams, S. M., Gupta, A., & Leeth, J. D. (2009). Are female executives over-represented
in precarious leadership positions? British Journal of Management, 20, 1-12.
doi:10.1111/j.1467-8551.2007.00549.x
Ahmed, S. (2005). Desired competencies and job duties of non-profit CEOs in relation to
the current challenges. Journal of Management Development, 24(10), 913-928.
doi:10.1108/02621710510627055
Allgood, S. & Farrell, K. A. (2003). The match between CEO and firm. Journal of
Business, 76(2), 317-341. doi:10.1086/367752
Antonioni, D. (2003). Leading with responsibility. Industrial Management, Nov/Dec,
2003, 8-15.
Apospori, E., Papalexandris, N., & Galanaki, E. (2005). Entrepreneurial and professional
CEOs: Differences in motive and responsibility profile. Leadership &
Organization Development Journal, 26(2), 141-162.
doi:10.1108/01437730510582572
Argyris, C., & Schon, D. (1978). Organizational Learning: A Theory of Action
Perspective. Reading, MA: Addison-Wesley.
Bartholomew, S. & Smith, A. D. (2006). Improving survey response rates from chief
executive officers in small firms: The importance of social networks.
Entrepreneurship Theory and Practice, Journal of Small Business Management,
(January, 2006), 83-96.
Bass, B. M. (1985). Leadership and Performance Beyond Expectations. New York: Free
Press.
Bass, B. M. (1990). Bass & Stogdills’s Handbook of Leadership: Theory, Research, and
Managerial Applications. (3rd
ed.) New York, NY: The Free Press.
Bass, B. M. (1998). Transformational leadership: Industry, military, and educational
impact. Mahwah, NJ: Lawrence Erlbaum Associates.
BDO Knows: SEC (2011). The Newsletter from BDO’s National Assurance Practice.
Retrieved from: www.bdo.com.
171
Beggs, J. M. & Doolittle, D. C. (1988). Mintzberg revisited: A study of chief executive
officers. Leadership and Organization Development Journal, 9(6), 17-21.
doi:10.1108/eb053648
Bennett, E. E. & Bierema, L. L. (2010). The ecology of virtual human resource
development. Advances in Developing Human Resources, 12(6), 632-647. doi:
10.1177/1523422310394789
Biddle, B. J. (1986). Recent developments in role theory. Annual Review of Sociology,
12, 67-92. doi:10.1146/annurev.so.12.080186.000435
Biddle, B. J. and Thomas, E. J. (Eds.) (1966). Role theory concepts and research. New
York, NY: John Wiley & Sons.
Bing, J. W., Kehrhahn, M., & Short, D. C. (2003). Challenges to the field of human
resource development. Advances in Developing Human Resources, 5(3), 342-351.
doi:10.1177/1523422303254671
Block, P. (1993). Stewardship: Choosing Service over Self-Interest, San Franciso, CA:
Berrett-Koehler.
Bloxham, E. (2010). Should CEO be a team job? Retrieved September 13, 2010 from
http://money.cnn.com
Boal, K. B. & Hooijberg, R. (2001). Strategic leadership research: Moving on.
Leadership Quarterly, 11(4), 515-549.
Boatright, J. R. (2009). From hired hands to co-owners: Compensation, team production,
and the role of the CEO. Business Ethics Quarterly, 19(4), 471-496.
Bodwell, W., & Chermack, T. J. (2010). Organizational ambidexterity: Integrating
deliberate and emergent strategy with scenario planning. Technological
Forecasting and Social Change, 77(2), 193-202.
doi:10.1016/j.techfore.2009.07.004
Breene, R. T. S., Nunes, P. F., & Shill, W. E. (2007). The chief strategy officer. Harvard
Business Review, 85(10), 84-93.
Carlson, S. (1951). Executive Behavior. Stockholm, SE: Stromberg‘s.
Carroll, S.J. & Gillen, D.J. (1987). Are the classical management functions useful in
describing managerial work? The Academy of Management Review, 12(1), 38-51.
Carter, J. E. (1982). Variations among executive role strengths in U.S. firm at different
levels of international involvement (Doctoral dissertation). Retrieved from
172
Proquest Dissertations and Theses database. (UMI No. 8308819)
Case, T. S. (2009). Millions spent on CEO turnover: A study of learning and sensemaking
of new CEO leaders (Doctoral dissertation). Retrieved from ProQuest
Dissertations and Theses database. (UMI No. 3344718)
Castaldi, R. M. (1986). An analysis of the work roles of CEOs of small firms. American
Journal of Small Business, 11 (1), 53-64.
Charan, R. (2005). Ending the CEO succession crisis. Harvard Business Review, 83(2),
72-81.
Chermack, T. J. (2003). Mental models in decision making. Advances in Developing
Human Resources, 5(4), 408-422. doi:10.1177/1523422303257373
Collins, J. (2001). Good to Great. New York, NY: HarperCollins Publishers Inc
Coyne, K. & Rao, B. (2005). A guide for the CEO-elect. McKinsey Quarterly, 3, 46-53.
Creswell, J.W. (2002). Educational Research: Planning, Conducting, and Evaluating
Quantitative and Qualitative Research. Upper Saddle River, NJ: Pearson
Education, Inc.
Cummings, T. G., & Worley, C. G. (2009). Organization development and change.
Mason, OH: South-Western Cengage Learning.
Cunningham, P. W., Lynham, S. A., & Weatherly, G. (2006). National human resource
development in transitioning societies in the developing world: South Africa.
Advances in Developing Human Resources, 8(1), 62-83. doi:
10.1177/152342235283059
Dillman, D. A. (2007). Mail and internet surveys: The tailored design method (2nd ed.).
Hoboken, NJ: John Wiley & Sons, Inc.
Dillman, D. A., Smyth, J. D., & Christian, L. M. (2009). Internet, mail and mixed-mode
surveys: The tailored design method (3rd
ed.). Hoboken, NJ: John Wiley & Sons.
Dooley, L. M. & Lindner, J. R. (2003). The handling of nonresponse error. Human
Resource Development Quarterly, 14(1), 99-110.
Edersheim, E. H. (2007). Peter Drucker‘s ―unfinished chapter:‖ The role of the CEO.
Leader to Leader, 45, 40-46. doi:10.1002/ltl.242
Ertugrul, M. & Krishnan, K., (2011). Can CEO dismissals be proactive? Journal of
Corporate Finance, 17, 134-151. doi:10.1016/j.jcorpfin.2010.09.008
173
Favaro, K., Karlsson, P., & Neilson, G. L. (2010). CEO succession 2000-2009: A decade
of convergence and compression. Retrieved May 26, 2010 from
Strategy+Business website: http://www.strategy-
business.com/article/10208?pg=all&tid=27782251
Fink, A. (2006). How To Conduct Surveys: A Step-by-Step Guide (3rd
ed.). Thousand
Oaks, CA: Sage Publications.
Fisher, C. D. & Gitelson, R., (1983). A meta-analysis of the correlates of role conflict and
ambiguity. Journal of Applied Psychology, 68(2), 320-333. doi:10.1037/0021-
9010.68.2.320
Ford, D. N. & Sterman, J. D. (1998). Expert knowledge elicitation to improve formal and
mental models. Systems Dynamics Review, 14(4), 309-340.
doi:10.1002/(SICI)1099-1727(199824)14:4<309::AID-SDR154>3.0.CO;2-5
Galambos, L. (1995). The authority and responsibility of the chief executive officer:
Shifting patterns in large U.S. enterprises in the twentieth century. Industrial and
Corporate Change, 4(1), 187-203. doi:10.1093/icc/4.1.187
Gall, J. P., Gall, M. D., & Borg, W. R. (2006). Applying Educational Research A
Practical Guide (5th ed.). Boston, MA: Pearson Education, Inc.
Gilley, J. W., Boughton, N.W., & Maycunich, A. (1999). The Performance Challenge
Developing Management Systems to Make Employees Your Organization’s
Greatest Asset. Cambridge, MA: Perseus Publishing.
Gliner, J. A., Morgan, G. A., and Leech, N. L. (2009). Research Methods in Applied
Settings: An Integrated Approach to Design and Analysis (2nd
ed.). New York,
NY: Taylor and Francis Group, LLC.
Goleman, D., Boyatzis, R., & McKee, A. (2002). Primal Leadership Learning to Lead
with Emotional Intelligence. Boston, MA: Harvard Business School Press.
Greenfeld, S., Winder, R. C., & Williams, G. (1988). The CEO and the external
environment. Business Horizons, 31(6), 20-25. doi:10.1016/0007-6813(88)90019-
5
Gross, N., Mason, W., & McEachern, A. (1958). Explorations in role analysis: Studies of
the school superintendency role. New York, NY: John Wiley & Sons.
Guba, E. G. (Ed.). (1990). The Paradigm Dialog. Newbury Park, CA: Sage Publications.
Hales, C. P. (1986). What do managers do? A critical review of the evidence. Journal of
Management Studies, 23(1), 88-115. doi:10.1111/j.1467-6486.1986.tb00936.x
174
Hales, C. P. (1999). Why do managers do what they do? Reconciling evidence and theory
in accounts of managerial work. British Journal of Management, 10, 335-350.
Hall, B. J. & Murphy, K. J. (2003). The trouble with stock options. The Journal of
Economic Perspectives, 17(3), 49-70. doi:10.1257/089533003769204353
Hambrick, D.C. & Mason, P.A. (1984). Upper echelons: The organization as a reflection
of its top managers. The Academy of Management Review, 9(2), 193-206.
doi:10.2307/258434
Harris. J. D. (2009). What‘s wrong with executive compensation? Journal of Business
Ethics, 85(1), 147-156. doi:10.1007/s10551-008-9934-6
Hart, S. L. & Quinn, R. E. (1993). Roles executives play: CEOs, behavioral complexity,
and firm performance. Human Relations, 46(5), 543-574.
doi:10.1177/001872679304600501
Hawkins, J. A. (1997). Why investors push for strong corporate boards. The McKinsey
Quarterly, 3, 144-148.
Hiller, N. J., Resick, C. J., Weingarden, S. M., & Whitman, D. S. (2009). The bright-side
and the dark-side of CEO personality: Examining core self-evaluations,
narcissism, transformational leadership, and strategic influence. Journal of
Applied Psychology, 94(6), 1365-1381. doi:10.1037/a0016238
Hofstadter, R. (1948). The American Political Tradition and the Men Who Made It. New
York, NY: A.A. Knopf.
Howe, M. (1988). A test of Mintzberg’s (1973) assertion that all managers perform all
managerial roles, in addition to an investigation of the psychometric properties of
the Pavett & Lau (1983) questionnaire (Doctoral dissertation). University of
Toronto, Toronto, Canada.
IBM Institute for Business Value (2010). Capitalizing on complexity: Insights from the
Global Chief Executive Officer Study. IBM Corporation.
Ireland, R. D. & Hitt, M. A. (1999). Achieving and maintaining strategic competitiveness
in the 21st century: The role of strategic leadership. Academy of Management
Executive, 13(1), 43-57.
Jackson, S. E. & Schuler, R. S. (1985). A meta-analysis and conceptual critique of
research on role ambiguity and role conflict in work settings. Organizational
Behavior and Human Decision Processes 36, 16-78.
doi:10.1016/0749-5978(85)90020-2
175
Jacovitz, R. (2006). C level management churn continues. Retrieved February 11, 2010,
from Liberum Research Web Site:
http://[email protected].
Jensen, M. C. & Murphy, K. J. (1990). CEO Incentives—It‘s not how much you pay, but
how. Harvard Business Review, 68(3), 138-149.
Johansen, B. (2007). Get There Early: Using Foresight to Provoke Strategy and
Innovation. San Francisco, CA: Berrett-Koehler Publishers, Inc.
Kahn, R. L., Wolfe, D. M., Quinn, R. P., & Snoek, J. D. (1964). Organizational stress:
Studies in role conflict and ambiguity. New York, NY: John Wiley & Sons.
Kanter, R. M. (1989). The new managerial work. Harvard Business Review, 67(6), 85-92.
Katz, D., & Kahn, R. L. (1966). The Social Psychology of Organizations. New York,
NY: John Wiley & Sons.
King, L. A. & King, D. W. (1990). Role conflict and role ambiguity: A critical
assessment of construct validity. Psychological Bulletin 107 (1), 48-64.
doi:10.1037/0033-2909.107.1.48
Kleiner, A. (2008). The age of heretics. (2nd
ed.) San Francisco, CA: Jossey-Bass.
Kurke, L. B. & Aldrich, H. E. (1983). Mintzberg was right! A replication and extension
of the nature of managerial work. Management Science, 29(8), 975-984.
doi:10.1287/mnsc.29.8.975
Lafley, A. G. (2009). What only the CEO can do. Harvard Business Review, 87(5), 54-
62.
Lau, A. W., Pavett, C. M., & Newman, A. R. (1979). The nature of managerial work: A
comparison of public and private sector jobs. Academy of Management
Proceedings, Detroit, MI, 339-343.
Leech, N. L., Barrett, K. C., & Morgan, G. A. (2005). SPSS for Intermediate Statistics
(2nd
ed.). Mahwah,NJ: Lawrence Erlbaum Associates, Publishers.
Leong, F. T., & Austin, J. T. (Eds.) (2006). The Psychology Research Handbook. (2nd
ed.), Thousand Oaks, CA: Sage Publications.
Lindner, J. R., Murphy, T. H., & Briers, G. H. (2001). Handling nonresponse in social
science research. Journal of Agricultural Education, 42(4), 43-53.
176
Lynham, S. (1998). The development and evaluation of a model of responsible leadership
for performance: Beginning the journey. Human Resource Development
International, 1(2), 207-220.
Lynham, S. (2000). The development of ―A theory for responsible leadership for
performance‖ (Doctoral dissertation). Retrieved from ProQuest Dissertations and
Theses database. (UMI No. 9972991)
Lynham, S. (2002). The general method of theory-building research in applied
disciplines. Advances in Developing Human Resources, 4(3), 221-241.
Marginson, D., & Bui, B. (2009). Examining the human cost of multiple role
expectations. Behavioral Research in Accounting, 21 (1), 59-81.
doi:10.2308/bria.2009.21.1.59
Martelli, J. & Abels, P. (2010). The education of a leader: Educational credentials and
other characteristics of chief executive officers. Journal of Education for
Business, 85, 209-217. doi:10.1080/0883232090349592
Martinko, M. J. & Gardner, W. I. (1985). Beyond structured observation: Methodological
issues and new directions. The Academy of Management Review, 10(4), 676-695.
doi:10.2307/258038
Mascarenhas, B. (2009). The emerging CEO agenda. Journal of International
Management, 15(3), 245-250. doi:10.1016/j.intman.2009.02.002
Matsumura, E. M. & Shin, J. Y. (2005). Corporate governance and CEO compensation:
Intended and unintended consequences. Journal of Business Ethics, 62(2), 101-
113. doi:10.1007/ss10551-005-0175-7
Mefford, R. N. (2009). Increasing productivity in global firms: The CEO challenge.
Journal of International Management, 15(3), 262-272.
doi:10.1016/j.intman.2008.12.004
Mintzberg, H. (1968). The manager at work—Determining his activities, roles, and
programs by structured observation (Doctoral dissertation). Massachusetts
Institute of Technology, Cambridge, MA.
Mintzberg, H. (1973). The nature of managerial work. New York, NY: Harper & Row,
Publishers, Inc.
Mintzberg, H. (2009). Managing. San Francisco, CA: Berrett-Koehler Publishers, Inc.
177
Mitchell, R. K., Agle, B. R., & Wood, D. J. (1997). Toward a theory of stakeholder
identification and salience: Defining the principle of who and what really counts.
Academy of Management, 22(4), 853-866.
Mooney, C. H., Dalton, C. M., Dalton, D. R., & Certo, S. T. (2007). CEO succession as a
funnel: The critical, and changing, role of inside directors. Organizational
Dynamics, 36(4), 418-428. doi:10.1016/j.orgdyn.2007.06.007
Morgan, G. A., Leech, N. L., Gloeckner, G. W., & Barrett, K. C. (2011). SPSS for
introductory statistics use and interpretation (4th ed.). New York: NY:
Routledge.
Morgeson, F. P., Delaney-Klinger, K., & Hemingway, M. A. (2005). The importance of
job autonomy, cognitive ability, and job-related skill for predicting role breadth
and job performance. Journal of Applied Psychology, 90 (2), 399-406.
doi:10.1037/0021-9010.90.2.399
Murphy, M. (2005) Why CEOs get fired. Retrieved from www.LeadershipIQ.com
Pugliese, P. J. (1985). The nature of managerial work: The extent Mintzberg’s roles are
required by the chief executives in academic and public libraries (Doctoral
dissertation). Retrieved from ProQuest Dissertations and Theses database. (UMI
No. 8603906)
Quarterman, J., Allen, L., & Becker, A. (2005). Managerial roles of intercollegiate
athletic directors for the NAIA: The Mintzberg model. International Journal of
Sport Management, 6, 165-182.
Rastetter, A. L. (1985). Managerial activity analysis via Mintzberg’s role theory: The
effects of person and organization variables (Doctoral dissertation). Retrieved
from ProQuest Dissertations and Theses database. (UMI No. 8605787)
Rizzo, J. R., House, R. J., & Lirtzman, S. I., (1970). Role conflict and ambiguity in
complex organizations. Administrative Science Quarterly, 15 (20), 150-163.
doi:10.2307/2391486
Rosser, M. H. (2005). Mentoring from the top: CEO perspectives. Advances in
Developing Human Resources, 7(4), 527-539. doi:10.1177/1523422305279685
Ruona, W. E. A. & Lynham, S. A. (2004). A philosophical framework for thought and
practice in human resource development. Human Resource Development
International, 7(2), 151-164. doi:10.1080/13678860310001630665
Sashkin, M. & Fulmer, R. M. (1988). Toward an organizational leadership theory. In
Emerging Leadership Vistas (pp. 51-65).
178
Senge, P. (1994). Learning to alter mental models. Executive Excellence, 11(3), 16-17.
Shapira, Z. & Dunbar, R. L. M. (1980). Testing Mintzberg‘s managerial roles
classification using an in-basket simulation. Journal of Applied Psychology,
65(1), 87-95.
Snyder, N. H. & Wheelen, T. L. (1981). Managerial roles: Mintzberg and the
management process theorists. Academy of Management Proceedings, 1981, 249-
253.
Stata, R. (1988). The role of the chief executive officer in articulating the vision.
Interfaces, 18(3), 3-9.
Steiner, G., Kunin, E. & Kunin H. (1981). The new class of chief executive officer. Long
Range Planning, 14(4), 10-20. doi:10.1016/0024-6301(81)90120-5
Stryker, S. (1959). Symbolic interaction as an approach to family research. Marriage and
Family Living, (20), 111-119. doi:10.2307/348099
Stryker, S. & Statham, A. (1985). Symbolic interaction and role theory. In G. Lindzey &
E. Aronson (Eds.) Volume I The Handbook of Social Psychology (pp. 311-378).
3rd
ed. New York, NY: Random House.
Swanson, R. A. (2007). Analysis for Improving Performance. 2nd
ed. San Francisco, CA:
Berrett-Koehler Publishers, Inc.
Swanson, R. A. & Holton, E. F. (2009). Foundations of Human Resource Development,
2nd
ed. San Francisco, CA: Berrett-Koehler Publishers, Inc.
Tedlow, R. S., Bettcher, K. E., & Purrington, C. A. (2003). The chief executive officer of
the large American industrial corporation in 1917. The Business History Review,
77(4), 687-701. doi:10.2307/30041234
Tengblad, S. (2006). Is there a ‗New Managerial Work‘? A comparison with Henry
Mintzberg‘s classic study 30 years later. Journal of Management Studies, 43(7),
1437-1461. doi:10.1111/j.1467-6486.2006.00651.x
Thomas, R. J. (1995). Interviewing important people in big companies. In R. Hertz & J.
Imber (Eds.), Studying elites using qualitative methods (pp. 3-17). Thousand
Oaks, CA: Sage.
Torraco, R. J. & Swanson, R. A. (1995). The strategic roles of human resource
development. Human Resource Planning, 18(4), 10-21.
179
Torraco, R. J., (1997). Theory-building research methods. In R.A. Swanson & E.F.
Holton III (Eds.), Human resource development research handbook: Linking
research and practice (pp. 114-137).
Tuck, E. F. & Earle, T. (1996). Why C.E.O.‘s succeed (and why they fail): Hunters and
gatherers in the corporate life. Strategy+Business, Q4, 1996, 18-25.
Useem, M. (1995). Reaching corporate executives. In R. Hertz & J. Imber (Eds.),
Studying elites using qualitative methods (pp. 19-39). Thousand Oaks, CA: Sage.
U.S. Bureau of Labor Statistics. Retrieved from www.bls.gov
Vaill, P. B. (1996). Learning as a way of being. San Francisco, CA: Jossey-Bass
Publishers.
Vera, D. & Crossan, M. (2004). Strategic leadership and organizational learning.
Academy of Management Review, 29(2), 222-240. doi:10.2307/20159030
Waldman, D. A., Siegel, D. S., & Javidan, M. (2006). Components of CEO
transformational leadership and corporate social responsibility. Journal of
Management Studies, 43(8), 1703-1725. doi:10.1111/j.1467-6486.2006.00642.x
Walsh, J. P. (2008). CEO compensation and the responsibilities of the business scholar to
society. Academy of Management Perspectives, 22(2), 26-33.
Whitely, W. T. (1978). Nature of managerial work revisited. Academy of Management
Proceedings, San Francisco, CA, 195-199.
Wickham, M. & Parker, M. (2006). Reconceptualising organisational role theory for
contemporary organisational contexts. Journal of Managerial Psychology, 22(5),
440-464. doi:10.1108/02683940710757182
Wood, J. S. (2011). Are your directors CEO Material? The Corporate Board, January-
February, 2011, 11-15.
Wood, J. & Vilkinas, T. (2003). Characteristics of chief executive officers: Views of their
staff. Journal of Management Development, 23(5), 469-478.
doi:10.1108/02621710410537074
Yang, B. (2005). Factor analysis methods. In R. A. Swanson and E. F. Holton (Eds.),
Research in organizations: Foundations and methods of inquiry. (pp. 181-199).
San Francisco, CA: Berrett-Koehler Publishers, Inc.
Zaccaro, S. J. (2001). Behavioral complexity theories: Conceptual review and
evaluations. In The nature of executive leadership A conceptual and empirical
180
analysis of success (pp. 123-147). Washington, DC: American Psychological
Association. doi:10.1037/10398-004
Zaleznik, A. (1977). Managers and leaders are they different? Harvard Business Review,
55(3), 74-81.
Zhang, Y. & Wiersema, M. F. (2009). Stock market reaction to CEO certification: The
signaling role of CEO background. Strategic Management Journal, 30, 693-710.
doi: 10.1002/smj.772
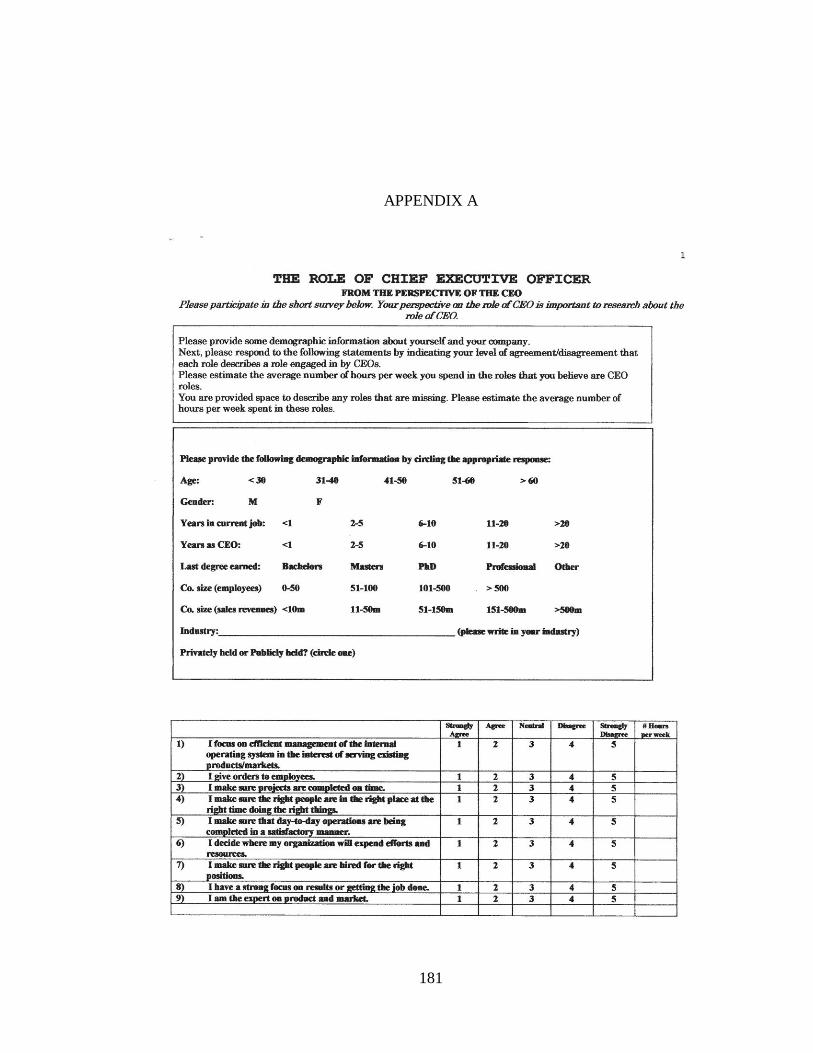
181
APPENDIX A
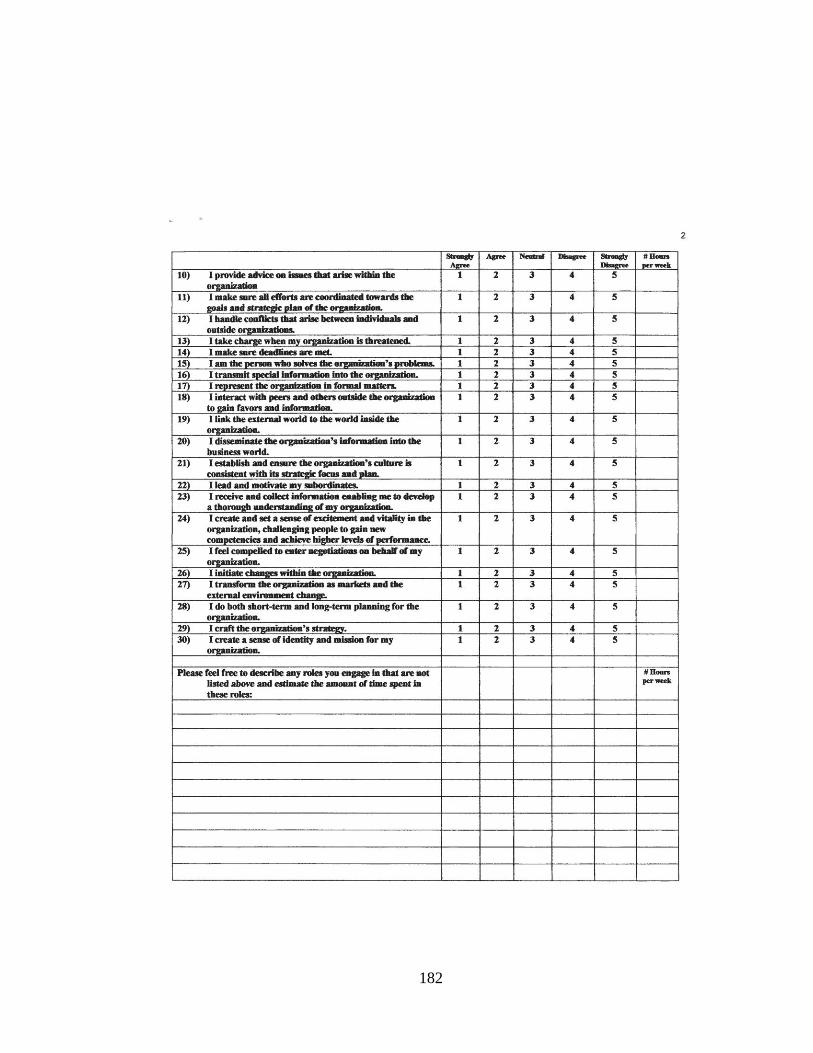
182
183
APPENDIX B
Consent to Participate in a Research Study
Colorado State University
TITLE OF STUDY: Pilot Test of an instrument designed to measure the role of the Chief
Executive Officer (CEO)
PRINCIPAL INVESTIGATOR: Thomas J. Chermack, PhD, Assistant Professor,
612.387.1951; [email protected] .
CO-PRINCIPAL INVESTIGATOR: Maggie Glick, CSU Doctoral Student, 970-495-
9689; [email protected] .
WHY AM I BEING INVITED TO TAKE PART IN THIS RESEARCH? You are being
invited to participate in this research because you are a CEO. The survey you are being
asked to complete provides information and your opinions about the role of the CEO and
how your time is allocated among the various roles. This information will help us to
understand what the role of the CEO is.
WHO IS DOING THE STUDY? This study is being conducted by Thomas J. Chermack,
PhD, Assistant Professor, Colorado State University, and Maggie Glick, Doctoral
Student, Colorado State University. This study is not funded.
WHAT IS THE PURPOSE OF THIS STUDY? The purpose of this study is to research
the current role of the CEO.
WHERE IS THE STUDY GOING TO TAKE PLACE AND HOW LONG WILL IT
LAST?
The survey will take place at the address of business and will be completed manually and
mailed back to Maggie Glick directly upon completion. The estimated time to complete
this survey is 10 minutes.
WHAT WILL I BE ASKED TO DO? You are being asked to complete a survey about
your role as a CEO. If you want to participate, please complete and return the survey in
the envelope provided. For future reference please keep this letter with the researcher‘s
contact information.
ARE THERE REASONS WHY I SHOULD NOT TAKE PART IN THIS STUDY?
There are no reasons not to participate in this study.
184
WHAT ARE THE POSSIBLE RISKS AND DISCOMFORTS?
There are no known risks associated with this study.
It is not possible to identify all potential risks in research procedures, but the
researcher(s) have taken reasonable safeguards to minimize any known and potential, but
unknown, risks.
ARE THERE ANY BENEFITS FROM TAKING PART IN THIS STUDY? There are
no direct benefits from taking part in this study. However, by participating you will add
to the knowledge of the role of CEO. As such, you will extend our understanding of the
role providing meaningful data for HRD professionals, boards of directors, and other
CEOs. (Please turn this page over for additional information.)
DO I HAVE TO TAKE PART IN THE STUDY? Your participation in this research is
voluntary. If you decide to participate in the study, you may withdraw your consent and
stop participating at any time without penalty or loss of benefits to which you are
otherwise entitled.
WHO WILL SEE THE INFORMATION THAT I GIVE?
Your name is not required. The name of your organization is not required. The
information you provide will be combined with information from other people taking part
in the study. When we write about the study to share it with other researchers or publish
the results, we will write about the combined information we have gathered. You will not
be identified in these written materials.
Only the two members of the research team (listed above) will have access to the survey
information.
WHAT IF I HAVE QUESTIONS?
Before you decide whether to accept this invitation to take part in the study, please ask
any questions that might come to mind now. Later, if you have questions about the
study, you can contact the principal investigator, Dr. Thomas J. Chermack at
612.387.1951; [email protected] , or the co-principle investigator, Maggie Glick
at 970-495-9689 or [email protected] . If you have any questions about your
rights as a volunteer in this research, contact Janell Barker, Human Research
Administrator at 970-491-1655. This copy of the consent form is yours to keep.
Thank you for your participation in this study.
Sincerely,
Maggie Glick
Doctoral Student
Colorado State University
Thomas J. Chermack, PhD
Assistant Professor
Colorado State University
185
APPENDIX C
Consent to Participate in a Research Study
Colorado State University
Research Integrity & Compliance Review Office
Office of Vice President for Research
Fort Collins, CO 80523-2011
(970) 491-1553
FAX (970) 491-2293
DATE: May 4, 2010 TO: Thomas Chermack, Education
Maggie Glick, Education FROM: Janell Barker, IRB Administrator Research Integrity & Compliance Review Office TITLE: Pilot Test of an Instrument Designed to Survey IRB ID: 027-10H Review Date: May 4, 2010 The Institutional Review Board (IRB) Administrator has reviewed this project and has declared the study exempt from the requirements of the human subject protections regulations as described in 45 CFR 46.101(b)(2): Research involving the use of educational tests,….survey procedures, interview procedures or observation of public behavior, unless: a) information obtained is recorded in such a manner that human subjects can be identified, directly or through identifiers linked to the subjects. The IRB determination of exemption means that: You do not need to submit an application for annual continuing review. You must carry out the research as proposed in the Exempt application, including obtaining and documenting (signed) informed consent if stated in your application or if required by the IRB. Any modification of this research should be submitted to the IRB through an e-mail to the IRB Administrator, prior to implementing any changes, to determine if the project still meets the Federal criteria for exemption. If it is determined that exemption is no longer warranted, then an IRB proposal will need to be submitted and approved before proceeding with data collection.
Please notify the IRB if any problems or complaints of the research occur. Please note that you must submit all research involving human participants for review by the IRB. Only the IRB may make the determination of exemption, even if you conduct a similar study in the future.
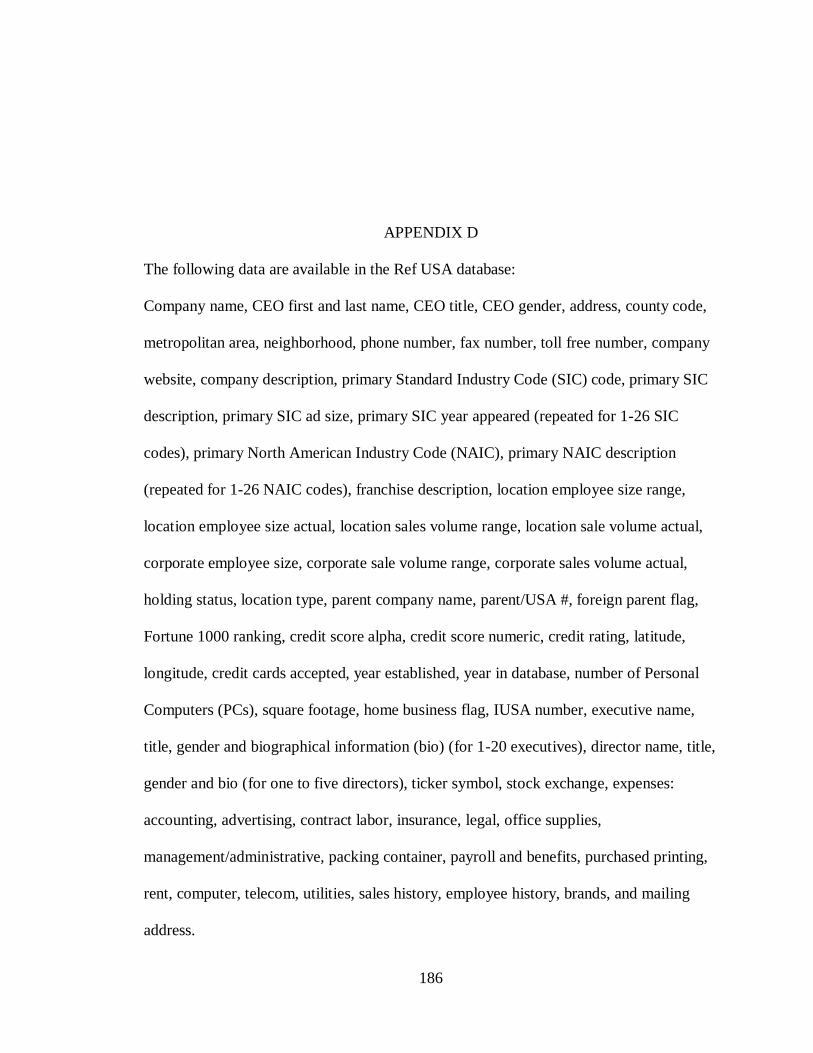
186
APPENDIX D
The following data are available in the Ref USA database:
Company name, CEO first and last name, CEO title, CEO gender, address, county code,
metropolitan area, neighborhood, phone number, fax number, toll free number, company
website, company description, primary Standard Industry Code (SIC) code, primary SIC
description, primary SIC ad size, primary SIC year appeared (repeated for 1-26 SIC
codes), primary North American Industry Code (NAIC), primary NAIC description
(repeated for 1-26 NAIC codes), franchise description, location employee size range,
location employee size actual, location sales volume range, location sale volume actual,
corporate employee size, corporate sale volume range, corporate sales volume actual,
holding status, location type, parent company name, parent/USA #, foreign parent flag,
Fortune 1000 ranking, credit score alpha, credit score numeric, credit rating, latitude,
longitude, credit cards accepted, year established, year in database, number of Personal
Computers (PCs), square footage, home business flag, IUSA number, executive name,
title, gender and biographical information (bio) (for 1-20 executives), director name, title,
gender and bio (for one to five directors), ticker symbol, stock exchange, expenses:
accounting, advertising, contract labor, insurance, legal, office supplies,
management/administrative, packing container, payroll and benefits, purchased printing,
rent, computer, telecom, utilities, sales history, employee history, brands, and mailing
address.
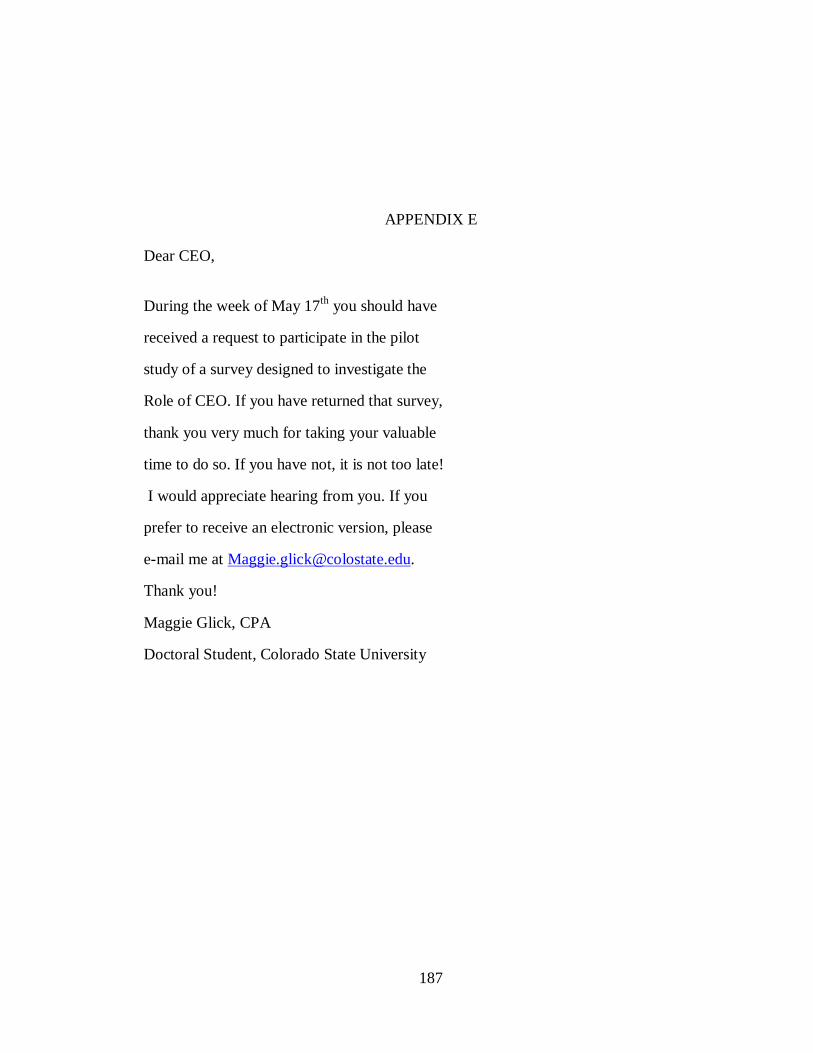
187
APPENDIX E
Dear CEO,
During the week of May 17th
you should have
received a request to participate in the pilot
study of a survey designed to investigate the
Role of CEO. If you have returned that survey,
thank you very much for taking your valuable
time to do so. If you have not, it is not too late!
I would appreciate hearing from you. If you
prefer to receive an electronic version, please
e-mail me at [email protected].
Thank you!
Maggie Glick, CPA
Doctoral Student, Colorado State University
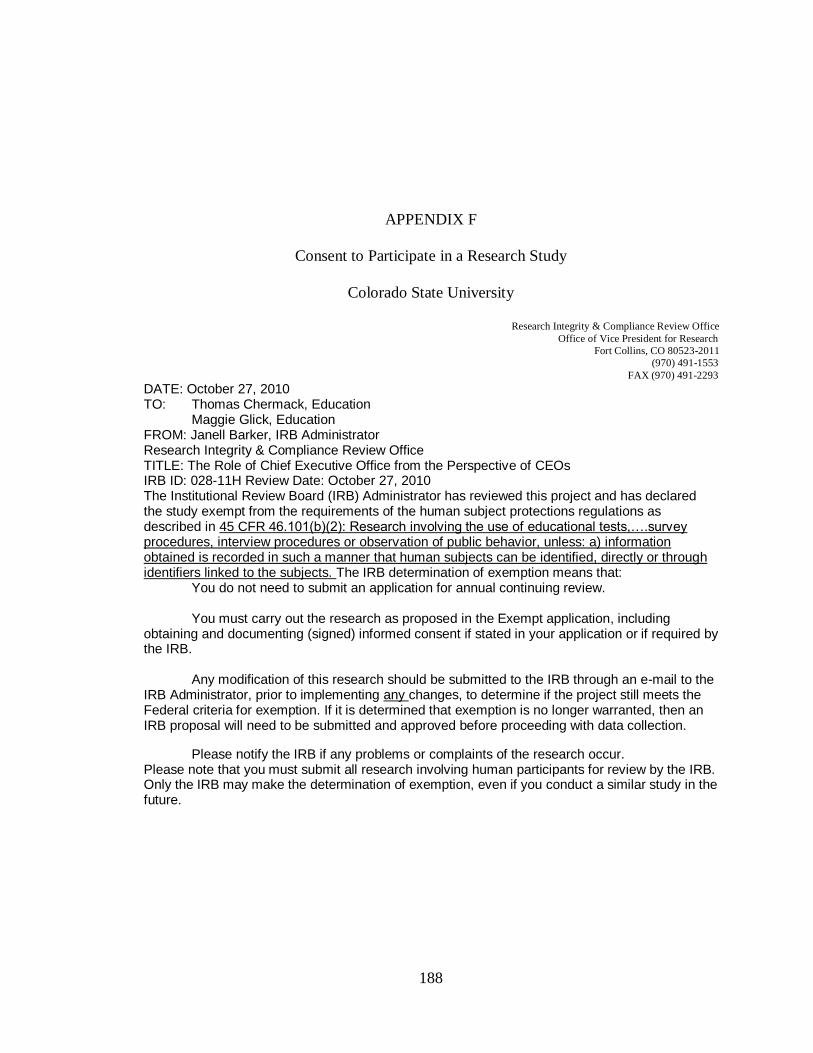
188
APPENDIX F
Consent to Participate in a Research Study
Colorado State University
Research Integrity & Compliance Review Office
Office of Vice President for Research
Fort Collins, CO 80523-2011
(970) 491-1553
FAX (970) 491-2293
DATE: October 27, 2010 TO: Thomas Chermack, Education
Maggie Glick, Education FROM: Janell Barker, IRB Administrator Research Integrity & Compliance Review Office TITLE: The Role of Chief Executive Office from the Perspective of CEOs IRB ID: 028-11H Review Date: October 27, 2010 The Institutional Review Board (IRB) Administrator has reviewed this project and has declared the study exempt from the requirements of the human subject protections regulations as described in 45 CFR 46.101(b)(2): Research involving the use of educational tests,….survey procedures, interview procedures or observation of public behavior, unless: a) information obtained is recorded in such a manner that human subjects can be identified, directly or through identifiers linked to the subjects. The IRB determination of exemption means that: You do not need to submit an application for annual continuing review. You must carry out the research as proposed in the Exempt application, including obtaining and documenting (signed) informed consent if stated in your application or if required by the IRB. Any modification of this research should be submitted to the IRB through an e-mail to the IRB Administrator, prior to implementing any changes, to determine if the project still meets the Federal criteria for exemption. If it is determined that exemption is no longer warranted, then an IRB proposal will need to be submitted and approved before proceeding with data collection.
Please notify the IRB if any problems or complaints of the research occur. Please note that you must submit all research involving human participants for review by the IRB. Only the IRB may make the determination of exemption, even if you conduct a similar study in the future.
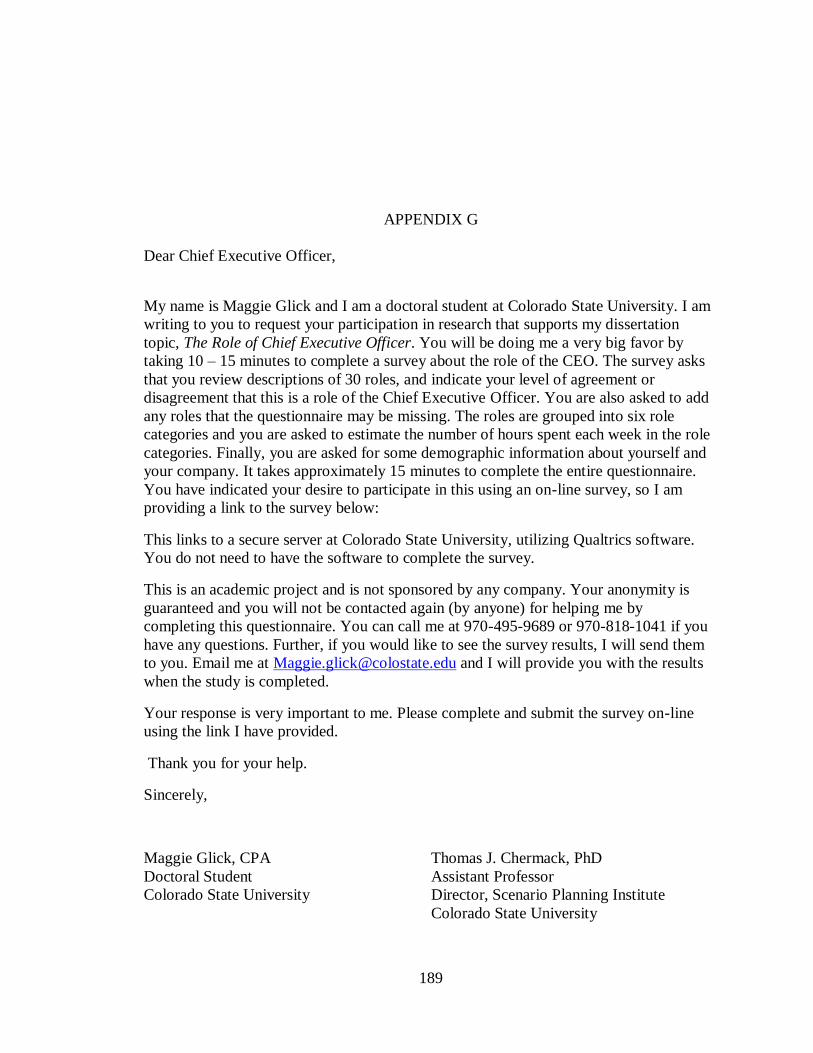
189
APPENDIX G
Dear Chief Executive Officer,
My name is Maggie Glick and I am a doctoral student at Colorado State University. I am
writing to you to request your participation in research that supports my dissertation
topic, The Role of Chief Executive Officer. You will be doing me a very big favor by
taking 10 – 15 minutes to complete a survey about the role of the CEO. The survey asks
that you review descriptions of 30 roles, and indicate your level of agreement or
disagreement that this is a role of the Chief Executive Officer. You are also asked to add
any roles that the questionnaire may be missing. The roles are grouped into six role
categories and you are asked to estimate the number of hours spent each week in the role
categories. Finally, you are asked for some demographic information about yourself and
your company. It takes approximately 15 minutes to complete the entire questionnaire.
You have indicated your desire to participate in this using an on-line survey, so I am
providing a link to the survey below:
This links to a secure server at Colorado State University, utilizing Qualtrics software.
You do not need to have the software to complete the survey.
This is an academic project and is not sponsored by any company. Your anonymity is
guaranteed and you will not be contacted again (by anyone) for helping me by
completing this questionnaire. You can call me at 970-495-9689 or 970-818-1041 if you
have any questions. Further, if you would like to see the survey results, I will send them
to you. Email me at [email protected] and I will provide you with the results
when the study is completed.
Your response is very important to me. Please complete and submit the survey on-line
using the link I have provided.
Thank you for your help.
Sincerely,
Maggie Glick, CPA Thomas J. Chermack, PhD
Doctoral Student Assistant Professor
Colorado State University Director, Scenario Planning Institute
Colorado State University
190
APPENDIX H
Role of CEO
Please participate in this confidential survey. Your perspective on the role of CEO is
important to research on this topic. Please read each role description and indicate your
level of agreement/disagreement as it relates to your role as a CEO. You are provided a
space to add and describe any roles that are missing from the survey. Please indicate the
approximate number of hours you spend on each role category per week. As a final step
please provide some background demographic information about yourself and your
company. Thank you for your participation in this research.
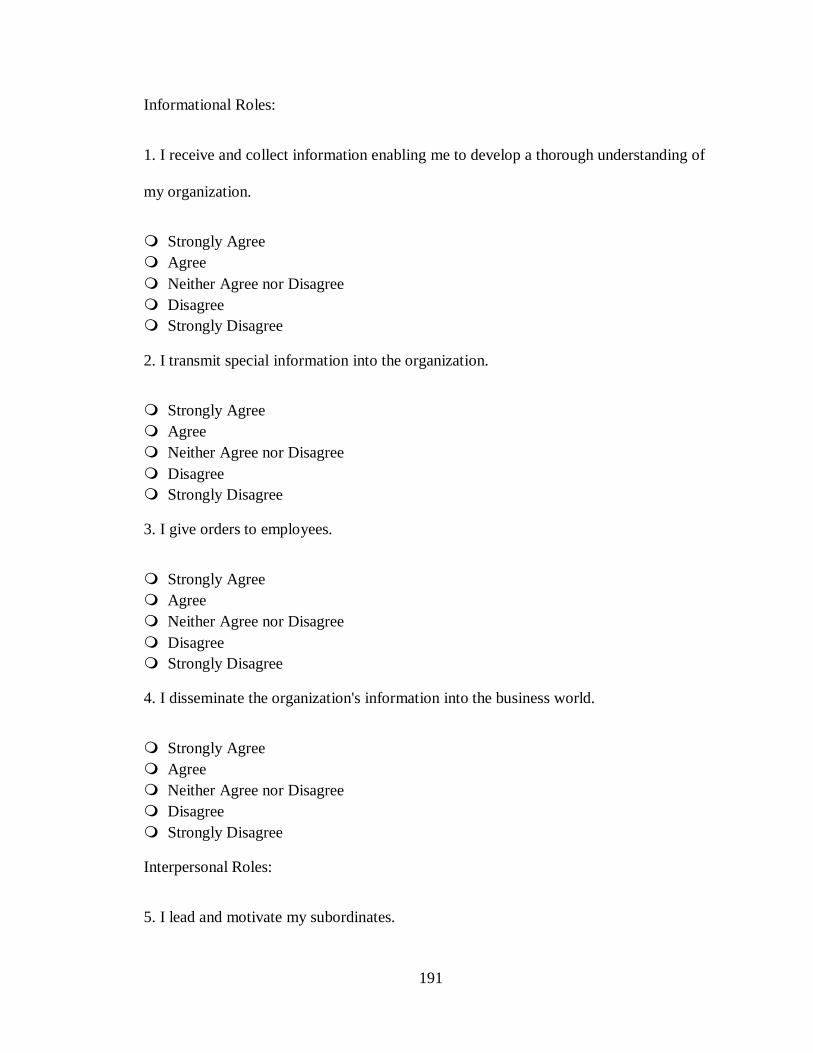
191
Informational Roles:
1. I receive and collect information enabling me to develop a thorough understanding of
my organization.
Strongly Agree
Agree
Neither Agree nor Disagree
Disagree
Strongly Disagree
2. I transmit special information into the organization.
Strongly Agree
Agree
Neither Agree nor Disagree
Disagree
Strongly Disagree
3. I give orders to employees.
Strongly Agree
Agree
Neither Agree nor Disagree
Disagree
Strongly Disagree
4. I disseminate the organization's information into the business world.
Strongly Agree
Agree
Neither Agree nor Disagree
Disagree
Strongly Disagree
Interpersonal Roles:
5. I lead and motivate my subordinates.
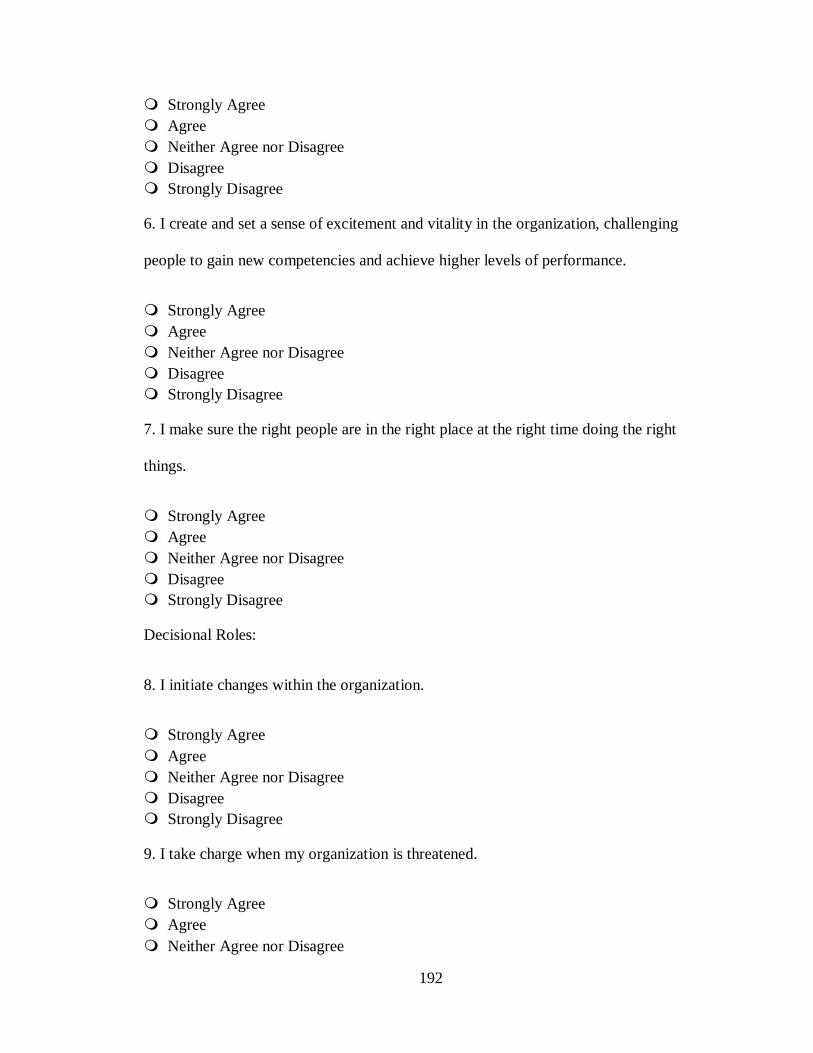
192
Strongly Agree
Agree
Neither Agree nor Disagree
Disagree
Strongly Disagree
6. I create and set a sense of excitement and vitality in the organization, challenging
people to gain new competencies and achieve higher levels of performance.
Strongly Agree
Agree
Neither Agree nor Disagree
Disagree
Strongly Disagree
7. I make sure the right people are in the right place at the right time doing the right
things.
Strongly Agree
Agree
Neither Agree nor Disagree
Disagree
Strongly Disagree
Decisional Roles:
8. I initiate changes within the organization.
Strongly Agree
Agree
Neither Agree nor Disagree
Disagree
Strongly Disagree
9. I take charge when my organization is threatened.
Strongly Agree
Agree
Neither Agree nor Disagree
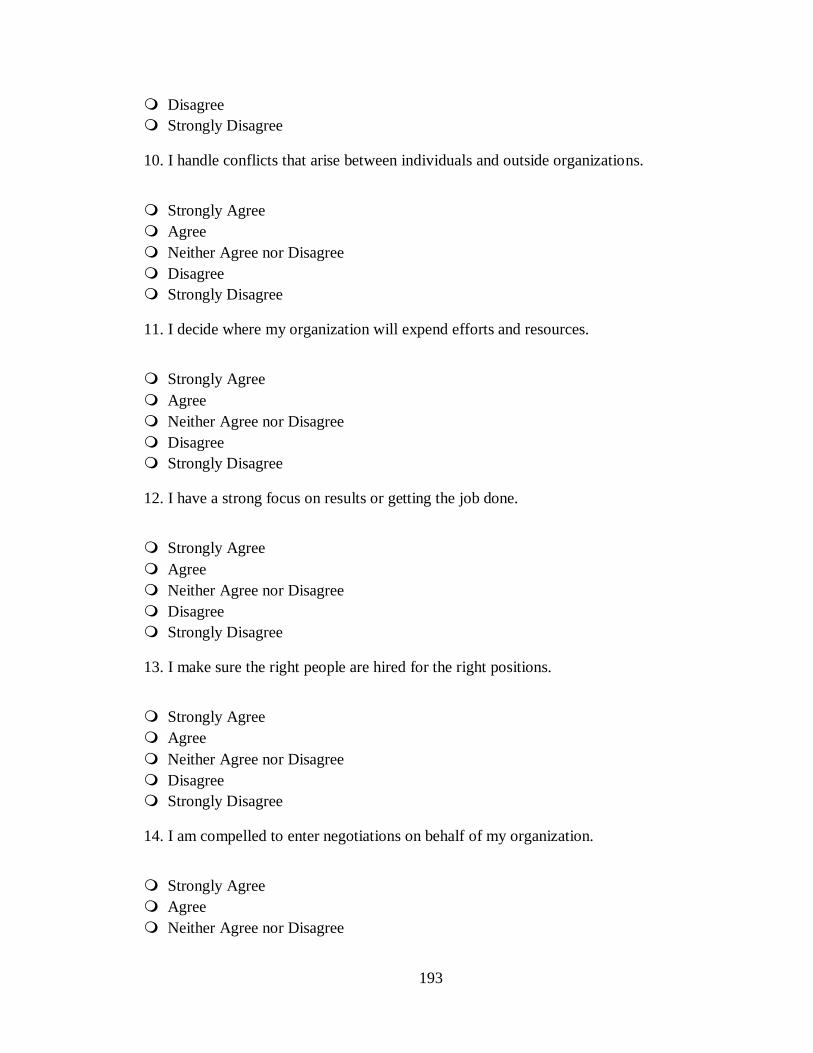
193
Disagree
Strongly Disagree
10. I handle conflicts that arise between individuals and outside organizations.
Strongly Agree
Agree
Neither Agree nor Disagree
Disagree
Strongly Disagree
11. I decide where my organization will expend efforts and resources.
Strongly Agree
Agree
Neither Agree nor Disagree
Disagree
Strongly Disagree
12. I have a strong focus on results or getting the job done.
Strongly Agree
Agree
Neither Agree nor Disagree
Disagree
Strongly Disagree
13. I make sure the right people are hired for the right positions.
Strongly Agree
Agree
Neither Agree nor Disagree
Disagree
Strongly Disagree
14. I am compelled to enter negotiations on behalf of my organization.
Strongly Agree
Agree
Neither Agree nor Disagree
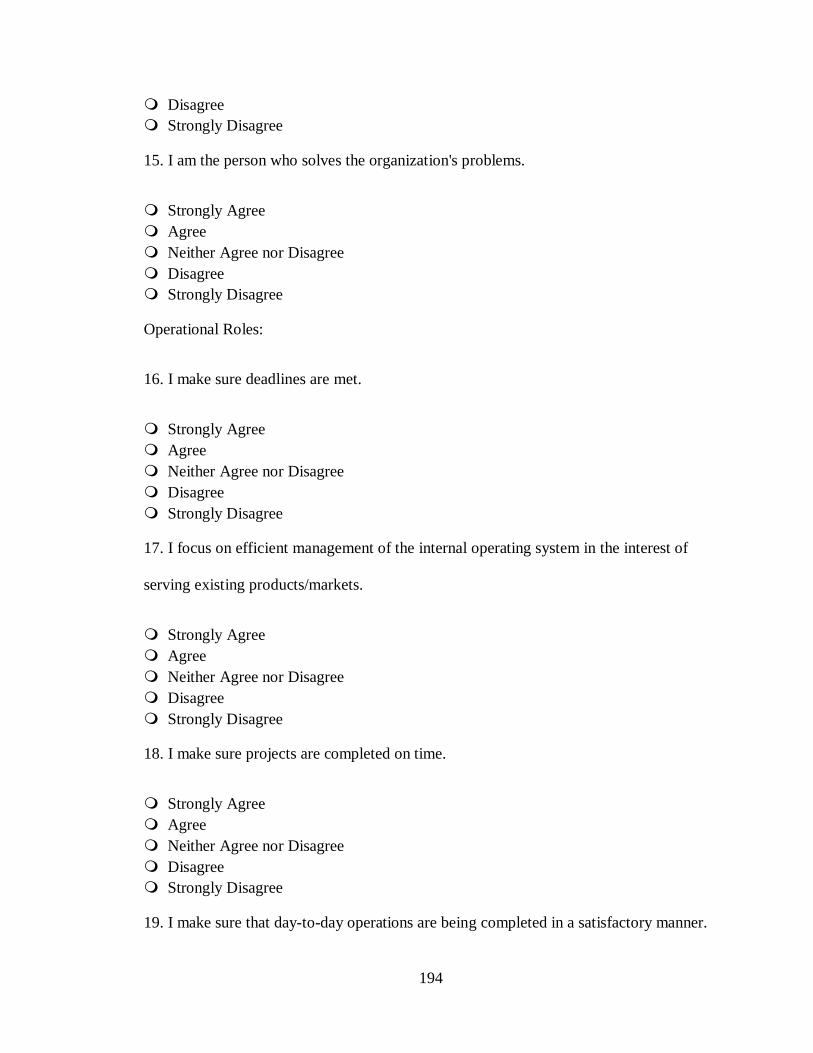
194
Disagree
Strongly Disagree
15. I am the person who solves the organization's problems.
Strongly Agree
Agree
Neither Agree nor Disagree
Disagree
Strongly Disagree
Operational Roles:
16. I make sure deadlines are met.
Strongly Agree
Agree
Neither Agree nor Disagree
Disagree
Strongly Disagree
17. I focus on efficient management of the internal operating system in the interest of
serving existing products/markets.
Strongly Agree
Agree
Neither Agree nor Disagree
Disagree
Strongly Disagree
18. I make sure projects are completed on time.
Strongly Agree
Agree
Neither Agree nor Disagree
Disagree
Strongly Disagree
19. I make sure that day-to-day operations are being completed in a satisfactory manner.
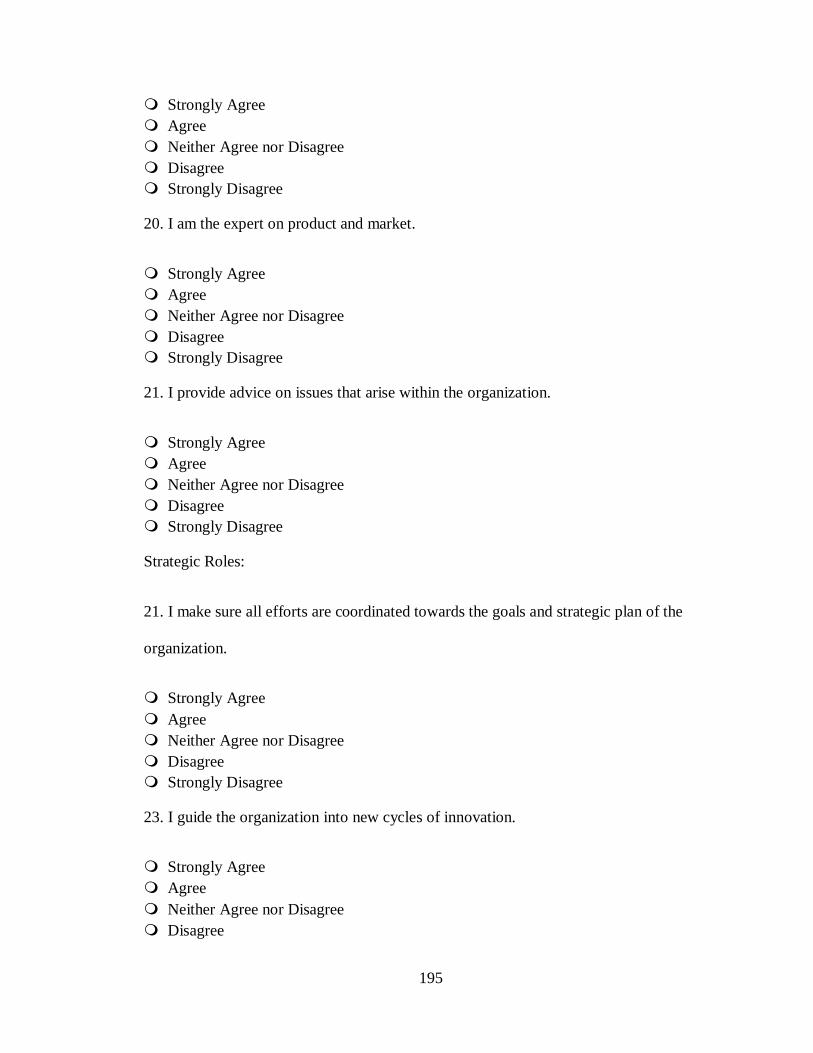
195
Strongly Agree
Agree
Neither Agree nor Disagree
Disagree
Strongly Disagree
20. I am the expert on product and market.
Strongly Agree
Agree
Neither Agree nor Disagree
Disagree
Strongly Disagree
21. I provide advice on issues that arise within the organization.
Strongly Agree
Agree
Neither Agree nor Disagree
Disagree
Strongly Disagree
Strategic Roles:
21. I make sure all efforts are coordinated towards the goals and strategic plan of the
organization.
Strongly Agree
Agree
Neither Agree nor Disagree
Disagree
Strongly Disagree
23. I guide the organization into new cycles of innovation.
Strongly Agree
Agree
Neither Agree nor Disagree
Disagree
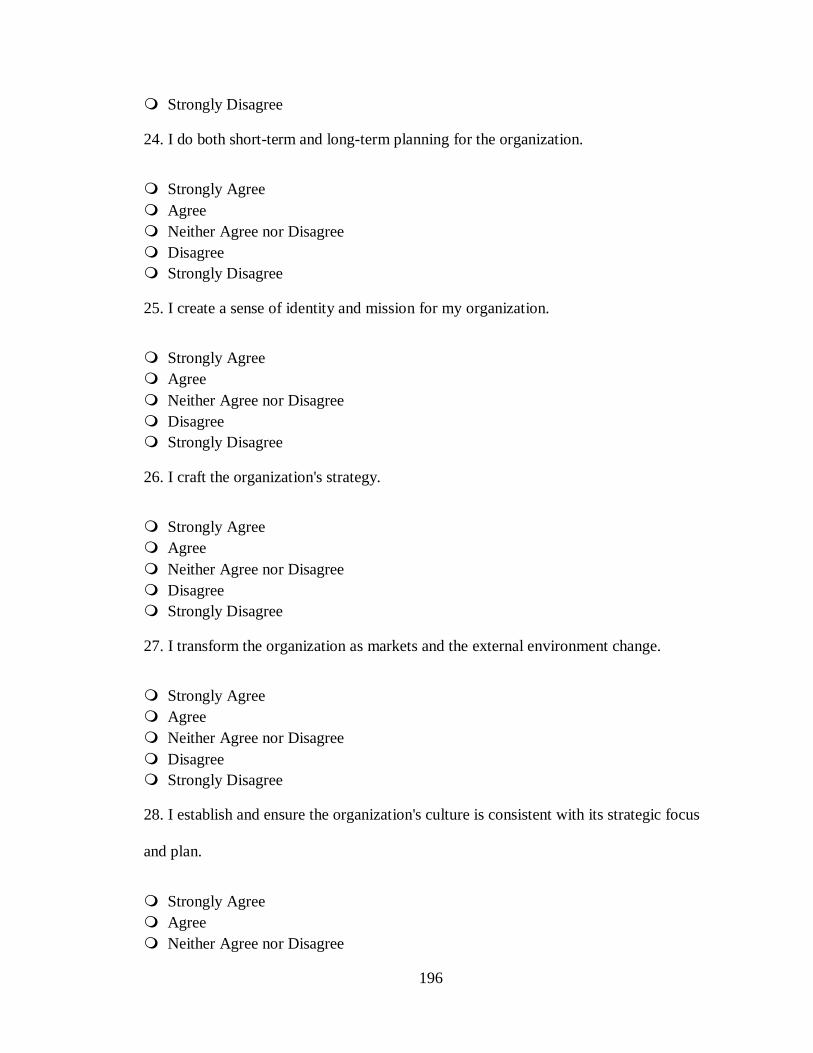
196
Strongly Disagree
24. I do both short-term and long-term planning for the organization.
Strongly Agree
Agree
Neither Agree nor Disagree
Disagree
Strongly Disagree
25. I create a sense of identity and mission for my organization.
Strongly Agree
Agree
Neither Agree nor Disagree
Disagree
Strongly Disagree
26. I craft the organization's strategy.
Strongly Agree
Agree
Neither Agree nor Disagree
Disagree
Strongly Disagree
27. I transform the organization as markets and the external environment change.
Strongly Agree
Agree
Neither Agree nor Disagree
Disagree
Strongly Disagree
28. I establish and ensure the organization's culture is consistent with its strategic focus
and plan.
Strongly Agree
Agree
Neither Agree nor Disagree
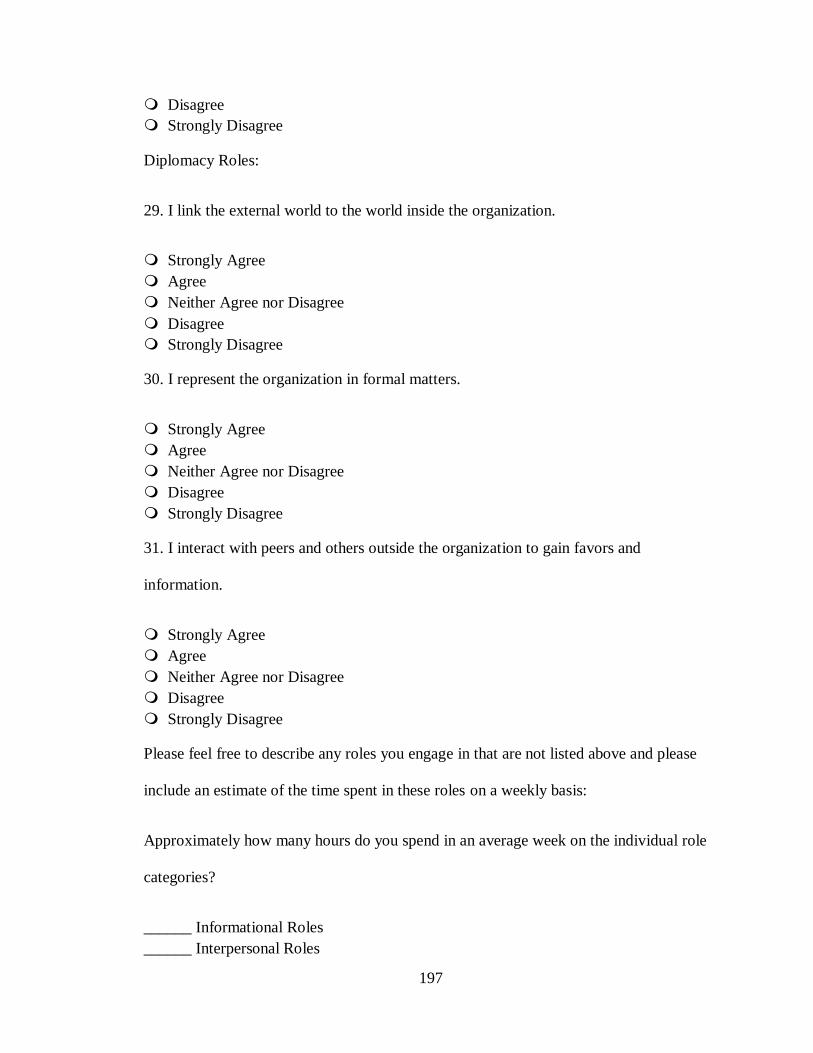
197
Disagree
Strongly Disagree
Diplomacy Roles:
29. I link the external world to the world inside the organization.
Strongly Agree
Agree
Neither Agree nor Disagree
Disagree
Strongly Disagree
30. I represent the organization in formal matters.
Strongly Agree
Agree
Neither Agree nor Disagree
Disagree
Strongly Disagree
31. I interact with peers and others outside the organization to gain favors and
information.
Strongly Agree
Agree
Neither Agree nor Disagree
Disagree
Strongly Disagree
Please feel free to describe any roles you engage in that are not listed above and please
include an estimate of the time spent in these roles on a weekly basis:
Approximately how many hours do you spend in an average week on the individual role
categories?
______ Informational Roles
______ Interpersonal Roles
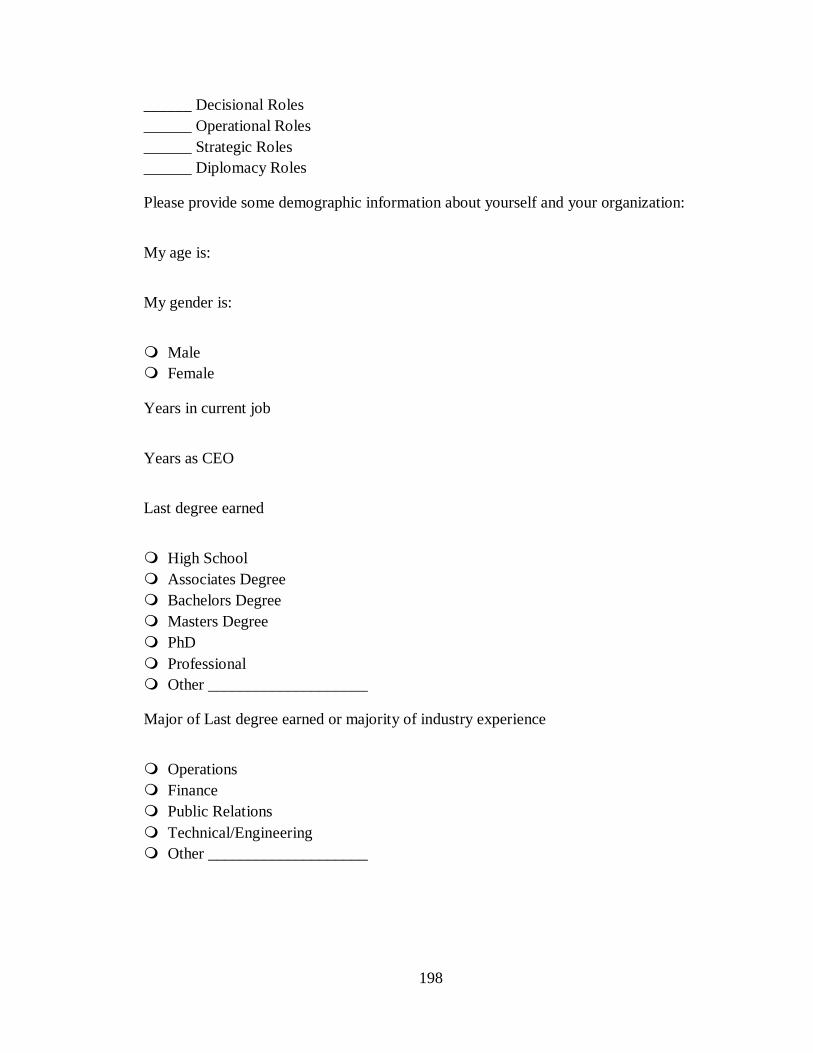
198
______ Decisional Roles
______ Operational Roles
______ Strategic Roles
______ Diplomacy Roles
Please provide some demographic information about yourself and your organization:
My age is:
My gender is:
Male
Female
Years in current job
Years as CEO
Last degree earned
High School
Associates Degree
Bachelors Degree
Masters Degree
PhD
Professional
Other ____________________
Major of Last degree earned or majority of industry experience
Operations
Finance
Public Relations
Technical/Engineering
Other ____________________
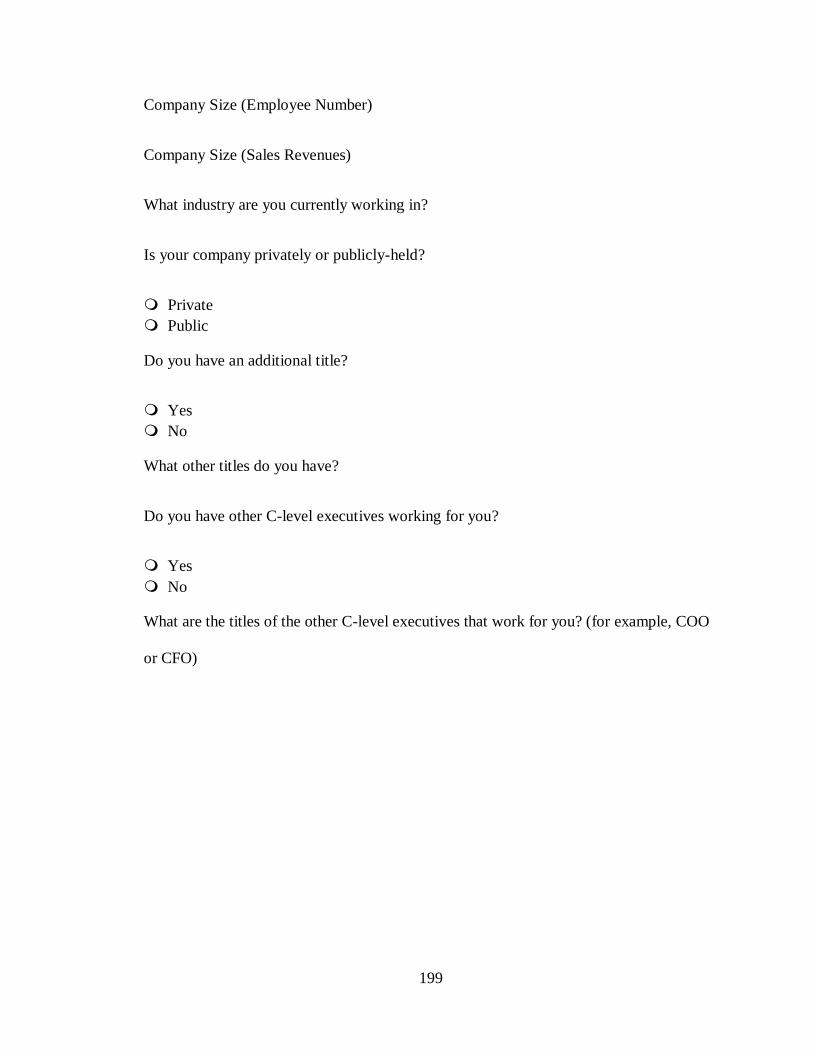
199
Company Size (Employee Number)
Company Size (Sales Revenues)
What industry are you currently working in?
Is your company privately or publicly-held?
Private
Public
Do you have an additional title?
Yes
No
What other titles do you have?
Do you have other C-level executives working for you?
Yes
No
What are the titles of the other C-level executives that work for you? (for example, COO
or CFO)