dissertation -...
TRANSCRIPT

Ph.D. DissertationInternational Do toral S hool in Informationand Communi ation Te hnologyDISI - University of Trento
Wildlife Road Crossing: InnovativeSolution for Preventing Vehi le Collisionbased on Pervasive WSN Monitoring SystemFabrizio RobolTutor:Andrea Massa, Full ProfessorUniversity of TrentoAdvisor:Paolo Ro a, Asso iate ProfessorUniversity of TrentoCo-Advisor:Federi o Viani, Assistant ProfessorUniversity of Trento April 2015


To my parents and my family, for their ontinuous and kind parte ipationduring this travel.A spe ial thanks to all friends and ollegues of the ELEDIA Resear h Centerand an additionl thanks to Ing. S. DeVigili and Ing. G. Benedetti of the 'ServizioGestione Strade', of the Autonomous Provin e of Trento (PAT), Italy, for thesupport during pilot site de�nition and system deployment.


Abstra tThe study, design and development of a monitoring system for wildlife road rossing problem is addressed in this thesis. Collisions between fauna and vehi lesis a relevant issue in several mountain and rural regions and a valuable low- ost solution has not yet been identi�ed. In parti ular, the proposed systemis omposed by a network of sensors installed along road margins, in order todete t wildlife events, (e.g., approa hing, leaving or rossing the road), thus topromptly warn the in oming drivers. The sensor nodes ommuni ate wirelesslyamong the network thus olle ting the sensed information in a ontrol unit fordata storage, pro essing and statisti s. The dete tion pro ess is performed bythe wireless nodes, whi h are equipped with low- ost Doppler radars for real-timeidenti� ation of wildlife movements. In detail, di�erent te hnologies valuable forsolving the problem and related o�-the-shelf solutions have been investigatedand properly tested in order to validate their a tual performan e onsidering thespe i� problem s enario. A �nal lassi� ation based on spe i� parameters hasallowed identifying the Doppler radar system as the better low- ost te hnologyfor ontributing to the problem obje tive. The performan e of the proposedsystem has also been investigated in a real s enario, whi h has been identi�edto be the a tual pilot site for the monitoring system. This on�rms the system apability of movements dete tion in the road proximity, thus de�ning a se urityarea along it, where all o urring events may be identi�ed.KeywordsWireless Sensor Network, Smart Environment, Road Safety, Sensors and A tua-tors, Distributed Monitoring

Published Conferen e Papers[C1℄ G. Oliveri, F. Robol, M. Carlin, and A. Massa, �Synthesis of largesparse linear arrays by bayesian ompressive sensing,� 5th EuropeanConferen e on Antennas and Propagation (EuCAP 2011), Rome,Italy, pp. 2203-2206, April 11-15, 2011.[C2℄ G. Oliveri, P. Ro a, F. Viani, F. Robol, and A. Massa, �Latestadvan es and innovative solutions in antenna array synthesis for mi- rowave wireless power transmission,� IEEE MTT-S InternationalMi rowave Workshop Series on �Innovative Wireless Power Trans-mission: Te hnologies, Systems, and Appli ations� (IMWS-IWPT2012), Kyoto, Japan, pp. 71-73, May 10-11, 2012.[C3℄ G. Fran es hetti, P. Ro a, F. Robol, and A. Massa, �Innovativere tenna design for spa e solar power systems,� IEEE MTT-S Inter-national Mi rowave Workshop Series on �Innovative Wireless PowerTransmission: Te hnologies, Systems, and Appli ations� (IMWS-IWPT2012), Kyoto, Japan, pp. 151-153, May 10-11, 2012.[C4℄ G. Fran es hetti, P. Ro a, F. Robol, and A. Massa, �Design and op-timization of e� ient re tenna systems for spa e solar power appli a-tions,� International Conferen e on Ele tromagneti s and Advan edAppli ations (ICEAA 2012), Cape Town, South Afri a, September 2-7, 2012 (Invited paper; Session title: �Wireless power transmission� -G. Fran es hetti and N. Shinohara).[C5℄ F. Viani, F. Robol, M. Salu i, E. Giarola, S. De Vigili, M. Ro a, F.Boldrini, G. Benedetti, and A. Massa, �WSN-based early alert sys-tem for preventing wildlife-vehi le ollisions in Alps regions - Fromthe laboratory test to the real-world implementation,� 7th EuropeanConferen e on Antennas and Propagation (EuCAP 2013) , Gothen-burg, Sweden, pp. 1857-1860, April 8-12, 2012.[C6℄ G. Menduni, F. Viani, F. Robol, E. Giarola, A. Polo, G. Oliveri, P.Ro a, and A. Massa, �A WSN-based ar hite ture for the E-Museum- The experien e at �Sala dei 500� in Palazzo Ve hio (Floren e),�i
Pro . 2013 IEEE AP-S International Symposium, Lake Buena Vista,Florida, USA, pp. 1114-1115, July 7-12, 2013.[C7℄ F. Viani, F. Robol, A. Polo, E. Giarola, and A. Massa, �Lo alizationstrategies in WSNs as applied to landslide monitoring,� 2013 Amer-i an Geophysi al Union Fall Meeting, San Fran is o, USA, p. A5,De ember 9-13, 2013 (Invited paper; Session title: �New te hnologiesin landslide monitoring and risk management� - A. Pasuto and L.S henato).[C8℄ F. Viani, F. Robol, E. Giarola, G. Benedetti, S. Devigili, and A.Massa, �Advan es in wildlife road- rossing early-alert system: new ar- hite ture and experimental validation,� 8th European Conferen e onAntennas and Propagation (EUCAP 2014), The Hague, The Nether-lands, pp. 3457-3461, April 6-11, 2014.[C9℄ A. Polo, F. Robol, C. Nardin, S. Mar hesi, A. Zorer, L. Zappini,F. Viani, and A. Massa, �De ision support system for �eet manage-ment based on TETRA terminals geolo ation,� 8th European Con-feren e on Antennas and Propagation (EUCAP 2014), The Hague,The Netherlands, pp. 1195-1198, April 6-11, 2014.[C10℄ F. Viani, A. Polo, F. Robol, G. Oliveri, P. Ro a, and A. Massa,�Crowd dete tion and o upan y estimation through indire t envi-ronmental measurements,� 8th European Conferen e on Antennasand Propagation (EUCAP 2014), The Hague, The Netherlands, pp.2127-2130, April 6-11, 2014.[C11℄ F. Viani, A. Polo, E. Giarola, F. Robol, P. Ro a, P. Garofalo, S.De Vigili, G. Benedetti, L. Zappini, A. Zorer, S. Mar hesi, and A.Massa, �Semanti wireless lo alization for innovative indoor/outdoorservi es,� Pro . 2014 IEEE AP-S International Symposium and USNC-URSI Radio S ien e Meeting, Memphis, Tennessee, USA, pp. 402-403, July 6-12, 2014.[C12℄ F. Viani, E. Giarola, F. Robol, G. Oliveri, and A. Massa, �Dis-tributed monitoring for energy onsumption optimization in smartbuildings,� Pro . 2014 IEEE Antenna Conferen e on Antenna Mea-surements and Appli ations (IEEE CAMA 2014), Antibes Juan-les-Pins, Fran e, pp. 1-3, November 16-19, 2014.[C13℄ F. Viani, E. Giarola, F. Robol, A. Polo, A. Lazzares hi, T. Moriyama,and A. Massa, �Passive wireless lo alization strategies for se urity inlarge indoor areas,� Pro . 2014 IEEE Antenna Conferen e on An-tenna Measurements and Appli ations (IEEE CAMA 2014), AntibesJuan-les-Pins, Fran e, pp. 1-3, November 16-19, 2014.ii

[C14℄ F. Viani, F. Robol, E. Giarola, A. Polo, A. Tos ano, and A. Massa,�Wireless monitoring of heterogeneous parameters in omplex mu-seum s enario,� Pro . 2014 IEEE Antenna Conferen e on AntennaMeasurements and Appli ations (IEEE CAMA 2014), Antibes Juan-les-Pins, Fran e, pp. 1-3, November 16-19, 2014.[C15℄ F.Viani, F. Robol, E. Giarola, P. Ro a, G. Oliveri, and A. Massa,�Passive imaging strategies for real-time tra king of non- ooperativetargets in se urity appli ations,� 9th European Conferen e on Anten-nas and Propagation (EUCAP 2015), Lisbon, Portugal, April 12-17,2015 (Invited paper; Session title: �Wave-based sensing and imagingfor se urity appli ations� - J. Martinez and C. Rappaport).[C16℄ F. Robol, F. Viani, A. Polo, E. Giarola, P. Garofalo, C. Zambiasi,and A. Massa, �Opportunisti rowd sensing in WiFi-enabled indoorareas,� Pro . 2015 IEEE AP-S International Symposium and USNC-URSI Radio S ien e Meeting, Van ouver, BC, Canada, July 19-25,2015 (Submitted).[C17℄ F. Viani, M. Salu i, F. Robol, E. Giarola, and A. Massa, �WSNs asenabling tool for next generation smart systems,� Atti XIX RiunioneNazionale di Elettromagnetismo (XIX RiNEm), Roma, pp. 393-396,10-14 Settembre 2012.[C18℄ E. Giarola, S. Mar hesi, A. Polo, F. Robol, F. Viani, L. Zappini, A.Zorer, and A. Massa, �Innovative wireless solutions for smart ities,�Atti XX Riunione Nazionale di Elettromagnetismo (XX RiNEm),Padova, pp. 385-388, 15-18 Settembre 2014.
iii

iv

Published Journals Papers[R1℄ F. Viani, M. Salu i, F. Robol, G. Oliveri, and A. Massa, �Design of aUHF RFID/GPS fra tal antenna for logisti s management,� Journalof Ele tromagneti Waves and Appli ations, vol. 26, pp. 480-492,2012.[R2℄ F. Viani, M. Salu i, F. Robol, and A. Massa, �Multiband fra talZigBee/WLAN antenna for ubiquitous wireless environments,� Jour-nal of Ele tromagneti Waves and Appli ations, vol. 26, no. 11-12,pp. 1554-1562, 2012.[R3℄ F. Viani, L. Poli, G. Oliveri, F. Robol, and A. Massa, �Sparse s at-terers imaging through approximated multi-task ompressive sensingstrategies,� Mi rowave and Opti al Te hnology Letters, vol. 55, no.7, pp. 1553-1557, July 2013.[R4℄ F. Viani, F. Robol, A. Polo, P. Ro a, G. Oliveri, and A. Massa,�Wireless ar hite tures for heterogeneous sensing in smart home ap-pli ations - Con epts and real implementations,� Pro eedings of theIEEE - Spe ial Issue on 'The Smart Home,' Invited Paper, vol. 101,no. 11, pp. 2381-2396, November 2013.[R5℄ G. Oliveri, L. Lizzi, F. Robol, and A. Massa, �Polarization-agile ADS-interleaved planar arrays,� Progress in Ele tromagneti Resear h, vol.142, pp. 771-798, 2013.[R6℄ G. Oliveri, E. Bekele, F. Robol, and A. Massa, �Sparsening onformalarrays through a versatile BCS-based method,� IEEE Transa tionson Antennas and Propagation - Spe ial Issue on �Innovative PhasedArray Antennas based on Non-regular Latti es and Overlapped Sub-arrays,� vol. 62, no. 4 (Part 1), pp. 1681-1689, April 2014.[R7℄ B. Majone, F. Viani, E. Filippi, A. Bellin, A. Massa, G. Toller, F.Robol, and M. Salu i, �Wireless sensor network deployment for mon-itoring soil moisture dynami s at the �eld s ale,� Pro edia Environ-mental S ien es, vol. 19, pp. 426-235, 2013.v

[R8℄ T. Moriyama, F. Viani, M. Salu i, F. Robol, and E. Giarola, �Planarmultiband antenna for 3G/4G advan ed wireless servi es,� IEICEEle troni s Express, vol. 11, no. 17, pp. 1-10, 10 September 2014.
vi
Contents1 Introdu tion 12 Wildlife Road Crossing Problem and Solutions 52.1 Roadside hara teristi s whi h may attra t wildlife . . . . . . . . 62.1.1 Wildlife Road Crossing Problem in the Provin e of Trento 62.2 State of the Art Solutions . . . . . . . . . . . . . . . . . . . . . . 103 Proposed Solution, Prototype and Validation 133.1 Proposed Solution: System Ar hite ture . . . . . . . . . . . . . . 143.2 Te hnology S outing . . . . . . . . . . . . . . . . . . . . . . . . . 183.2.1 Radar Te hnology . . . . . . . . . . . . . . . . . . . . . . . 183.2.2 Ultrasound Te hnology . . . . . . . . . . . . . . . . . . . . 193.2.3 Infrared Te hnology . . . . . . . . . . . . . . . . . . . . . . 193.2.4 Thermal Te hnology . . . . . . . . . . . . . . . . . . . . . 203.3 O�-The-Shelf Sensor Sele tion . . . . . . . . . . . . . . . . . . . . 213.4 Sensor Preliminary Setup and Testing . . . . . . . . . . . . . . . . 233.4.1 Radar Sensor RSM-1650 . . . . . . . . . . . . . . . . . . . 233.4.2 Ultrasound Sensor SRF485WPR . . . . . . . . . . . . . . . 313.4.3 Infrared Sensor PIR-SMD . . . . . . . . . . . . . . . . . . 383.4.4 Thermal Sensor TPA81 . . . . . . . . . . . . . . . . . . . . 453.5 WSN Node Ar hite ture . . . . . . . . . . . . . . . . . . . . . . . 513.5.1 WSN Node 3Mate Ar hite ture . . . . . . . . . . . . . . . 513.5.2 Power Consumption and Management of the IntegratedSolution . . . . . . . . . . . . . . . . . . . . . . . . . . . . 533.5.3 Hardware Interfa e of the Integrated Sensor Node . . . . . 593.6 Wireless Network Ar hite ture . . . . . . . . . . . . . . . . . . . . 663.6.1 Linear Network Ar hite ture . . . . . . . . . . . . . . . . . 663.6.2 Ring Network Ar hite ture . . . . . . . . . . . . . . . . . . 663.6.3 Star Network Ar hite ture . . . . . . . . . . . . . . . . . . 673.6.4 Mesh Network Ar hite ture . . . . . . . . . . . . . . . . . 683.6.5 Appli ation S enarios and Network Topology . . . . . . . . 683.7 Testing of the WSN Monitoring System in ontrolled Test-site . . 733.7.1 Test in Deer Fen e . . . . . . . . . . . . . . . . . . . . . . 74vii

4 Engineering and Pilot Site Extension 794.1 Doppler Radar . . . . . . . . . . . . . . . . . . . . . . . . . . . . 804.2 WSN Sensor Node Engineering . . . . . . . . . . . . . . . . . . . 854.2.1 WSN Node Platforms . . . . . . . . . . . . . . . . . . . . . 894.2.2 Prototype Layout Optimization . . . . . . . . . . . . . . . 944.2.3 Radar Sensor Support . . . . . . . . . . . . . . . . . . . . 984.2.4 Optimal Case De�nition . . . . . . . . . . . . . . . . . . . 1004.2.5 Integration Testing . . . . . . . . . . . . . . . . . . . . . . 1014.2.6 Controller Firmware . . . . . . . . . . . . . . . . . . . . . 1034.2.7 Event Dete tion Methodologies . . . . . . . . . . . . . . . 1074.3 Experimental Validation . . . . . . . . . . . . . . . . . . . . . . . 1104.4 Pilot Site Identi� ation and Sensor Node Installation . . . . . . . 1144.4.1 Experimental Testing . . . . . . . . . . . . . . . . . . . . . 1195 Con lusions 1295.1 Con lusion and Future Development . . . . . . . . . . . . . . . . 130A Complete Cir uital S heme of the WSN Node-SensorsInterfa ing Board 143
viii

List of Tables2.1 Fauna spe ies on the provin ial territory: spe ies, number andexpe ted trend. . . . . . . . . . . . . . . . . . . . . . . . . . . . . 72.2 Fauna ollisions in the last de ades. . . . . . . . . . . . . . . . . 83.1 Radar te hnology: available o�-the-shelf produ ts. . . . . . . . . 213.2 Ultrasound te hnology: available o�-the-shelf produ ts. . . . . . 213.3 Infrared te hnology: available o�-the-shelf produ ts. . . . . . . . 213.4 Thermal te hnology: available o�-the-shelf produ ts. . . . . . . . 223.5 Power budget: main omponents of the integrated sensor nodeand related urrent onsumption using 12Volt battery. . . . . . . 543.6 Power budget: main omponents of the integrated sensor nodeand related power onsumption using 12Volt battery. . . . . . . . 553.7 Power budget: main omponents of the integrated sensor nodeand related urrent onsumption using 6Volt battery. . . . . . . . 553.8 Power budget: main omponents of the integrated sensor nodeand related power onsumption using 6Volt battery. . . . . . . . 563.9 Ele tri al and ommuni ation hara teristi s of sensors and WSNnode. . . . . . . . . . . . . . . . . . . . . . . . . . . . . . . . . . 603.10 Spe i� input and output onne tions of the analog swit h forsensors management. . . . . . . . . . . . . . . . . . . . . . . . . 643.11 Sensors evaluation on the basis of four main parameters given bythe experimental tests out ome and spe i� te hnology features. 77
ix

LIST OF TABLES
x

List of Figures2.1 Risk map of the roads in the Provin e of Trento. . . . . . . . . . 82.2 Re�e tive devi e used on road delimiters. . . . . . . . . . . . . . 92.3 Example of a tive wildlife monitoring system [5℄: (a) devi e, (b)animal wearing the devi e. . . . . . . . . . . . . . . . . . . . . . 122.4 Typi al road infrastru tures: (a) fen e applied to road overpass,(b) wildlife e o-pass over road, ( ) wildlife underpass near �ood,(d) wildlife underpass in rural area. . . . . . . . . . . . . . . . . 123.1 Wildlife road rossing monitoring system: risk de�nition s heme. 143.2 WSN system ar hite ture: sensor and a tuator devi es for thedete tion of wildlife movement along road stret hes and promptalert. . . . . . . . . . . . . . . . . . . . . . . . . . . . . . . . . . 153.3 Radar sensor RSM-1650: dimensions and onne tion pins. . . . . 243.4 High pass �lter: ut frequen y 154Hz. . . . . . . . . . . . . . . . 253.5 Low pass �lter: ut frequen y 3.39KHz. . . . . . . . . . . . . . . 253.6 Double semi-wave re ti�er. . . . . . . . . . . . . . . . . . . . . . 263.7 S hmidt trigger with hysteresis and tunable threshold. . . . . . . 263.8 Radar sensor interfa e board: pro essing of output signal. . . . . 273.9 Radar sensor testing setup. . . . . . . . . . . . . . . . . . . . . . 283.10 Radar sensor testing setup: (a) a tive LED for movement dete -tion, (b) LED o� for no movement dete tion. . . . . . . . . . . . 283.11 Radar sensor testing: target with onstant speed 1Km/h. . . . . 293.12 Radar sensor testing: target with speed in the range 3.5-5Km/h. 293.13 Radar sensor testing - target moves away from the sensor planewith onstant speed: (a) experimental s enario, (b) radar outputsignal. . . . . . . . . . . . . . . . . . . . . . . . . . . . . . . . . . 303.14 Radar sensor testing - target moves towards the sensor plane with onstant speed: (a) experimental s enario, (b) radar output sig-nal. . . . . . . . . . . . . . . . . . . . . . . . . . . . . . . . . . . 303.15 Radar sensor testing - target is still in front of the radar sensor:(a) experimental s enario, (b) radar output signal. . . . . . . . . 313.16 Ultrasound sensor testing setup: (a) sensor view, (b) sensor on-ne tion s heme. . . . . . . . . . . . . . . . . . . . . . . . . . . . 323.17 RS-485 proto ol: transmission example. . . . . . . . . . . . . . . 32xi
LIST OF FIGURES3.18 Ultrasound sensor testing setup: USB-RS485 onverter and SRF485WPRsensor. . . . . . . . . . . . . . . . . . . . . . . . . . . . . . . . . 333.19 Ultrasound sensor testing setup: re eption data on Matlab workspa e.343.20 Ultrasound sensor testing: log �le with the measured data. . . . 353.21 Ultrasound sensor validation setup. . . . . . . . . . . . . . . . . . 353.22 Ultrasound sensor testing setup. . . . . . . . . . . . . . . . . . . 363.23 Ultrasound sensor testing: (a) target approa hing the sensor, (b)target in steady position in front of the sensor. . . . . . . . . . . 373.24 Ultrasound sensor testing setup. . . . . . . . . . . . . . . . . . . 373.25 Infrared sensor: (a) front view, (b) bottom view. . . . . . . . . . 393.26 Infrared sensor testing setup. . . . . . . . . . . . . . . . . . . . . 403.27 Infrared sensor testing: (a) target approa hing the sensor, (b)sensor output signal a quired with os illos ope. . . . . . . . . . . 413.28 Infrared sensor testing: sensor output signal a quired with os il-los ope while target leaves the sensor plane. . . . . . . . . . . . . 423.29 Infrared sensor testing: (a) sensor output signal a quired withos illos ope while target approa hes the sensor plane starting from7.0m, (b) sensor output signal a quired with os illos ope whiletarget leaves the sensor plane from 4.5m. . . . . . . . . . . . . . 423.30 Infrared sensor testing: (a) target moving tangentially in frontof the sensor, (b) sensor output signal a quired with os illos opewhile the target moves tangentially at 3.5m. . . . . . . . . . . . . 433.31 Infrared sensor testing: sensor output signal a quired with os il-los ope while the target moves tangentially at 7.0m. . . . . . . . 443.32 Infrared sensor testing: (a) target standing in front of the sensor,(b) sensor output signal a quired with os illos ope while the targetstands in front of the sensor at 2m distan e. . . . . . . . . . . . . 443.33 Thermal sensor TPA81: (a) onne tion pins, (b) sensor dimension. 463.34 Thermal sensor TPA81 onne ted to the I2C-USB onverter. . . 463.35 Thermal sensor TPA81: (a) data a quisition example in Matlabworkspa e, (b) real-time olor map generated on data a quisition. 473.36 Thermal sensor TPA81 testing setup. . . . . . . . . . . . . . . . 483.37 Thermal sensor TPA81: olor map representative of a target pla edon the left side of the sensor �eld-of-view. . . . . . . . . . . . . . 493.38 Thermal sensor TPA81: olor map representative of a target mov-ing at 2m distan e from the sensor plane. . . . . . . . . . . . . . 493.39 WSN node 3Mate: (a) front side, (b) ba k side. . . . . . . . . . . 513.40 WSN node 3Mate: (a) programmer board, (b) 3Mate devi e withprogrammer board. . . . . . . . . . . . . . . . . . . . . . . . . . 523.41 WSN node 3Mate: onne tion strips. . . . . . . . . . . . . . . . . 523.42 WSN node 3Mate: integration s heme. . . . . . . . . . . . . . . . 53xii

LIST OF FIGURES3.43 Voltage regulators ir uital s heme: (a) step-down regulator 6.0V-3.3V, (b) step-down regulator 6.0V-5.0V, ( ) step-up regulator6.0V-12.0V. . . . . . . . . . . . . . . . . . . . . . . . . . . . . . . 613.44 Radar sensor onditioning stages and onne tion to WSN node ontroller: ir uital s heme. . . . . . . . . . . . . . . . . . . . . . 623.45 Ultrasound sensor onne tion to WSN node ontroller: ir uitals heme. . . . . . . . . . . . . . . . . . . . . . . . . . . . . . . . . 633.46 Infrared sensor onne tion toWSN node ontroller: ir uital s heme.633.47 Analog swit h onne tion to WSN node ontroller and sensors: ir uital s heme. . . . . . . . . . . . . . . . . . . . . . . . . . . . 643.48 Integrated sensor node prototype: (a) ir uital board, (b) inte-grated devi e. . . . . . . . . . . . . . . . . . . . . . . . . . . . . 653.49 Linear network ar hite ture s heme. . . . . . . . . . . . . . . . . 663.50 Ring network ar hite ture s heme. . . . . . . . . . . . . . . . . . 673.51 Star network ar hite ture s heme. . . . . . . . . . . . . . . . . . 673.52 Mesh network ar hite ture s heme. . . . . . . . . . . . . . . . . . 683.53 WSN node radio trans eiver overage: s heme and diameter of the overed area. . . . . . . . . . . . . . . . . . . . . . . . . . . . . . 693.54 Controlled environment of redu ed dimensions. . . . . . . . . . . 703.55 Controlled environment of medium/large dimensions. . . . . . . . 703.56 Experimental test site: network topology sket h. . . . . . . . . . 723.57 WSN monitoring system testing: (a) approa hing event, (b) graph-i al interfa e showing the event dete tion. . . . . . . . . . . . . . 733.58 WSN monitoring system testing: (a) lateral movement, (b) graph-i al interfa e showing the event dete tion. . . . . . . . . . . . . . 743.59 WSN monitoring system testing: sensor node position inside thedeer fen e. . . . . . . . . . . . . . . . . . . . . . . . . . . . . . . 743.60 WSN monitoring system testing: (a) lateral approa hing move-ment, (b) leaving movement, ( ) graphi al interfa e showing theapproa hing event dete tion, (d) graphi al interfa e showing theleaving event dete tion. . . . . . . . . . . . . . . . . . . . . . . . 753.61 WSN monitoring system testing: (a) deers movement, (b) graph-i al interfa e showing the event dete tion. . . . . . . . . . . . . . 764.1 Doppler e�e t s heme. . . . . . . . . . . . . . . . . . . . . . . . . 814.2 Doppler radar s heme. . . . . . . . . . . . . . . . . . . . . . . . . 824.3 WSN sensor node �eld-of-view: (a) single radar module, (b) dou-ble radar module. . . . . . . . . . . . . . . . . . . . . . . . . . . 854.4 Blo k diagram of the onditioning stage in ase of double radarmodule. . . . . . . . . . . . . . . . . . . . . . . . . . . . . . . . . 864.5 Radar signal output of the �rst ampli�er stage: (a) leaving move-ment, (b) approa hing movement. . . . . . . . . . . . . . . . . . 87xiii

LIST OF FIGURES4.6 Radar signal output of the omplete onditioning stage: (a) leav-ing movement, (b) approa hing movement. . . . . . . . . . . . . 884.7 WSN node platforms: 3Mate devi e. . . . . . . . . . . . . . . . . 904.8 WSN node platforms: TinyNode devi e. . . . . . . . . . . . . . . 904.9 WSN node platforms: Flyport devi e. . . . . . . . . . . . . . . . 914.10 WSN node platforms: Arduino and XBee devi es. . . . . . . . . 924.11 WSN node platforms testing: experimental test s enario map andaltitude measurements. . . . . . . . . . . . . . . . . . . . . . . . 924.12 WSN node platforms testing: experimental setup and nodes posi-tion. . . . . . . . . . . . . . . . . . . . . . . . . . . . . . . . . . . 934.13 WSN sensor node prototype optimization: ir uital s heme. . . . 974.14 WSN sensor node prototype optimization: board layout. . . . . . 984.15 WSN sensor node prototype optimization: radar sensor axial joint. 994.16 WSN sensor node prototype optimization: radar sensors and sup-ports. . . . . . . . . . . . . . . . . . . . . . . . . . . . . . . . . . 994.17 Optimal ase de�nition: (a) front view and dimensions, (b) ba kview and �xing holes. . . . . . . . . . . . . . . . . . . . . . . . . 1014.18 Optimal ase de�nition: (a) sliding pro�le for board insertion, (b)insertion guide and lo k. . . . . . . . . . . . . . . . . . . . . . . 1024.19 Controller �rmware �ux diagram. . . . . . . . . . . . . . . . . . . 1054.20 Controller �rmware �ux diagram: battery voltage he k and adap-tive sensor node a tivity regulation. . . . . . . . . . . . . . . . . 1064.21 Movement event: radar signal output of the hardware pre-pro essingmethodology. . . . . . . . . . . . . . . . . . . . . . . . . . . . . . 1084.22 Experimental testing: (a) sensor node installation support, (b)sensor node installation height. . . . . . . . . . . . . . . . . . . . 1104.23 Experimental testing sensor node installation distan e. . . . . . . 1114.24 Experimental testing: data log �le. . . . . . . . . . . . . . . . . . 1124.25 Experimental testing: lateral movement in sensor nodes �eld-of-view. . . . . . . . . . . . . . . . . . . . . . . . . . . . . . . . . . 1134.26 Pilot site: (a) map lo ation, (b) node installation sket h. . . . . 1144.27 Wildlife road rossing monitoring system: risk de�nition s heme. 1154.28 Sensor nodes under onstru tion. . . . . . . . . . . . . . . . . . . 1154.29 Sensor nodes installation on the pilot site. . . . . . . . . . . . . . 1164.30 Pilot site: (a) variable message panel and position of some sen-sor nodes signed by red marker, (b) variable message panel andposition of gateway node signed by yellow marker, ( ) gatewaynode installation, (d) gateway node Yagi antenna and veri� ationsystem. . . . . . . . . . . . . . . . . . . . . . . . . . . . . . . . . 1184.31 Pilot site experimental testing: (a) approa hing, leaving and lat-eral movements, (b) road rossing movements. . . . . . . . . . . 1194.32 Experimental testing: (a) pro essed radar signal during approa h-ing event, (b) pro essed radar signal during leaving event. . . . . 120xiv

LIST OF FIGURES4.33 Pilot site experimental movement tests: (a)-(b) orthogonal tonode #5 and pro essed radar signal, ( )-(d) orthogonal to node#6 and pro essed radar signal, (e)-(f) lateral to node #5 andpro essed radar signal, (g)-(h) lateral to node #6 and pro essedradar signal. . . . . . . . . . . . . . . . . . . . . . . . . . . . . . . 1214.34 Pilot site experimental movement tests: (a)-(b) lateral to node#6 and pro essed radar signal, ( )-(d) lateral to nodes #5 and#6 and pro essed radar signal, (e)-(f) lateral approa h to nodes#6 and #5 and pro essed radar signal. . . . . . . . . . . . . . . 1224.35 Pilot site experimental tests: (a) target moving out of the se u-rity area, (b) pro essed radar signal when target moving out ofthe se urity area, ( ) target moving inside the se urity area, (d)pro essed radar signal when target moving inside the se urity area. 1234.36 Pilot site experimental tests: (a)-(b) road rossing near nodes#5 and #1 and pro essed radar signal, ( )-(d) road rossing nearnodes #6 and #2 and pro essed radar signal, (e)-(f) road rossingnear nodes #5 and #2 and pro essed radar signal, (g)-(h) road rossing near nodes #6 and #3 and pro essed radar signal. . . . 1244.37 Pilot site experimental tests: (a)-(b) road rossing near nodes#7 and #2 and pro essed radar signal, ( )-(d) road rossing nearnodes #5 and #3 and pro essed radar signal, (e)-(f) road rossingnear nodes #7 and #1 and pro essed radar signal. . . . . . . . . 1254.38 Pilot site: battery re harge. . . . . . . . . . . . . . . . . . . . . . 1264.39 Pilot site: (a)-(b)-( ) roe-deer road orssing event, su essive timeinstants, (d) pro essed radar signal a quired for the roe-deer road rossing event. . . . . . . . . . . . . . . . . . . . . . . . . . . . . 1275.1 A tuator node of the monitoring system: (a) developed prototype,(b) proposed �nal solution. . . . . . . . . . . . . . . . . . . . . . 131A.1 Cir uital s heme of the WSN node-sensors interfa ing board. . . 143
xv

LIST OF FIGURES
xvi

Chapter 1Introdu tionWildlife monitoring has attra ted more and more attention during the lastde ades. In this framework, the problem of wildlife road- rossing is here onsid-ered. In the last years, most of the mountain roads in Alps regions have beena�e ted by an in reasing number of wildlife-vehi le ollisions mainly due to thehigh �ow of tourism and the limati hanges that for e animals to move at dif-ferent altitudes. The negative e�e ts of roads on wildlife are well do umentedand the animal mortality be ause of vehi le ollisions is onstantly in reasing [1℄.The problem of rossing-event also onstitutes a major publi safety on ern fortransportations espe ially in mountain regions. Many solutions have been intro-du ed in road fa ilities to minimize the wildlife-vehi le ollisions, mainly based onfen ing and rossing stru tures that prevent ungulates to a ess the road. Unfor-tunately, the osts of road upgrades limit a wide di�usion of preventive stru tures.Therefore, �nding reliable and ost-e�e tive methods for ollision prevention rep-resents a hallenging obje tive for many wildlife management agen ies. State-of-the-art studies are devoted to monitor wildlife a tivities for tra king and behavioranalysis [2, 3℄ with integrated often wearable sensors. The most di�used te hno-logi al solutions are based on global positioning systems (GPSs), radio-frequen yidenti� ation (RFIDs), and video ameras. Unfortunately, these a tive (i.e. withwearable devi es) systems annot be exploited for road rossing-event dete tionof non- ontrolled spe ies. Other studies are fo used on the understanding of an-imal behavior, their physiology, so ialization, and di�usion [4, 5℄. To this end,resear hers have proposed many autonomous monitoring systems mainly basedon wireless sensor network (WSN) infrastru tures [6, 7℄. Thanks to their s ala-bility and pervasiveness, WSN-based systems have been widely adopted for themonitoring of heterogeneous real-world data and events, su h as the soil hara -teristi s in pre ision agri ulture [8℄, the ele tromagneti pollution in urban areas[9, 10℄, the artworks preservation in museums [11℄, up to the lo alization andtra king of trans eiver-free targets [12, 13, 14, 15, 16, 17, 21℄. The ompa t size,the robustness and the long lifetime of WSNs have been exploited in those so-lutions where animals are equipped with battery powered sensors (e.g. ollars)1

able to olle t heterogeneous spatio-temporal data related to movements andpositions. However, this system ar hite ture omposed by wearable devi es isvaluable only when a known and �nite set of animals is monitored. A di�er-ent approa h is needed for the passive monitoring of trans eiver-free (i.e. notequipped with a tive devi es) animals.This work deals with a prevention system for wildlife-vehi le ollisions basedon a sensor/a tuator network able to dete t the presen e of animals in the prox-imity of the road and to immediately alert the drivers. More spe i� ally, awireless sensor network (WSN) infrastru ture is exploited as a powerful platformfor pro essing data olle ted from the environment and for the event signaling[18℄. The nodes of the WSN onsist of low- ost and ompa t devi es, installedon the road sides, with sensing and pro essing apabilities. Ea h node is wire-lessly onne ted to the others to perform distributed and ooperative sensingtasks. The nodes are equipped with spe i� sensors able to e�e tively dete t thepresen e and the movements of animals (e.g., ungulates) approa hing the roadproximity. Additional parameters may be evaluated, like the dire tion and thevelo ity of wildlife movement, in order to enable a reliable and real-time falsealarm dete tion [19, 20, 22, 23, 24℄. Ea h sensing devi e allows identifying a�nite-size warning area along the road path, whi h orresponds to the sensors�eld-of-view. The real-time event dete tion is shared among the WSN nodes thusto promptly monitor not only the area sorrounding the WSN node, whi h �rstlydete ts the events, but also the area monitored by the other sensing devi es inthe proximity. This information, then, may trigger the a tuation poli ies to alertdrivers of the risky ondition. In fa t, on e the sensed information is interpretedas a rossing-event, the a tuators of the WSN platform ould be a tivated towarn the alarm for driver se urity (e.g., a light signal system installed on theroadside). The olle ted information is also transmitted to a remote ontrolunit for su essive data analysis and statisti s. The proposed early-alert systemhas been experimentally validated through a real small-s ale deployment in Alpsregion. Preliminary results have assessed the potentialities of the approa h indealing with ungulates road rossing dete tion and signaling.Therefore, the ondu ted te hnology transfer a tivity has been aimed at de-signing and developing a system able to monitor and alert drivers of the pres-en e of wildlife animals approa hing the monitored road in order to preventwildlife-vehi le ollision. A tually there is no an e�e tive solution to the pre-sented problem, whi h in turns produ es huge osts for Publi Administration.As an example, in the Provin e of Trento, there are about 600 wildlife to ve-hi le ollisions per year and till the year 2014, drivers refund for the a identwas about up to the 70% of the experien ed damages. Nowadays, the restri tionpoli ies have implied to negle t this reimbursement formula and hen e solutionslike the one proposed may be valuable approa hes to the problem.2

CHAPTER 1. INTRODUCTIONThesis outlineThe thesis is organized as follows. Firstly, the wildlife road rosing problemis dis ussed, by analyzing the a tual solutions to the problem used nowadaysin Chapter 2. Then, the approa h to the problem is presented in Chapter 3,by des ribing the proposed solution to prevent wildlife-vehi le ollision. In this ontext, the te hnologi al solutions identi�ed to be integrated in the sensingdevi e are des ribed, analyzing the features for ea h adopted te hnology. Anexperimental validation ampaign emphasizes advantages and disadvantages ofea h te hnology and in parti ular of the spe i� o�-the-shelf devi es, whi h hasbeen hosen for the integration with the sensing WSN devi e. On the basis ofthe out omes obtained during the experimental validation, the �nal te hnologi al hoi e is de�ned in Chapter 4 together with the engineering pro ess on the basis ofthe prototypal platform, whi h is ondu ted in order to improve the performan e,while redu ing dimensions and energy onsumption. Then the a tual installationon the experimental test-site is presented and �nal on lusions are drawn inChapter 5.
3

4

Chapter 2Wildlife Road Crossing Problemand SolutionsIn this hapter, the problem on erning wildlife road rossing is presented. State-of-the-art studies are mainly devoted to monitor wildlife a tivities for tra kingand behavior analysis [2, 3℄ by exploiting integrated sensors most of whi h arewearable ones. Many a tual solutions have also been introdu ed in road fa ili-ties in order to minimize wildlife-vehi le ollisions, mainly based on fen ing and rossing stru tures, whi h should prevent ungulates to a ess the road. The hugenumber of in idents registered nowadays lead to infer the redu ed e�e tivenessof the experimented solutions, thus motivating the de�nition of a more e� ientsystem to address the problem.
5

2.1. ROADSIDE CHARACTERISTICS WHICH MAY ATTRACTWILDLIFE2.1 Roadside hara teristi s whi h may attra twildlifeWildlife- ollision areas exhibit some ommon feature, whi h appeal wildlife thusin reasing the risk of ollision with in transit vehi les. Some of these hara ter-isti s are listed below and their knowledge may be exploited in order to learlyidentify more risky road areas and to in rease driver awareness about the prob-lem:• Areas of good forage: on the basis of the parti ular periodi ity, animalsmoves from more remote areas down into the valley looking for food, giventhat at higher altitudes the food resour es may be depleted or nature isstill frozen, if we osider autumn and winter seasons.• Proximity to water sour es: wildlife is attra ted to fresh water sour es,often pla ed in reeks parallel or interse ting roads.• Wide open and/or isolated, lear stret hes of road: wildlife-vehi le olli-sions o ur most of the times during lear nights, on dry roads onditionsand on straight stret hes of road or quite isolated areas. In fa t, animalsare attra ted by these onditions, sin e there are few vehi les and humana tivity is quite redu ed. At the same time, the same onditions give more on�den e to drivers on behalf of higher visibility and a false sense of in- reased se urity.In addition to these features, it is possible to identify other hara teristi s in ommon to many ollisions registered in last years. In parti ular, dawn andsunset are peak a tivity times for wildlife ollisions and most of in idents happenbetween 7:00pm and midnight. This is due to the fa t that animals exploit �rstand last glimmers of light, respe tively, for looking forward for food and forage,given also the redu ed tra� a tivity along roads during these hours.Therefore these simple rules may be of publi domain in order to in rease itizen awareness to the problem and to improve their fore ast and rea tionability, establishing a virtuous behaviuor.2.1.1 Wildlife Road Crossing Problem in the Provin e ofTrentoThe provin ial territory is mainly hara terized by Alps regions over an area ofabout 620668 he tares, the 70% of whi h present an altitude higher than 1000mto the sea level. The a tual surfa e overed by forests is around 345000 he tares,namely the 56% of the intire provin ial territory. Grazing land represents aboutthe 17% and the remaining is mainly divided among agri ultural a tvities andurban areas. Over this area a great variety of �ora and fauna is present, ranging6

CHAPTER 2. WILDLIFE ROAD CROSSING PROBLEM AND SOLUTIONSfrom mediterrean spe ies to mountain and sub-alpine woods. Con erning fauna,instead, Table 2.1 reports the main spe ies present on the territory, their a tualnumber and the expe ted trend (data given by the 'Servizio Gestione Strade' ofthe Provin e of Trento).Spe ies Individual Number TrendRoe Deer 26016 in reasingDeer 9123 in reasingChamois 24520 stableWild Boar 150 /Steinbo k 400 stableMou�on 860 de reasingHare 5000-6000 de reasingMarmot 10000-12000 stableBear 23-25 in reasingTable 2.1: Fauna spe ies on the provin ial territory: spe ies, number and ex-pe ted trend.
The roads in the Trentino Region are lassi�ed as state and provin ial roads,for a total length of about 2375Km, divided in 1511Km of provin ial roads and864Km of state roads. In parti ular, the mountain roads overs around 2140Km,while the remaining 235Km are represented by valley roads.In addition, the Provin e of Trento is in harge of monitoring roads statusand guarantee se urity also onsidering the in idents prevention due to the lo alfauna. To this end, risk maps have been generated on the basis of the registeredin idents along the roads of the provin e, as shown in Fig. 2.1. In parti ular,the risk level is lassi�ed in four main ategories, namely low-, moderate-, risk,high- risk onditions to whi h a olor is assigned for the map generation.In Trentino, the data related to in idents due to fauna are stored on a databsesin e the year 1993 in ful�llment of a spe i� legislation, whi h implies the olli-sion ommuni ation to the authority. Table 2.2 reports the data related to faunain idents of the last de ades. 7
2.1. ROADSIDE CHARACTERISTICS WHICH MAY ATTRACTWILDLIFE
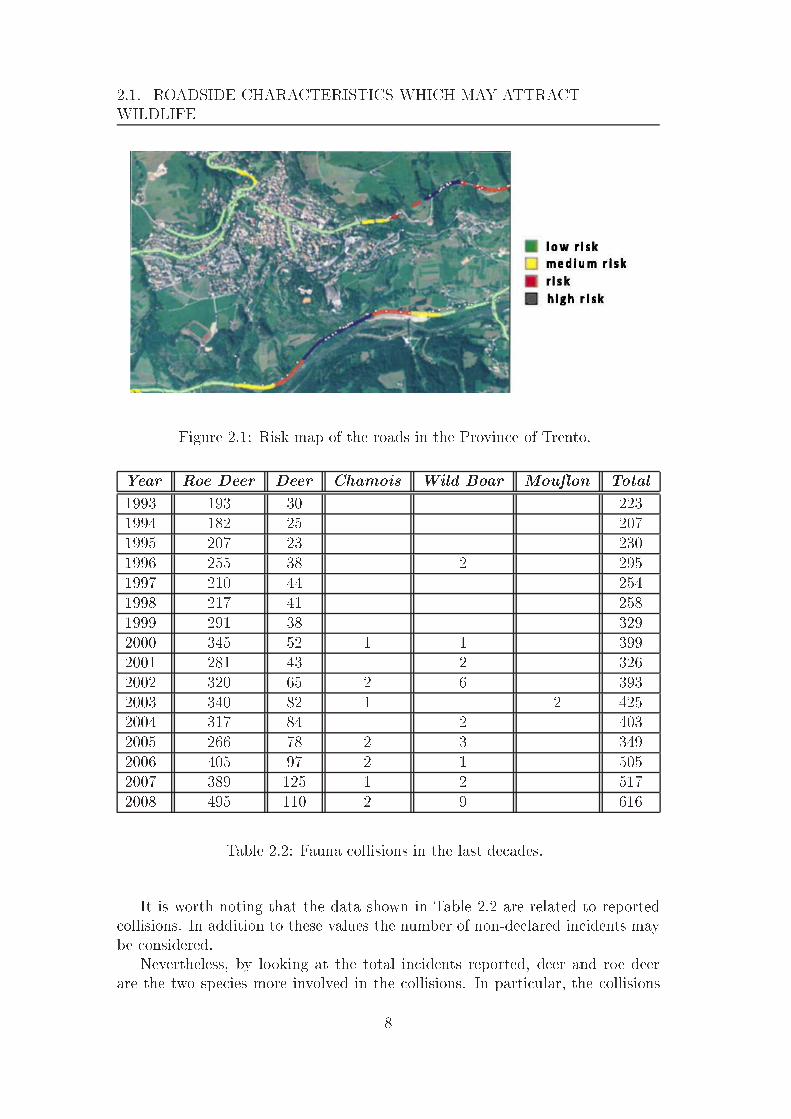
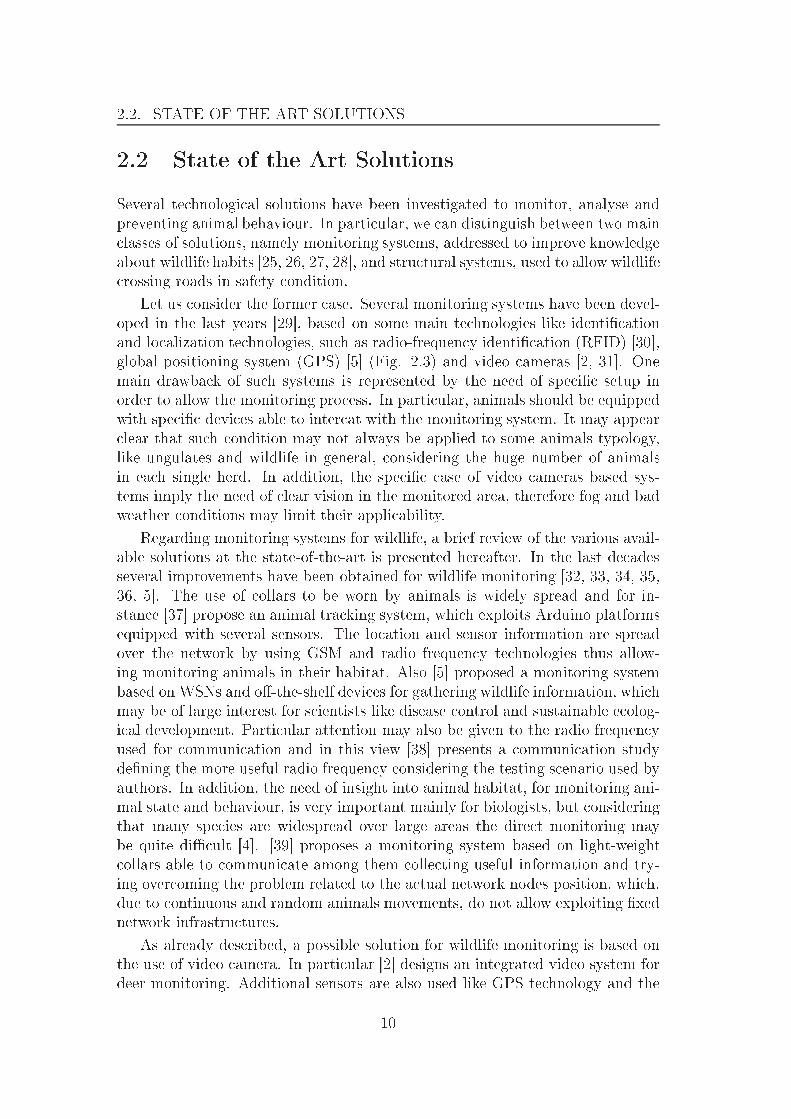
Figure 2.1: Risk map of the roads in the Provin e of Trento.Year Roe Deer Deer Chamois Wild Boar Mou�on Total1993 193 30 2231994 182 25 2071995 207 23 2301996 255 38 2 2951997 210 44 2541998 217 41 2581999 291 38 3292000 345 52 1 1 3992001 281 43 2 3262002 320 65 2 6 3932003 340 82 1 2 4252004 317 84 2 4032005 266 78 2 3 3492006 405 97 2 1 5052007 389 125 1 2 5172008 495 110 2 9 616Table 2.2: Fauna ollisions in the last de ades.It is worth noting that the data shown in Table 2.2 are related to reported ollisions. In addition to these values the number of non-de lared in idents maybe onsidered.Nevertheless, by looking at the total in idents reported, deer and roe deerare the two spe ies more involved in the ollisions. In parti ular, the ollisions8

CHAPTER 2. WILDLIFE ROAD CROSSING PROBLEM AND SOLUTIONSpeaks are registered during autumn and spring seasons in relation to the highermobility of the fauna during su h periods of the year.In addition, also birds and small size spe ies are vi tims of vehi le ollisions,but given their redu ed size, the gathering data pro ess is quite di� ult and thussu h in idents may es ape from the survey.Among the intervention ondu ted by the Provin e of Trento in order to limitthe fauna ollisions, barriers, fen es and re�e tive devi es have been a tuated.In parti ular, regarding the re�e tive devi es (Fig. 2.2), the Provin e of Trentostarted with their installation in the 1998 along 160 stret hed of roads for about101Km, as an experimental test. Su h devi es should re�e t the vehi les lightstowards the external se tion of the road, su h that an approa hing animal shouldbe s ared by the re�e ted light stopping and leaving the s ene. Nevertheless,a study ondu ted in order to evaluate the e�e tiveness of the implementedsolution states that no a tual bene�t is given by the presen e of the re�e tivedevi es, given that the a tual number of ollisions do not de rease sin e theirpresen e on the road margins. Therefore this may suggest that fauna in identsare mainly related to seasonal onditions and thus the e�e tiveness of su h devi eshas already to be evaluated.
Figure 2.2: Re�e tive devi e used on road delimiters.Additional interventions regard the installation of illuminated road signs,pla ed along high-risk roads and equipped with tra� sensors, thus a tivatingthe signal when vehi les transit over the road.9
2.2. STATE OF THE ART SOLUTIONS2.2 State of the Art SolutionsSeveral te hnologi al solutions have been investigated to monitor, analyse andpreventing animal behaviour. In parti ular, we an distinguish between two main lasses of solutions, namely monitoring systems, addressed to improve knowledgeabout wildlife habits [25, 26, 27, 28℄, and stru tural systems, used to allow wildlife rossing roads in safety ondition.Let us onsider the former ase. Several monitoring systems have been devel-oped in the last years [29℄, based on some main te hnologies like identi� ationand lo alization te hnologies, su h as radio-frequen y identi� ation (RFID) [30℄,global positioning system (GPS) [5℄ (Fig. 2.3) and video ameras [2, 31℄. Onemain drawba k of su h systems is represented by the need of spe i� setup inorder to allow the monitoring pro ess. In parti ular, animals should be equippedwith spe i� devi es able to inter at with the monitoring system. It may appear lear that su h ondition may not always be applied to some animals typology,like ungulates and wildlife in general, onsidering the huge number of animalsin ea h single herd. In addition, the spe i� ase of video ameras based sys-tems imply the need of lear vision in the monitored area, therefore fog and badweather onditions may limit their appli ability.Regarding monitoring systems for wildlife, a brief review of the various avail-able solutions at the state-of-the-art is presented hereafter. In the last de adesseveral improvements have been obtained for wildlife monitoring [32, 33, 34, 35,36, 5℄. The use of ollars to be worn by animals is widely spread and for in-stan e [37℄ propose an animal tra king system, whi h exploits Arduino platformsequipped with several sensors. The lo ation and sensor information are spreadover the network by using GSM and radio frequen y te hnologies thus allow-ing monitoring animals in their habitat. Also [5℄ proposed a monitoring systembased on WSNs and o�-the-shelf devi es for gathering wildlife information, whi hmay be of large interest for s ientists like disease ontrol and sustainable e olog-i al development. Parti ular attention may also be given to the radio frequen yused for ommuni ation and in this view [38℄ presents a ommuni ation studyde�ning the more useful radio frequen y onsidering the testing s enario used byauthors. In addition, the need of insight into animal habitat, for monitoring ani-mal state and behaviour, is very important mainly for biologists, but onsideringthat many spe ies are widespread over large areas the dire t monitoring maybe quite di� ult [4℄. [39℄ proposes a monitoring system based on light-weight ollars able to ommuni ate among them olle ting useful information and try-ing over oming the problem related to the a tual network nodes position, whi h,due to ontinuous and random animals movements, do not allow exploiting �xednetwork infrastru tures.As already des ribed, a possible solution for wildlife monitoring is based onthe use of video amera. In parti ular [2℄ designs an integrated video system fordeer monitoring. Additional sensors are also used like GPS te hnology and the10

CHAPTER 2. WILDLIFE ROAD CROSSING PROBLEM AND SOLUTIONSsystem obje tive is mainly fo used on the understanding and analysis of animalsbehaviour.Another important issue regards the dete tion algorithms implemented gener-ally on board of WSN devi es, as des ribed in [40, 41℄, where the sensor nodes are onsiderd not only as sensing devi es but also in luding pro essing apabilitiesuseful for dete tion making.[42, 43, 44, 45, 46, 47, 48, 49, 50℄, instead, are mainly fo used on design-ing energy-e� ient routing proto ols, given the limited resour es of the systemdevi es batteries, whi h may not easily a essed for long periods of time. Sim-ilar, [51℄ proposes a novel dissemination proto ol, alled Seal-2-Seal, for datagathering through sparse nodes, whi h are intermittently onne ted to the net-work, allowing the deployment of larger number of sensor nodes rather than donebefore.An approa h to wildlife rossings is presented in [52℄, where the problem ofelephants rail tra k rossing is addressed. In parti ular, the use of sensing andinfrasoni a tuator nodes should deter animals by rossing the rail tra k.Let us now fo us on the road infrastru tures for preventing wildlife-vehi le ollisions. Common solutions are represented by fen ing and rossing stru turesused to limit wildlife a ess to roads. The ombined use of su h stru turesleads dire ting animals towards under- or over- passes, whi h allow the safe oexisten e of wildlife, vehi les and roads. The main problem with this kind ofsolutions is represented by the huge osts required for their realization, whi hbrings Publi Administrations to apply su h te hnolgy only for spe i� ases orwhenever nature may give aid to the a tual reation (i.e., parti ular geologi alshape). Fig. 2.4 shows some examples of the mentioned road insfrastru tureswidely used in order to limit wildlife rossing roads.Alternative to fen ing and rossing stru tures is represented by re�e tive de-vi es mounted on road delimiters spe i� ally designed to re-dire t ar lights to-wards external road areas, thus alerting animals and diverting them to approa hthat zone. These devi es are widely used nowadays, given the quite redu ed ost,the low maintenan e level and the easy of installation.In addition, road stret hes equipped with these devi es are in general om-bined with the installation of spe i� road signs, ra�gurating an ungulate, whi hmay be printed or omposed by led-lights, thus allowing the a tual sign in pres-en e of moving vehi les. Nevertheless, the stati and repeated presen e of su hroad-signs lead drivers to de rease their attention level along the a�e ted roads,be ause of the habit-phenomenon.11

2.2. STATE OF THE ART SOLUTIONS
(a) (b)Figure 2.3: Example of a tive wildlife monitoring system [5℄: (a) devi e, (b)animal wearing the devi e.
(a) (b)( ) (d)Figure 2.4: Typi al road infrastru tures: (a) fen e applied to road overpass,(b) wildlife e o-pass over road, ( ) wildlife underpass near �ood, (d) wildlifeunderpass in rural area.
12

Chapter 3Proposed Solution, Prototype andValidationThis hapter is devoted to the des ription of the proposed solution to the wildliferoad rossing problem. In parti ular, the system ar hite ture is presented to-gether with the te hnology s outing pro ess arried out in order to de�ne whi hte hnologies should be used for the system integration. In addition, validationtest are reported, thus evaluating the system working in real s enarios.
13

3.1. PROPOSED SOLUTION: SYSTEM ARCHITECTURE3.1 Proposed Solution: System Ar hite tureStarting from the onsiderations explained in the previous hapter, the proposedsolution to the wildlife-road rossing problem is based on the use of low- ostand ompa t devi es, to be installed on the road sides, with spe i� sensing apabilities, thus to allow monitoring the road proximity for dete ting presen eand movement of animals approa hing, staying or leaving the road.In parti ular, the system main obje tive regards the apability to alert driversonly when the a tual risk is present, thus avoiding tha habit e�e t in looking atstati road signs, improving the risk awareness and inspiring virtuous behaviour.All these key aspe ts should ontribute in redu ing the a tual number of in identsdue to wildlife road rossing. Therefore the meaning of a tual risk may be de-�ned. To this end, Fig. 3.1 show a graphi al s heme of the system working. Theyellow dots represents the sensing devi es installed at the road edge and the so alled dete tion area is de�ned in relation to the sensors �eld-of-view integratedon su h devi es. More spe i� ally, three main area should be identi�ed, distin-guished on the basis of the risk level for drivers given the presen e/movement ofa wildlife in one of those areas. The danger is therefore lassi�ed on the basis ofthe target position and traje tory, thus diversi�ed warnings may be generated.
Figure 3.1: Wildlife road rossing monitoring system: risk de�nition s heme.In detail, a wireless sensor network (WSN) infrastru ture is exploited, taking14

CHAPTER 3. PROPOSED SOLUTION, PROTOTYPE AND VALIDATIONadvantage of the several features this te hnology arries [53, 54, 55, 56, 57, 58℄.Ea h single WSN node is apable to ommuni ate with the other devi es in thenetwork, thus allowing distributed, persavise and ooperative sensing and a tu-ating tasks. Several studies have been ondu ted in order to properly managethe network possibilities, onsidering also the redu ed omputational apabil-ities of the network nodes mi ro ontrollers[59, 60, 61, 62, 63℄. These devi esare equipped with spe i� sensors useful for e�e tively dete ting presen e andmovements of animals in the road proximity. Thus the real-time sensing featureallows the network sharing the information and triggering the a tuation devi esif needed, on the base of the movement typology, whi h has been sensed. In fa t,on e the sensed information is pro essed and interpreted as rossing-event, thea tuators of the WSN platform a tivate the warning alarm for in transit drivers.In addition, the olle ted information is also transmitted to a remote ontrol unitfor su essive data analysis and statisti s.Therefore, it should appear lear that no habit-e�e t should be generatedby su h a system, given that a tuators and road signs alarm drivers only in thea tual ase of risky onditions, namely wildlife approa hing the road or stayingin the road stret h proximity.
Figure 3.2: WSN system ar hite ture: sensor and a tuator devi es for the dete -tion of wildlife movement along road stret hes and prompt alert.15

3.1. PROPOSED SOLUTION: SYSTEM ARCHITECTUREFig. 3.2 shows a simple sket h ra�gurating an example of the WSN systemar hite ture, omposed mainly by two node typologies, namely:• Sensor node, in harge of sensing the nearby environment by using thespe i� sensors with whi h it is equipped and performing �rst step datapro essing;• A tuator node, in harge of a tivating a tuation devi e for warning driversof the risky ondition sensed by the sensor nodes.Besides this �rst node lassi� ation, two additional node typologies may be on-sidered, namely:• An hor node, devoted to wireless network management via multihop ar hi-te ture for overage extension along road sides;• Gateway node, dedi ated to data olle tion and forwarding to the ontrolunit.With referen e to Fig. 3.2, let us onsider to ompose the WSN of N nodesinstalled in known positions in the road proximity, su h as (xn, yn) , n = 1, ..., N .Together with a pre ise analysis of sensor �eld-of-view, sensor nodes position
(xn, yn) should be strategi ally de�ned to enable good dete tion of moving tar-gets, while being as less invasive as possible with respe t to the real installations enario. As Fig. 3.2 learly shows, the sensor nodes de�ne the so- alled se urityzone, whose size is determined by the sensors overage apability installed on ea hsingle devi e. The se urity zone, therefore, de�nes the area in the road proximitywithin whi h the presen e and possible movement of animals is dete ted, givingraise to the omplete monitoring and a tuating pro ess (i.e., sensing, pro essing,a tuation).The WSN network typology may be ustomized in relation to the parti ulars enario in whi h the system may be installed, thus exploiting the a tual nodeposition in the real s enario to extend network apabilities. In general, the WSNnodes may be inter onne ted via multihop wireless links, thus in reasing thenetwork overage and its robustness.In addition, ea h single devi e, being a sensor-, an a tuator- or an an hor-node, has to be properly designed in order to minimize the overall dimensions,thus simplifying installation and amou�age pro esses, the energy onsumption,thus limiting the maintenan e intervention and extending at the same time thedevi e lifetime. Therefore, ea h node is equipped with solar panels for en-ergy management and lifetime optimization, together with an e� ient ontrol�rmware, whi h allows limiting power losses due e.g. to non syn hronized wire-less transmissions.The data olle ted by the gateway node are sent to the ontrol unit for on-line storage and pro essing. In parti ular, the system generates di�erent data ategories: 16

CHAPTER 3. PROPOSED SOLUTION, PROTOTYPE AND VALIDATION• Diagnosti data: the data sent periodi ally by ea h sensor node, su h asbattery and solar panel voltages, internal temperature and humidity, wire-less link quality. These information allows monitoring the status of thesystem and dete ting potential malfun tioning to promptly intervene withproper maintenan e pro ess.• Dete tion event: when sensors dete t animals presen e or movements inthe se urity zone, the respe tive sensor node immediately sends the eventdata to the gateway node with the time, position and dire tion informationof the event. The gateway node forwards the event to the ontrol unit, in harge of pro essing the information and evaluating the optimal feedba ka ording to the adopted strategy.• Signalling event: in ase a real event has been dete ted and the related datahave been pro essed by the ontrol unit, a signalling message is sent to thea tuator nodes losest to the area in whi h the event has been dete ted inorder to a tivate the signalling devi es installed on the road sides.
17

3.2. TECHNOLOGY SCOUTING3.2 Te hnology S outingFirst step in the design pro ess of the proposed monitoring system regards thede�nition of the spe i� te hnologies to be integrated in the sensor node devi es,thus enabling the sensing apability of the system.In parti ular, in order to design low- ost devi es, as de�ned in the proposedsolution s heme in the previous se tion, it is ne essary to identify o�-the-shelfsolutions, whi h may be adopted to a hieve the system obje tive. Therefore,the main te hnologies identi�ed as valuable ones are presented, together withadvantages and disadvantages proper of the onsidered te hnology or dedu ed ifapplied to the proposed system.3.2.1 Radar Te hnologyThe radar te hnology (RAdar Dete tion And Ranging) is widely known and usednowadays as one of the major systems for target lo alization applied to severalappli ations. This system is based on the ele tromagneti propagation of radiowaves. In parti ular, the trasmitting antenna sends a radio or mi rowave pulse,a small portion of whi h, on e it impinges on the target, is re�e ted towards there eiving antenna, usually o-positioned with the transmitting one.A radar sensor allows determining several parameters useful for the obje tdete tion, either moving either stati . Some of these parameters are: distan e,altitude, dire tion and speed of the movement.Nevertheless, not all the radar sensors are able to supply su h parameters.In parti ular, some sensors are only able to dete t movements and a elerationsalong orthogonal dire tions to the sensor plane or with non-null angle between themovement dire tion and the tangential dire tion to the sensor plane. Therefore,by using su h sensors, it is not possible to dete t the presen e of stati targets ormovements perfe tly dire ted along the tangential dire tion to the sensor plane.Some advantages of the radar te hnology if applied to the sensor devi e are:• the use of radio waves, whi h allows lo ating targets even at large distan es,given the redu ed attenuation phenomena through the propagation mediaor for atmospheri agents;• large �eld of view;• availability of low- ost solutions.One major disadvantage of this te hnology regards the sensors based on on-tinuous wave with no frequen y modulation, sin e these devi es do not allowevaluating the target distan e and therefore neither the presen e of stati ob-je ts in the sensor �eld of view. 18

CHAPTER 3. PROPOSED SOLUTION, PROTOTYPE AND VALIDATION3.2.2 Ultrasound Te hnologyThe ultrasound sensors are based on a fun tional prin iple similar to the oneused by radar te hnology. In fa t, the re�e ted se tion of the trasmitted waveis gathered by the sensors and properly pro essed in order to determine target hara teristi s. These sensors generate sound waves at high frequen y and om-puting the time between trasmission and the re eption of the e ho the distan e ofthe target in the sensor �eld of view an be omputed. This te hnology is widelyused in medi al and industrial �elds, for instan e in sonogram or in non-invasive ontrol systems.Among the advantages of su h te hnology let us onsider the following ones,useful for the investigated problem:• it allows omputing the distan e of the target, without any spe i� wavemodulation as instead in the radar te hnology ase;• enables the dete tion of still targets;• availability of low- ost solutions.Major disadvantages of su h te hnology are the redu ed �eld of view and thephysi al hara teristi s that the target should have in order to be properly de-te ted by the sensor. In parti ular, material density and omposition a�e t thereading apability of the ultrasound sensor, by varying the portion of re�e tedwave towards the sensor itself, thus in turn leading to more ambiguous readings.3.2.3 Infrared Te hnologyInfrared sensors are parti ular devi es able to measure the radiation emittedin the infrared spe trum by any target in the �eld of view of the sensor. Thiste hnology is largely used for the dete tion of humans and targets able to radiatein the infrared spe trum. The dete tion is based on the variation of infraredradiation registered in the �eld of view of the sensor, thus even a target withtemperature equal to the environmetal one and moving in front of the sensor anbe dete ted sin e it generates a �eld hange, whi h is dete ted by the infraredsensor.Advantages of su h te hnology are:• passive dete tion of targets, whi h implies redu ed energy onsumption;• medium size �eld of view, with in general wide aperture angle;• availability of low- ost solutions.The main disadvantage regards the huge attenuation this te hnology su�ers dueto atmospheri al agents, whi h perturbates the s enario thus de reasing the de-te tion apability of the sensor. 19
3.2. TECHNOLOGY SCOUTING3.2.4 Thermal Te hnologyThermal sensors measures the temperature of anything in the sensor �eld ofview, being an a tual target or the sorrounding evironment. In parti ular, thiste hnology exploits thermal emission of any obje t and spe i� ally onsideringmedium infrared radiation (i.e., thermal infrared).This te hnology, similarly to the infrared te hnology, allows the passive de-te tion of targets, also onsidering low- ost solutions available o�-the-shelf. Nev-ertheless, this te hnology is strongly a�e ted by atmospheri al agents and theo�-the-shelf solutions shows in general a redu ed size �eld of view. Improvedperforman e may be obtained with spe i� thermal sensors, whose ost in reasesprominently.
20

CHAPTER 3. PROPOSED SOLUTION, PROTOTYPE AND VALIDATION3.3 O�-The-Shelf Sensor Sele tionIn the following, the available o�-the-shelf sensors per ea h of the presentedte hnologies are reported, with some spe i� ation, whi h allow determining thepossibility of integrating su h devi es in the sensor node for the development ofthe monitoring system. Additional information may be retrieved in the sensordatasheets.It is worth noting that the robustness parameter is de�ned on the basis ofthe a tual physi al robustness of the onsidered sensor, together with additionalfeatures it may present (e.g., waterproof). Therefore three main values are given,namely low, medium and high robustness.Model Cost Power Consumption Field-of-View Robustness Output Signal Dimensions [mm℄RSM-1650 $19.65 5V, 30-40mA 15-20m, 80◦/32◦ (H/V) medium analog 25x25x12.7RSM-1700 $19.65 5v, 30-40mA 15-20m, 70◦/70◦ (H/V) medium analog 25x25x12.7R-GAGE QT50R $530.00 12-30V, 100mA 12m, 15◦/15◦ (H/V) high digital 74.1x46.1x66Table 3.1: Radar te hnology: available o�-the-shelf produ ts.Model Cost Power Consumption Field-of-View Robustness Output Signal Dimensions [mm℄UB6000-30GM-E2-V15 $175.00 20-20V, 200mA 6m, 20◦ medium digital PNP 73x73x112MIC+600/D/TC $445.00 9-30V, 80mA 6m, 10◦ high digital PNP 65x65x105SRF485WPR $30.63 8-14V, 10mA 0.6-5m, 30◦ high RS-485 proto ol 40.5x40.5x20SRF10 $31.80 5V, 15mA 0.06-6m, 72◦ medium I2C proto ol 32x15x10SRF02 $10.60 5V, 4mA 0.16-6m, 55◦ medium I2C and serial proto ols 24x20x15SRF01 $21.20 3.3-12V, 25mA 0-6m medium serial proto ol 25x25x20Table 3.2: Ultrasound te hnology: available o�-the-shelf produ ts.Model Cost Power Consumption Field-of-View Robustness Output Signal Dimensions [mm℄IRA-E700ST0 $3.30 2-15V, - 12m, 45◦ medium analog 9.1x9.1x4.7LHI 878 $3.60 2-15V, - - , 95◦ medium analog 9.1x9.1x4.2EW-AMN34111 $38.52 3-6V, 170-300uA 10m, 110◦ medium digital 17.4x17.4x18.5GP2Y0A02YK0F $29.50 4.5-5.5V, 33mA 0.2-1.5m, - high analog 18.9x13.5x44.5GP2Y0A710K0F $23.40 4.5-5.5V, 30mA 1-5.5m, - high analog 58x17.6x22.5GP2Y3A003K0F $61.93 4.5-5.5V, 30mA 0.4-3m, - high analog 68x20x18PIR SMD 3-5V/80UA $27.06 3-5V, 40uA 12m, 120◦ medium analog and digital 25x25x20PIR SMD 3-12V/2MA $17.07 3-12V, 2mA 12m, 120◦ medium analog and digital 25x25x20Table 3.3: Infrared te hnology: available o�-the-shelf produ ts.
21
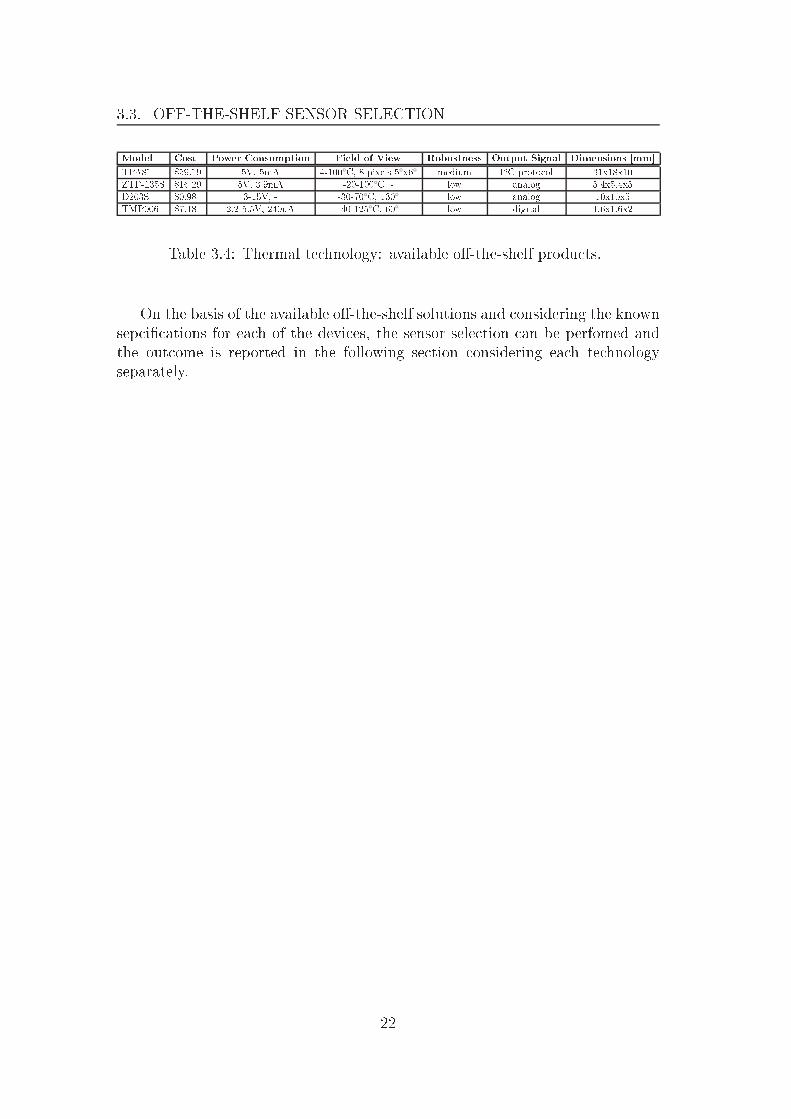
3.3. OFF-THE-SHELF SENSOR SELECTIONModel Cost Power Consumption Field-of-View Robustness Output Signal Dimensions [mm℄TPA81 $59.19 5V, 5mA 4-100◦C, 8 pixels 5◦x6◦ medium I2C proto ol 31x18x10ZTP-135S $16.29 5V, 3.9mA -20-100◦C, - low analog 5.4x5.4x5D203S $0.98 3-15V, - -30-70◦C, 130◦ low analog 10x10x5TMP006 $7.18 2.2-5.5V, 240uA -40-125◦C, 60◦ low digital 1.6x1.6x2Table 3.4: Thermal te hnology: available o�-the-shelf produ ts.On the basis of the available o�-the-shelf solutions and onsidering the knownsep i� ations for ea h of the devi es, the sensor sele tion an be perfomed andthe out ome is reported in the following se tion onsidering ea h te hnologyseparately.
22

CHAPTER 3. PROPOSED SOLUTION, PROTOTYPE AND VALIDATION3.4 Sensor Preliminary Setup and Testing3.4.1 Radar Sensor RSM-16503.4.1.1 SetupMultipurpose radar sensor, espe ially suitable for movement dete tion appli a-tions in ompa t and low power systems. This sensor is omposed by separatedtransmitting and re eiving antennas for better sensitivity.Te hni al parameters:• redu ed ost: $19.65• voltage sour e: 4.75-5.25V• urrent drain: 30-40mA• �eld-of-view: 15-20m• aperture angle (H/V): 80◦/32◦• signal frequen y band: 6-600Hz• operating frequen y: 24.0-24.5GHz• signal type: ontinuous wave without frequen y modulation• emitted power: 16dBm• operating temperature: [-20,60℄◦C• output signal: frequen y modulated signal, modulation based on the obje tspeed and amplitude proportional to dimensions and distan e of the targetto the sensor• dimensions (LxWxH): 25x25x12.7mmIn order to perform a preliminary experimental validation of the radar sensorRSM-1650, a dedi ated interfa e board has been developed, thus allowing themeasure of ontrolled desired movements.The radar sensor RSM-1650 is equipped with three onne tion pins, devotedto 1) power supply, 2) analog output, 3) ground onne tion respe tively (Fig.3.3). 23

3.4. SENSOR PRELIMINARY SETUP AND TESTING
Figure 3.3: Radar sensor RSM-1650: dimensions and onne tion pins.The output signal frequen y is proportional to the obje t/target speed de-te ted in the �eld-of-view of the sensor. For instan e, a moving target with1Km/h speed determines an output signal with frequen y equal to 44Hz, giventhe transmitted signal frequen y to 24.125GHz.Distan e and dimension of targets in the �eld-of-view of the sensor dire tlyin�uen e on the output signal amplitude, whi h shows a very redu ed dynami ,namely at most 300uVolt, parti ularly onsidering that this signal may be readby mi ro ontrollers with redu ed performan e and omputational apa ity, likeWSN sensor nodes, that in general exhibit low resolution ADC onverter (i.e.,10bit or 12 bit resolution with voltage referen e equal to the supply voltage).Therefore, the signal output of the radar sensor an not be dire tly a -quired/analyzed by su h devi es, thus an ampli� ation stage is required.In addition, onsidering the wildlife road- rossing problem, parti ular interestis fo used on a sub-set of sensor output signal frequen ies, in relation to thea tual speed of the asso iated movement. Therefore, the output signal frequen yrange 154Hz-3.39KHz is �ltered, thus allowing the dete tion and the analysis ofmovements in the reading �eld of the sensor with speed approximately rangingbetween 3.5Km/h and 77Km/h. This pro essing allows onsidering neither tooslow movements neither too fast ones, whi h unlikely may belong to a tual animalmovements.To this end, a spe i� �ltering stage has been designed. This pro essing stageis mainly omposed by two �lter typologies, namely a 2nd order Butterworthhigh pass �lter with about 3dB gain and a 2nd order Butterworth low pass �lterwith about 3dB gain. In parti ular, the �ltering sequen e is omposed by onelow pass stage followed by two high pass �lters, thus enhan ing the �lter of lowspeed omponents. Fig. 3.4 and Fig. 3.5 show the ir uital s hemes of the �ltersrespe tively. 24

CHAPTER 3. PROPOSED SOLUTION, PROTOTYPE AND VALIDATION
Figure 3.4: High pass �lter: ut frequen y 154Hz.
Figure 3.5: Low pass �lter: ut frequen y 3.39KHz.The designed interfa e board integrates in the order an ampli� ation stage,with ampli� ation fa tor equal to 100, the high pass �lter and two low pass �lters,as des ribed above, a double semi-wave re ti�er (Fig. 3.6), thus to onsider allthe signal energy (i.e., not only the positive semi-wave energy), a S hmidt trigger25

3.4. SENSOR PRELIMINARY SETUP AND TESTINGwith hysteresis and tunable threshold (Fig. 3.7). A led is onne ted to the trigger,thus its blink allows determining the a tual dete tion of movements.Fig. 3.8 shows the interfa e board prototype implementation.
Figure 3.6: Double semi-wave re ti�er.
Figure 3.7: S hmidt trigger with hysteresis and tunable threshold.26

CHAPTER 3. PROPOSED SOLUTION, PROTOTYPE AND VALIDATION
Figure 3.8: Radar sensor interfa e board: pro essing of output signal.The radar module output signal, if pro essed with the designed interfa eboard, may be a quired and analyzed also by WSN devi es by using digital oranalog onne tions, thus allowing the easy integration of the sensor with theWSN sensor node. Finally, parti ular attention have to be addressed to thesensor supply requirements (i.e., voltage supply), sin e in general this parameterdi�ers from the WSN devi e voltage supply. Therefore proper voltage onversionshould be applied and the sensor urrent drain (i.e., 30-40mA) should be takeninto a ount in order to optimize the lifetime of the integrated devi e. Supplymanaging pro edures may be onsidered in order to a tivate the radar sensor onlyduring spe i� time periods, thus de reasing the overall power onsumption, asa trade-o� between data olle tion rate and dete tion apability.
3.4.1.2 TestingIn order to perform the validation tests, it is ne essary to setup the experimentals enario thus to properly supply the interfa e board and the radar sensor and to orre tly a quire the sensor signal output.Therefore a stable power supply and an os illos ope are used during the �rstsetup in order to verify the orre t fun tioning of ea h single omponent of theinterfa e board and the sensor (Fig. 3.9).27

3.4. SENSOR PRELIMINARY SETUP AND TESTING
Figure 3.9: Radar sensor testing setup.During a se ond step, the power supply is substituted by a lead battery andthe movement dete tion is ommitted to the led on the interfa e board, thusmajor mobility is allowed to the equipment (Fig. 3.10).
(a) (b)Figure 3.10: Radar sensor testing setup: (a) a tive LED for movement dete tion,(b) LED o� for no movement dete tion.By exploiting the �rst setup des ribed above, all the equipment is ontinuoslya tive and supplied, thus the a tual radar sensor working an be monitored real-time throughout all the test duration. For the �rst test, the experimental s enario onsiders a target moving in the area with onstant speed equal to 1Km/h. Asit an be noti e in Fig. 3.11, the signal output of the sensor exhibits a frequen yequal to 44Hz, as expe ted. 28
CHAPTER 3. PROPOSED SOLUTION, PROTOTYPE AND VALIDATION
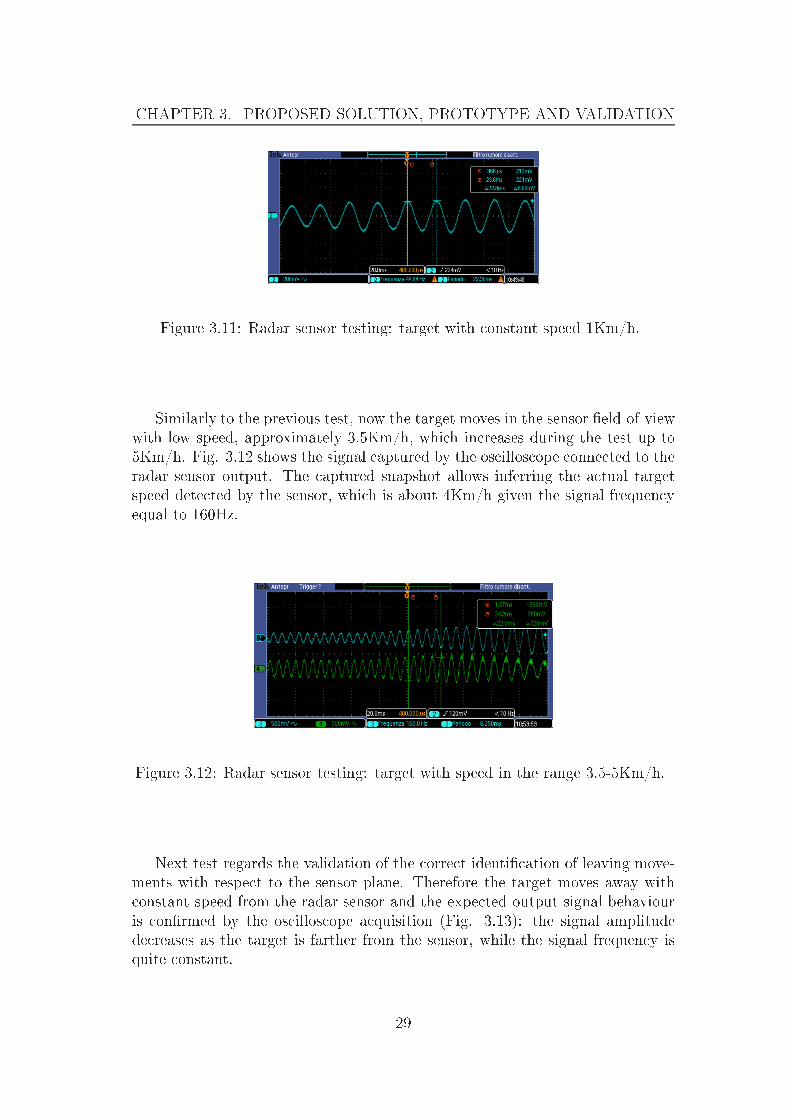
Figure 3.11: Radar sensor testing: target with onstant speed 1Km/h.Similarly to the previous test, now the target moves in the sensor �eld-of-viewwith low speed, approximately 3.5Km/h, whi h in reases during the test up to5Km/h. Fig. 3.12 shows the signal aptured by the os illos ope onne ted to theradar sensor output. The aptured snapshot allows inferring the a tual targetspeed dete ted by the sensor, whi h is about 4Km/h given the signal frequen yequal to 160Hz.
Figure 3.12: Radar sensor testing: target with speed in the range 3.5-5Km/h.Next test regards the validation of the orre t identi� ation of leaving move-ments with respe t to the sensor plane. Therefore the target moves away with onstant speed from the radar sensor and the expe ted output signal behaviouris on�rmed by the os illos ope a quisition (Fig. 3.13): the signal amplitudede reases as the target is farther from the sensor, while the signal frequen y isquite onstant. 29
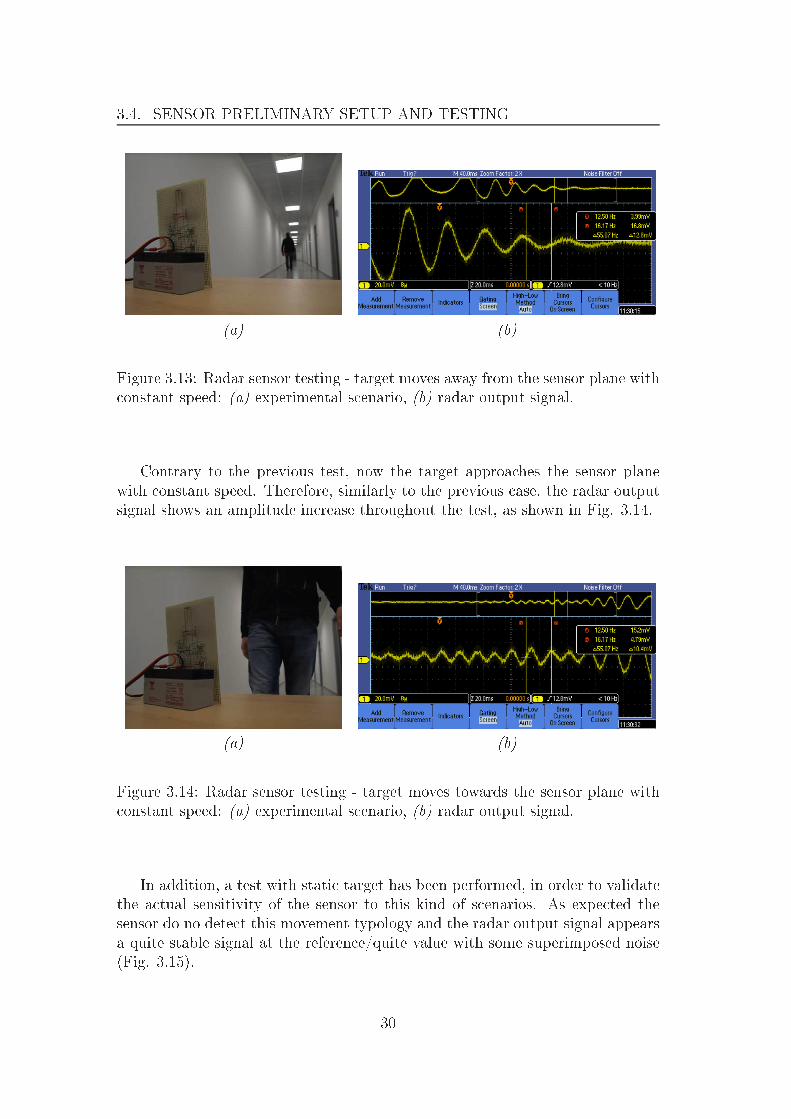
3.4. SENSOR PRELIMINARY SETUP AND TESTING
(a) (b)Figure 3.13: Radar sensor testing - target moves away from the sensor plane with onstant speed: (a) experimental s enario, (b) radar output signal.Contrary to the previous test, now the target approa hes the sensor planewith onstant speed. Therefore, similarly to the previous ase, the radar outputsignal shows an amplitude in rease throughout the test, as shown in Fig. 3.14.
(a) (b)Figure 3.14: Radar sensor testing - target moves towards the sensor plane with onstant speed: (a) experimental s enario, (b) radar output signal.In addition, a test with stati target has been performed, in order to validatethe a tual sensitivity of the sensor to this kind of s enarios. As expe ted thesensor do no dete t this movement typology and the radar output signal appearsa quite stable signal at the referen e/quite value with some superimposed noise(Fig. 3.15). 30

CHAPTER 3. PROPOSED SOLUTION, PROTOTYPE AND VALIDATION
(a) (b)Figure 3.15: Radar sensor testing - target is still in front of the radar sensor: (a)experimental s enario, (b) radar output signal.Finally the maximum and minimum dete tion distan es have been validated,obtaining that the radar sensor RSM-1650 is apable to identify target move-ments from zero distan e to the sensor plane up to about 15-20m distan e fromthe sensor plane. Thus the sensor spe i� ations are on�rmed and its a tualfun tioning, together with the one of the interfa e board, has been validated inorder to integrate su h sensor in the WSN sensor node.3.4.2 Ultrasound Sensor SRF485WPR3.4.2.1 SetupThe identi�ed sensor, model SRF485WPR, is a waterproof sonar sensor, suitablefor many outdoor appli ations. The sensor ommuni ation is based on RS-485serial proto ol and the total power onsumption is quite redu ed.Te hni al parameters:• ost: $30.63• voltage sour e: 8-14V• urrent drain: 10mA• measuring range: 0.6-5m• aperture angle: 30◦• operating temperature: [-30,50℄◦C• output signal: RS-485 proto ol• dimensions (LxWxH): 40.5x40.5x20mm31
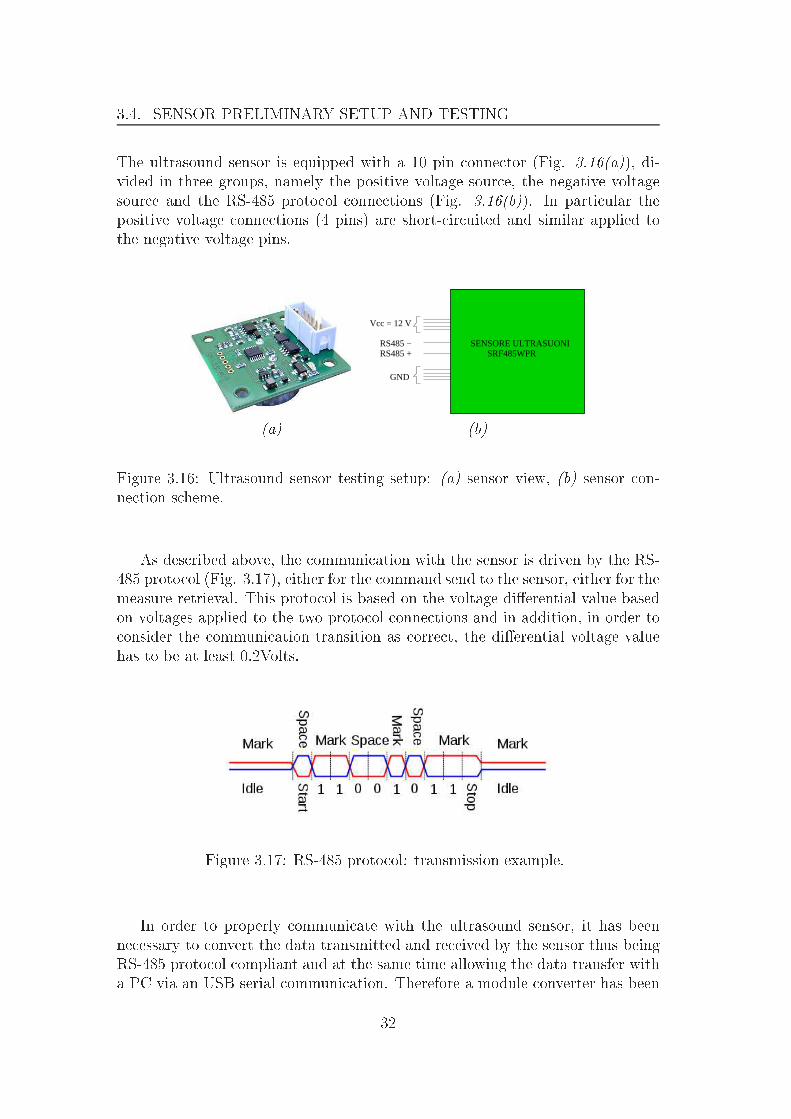
3.4. SENSOR PRELIMINARY SETUP AND TESTINGThe ultrasound sensor is equipped with a 10 pin onne tor (Fig. 3.16(a)), di-vided in three groups, namely the positive voltage sour e, the negative voltagesour e and the RS-485 proto ol onne tions (Fig. 3.16(b)). In parti ular thepositive voltage onne tions (4 pins) are short- ir uited and similar applied tothe negative voltage pins.SRF485WPR
GND
RS485 +RS485 − SENSORE ULTRASUONI
Vcc = 12 V
(a) (b)Figure 3.16: Ultrasound sensor testing setup: (a) sensor view, (b) sensor on-ne tion s heme.As des ribed above, the ommuni ation with the sensor is driven by the RS-485 proto ol (Fig. 3.17), either for the ommand send to the sensor, either for themeasure retrieval. This proto ol is based on the voltage di�erential value basedon voltages applied to the two proto ol onne tions and in addition, in order to onsider the ommuni ation transition as orre t, the di�erential voltage valuehas to be at least 0.2Volts.
Figure 3.17: RS-485 proto ol: transmission example.In order to properly ommuni ate with the ultrasound sensor, it has beenne essary to onvert the data transmitted and re eived by the sensor thus beingRS-485 proto ol ompliant and at the same time allowing the data transfer witha PC via an USB serial ommuni ation. Therefore a module onverter has been32

CHAPTER 3. PROPOSED SOLUTION, PROTOTYPE AND VALIDATIONadopted (Fig. 3.18) for this validation phase and thus a simple Matlab ode hasbeen used to ommuni ate with the sensor.
Figure 3.18: Ultrasound sensor testing setup: USB-RS485 onverter andSRF485WPR sensor.The ultrasound sensor allow the measured data to be set in entimeters orin hes and in addition, for both the measuring units, two working modalities areavailable, namely ontinuous reading or on demand reading.During this validation pro ess, the ontinuous reading mode in entimetershas been hosen, thus allowing the real-time estimation of the sensor behaviourin the experimental s enario throughout all the test duration. Thus, in order toset this working modality the ontroller (i.e., PC) has to send a break ommandon the serial port to the ultrasound sensor, whi h onsists of keeping the RS-485 onne tion to the low logi value per a preset period of time. This pro edureallows the sensor syn hronizing with the ontroller and interpreting in the orre tway the ommands that follows this �rst instru tion. In parti ular, the send ommands present the following stru ture:break | ommand | register | address (three 1byte �elds) | data | he ksumConsidering the spe i� ase of the ommand used during this experimentaltest, the ommand string is omposed as follows:(0x54 | 0x00 | 0x35 | 0x20 | 0x00 | 0xA9)HEX= (84 | 0 | 48 | 37 | 0 | 86)DECThe ultrasound sensor requires about 70mse to get the measure data. On ethe meaures has been get the sensor automati ally sends the proper ommuni a-tion to the ontroller, whi h is omposed by two bytes in RS-485 proto ol. The33
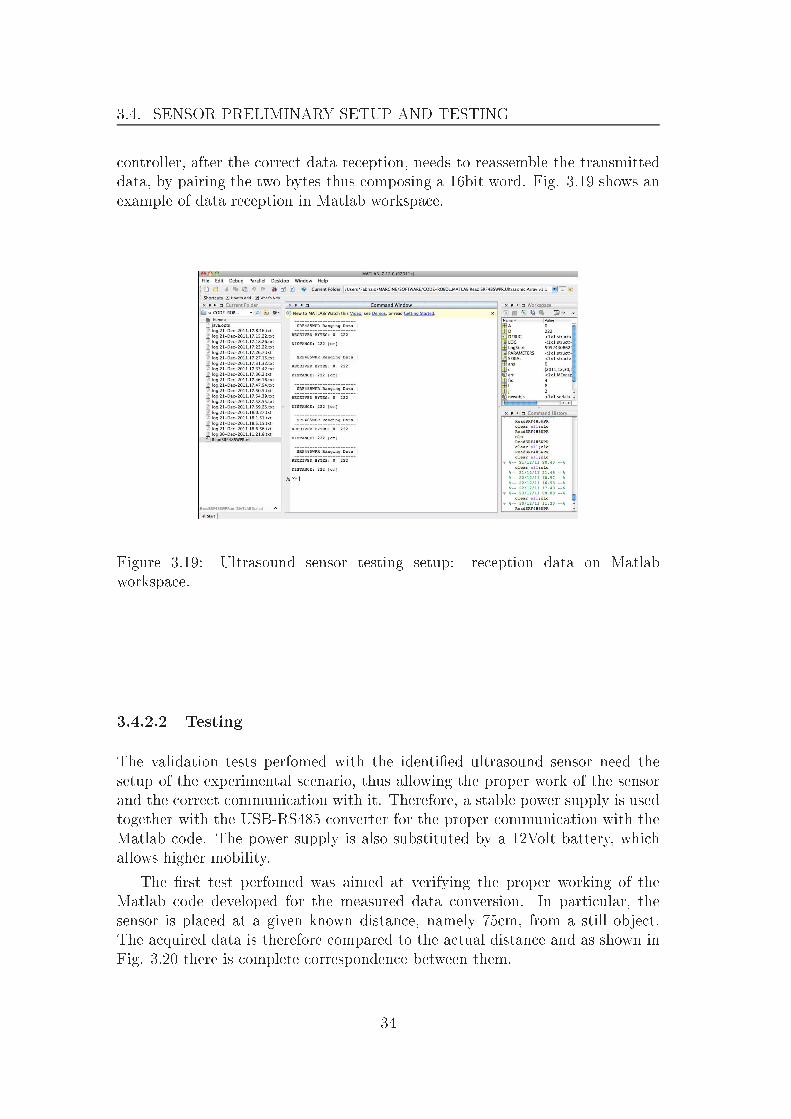
3.4. SENSOR PRELIMINARY SETUP AND TESTING ontroller, after the orre t data re eption, needs to reassemble the transmitteddata, by pairing the two bytes thus omposing a 16bit word. Fig. 3.19 shows anexample of data re eption in Matlab workspa e.
Figure 3.19: Ultrasound sensor testing setup: re eption data on Matlabworkspa e.3.4.2.2 TestingThe validation tests perfomed with the identi�ed ultrasound sensor need thesetup of the experimental s enario, thus allowing the proper work of the sensorand the orre t ommuni ation with it. Therefore, a stable power supply is usedtogether with the USB-RS485 onverter for the proper ommuni ation with theMatlab ode. The power supply is also substituted by a 12Volt battery, whi hallows higher mobility.The �rst test perfomed was aimed at verifying the proper working of theMatlab ode developed for the measured data onversion. In parti ular, thesensor is pla ed at a given known distan e, namely 75 m, from a still obje t.The a quired data is therefore ompared to the a tual distan e and as shown inFig. 3.20 there is omplete orresponden e between them.34
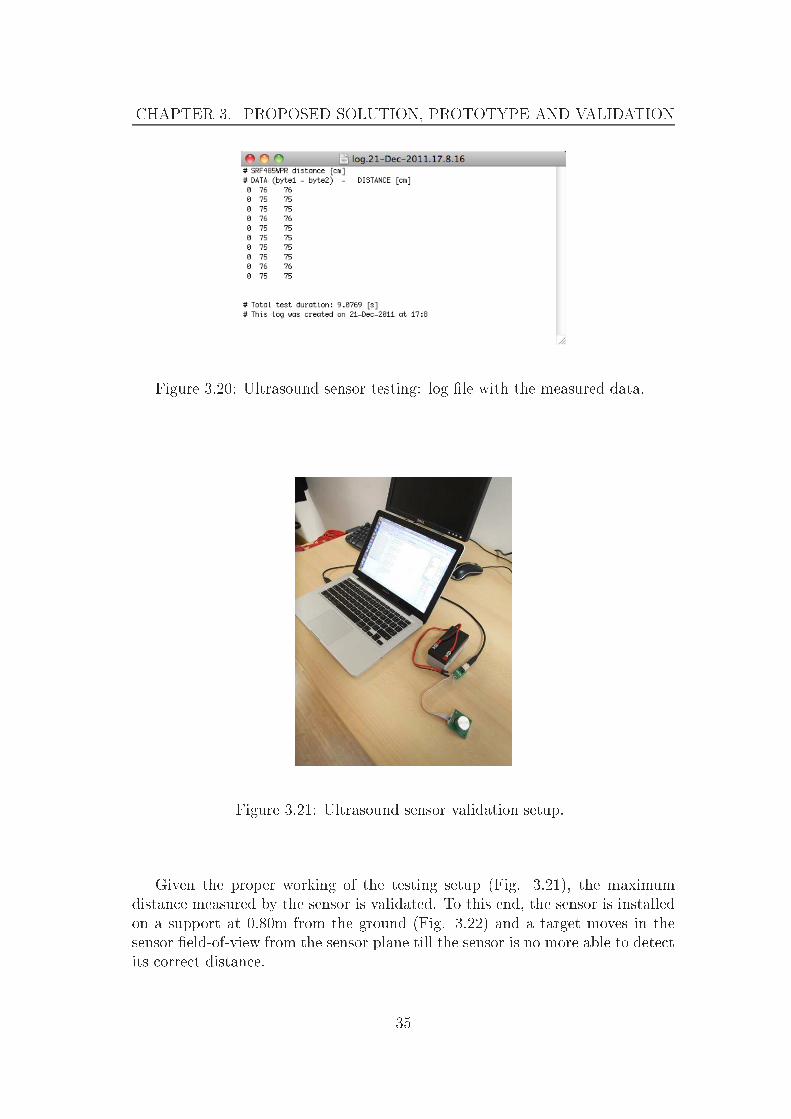
CHAPTER 3. PROPOSED SOLUTION, PROTOTYPE AND VALIDATION
Figure 3.20: Ultrasound sensor testing: log �le with the measured data.
Figure 3.21: Ultrasound sensor validation setup.Given the proper working of the testing setup (Fig. 3.21), the maximumdistan e measured by the sensor is validated. To this end, the sensor is installedon a support at 0.80m from the ground (Fig. 3.22) and a target moves in thesensor �eld-of-view from the sensor plane till the sensor is no more able to dete tits orre t distan e. 35

3.4. SENSOR PRELIMINARY SETUP AND TESTING
Figure 3.22: Ultrasound sensor testing setup.In indoor environments the sensor su�ers of false positive phenomena due tomultiple re�e tions of the sound wave on the obje ts present in the experimentals enario. Nevertheless, the maximum distan e of 4m has been validated, againstthe spe i� ation of about 5m.Analogous test has been arried out in order to determine the minimun dis-tan e measurable by the ultrasound sensor. The produ er de lares a minimundistan e of about 0.6m, thus the target starts moving in the sensor �eld-of-viewat the distan e of 1m, approa hing slowly the sensor plane. The real-time a -quisition is analyzed in order to he k the a tual minimum distan e measuredby the sensor, thus the distan e of 0.6-0.7m is on�rmed to be the minimumdete table by the identi�ed ultrasound sensor.The su essive test is fo used on the simulation of more realisti events, thus omposed by di�erentiated movements like leaving, staying and approa hing thesensor plane. Therefore, the test starts with an empty experimental s enario,then the target moves in the sensor �eld-of-view leaving the sensor plane till themaximum distan e, then the target omes ba k (Fig. 3.23(a)) till 1.60m from thesensor plane (Fig. 3.23(b)), where the target stops simulating small movementsand variations, whi h may be ompared to real environmental hanges.36

CHAPTER 3. PROPOSED SOLUTION, PROTOTYPE AND VALIDATION
(a)(b)Figure 3.23: Ultrasound sensor testing: (a) target approa hing the sensor, (b)target in steady position in front of the sensor.
0
40
80
120
160
200
240
280
320
360
400
440
480
520
0 10 20 30 40 50 60
Dis
tanc
e [c
m]
Time [sec]
Reference DistanceMeasured Distance
Figure 3.24: Ultrasound sensor testing setup.37

3.4. SENSOR PRELIMINARY SETUP AND TESTINGFig. 3.24 shows the experimental result obtained with the above des ribedtest. The blue line depi ts the referen e distan e as written above, while thegreen line refers to the real measurements data obatined by the ultrasound sensorSRF485WPR. During the empty s enario periods the sensor returns the maxi-mum readable distan e, this is why in the �rst samples of the plot in Fig. 3.24the measured distan e is very high and then starts following the a tual movementof the target.The ultrasound sensor properly dete ts the target starting from the movementis about 0.6m from the sensor plane. The su essive measurements follow quitea urately the target movement in the sensor �eld-of-view up to the distan eof 4m. The following moving away at the distan e of 5m and higher is notdete ted and the sensor starts again measuring the a tual target distan e atabout 3.5m from the sensor during the approa hing moving. In addition, whenthe target stops at 1.60m the measurements given by the sensor are quite stableand ontinuously dete t the presen e of the target in the sensor �eld-of-view.The perturbations introdu ed by the target during the still staying period arenot dete ted by the sensor, even if its a ura y measured in real tests is of about0.01m.Therefore it is worth noting that the identi�end ultrasound sensor allowsdete ting still and moving targets in the sensor �eld-of-view, whi h has a maxi-mum veri�ed dimension of about 4-5m. In addition, redu ed target perturbationdo not ause relevant hanges in the measured data, thus improving the sensormeasurement reliability.3.4.3 Infrared Sensor PIR-SMD3.4.3.1 SetupThe identi�ed infrared sensor is a ompa t devi e, suitable for several appli ationin sensing and automation �eld, thanks also to the high sensitivity and theavailability of double output format, namely analog and digital signals.Te hni al parameters:• redu ed ost: $27.06• voltage sour e: 3-5V• urrent drain: 400uA• �eld-of-view: 12m• aperture angle (H/V): 120◦/60◦• operating temperature: [-20,70℄◦C• output signal: analog and digital signal38

CHAPTER 3. PROPOSED SOLUTION, PROTOTYPE AND VALIDATION• dimensions (LxWxH): 25x25x20mmThe infrared sensor onne tions are lo ated on the bottom side of the sensor, asshown in Fig. 3.25. In parti ular, the available onne tions are distributed asfollows:• pin 1: analog output• pin 2: referen e voltage• pin 3: ground onne tion• pin 4: digital output• pin 5: ground onne tion• pin 6: power supply onne tion• pin 7: opti al resistan e• pin 8: opti al resistan e
(a) (b)Figure 3.25: Infrared sensor: (a) front view, (b) bottom view.In order to validate the sensor and its performan e, a simple testing setup isprepared. In parti ular, given the availability of both analog and digital signaloutputs, the analog type is hosen thus allowing the ontinuous analysis of theoutput signal by using an os illos ope dire tly onne ted to sensor pin 1 on-ne tion. Fig. 3.26 shows the experimental setup. The stable power supply isused to power the infrared sensor, thus avoiding possible problems due to noiseor instability of the supplying network during the �rst validation phase. This, inturn, allows on entrating the attention to the a tual devi e working during theexperimental tests. 39
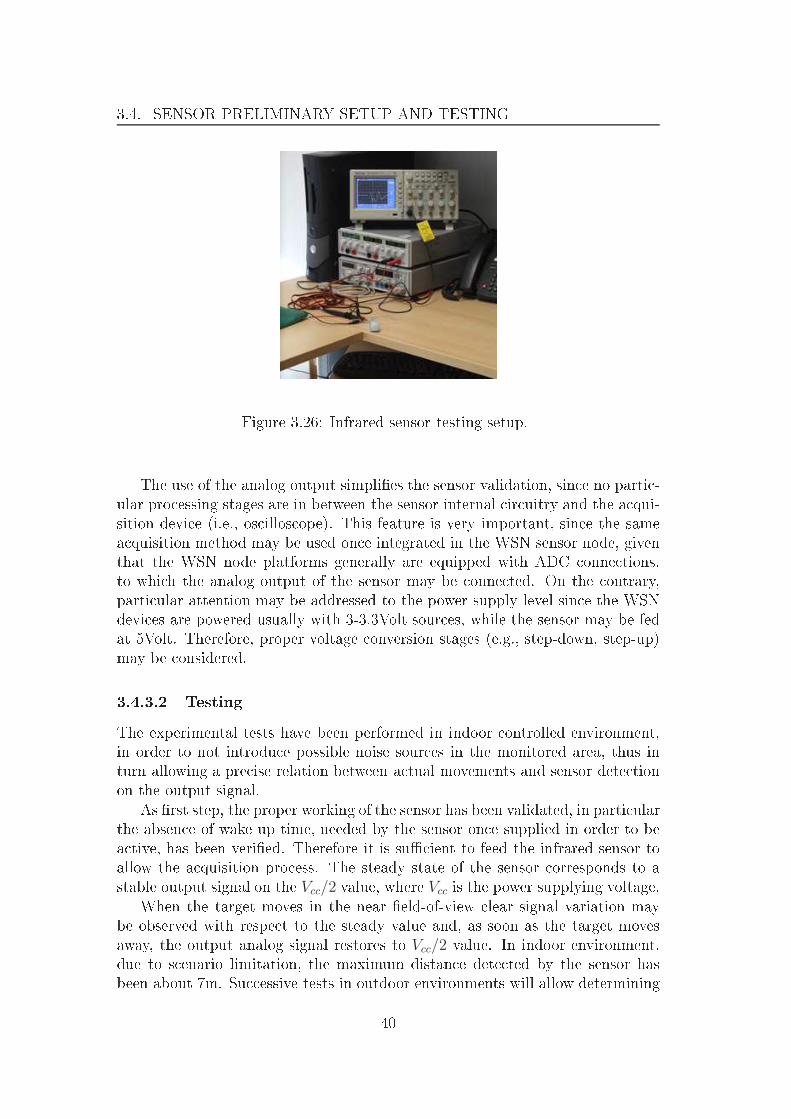
3.4. SENSOR PRELIMINARY SETUP AND TESTING
Figure 3.26: Infrared sensor testing setup.The use of the analog output simpli�es the sensor validation, sin e no parti -ular pro essing stages are in between the sensor internal ir uitry and the a qui-sition devi e (i.e., os illos ope). This feature is very important, sin e the samea quisition method may be used on e integrated in the WSN sensor node, giventhat the WSN node platforms generally are equipped with ADC onne tions,to whi h the analog output of the sensor may be onne ted. On the ontrary,parti ular attention may be addressed to the power supply level sin e the WSNdevi es are powered usually with 3-3.3Volt sour es, while the sensor may be fedat 5Volt. Therefore, proper voltage onversion stages (e.g., step-down, step-up)may be onsidered.3.4.3.2 TestingThe experimental tests have been performed in indoor ontrolled environment,in order to not introdu e possible noise sour es in the monitored area, thus inturn allowing a pre ise relation between a tual movements and sensor dete tionon the output signal.As �rst step, the proper working of the sensor has been validated, in parti ularthe absen e of wake up time, needed by the sensor on e supplied in order to bea tive, has been veri�ed. Therefore it is su� ient to feed the infrared sensor toallow the a quisition pro ess. The steady state of the sensor orresponds to astable output signal on the Vcc/2 value, where Vcc is the power supplying voltage.When the target moves in the near �eld-of-view lear signal variation maybe observed with respe t to the steady value and, as soon as the target movesaway, the output analog signal restores to Vcc/2 value. In indoor environment,due to s enario limitation, the maximum distan e dete ted by the sensor hasbeen about 7m. Su essive tests in outdoor environments will allow determining40

CHAPTER 3. PROPOSED SOLUTION, PROTOTYPE AND VALIDATIONthe a tual maximum dete table distan e.On the ontrary, the minimum dimension of the sensor �eld-of-view has beenveri�ed with a onstant speed motion of the target, whi h approa hes the sensorfrom the starting distan e of 1m. The sensor is apable of dete ting the targetmovement till the distan e between the target and the sensor is nulli�ed.Su essive tests are devoted to the validation of the a tual sensor sensibility toradial movements with respe t to the sensor plane. In parti ular these movementsare perfomed at di�erent distan es from the sensor, but always within the knownsensor �eld-of-view dimensions. Fig. 3.27(a) shows the target approa hing thesensor from an initial distan e of about 3.5m up to 2.1m. The sensor dete tsthe presen e of the moving target and the a quired output signal is shown inFig. 3.27(b), where learly appears the signal perturbation due to the dete tedmovement.
(a)
(b)Figure 3.27: Infrared sensor testing: (a) target approa hing the sensor, (b) sensoroutput signal a quired with os illos ope.41

3.4. SENSOR PRELIMINARY SETUP AND TESTINGSimilar behaviour is obtaind when the target leaves the sensor plane, startingfrom the end position of the previous test (i.e., 2.1m) till the distan e of about3.5m, as shown in Fig. 3.28.
Figure 3.28: Infrared sensor testing: sensor output signal a quired with os illo-s ope while target leaves the sensor plane.
(a) (b)Figure 3.29: Infrared sensor testing: (a) sensor output signal a quired withos illos ope while target approa hes the sensor plane starting from 7.0m, (b)sensor output signal a quired with os illos ope while target leaves the sensorplane from 4.5m.The same test is repeated in reasing the distan e to the sensor and similarlythe sensor is apable of dete ting the presen e of the moving target, even if the42

CHAPTER 3. PROPOSED SOLUTION, PROTOTYPE AND VALIDATIONoverall dynami of the output signal is more redu ed if ompared to the previous ase (Fig. 3.29).In omparison to radial movements, su essive tests are aimed at validatingthe sensor sensibility in ase of tangential movements with respe t to the sensorplane. In parti ular the target moves at the tangential distan e of about 3.5mfrom left to right till exiting the sensor �eld-of-view. Then the target stopsand repeats the test from right to the left. The same is then repeated at 7.0mdistan e. As it an be seen in Fig. 3.30(b) and Fig. 3.31, the sensor outputsignal learly dete ts the target movements and it is worth noting that the signalamplitude is onsiderable higher than what has been obtained with the radialmovement tests respe tively.
(a)
(b)Figure 3.30: Infrared sensor testing: (a) target moving tangentially in front ofthe sensor, (b) sensor output signal a quired with os illos ope while the targetmoves tangentially at 3.5m.43

3.4. SENSOR PRELIMINARY SETUP AND TESTING
Figure 3.31: Infrared sensor testing: sensor output signal a quired with os illo-s ope while the target moves tangentially at 7.0m.
(a) (b)Figure 3.32: Infrared sensor testing: (a) target standing in front of the sensor,(b) sensor output signal a quired with os illos ope while the target stands infront of the sensor at 2m distan e.Finally, onsidering the target still in front of the sensor at di�erent distan es,the sensor do not dete t the presen e of the target as expe ted. Fig. 3.32 showsthe os illos ope a quisition while the target is standing in front of the infraredsensor at 2.0m distan e. 44
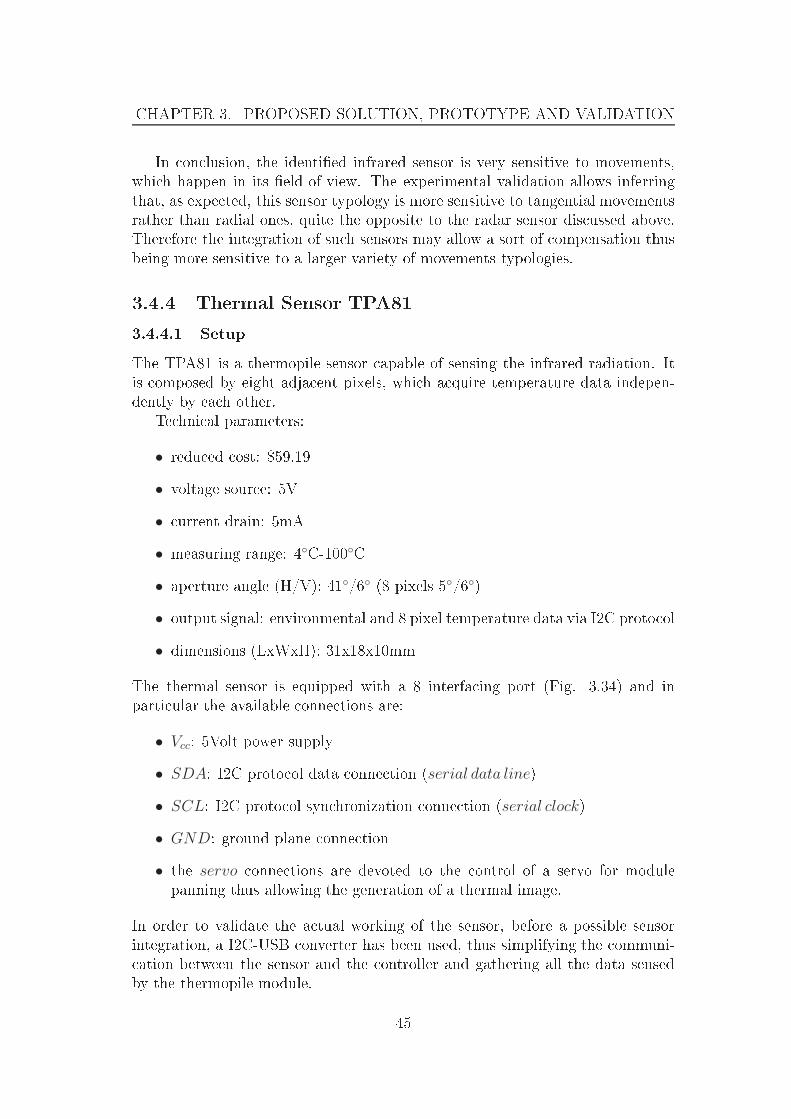
CHAPTER 3. PROPOSED SOLUTION, PROTOTYPE AND VALIDATIONIn on lusion, the identi�ed infrared sensor is very sensitive to movements,whi h happen in its �eld-of-view. The experimental validation allows inferringthat, as expe ted, this sensor typology is more sensitive to tangential movementsrather than radial ones, quite the opposite to the radar sensor dis ussed above.Therefore the integration of su h sensors may allow a sort of ompensation thusbeing more sensitive to a larger variety of movements typologies.3.4.4 Thermal Sensor TPA813.4.4.1 SetupThe TPA81 is a thermopile sensor apable of sensing the infrared radiation. Itis omposed by eight adja ent pixels, whi h a quire temperature data indepen-dently by ea h other.Te hni al parameters:• redu ed ost: $59.19• voltage sour e: 5V• urrent drain: 5mA• measuring range: 4◦C-100◦C• aperture angle (H/V): 41◦/6◦ (8 pixels 5◦/6◦)• output signal: environmental and 8 pixel temperature data via I2C proto ol• dimensions (LxWxH): 31x18x10mmThe thermal sensor is equipped with a 8 interfa ing port (Fig. 3.34) and inparti ular the available onne tions are:• Vcc: 5Volt power supply• SDA: I2C proto ol data onne tion (serial data line)• SCL: I2C proto ol syn hronization onne tion (serial clock)• GND: ground plane onne tion• the servo onne tions are devoted to the ontrol of a servo for modulepanning thus allowing the generation of a thermal image.In order to validate the a tual working of the sensor, before a possible sensorintegration, a I2C-USB onverter has been used, thus simplifying the ommuni- ation between the sensor and the ontroller and gathering all the data sensedby the thermopile module. 45
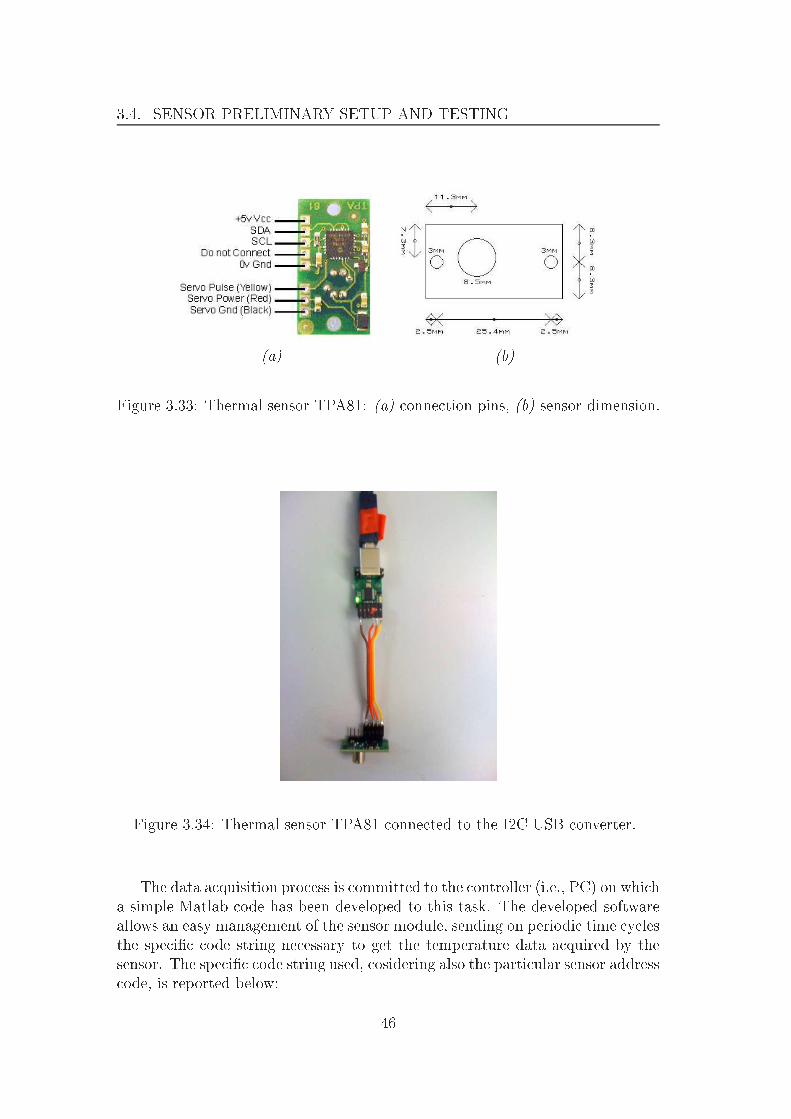
3.4. SENSOR PRELIMINARY SETUP AND TESTING
(a) (b)Figure 3.33: Thermal sensor TPA81: (a) onne tion pins, (b) sensor dimension.
Figure 3.34: Thermal sensor TPA81 onne ted to the I2C-USB onverter.The data a quisition pro ess is ommitted to the ontroller (i.e., PC) on whi ha simple Matlab ode has been developed to this task. The developed softwareallows an easy management of the sensor module, sending on periodi time y lesthe spe i� ode string ne essary to get the temperature data a quired by thesensor. The spe i� ode string used, osidering also the parti ular sensor address ode, is reported below: 46

CHAPTER 3. PROPOSED SOLUTION, PROTOTYPE AND VALIDATION(0x55 | 0XD1 | 0X00 | 0X0A)HEX = (85 | 209 | 0 | 10)DECThis ommand allows the ontroller getting the data saved in a 10byte registeron the sensor, where the module stores the sensed temperature data. These dataare then a quired and properly pro essed by the Matlab routine in order togenerate a real-time olor map, more representative of the observed s ene (Fig.3.35).
(a)
(b)Figure 3.35: Thermal sensor TPA81: (a) data a quisition example in Matlabworkspa e, (b) real-time olor map generated on data a quisition.Fig. 3.35(b) shows the olor map drawn on the basis of the a quired data.In parti ular, the 8 pixel array is shown together with the environmental tem-perature measured by the sensor (i.e., the olored square on the left side of thepi ture). 47

3.4. SENSOR PRELIMINARY SETUP AND TESTINGThe thermopile sensor needs to be supplied with a 5Volt sour e and thisfeature may be taken arefully into a ount during the possible integration pro- ess with the WSN sensor node, whi h instead is supplied with 3-3.3Volts. Thepower onsumtion of the thermopile sensor is quite redu ed and therefore a properpower management of the integrated WSN sensor node may allow optimizing theavailable power sour e.3.4.4.2 TestingThe experimental setup used in order to validate the sensor performan e is om-posed by a PC with Matlab software, the thermopile sensor and the I2C to USB onverter (Fig. 3.36).
Figure 3.36: Thermal sensor TPA81 testing setup.The �rst test performed is devoted to validate the a tual sensor �eld-of-view.In parti ular, the sensor is installed at about 80 m from the ground and thetarget moves in front of the sensor, starting from the sensor position and goingfarther along the tangential dire tion till 4m distan e. The target then stopsand after some se onds re-start moving towards the sensor plane. The a quireddata allows inferring that the sensor is apable of dete ting the target presen ein the s ene within 1.5m range. Beyond this distan e, the data a quired by thesensor are quite similar to the environmental temperature, thus the presen e ormovement of the target an not be identi�ed.48

CHAPTER 3. PROPOSED SOLUTION, PROTOTYPE AND VALIDATIONTherefore, given the maximum dete table distan e obtained with the previoustest, the target is pla ed at 1m distan e from the sensor and starts moving fromleft to right and vi eversa, keeping the same radial distan e. Fig. 3.37 showsan example of the olor map generated by the Matlab software, whi h allowsdetermining the presen e and relative position of a target in the sensor �eld-of-view. It is worth noting that the sensor is apable of dete ting the presen e of thetarget and in parti ular the radial movement throughout all the test duration.
Figure 3.37: Thermal sensor TPA81: olor map representative of a target pla edon the left side of the sensor �eld-of-view.
Figure 3.38: Thermal sensor TPA81: olor map representative of a target movingat 2m distan e from the sensor plane.49

3.4. SENSOR PRELIMINARY SETUP AND TESTINGSimilar to previous test, the target repeats the same movements at the dis-tan e of about 2m from the sensor plane, in order to verify and on�rm themaximum dete table distan e validated in the �rst tests. As expe ted, the ther-mopile sensor is not able to dete t the presen e of the moving target and thea quired data do no di�er from the environmental temperature value, as shownin Fig. 3.38.In on lusion, the thermopile sensor represents a low- ost solution, with re-du ed power onsumption and of quite easy integration with the WSN sensornode. Nevertheless, the sensor performan e are quite inadequate parti ularly onsidering the main problem obje tive of this thesis.In general, the osts of su h tehnology are quite high and the identi�ed ther-mal sensor represents one low- ost o�-the-shelf solution. Therefore the integra-tion of su h sensor is not valuable for the a tual dete tion of wildlife moving inthe road proximity.
50
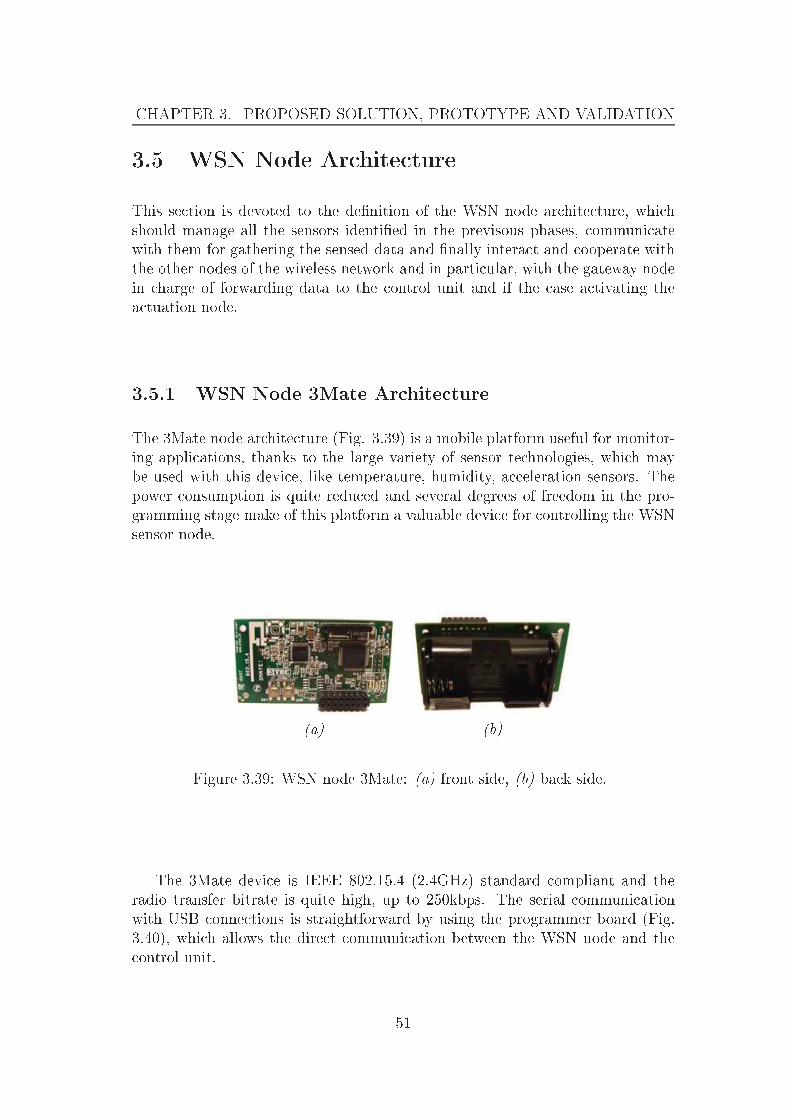
CHAPTER 3. PROPOSED SOLUTION, PROTOTYPE AND VALIDATION3.5 WSN Node Ar hite tureThis se tion is devoted to the de�nition of the WSN node ar hite ture, whi hshould manage all the sensors identi�ed in the previsous phases, ommuni atewith them for gathering the sensed data and �nally intera t and ooperate withthe other nodes of the wireless network and in parti ular, with the gateway nodein harge of forwarding data to the ontrol unit and if the ase a tivating thea tuation node.3.5.1 WSN Node 3Mate Ar hite tureThe 3Mate node ar hite ture (Fig. 3.39) is a mobile platform useful for monitor-ing appli ations, thanks to the large variety of sensor te hnologies, whi h maybe used with this devi e, like temperature, humidity, a eleration sensors. Thepower onsumption is quite redu ed and several degrees of freedom in the pro-gramming stage make of this platform a valuable devi e for ontrolling the WSNsensor node.
(a) (b)Figure 3.39: WSN node 3Mate: (a) front side, (b) ba k side.The 3Mate devi e is IEEE 802.15.4 (2.4GHz) standard ompliant and theradio transfer bitrate is quite high, up to 250kbps. The serial ommuni ationwith USB onne tions is straightforward by using the programmer board (Fig.3.40), whi h allows the dire t ommuni ation between the WSN node and the ontrol unit. 51

3.5. WSN NODE ARCHITECTURE(a) (b)Figure 3.40: WSN node 3Mate: (a) programmer board, (b) 3Mate devi e withprogrammer board.In addition, the 3Mate platform is equipped with two main buttons, namely:
• reset: used to reset the node• user: it enables additional fun ionalities, whi h may be programmed bythe user.In addition, the devi e has on the front side three onne tor strips, omposedby 8 pins ea h as shonw in Fig. 3.41, whi h make available several onne tiontypologies, like UART (Universal Asyn hronous Re eiver Transmitter) serial,ADCs and digital GIO (General Input Output) onne tions.The prin ipal omponent of the devi e is represented by its mi ro ontrollerMSP430 (Texas Instruments), whi h features 10KB RAM and 48KB �ash mem-ory.
Figure 3.41: WSN node 3Mate: onne tion strips.In parti ular, the availability of numerous onne tions, both analog and digi-tal, allows interfa ing all the devi es identi�ed in the te hnology s outing phase.Fig. 3.42 shows a onne tion s heme for the management of all the sensors to-gether with the powering bran h. The spe i� ontrol of batteries and renewable52

CHAPTER 3. PROPOSED SOLUTION, PROTOTYPE AND VALIDATIONenergy sour e allows monitoring the proper state of the WSN sensor node andidentifying riti al events for the life of the integrated devi e.
Figure 3.42: WSN node 3Mate: integration s heme.3.5.2 Power Consumption and Management of the Inte-grated SolutionConsidering the proposed integration s heme, shown in Fig. 3.42, whi h in ludesall the sensors dis ussed in the previous se tions, the analysis of the power budgetis dis ussed, in oder to determine the devi e lifetime.The prototype is therefore mainly omposed by the following devi es:
• WSN Node 3Mate• radar sensor model RSM1650 53

3.5. WSN NODE ARCHITECTURE• ultrasound sensor model SRF485WPR• infrared sensor model PIR_STD_LP• operational ampli�ers model LMV358• dual operational ampli�ers model LM358N• analog swit h model MAX4662• step-down onverter 12Volt-5Volt model MAX1837EUT50• step-down onverte 12Volt-3.3Volt model MAX1837EUT333.5.2.1 Power ConsumptionTable 3.5 reports the main omponents of the integrated sensor node, des ribingmodel, urrent drain during a tive phase I0, urrent drain during ina tive phase
IS and supplying voltage supposing the use of a 12Volt battery.# Des ription Model Current Drain I0 Current Drain IS Voltage1 Step-down onverter 3.3V MAX1837EUT33 25µA 25µA 12.0V1 Step-down onverter 5.0V MAX1837EUT50 26µA 0 12.0V1 UART-RS485 onverter SP3485 1mA 0 3.3V1 Analog swit h MAX4662 5µA 5µA 3.3V8 Operational Ampli�er LM358N 0.5mA 0 5.0V2 Operational Ampli�er LMV358 210µA 0 5.0V1 WSN Node 3Mate 23mA 21µA 3.3V1 Radar sensor RSM1650 40mA 0 5.0V1 Ultrasound sensor SRF485WPR 10mA 0 12.0V1 Infrared sensor PIR_STD_LP 400µA 0 5.0VTable 3.5: Power budget: main omponents of the integrated sensor node andrelated urrent onsumption using 12Volt battery.Table 3.6 reports instead the power onsumption omputed on the basis ofdata shown in Table 3.5. In Table 3.6 the term P0 refers to the power onsumptionduring a tive phase, while PS the power onsumption during ina tive phase,similar to the expression used in Table 3.5.54

CHAPTER 3. PROPOSED SOLUTION, PROTOTYPE AND VALIDATION# Des ription Model Power P0 Power IS1 Step-down onverter 3.3V MAX1837EUT33 0.3mW 0.3mW1 Step-down onverter 5.0V MAX1837EUT50 0.3mW 01 UART-RS485 onverter SP3485 3.3mW 01 Analog swit h MAX4662 0.06mW 0.06mW8 Operational Ampli�er LM358N 2.5mW 02 Operational Ampli�er LMV358 1.05mW 01 WSN Node 3Mate 75.9mW 69.3µW1 Radar sensor RSM1650 0.2W 01 Ultrasound sensor SRF485WPR 0.12W 01 Infrared sensor PIR_STD_LP 2mW 0Table 3.6: Power budget: main omponents of the integrated sensor node andrelated power onsumption using 12Volt battery.Similar analysis an be arried out onsidering a di�erent power supply,namely a 6Volt battery. In this ase a step-up onverter has to be used inorder to properly supply the ultrasound sensor, whi h need 12Volt power supply.
# Des ription Model Current Drain I0 Current Drain IS Voltage1 Step-down onverter 3.3V MAX1837EUT33 25µA 25µA 6.0V1 Step-down onverter 5.0V MAX1837EUT50 26µA 0 6.0V1 Step-up onverter 12.0V MAX734ESA 2.5mA 0 6.0V1 UART-RS485 onverter SP3485 1mA 0 3.3V1 Analog swit h MAX4662 5µA 5µA 3.3V8 Operational Ampli�er LM358N 0.5mA 0 5.0V2 Operational Ampli�er LMV358 210µA 0 5.0V1 WSN Node 3Mate 23mA 21µA 3.3V1 Radar sensor RSM1650 40mA 0 5.0V1 Ultrasound sensor SRF485WPR 10mA 0 12.0V1 Infrared sensor PIR_STD_LP 400µA 0 5.0VTable 3.7: Power budget: main omponents of the integrated sensor node andrelated urrent onsumption using 6Volt battery.55

3.5. WSN NODE ARCHITECTURE# Des ription Model Power P0 Power IS1 Step-down onverter 3.3V MAX1837EUT33 0.15mW 0.15mW1 Step-down onverter 5.0V MAX1837EUT50 0.15mW 01 Step-up onverter 12.0V MAX734ESA 15mW 01 UART-RS485 onverter SP3485 3.3mW 01 Analog swit h MAX4662 0.03mW 0.03mW8 Operational Ampli�er LM358N 2.5mW 02 Operational Ampli�er LMV358 1.05mW 01 WSN Node 3Mate 75.9mW 69.3µW1 Radar sensor RSM1650 0.2W 01 Ultrasound sensor SRF485WPR 0.12W 01 Infrared sensor PIR_STD_LP 2mW 0Table 3.8: Power budget: main omponents of the integrated sensor node andrelated power onsumption using 6Volt battery.3.5.2.2 Prototype LifetimeTaking into a ount the use of a 12Volt battery, able to supply 1.2Ah, the total onsumption an be omputed as follows:
P = α · P0 + (1− α) · PSwhere:• P0 is the power onsumption during ina tive or standby time• PS is the power onsumption during a tive phase• α is the duty- y le (%) of the a tivity period.The prototype lifetime (Trun) is obtained by omparing the total power onsump-tion (P ) to the a tual power supplied by the used battery (Pbatt), for instan e inthe ase of 12Volt battery with 1.2Ah, the supplied power will be Pbatt = 14.4Wh.• System a tivity 100%, α = 1
P = 424mWPbatt = 12V · 1.2Ah = 14.4WhTrun ≃ 34h ≃ 1.5days
• System a tivity 50% (30se /min), α = 0.556

CHAPTER 3. PROPOSED SOLUTION, PROTOTYPE AND VALIDATIONP = 212mW
Trun ≃ 68h ≃ 3days
• System a tivity ∼30% (20se /min), α = 0.3
P = 142mWTrun ≃ 102h ≃ 4daysAnalogous result mat be obtained taking into a ount the use of a 6Voltbattery, able to supply 4.5Ah, thus the supplied power will be Pbatt = 27Wh.• System a tivity 100%, α = 1
P = 437.58mWTrun ≃ 61.70h ≃ 2.5days
• System a tivity 50% (30se /min), α = 0.5
P = 218.82mWTrun ≃ 123.39h ≃ 5days
• System a tivity ∼30% (20se /min), α = 0.3
P = 145mWTrun ≃ 185.05h ≃ 8daysTherefore, the only use of a battery sour e may not be su� ient to guaranteea valuable lifetime to the system. In parti ular, renewable energy sour es maybe exploited to extend the system lifetime. Proper analysis has to be ondu tedin order to identify the spe i� solar ells to be used, taking into a ount thebattery sour e features and the system time of a tual a tivity, whi h mainlyimpa t on the power onsumption.Several types of solar ells are available as o�-the-shelf produ ts. Thus, on-sidering a solar panel featuring 6Volt, 250mA a study on the a tual prototypelifetime may be ondu ted. In parti ular, onsidering a day-time of 100% a -tivity of the integrated sensor node, omplete of all the sensors identi�ed, the urrent drain needed to supply all the omponents during all the day long, isabout I24h = 78mA · 24h = 1.872A.Given this urrent drain, the energy apported by the solar panel has to be onsidered and in parti ular the a tual urrent supplied by the solar ells is about
Isolar = 250mA · 7h = 1.75A, onsidering seven hours of e�e tive solar radiation.57

3.5. WSN NODE ARCHITECTURETherefore, it is lear that at the end of the day the power budget is in de� it ofabout Ideficit = 122mA.This on�guration allows extending the lifetime of the system to 37 days,whi h in turn means that after this time the battery have to be hanged with harged ones. The solar ells, therefore, slow down the battery dis harge pro ess,but the omplete re harge may not happen.To a tually extend the system lifetime two solutions may be hosen: a) hangesolar panels with higher performan e models, b) redu e the system time of a -tivity.Con erning the former ase, the identi� ation pro ess of higher perfoman esolar panles may be not so trivial, given that not only supplying features haveto be a ounted, but also other hara teristi s su h as ost and dimensions maybe minimized. Therefore, the alternative to this approa h is represented by thelatter ase des ribed above, namely the redu tion of the system time of a tivity.As an example, by redu ing the a tivity time to 50se per minute, the urrent onsumption is in turn redu ed to about I ≃ 1.56A, whi h is smaller if omparedto the a tual urrent supplied by the solar panel dis ussed above during a periodof e�e tive solar radiation in the range of about seven hours (i.e., Isolar ≃ 1.75A).Thus this approa h do not imply neither any in rease in the osts neither in theoverall prototype dimensions.Parti ular attention may be addressed to the e�e tive radiation period on-sidered in the previous dis ussion. In fa t, onsidering seven hour of a tual solarpanel work may be too optimisti , also onsidering that there is no guaranteeon su h parameter. Therefore, for the sake of ompleteness, the power budget omputed earlier may be reformulated onsidering di�erent period of time inwhi h solar panels are onsidered to properly supply energy to the system. Inthis view, let us onsider two main examples, namely the �rst ase with at most3 hours of e�e tive solar radiation and the se ond one with at most 5 hours ofsolar radiation. Thus:• ase a) 3 hours of e�e tive solar radiation: similar to what have just beenpresented earlier in this se tion, the total urrent supplied by the solarpanel may be omputed as Isolar ≃ 250mA·3h = 750mA. The total urrent onsumption during 24hours of 100% a tivity is about I24h ≃ 78mA ·24h =1.872A. Therefore, it is lear that in su h onditions the solar panel supplyis not su� ient in order to a tually extend the system lifetime. To this end,the prototype period of a tivity may be omputed as: I24h ≃ 78mA · α ·24h ≤ 750mA. Thus the system a tivity time may be redu ed to 24se perminute (i.e., α = 0.4), thus obtaining: I24h ≃ 78mA · 0.4 · 24h ≃ 749mA,whi h is omparable to the amount of urrent supplied by the solar panel.
• ase b) 5 hours of e�e tive solar radiation: analogously to the omputationin ase a), the following may be obtained: Isolar ≃ 250mA · 5h = 1.25A ,thus I24h ≃ 78mA · α · 24h ≤ 1.25A, whi h lead to: α = 0.66 or I24h ≃58

CHAPTER 3. PROPOSED SOLUTION, PROTOTYPE AND VALIDATION78mA · 0.66 · 24h ≃ 1.24A, whi h means that the system may be a tive forabout 40se per minute.It is worth noting, that in the above omputation the urrent drain during ina -tive phases has not been onsidered, sin e this amount of urrent is negligible if ompared to the other entities onsidered for the evaluation of the α term.Therefore, in on lusion, it may be onvenient to onsider an automati ad-justment pro edure of the system time of a tivity, based on the a tual readingof battery and solar panel voltages. This expedient may ideally allow obtain-ing in�nite system lifetime, given that the battery may not never be ompletelydis harged, by redu ing the system time of a tivity omplementary to the solarpanel apa ity. Thus the only limitation in su h ondition would be representedby the a tual battery life, omputed as performan e degradation in relation torepeated harge/dis harge y les.3.5.3 Hardware Interfa e of the Integrated Sensor NodeFollowing the previous development stages, fo used on the identi� ation of spe- i� te hnologies useful to the aim of this thesis proje t, the su essive stepregards the design of the hardware interfa ing board, whi h should allow theproper ommuni ation among all the omponents, namely sensors and WSNnode ontroller, in order to gather all the sensed information and to manage atthe same time their working.Starting from all the te hnologies identi�ed and presented in Se tion 3.2 (i.e.,radar, infrared, ultrasound and thermal te hnologies), as dis ussed above, thethermal te hnology has been ex luded sin e low- ost o�-the-shelf solutions donot perform su� iently, thus implying only a urrent drain to the system, inturn hardening the expansion pro ess regarding the system lifetime.Therefore the the hnologies and related sensors used for the a tual integrationpro ess are the following ones:
• radar te hnology: sensor RSM-1650• ultrasound te hnology: sensor SRF485WPR• infrared te hnology: sensor PIR_STD_LPEa h sensor present di�erent hara teristi s in terms of input/output signals,power supply, layout and dimensions. In this view, the WSN node allows inter-fa ing all these te hnologies without any parti ular problem, thus exploiting andmanaging several devi es with one single ontroller.As already dis ussed, the WSN Node 3Mate exhibit three main onne tionstrips on whi h analog, digital and supplying onne tions are available. In par-ti ular, some of them are also of re un�gurable type, whi h means that, for59

3.5. WSN NODE ARCHITECTUREinstan e, an analog onne tion may by properly programmed by the end-user inorder to work as a digital one.Table 3.9 reports the main ele tri al and ommuni ation hara teristi s ofthe identi�ed sensors together with the WSN node ontroller.Component Model Supplying Voltage Input Signal Output SignalWSN Node 3Mate 3.3V Analog/Digital Analog/DigitalRadar Sensor RSM-1650 5.0V / AnalogUltrasound Sensor SRF485WPR 12.0V RS485 String Code RS485 String CodeInfrared Sensor PIR_STD_LP 5.0V / AnalogTable 3.9: Ele tri al and ommuni ation hara teristi s of sensors and WSNnode.
60

CHAPTER 3. PROPOSED SOLUTION, PROTOTYPE AND VALIDATION3.5.3.1 Supplying VoltageGiven the variety of supplying voltages, whi h di�er from sensor to sensor, theproposed solution is omposed by the use of voltage regulators, whi h allowsusing a single power sour e (i.e., lead battery 6Volt, 4.5Ah) instead of singulardedi ated supplying sour es. Fig. 3.43 shows the ir uital s hemati s of thevoltage regulators to 3.3V, 5.0V and 12.0V respe tively.(a)(b)
( )Figure 3.43: Voltage regulators ir uital s heme: (a) step-down regulator 6.0V-3.3V, (b) step-down regulator 6.0V-5.0V, ( ) step-up regulator 6.0V-12.0V.61

3.5. WSN NODE ARCHITECTURE3.5.3.2 Sensors Interfa ingGiven the spe i� s reported in Table 3.9 and the obje tive of managing thesensors separately, ea h output signal has to be onne ted to one dedi ated porton the WSN node ontroller and properly managed. In parti ular, let us resumethe interfa ing of ea h identi�ed sensor with the ontroller as follows:• radar sensor : the output signal of the radar module is dire tly pro essed bythe onditioning stages, as des ribed earlier in sub-se tion 3.4.1.1. The �l-tered and ampli�ed signal obtained through these stages is then onne tedto one analog port of the ontroller (in the spe i� port ADC1, pin2 on-ne tor JP2). Fig. 3.44 shows the ir uital s heme of the onditioning stagesand the symboli onne tion to the analog port of the ontroller.
Figure 3.44: Radar sensor onditioning stages and onne tion to WSN node ontroller: ir uital s heme.• ultrasound sensor : the module ommuni ate via the RS485 proto ol. There-fore, given that the ontroller do not support this standard dire tly, aUART-RS485 onverter is needed, thanks to the availility on the ontrollerof a UART (Universal Asun hronous Re eiver Transmitter) onne tion.The use of the onverter allows the ommuni ation between the devi es.Fig. 3.45 shows the ir uital s heme of this interfa ing method.62
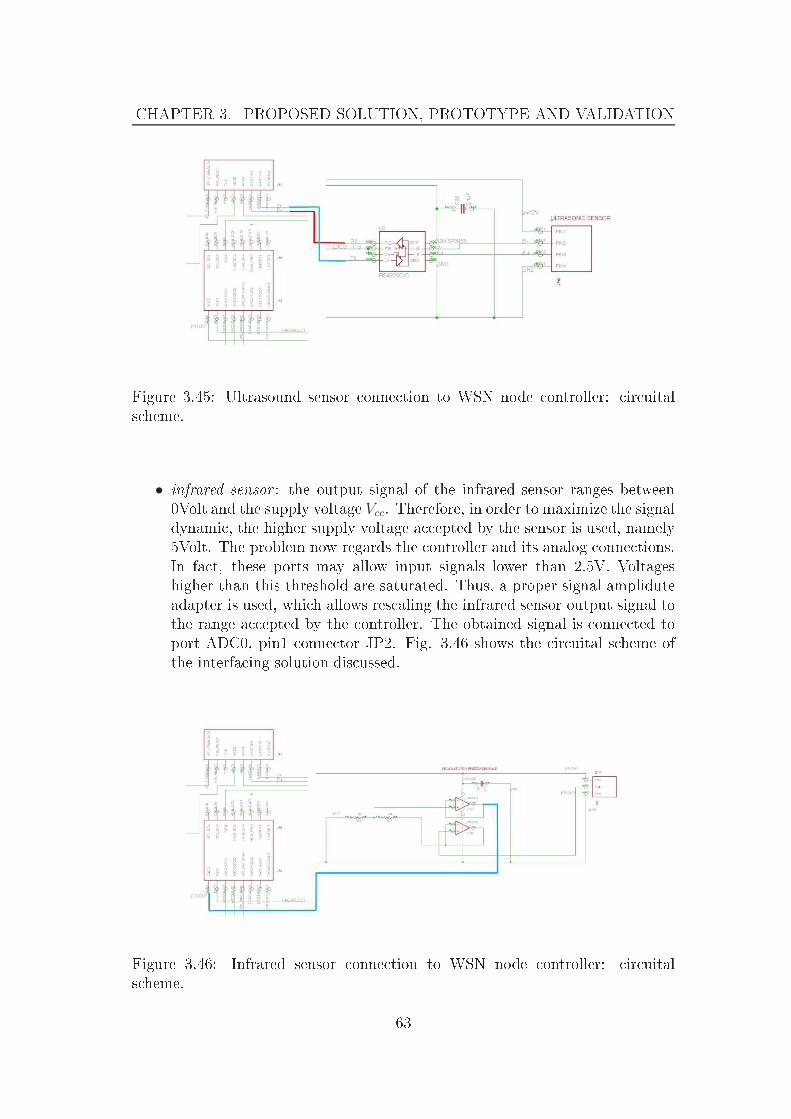
CHAPTER 3. PROPOSED SOLUTION, PROTOTYPE AND VALIDATION
Figure 3.45: Ultrasound sensor onne tion to WSN node ontroller: ir uitals heme.• infrared sensor : the output signal of the infrared sensor ranges between0Volt and the supply voltage Vcc. Therefore, in order to maximize the signaldynami , the higher supply voltage a epted by the sensor is used, namely5Volt. The problem now regards the ontroller and its analog onne tions.In fa t, these ports may allow input signals lower than 2.5V. Voltageshigher than this threshold are saturated. Thus, a proper signal ampliduteadapter is used, whi h allows res aling the infrared sensor output signal tothe range a epted by the ontroller. The obtained signal is onne ted toport ADC0, pin1 onne tor JP2. Fig. 3.46 shows the ir uital s heme ofthe interfa ing solution dis ussed.
Figure 3.46: Infrared sensor onne tion to WSN node ontroller: ir uitals heme. 63

3.5. WSN NODE ARCHITECTUREIn addition, in order to allow the manage and in parti ular enabling thepossibility to a tivate ea h single sensor independently, an analog swit h is in-trodu ed in the interfa ing board, whi h takes in input the di�erent voltagesupplies, regulated as des ribed before, and the outputs are represented by thefeeding bran hes for ea h sensing devi e. The analog swit h an be ontrolledusing digital onne tions of the ontroller, whi h range between high and lowlogi states, namely, on the base of the analog swit h typology, enabling or dis-abling the related output respe tively. Fig. 3.47 shows the ir uital s heme ofthe analog swit h, together with input and output onne tion relation. Table3.10 reports the operating signal onne ted to ea h port of the swit h.
Figure 3.47: Analog swit h onne tion to WSN node ontroller and sensors: ir uital s heme.Input Output Control Signal Power SupplyD1: 5.0V radar power supply GIO0 VL: 3.3VD2: 5.0V PIR power supply GIO1 V+: 6.0VD3: 6.0V step-up 6-12V power supply GIO2 V-: groundD4: 3.3V UART-RS485 onverter power supply GIO2 GND: groundTable 3.10: Spe i� input and output onne tions of the analog swit h for sensorsmanagement.
3.5.3.3 Supply MonitoringAs previously dis ussed, it is fundamental to monitor the a tual state of the pro-totype and in parti ular of the energy supplies of whi h it is equipped. Therefore,64

CHAPTER 3. PROPOSED SOLUTION, PROTOTYPE AND VALIDATIONbattery and solar panel voltages are monitored as index of the a tual state ofthe respe tive omponents. To this end, these signals have to be res aled, asdone for the infrared sensor, in order to allow the ontroller properly pro essingthe information via an analog onne tion (for sake of ompleteness analog portsallow input voltages in the range 0-2.5Volt). In parti ular, a voltage resistivedivider is designed and its output is onne ted to the ontroller on port ADC4(pin4 onne tor JP1) and ADC5 (pin5 onne tor JP1) for battery and solar panelrespe tively.Appendix A reports the omplete ir uital s heme of the interfa ing board, omposed by all the sub-systems dis ussed in this se tion.Fig. 3.48 shows the integrated sensor node prototype and the developed ir uital board for the sensors interfa ing.
(a) (b)Figure 3.48: Integrated sensor node prototype: (a) ir uital board, (b) integrateddevi e.65

3.6. WIRELESS NETWORK ARCHITECTURE3.6 Wireless Network Ar hite tureThe network ar hite ture points out the omplex stru ture of fun tions and re-lationships among network devi es, whi h the system or network have to supplyto the end-user. In parti ular, a fundamental aspe t of the network ar hite tureis represented by the a tual physi al stru ture of the network, also known asnetwork topology.The network topology an be also represented graphi ally thus highlightningall the inter onne tions among network devi es. Therefore, it is important to arefully take into a ount this aspe t, also onsidering the spe i� appli ations enario and its hara teristi s.3.6.1 Linear Network Ar hite tureThis network topology is the simplest one, sin e the only inter onne tion admit-ted are the uni- or bi-dire tional ones among pairs of devi es. In parti ular, thenetwork elements are pla ed along a linear positioning and thus one node rep-resents the next hope for the nearest one towards the su essive network node.Fig. 3.49 shows an example of su h topology stru ture.Figure 3.49: Linear network ar hite ture s heme.One of the main drawba k of su h ar hite ture is represented by the fa t thatthe network reliability is quite redu ed, given that the mulfun tioning of a singledevi e imply the inability for the other nodes to ommuni ate along the entirenetwork, generating two di�erent sub-networks.3.6.2 Ring Network Ar hite tureThe ring topology is an evolution of the linear ase. In fa t, it may simply beobtained by losing the linear stru ture, thus forming a ring or losed lineartopology (Fig. 3.50).This topology therefore solves the main drawba k of the linear ase, alreadydis ussed, sin e even onsidering the mulfun tioning ase of one network node,the remaining ones may re-organize themselves in a linear topology, thus allowingthe omplete ommuni ation along the network.66
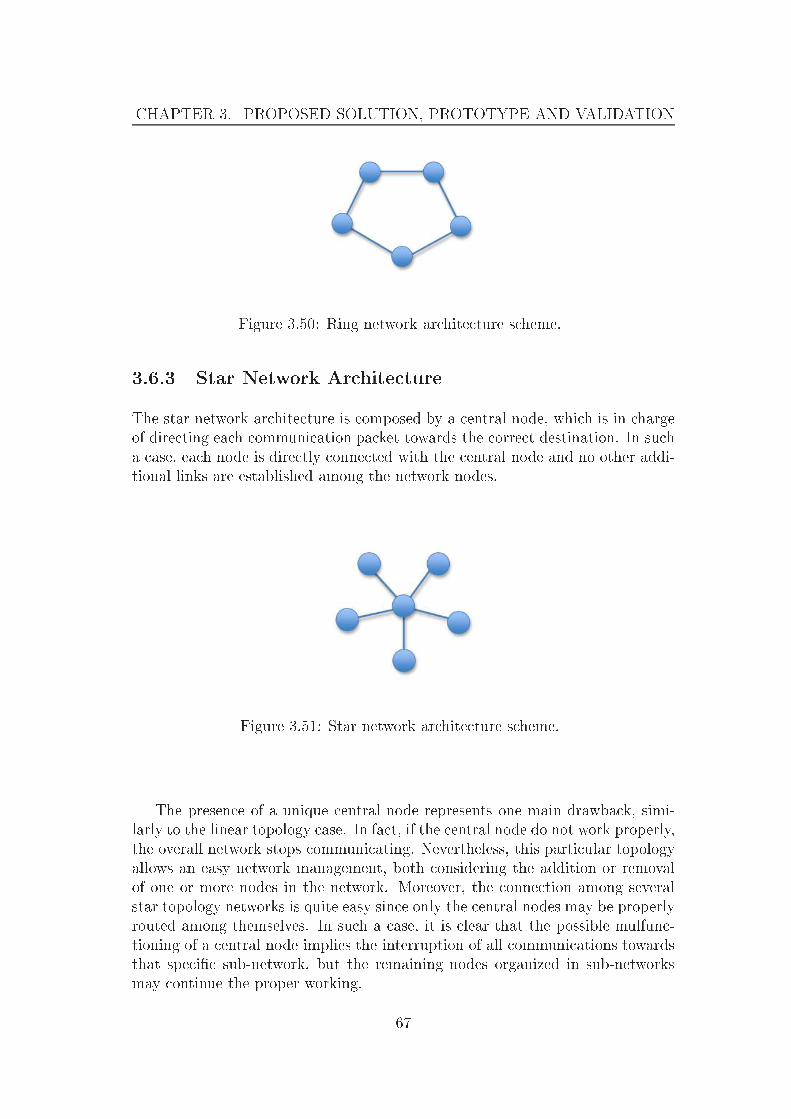
CHAPTER 3. PROPOSED SOLUTION, PROTOTYPE AND VALIDATION
Figure 3.50: Ring network ar hite ture s heme.3.6.3 Star Network Ar hite tureThe star network ar hite ture is omposed by a entral node, whi h is in hargeof dire ting ea h ommuni ation pa ket towards the orre t destination. In su ha ase, ea h node is dire tly onne ted with the entral node and no other addi-tional links are established among the network nodes.
Figure 3.51: Star network ar hite ture s heme.The presen e of a unique entral node represents one main drawba k, simi-larly to the linear topology ase. In fa t, if the entral node do not work properly,the overall network stops ommuni ating. Nevertheless, this parti ular topologyallows an easy network management, both onsidering the addition or removalof one or more nodes in the network. Moreover, the onne tion among severalstar topology networks is quite easy sin e only the entral nodes may be properlyrouted among themselves. In su h a ase, it is lear that the possible mulfun -tioning of a entral node implies the interruption of all ommuni ations towardsthat spe i� sub-network, but the remaining nodes organized in sub-networksmay ontinue the proper working. 67

3.6. WIRELESS NETWORK ARCHITECTURE3.6.4 Mesh Network Ar hite tureThe mesh topology do not require any kind of entral node or oordinator. Thenetwork devi es are able to ommuni ate with all the other nodes in the networkthanks to dedi ated links and following spe i� routing rules. This ar hite ture ategory may further lassi�ed on the basis of the parti ular onne tions amongthe nodes, namely ompletely onne ted networks (in whi h ea h single node is onne ted with any other node in the network) and non- ompletely onne tednetworks (in whi h some nodes are onne ted only with some other devi es inthe network).Figure 3.52: Mesh network ar hite ture s heme.This network topology is highly reliable, sin e even the mulfun tioning ofone or more network nodes do not imply the stop of ommuni ations among theother nodes, thanks to the multiple links among nodes.3.6.5 Appli ation S enarios and Network TopologyAs dis usses above, the network ar hite ture may be de�ned together with theknowledge of the a tual appli ation s enario and of its hara teristi s and thespe i� al fun tionalities, whi h the network has to satisfy. Therefore, the follow-ing subse tions take into a ount some examples of system appli ation s enariostogether with the de�nition of the network topology more suitable for the spe i� ase.3.6.5.1 Controlled EnvironmentThe ategory ontrolled environment in ludes all those appli ation s enarios usedfor experimental validation tests of the WSN sensor node prototype. In parti u-lar, these environments are hara terized by the absen e of �ba kground noise�,like buildings or plants, whi h may limit or alter the a tual �eld-of-view of thesensors. Therefore the bene�t of su h appli ation s enarios is pre isely repre-sented by the fa t that experimental test in real environments may be performedwithout any parti ular perturbation. 68

CHAPTER 3. PROPOSED SOLUTION, PROTOTYPE AND VALIDATIONLet us onsider two main typologies of ontrolled environment, lassi�ed in re-lation to the maximum overage of the network node radio trans eiver, namely:redu ed dimension ontrolled environment and medium/large dimension on-trolled environment.In the former ase, the radio overage is larger than the dimensions of the ontrolled environment, as shown in Fig. 3.53.
Figure 3.53: WSN node radio trans eiver overage: s heme and diameter of the overed area.In su h onditions, the network ar hite ture, whi h may be used, is of thestar topology. In fa t, given the need of olle ting the sensed data from all thenodes pla ed in the environment, the use of a entral node dire tly onne tedto the ontrol unit for data storage and analysis (i.e., gateway node) on�rmthis hoi e. In addition, the possibility to dire tly send data towards the entralnode allows simplifying the network routing and in turn the tasks of ea h networknode.The latter ase, instead, in ludes all those s enarios with dimensions ompa-rable or larger than the maximum overage of the sensor node radio trans eiver(Fig. 3.55). In su h on�guration, the suggested network topology is a hybridone, omposed as the ombination of star and mesh topologies. In parti ular, the onne tion between the gateway node and a peripheral node (i.e., sensor node)is not guaranteed dire tly. Given the large environmet dimensions, the distan ebetween these two nodes may be larger than their respe tive radio overage, thusimplying the need of several hopes among other nodes, in harge of re eiving andforwarding data towards the destination node (i.e., gateway or peripheral nodedepending on the message type). 69

3.6. WIRELESS NETWORK ARCHITECTURE
Figure 3.54: Controlled environment of redu ed dimensions.
Figure 3.55: Controlled environment of medium/large dimensions.70

CHAPTER 3. PROPOSED SOLUTION, PROTOTYPE AND VALIDATION3.6.5.2 Real Environmet: Experimental SiteConsidering the analysis dis ussed in the previous se tion, it is possible to sup-pose the network ar hite ture of the monitoring system omposed by severalsensor nodes pla ed along the road in order to allow the proper ommuni ationamong the network.In parti ular, onsidering the dimensions of a possible experimental test site,these will be very large ompared to the maximum radio overage. Therefore,similar to the medium/large ontrolled s enario, a hybrid star-mesh networktopology may be used. More spe i� ally, the network topology may be omposedby four main lasses of WSN nodes, ea h with spe i� fu tionalities:• peripheral/sensor node: WSN node in harge of interfa ing and managingall the sensors (i.e., radar, ultrasound, infrared);• gateway node: WSN node in harge of re eiving and forwarding the senseddata to the ontrol unit to whi h it is dire tly onne ted (e.g., p or server).It is also in harge of sending radio messages to peripheral nodes and tothe a tuator node when needed;• a tuator node: WSN node interfa ed with the a tuation devi e (e.g., lumi-nous road sign);• an hor node: WSN node in harge of dire ting the radio pa kets sent overthe network towards the orre t destination, in order to allow the proper omuni ation among all the nodes, also those too far for a dire t onne tionwith the gateway node.In addition, this network topology allows arranging the sensor nodes quite easilyalong the monitored road, by inserting at regular intervals an hor nodes fornetwork extension. In this way, all the sensor nodes will be able to sense andsend the a quired data, whi h will be properly re eived by the gateway node andthus by the ontrol unit. Fig. 3.56 shows an example sket h of an exprimentaltest site and the possible positioning of the WSN nodes for the proper systemworking.
71
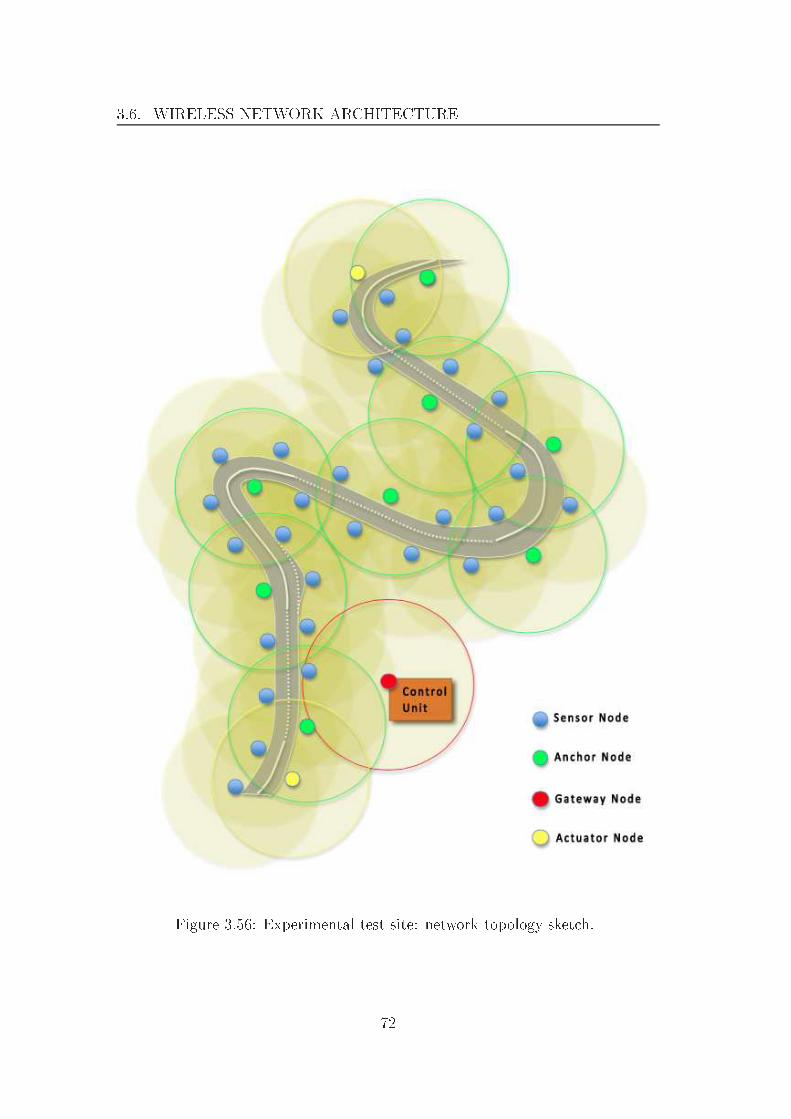
3.6. WIRELESS NETWORK ARCHITECTURE
Figure 3.56: Experimental test site: network topology sket h.72

CHAPTER 3. PROPOSED SOLUTION, PROTOTYPE AND VALIDATION3.7 Testing of the WSN Monitoring System in ontrolled Test-siteA small dimension WSN network has been deployed in a ontrolled s enario, atthe �Centro Fauna Alpina A. Falzogher�, Casteller - Trento. The perfomed testsin su h s enario exploit three WSN sensor nodes, whi h integrate the sensorsdis ussed in the previous se tions. Several movements have been performedin the monitored area, in order to validate the a tual working of the system.As expe ted, approa hing and leaving movements are learly dete ted by radarsensors, de�ning an area large about 12-15m from the WSN node position inthe orthogonal dire tion in whi h any movement is a quired. Fig. 3.57(a) showsthe target approa hing the node with id=2 and the simple graphi al interfa edisplays in red the sensors, whi h dete t the event (Fig. 3.57(b)).
(a) (b)Figure 3.57: WSN monitoring system testing: (a) approa hing event, (b) graph-i al interfa e showing the event dete tion.Considering instead lateral movements, infrared and radar sensors allow thedete tion of the moving target, as shown in Fig. 3.58. In parti ular, the targetstarts its run near the position of sensor node with id=3 and then moves towardsthe other nodes. Ultrasound sensors, on the ontrary, do not dete t the presen eof the target even if sometimes some measured distan es are get by the sensornodes, whi h do not oin ide with the a tual target position.73

3.7. TESTING OF THE WSN MONITORING SYSTEM IN CONTROLLEDTEST-SITE
(a) (b)Figure 3.58: WSN monitoring system testing: (a) lateral movement, (b) graphi- al interfa e showing the event dete tion.On the basis of these tests, additional ones have been perfomed also on-sidering omplex events as the ombination of these simple ases. As expe ted,the out ome resemble what have been presented above and in parti ular radarsensors appears to be highly sensitive to a tual movements with respe t to theother sensors.3.7.1 Test in Deer Fen eThanks to the ollaboration of game warden it has been possible to install themonitoring system in a deer fen e at the �Centro Fauna Alpina A. Falzogher�(Casteller, Trento). The sensor nodes have been deployed on a fen e near apassage where deers are usal to pass trough, as shown in Fig. 3.59.
Figure 3.59: WSN monitoring system testing: sensor node position inside thedeer fen e. 74

CHAPTER 3. PROPOSED SOLUTION, PROTOTYPE AND VALIDATIONThe deer movements have been performed in two main steps and with di�er-ent typologies, whi h has allowed the validation of the sensors a tual working inrelation to the spe i� event o urred. In parti ular, at �rst some deers movedlaterally in front of the sensor node 1, leaving then the s ene near sensor node2. Fig. 3.60 shows a pi ture of the movement, in parti ular Fig. 3.60(a) the ap-proa hing movement lateral to node 1, while Fig. 3.60(b) the leaving movementorthogonal to node 2.The dete ted events are shown in Fig. 3.60( ) and Fig. 3.60(d) respe tively.As expe ted the infrared sensor of node 1 and the radar sensor of node 2 orre tlysensed the events in their �eld-of-view.
(a) (b)( ) (d)Figure 3.60: WSN monitoring system testing: (a) lateral approa hing movement,(b) leaving movement, ( ) graphi al interfa e showing the approa hing eventdete tion, (d) graphi al interfa e showing the leaving event dete tion.The se ond motion, instead, regards a herd of deers, whi h moves linearly infront of sensor nodes, from node 3 to node 1. Fig. 3.61(a) shows the herd of deersrunning in front of the sensors. Also in this ase, the motion has been orre tlydete ted by all three sensor nodes, as shown in Fig. 3.61(b), whi h reports thegraphi al interfa e displaying all the events dete ted by the sensor nodes.75

3.7. TESTING OF THE WSN MONITORING SYSTEM IN CONTROLLEDTEST-SITE
(a)(b)Figure 3.61: WSN monitoring system testing: (a) deers movement, (b) graphi alinterfa e showing the event dete tion.Both the events have been learly dete ted by the sensor nodes, on�rmingthe high sensitivity of ea h sensor to spe i� movement typology. In parti ular:
• the radar sensor allows dete ting moving targets within 10-15m from thesensor plane and spe i� ally orthogonal movements are more sensitive tothis sensor te hnology. In addition, su h sensor is quite robust for thisappli ation, onsidering also the possibility to prote t the sensor itself witha diele tri box, whi h may not alter its radiation performan e.• the infrared sensor is more sensitive to lateral movements, allowing thedete tion of moving targets within about 6m from the sensor plane. Thesensor is quite robust, but the main disadvantage for this te hnolgy is theneed to open a hole in the sensor node en losure, thus allowing the sensorhaving a view of the monitored s enario.• the ultrasound sensor does not allow the distin t dete tion of movementsin its �eld-of-view during the performed tests. In parti ular, this is mainlydue to the a tual installation position of su h sensor. In fa t, additionaltests have proven that by varying the sensor height form the ground toabout 1.5m, the pre ise ranging is given to the ontroller. In addition, as76

CHAPTER 3. PROPOSED SOLUTION, PROTOTYPE AND VALIDATIONfor the infrared sensor, also in this ase a hole in the sensor node en losureis needed, thus allowing the proper sensor fun tioning.Therefore, Table 3.11 resumes the test out omes and the judgement, whi h hasbeen dedu ed onsidering four main parameters, namely: physi al robustness,integration with sensor node en losure, �eld-of-view dimension, measuring relia-bility. In parti ular, good, medium or bad judgments are used.Te hnology Robustness Integration Measuring Range ReliabilityRadar good good good goodInfrared medium medium bad mediumUltrasound bad medium bad badTable 3.11: Sensors evaluation on the basis of four main parameters given by theexperimental tests out ome and spe i� te hnology features.
77

3.7. TESTING OF THE WSN MONITORING SYSTEM IN CONTROLLEDTEST-SITE
78
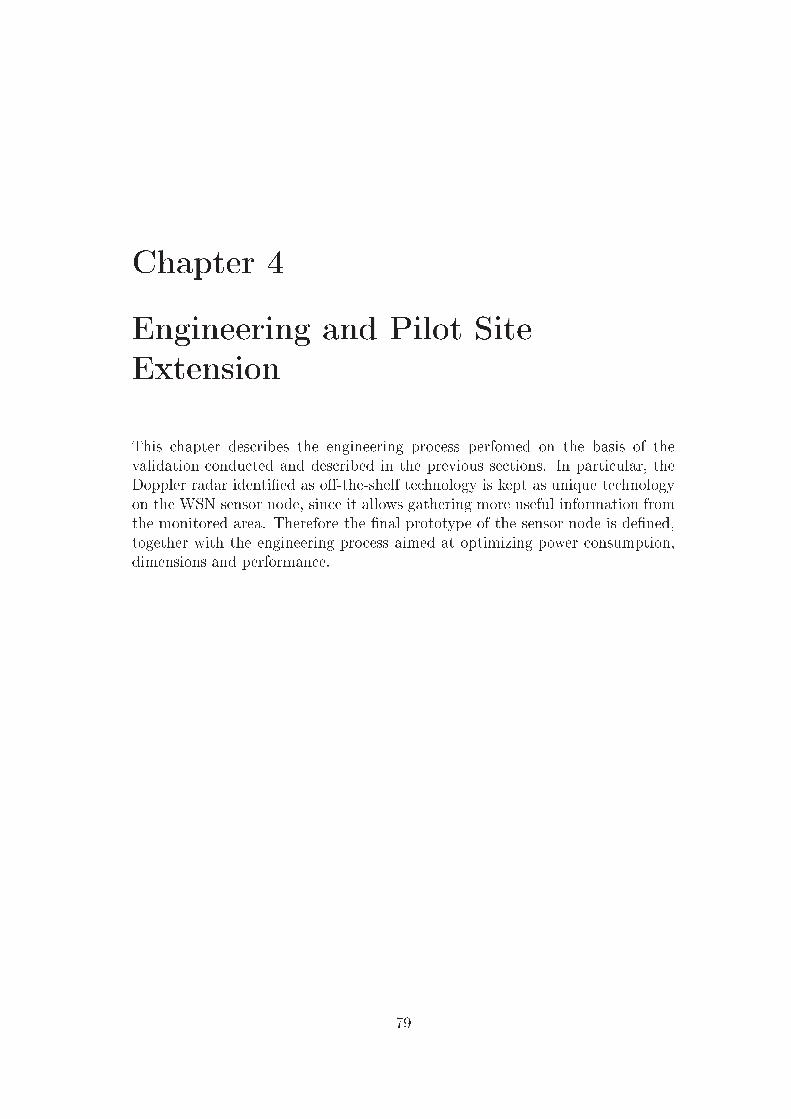
Chapter 4Engineering and Pilot SiteExtensionThis hapter des ribes the engineering pro ess perfomed on the basis of thevalidation ondu ted and des ribed in the previous se tions. In parti ular, theDoppler radar identi�ed as o�-the-shelf te hnology is kept as unique te hnologyon the WSN sensor node, sin e it allows gathering more useful information fromthe monitored area. Therefore the �nal prototype of the sensor node is de�ned,together with the engineering pro ess aimed at optimizing power onsumption,dimensions and performan e.
79

4.1. DOPPLER RADAR4.1 Doppler RadarThe proposed monitoring system is mainly based on the use of Doppler radarsensors. As well known, the physi al phenomenon behind the devi e fun tioningis the Doppler e�e t, for whi h a moving target implies the frequen y shift of theba ks attered signal with respe t to the signal transmitted by the sensor itself.Therefore, parti ular attention should be given to the surfa e hara teristi s onwhi h the signal impinges, sin e di�erent e�e ts on the ele tromagneti wavemay be experimented, su h as di�erent re�e tions and s attering phenomena.More in detail, the Doppler e�e t des ribes the apa ity of a moving targetof produ ing a frequen y shift of the re�e ted ele tromagneti wave, from whi huseful information may be retrieved. One of the prin ipal appli ation of su he�e t is represented by the Doppler radar sensors, whi h are able to estimatethe target velo ity by exploiting the frequen y shift between the ba ks atteredand the transmitted signals. Typi al example of su h phenomenon is given byan ambulan e moving with respe t to a stationary observer. The sound emittedby the vehi le alarm, whi h is spe i� ally emitted at a ertain frequen y, willbe per eived by the observer in di�erent ways as the ambulan e approa hes orleaves the observer. In parti ular, in the former ase the frequen y shift willallow the observer hearing an higher frequen y alarm and vi eversa when thevehi le leaves the observer, the per eived alarm frequen y will be lower than thea tual one.Therefore, onsidering the s heme shown in Fig. 4.1, the Doppler shift maybe omputed as follows:fshift = 2v ftx
ccos(θ)where:
• fshift represents the frequen y Doppler shift of the radar transmitted signal,expressed in Hz;• v is the a tual target speed, expressed in m/s;• ftx is the radar emitted signal, expressed in Hz;• θ is the angle between the target motion traje tory and the orthogonaldire tion to the radar sensor, expressed in radiants.For instan e, the use of the des ribed equation allows the easy omputation ofthe target speed, given the working frequen y, θ and the Doppler shift. Nev-ertheless, two parti ular ases may be de�ned, namely onsidering θ equal to0◦ or 90◦. Su h onditions, in fa t, are parti ular s enarios in whi h the targetmoves orthogonally with respe t to the radar or it performs lateral/tangentialmovements with respe t to the sensor plane respe tively. Therefore the followingmay be de�ned: 80

CHAPTER 4. ENGINEERING AND PILOT SITE EXTENSION• if θ = 0◦ the maximum Doppler shift is obtained, given that: fshift =2v ftx
ccos(0◦) = 2v ftx
c
• if θ = 90◦ the minimum Doppler shift is obtained, given that: fshift =2v ftx
ccos(90◦) = 0
Figure 4.1: Doppler e�e t s heme.During the design of su h systems, the analysis of the ratio between trans-mitted and re eived power is a very important parameter, mainly related tosystem and target hara teristi s [64, 65℄. In detail, the following relation allows omputing the re eived power ba k in a radar system, by onsidering severalparameters as des ribed after:Prx = PtxG
2λ2Aσ0
(4π)3R4Lwhere:• Ptx is transmitted power, expressed in Watts• G is the antenna gain in dB unit• λ is the wavelength of the radar transmitted signal, expressed in meters• A is the area illuminated by the radar, measured in m2
• R is the distan e between radar and target, expressed in meters• σ0 is the target normalized Radar Cross Se tion (RCS)• L represents the system lossesAs it an be noti ed, several parameters are involved in the omputation ofthe re eived power and parti ular attention may be given to the RCS parameter,whi h allows measuring how mu h a target may be dete ted by the radar system,81

4.1. DOPPLER RADAR
Figure 4.2: Doppler radar s heme.namely higher RCS values state for highly dete table target and theoreti alylarger re eived power and vi eversa.Fig. 4.2 illustrated a simpli�ed blo k s heme of a Doppler radar. In detail,the gunn diode, properly ex ited by the external power supply, generates ele -tromagneti waves at a given frequen y, whi h are passed to the ir ulator orduplexer. The ir ulator is a mi rowave omponent generally omposed by threeor more ports and hara terized by a dire tion of rotation. A typi al appli ationof su h omponent is for signal de oupling and re eption, sin e one port may be onne ted to the signal sour e, another port to the antenna element and fromthe last port the signal re eived on the antenna de oupled with respe t to thesour e signal may be retrieved. Therefore, thanks to the use of su h ompo-nent, a ontinuous wave radar may be designed, whi h allows the simultaneoustransmission and re eption on the antenna.The next omponent is represented by the mixer, whi h is used in orderto shift the re eived signal to lower frequen ies. In fa t, let us onsider thetransmission signal frequen y to be ftx. The re eived signal frequen y will berelated to the transmitted one and to the Doppler e�e t, onsidering the presen eof a moving target. Therefore, frx = ftx +∆f will be the frequen y of the signalre�e ted by the target towards the antenna. At this point, the re eived signal willpass through the ir ulator and then to the mixer, where the signal multipli ationwith the one generated by the gunn diode will allow shifting to lower frequen iesthe re eived signal and spe i� ally to the value of ∆f . Thus the signal may be�ltered and ampli�ed for next pro essing stages.In parti ular, thanks to the te hnologi al progress, all these omponents areintegrated in a single one alled trans eiver, whi h only needs of a power supplyand a radiating element. 82

CHAPTER 4. ENGINEERING AND PILOT SITE EXTENSIONRadar te hnology is widely used nowadays for several appli ations, whi h mayrange among spa e appli ations as des ribed by authors in [66, 67℄, or weatherappli ations, bird migration surveillan e for wind energy systems, airborne radar,hydrology monitoring and many others. More in detail, for instan e, [68℄ presentsthe development of an innovative tool for atmospheri storms observation basedon Doppler radar, operating in the X-band frequen y range and mounted on anairplane. In parti ular, onsidering this s enario, the radar is used in order toprovide a urate measurments of air motion and rainfall related to large storms,whi h in general are too far and/or too large for being observable by groundradar systems [69, 70℄.Another relevant �eld of appli ation of the radar te hnology is related tosurveillan e systems and as an example monitoring wind turbine plants for birdmigration phenomena [71℄. Wind energy is very attra tive and the number ofdeployed plants is growing a lot, thanks to the possibility of harvesting su h en-ergy wherever there are strong winds. The main problem on erning the turbinestru tures is related to birds and bats mortality mainly due to ollision, dis-pla ement due to disturban e, barrier e�e t and habitat loss [72, 73℄. Therefore,the authors propose the use of weather radar for providing quanti� ation dataregarding bird migration patterns, thus limiting the negative e�e t of this green,free and renewable energy. Doppler radar may also be exploited for wind ob-servation analysis and in parti ular several methodologies have been developed,su h as a multi-grid analysis of 3D Doppler radar radial velo ity [74, 75℄.Always in the environmental monitoring, radar has been used in order to mapand monitor wetlands and forests, whi h are very important for water qualityand aquati habitat. Therefore hydrology studies may be ondu ted on syntheti aperture radar data used for su h appli ation as des ribed in [76℄.Additional studies have also been fo used on the analysis of real-time estima-tion and ompensation methodologies of airbone radar platform movements [77℄.Airborne radars are nowadays essential devi es for many appli ations, but dueto the natural movements of the aerial platform, Doppler shift may be a�e tedby this phenomenon. Therefore, a urate real-time estimation and ompensa-tion of su h motions may be onsidered in order to properly allow moving targetdete tion. To this end several studies have been performed, whi h may try to ompensate the shift by adjusting the frequen y of the os illator, or by insertinga phase shift thus an elling the unwanted e�e t [78, 79, 80, 81℄.Di�erent from the above appli ation examples, [82℄ presents the appli ationof Doppler radar for monitoring and analysis of respiration pattern in an unob-trusive manner. In parti ular, the identi� ation of abnormal breathing patternrepresents an important task very useful for improve knowledge about respiratorydisorders and at the same time re�ning diagnosti pro edures. Doppler radarshave been largely used for health are monitoring systems and several works havebeen reported in literature [83, 84, 85, 86, 87℄, but as the authors of [82℄ de lare,no spe i� studies have been fo used on the identi� ation of breathing patterns,83

4.1. DOPPLER RADARthus allowing to apture di�erent types of respiratory trends.
84

CHAPTER 4. ENGINEERING AND PILOT SITE EXTENSION4.2 WSN Sensor Node EngineeringConsidering the out omes reported in Table 3.11, showing the judgment of theseveral te hnologies used during the previous phases of the proje t thesis, thedoppler radar model RSM-1650 is the unique te hnology, whi h performs at asu� ient level for the aim of the monitoring system. Therefore, by using onlythis te hnology, the key idea is to exploit two radar sensors, thus doubling theWSN sensor node �eld-of-view. In parti ular, a sket h of this idea is shown inFig. 4.3.
(a)
(b)Figure 4.3: WSN sensor node �eld-of-view: (a) single radar module, (b) doubleradar module. 85

4.2. WSN SENSOR NODE ENGINEERINGTherefore, given the se ond radar module, a hange in the sensor node ir- uital s hemati is ne essary and in parti ular an innovative solution is intro-du ed in order to limit power onsumption and to optimize the available re-sour es. In this view, a multiplexer is introdu ed thus allowing the use of asingle onditioning stage for the radar signal, being of the �rst or se ond radarmodule. Fig. 4.4 shows the blo k diagram of the proposed solution. The radarsignals are multiplexed a ording to a spe i� logi in harge of the ontrollerand thus programmed via its �rmware.
MU
LTIP
LEX
ER
PW
R
MULTIPLEXER1st AMPLIFIER
STAGESTAGE2nd AMPLIFIER
TRIGGERRECTIFIER &
FILTER
RADAR 1
RADAR 2
WSN NODE
1st AMPLIFIER STAGE OUTPUTTRIGGEROUTPUT
POWER MANAGEMENT
MULTIPLEXER CONTROL SIGNAL
WSN NODE PWR
RA
DA
R 2
PW
R
RA
DA
R 1
PW
R
Figure 4.4: Blo k diagram of the onditioning stage in ase of double radarmodule.Additional information may be obtained by the radar sensors, thanks to thedire t onne tion to the ontroller of the output of the �rst ampli� ation stage.This allows the a quisition of a raw signal, whi h is higly informative with re-spe t to the a tual event o urred in the sensor �eld-of-view. This signal then ontinues the pro essing phase through the �ltering stages, in order to negle tundesired signal omponents, and the re ti�er, thus olle ting the larger amountof the signal energy. The ombination of su h signals, namely raw and pro essed,may allow better event dete tion and analysis, thus improving the system perfor-man e. As an example, the pro essed signal may be used as trigger for startingthe a quisition and pro essing of the raw signal. In this way higher omputa-tion demand is required only when a tual movements are dete ted and in su h ases more information are obtained by the ombination and analysis of multipleversions of the radar signal.Fig. 4.5(a) reports an example of the raw signal, output of the �rst ampli�erstage, and relative to a leaving movement from the sensor plane. The signal stops86

CHAPTER 4. ENGINEERING AND PILOT SITE EXTENSIONwhen the target has rea hed about 15m from the radar module. As expe ted thesignal de reases progressively as the target move away. Similar ase is shownin Fig. 4.5(b) in ase of an approa hing event. In this ase, the target movestowards the sensor plane and the dete tion starts when the target is at about14m from the sensor plane. Opposite to the previous ase, the signal amplitudein reases as the target approa hes the radar sensor.
(a)
(b)Figure 4.5: Radar signal output of the �rst ampli�er stage: (a) leaving move-ment, (b) approa hing movement. 87
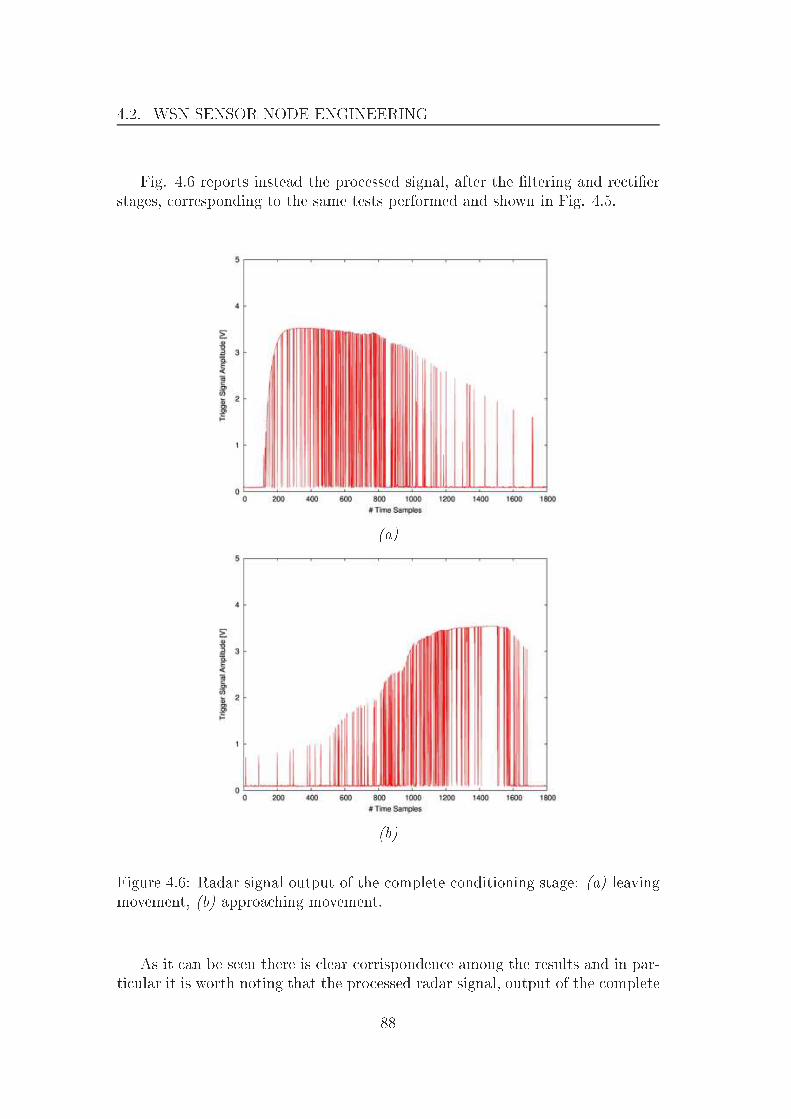
4.2. WSN SENSOR NODE ENGINEERINGFig. 4.6 reports instead the pro essed signal, after the �ltering and re ti�erstages, orresponding to the same tests performed and shown in Fig. 4.5.
(a)
(b)Figure 4.6: Radar signal output of the omplete onditioning stage: (a) leavingmovement, (b) approa hing movement.As it an be seen there is lear orrisponden e among the results and in par-ti ular it is worth noting that the pro essed radar signal, output of the omplete88

CHAPTER 4. ENGINEERING AND PILOT SITE EXTENSION onditioning stage, allows the dete tion of the moving target at higher distan es,spe i� ally 20-22m from the sensor plane during leaving events and 17m duringapproa hing events.Therefore by omparing these results, it may be noti ed like the pro essedsignal may be exploited for the �rst event dete tion, whi h allows triggering thea quisition of the raw radar signal from whi h additional information may beretrieved (i.e., dire tion, speed, et .).4.2.1 WSN Node PlatformsSeveral te hnologies are available onsidering the WSN node platform, whi hrepresents the ontroller se tion of the WSN sensor node des ribed in this do -ument. Ea h of the devi es presented hereafter are hara terized by spe if features, whi h may be advantages or disadvantages onsidering the spe i� s e-nario in whi h the platform has to be used. Therefore, the pre ise analysis ofthese omponents is a ru ial aspe t, in parti ular regarding the spe i� workthe platform will have to perform.A �rst lassi� ation of the WSN node platforms may be ondu ted on thebasis of the radio module working frequen y, namely 868MHz and 2.4GHz. Infa t, these are the main working frequen y adopted by su h modules and it isa fundamental aspe t for their de�nition sin e, as well known, the operatingfrequen y of the radio module is dire tly related to the a tual ommuni ationdistan e. In addition, for the sake of ompleteness, the following re all the in-verse relation between frequen y f and wavelength λ, given by: λ = c/f , wherec is the light speed in meters/se onds [m/s℄, f is the working frequen y mea-sured in Hertz [Hz℄ and λ is the signal wavelength expressed in meters [m℄. Thusthe a tual relation between wavelength and overage distan e allows determiningthat higher frequen ies implies theoreti ally smaller ommuni ation ranges andvi eversa onsidering lower frequen ies. Nevertheless, su h parameters may notbe onsidered in absen e of the a tual radiation power, namely even radio mod-ules operating at higher frequen ies may perform larger ommuni ation rangesthanks to higher power transmission levels.In the following, the main WSN platforms used nowadays are presented witha brief resume of their spe i� ations:
• 3Mate platform� working frequen y: 2.4GHz� IEEE802.15.4 standard ompliant� transmitting power: [-25dBm, 0dBm℄� printed antenna and external antenna onne tor predisposition� 16-bit mi ropro essor, 48KB �ash memory, 10KB RAM89

4.2. WSN SENSOR NODE ENGINEERING� 12-bit analog-to-digital onverter, with adjustable voltage referen e(max 3.0Volt)� power supply 3.3Volt� dimensions: 70x40x15mm� ost: ∼$140.00Figure 4.7: WSN node platforms: 3Mate devi e.
• TinyNode platform� working frequen y: 868MHz� transmitting power: [-3dBm, 12dBm℄� wire antenna and external antenna onne tor predisposition� 16-bit mi ropro essor, 48KB �ash memory, 10KB RAM� 12-bit analog-to-digital onverter, with adjustable voltage referen e(max 3.0Volt)� power supply 3.3Volt� dimensions: 30x40x10mm� ost: ∼$120.00
Figure 4.8: WSN node platforms: TinyNode devi e.90

CHAPTER 4. ENGINEERING AND PILOT SITE EXTENSION• Flyport platform� working frequen y: 2.45GHz� Wi-Fi 802.11 standard ompliant� transmitting power: 16dBm� printed antenna and external antenna onne tor predisposition� 16-bit mi ropro essor, 256KB �ash memory, 16KB RAM� 10-bit analog-to-digital onverter, with voltage referen e (max 2.048Volt)� power supply 3.3Volt or 5.0Volt� dimensions: 35x48x15mm� ost: ∼$43.00
Figure 4.9: WSN node platforms: Flyport devi e.• Arduino and XBee platforms� working frequen y: 868MHz or 2.4GHz� transmitting power: 10dBm for 2.4GHz, [0dBm, 25dBm℄ for 868MHz� printed antenna and external antenna onne tor predisposition� 8-bit mi ropro essor, 32KB �ash memory, 2KB RAM� 10-bit analog-to-digital onverter, with voltage referen e (max 5.0Volt)� power supply 3.3Volt� dimensions: 65x30x13mm� osts:
∗ Arduino FIO: ∼$25.00∗ XBee Pro 2.4GHz Radio Module: ∼$38.00∗ XBee Pro 868MHz Radio Module: ∼$82.0091
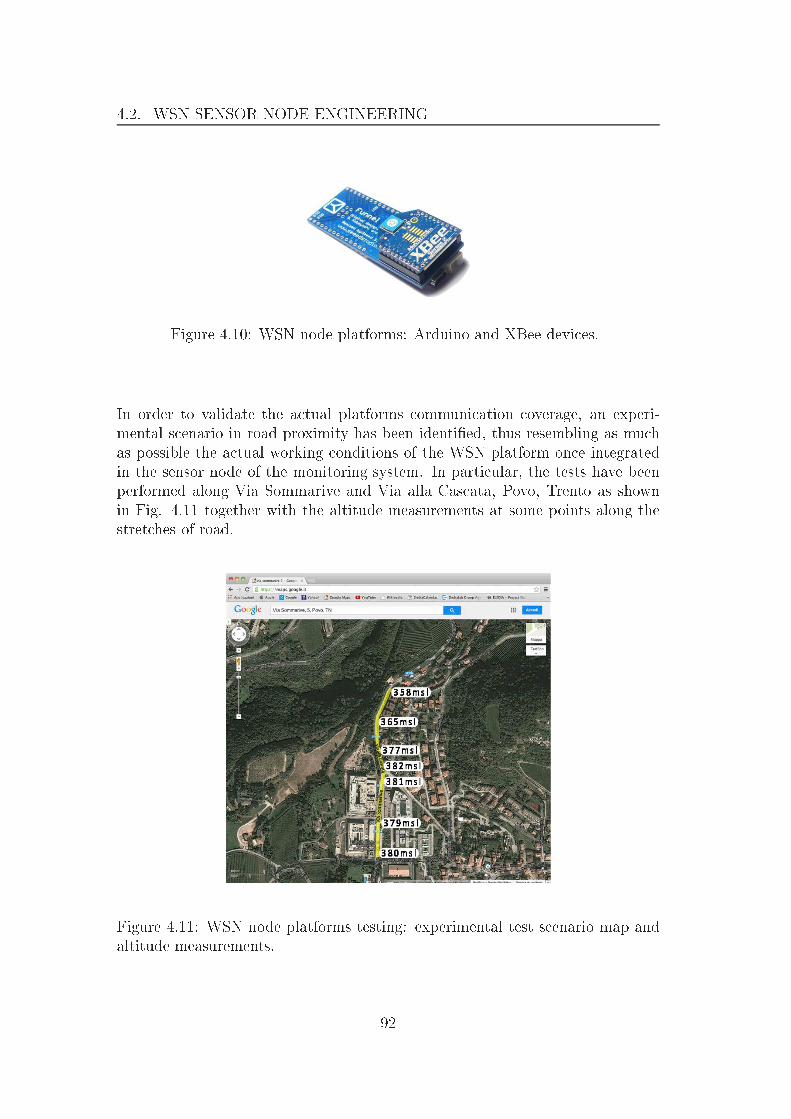
4.2. WSN SENSOR NODE ENGINEERING
Figure 4.10: WSN node platforms: Arduino and XBee devi es.In order to validate the a tual platforms ommuni ation overage, an experi-mental s enario in road proximity has been identi�ed, thus resembling as mu has possible the a tual working onditions of the WSN platform on e integratedin the sensor node of the monitoring system. In parti ular, the tests have beenperformed along Via Sommarive and Via alla Cas ata, Povo, Trento as shownin Fig. 4.11 together with the altitude measurements at some points along thestret hes of road.
Figure 4.11: WSN node platforms testing: experimental test s enario map andaltitude measurements. 92
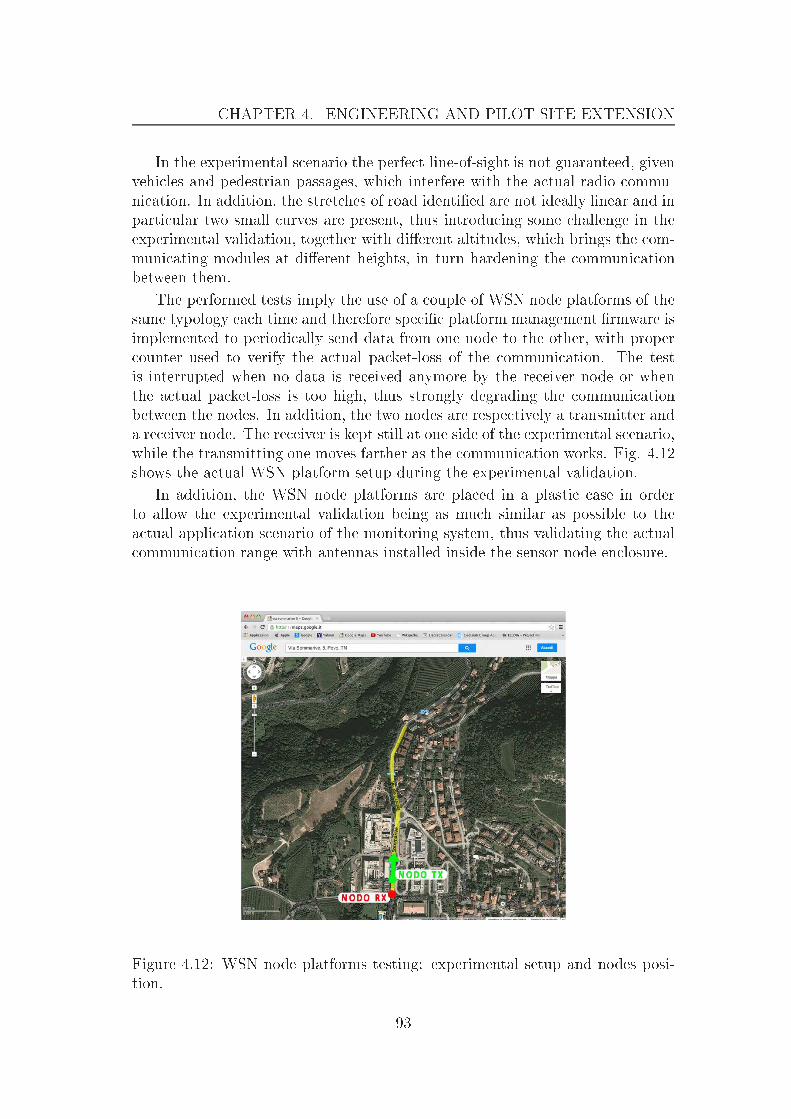
CHAPTER 4. ENGINEERING AND PILOT SITE EXTENSIONIn the experimental s enario the perfe t line-of-sight is not guaranteed, givenvehi les and pedestrian passages, whi h interfere with the a tual radio ommu-ni ation. In addition, the stret hes of road identi�ed are not ideally linear and inparti ular two small urves are present, thus introdu ing some hallenge in theexperimental validation, together with di�erent altitudes, whi h brings the om-muni ating modules at di�erent heights, in turn hardening the ommuni ationbetween them.The performed tests imply the use of a ouple of WSN node platforms of thesame typology ea h time and therefore spe i� platform management �rmware isimplemented to periodi ally send data from one node to the other, with proper ounter used to verify the a tual pa ket-loss of the ommuni ation. The testis interrupted when no data is re eived anymore by the re eiver node or whenthe a tual pa ket-loss is too high, thus strongly degrading the ommuni ationbetween the nodes. In addition, the two nodes are respe tively a transmitter anda re eiver node. The re eiver is kept still at one side of the experimental s enario,while the transmitting one moves farther as the ommuni ation works. Fig. 4.12shows the a tual WSN platform setup during the experimental validation.In addition, the WSN node platforms are pla ed in a plasti ase in orderto allow the experimental validation being as mu h similar as possible to thea tual appli ation s enario of the monitoring system, thus validating the a tual ommuni ation range with antennas installed inside the sensor node en losure.
Figure 4.12: WSN node platforms testing: experimental setup and nodes posi-tion. 93

4.2. WSN SENSOR NODE ENGINEERINGThe following resumes the a tual experimental out omes obtained in termsof maximum ommuni ation distan e between ouple of same typology nodes:• 3Mate platform:� maximum overage: 280m• TinyNode platform:� maximum overage: 180m• Flyport platform:� maximum overage: 300m• Arduino and XBee platforms:� maximum overage: 400m for 2.4GHz� maximum overage: 450m for 868MHzTherefore, onsidering the tests out omes, the WSN platform performing betterthan the other ones is represented by the Arduino and XBee ombination plat-form and spe i� ally onsidering the 868MHz radio module. Nevertheless, su hsolution is not ost-e�e tive parti ularly onsidering the XBee module operatingat su h frequen y. Thus, similar results have been obtained by the use of Arduinoand XBee 2.4GHz modules. Su h on�guration, in fa t, is more ost-e�e tive andthe a tual maximum ommuni ation overage resembles the previous one. Theother te hnologi al solutions are not onvenient for the monitoring system, on-sidering osts and radio module performan e.4.2.2 Prototype Layout OptimizationStarting from the prototype developed and des ribed in the previous se tions,an optimization pro edure has been performed in order to improve omponentspositioning and implementing some ir uital hanges, whi h allow enhan ing theprototype performan e.The ir uital layout may be lassi�ed in three main se tions, namely thepower supply bran h, the WSN node or ontroller, the radar signal ondition-ing stage. In parti ular, regarding the supply network and onsidering the �nal hoi e of the sensors used, namely the absen e of ultrasound and infrared sen-sors, the possibility to exploit 12Volt battery is no more needed, thus the batteryperforming 6Volt, 4.5Ah is sele ted as de�nitive power supply of the WSN sensornode. Therefore, given this omponents sele tion, a �rst hange of the ir uital94

CHAPTER 4. ENGINEERING AND PILOT SITE EXTENSIONs heme pre isely regards the feeding network and the voltage regulators used. Infa t, by using the 6Volt battery and the Arduino platform for the ontroller se -tion, a single 5Volt voltage regulator with low drop-out (i.e., di�erential voltage omputed as di�eren e of the regulated output and the minimum input volt-age needed by the omponent to properly regulate the output supply) is neededto supply internal ir uitry and radar sensors, given that the WSN devi e is apable of e� iently onvert the supply voltage to a stable 3.3Volt output forits own fun tioning. In addition, the 3.3Volt regulated output may be usedfor external supply or referen e if needed, by exploiting the proper onne tionsavailable on the WSN devi e. One major bene�t of su h hange is related tothe stability of the radar signal, dire tly at the output of the sensors, and theavoidan e/redu tion of noise introdu ed by the onditioning stages. Thereforethe overall monitoring system takes advantage of the aforesaid stability, whi hmeans a quiring a more stable and more informative signal.In addition, still regarding the supply network, a spe i� voltage regulatorhas been designed to properly manage the solar panel energy for the battery harge. Even if the lead battery harging pro ess is less rity al than the aseof lithium batteries, parti ular attention may be addressed to su h omponentin order to extend the system lifetime and to avoid possible mulfun tionings.Indeed it is ne essary to implement ontrolled harge-dis harge y les, arrangingthe regulator ir uit in order to imply voltage and urrent limits towards thebattery unit, thus avoiding possible e essive exposition to anomalous voltagesand urrents over the properly safe harging limits. Therefore, given the useof 6Volt 4.5Ah battery, the maximum allowed voltage is set to 7.5Volt withmaximum urrent �ow of 500mA, whi h is approximately the 10% of the a tualbattery apa ity. In this way, the battery may be harged during a period ofabout 8 hours, onsidering the presen e of lear solar radiation for all this time.An additional advantage of su h ir uitry is given by the in reased degree offredom in the solar panel sele tion phase, ensuring in any ase some minimal re-quirements needed for the proper work of the entire prototype, namely minimumsolar panel voltage to be higher than battery voltage and solar panel e�e tive urrent omparable and higher than the 10% of the a tual battery apa ity. Allvalues over su h onditions are �ltered by the regulator designed.Another relevant hange, introdu ed in the optimized prototype, is related tothe onditioning stage of the radar signal. In parti ular, the low pass and highpass �lters, des ribed in Se tion 3.4.1.1, are substituted by a band-pass �lter omposed by a Butterworth 2nd order low pass �lter and a Butterworth 2ndorder high pass �lter, both with gain about 9dB. This allows �ltering the radarsignal with higher pre ision and a more stable transfer fun tion, with respe tto the previous solution namely omposed by one low pass and two high pass�lters, and with an higher gain, whi h allows improving the dete tion pro edureapplied after. In addition, the a tual ut-o� frequen ies are respe tively 100Hzand 1900Hz, whi h orrespond to speed range of about 3-43Km/h.95

4.2. WSN SENSOR NODE ENGINEERINGAn additional hange regards also the ampli� ation stages useful for enhan -ing the radar signal dynami . In parti ular, the ampli�ers are now designedon-board, thus improving the pro essing quality and the noise redu tion. In theprevious version, in fa t, the ampli�er modules used were o�-the-shelf produ tsand mounted on external breakout. This hoi e was very onvenient during theprototype development, sin e tuning and setup pro edures may be applied easlyto the omponents. Nevertheless, the use of onne tors and tunable ele tri al omponents may introdu e noise and signal instability, whi h in turn appearduring the onditioning stages. Therefore, on e the desired setup is de�ned, theon-board design and implementation guarantee a larger reliability of the ampli�erstages, thus improving the system performan e.Finally, onsidering the hoi e of exploiting two radar sensors, in view ofoptimizing the available resour es a single onditioning stage is designed, thus amultiplexer is needed to allow periodi ally hange of the analysed radar signal.In addition, in order to limit power onsumption, the radar sensor is powered o�during periods of non signal pro essing. Therefore, a spe i� dual load swit hwith ontrolled turn-on is used to this end. In parti ular, two digital onne tionsof the WSN node are used to ontrol su h omponent.Fig. 4.13 shows the ir uital s hemati of the optimized solution, whi hintegrates all the hanges des ribed in this se tion.The �nal step regarding the optimization of the interfa ing board is relatedto the design of the a tual board layout, by de�ning the maximum dimensions ofthe printed ir uit and the position of ea h ir uital omponent on it. Thereforeparti ular attention have been put in this design pro ess, de�ning as maximumamount of spa e the area 210x70mm. This area is de�ned by onsidering thea tual dimensions of the road delimiters, whi h are parti ular plasti stru tureslarge about 85mm. The board layout is shown in CAD sket h in Fig. 4.14. As itmay be noti ed, the prin ipal omponents of the interfa ing board are groupedfollowing the aforementioned lassi� ation and distributed on the board thusavoiding possible interferen es among ir uital strips. The two entered holesare provided in order to install the radar sensors support, while the de enterdone in the lower se tion is dedi ated to the installation of the radio moduleantenna.Parti ular attention has been fo used on the radio module radiating elementand its positioning inside the sensor node ase, by onsidering the a tual installa-tion position of the devi es along the road. In fa t, given the verti al orientationof the devi e en losure and the gateway node position, whi h may be at higherlevel with respe t to ground, thus having better radiation to and from the sensornodes, the antenna omponent has been pla ed su h to be at the higher positionallowed by the devi e ase. The proposed solution of installing the antenna insidethe ase is mainly due to better prote tion and amou�age e�e t.96

CHAPTER 4. ENGINEERING AND PILOT SITE EXTENSION
Figure 4.13: WSN sensor node prototype optimization: ir uital s heme.The four orner holes are designed for board installation on the support ofthe ase as des ribed in the following.The optimization and engineering steps des ribed allow also the redu tionin total power onsumption, thus obtaining a mean urrent drain of 50mA on-sidering normal prototype fun tioning. Therefore, a simple power budget maybe omputed, similar to what has been done for the non optimized sensor node.Considering the 6Volt 4.5Ah battery and the mean urrent onsumption of 50mA,the prototype lifetime with the only battery as power supply is given by:Tlife = 4.5Ah/50mA ≃ 90h ≃ 4 daysIn order to allow system extended lifetime, the a tivity periods of some om-ponents may be properly managed, thus de reasing the overall onsumption. Inparti ular, radar modules are the most energy onsuming devi es together withthe radio module of the WSN node. Therefore the introdu tion of small sleepingperiods for the sensors and the use of the radio module only when spe i� allyneeded allow enha ing the prototype performan e, rea hing in reased lifetimeperiods (e.g., 8-10 days) to be evaluated in relation to the a tual period of learsolar radiation for battery harge. 97
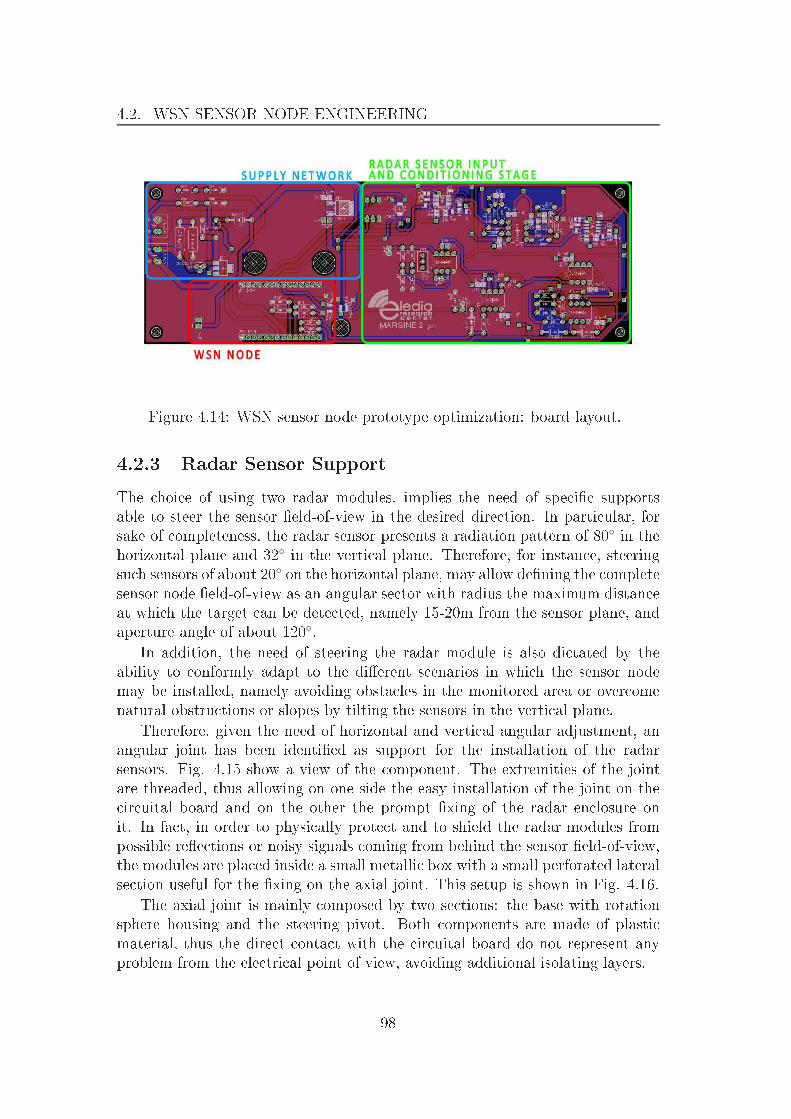
4.2. WSN SENSOR NODE ENGINEERING
Figure 4.14: WSN sensor node prototype optimization: board layout.4.2.3 Radar Sensor SupportThe hoi e of using two radar modules, implies the need of spe i� supportsable to steer the sensor �eld-of-view in the desired dire tion. In parti ular, forsake of ompleteness, the radar sensor presents a radiation pattern of 80◦ in thehorizontal plane and 32◦ in the verti al plane. Therefore, for instan e, steeringsu h sensors of about 20◦ on the horizontal plane, may allow de�ning the ompletesensor node �eld-of-view as an angular se tor with radius the maximum distan eat whi h the target an be dete ted, namely 15-20m from the sensor plane, andaperture angle of about 120◦.In addition, the need of steering the radar module is also di tated by theability to onformly adapt to the di�erent s enarios in whi h the sensor nodemay be installed, namely avoiding obsta les in the monitored area or over omenatural obstru tions or slopes by tilting the sensors in the verti al plane.Therefore, given the need of horizontal and verti al angular adjustment, anangular joint has been identi�ed as support for the installation of the radarsensors. Fig. 4.15 show a view of the omponent. The extremities of the jointare threaded, thus allowing on one side the easy installation of the joint on the ir uital board and on the other the prompt �xing of the radar en losure onit. In fa t, in order to physi ally prote t and to shield the radar modules frompossible re�e tions or noisy signals oming from behind the sensor �eld-of-view,the modules are pla ed inside a small metalli box with a small perforated lateralse tion useful for the �xing on the axial joint. This setup is shown in Fig. 4.16.The axial joint is mainly omposed by two se tions: the base with rotationsphere housing and the steering pivot. Both omponents are made of plasti material, thus the dire t onta t with the ir uital board do not represent anyproblem from the ele tri al point of view, avoiding additional isolating layers.98
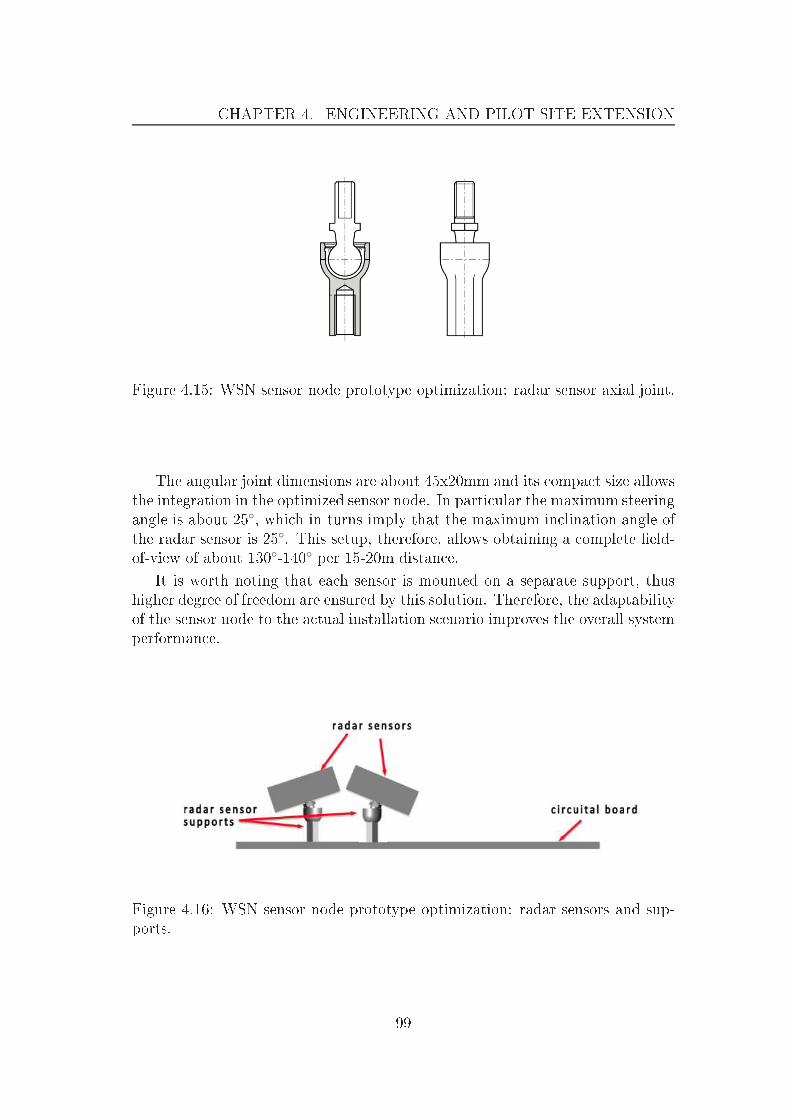
CHAPTER 4. ENGINEERING AND PILOT SITE EXTENSION
Figure 4.15: WSN sensor node prototype optimization: radar sensor axial joint.The angular joint dimensions are about 45x20mm and its ompa t size allowsthe integration in the optimized sensor node. In parti ular the maximum steeringangle is about 25◦, whi h in turns imply that the maximum in lination angle ofthe radar sensor is 25◦. This setup, therefore, allows obtaining a omplete �eld-of-view of about 130◦-140◦ per 15-20m distan e.It is worth noting that ea h sensor is mounted on a separate support, thushigher degree of freedom are ensured by this solution. Therefore, the adaptabilityof the sensor node to the a tual installation s enario improves the overall systemperforman e.
Figure 4.16: WSN sensor node prototype optimization: radar sensors and sup-ports.99

4.2. WSN SENSOR NODE ENGINEERING4.2.4 Optimal Case De�nitionSeveral analysis have been ondu ted in order to de�ne the optimal ase forthe WSN sensor node in its engineered and optimized version. In parti ular,the de�nition of the a tual total dimensions to properly �t ea h omponent hasbeen investigated, with parti ular attention to battery positioning mainly forse urity reasons. Additional investigated parameters are waterproof, me hani- al robustness, easy integration on road delimiters. The maximum size of thepa kaging is de�ned in relation to the dimensions of road delimiters, whi h areabout 100x100x1300mm, width, depth and height respe tively. In addition, di-mensions have to be arefully taken into a ount in order to allow the installationof solar panels for battery harge task. To this end, ad-ho solar ells have beenrealized on the basis of ele tri al hara teristi s needed for the a tual batterymaintenan e and the a tual size of the ase under de�nition.Nevertheless, given the absen e of low- ost solutions available o�-the-shelf,able to satisfy all the imposed requirements, in parti ular onsidering redu edsize and easy integration of the WSN sensor node omponents, an ad-ho ase hasbeen designed and realized. The �rst version of su h ase is shown in Fig. 4.17,with maximum dimensions 90x90x300mm. The ase is omposed by metha ry-late material properly modeled and soldered to guarantee waterproof feature,given also the unique aperture in the lower side losed by a joint s rewed in ap.This design allows furthermore a separated a ess to the two main ompo-nents of the sensor node, namely the battery and the interfa ing board on whi hsensors, ontroller and ir uitry are installed. The battery unit is installed onthe lower ap and in this way it is the �rst omponent to whi h the operator mayhave a ess to. Only by properly unlo king the interfa ing board, this an beextra ted from the ase for maintenan e a tivities. The key idea is that no par-ti ular interventions should be performed regarding the ele troni board or the ontroller and sensors. Considering the normal devi e a tivity, the main mainte-nan e should be related to battery repla ement on e its life- y le is terminated.Therefore even non expert operators may perform the substitution having a essto the only needed WSN sensor node se tion.The �xing method to road delimiters is based on four main holes for metalrivets or s rews simmetri ally pla ed in the top and bottom areas of the aseba k side, as shown in Fig. 4.17(b). Additional slots are present in order toallow di�erent �xing by using metalli or plasti strips.The ase inside is ompletely free and a simple sliding pro�le is used toproperly position the ele tri al board of the sensor node. In parti ular, the four orner holes present on the ele tri al board are used to �x it on the sliding pro�lewith plasti s rews and thus by only moving this omponent, all the ir uitryof the sensor node may be extra ted or inserted in the orre t position. Inaddition, small plasti guides are present in order to drive the movement of the100

CHAPTER 4. ENGINEERING AND PILOT SITE EXTENSION
(a) (b)Figure 4.17: Optimal ase de�nition: (a) front view and dimensions, (b) ba kview and �xing holes.sliding pro�le inside the ase. A lo k is wedged in between the ase ba k andthe sliding pro�le thus avoiding the last to move when the lower ap of the aseis open. Fig. 4.18(a) shows the ir uital board installed on the sliding pro�le,while Fig. 4.18(b) is a snapshot of the installed sliding pro�le with a view of thelo k and the guides for pro�le insertion.An additional optimization regards the battery installation support, whi his atta hed to the ase ap. In parti ular, as it may be shown in Fig. 4.18(a),the battery unit may be laid on the verti al support, whi h allows �xing thebattery with plasti strip or alternative solution, thus avoiding any possible on-ta t between the battery and the internal ir uitry espe ially during opening and losing ase pro edures.4.2.5 Integration TestingOn the basis of the optimization hanges dis ussed in previous se tions, an anal-ysis of the a tual prototype working is performed. In parti ular, regarding thepower supply network and power onsumption, the use of spe i� equipment tomonitor the e�e tive power onsumption allowed determining that the engineeredboard a tually requires 7-8mA urrent against the estimated 10mA. Similar re-101
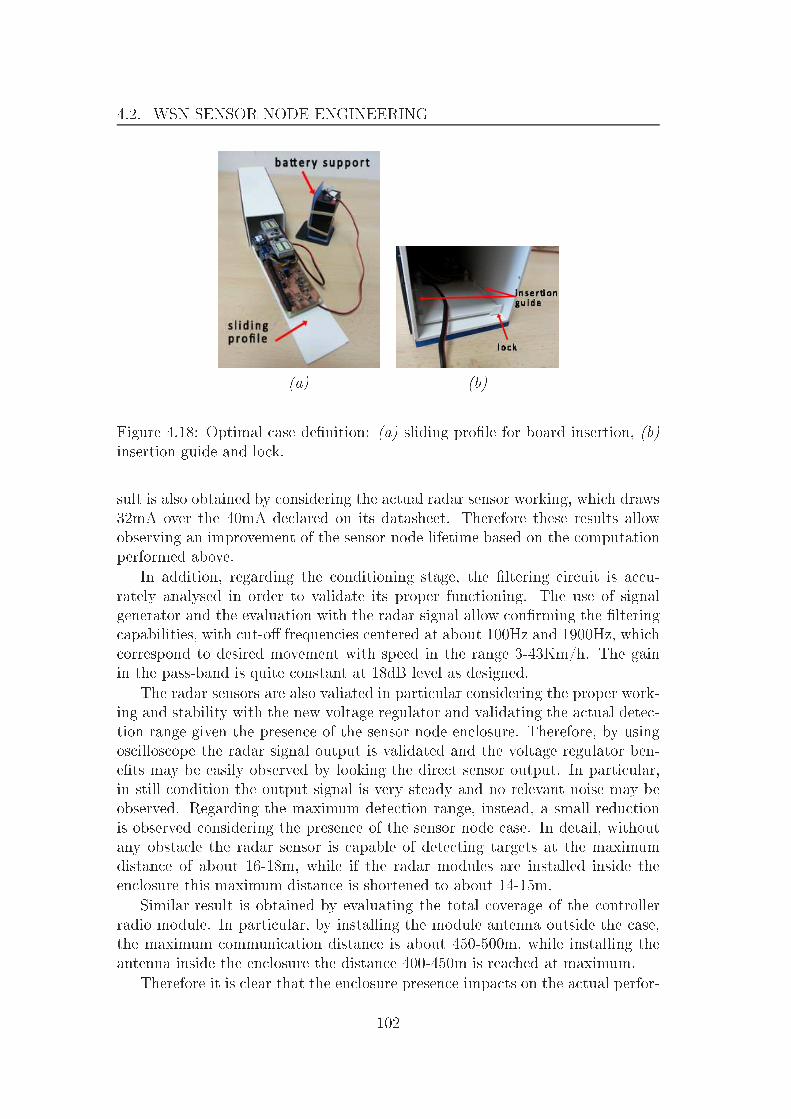
4.2. WSN SENSOR NODE ENGINEERING
(a) (b)Figure 4.18: Optimal ase de�nition: (a) sliding pro�le for board insertion, (b)insertion guide and lo k.sult is also obtained by onsidering the a tual radar sensor working, whi h draws32mA over the 40mA de lared on its datasheet. Therefore these results allowobserving an improvement of the sensor node lifetime based on the omputationperformed above.In addition, regarding the onditioning stage, the �ltering ir uit is a u-rately analysed in order to validate its proper fun tioning. The use of signalgenerator and the evaluation with the radar signal allow on�rming the �ltering apabilities, with ut-o� frequen ies entered at about 100Hz and 1900Hz, whi h orrespond to desired movement with speed in the range 3-43Km/h. The gainin the pass-band is quite onstant at 18dB level as designed.The radar sensors are also valiated in parti ular onsidering the proper work-ing and stability with the new voltage regulator and validating the a tual dete -tion range given the presen e of the sensor node en losure. Therefore, by usingos illos ope the radar signal output is validated and the voltage regulator ben-e�ts may be easily observed by looking the dire t sensor output. In parti ular,in still ondition the output signal is very steady and no relevant noise may beobserved. Regarding the maximum dete tion range, instead, a small redu tionis observed onsidering the presen e of the sensor node ase. In detail, withoutany obsta le the radar sensor is apable of dete ting targets at the maximumdistan e of about 16-18m, while if the radar modules are installed inside theen losure this maximum distan e is shortened to about 14-15m.Similar result is obtained by evaluating the total overage of the ontrollerradio module. In parti ular, by installing the module antenna outside the ase,the maximum ommuni ation distan e is about 450-500m, while installing theantenna inside the en losure the distan e 400-450m is rea hed at maximum.Therefore it is lear that the en losure presen e impa ts on the a tual perfor-102
CHAPTER 4. ENGINEERING AND PILOT SITE EXTENSIONman e of the sensor node, but it is worth noting that the degradations indu edare not relevant to the aim and a tual working of the monitoring system.4.2.6 Controller Firmware4.2.6.1 Sensor Node FirmwareThe general fun tioning of the sensor node is, as already said, managed bythe ontroller unit represented by the Arduino FIO platform. Therefore proper�rmware has to be developed in order to allow the orre t working of ea h single omponent thus in turn a hieving the monitoring system obje tive.Simpler version of the ontroller �rmware have been written for the testingpro edures, but in su h ases parti ular attention may be given to spe i� partof the sensor node (e.g., radar sensor, ampli�er stages, power management, et .),thus the omplete management of the devi e was not addressed. Therefore, ustom management �rmware has been developed, able to properly dire t allthe sensor node omponents together with a proper network management logi ,given the large number of devi es, whi h should be part of the network.Therefore, parti ular attention is given to the ontrol of the radar sensor,as well as the onditioning stage and the ampli�ers used. Indeed, the propermanagement of these and all the other sensor node omponents allow the devel-opment of he k and update pro edures for the state information of the sensornode, whi h are very useful in order to monitor the a tual working of ea h singledevi e in the network. These information may be periodi ally sent to the ontrolunit for data analysis and statisti s. In addition, an optimal management of theavailable resour es, namely both omponents, sensors and energy sour es, allowsimproving the devi e lifetime and thus the overall system lifetime.In ode development, the use of parametri variables simpli�es the �rmwarestru ture in relation to the spe i� installation, allowing in turn hanging or orre ting some parameters in an easy way, for instan e oherently with thea tual fun tioning of the other devi es in the network.Fig. 4.19 shows the �ux diagram of the �rmware developed for the sensornodes. As it an be seen, the prin ipal state is the idle one, whi h the ontroller y li ally exe utes and after whi h several �rmware states may follow in relationto some state he ks perfomed. In detail, the ontroller starts for the �rst timeby sending to the gateway node a periodi info pa ket, in whi h some stateinformation are written together with its identi� ation ode and its epo h time.On e this message has been sent, the ontroller enters in the syn state, in whi hattending the gateway node to send the orre t epo h time for syn hronizationpurposes. This operation may be exe uted within a parametrized period of time,after whi h the sensor node ontinues its operations even if the syn hronizationstep do not su essful. In the �rmware �ux the next operation regards the state he k, spe i� ally aimed at verifying tha a tual battery voltage to determine ifthe sensor node may operate or not. If it is the ase, then the node a tually103
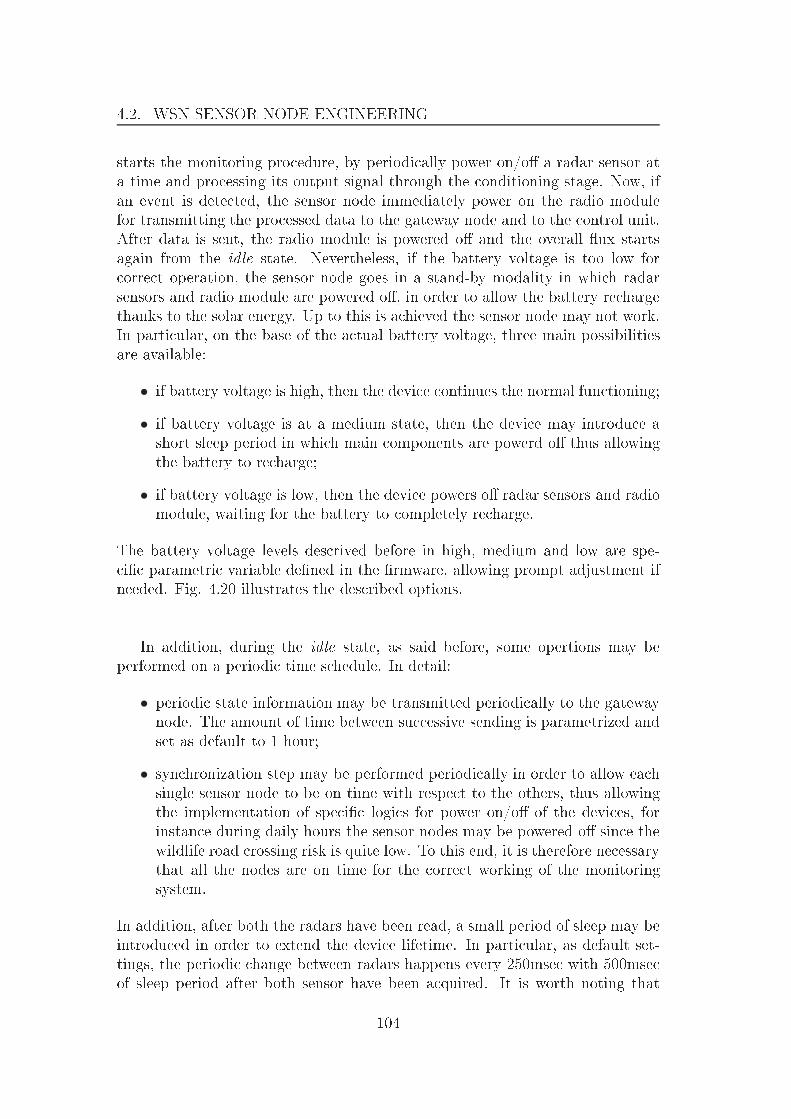
4.2. WSN SENSOR NODE ENGINEERINGstarts the monitoring pro edure, by periodi ally power on/o� a radar sensor ata time and pro essing its output signal through the onditioning stage. Now, ifan event is dete ted, the sensor node immediately power on the radio modulefor transmitting the pro essed data to the gateway node and to the ontrol unit.After data is sent, the radio module is powered o� and the overall �ux startsagain from the idle state. Nevertheless, if the battery voltage is too low for orre t operation, the sensor node goes in a stand-by modality in whi h radarsensors and radio module are powered o�, in order to allow the battery re hargethanks to the solar energy. Up to this is a hieved the sensor node may not work.In parti ular, on the base of the a tual battery voltage, three main possibilitiesare available:• if battery voltage is high, then the devi e ontinues the normal fun tioning;• if battery voltage is at a medium state, then the devi e may introdu e ashort sleep period in whi h main omponents are powerd o� thus allowingthe battery to re harge;• if battery voltage is low, then the devi e powers o� radar sensors and radiomodule, waiting for the battery to ompletely re harge.The battery voltage levels des rived before in high, medium and low are spe- i� parametri variable de�ned in the �rmware, allowing prompt adjustment ifneeded. Fig. 4.20 illustrates the des ribed options.In addition, during the idle state, as said before, some opertions may beperformed on a periodi time s hedule. In detail:• periodi state information may be transmitted periodi ally to the gatewaynode. The amount of time between su essive sending is parametrized andset as default to 1 hour;• syn hronization step may be performed periodi ally in order to allow ea hsingle sensor node to be on time with respe t to the others, thus allowingthe implementation of spe i� logi s for power on/o� of the devi es, forinstan e during daily hours the sensor nodes may be powered o� sin e thewildlife road rossing risk is quite low. To this end, it is therefore ne essarythat all the nodes are on time for the orre t working of the monitoringsystem.In addition, after both the radars have been read, a small period of sleep may beintrodu ed in order to extend the devi e lifetime. In parti ular, as default set-tings, the periodi hange between radars happens every 250mse with 500mse of sleep period after both sensor have been a quired. It is worth noting that104

CHAPTER 4. ENGINEERING AND PILOT SITE EXTENSION
Figure 4.19: Controller �rmware �ux diagram.the sleep period is exe uted only if no events have been dete ted by the radarmodules, otherwise the �rmware is programmed in order to keep the a quisitionon the radar, whi h is dete ting the event for total 500mse , after whi h thereading is turned on the other radar module in order to have a omplete viewof the monitored s enario. Therefore, in su h ondition, the radars are neverpowered o� and no sleeping periods are introdu ed. Only when no radars dete tan event in their respe tive �el-of-view, then the normal fun tioning is restored.4.2.6.2 Gateway Node FirmwareThe gateway node requires the development of dedi ated �rmware able to inter atwith the operations ongoing on the sensor nodes. Therefore, two main a tivitiesare exe uted:• data re eption over the wireless link and forward towards the ontrol unit;• epo h time onversion from ontrol unit time, whi h has to be sent to sensornodes when required.To this end, two serial ommuni ation are implemented, ea h dedi ated to oneof the tasks above-mentioned. In parti ular, regarding data re eption oming105

4.2. WSN SENSOR NODE ENGINEERING
Figure 4.20: Controller �rmware �ux diagram: battery voltage he k and adap-tive sensor node a tivity regulation.from sensor nodes, the serial ommuni ation used is the standard one availableon Arduino platforms, whi h is easily redire ted to the serial ommuni ationtowards the ontrol unit in harge of storing data.Considering instead the se ond task, namely epo h time onversion for syn- hronization among WSN nodes, a spe i� serial ommuni ation has been imple-mented, by using digital onne tions of the Arduino platform, thus generatingthe so alled software-serial ommuni ation. This allows having two distin t se-rial ommuni ations towards and from the gateway node, thus separating spe i� tasks whi h may be performed asyn hronously.Therefore, the gateway node �rmare is mainly omposed by a single loopin whi h both serial ommuni ations are ontinuously analyzed waiting for re-spe tive data. In fa t, the syn hronization is periodi ally given by the ontrolunit, whi h sends its time to the gateway node. When this happens, the gatewaynode onverts the time in epo h format and this value is sent to the asking sensornodes when needed.4.2.6.3 Validation TestExperimental validation in ontrolled environmet has been performed in orderto a tually verify the proper working of the �rmware des ribed in the previousse tion. In parti ular, some sensor nodes have been used for the tests, ea hlo ated at di�erent distan es from the gateway node. This setup, in addition,has allowed the validation of the transmission quality of the radio pa kets amongnodes, by observing the pa ket loss index.In parti ular, the proper working of the �rmware has been validated on all106

CHAPTER 4. ENGINEERING AND PILOT SITE EXTENSIONthe sensor nodes used, parti ularly onsidering the battery managements logi sdes ribed above. In addition, regarding the wireless ommuni ation quality, inthe worst ase the amount of pa ket loss has been registered at about 10% ofthe total transmissions, with 1% pa ket loss onsidering periodi informationpa kets.4.2.7 Event Dete tion MethodologiesThe development of event dete tion methodologies for Doppler radar systemsmay require omplex omputational load, also in relation to the a tual signal tobe pro essed, namely raw or pre-pro essed data.Therefore, two main ategories for data analysis and event dete tion may bede�ned:• software based methodologies applied to the sensors signal output;• hardware based methodologies in harge of pre-pro essing the sensors signaloutput for su essive analysis.The main distin tion between these two ategories may be fo used on the a -tual omputational apa ity the mi ro ontroller in harge of it have and on thehardware omplexity needed to pro ess the raw signal.Considering the �rst ase, spe if methodologies have been largely investi-gated in literature. For instan e [88, 89, 90, 91℄ exploit several methodologiesfor the analysis of radar signal, without any �ltering or de-noising pro ess. Inthis ontext, two methodologies are mainly used based on frequen y transformmethods, by using the Time Dis rete Fourier Transform, or on auto- orrelationmethods.Both these analysis may allow a hieving a urate results in terms of resolu-tion of the pro essed data, nevertheless the omputational burden required maybe arefully evaluated in relation to the a tual performan e of the ontrollerplatform available. One of the main advantages of su h software methodologiesis related to the huge number of information available after the pro essing, su has speed, movement dire tion, et .Considering, instead, hardware based methodologies, the pre-pro essing pro- edures may appear very omplex and expensive in terms of ir uital omponents,but they may allow lightening the software/�rmware omplexity and in turn the omputational burden required by software methodologies. This may also beexpressed as a onsiderable energy saving, fundamental aspe t for low-energydevi es, thus extending the devi e lifetime.Therefore, the engineering development of the sensor node exploits both thesemethodologies, namely hardware and software, in order to take advantage of bothof them. In parti ular, as already des ribed, the pre-pro essing of the radar sig-nal is performed thanks to the hardware onditioning stage implemented on the107

4.2. WSN SENSOR NODE ENGINEERING ir uital board of the sensor node, thus allowing redu ed omplexity in �rmwaredevelopment and node management. As already des ribed in the previous se -tions, the use of �ltering and ampli� ation stages allow improving the radarsignal quality, limiting noisy omponents and emphasizing the signal ompo-nents related to o urred events, whi h have been dete ted by the radar sensors.For instan e, the event speed �lter in the range 3-43Km/h may simplify su es-sive analysis sin e this parameter has already been dete ted, thus on entratingto other infromative paramenters. The su essive stages of the pro essing allowre tifying the analysed signal, thus evaluating the event entity dire tly from theenergy ontent of the pro essed signal. After this step, an additional se tionsimpli�es the dete tion apability of the ontroller platform, sin e the RC ir uitdesigned allows a sort of delay in the signal dynami , thus the ontroller ansample this signal even at lower frequen y.Fig. 4.21 shows an example of radar signal a quired by the ontroller platformand pro essed with the hardware pre-pro essing methodology. In parti ular, thesignal represented in the plot is related to a real event o urred in the sensor�eld-of-view, lasting about 1se with the target approa hing and leaving thes enario at the minimum distan e of about 6m.
Figure 4.21: Movement event: radar signal output of the hardware pre-pro essingmethodology.Therefore, the dete tion may be allowed with simple threshold me hanisms,thus dete ting the time instants in whi h the pro essed signal goes beyond theset threshold value or stays in a spe i� range validated experimentally, or more omplex pro edures. In addition, the experimental validation has allowed ana urate alibration of the pro essing and dete tion methodology, allowing goodperforman e adequate to the monitoring system obje tive.108

CHAPTER 4. ENGINEERING AND PILOT SITE EXTENSIONThis pre-pro essed signal an be used to start the dete tion of raw radarsignal, a quired and pro essed only in relation to event dete tion, from whi hadditional information regarding the o urred event may be retrieved. Thus,the proposed methodology allows ombining a �rst dete tion phase, very easyfrom the software point of view, and in turn with low omputational burden,with a se ond dete tion phase, more omplex and aimed at extra ting additionalinformation from the raw radar signal, thus improving the knowledge of the evento urred in the sensor node �eld-of-view and the related risk level for in omingdrivers. It is worth noting that the se ond dete tion phase is a tivated only if the�rst one has dete ted an event, otherwise no additional pro essing is performed.
109

4.3. EXPERIMENTAL VALIDATION4.3 Experimental ValidationGiven the previous integration and validation tests, mainly devoted at evaluatingthe proper working of the main omponents introdu ed with the optimizationand engineering pro esses on one side and the �rmware orre tness on the other,an additional testing ampaign has been performed, in order to validate theoverall system in real ontrolled s enario, by investigating parameters su h asradio overage, system robustness in event dete tion, and warning apability.Therefore, a real s enario resembling pilot test features is identi�ed to performthe experimental validation. In parti ular an empty area su� iently wide toallow the maximum radar sensor overage (i.e., at least 15m) is dis overed, thusallowing movement generation inside and outside the sensor nodes �eld-of-view.The sensor nodes used during this pro ess have been installed on spe i� tripod supports, allowing their deployment in onditions as similar as possibleto the a tual �nal installation on road sides. In parti ular �ve nodes have beenused. Fig. 4.22 shows a pi ture of the installed sensor nodes, pla ed at the heightof about 1m, whi h is the installation position the sensor will have on the roaddelimiters.
(a) (b)Figure 4.22: Experimental testing: (a) sensor node installation support, (b)sensor node installation height.In addition, the sensor nodes used during these tests have been deployed atabout 20m from ea h other (Fig. 4.23), similarly to the road delimiters positionalong the stret hes of road.110

CHAPTER 4. ENGINEERING AND PILOT SITE EXTENSION
Figure 4.23: Experimental testing sensor node installation distan e.The performed tests in the identi�ed s enario, with the setup des ribed above,are mainly hara terized by movements and events in the sensor nodes �eld-of-view. In detail the movement typologies may be resumed as follows:• lateral movement to the sensors plane;• orthogonal movement to the sensor plane (i.e., approa hing or leavingmovements);• ir ular movement in the sensor �eld-of-view.In addition to su h events, movements in between near sensor nodes have beenperformed in order to validate the absen e of shadow zones in whi h events maynot be dete ted by the monitoring system.The sensor nodes used for the tests are equipped with the �rmware des ribedin se tion 4.2.6. Therefore, as des ribed, when a sensor node is powered on a spe- i� pro edure is a tivated before the devi e starts its normal fun tioning. Theuse of several sensor nodes during the experimental tests have allowed verifyingthe orre t working of the ontroller �rmware and Fig. 4.24 shows an example ofradio pa ket messages re eived by the gateway node at the powering on of nodes1 and 2. In parti ular, as it may be seen, the sensor nodes send the syn hro-nization request to whi h the gateway node reply with its epo h time. Then thesensor node replies again with some fun tional parameters and its new workingtime, whi h orresponds with the gateway node time. The su essive messagesare related to movements of the operator, whi h is working of the spe i� devi e.111

4.3. EXPERIMENTAL VALIDATION
Figure 4.24: Experimental testing: data log �le.Fig. 4.25 shows an example of the performed lateral movements in front ofthe installed sensor nodes. The target moves along the red tra e drawn, whi h isabout 12-15m from the sensors. Additional tests have been performed by varyingthe gateway node position, thus allowing the validation of the maximum radio overage.The large majority of the performed tests have been orre tly dete ted by thesensor nodes and the respe tive alarm signals have been re eived by the gate-way node. Also onsidering lateral movements in the sensor nodes �eld-of-view,the orre t sequen e of alarms generated by the sensor nodes has always beenevaluated in the orre t order as the motion has been performed. In addition,the possibility to steer the radar sensor has allowed avoiding shadow regions inwhi h events may not be dete ted. Thus the events repetition on statisti al basehas allowed determining the system performan e in a real ontrolled s enario,whi h may be resumed as follows:• sensor node distan e: 18-20m• maximum dete tion distan e from sensors: 15m• maximum radio overage: 400-450m
112

CHAPTER 4. ENGINEERING AND PILOT SITE EXTENSION
Figure 4.25: Experimental testing: lateral movement in sensor nodes �eld-of-view.
113
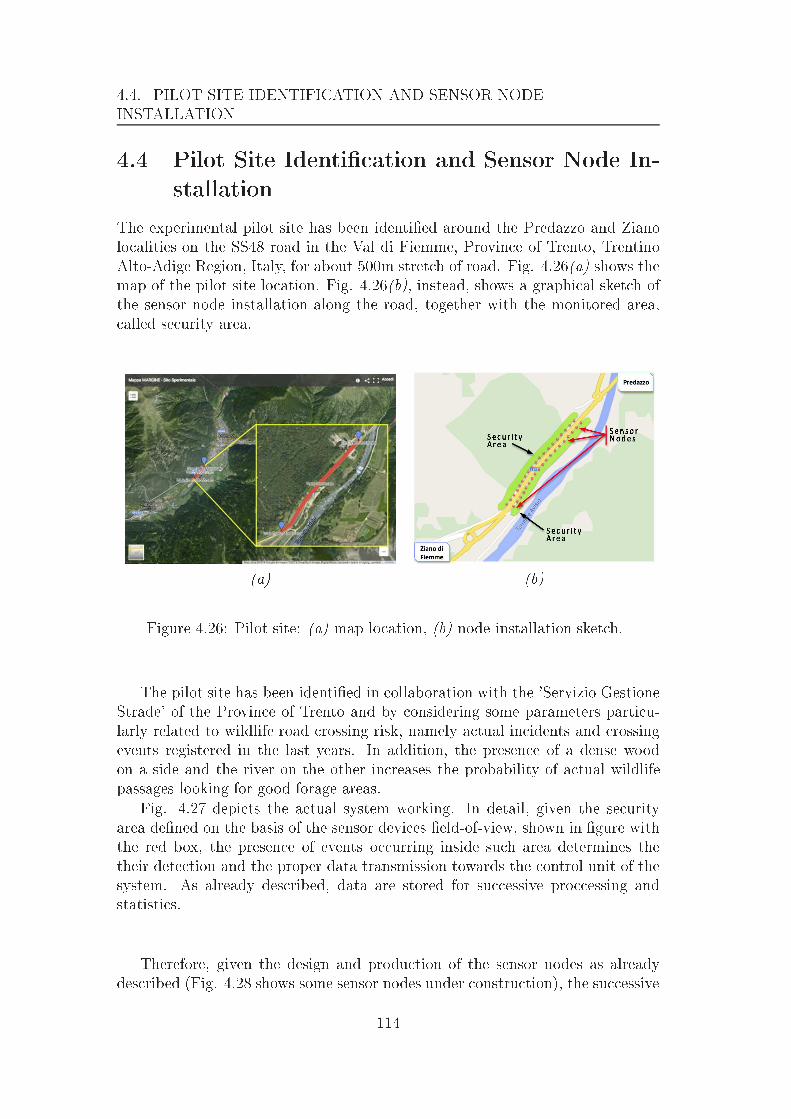
4.4. PILOT SITE IDENTIFICATION AND SENSOR NODEINSTALLATION4.4 Pilot Site Identi� ation and Sensor Node In-stallationThe experimental pilot site has been identi�ed around the Predazzo and Zianolo alities on the SS48 road in the Val di Fiemme, Provin e of Trento, TrentinoAlto-Adige Region, Italy, for about 500m stret h of road. Fig. 4.26(a) shows themap of the pilot site lo ation. Fig. 4.26(b), instead, shows a graphi al sket h ofthe sensor node installation along the road, together with the monitored area, alled se urity area.
(a) (b)Figure 4.26: Pilot site: (a) map lo ation, (b) node installation sket h.The pilot site has been identi�ed in ollaboration with the 'Servizio GestioneStrade' of the Provin e of Trento and by onsidering some parameters parti u-larly related to wildlife road rossing risk, namely a tual in idents and rossingevents registered in the last years. In addition, the presen e of a dense woodon a side and the river on the other in reases the probability of a tual wildlifepassages looking for good forage areas.Fig. 4.27 depi ts the a tual system working. In detail, given the se urityarea de�ned on the basis of the sensor devi es �eld-of-view, shown in �gure withthe red box, the presen e of events o urring inside su h area determines thetheir dete tion and the proper data transmission towards the ontrol unit of thesystem. As already des ribed, data are stored for su essive pro essing andstatisti s.Therefore, given the design and produ tion of the sensor nodes as alreadydes ribed (Fig. 4.28 shows some sensor nodes under onstru tion), the su essive114

CHAPTER 4. ENGINEERING AND PILOT SITE EXTENSION
Figure 4.27: Wildlife road rossing monitoring system: risk de�nition s heme.step has regarded the devi es installation along the identi�ed road. Thanks tothe ollaboration of the 'Servizio Gestione Strade' of the Provin e of Trento,the road delimiters have been a urately positioned at the re ipro al distan eof 20m from ea h other throughout all the test site. This has allowed deployingthe sensing devi es with regular displa ement between single pairs, thus avoidingshadowing areas in the se urity zone depi ted by the sensors �eld-of-view.
Figure 4.28: Sensor nodes under onstru tion.115
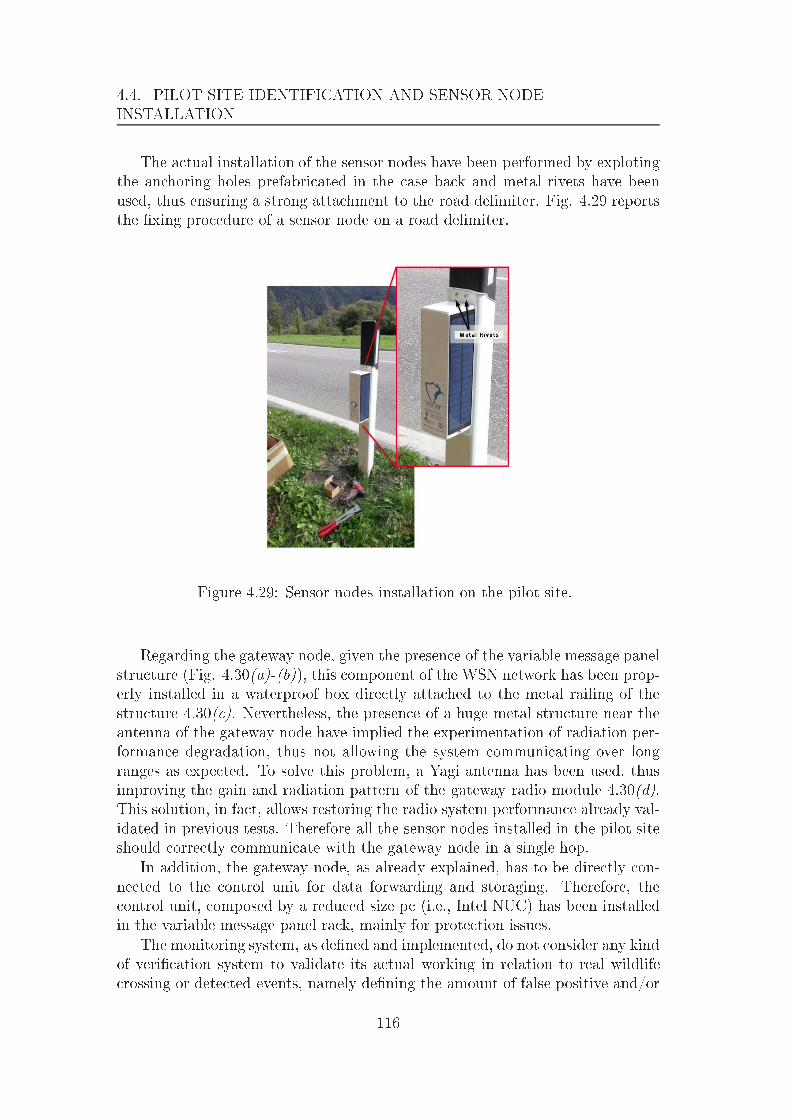
4.4. PILOT SITE IDENTIFICATION AND SENSOR NODEINSTALLATIONThe a tual installation of the sensor nodes have been performed by explotingthe an horing holes prefabri ated in the ase ba k and metal rivets have beenused, thus ensuring a strong atta hment to the road delimiter. Fig. 4.29 reportsthe �xing pro edure of a sensor node on a road delimiter.
Figure 4.29: Sensor nodes installation on the pilot site.Regarding the gateway node, given the presen e of the variable message panelstru ture (Fig. 4.30(a)-(b)), this omponent of the WSN network has been prop-erly installed in a waterproof box dire tly atta hed to the metal railing of thestru ture 4.30( ). Nevertheless, the presen e of a huge metal stru ture near theantenna of the gateway node have implied the experimentation of radiation per-forman e degradation, thus not allowing the system ommuni ating over longranges as expe ted. To solve this problem, a Yagi antenna has been used, thusimproving the gain and radiation pattern of the gateway radio module 4.30(d).This solution, in fa t, allows restoring the radio system performan e already val-idated in previous tests. Therefore all the sensor nodes installed in the pilot siteshould orre tly ommuni ate with the gateway node in a single hop.In addition, the gateway node, as already explained, has to be dire tly on-ne ted to the ontrol unit for data forwarding and storaging. Therefore, the ontrol unit, omposed by a redu ed size p (i.e., Intel NUC) has been installedin the variable message panel ra k, mainly for prote tion issues.The monitoring system, as de�ned and implemented, do not onsider any kindof veri� ation system to validate its a tual working in relation to real wildlife rossing or dete ted events, namely de�ning the amount of false positive and/or116

CHAPTER 4. ENGINEERING AND PILOT SITE EXTENSIONfalse negative dete tions. To this end, a digital video re order system with in-frared amera has been installed on the pilot site, thus a quiring the so alledground truth of the monitored s enario h24 and allowing the omparison amongregistered data (4.30(b)).
117

4.4. PILOT SITE IDENTIFICATION AND SENSOR NODEINSTALLATION
(a) (b)
( ) (d)Figure 4.30: Pilot site: (a) variable message panel and position of some sensornodes signed by red marker, (b) variable message panel and position of gatewaynode signed by yellow marker, ( ) gateway node installation, (d) gateway nodeYagi antenna and veri� ation system. 118

CHAPTER 4. ENGINEERING AND PILOT SITE EXTENSION4.4.1 Experimental TestingSeveral tests have been performed by exploiting the deployed sensor nodes, inorder to validate the proper working of the monitoring system in the real in-stallation s enario, by performing di�erent movements, whi h may resemble thea tual events determined by wildlife road rossing. In addition, repeated mo-tion typologies have been implemented, thus evaluating the monitoring systemworking on a statisti al base.Fig. 4.31 shows the movements typologies performed in front of the sensornodes. In detail, the sket h shows the position of some sensor nodes, displayedwith the yellow ir le along the road, the single devi e �eld-of-view, drawn as theangular se tor in orange, and the total se urity area determined by the dete tionrange of all the nodes deployed in the test site. Su h area, is de�ned as thezone in whi h events may be dete ted by the monitoring system, su h that everytarget approa hing the road from any of the two road sides is promptly dete tedby the relative sensor node installed in the proximity of the o urring event.
(a) (b)Figure 4.31: Pilot site experimental testing: (a) approa hing, leaving and lateralmovements, (b) road rossing movements.In parti ular, Fig. 4.31(a) reports the approa hing, leaving or lateral move-ments ategory, while Fig. 4.31(b) reports the road rossing events one. Su htests has allowed validating the proper working of the monitoring system installedon the pilot site, with parti ular attention to some parameter su h as a tual se u-rity area size, proper work of the devi es and event dete tion apability a ordingto the tested events typologies. 119
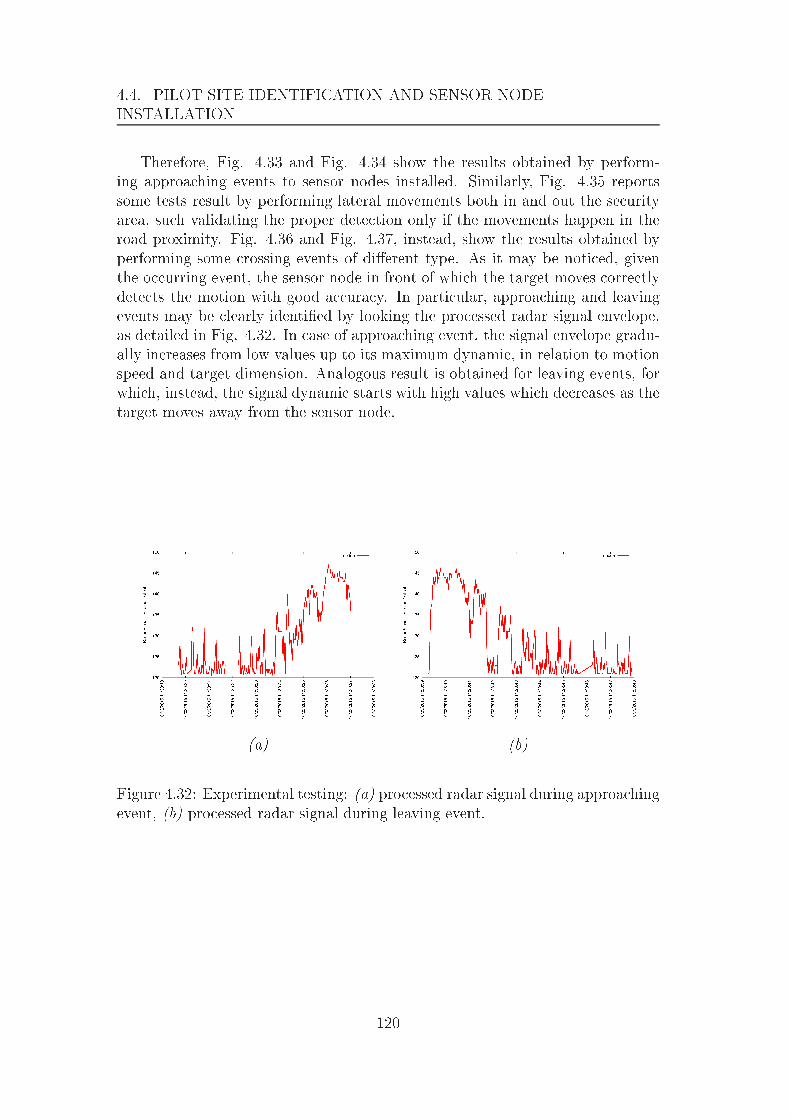
4.4. PILOT SITE IDENTIFICATION AND SENSOR NODEINSTALLATIONTherefore, Fig. 4.33 and Fig. 4.34 show the results obtained by perform-ing approa hing events to sensor nodes installed. Similarly, Fig. 4.35 reportssome tests result by performing lateral movements both in and out the se urityarea, su h validating the proper dete tion only if the movements happen in theroad proximity. Fig. 4.36 and Fig. 4.37, instead, show the results obtained byperforming some rossing events of di�erent type. As it may be noti ed, giventhe o urring event, the sensor node in front of whi h the target moves orre tlydete ts the motion with good a ura y. In parti ular, approa hing and leavingevents may be learly identi�ed by looking the pro essed radar signal envelope,as detailed in Fig. 4.32. In ase of approa hing event, the signal envelope gradu-ally in reases from low values up to its maximum dynami , in relation to motionspeed and target dimension. Analogous result is obtained for leaving events, forwhi h, instead, the signal dynami starts with high values whi h de reases as thetarget moves away from the sensor node.
(a) (b)Figure 4.32: Experimental testing: (a) pro essed radar signal during approa hingevent, (b) pro essed radar signal during leaving event.
120

CHAPTER 4. ENGINEERING AND PILOT SITE EXTENSION
(a) (b)( ) (d)(e) (f)(g) (h)Figure 4.33: Pilot site experimental movement tests: (a)-(b) orthogonal to node#5 and pro essed radar signal, ( )-(d) orthogonal to node #6 and pro essedradar signal, (e)-(f) lateral to node #5 and pro essed radar signal, (g)-(h) lateralto node #6 and pro essed radar signal.121

4.4. PILOT SITE IDENTIFICATION AND SENSOR NODEINSTALLATION
(a) (b)( ) (d)(e) (f)Figure 4.34: Pilot site experimental movement tests: (a)-(b) lateral to node #6and pro essed radar signal, ( )-(d) lateral to nodes #5 and #6 and pro essedradar signal, (e)-(f) lateral approa h to nodes #6 and #5 and pro essed radarsignal.
122

CHAPTER 4. ENGINEERING AND PILOT SITE EXTENSION
(a) (b)( ) (d)Figure 4.35: Pilot site experimental tests: (a) target moving out of the se urityarea, (b) pro essed radar signal when target moving out of the se urity area, ( )target moving inside the se urity area, (d) pro essed radar signal when targetmoving inside the se urity area.
123

4.4. PILOT SITE IDENTIFICATION AND SENSOR NODEINSTALLATION
(a) (b)( ) (d)(e) (f)(g) (h)Figure 4.36: Pilot site experimental tests: (a)-(b) road rossing near nodes #5and #1 and pro essed radar signal, ( )-(d) road rossing near nodes #6 and#2 and pro essed radar signal, (e)-(f) road rossing near nodes #5 and #2and pro essed radar signal, (g)-(h) road rossing near nodes #6 and #3 andpro essed radar signal. 124

CHAPTER 4. ENGINEERING AND PILOT SITE EXTENSION
(a) (b)( ) (d)(e) (f)Figure 4.37: Pilot site experimental tests: (a)-(b) road rossing near nodes #7and #2 and pro essed radar signal, ( )-(d) road rossing near nodes #5 and#3 and pro essed radar signal, (e)-(f) road rossing near nodes #7 and #1 andpro essed radar signal.
125
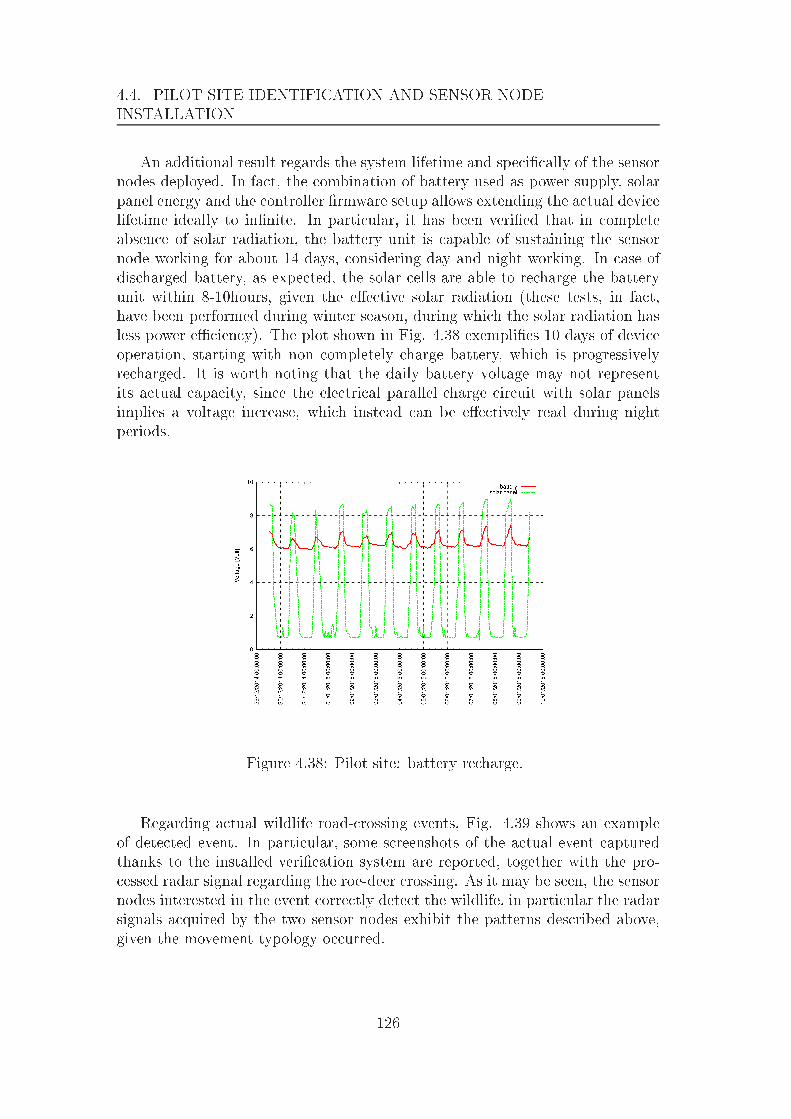
4.4. PILOT SITE IDENTIFICATION AND SENSOR NODEINSTALLATIONAn additional result regards the system lifetime and spe i� ally of the sensornodes deployed. In fa t, the ombination of battery used as power supply, solarpanel energy and the ontroller �rmware setup allows extending the a tual devi elifetime ideally to in�nite. In parti ular, it has been veri�ed that in ompleteabsen e of solar radiation, the battery unit is apable of sustaining the sensornode working for about 14 days, onsidering day and night working. In ase ofdis harged battery, as expe ted, the solar ells are able to re harge the batteryunit within 8-10hours, given the e�e tive solar radiation (these tests, in fa t,have been performed during winter season, during whi h the solar radiation hasless power e� ien y). The plot shown in Fig. 4.38 exempli�es 10 days of devi eoperation, starting with non ompletely harge battery, whi h is progressivelyre harged. It is worth noting that the daily battery voltage may not representits a tual apa ity, sin e the ele tri al parallel harge ir uit with solar panelsimplies a voltage in rease, whi h instead an be e�e tively read during nightperiods.
Figure 4.38: Pilot site: battery re harge.Regarding a tual wildlife road- rossing events, Fig. 4.39 shows an exampleof dete ted event. In parti ular, some s reenshots of the a tual event apturedthanks to the installed veri� ation system are reported, together with the pro- essed radar signal regarding the roe-deer rossing. As it may be seen, the sensornodes interested in the event orre tly dete t the wildlife, in parti ular the radarsignals a quired by the two sensor nodes exhibit the patterns des ribed above,given the movement typology o urred.126

CHAPTER 4. ENGINEERING AND PILOT SITE EXTENSION
(a) (b)( ) (d)Figure 4.39: Pilot site: (a)-(b)-( ) roe-deer road orssing event, su essive timeinstants, (d) pro essed radar signal a quired for the roe-deer road rossing event.
127

4.4. PILOT SITE IDENTIFICATION AND SENSOR NODEINSTALLATION
128

Chapter 5Con lusionsIn this hapter, on lusions and future developments regarding the proposedwildlife road rossing monitoring system are presented. In parti ular, additional onsiderations are given on erning the a tual value of su h system in order tolimit fauna-vehi le in idents by preventing these events to happen.
129

5.1. CONCLUSION AND FUTURE DEVELOPMENT5.1 Con lusion and Future DevelopmentWildlife road rossing represents a real problem to whi h a tual solutions havenot yet been de�ned. In parti ular, as already des ribed in se tion 2.2, state-of-the-art solutions are mainly based on a tive systems, thus implying wildlife towear spe i� devi es, whi h allow them ooperating in the dete tion me hanism,or alternatively on road infrastru ters used to limit fauna a ess to the roads.Nevertheless, su h solutions are hara terized by some drawba ks, in detailregarding the former ase, the use of devi es to be worn by animals a tuallylimits the use of su h system sin e it may not be generalized to every faunaspe ies, in parti ular those ones arranged in large herds of animals and whi hmay not be easily aptured for devi e equipping. In addition, another hallengeregards the a tual transmission of information, whi h should take pla e wirelessly,thus implying proper radio infrastru tures. Moreover, also the power supply mayrepresent a main drawba k of the system, sin e repla ing batteries used for devi esupply may not be a tually an easy operation, as des ribed above.Regarding the latter ase, instead, the solution of properly infrastru turingroads interested in the wildlife road rossing problem is a valuable solution,sin e it does not imply the use of any kind of devi e for the e�e tive faunamonitoring, thus redu ing the maintenan e interventions by operators. In fa t,on e installed, these infrastru tures should guarantee an higher se urity level onnear roads and few periodi inspe tions may be performed in order to validatetheir a tual state. As already des ribed, the main used infrastru tures are of theunderpass, overpass and fen ing typologies. Nevertheless, the main drawba ks ofsu h stru tures regard osts and a tual impa t on the environment, whi h mayalter both the e osystem and the roads mobility.Therefore, also onsidering the above onsiderations, the proposed monitoringsystem may be an a tual solution to the problem, sin e, regarding the abovedrawaba ks, it an be lassi�ed as a passive system, sin e wildlife do not needto wear any kind of devi e for their dete tion, and in addition the a utal system ost has been kept very low, even during the prototyping pro ess.The engineered sensor nodes exploit the Doppler radar te hnology, whi hallows gathering useful information from the dete ted events, su h as speed anddire tion of the moving target. A se urity area is de�ned along the road dire tionof size about 10-12m from the road margin. Therefore all the events o urringinside this area are identi�ed by the monitoring system and they may be usedin order to properly warn in oming drivers. In fa t, in order to lose the systemoperation y le, an a tuator node of the wireless network may be implemented,thus allowing th a tual warn of drivers in relation to dete ted events. A tually aprototype of su h devi e has been developed in order to propose and validate the omplete monitoring system working. Fig. 5.1(a) shows a pi ture of the a tuatornode prototype. Of ourse the �nal a tuator devi e will have to omply withroad and se urity legislations in for e, thus the solution may be identi�ed in the130

CHAPTER 5. CONCLUSIONSwildlife road sign properly equipped with warning leds, whi h may be triggeredwith di�erent e�e ts on the basis of the a tual dete ted event. For instan e, noleds if no events are o urring, blinking leds in low risky onditions and steadya tive leds in ase of wildlife movements representing a very dangerous s enariofor in oming drivers.
(a) (b)Figure 5.1: A tuator node of the monitoring system: (a) developed prototype,(b) proposed �nal solution.Moreover, the relation between the radar signal and the target hara teristi sis very omplex and a learning by example (LBE) strategy ould be exploited inorder to estimate it. In fa t, the signal a quired by the radar modules dependson the target hara teristi s and it ontains information on the s enario usefulto determine the position, the dire tion and the velo ity of the unknown movingtarget.Towards this end, a set of targets (i.e., di�erent positions, movements andvelo ities) ould be de�ned and the problem of target identi� ation re ast as thede�nition of the probability of belonging to a spe i� lass of target. A ordingwith the similarity to the known training data a quired in ontrolled s enar-ios, this approa h should redu e the false positive and false negative dete tions.Moreover, even if a target will be identi�ed inside the se urity zones, the lassi�erwill label the event as true only when the movement hara teristi s will belong131

5.1. CONCLUSION AND FUTURE DEVELOPMENTto a spe i� lass, thus avoiding the signaling of stati targets or targets movingparallel to the road, whi h may represent lower risk onditions for road se urity.
132
Bibliography[1℄ R.T. Forman, �Road E ology: S ien e and Solutions,� Island Press, Wash-ington, D.C., USA, 2003.[2℄ Z. He et al., �Energy-aware portable video ommuni ation system design forwildlife a tivity monitoring,� IEEE Cir uits and Systems Mag., vol. 8, no.2, pp. 25-37, 2008.[3℄ B. Wietrzyk and M. Radenkovi , �Energy e� ien y in the mobile ad ho networking approa h to monitoring farm animals,� IEEE Int. Conf. on Net-working and Servi es, July 19-21, Sili on Valley,CA, USA, 2006.[4℄ M. Rutishauser, V.V. Petkov, T. Williams, C. Wilmers, J. Boi e, K.Obra zka, and P. Mantey, �CARNIVORE: A disruption-tolerant system forstudying wildlife,� in Pro . of 19th Int. Conf. on Computer Communi ationsand Networks, pp. 1-8, 2010.[5℄ J-H. Huang, Y-Y. Chen, Y-T. Huang, P-Y. Lin, Y-C. Chen, Y-F. Lin, S- C.Yen, P. Huang, and L-J. Chen, �Rapid prototyping for wildlife and e ologi almonitoring,� IEEE Systems Journal , vol. 4, no. 2, pp. 198-209, 2010.[6℄ F. Viani, P. Ro a, G. Oliveri, and A. Massa, �Pervasive remote sensingthrough WSNs,� European Conf. on Antennas and Propagation, (EuCAP2012), Prague, Cze h Republi , Mar h 26-30, 2012.[7℄ M. Benedetti, L. Ioriatti, M. Martinelli, and F. Viani, �Wireless sensor net-work: a pervasive te hnology for earth observation�, IEEE Journal of Se-le ted Topi in Applied Earth Observation and Remote Sensing , vol.3, no.4, pp. 488-496, 2010.[8℄ M. Martinelli et al., �A WSN-based solution for pre ision farm purposes�,Pro . 2009 IEEE Int. Geos i. Remote Sens. Symp. (IGARSS 2009), CapeTown, 13-17 July 2009, vol. 5, pp. 469-473.[9℄ L. Ioriatti, M. Martinelli, F. Viani, M. Benedetti, and A. Massa, �Real-timedistributed monitoring of ele tromagneti pollution in urban environment,�in Pro . 2009 IEEE International Symposium on Geos ien e and RemoteSensing, Cape Town, South Afri a, July 13-17, 2009.133

BIBLIOGRAPHY[10℄ F. Viani, M. Donelli, D. Trin hero, G. Oliveri, and A. Massa, �A WSN-based system for real-time ele tromagneti monitoring,� Pro . 2011 IEEEAP-S International Symposium, Spokane, Washington, USA, pp. 3129-3132,July 3-8, 2011.[11℄ F. Viani, M. Salu i, P. Ro a, G. Oliveri, and A. Massa, �A multi-sensorWSN ba kbone for museum monitoring and surveillan e,� European Conf.on Antennas and Propagation, (EuCAP 2012), Prague, Cze h Republi ,Mar h 26-30, 2012.[12℄ F. Viani, P. Ro a, M. Benedetti, G. Oliveri, and A. Massa, �Ele tro-magneti passive lo alization and tra king of moving targets in a WSN-infrastru tured environment,� Inverse Problems - Spe ial Issue on Ele tro-magneti Inverse Problems: Emerging Methods and Novel Appli ations, vol.26, pp.1-15, 2010.[13℄ F. Viani, M. Donelli, P. Ro a, G. Oliveri, D. Trin hero, and A. Massa,�Lo alization, tra king and imaging of targets in wireless sensor networks,�Radio S ien e, Vol. 46, No. 5, 2011.[14℄ F. Viani, L. Lizzi, P. Ro a, M. Benedetti, M. Donelli, and A. Massa, �Ob-je t tra king through RSSI measurements in wireless sensor networks,� Ele -troni Letters, vol. 44, no. 10, pp. 653-654, May 2008.[15℄ F. Viani, G. Oliveri, and A. Massa, �Real-time tra king of trans eiver-freeobje ts for homeland se urity,� 39th European Mi rowave Conferen e 2009(EuMC2009 ), Rome, Italy, pp. 1892-1895, September 28 O tober 2, 2009.[16℄ F. Viani, M. Donelli, M. Salu i, P. Ro a, and A. Massa, �Opportunisti exploitation of wireless infrastru tures for homeland se urity,� Pro . 2011IEEE AP - S International Symposium, Spokane, Washington, USA, pp.3062-3065, July 3-8, 2011.[17℄ F. Viani, M. Donelli, G. Oliveri, and A. Massa, �A mobile wireless sensornetwork for ollaborative tasks a hievement by means autonomous robotrobot swarm,� Pro . 2010 IEEE AP-S International Symposium, Toronto,ON, Canada, July 11-17, 2010.[18℄ F. Viani et al., �Ele tromagneti passive lo alization and tra king of movingtargets in a WSN infrastru tured environment,� Inverse Problems, vol. 26,pp. 1-15, 2010.[19℄ F. Viani, M. Martinelli, L. Ioriatti, L. Lizzi, G. Oliveri, P. Ro a, and A.Massa, �Real-time indoor lo alization and tra king of passive targets bymeans of wireless sensor networks,� Pro . 2009 IEEE AP-S InternationalSymposium, Charleston, SC, USA, June 1-5, 2009.134

BIBLIOGRAPHY[20℄ F. Viani, M. Martinelli, L. Ioriatti, M. Benedetti, and A. Massa, �Passivereal-time lo alization through wireless sensor networks,� Pro . 2009 IEEEInternational Symposium on Geos ien e and Remote Sensing, Cape Town,South Afri a, July 13-17, 2009.[21℄ F. Viani, G. Oliveri, M. Donelli, L. Lizzi, P. Ro a, and A. Massa, �WSN-based solutions for se urity and surveillan e,� 40th European Mi rowaveConferen e 2010 (EuMC2010 ) (2010 EuMA), Paris, Fran e, September 26O tober 1, 2010.[22℄ F. Viani, P. Ro a, G. Oliveri, and A. Massa, �Ele tromagneti tra kingof trans eiver-free targets in wireless networked environments,� Pro . 2011European Conferen e on Antennas and Propagation (EuCAP2011 ), Rome,Italy, April 11-15, 2011.[23℄ F. Viani, P. Ro a, M. Donelli, D. Trin hero, and A. Massa, �Exploitinginverse s attering theory for real-time tra king in homeland se urity appli- ations,� Pro . 2011 Progress in Ele tromagneti s Resear h Symp. (PIERS2011 ), Marrakesh, Moro o, Mar h 20-23, 2011.[24℄ F. Viani, P. Ro a, L. Lizzi, and A. Massa, �WSN-based early alert sys-tem for preventing wildlife-vehi le ollisions in alps regions,� InternationalConferen e on Ele tromagneti s in Advan ed Appli ations (ICEAA2011 ),Turin, Italy, September 12-16, 2011.[25℄ J. Anand, A. Jones, T.K. Sandhya, and K. Besna, �Preserving nationalanimal using wireless sensor network based hotspot algorithm,� IEEE In-ternational Conferen e on Green High Performan e Computing (ICGHPC ),pp.1-6, 14-15 Mar h 2013.[26℄ A. Tovar, T. Friesen, K. Ferens, and B. M Leod, �A DTN wireless sen-sor network for wildlife habitat monitoring,� 23rd Canadian Conferen e onEle tri al and Computer Engineering (CCECE ), pp.1-5, 2-5 May 2010.[27℄ V. Dyo, S.A. Ellwood, D.W. Ma donald, A. Markham, C. Mas olo, B. Pasz-tor, S. S ellato, N. Trigoni, R. Wohlers, and K. Yousef, �Evolution and sus-tainability of a wildlife monitoring sensor network,� in Pro eedings of the8th ACM Conferen e on Embedded Networked Sensor Systems, pp. 127-140,2010.[28℄ C. Mas olo, �Wildlife So ial Life Monitoring through Sensor Network for aBetter Planet,� Ubiquitous Computing at a Crossroads Workshop, London,January 6-7, 2009.[29℄ S ien e and the Environment Bulletin, "Wildlife Tra king Te hnologies,"[Online℄, http://www.e .g . a/S ien e/sandejuly99/arti le1_e.html135

BIBLIOGRAPHY[30℄ Vrban i F., �The ubiquitous radio frequen y identi� ation te hnology usedfor livesto k breeding,� MIPRO, 2010 Pro eedings of the 33rd InternationalConvention, pp.653,655, 24-28 May 2010.[31℄ Z. He, �Energy-e� ient integrated amera and sensor system design forwildlife a tivity monitoring,� IEEE International Conferen e on Multimediaand Expo, ICME 2009, pp.1580-1581, June 28 2009-July 3 2009.[32℄ L.D. Me h and S.M. Barber, �A ritique of wildlife radio-tra king and itsuse in national parks: a report to the U.S. National Park Servi e,� U.S.Geologi al Survey, Northern Prarie Wildlife Reser h Center, Jamestown,N.D. 78, 2002.[33℄ J.J. Millspaugh and J.M. Marzlu�, �Radio Tra king and Animal Popula-tions,� A ademi Press, San Diego, California, USA, 2001.[34℄ L.D. Me h, �A Handbook Of Animal Radio-tra king,� Univ. of Minn. Press,1983.[35℄ NASA satellite Tra king of Threatened Spe ies.http://sd d.gsf .nasa.gov/ISTO/satellite_tra king/, 2002.[36℄ P. Juang, H. Oki, Y. Wang, M. Martonosi, L.-S. Peh, and D. RUben-stein, �Energy-e� ient omputing for wildlife tra king: Design tradeo�sand early experien es with Zebranet,� Tenth International Conferen e onAr hite tural Support for Programming Languages and Operating Systems(ASPLOS-X ), San Jose, CA, O tober 5-9, 2002.[37℄ S.I. Chak hai, P. Comdet, T. Smarn, W. Nutni ha, W. Kasidit, K. Ura hart,W. Boonsup, and S. Saiyan, �Mobile Animal Tra king Systems using LightSensor for E� ient Power and Cost Saving Motion Dete tion,� 8th Interna-tional Symposium on Communi ation Systems, Networks and Digital SignalPro essing (CSNDSP), pp. 1-6, 2012.[38℄ M. Dominguez-Morales, A. Jimenez-Fernandez, D. Cas ado-Caballero, A.Linares-Barran o, R. Paz, G. Jimenez-Moreno, and R. Soriguer, "Te hni alviability study for behavioral monitoring of wildlife animals in Donana: An802.15.4 overage study in a Natural Park," Pro eedings of the InternationalConferen e on Data Communi ation Networking (DCNET ), pp.1-4, 18-21July 2011.[39℄ S. Ehsan, M. Brugger, K. Bradford, B. Hamdaoui, and Y. Kov hegov, �Suf-� ient Node Density Conditions on Delay-Tolerant Sensor Networks forWildlife Tra king and Monitoring,� IEEE Global Tele ommuni ations Con-feren e (GLOBECOM 2011 ), pp.1-6, 5-9 De . 2011.136

BIBLIOGRAPHY[40℄ D.M. Jun, D.L. Jones, T.P. Coleman, W.J. Leonard, and R. Ratnam,�Pra ti al sensor management for an energy-limited dete tion system,�IEEE International Conferen e on A ousti s, Spee h and Signal Pro essing(ICASSP), pp.1641-1644, 25-30 Mar h 2012.[41℄ L. Long, D.M. Jun, and D.L. Jones, �Energy-e� ient dete tion system intime-varying signal and noise power,� IEEE International Conferen e onA ousti s, Spee h and Signal Pro essing (ICASSP), pp.2736-2740, 26-31May 2013.[42℄ L. Karim, and N. Nasser, �Energy E� ient and Fault Tolerant RoutingProto ol for Mobile Sensor Network,� IEEE International Conferen e onCommuni ations (ICC ), pp.1-5, 5-9 June 2011.[43℄ J. Kiepert, and L. Sin Ming, �A uni�ed wireless sensor network framework,�IEEE International Systems Conferen e (SysCon), pp.1-6, 19-22 Mar h2012.[44℄ S. Sivaramakrishnan, and A. Al-Anbuky, �Analysis of network onne tivity:Wildlife and Sensor Network,� Tele ommuni ation Networks and Appli a-tions Conferen e (ATNAC ), pp.1-6, 10-12 Nov. 2009.[45℄ S. Sivaramakrishnan, A. Al-Anbuky, and B.B. Breen, �Adaptive sampling fornode dis overy: Wildlife monitoring & sensor network,� 16th Asia-Pa i� Conferen e on Communi ations (APCC ), pp.447-452, O t. 31 2010-Nov. 32010.[46℄ S.A.B. Awwad, C.K. Ng, N.K. Noordin, and M.F.A. Rasid, �Cluster basedrouting proto ol for mobile modes in wireless sensor network,� InternationalSymposium on Collaborative Te hnologies and Systems, pp. 233-241, 2009.[47℄ F. Bajaber and I. Awan, "Dynami /Stati Clustering Proto ol for Wire-less Sensor Network," Se ond UKSIM European Symposium on ComputerModeling and Simulation, pp. 524-529, 2008.[48℄ D.-S. Kim, and Y.-J. Chung, �Self-Organization Routing Proto ol Support-ing Mobile Nodes for Wireless Sensor Network,� Pro eedings of the FirstInternational Multi-Symposiums on Computer and Computational S ien es(IMSCCS'06 ), 2006.[49℄ A. Durresia, V. Paru huri, and L. Barolli, �Clustering Proto ol for sen-sor networks,� 20th International Conferen e on Advan ed Information Net-working and Appli ations, vol. 2, 2006.[50℄ Y.P. Chen, A.L. Liestman, and J. Liu, �A hierar hi al energy-e� ient frame-work for data aggregation in wireless sensor networks,� Vehi ular Te hnol-ogy, IEEE Transa tions on , vol.55, no.3, pp.789,796, May 2006.137
BIBLIOGRAPHY[51℄ A. Lindgren, C. Mas olo, M. Lonergan, and B. M Connell, �Seal-2-Seal:A delay-tolerant proto ol for onta t logging in wildlife monitoring sensornetworks,� 5th IEEE International Conferen e on Mobile Ad Ho and SensorSystems, MASS 2008, pp.321,327, Sept. 29 2008-O t. 2 2008.[52℄ P. Mathur, R.H. Nielsen, N.R. Prasad, R. Prasad, �Wildlife onservationand rail tra k monitoring using wireless sensor networks,� 4th InternationalConferen e on Wireless Communi ations, Vehi ular Te hnology, Informa-tion Theory and Aerospa e & Ele troni Systems (VITAE ), pp.1-4, 11-14May 2014.[53℄ I. F. Akyildiz, Su W., Sankarasubramaniam Y., and Cayir i E., �A surveyon sensor networks,� IEEE Communi ations Magazine, vol.40, no.8, pp.102-114, Aug. 2002.[54℄ A.R. de Carvalho, A.D. Ribas, V.F. da Camara Neto, E.F. Nakamura, andC.M. Figueiredo, �An RSSI-based navigation algorithm for a mobile robotin Wireless Sensor Networks," IEEE 37th Conferen e on Lo al ComputerNetworks (LCN ), pp.308-311, 22-25 O t. 2012.[55℄ A. Barati, M. Dehghan, H. Barati, and A.A. Mazreah, �Key ManagementMe hanisms in Wireless Sensor Networks,� Se ond International Confer-en e onSe ond International Conferen e on Sensor Te hnologies and Appli- ations, pp.81-86, 25-31 Aug. 2008.[56℄ H. Leung, S. Chandana, and W. Shuang, �Distributed sensing based onintelligent sensor networks,� IEEE Cir uits and Systems Magazine, vol.8,no.2, pp.38-52, Se ond Quarter 2008.[57℄ J.M. Kahn, R.H. Katz, and K.S.J. Pister, �Mobile Networking for SmartDust,� ACM/IEEE Intl. Conf. on Mobile Computing and Networking (Mobi-Com 99 ), Seattle, WA, August 17-19, 1999.[58℄ G. Potti and W. Kaiser, �Wireless integrated network sensors,� Communi- ations of the ACM, vol. 43, no. 5, pp. 51-58, May 2000.[59℄ Bulusu et al., �S alable Coordination for Wireless Sensor Networks: Self-Con�guring Lo alization Systems,� ISCTA 2001, Ambleside, U.K., July2001.[60℄ C. Shen, C. Srisathapornphat, and C. Jaikaeo, �Sensor Information Net-working Ar hite ture and Appli ations,� IEEE Pers. Commun., pp. 52-59,Aug. 2001.[61℄ K. Sohrabi et al., �Proto ols for Self-Organization of a Wireless Sensor Net-work,� IEEE Pers. Commun., pp. 16-27, O t. 2000.138
BIBLIOGRAPHY[62℄ W. R. Heinzelman, A. Chandrakasan, and H. Balakrish- nan, �Energy-E� ient Communi ation Proto ol for Wireless Mi rosensor Networks,�IEEE Pro . Hawaii Int'l. Conf. Sys. S i., pp. 1-10, Jan. 2000.[63℄ V. Rodoplu and T. H. Meng, �Minimum Energy Mobile Wireless Networks,�IEEE JSAC, vol. 17, no. 8, pp. 1333-1344, Aug. 1999.[64℄ Skolnik M., �Radar Handbook,� 3rd Edition, M Graw-Hill, 2008.[65℄ Krohne Messte hnik GmbH & Co. KG, �Fundamental of Radar Te hnologyfor Level Gauging,� 4th Edition, 2007.[66℄ T. Augustynek, and A. Battaglia, �Retrieving hydrometeor motions usingspa e-borne EarthCARE Doppler radar,� 13th International Radar Sympo-sium (IRS ), pp.509-512, 23-25 May 2012.[67℄ J.H. Dunn, and D.D. Howard, �RADAR Target Amplitude, Angle, andDoppler S intillation from Analysis of the E ho Signal Propagating inSpa e,� IEEE Transa tions on Mi rowave Theory and Te hniques, vol.16,no.9, pp.715-728, Sep 1968.[68℄ P. H. Hildebrand, C. A. Walther, C. L. Frush, J. Testud, and F. Baudin, �TheELDORA/ASTRAIA Airbone Doppler Weather Radar: Goals, Design, andFirst Field Tests,� Pro eedings of the IEEE, vol. 82, No. 12, De ember 1994.[69℄ J. P. Webster, and R. Lukas, �TOGA-COARE: The TOGA oupled o ean-atmosphere response experiment,� Bull. Amer. Meteor. So ., vol. 73, pp.1377-1416, 1992.[70℄ T. Nakazawa, �Tropi al super- lusters under intraseasonal variation,� inJapan-US Workshop on the ENSO Phenomena, Univeristy of Tokyo, Mete-orology Rep. 88-1, Dept. of Meterorology, Geophysi al Institute, pp.76-78,1988.[71℄ P. Komatineni, N. Nagarajan, M. M. Wadood, G. Mirzaei, J. Ross, M. M.Jamali, P. V. Gorsevski, J. Frizado, and V. P. Bingman, �Quanti� ationof bird migration using Doppler Weather Surveillan e Radars (NEXRAD),�IEEE Radar Conferen e (RADAR), pp. 1-4, April 29 2013-May 3 2013.[72℄ Global Wind Energy Coun il, from http://www.gwe .net/index.php?id=121[73℄ U.S. Fish ad Wildlife Servi es, from http://www.fws.gov/birds/mortality-fa t-sheet.pdf[74℄ H. Zhou, �Dual-Doppler radar three-dimensional wind �eld retrieval softwaresystem and appli ations,� International Conferen e on Computer S ien eand Servi e System (CSSS ), pp. 360-365, 27-29 June 2011.139

BIBLIOGRAPHY[75℄ W. Li, and Y. Xie, �Multi-grid Analysis of the Three-Dimensional DopplerRadial Velo ity: Idealized Cases Study,� Fitfth International Joint Con-feren e on Computational S ien es and Optimization (CSO), pp. 813-816,23-26 June 2012.[76℄ M. W. Lang, G. W. M Carty, J. C. Rit hie, A. M. Sadeghi, W. D. Hively,and S. D. E kles, �Radar Monitoring of Wetland Hydrology: Dynami In-formation for the Assessment of E osystem Servi es,� IEEE InternationalGeos ien e and Remote Sensing Symposium, IGARSS 2008, vol. 1, pp. I-261,I-264, 7-11 July 2008.[77℄ Y. K. Kwag, �An Airborne Radar System with Adaptive MTD DopplerCompensation S heme usgin DSP Based Real-Time Spe tral Estimation,�IEEE Radar Conferen e, pp. 1-5, 26-30 May 2008.[78℄ D. C. S hleher, �MTI and pulsed Doppler radar,� Arte h House, pp. 344-355,1991.[79℄ M. I. Skolnik, �Introdu tion to radar,� M Graw Hill, h. 3, 2000.[80℄ Galati, �Adavan ed radar te hniques and systems,� IEE Press, London, UK, h. 6, 1993.[81℄ Y. Huang et al, �Adaptive lutter suppression s heme with high perfor-man e,� IEEE Pro eding of ICSP, pp. 1818-1821, 2000.[82℄ Y. S. Lee, P. N. Pathirana, C. L. Steinfort, and T. Caelli, �Monitoring andAnalysis of Respiratory Patterns Using Mi rowave Doppler Radar,� IEEEJournal of Translational Engineering in Health ans Medi ine, vol. 2, pp.1-12, 2014.[83℄ J. H. Oum, D. W. Kim, and S. Hong, �Two frequen y radar sensor fornon- onta t vital signal monitor,� IEEE MTT-S International Mi rowaveSymposium Digest, pp. 919-922, June 2008.[84℄ Y. Yan, C. Li, X. Yu, M. D. Weiss, and J. Lin, �Veri� ation of a non- onta tvital sign monitoring system using an infant simulator,� Anual InternationalConferen e of the IEEE on Engineering in Medi ine and Biology So iety,EMBC 2009, pp. 4836-4839, 3-6 Sept. 2009.[85℄ W. Xu, C. Gu, C. Li, and M. Sarrafzadeh, �Robust Doppler radar demodu-lation via ompressed sensing,� Ele troni Letters, vol. 48, No. 2, pp. 1428-1430, O tober 25 2012.[86℄ C. Gu et al., �An instruments-built Doppler radar for sensing vital signs,�8th International Symposium on Antennas, Propagation and EM Theory,ISAPE 2008, pp.1398-1401, 2-5 Nov. 2008.140

BIBLIOGRAPHY[87℄ A. Tariq, and H. Ghafouri-Shiraz, �Vital signs dete tion using Doppler radarand ontinuous wavelet Transform,� Pro eedings of the 5th European Con-feren e on Antennas and Propagation (EUCAP), pp.285,288, 11-15 April2011.[88℄ O. Bori -Lube ke, V. M. Lube ke, I. Mostafanezhad, B.-K. Park, W. Mas-sagram, and B. Jokanovi , �Doppler Radar Ar hite tures and Signal Pro- essing for Heart Rate Extra tion,� Mi rowave Review, De ember 2009.[89℄ X. Lai, H. Torp, and K. Kristo�ersen, �An Etended Auto orrelation Methodfor Estimation of Blood Velo ity,� IEEE Transa tions on Ultrasoni , Ferro-ele tri s, and Frequen y Control, Vol. 44, No. 6, November 1997.[90℄ P. Misans, and M. Terauds, �CW Doppler Radar Based Land Vehi le SpeedMEasurement Algorithm Using Zero Crossing and Least Squares Method,�13th Biennial Balti Ele troni s Conferen e (BEC2012 ) Tallinn, Estonia,O tober 3-5, 2012.[91℄ J. H. Lim, I.-J Wang, and A. Terzis, �Tra king A Non. ooperative Mo-bile Target Usign Low-Power Pulsed Doppler Radars,� 5th IEEE Interna-tional Workshop on Pra ti al Issues in Building Sensor Network Appli a-tions (SenseApp 2010 ), Denver, Colorado.
141

BIBLIOGRAPHY
142

Appendix AComplete Cir uital S heme of the WSN Node-SensorsInterfa ing Board
Figure A.1: Cir uital s heme of the WSN node-sensors interfa ing board.143

144