dissolution curve comparison alternative to f2 › amca-biobridges › media › ... · prague sept...
TRANSCRIPT

Prague Sept 2018 -1 © JM CARDOT
J-M. CardotEmail: [email protected]
Dissolution curve comparisonAlternative to F2

Prague Sept 2018 -2 © JM CARDOT
Introduction

Prague Sept 2018 -3 © JM CARDOT
Formulation type: IR, MR,
type of MR, etc…
Process parameters: mixing ,
granulation, drying, tabletting,
coating
Formula: composition, grade
of excipients, quantity of API
and excipients, etc…
API: source, quality, purity,
salt, etc.
API: solubility, dissolution rate,
particle size, crystal shape,
polymorphism, pKa, etc.
Form
ula
tion a
nd p
rocess
AP
I
Dissolution results:
percentage dissolved vs
time
Dissolution apparatus
Dissolution media
Dissolution parameter
Dissolution tests

Prague Sept 2018 -4 © JM CARDOT
Dissolution tests
• Use as QC => insure batch to batch consistency
• Use in Biowaivers => surrogate of in vivo
– BCS based IR solid dosage form
– Strength IE/MR dosage forms
• Use in life cycle management
– Support variations
Prague Sept 2018 -5 © JM CARDOT
Guidelines/reflection papers EMA
• Bioequivalence
• MR
• ICH Q8
• Variation
• Dissolution
• ICH M9
• Statistical methodology
• Etc…

Prague Sept 2018 -6 © JM CARDOT
Dissolution curve comparison
• If >85% dissolved in < 15 for IR solid formulation no statistical test
• If that is not the case– F2 but
• 12 units• 3 time points with only one > 85%• CV first point < 20% and others < 10%
– Variability could be due to formulation, process or even reference formulation (and not test formulation)
– If conditions of F2 not fulfilled for CV => alternative tests … but which one that is not defined

Prague Sept 2018 -7 © JM CARDOT
Comparison of curves F2 test
Prague Sept 2018 -8 © JM CARDOT
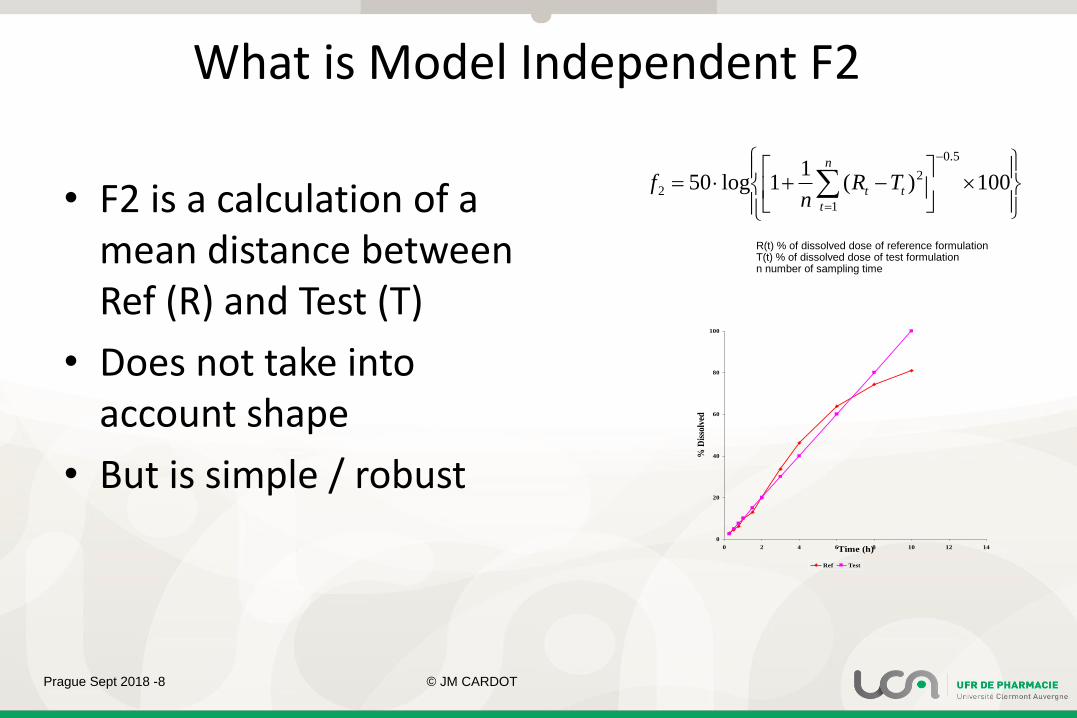
What is Model Independent F2
−+=
−
=
100)(1
1log50
5.0
1
2
2
n
t
tt TRn
f
R(t) % of dissolved dose of reference formulationT(t) % of dissolved dose of test formulationn number of sampling time
• F2 is a calculation of a mean distance between Ref (R) and Test (T)
• Does not take into account shape
• But is simple / robust0
20
40
60
80
100
0 2 4 6 8 10 12 14Time (h)
% D
isso
lved
Ref Test

Prague Sept 2018 -9 © JM CARDOT
f2
• F2=50 => mean R-T=10
−+=
−
=
100)(1
1log50
5.0
1
2
2
n
t
tt TRn
f
1099
99)(1
10)(1
1
1.0
1)(
11
)(1
1
11.0
)(1
11.0100
10
100)(1
110
100)(1
1log150
50
100)(1
1log5050
2
1
2
1
2
1
2
1
2
5.0
1
2
5.0
1
2
5.0
1
2
5.0
1
2
2
→=
=→=+
=+→
+
=
+==
+=
+==
+==
==
=
=
−
=
−
=
−
=
−
=
mm dd
n
t
t
n
t
t
n
t
tn
t
t
n
t
t
n
t
t
n
t
t
n
t
t
dn
dn
dn
dn
dn
dn
dn
dn
f
Prague Sept 2018 -10 © JM CARDOT
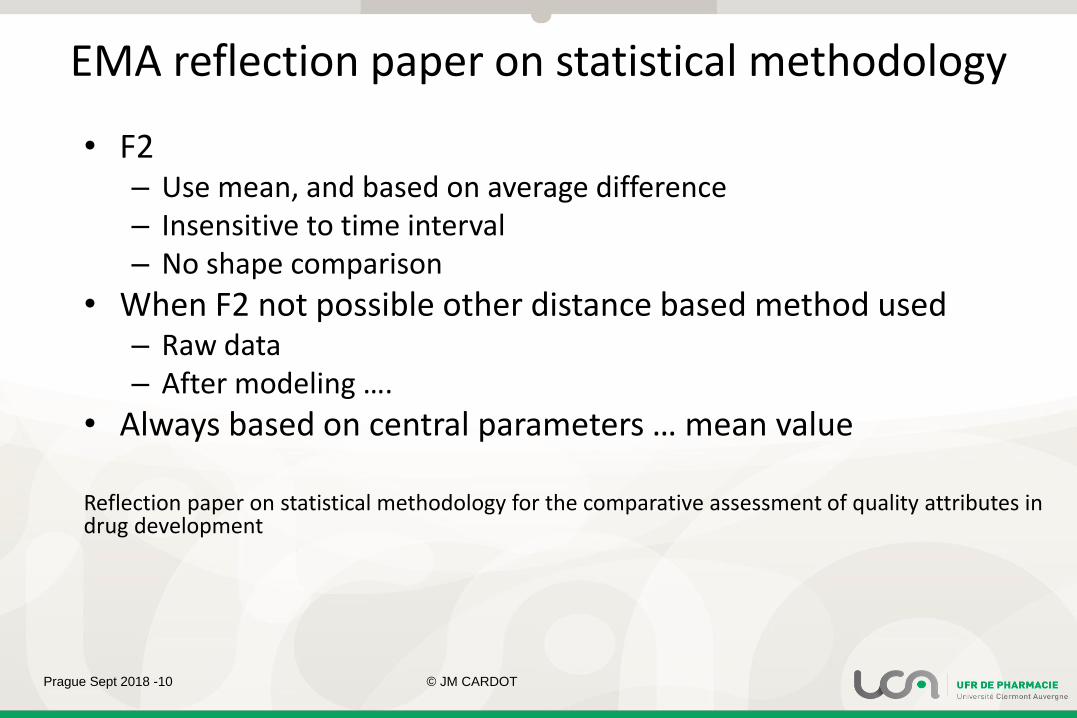
EMA reflection paper on statistical methodology
• F2– Use mean, and based on average difference– Insensitive to time interval– No shape comparison
• When F2 not possible other distance based method used– Raw data– After modeling ….
• Always based on central parameters … mean value
Reflection paper on statistical methodology for the comparative assessment of quality attributes in drug development

Prague Sept 2018 -11 © JM CARDOT
Proposed: dissolution
• F2 no alpha (and of course no beta) risk associated … except after bootstrapping
• F2: not possible to make a simple CI (except if bootstrapping)
• F2 acceptance based on a mean almost 10% difference
• Alternative to F2– Limits +/- 10% … of what (ref ?)
– Limits +/- 10% of bio batch but why
– What is the in vivo outcome of +/-10%
• How to set alpha risk … problem of multiple comparison R1 vs T1 R1 vs T2 R1 vs T3, R2 vs T1, etc…

Prague Sept 2018 -12 © JM CARDOT
Remarks
• Simple to criticize but what to propose ?
• Ideal Target Test Profile
– Compatible with manual calculation
– Limits easy to determine
– Simple selection of points to be used
– Taking into account if Test less variable than Reference
– Taking into account shape of curves
– …

Prague Sept 2018 -13 © JM CARDOT
Current alternatives to F2

Prague Sept 2018 -14 © JM CARDOT
Alternative tests
• When variability criteria of F2 is not fulfilled
• Not possible when results are not complying with F2>50% but all conditions are fulfilled …

Prague Sept 2018 -15 © JM CARDOT
Described
• Multivariate Statistical Distance (MSD) either on raw data or model parameters,
• Bootstrapping F2• Bootstrapping G1, • Bayesian extension of f2 metrics, • Dissolution efficiency DE, associated or not to MDT • Paired permutated t test, • GLM: ANOVA, Principal Components Model, and Mixed
linear models,• Etc…

Prague Sept 2018 -16 © JM CARDOT
Described
• Multivariate Statistical Distance (MSD) either on raw data or model parameters,
• Bootstrapping F2• Bootstrapping G1, • Bayesian extension of f2 metrics, • Dissolution efficiency DE, associated or not to MDT • Paired permutated t test, • GLM: ANOVA, Principal Components Model, and Mixed
linear models,• Etc…

Prague Sept 2018 -17 © JM CARDOT
MSD
• When the ƒ2 statistic is not suitable, then the similarity may be compared using model-dependent or model-independent methods e.g. by statistical multivariate comparison of the parameters of the Weibull function or the percentage dissolved at different time points … The similarity acceptance limits should be pre-defined and justified and not be greater than a 10% difference. In addition, the dissolution variability of the test and reference product data should also be similar, however, a lower variability of the test product may be acceptable
CPMP/EWP/QWP/1401/98 Rev. 1/ Corr ** page 21/27

Prague Sept 2018 -18 © JM CARDOT
MSD
• 2 or n dimension distances which calculations are based on the variance of each variable and the covariance between variables.
• takes into account the relationship and distance between the datasets, the possible different scales and the dispersions of them.
• 90% CI is computed, and the larger bound is compared to a preset value (in the present case, the distance calculated vs the limit)

Prague Sept 2018 -19 © JM CARDOT
MSD SAS
• Use proc CANDISC option DISTANCE
– MSD = 𝑀𝑆𝐷²
– K=Fobs/MSD².
– CI=𝑀𝑆𝐷 ± 𝐹𝑐𝑟𝑖𝑡/𝐾, where Fcrit is the F value for α=0.1 and 3 (number of parameters), 20 (24 values-3 parameters-1) df

Prague Sept 2018 -20 © JM CARDOT
MSD problems: on dissolution curve fitting
• Can be performed on parameters of equation used to fit dissolution curves– Is that the right equation
– Is not the model over-parametrized
– Often driven by Q dissolved at infinity
– This high similarity between dissolution at the end of the profile or parameters (such as Fmax) leads to a wrong conditioning of the variance covariance matrix, collinearity, and bias of the common variance estimation.
– Accomodate non similar sample

Prague Sept 2018 -21 © JM CARDOT
MSD problems: on dissolution Raw data
• Can be performed on raw data
– Which points to take
– Use time as a factor => Co-linearity problem (dissolution at time 2 depends of dissolution at time 1, etc.), singularity of the pooled covariance matrix, and bias of the common variance estimation
– Not using time as a factor: best option but must limit sample up to one greater than 85% (as for f2) to avoid insensibility of the results to detect possible differences
Prague Sept 2018 -22 © JM CARDOT
Limits … another problem
• 10% of What
• Of Reference seems to be the more logic: Ref vs Ref + or -10% – Takes into account the variability of the reference => if test
less varaible that is in your advantage
– Takes into account a reality Ref vs Ref + or – 10% must be in theory equal ….
• Between various batches of the reference => largerdifference– Possible if greater than the previous option

Prague Sept 2018 -23 © JM CARDOT
MSD 2*2 or all batches together
• When 3 test batches (T1, T2, T3) must be compared to a single reference (R) that leads to R vs T1, R vs T2, R vs T3, and R vs limit: 4 tests
• Multiplication of tests is not recommended (alpha inflation)
• MSD could be handle on all the data and then takes into account the variabilities sources

Prague Sept 2018 -24 © JM CARDOT
MSD
• Is again a global distance between batches

Prague Sept 2018 -25 © JM CARDOT
F2 bootstrapping

Prague Sept 2018 -26 © JM CARDOT
Bootstrapping
• Bootstrapping is a random re-sampling technique
• Bootstrapping allows
– measuring of accuracy to sample estimates
– estimating of the sampling distribution
• F2 bootstrapping
– From initial dataset of test and ref sample to create new sets of data
– Handicap if Ref more variable than Test
Prague Sept 2018 -27 © JM CARDOT
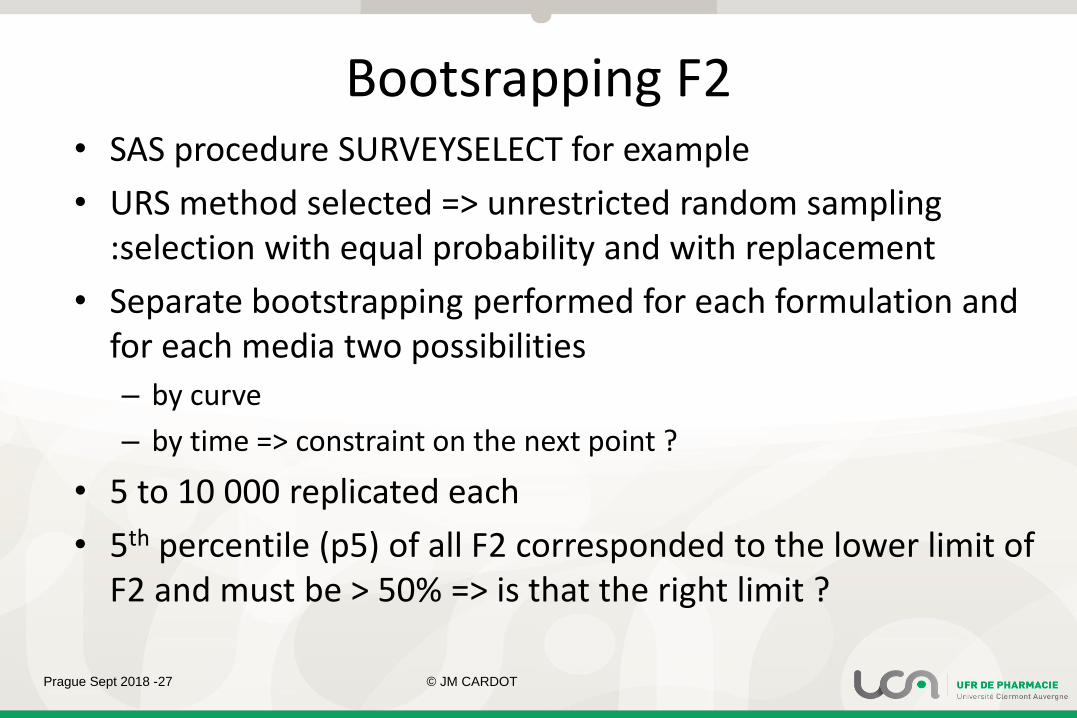
Bootsrapping F2• SAS procedure SURVEYSELECT for example
• URS method selected => unrestricted random sampling :selection with equal probability and with replacement
• Separate bootstrapping performed for each formulation and for each media two possibilities
– by curve
– by time => constraint on the next point ?
• 5 to 10 000 replicated each
• 5th percentile (p5) of all F2 corresponded to the lower limit of F2 and must be > 50% => is that the right limit ?
Prague Sept 2018 -28 © JM CARDOT
Bootstrapping and limits
• 50% is a preset limit like for classical F2
• 50% does not take into account the variability especially of the reference => could lead to inconsistent results
• Why not using limit corresponding to reference + or – 10 %?
Prague Sept 2018 -29 © JM CARDOT
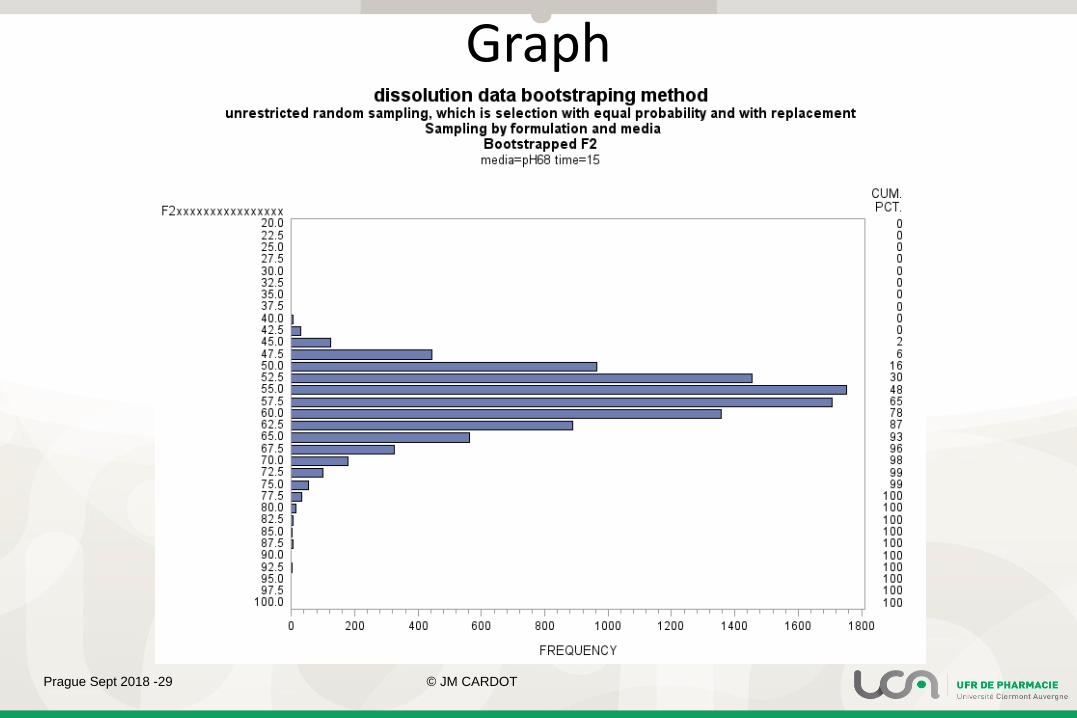
Graph

Prague Sept 2018 -30 © JM CARDOT
Example
Based on real data

Prague Sept 2018 -31 © JM CARDOT
Data
Mean CV Graph
Reference
time mean cv Flag10 52 43 >2015 65 420 74 430 86 5
Test
time mean cv Flag10 44 1115 57 920 71 830 81 11 >10

Prague Sept 2018 -32 © JM CARDOT
Initial F2
• F2 (1) test vs ref: 59%
• F2 (2) Ref vs Ref: 100 %
• F2 (3) ref vs Ref ± 10: 50 %
Prague Sept 2018 -33 © JM CARDOT
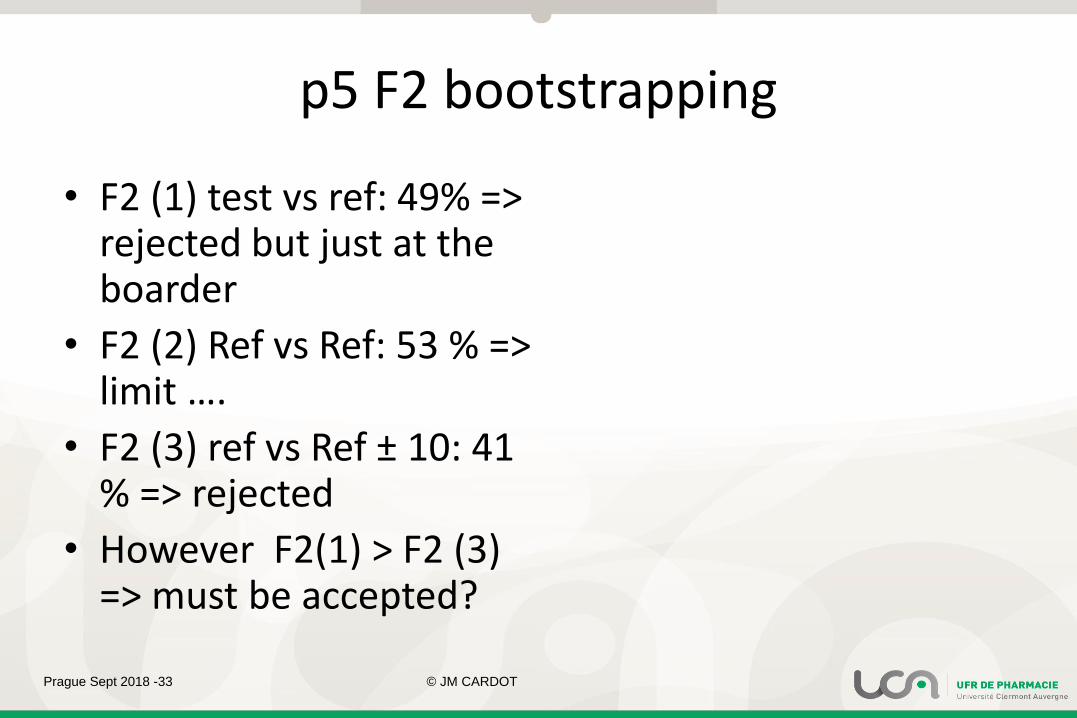
p5 F2 bootstrapping
• F2 (1) test vs ref: 49% => rejected but just at the boarder
• F2 (2) Ref vs Ref: 53 % => limit ….
• F2 (3) ref vs Ref ± 10: 41 % => rejected
• However F2(1) > F2 (3) => must be accepted?

Prague Sept 2018 -34 © JM CARDOT
MSD
• Results as follow: accepted
FromŽTo↓
limit ref test
limit #DIV/0! 0.94 1.00
ref 0.94 #DIV/0! 0.40
test 1.00 0.40 #DIV/0!

Prague Sept 2018 -35 © JM CARDOT
Conclusion

Prague Sept 2018 -36 © JM CARDOT
Variability
• As per guideline “In addition, the dissolution variability of the test and reference product data should also be similar however, a lower variability of the test product may be acceptable”
• What to do if variability are different between test and reference– If test is more variable than reference => not a good
batch but what is more?
– If reference is highly varaible?

Prague Sept 2018 -37 © JM CARDOT
Selection of alternative tests
• How to fix limits ?
– P5>50% for bootstrapping of F2 very conservative
– Use F2 vs ref ± 10%?
• Function of the test selected results could be different
• Neither bootstrapping of F2 nor MSD fulfill the criteria of an ideal test!

Prague Sept 2018 -38 © JM CARDOT
Post meeting note

Prague Sept 2018 -39 © JM CARDOT

Prague Sept 2018 -40 © JM CARDOT
Aim
Follow up of the statistical reflection paper presented last year
• Provide clarification about the suitability of the Mahalanobis distance (MD)
• Emphasize the importance of confidence intervals to quantify the uncertainty around the point estimate

Prague Sept 2018 -41 © JM CARDOT
MD: declared problems• MD is the multi-dimensional generalisation of the idea of
expressing the distance between two points using standard deviation as the unit of measurement.
• Under some assumptions, the MD becomes smaller, indicating similar dissolution profiles, with increasing variability observed in the data. This property makes its use undesirable for deciding upon similarity in dissolution
• Depending on the variability observed it is quite possible to have an observed difference of over 10% at some time point, yet MD-based criteria could declare the difference to be unimportant.
• Based on these considerations, the MD metric cannot be supported as a preferred methodological approach to decide upon similar dissolution

Prague Sept 2018 -42 © JM CARDOT
F2 bootstrapping declared advantages• Any approach based upon confidence intervals for f2
would, however, be considered appropriate whether the validity criteria outlined in CHMP guidance are met or not
• Similarity could then be declared if the confidence interval for f2 were entirely above 50.
• Properties of the f2 sampling distribution do not allow the derivation of exact confidence intervals
• To address this, bootstrap methodology could be used to derive confidence intervals for f2 based on quantiles of re-sampling distributions
• This approach could actually be considered the preferred method over f2 and MD.

Prague Sept 2018 -43 © JM CARDOT
Comments 1/4: higher risk to fail, limits• Variability must be similar for test and ref to declare 2 set of
data similar …”In addition, the dissolution variability of the test and reference product data should also be similar” ( BE guidance CPMP/EWP/QWP/1401/98 Rev. 1/ Corr **).
• In case of large variability of ref (or ref and test) booptstrapped F2 has all the chance to fail if comparing p5 to 50%. In BE guidance it is clearly specify “lower variability of the test product may be acceptable” => but large variability of ref will penalize the bootstrapped F2 results …..
• Still problem to see how to fix limit
Prague Sept 2018 -44 © JM CARDOT
Comments 2/4: strange wording
• whether the validity criteria outlined in CHMP guidance are met or not => ???
– CV only (my guess)
– number of points <3
– More than one point > 85%
• This approach could actually be considered the preferred method over f2 and MD.
– Classical f2 not recommended anymore even if possible?

Prague Sept 2018 -45 © JM CARDOT
Comment 4/4: Methodology
• Which type of bootstrapping: by curve, by point ?
• Do not forget to fulfill criteria for all of the bootstrap (or not ???)
• Which limit
• Etc…

Prague Sept 2018 -46 © JM CARDOT
Comment 4/4: ICH M9
• ICH M9 “In case the coefficient of variation is too high, f2 calculation is considered not accurate and reliable and a conclusion on similarity in dissolution cannot be made.”
• How to understand “This approach could actually be considered the preferred method over f2 and MD” when no alternative is given in ICH M9 ???

Prague Sept 2018 -47 © JM CARDOT
Conclusion
• When variability is high and mainly for reference all the chance to fail bootstrapping if limits at 50%
• Which validity criteria are mentioned
• Could a classical F2 be used when possible ?
=> that is a very restrictive approach if f2 limit could not be adjusted in case of high variability of ref ….
=> no real clarification of what to be done

Prague Sept 2018 -48 © JM CARDOT
Thank you
Questions ?
No => perfect ! ☺
Yes => I am ready to answer! … ☺