dissolved-oxygen regimen of the - usgs · dissolved-oxygen regimen of the willamette river, oregon,...
TRANSCRIPT


Dissolved-Oxygen Regimen of the
Willamette River, Oregon,
Under Conditions of Basinwide
Secondary Treatment
By Walter G. Hines, Stuart W. McKenzie,
David A. Rickert, and Frank A. Rinella
RIVER-QUALITY ASSESSMENT OF THE WlllAMETTE RIVER BASIN, OREGON
G E 0 l 0 G I C A l S U R V E Y C I R C U l A R 7 1 5-1
1977

United States Department of the Interior
THOMAS S. KLEPPE, Secretary
Geological Survey V. E. McKelvey, Director
Library of Congress Cataloging in Publication Data
Dissolved oxygen regimen of the Willamette River, Oregon, under conditions of basinwide secondary treatment.
(Geological Survey Circular 715-1) Bibliography: p. 137-138. 1. Water quality--Qregon-Willamette River. 2. Water-dissolved oxygen. I. Hines, Walter G. II. Series: United States. Geological Survey. Circular
715-I. QE75 .C5 no. 715-1 [TD224.07] 363.6'1 77-21419
Free on application to Branch of Distribution, U.S. Geological Survey,l200 South Eads Street, Arlington, VA 22202
FOREWORD
The American public has identified the enhancement and protection of river quality as an important national goal, and recent laws have given this commitment considerable force. As a consequence, a considerable investment has been made in the past few years to improve the quality of theN ation's rivers. Further improvements will require substantial expenditures and the consumption of large amounts of energy. For these reasons, it is important that alternative plans for river-quality management be scientifically assessed in terms of their relative ability to produce environmental benefits. To aid this endeavor, this circular series presents a case history of an intensive river-quality assessment in the Willamette River basin, Oregon.
The series examines approaches to and results of critical aspects of riverquality assessment. The first several circulars describe approaches for providing technically sound, timely information for river-basin planning and management. Specific topics include practical approaches to mathematical modeling, analysis of river hydrology, analysis of earth resources-river quality relations, and development of data-collection programs for assessing specific problems. The later circulars describe the application of approaches to existing or potential river-quality problems in the Willamette River basin. Specific topics include maintenance of high-level dissolved oxygen in the river, effects of reservoir release patterns on downstream river quality, algal growth potential, distribution of toxic metals, and the significance of erosion potential to proposed future land and water uses.
Each circular is the product of a study devoted to developing resource information for general use. The circulars are written to be informative and useful to informed laymen, resource planners, and resource scientists. This design stems from the recognition that the ultimate success of river-quality assessment depends on the clarity and utility of approaches and results as well as their basic scientific validity.
Individual circulars will be published in an alphabetical sequence in the Geological Survey Circular 715 series entitled "River-Quality Assessment of the Willamette River Basin, Oregon."
J. S. Cragwall, Jr. Chief Hydrologist
III

Cover: Willamette River as it winds through Portland, Oregon. Photograph taken by Hugh Ackroyd.

CONTENTS
Page
Abstract---------------------------------------------------------------------------------------- 11 Introduction ---------------------·------------·----------·------------·--------------------- 1
Purpose and scope ----------------------------------·------------·---------- 3 Physical setting ---·------------·------------·-----------------------·---------- 3 Precipitation -----------------------------------·-----------------------·---------- 4 Streamflow -------------·------------ ·-----------------------·----------·-------- __ 4 Water temperature -----------------------·------------·----------·---------- 5 Channel morphology ________ ·----------·------------ ·------------------- __ 7
Upstream Reach --------·----------·------------·--------------------- 7 "Newberg Pool" ----------·----------·------------·------------·-------- 7 Tidal Reach ------------------·-----------------------·------------·-------- 7
Design of the study program ---------------·---------------------·---·------ 8 Initial hypotheses and assumptions -------------------·------ 8 Selection of study reaches and sampling sites ______ 9 Importance of hydrologic stability ______________________________ 10
Methods and procedures ------------·------------·------------·----------·------ 11 DO-BOD studies-------·------------·------------·------------·----------·------ 15 Nonpoint-source BOD study-----------·------------·----------·------ 18 Nitrification study ---·-------------------------·------------·----------------- 18
Results ---------·------------·-------------------------·----------·------------·------------·---- 18 BOD loading --·------------·-----------------------·-------------------------·---- 18
Point-source BOD loads ·-----------------------·------------·---- 19 Nonpoint-source BOD loads -----------------------------·---- 20
BOD concentrations and rates in Willamette River-----·------------·------------·-----------------------·---- 20
Anomalously high BOD in the Tidal Reach -----·---- 21 Nitrification ----·------------·------------·------------·-----------------------·---- 24
Nitrogen loading-·------------·------------·-----------------------·---- 24 Nitrogen concentrations in
Willamette River-----------------------·------------·--------------- 24 Nitrifying bacteria ____________ ·----------·-- ----------·------------ ·-- 24
Photosynthesis and respiration ------------------ ------------·-- 26
Page
Results-Continued Atmosphere reaeration ________ ·----------------------- ·------------ ·-- 127 River-dissolved oxygen --·-----·------------·----------·------------·---- 29
Independent check of the DO data -------------------- 30 DO variations at individual sites ---------------------- 30 Synoptic DO profile --------·-----------------------·------------·-- 30
Discussion -----·-----------------------·------------·------------·-----------------------·-- 30 Hypothetical boat trip ------------·------------·-----------------------·-- 31
RM 185 to 120 ---------·----------·------------·-------------------------- 31 RM 120 to 50 -----------·-----------------------·------------·------------· 31 RM 50 to 10 -------------·------------------------------------·------------- 32 RM 10 to 1.5 -----------·------------·-----------------------·------------· 32
Historical perspective ---·----------·------------·-----------------------· 32 Conclusions -----·------------·------------·-----------------------·------------·----------- 35 Acknowledgments ------·------------·-----------------------·------------------------ 37 Selected references ----·------------·------------·-----------------------·----------- 37 Supplement A-River self-purification processes ________ 40
Carbonaceous deoxygenation --·------------·---------------------- 40 Benthal oxygen demand -·-----------------------·---------------------- 41 Nitrification ----------·------------·------------·-----------------------·--------- 42 Photosynthesis and respiration ·-----------------------·--------- 42 Atmospheric reaeration -·---·--------·-----------------------·--------- 42
Supplement B-Field calibration of dissolved-oxygen meters -------------------------------·-------------------- 43
Supplement C-Analysis of BOD -----------------·------------·------- 44 Dilution water , --------·--------·---·------------·----------·------------·------- 44 Inhibition of nitrification -·------------·----------·------------·------- 44 Calibration ---·------------·----------·------------·------------------------------- 44 Measurement of DO in BOD bottles ---·-·-·----------·----- 45 Lee's graphical method -·-----·-----------------------·------------·----- 45
Supplement D-Special BOD experiments -·------------·----- 46 Supplement E-Detailed river DO and water
temperature data ------------·----------·------------·----------------------------- 49
ILLUSTRATIONS
Page
FIGURE 1. Map of Willamette River basin, showing location of river miles on main-stem Willamette River -----·---------- 12 2. Graphs showing typical precipitation patterns at various locations, Willamette River basin -------------·---------- 5 3. Hydrographs showing Willamette River discharge at Salem, Oreg., 1944, 1964, and
1973 water years ------------·------------·----------·------------·------------·------------·------------·------------·-------------------------·-----------------------·---------- 6 4. Graphs showing mean monthly and maximum and minimum daily water temperatures for the
North Santiam, Willamette, and South Yamhill Rivers-·-------------~----------·------------·------------·------------·--------------------- 9 5. Graph showing maximum, mean, and minimum water temperature profiles for July,
Willamette River ------------·------------·------------·-------------------------------------------------·------------·-------------------------·------------·------------·-------- 10 6. Map and graph showing Willamette River-distinctive morphological reaches and elevation profile________ 11 7. Typical channel cross-sections of the Willamette River at concurrent low-flow conditions______________________________ 12 8. Graph showing cumulative time of travel for various low flows, Willamette River-----------------------------------·-------- 13 9. Map of the lower Willamette River system ---------·------------·------------·------------·------------·------------·------------·-----------------------·-------- 14
10. Hydrographs showing streamflow of Willamette River at Salem for 1973 and 1974 summer periods -----,-- 16 11. Photograph of aerated lagoon used for treatment of pulp and paper mill waste waters -·------------·------------------- 17
v

Page
FIGURE 12. Graph showing comparison of measured and calculated BODult loads in the Willamette River during August 1974 low-flow conditions---------------------------------------------------------------------------------------------------------------------- I21
13. Graph showing longitudinal and vertical turbidity patterns in the Tidal Reach, -Willamette River, August 16, 1974 -------------------------------------------------------------------------------------------------------------------------------- 25
14. Graph showing inorganic nitrogen concentration in the Willamette River during August 12-14, 1974 ______ 25 15. Graphs showing summertime (low-flow condition) diel DO curves at various sites on Willamette River
and tributaries, 1929 and 1973 -------------------------------------------------------------------------------------------------------------------------------------- 28 16. Graph showing calculated reaeration coefficients (k1) for various sites in the Willamette River
using four different reaeration prediction methods ------------------------------------------------------------------------------------------------ 29 17. Graph showing dissolved-oxygen concentrations measured in the Willamette River by U.S. Geological
Survey and DEQ during 1973 summer low-flow period, July 5 to August 18------------------------------------------------ 31 18. Graph showing dissolved-oxygen concentrations measured in the Willamette River by U.S. Geological
Survey and DEQ during 1974 summer low-flow period, August 1-15 -------------------------------------------------------------- 32 19. Graph showing diel dissolved oxygen and water temperature curves, Willamette River at
Harrisburg (RM 161), August 7-9, 1973 ......... --------------------------------------------------------------------------------------------------------------- 33 20. Graph showing diel dissolved-oxygen curves at four sites in the Tidal Reach Willamette River,
July 24-26, 1973 -------------------------------------------------------------------------------------------------------------------------------------------------------------------- 34 21. Graph showing composite DO profile of the Willamette River under 1973 steady low-flow conditions ______ 35 22. Graph showing comparison of 1973 with historical DO conditions in the Willamette River for the
summer low-flow period ------------------------------------------------------------------------------------------------------------------------·--------------------------- 36 23. Graph showing historical average daily BOD loads to the Willamette River during dry weather periods 24. Example of Lee's graphical method for analyzing k1 and BODult, Willamette River, RM 86.5 ---------------------- 46 25. Example of Lee's graphical method for analyzing k1 and BODult• McKenzie River ------------------------------------------ 47 26. Example of Lee's graphical method for analyzing k1 and BODult• pulp and paper effluent---------------------------- 48 27. Graph showing dissolved-oxygen concentration in the Willamette River and major tributaries
between RM 185 and 86.5, August 6-12, 1973 ----------------------------------------------------------------------------------------------------------- 49 28. Graph showing dissolved-oxygen concentration in the Willamette River between RM 86.5 and 28.6,
August 15-17, 1973 ------------------------------------------------------------------------------------------------------------------------------------------------------------- 50 29. Graph showing dissolved-oxygen concentration in the Willamette River between RM 28.6 and 1.5,
July 24-26, 1973 ------------------------------------------------------------------------------------------------------------------------------------------------------------------- 51 30. Graph showing observed dissolved-oxygen concentration in the Willamette River between
RM 86.5 and 6.0, August 6-7, 1974 ------------------------------------------------------------------------------------------------------------------------------- 52
TABLES
Page
TABLE 1. Selected characteristics of major reservoirs, Willamette River basin, Oregon------------------------------------------------------ I7 2. Lowest daily discharge for 7, 14, and 30 consecutive days in year ending March 31 for
Willamette River at Salem, 1910-70 ------------------------------------------------------------------------------------------------------------------------------ 8 3. Selected physical characteristics of the main stem Willamette River ---------------------------------------------------------------------- 13 4. Summary of studies of the Willamette River conducted during 1973 and 1974 ---------------------------------------------------- 15 5. BODult loading to the Willamette River from individual outfalls and tributary watersheds -------------------------- 19 6. Reach-by-reach summary of point and nonpoint BODult loading to the Willamette River for
summer low-flow conditions -------------------------------------------------------------------------------------------------------------------------------------------- 19 7. BODult concentrations and BOD bottle deoxygenation rates for samples of Willamette River
during summer low-flow periods, 1973 and 1974------------------------------------------------------------------------------------------------------ 21 8. Inorganic nitrogen loading to the main stem Willamette River during summer 1973-74 conditions __________ 25 9. Counts of Nitrosomonas and Nitrobacter bacteria in river water and on rock slimes,
Willamette River August 12-14, 197 4 __________________ --------------------------- _____________________ .. ·------------------------- ________ ---------------------- 26 10. Estimated primary production at various sites in the Willamette River during summers of 1973
and 1974 ---------------------------------------------------------------------------------------------------------------------------------------------------------------------------------- 27
VI

SYMBOLS
[See Supplement A for definitions and further discussion of many of the terms listed here]
BOD-biochemical oxygen demand BODuu-ultimate BOD BODs-5-day BOD at 20°C BOD2o -20-day BOD at 20°C K1 -carbonaceous deoxygenation rate (loge) as measured in
BOD bottle at 20°C k1-carbonaceous deoxygenation rate (log10) as measured
in BOD bottle at 20°C kr -river carbonaceous deoxygenation rate (log10),
adjusted to 20°C Kn-nitrogenous deoxygenation rate (loge) in river,
adjusted to 20°C
kn-nitrogenous deoxygenation rate (logw) in river, adjusted to 20°C
K2-reaeration coefficient (loge) k2 -reaeration coefficient (logw) n-number of samples PE-BOD population equivalent=0.24 lb/day BODult
(0.11 kg/day BODult) Q-stream discharge RM-river mile T -water temperature
CONVERSION FACTORS
Factors for converting English units to the International System of Units (SI) are given below to four significant figures. However, in the text the metric equivalents ' are shown only to the number of significant figures consistent with the values for the English units.
English Multiply by- Metric (Sf)
ft (feet) 3.048xl0-1 m (meters)
ft3/s (cubic feet per second) 2.832xl0-2 m3/s (cubic meters per second)
in. (inches) 2.540 em (centimeters) 2.540xl0-1 mm (millimeters)
in.2 (square inches) 6.452 cm2 (square centimeters)
lb (pounds) 4.535xl0-1 kg (kilograms)
mi (miles) 1.609 km (kilometers)
mi2 (square miles) 2.590 km2 (square kilometers)
VII

Dissolved-Oxygen Regimen of the Willamette River, Oregon,
Under Conditions of Basinwide Secondary Treatment
By Walter G. Hines, Stuart W. McKenzie,
David A. Rickert, and Frank A. Rinella
ABSTRACT
For nearly half a century the Willamette River experienced severe dissolved-oxygen problems related to large loads of organically rich waste waters from industries and municipalities. Since the mid-1950's dissolved-oxygen quality has gradually improved owing to low-flow augmentation, the achievement of basinwide secondary treatment, and the use of other waste-management practices. As a result, summer dissolved-oxygen levels have increased, salmon runs have returned, and the overall effort is widely regarded as a singular water-quality success.
To document the improved dissolved-oxygen regimen, the U.S. Geological Survey conducted intensive studies of the Willamette during the summer low-flow seasons of1973 and 1974. During each summer the mean daily dissolved-oxygen levels were found to be higher than 5 milligrams per liter throughout the river. Because of the basinwide secondary tr~atment, carbonaceous deoxygenation rates were low (kr=0.02 to 0.06, log10). In addition, almost half of the biochemical oxygen demand entering the Willamette was from diffuse (nonpoint) sources rather than outfalls. These results indicated that point-source biochemical oxygen demand was no longer the primary cause of dissolvedoxygen depletion. Instead, them.ajor causes of deoxygenation were nitrification in a shallow "surface active" reach below Salem and an anomalous oxygen demand (believed to be primarily of benthal origin) in Portland Harbor.
INTRODUCTION
Historically, the Willamette River (fig. 1) has experienced severe river-quality problems due primarily to large loads of organic waste waters from pulp and paper industries and municipalities (Gleeson, 1972). During summers, critically low and in some cases zero dissolved oxygen (DO) concentrations drastically affected fish migration, esthetics, recreation, and other water uses. High fecal bacteria concentrations, floating and benthic sludge, sulfur odors, and infestations of the "sewage fungus" Sphaerotilus prevailed.
With the gradual introduction of basinwide
11
secondary waste-water treatment, chemical recovery processes by the pulp and paper industries, rerouting of Portland's dry-weather combined sewer overflows to a new waste-water treatment plant on the Columbia River, and increased low-flow augmentation, the Willamette River has recently shown a marked improvement in quality. Dissolved-oxygen concentrations have risen dramatically, and migratory salmon runs and water-contact recreation have returned. The Willamette is now described as an outstanding water-quality success story (Starbird, 1972).
Dissolved oxygen-biochemical oxygen demand (BOD) relations in the Willamette River have been studied for nearly half a century. Rogers, Mockmore, and Adams (1930) conducted a DO study that was remarkable considering the state of knowledge, sampling equipment, and analytical methods available at that time. From a series of synoptic surveys, Gleeson (1936) analyzed DO-BOD relations in the hydraulically complex Tidal Reach of the Willamette. (See fig. 9.) On the basis of intensive sampling during the summer-fall low-flow season, Velz (1951, 1961) made detailed DO mass-balance calculations and developed a model for estimating the response of DO concentrations to changes in waste load, streamflow, and water temperature. Throughout the 1920-75 period local and State agencies and industries sponsored river and waste-water sampling. Presently (1977), the Oregon Department of Environmental Quality (DEQ) operates a water-quality surveillance network (primarily discrete grab sampling) on the entire 187-mi (301 km) main stem of the Willamette.
Despite the recent improvement in the quality of the river, there is continuing environmental

w
tn <( 0 u
II
INDEX MAP OF OREGON
0 10 20 MILES t-1 --,-1 ----~.1--rj ----rlj I 0 10 20 30 KILOMETERS
w 0 <( u Cl) <( u
FIGURE 1.-Willamette River basin, showing location of river miles on main-stem Willamette River.
12

interest in the Willamette River. Locally, citizens, industries, and environmental regulatory agencies are concerned with the maintenance of good river quality in the face of rapid basin development. Nationally, engineers, scientists, environmental planners, and Federal resource agencies are interested in the documentation of factors responsible for the Willamette "clean up" as guidance for riverquality planning in other basins. Because of the unique situation of complete secondary wastewater treatment (for dry weather conditions) in the basin, the question of the future need for expensive, energy-consumptive tertiary treatment is of interest both locally and nationally.
PURPOSE AND SCOPE
The major intent of this circular is to provide the data base and interpretive insight necessary- for the understanding, explanation, and quantitative description of the DO regimen of the Willamette River. More specifically, the report is intended to (1) describe the DO regimen of the Willamette through detailed examination of five river self-purification processes, (2) document the reasons for the recently improved DO conditions, (3) discuss the nature of waste-water and river-water BOD under the unique conditions of basinwide secondary treatment, and (4) present concepts and methods useful for studies of large river systems such as the Willamette.
The data, analyses, and discussion presented here were denved partly from an examination of historical hydrologic and water-quality data, but most importantly from a series of synoptic field and laboratory studies made during 1973 and 1974. Originally, it was our intent in this paper to describe the cause-effect relations that control DO in the Willamette without resorting to a mathematical model. However, in order to sufficiently define the impacts of benthal oxygen demand, photosynthesis, and atmospheric reaeration, it was necessary to make several rough DO mass-balance calculations. These calculations were made by using a preliminary version of the Willamette Intensive River Quality Assessment Study (WIRQAS) DO model (Rickert and others, 1975). The full development and testing of the WIRQAS model will be described in Circular 715-J. Moreover,
Circular 715-K will describe application of the verified model for predicting the impacts of alternative planning proposals on the Willamette's DO condition.
The first section of the paper provides an overview of the physiography and hydrology of the Willamette basin. The overview serves as background for a detailed description of the streamflow, water temperature, and channel morphology characteristics of the main -stem Willamette River. The next section deals with the design and rationale of the synoptic study program. This is followed by a discussion of laboratory and field techniques employed in the studies. The "Results" section provides a graphically oriented summary of the data collected during the synoptic studies. The section is partitioned so as to allow a step-bystep examination of each of the five classically recognized self-purification processes: carbonaceous deoxygenation, benthal oxygen demand, nitrification, plant photosynthesisrespiration, and atmospheric reaeration. The interpretive "Discussion" section includes both a present-day and historical overview of the Willamette River DO regimen. The overviews are developed by taking a hypothetical boat trip down the 187-mile main stem of the river and by comparison of 1973 DO profiles with historical profiles. The "Conclusions" section briefly describes the major findings and implications of the study.
Because of the length and scope of the paper, those interested primarily in findings and implications may wish, at least initially, to forego much of the detailed technical discussion and to concentrate on the "Discussion" and "Conclusions" sections. For the more technically oriented reader, the report includes several supplements. The supplements serve to summarize the field and laboratory data and methods and to present background discussion on the quantification of river self-purification processes.
13
PHYSICAL SETTING
The Willamette River drains an 11,460 mi2
(29,800 km2) area in northwestern Oregon (fig. 1). The basin is bounded on the north by the Columbia River, on the south by the Calapooya

Mountains, and on the east and west by the Cascade and Coast Ranges. Within the basin are the State's three largest cities, Portland, Salem, and Eugene, and approximately 1.4 million people (1970 census), representing 70 percent of the State's population. The basin supports an important timber, agricultural, industrial, and recreational economy and an extensive fish and wildlife habitat. Two-thirds of the land is forested. Timbering is centered primarily in the Cascade Range, with lesser activity in the Coast Range. The middle part of the basin is occupied by the 3,500-mi2 (9,050 km2) Willamette Valley. The valley is covered with farmlands that produce large crops of grass seed, vegetables, berries, hops, mint, and turkeys. Almost all of the limited agricultural irrigation is by sprinklers, and virtually no irrigation return flow directly reaches the Willamette River or its tributaries.
The main stem of the Willamette flows northward for 187 mi (300 km) through the Willamette Valley from a point near Eugene to its confluence with the Columbia at Portland. The 135-mi (217 km) reach of the river between Eugene and a point just south of Newberg has a shallow, meandering alluvial channel. Through the next 25.5 mi (41.0 km) the Willamette flows within well-defined banks in a deep, slowmoving reach known as the "Newberg Pool." Near Oregon City, the river flows over a basaltic sill which creates the 50-ft (15 m) high Willamette Falls. The 26.5 mi ( 42.6 km) reach below the falls is subject to nonsaline tidal effects transmitted from the Pacific via the Columbia River.
PRECIPITATION
The Willamette Basin has a modified marine climate characterized by wet, cloudy winters and clear, dry summers. Daily average temperatures range from 35°F (1. 7°C) to 83°F (28°C) on the valley floor and from 20°F (-6.7°C) to 75°F (24°C) at the crest of the Cascade Range (Willamette Basin Task Force, 1969, p. 11-10).
Seventy percent of the annual precipitation occurs from November through March, only about 5 percent from June through August. In some years, no precipitation falls for 30-60 days or more during the summer and early fall. These seasonal dry periods have a great impact on the
I4
summer-fall streamflow and quality of the Willamette.
In the Willamette Valley most of the precipitation occurs as rain. However, as elevation increases, snowfall makes up an increasingly larger percentage of annual precipitation, particularly in the rugged terrain above 3,000 ft in the Cascade Range. (Only a few peaks reach this elevation in the Coast Range.) The heavy winter snowpack, coupled with the excellent water-storage and yield characteristics of the volcanic rocks, provide the Cascade tributaries, and thus the Willamette, with unusually high summer baseflows (Velz, 1951, p. 25).
Mean annual precipitation for the Willamette Basin is 63 in. (1,600 mm), but large variations occur owing to elevation and topography. The Willamette Valley floor usually receives about 40 in. (1,020 mm) per year, whereas several locations on the west slope of the Cascade Range receive more than 130 in. (3,330 mm) per year. Typical precipitation patterns are shown in figure 2.
STREAMFLOW
Most of the streamflow conveyed by the Willamette occurs in the November to March period as a result of persistent winter rainstorms and spring snowmelt. Post-March snowmelt in the High Cascades (above 5,000 ft or 1,500 m) tends to prolong the runoff season into June or early July.
The seasonal flow patterns of the river are illustrated by the hydrographs in figure 3. The 1944 hydrograph is typical of natural runoff patterns prior to large-scale reservoir regulation, whereas the 1964 and 1973 hydrographs reflect postregulation patterns.
As summarized in table 1, streamflow regulation began with construction and operation of three reservoirs (in the period 1941-49) on tributaries in the Coast Range and Calapooya Mountains. However, it was not until after water year 1952 (after construction of Detroit and Lookout Point reservoirs on Cascade Range tributaries) that reservoir regulation had a significant impact on low-flow patterns of the main-stem Willamette. A review of post 1952 low-flow duration data (table 2) shows that reservoir releases have greatly augmented flows during the summer-fall period.

45
40
C/) 35 w I (.)
z ; 30
z 0 i= 25 <t: I-D..
(.)
~ 2D D..
>...J I 1- 15 z 0 :!!
10
5
Valsitz, crest of Coast Range
EXPLANATION
BMaximun
Average
Minimum
1000
C/) a:: LLI 1-w :!! ...J ...J
750 :!!
~ z 0 1-<t: 1-
500 D.. (.) w a: D..
>...J I 1-z 0
250 :!!
15
10
5
C/) w
200
C/)
a: w 1-w
5ol--..----r----.----r===t----r~.--,...---F=;---r--+-O :!! ...J ...J z
~ z 0 i= 25 <t: 1-a:: (3
~ 20 D..
>...J I 1- 15 z 0 :!!
10
5
Three Lynx, Lower Cascade Range z 0 1-<t: I-D..
(.) 500 w
a:
250
D..
>...J I 1-z 0 :!!
FIGURE 2.-Typical precipitation patterns at various locations, Willamette River basin. Precipitation at Three Lynx station is not representative of that in higher Cascades which is similar to that shown for Valsitz. (Adapted from Willamette Basin Task Force, Appendix B, 1969, p. 11-15.)
(All of the 7-, 14-, and 30-day low flows in table 2 occurred during the July-October low-flow period.) Prior to 1953, the average annual consecutive 30-day low flow was 3,670 ft3 Is (103 m 3/s) and ranged from 2,570 to 5,020 ft3/s (72.8 to 142 m 3/s). Between 1953 and 1970 the average consecutive 30-day low flow was 6,010 ft3/s (170 m 3/s) and ranged from 5,290 to 7,400 ft3/s (150 to 210 m 3/s).
Analysis of streamflow data from tributaries shows that Cascade tributaries (Clackamas, Santiam, McKenzie, and Middle Fork Willamette Rivers) contribute the major part of the annual streamflow in the Willamette, and more than 95 percent during the dry summer-fall months (Willamette Basin Task Force, Appendix B, 1969).
WATER TEMPERATURE
Water temperatures in the Willamette and all
15
major tributaries reach a maximum during the July-August period (fig. 4), coinciding with the onset of low-flow conditions. During this period there is a tendency for increasing water temperature in the downstream direction despite the cooling effects of the McKenzie, Santiam, and Clackamas Rivers (fig. 5). The reach above RM 120 often has cooler water temperatures than naturally expected because of the release of cool bottom waters from the Lookout Point-Dexter Reservoir complex on the Middle Fork of the Willamette River (fig. 1). Reservoirs on the other tributaries are far enough from the Willamette to allow cool release flows to reach ambient temperature before confluence with the main stem Willamette. Thus, except in the reach above RM 120 (and expecially above RM 172) reservoir regulation has little effect on summer water temperature of the Willamette.

100,000
1000
10,000
100
1000
0
0 100,000 z 0 z u
0 w u IJ) w a: IJ) w a:: 0.. w
1000 IJ)
0.. a: I- w w I-w w ~ ~ u u ll) 10,000 ll) ::::> ::::> u u ~ z w·
w· c.::> a: 100 c.::> <{ a: ::c <{ u ::c IJ) u 0 IJ)
0 1000
100,000
1000
10,000
100
FIGURE 3.-Willamette River discharge at Salem, Oreg., 1944, 1964, and 1973 water years. Note the recurrent nature or the July, August, and September low-flow periods even after large-scale streamflow regulation began in 1953.
16
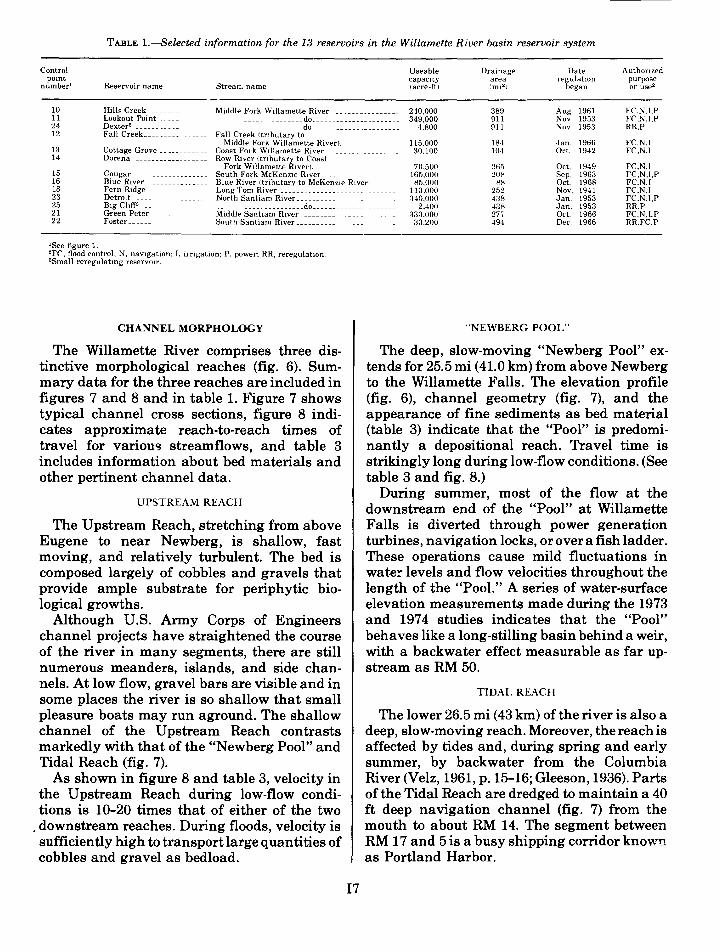
TABLE 1.-Selected information for the 13 reservoirs in the Willamette River basin reservoir system
Control pomt
number' Reservoir name Strear.. name
Useable capacity lacre-ftl
Dram age area lmi 2 1
Date Authonzed regulatwn purpose
began or use2
10 11 24 12
Hills Creek ____________ __ Middle Fork Willamette River ______________ 240,000 389 Aug. 1961 FC,N,I,P Lookout Point ___________ _ ------------ ________ do_ ___________ 349,000 911 Nov. 1953 FC,N,I,P Dexter3 _________________ _ ______________________ do_ 4,800 911 Nov 1953 RR,P Fall Creek _____________ __ Fall Creek ltnbutarv to
Middle Fork Wilhimette River!. 115,000 184 Jan 1966 FC,N,I 13 14
Cottage Grove __________ __ Coast Fork Willamette River_________________ 30,100 104 Oct. 1942 FC,N,I Dorena ________________ -- Row River !tributary to Coast
Fork Willamette River!. 70,500 265 Oct. 1949 FC,N,I 15 16 18 23 25 21 22
Cougar ________________ __ South Fork McKenzie River __ __ __ __ __ _ _ __ __ __ 165,000 208 Sep 1963 FC,N,I,P 88 Oct. 1968 FC,N,I Blue River ltnbutarv to McKenzie River/ ______ 85,000
Long Tom River __ _-__ __ __ __ __ __ __ __ _ _ __ _ _ __ __ 110.000 Blue River ____________ _ Fern Ridge ____________ __ 252 Nov 1941 FC.N,I Detroit _________________ _ North Santiam River__________ ______ 340,000 438 Jan. 1953 FC,N,I,P Big Cliff' ______________ __ ______________________ do__________ 2.400 438 Jan. 1953 RR,P Green Peter _____________ _ Middle Santiam River __ __ _ 333,000 277 Oct. 1966 FC,N,I,P Foster ________ _ South Santiam River_______ ____________ 33,200 494 Dec 1966 RR.FC,P
'See figure 1. 2 FC, flood control; N, navigation; I, Irrigation; P, power; RR, reregulatwn. 3 Small reregulating reservoir.
CHANNEL MORPHOLOGY
The Willamette River comprises three distinctive morphological reaches (fig. 6). Summary data for the three reaches are included in figures 7 and 8 and in table 1. Figure 7 shows typical channel cross sections, figure 8 indicates approximate reach-to-reach times of travel for variou'3 streamflows, and table 3 includes information about bed materials and other pertinent channel data.
UPSTREAM REACH
The Upstream Reach, stretching from above Eugene to near Newberg, is shallow, fast moving, and relatively turbulent. The bed is composed largely of cobbles and gravels that provide ample substrate for periphytic biological growths.
Although U.S. Army Corps of Engineers channel projects have straightened the course of the river in many segments, there are still numerous meanders, islands, and side channels. At low flow, gravel bars are visible and in some places the river is so shallow that small pleasure boats may run aground. The shallow channel of the Upstream Reach contrasts markedly with that of the "Newberg Pool" and Tidal Reach (fig. 7).
As shown in figure 8 and table 3, velocity in the Upstream Reach during low-flow conditions is 10-20 times that of either of the two
. downstream reaches. During floods, velocity is sufficiently high to transport large quantities of cobbles and gravel as bedload.
17
"NEWBERG POOL"
The deep, slow-moving "Newberg Pool" extends for 25.5mi (41.0 km) from above Newberg to the Willamette Falls. The elevation profile (fig. 6), channel geometry (fig. 7), and the appearance of fine sediments as bed rna terial (table 3) indicate that the "Pool" is predominantly a depositional reach. Travel time is strikingly long during low-flow conditions. (See table 3 and fig. 8.)
During summer, most of the flow at the downstream end of the "Pool" at Willamette Falls is diverted through power generation turbines, navigation locks, oroverafishladder. These operations cause mild fluctuations in wate!" levels and flow velocities throughout the length of the "Pool." A series of water-surface elevation measurements made during the 1973 and 1974 studies indicates that the "Pool" behaves like a long -stilling basin behind a weir, with a backwater effect measurable as far upstream as RM 50.
TIDAL REACH
The lower 26.5 mi ( 43 km) of the river is also a deep, slow-moving reach. Moreover, the reach is affected by tides and, during spring and early summer, by backwater from the Columbia River (Velz, 1961, p. 15-16; Gleeson, 1936). Parts of the Tidal Reach are dredged to maintain a 40 ft deep navigation channel (fig. 7) from the mouth to about RM 14. The segment between RM 17 and 5 is a busy shipping corridor known as Portland Harbor.

TABLE 2.-Lowest daily discharge for 7, 14, and 30 consecutive days in year ending March 31 for Willamette River at Salem, Oreg., 1910-701
Lowest da1ly discharge in cubic feet per second
Year 7 days 14 days 30 days
Period of minor low-flow regulation
1910 ---------------- 3,750 3,780 3,850 1911 ---------------- 3,750 3,800 4,050 1912 ---------------- 4,570 4,750 5,020 1913 ---------------- 4,240 4,360 4,840 1914 ---------------- 3,510 3,540 3,640 1915 ---------------- 3,420 3,480 3,500 --------------------
1923 ---------------- 3,920 3,980 1924 ---------------- 2,990 3,070
1925 ---------------- 3,020 3,070 1926 ---------------- 3,130 3,140 1927 ---------------- 3,730 3,730 1928 ---------------- 3,400 3,500 1929 ---------------- 3,190 3,190
1930 ---------------- 2,860 2,860 1931 ---------------- 2,520 2,580 1932 ---------------- 3,170 3,170 1933 ---------------- 3,750 4,020 1934 ---------------- 2,830 2,860
1935 ---------------- 3,140 3,220 1936 ---------------- 3,080 3,090 1937 ---------------- 3,800 4,000 1938 ---------------- 3,250 3,270 1939 ---------------- 2,940 3,060
1940 ---------------- 2,520 2,520 1941 ---------------- 3,140 3,210 1942 ---------------- 2,980 3,160 1943 ---------------- 4,200 4,300 1944 ---------------- 2,750 2,830
1945 ---------------- 3,170 3,300 1946 ---------------- 3,650 3,770 1947 ---------------- 3,800 3,940 1948 ---------------- 4,400 4,670 1949 ---------------- 3,670 3,730
1950 ---------------- 4,100 4,260 1951 ---------------- 4,080 4,200 1952 ---------------- 3,560 3,750
Period of major low-flow regulation
1953 ---------------- 5,320 1954 ---------------- 6,160
1955 ---------------- 6,160 1956 ---------------- 5,950 1957 ---------------- 5,380 1958 ---------------- 5,680 1959 ---------------- 5,410 1960 ---------------- 5,510 1961 ---------------- 5,780 1962 ---------------- 5,740 1963 ---------------- 5,490 1964 ---------------- 6,470 1965 ---------------- 5,360 1966 ---------------- 5,030 1967 ---------------- 5,340 1968 ---------------- 5,840 1969 ---------------- 6,940 1970 ---------------- 6,610
5,430 6,290
6,160 6,000 5,440 5,720 5,440 5,580 5,800 5,880 5,650 6,640 5,400 5,130 5,340 5,870 7,360 6,610
4,210 3,160 3,220 3,190 3,860 3,560 3,240 2,920 2,640 3,170 4,360 2,900 3,350 3,130 4,110 3,410 3,170 2,570 3,390 3,220 4,360 2,880 3,390 3,830 4,310 4,880 3,880 4,610 4,360 3,980
5,770 6,560
6,280 6,150 5,670 5,830 5,460 5,680 5,840 6,090 5,790 6,740 5,460 5,290 5,420 5,950 7,400 6,770
'For example, the 1930 data are from Apnl 1, 1929, to March 31, 1930.
During summer low-flow conditions, water in the Tidal Reach moves very slowly downstream, although tidal effects cause periodic flow reversals and local eddy currents. Hydrau-
18
lies are most complex in the lower IO mi (I6 km) where, depending on tide- and river-stage conditions, Columbia River water may move upstream and intermix with Willamette water. (During I973-74 studies we found Columbia water as far upstream as RM 6. (See fig. 9)) The downstream movement of intermixed water can be either through the lower several miles of the Willamette and out the mouth, or through Multnomah Channel. Particularly during late summer, Columbia River water has a higher concentration of dissolved solids (typically I20 mg/l as opposed to the Willamette's 80 mg/l) and is commonly several degrees cooler than Willamette River water. Columbia water is, therefore, denser than Willamette water and for the first several miles can move upstream as a distinct bottom wedge.
DESIGN OF THE STUDY PROGRAM
Design of the study program was based on the fundamental philosophy (Hines and others, I975, I976) that explanation and understanding of river-quality phenomena are best developed through repetitive, synoptic studies rather than year-round monitoring data. The program included three major elements: (I) a reconnaissance study including preliminary river sampling, review of existing data, and development of hypotheses concerning the relative roles, importance, and interactions of self-purification processes and hydrologic factors; (2) intensive field and laboratory studies; and (3) data analysis to test the hypotheses.
INITIAL HYPOTHESES AND ASSUMPTIONS
Based on reconnaissance work (Rickert and others, 1976) during the period January to June I973, four major hypotheses had been developed concerning the DO regimen of the Willamette River. Each hypothesis was either refuted or substantiated by later findings of the study.
(I) Carbonaceous deoxygenation is the primary process affecting DO depletion in the Willamette River (refuted).
(2) Photosynthesis and plant respiration. have little impact on the day-to-day average DO concentration of the river (substantiated).
(3) Nitrification is not a significant oxygendemanding process in the river (refuted).
(4) Benthal oxygen demand is no longer a

North Santiam River at Niagara
Willamette River at Salem
South Yamhill River near Willamina
Maximum 25
(I)
=> Ci) ..J w (.) 20 Cl) w w a: (!) w 0
~ 15
w' a: ::> 1-<t:
10 a: w Q.
::!: w 1-
5
0
JFMAMJJASOND JFMAMJJASOND JFMAMJJASON
FIGURE 4.-Mean monthly and maximum and minimum daily water temperatures for the North Santiam, Willamette, and South Yamhill Rivers. (Adapted from Willamette Basin Task Force, Appendix B, 1969.)
significant oxygen-demanding process in the river (substantiated except for lower segment of Portland Harbor).
The major underlying assumption for the river studies.is that DO depletion has been and will continue to be a river-quality problem only during the recurring low-flow summer-fall period. Existing surveillance data (public files, DEQ, Portland, Oreg.)showthatDOconcentrations in the river are at or near saturation for the remainder of the yearly cycle.
SELECTION OF STUDY REACHES AND SAMPLING SITES
The time, location, and general nature of studies are outlined in table 4 and are subsequently described in detail. Spatially, the studies focused on the lower 86.5 mi (139 km) of river where DO problems have been prevalent in the past. In general, study segments were selected to conform with the three distinctive morphological reaches of the Willamette (fig. 6). Logistical considerations, the location of major waste-water discharges (particularly in the
I9
Salem area), and the need for hydrologic control from fixed-stream gages somewhat modified the selection of segments solely on the basis of morphology.
Individual sampling sites were selected primarily on the basis of waste-water outfall and tributary locations, traveltime between sites, and the availability of boat launches and bridge measuring sites. Information for site selection was derived from:
(I) Detailed examination of 1:12,000 high resolution black and white photographs of the Willamette River channel supplied by the Portland District, U.S. Army Corps of Engineers.
(2) Channel geometry data obtained from channel soundings and maps furnished by the Portland District, U.S. Army Corps of Engineers.
(3) Traveltime data from dye-tracer tests conducted by the Geological Survey (Harris, 1968).
( 4) Historic waste-loading information sup-

RIVER Kl LOMETERS ABOVE MOUTH
Coast Fork Marys Luckiamute Tualatin Willamette River River River River
Fall McKenzie Long Tom Calapooia Santi am Molalla Clackamas Creek River River River River River River
0
V'J 25 :::::> V'J ...J w (.)
~ 20 ~ w a: (!) w Cl
~ 15
ui a: :::::> 1-<( 10 a: w a.. ~ EXPLANATION w 1-a: 5 --- Natural conditions w 1- ------ Regulated conditions <(
~
0 200 150 100 50 0
RIVER Ml LES ABOVE MOUTH
FIGURE 5.-Maximum, mean, and minimum water temperature profiles for July, Willamette River. Profiles upstream of RM 187 are for Middle Fork Willamette River. Note that below RM 125 reservoir regulation does not change the naturally occurring temperature regimen. (Adapted from Willamette Basin Task Force, Appendix B, 1969.)
plied by DEQ. (5) Observations of river currents and mixing
phenomenon made during reconnaissance sampling in late spring 1973.
IMPORTANCE OF HYDROLOGIC STABILITY
Studies were designed to coincide with relatively stable low-flow conditions; that is, a relatively prolonged period (""' 10 days) of steady stream flow not affected by preceding storm runoff. This consideration is particularly important because the quantification of selfpurification processes is accomplished with mathematical equations and models based largely on assumptions of a steady state system. In the Willamette River, these assumptions are (with rare exceptions) reasonably met only during the extended periods of hydrologic stability experienced during summer.
As shown in figure 10, streamflow in the Willamette River and major tributaries was'low and relatively steady throughout the 1973 and
110
197 4 summer study periods. The Willamette Basin had an unusually light snowpack and winter-spring rainfall in 1973, and runoff into reservoirs was considerably below normal. Note that in 1973, a steady low-flow period began about July 5 and, except for a minor rise between July 20 and 25, persisted at about 6,000 ft3/s (170 m3/s) until August 17, when reservoir releases increased streamflow above 7,000 ft3 Is (200 m3/s). In 1974 a heavy winter snowpack and late spring rainfall prolonged the runoff period until early August, and stable low-flow conditions (approximately 6,800 ft3/s or 190 m3/s) lasted only from August 1 until August 14.
During the periods of study in 1973 and 1974, the accounting of gaged flows from all upstream tributaries consistently resulted in excellent checks (within 7 percent) with flows recorded at the three Willamette River gages at Harrisburg (RM 161), Albany (RM 134) and Salem (RM 85). The Salem gage was used as the reference gage for all studies because of the

(A)
'\ s (
3 135m (217 km)
187 (301 km)
( \
0 30 MILES I 1
1 11
0 50 KILOMETERS
300 200 100 0
DISTANCE, IN RIVER KILOMETERS ABOVE MOUTH
FIGURE 6.-Willamette River, Oreg. A, Distinctive morphological reaches. B, Elevation profile.
capability to correlate flows at Salem with those observed at any other downstream location on the main stem Willamette. This could be done during the stable low-flow period because no major diversions or inflows, other than gaged tributaries, occur downstream of Salem. Because of reservoir regulation and a relatively homogeneous basinwide seasonal runoff regimen, major tributaries were also at a condition of stable low flow. Thus, average daily streamflow values at any point on the main
Ill
stem Willamette could be computed by a simple flow-routing procedure.
METHODS AND PROCEDURES
In general, methods were selected from standard practices and techniques documented in sanitary engineering and limnological literature. However, several modifications evolved from experimentation and practical experience during the course of study. As a guide for future river studies, discarded

River mile 119 (Upstream Reach) River mile 40.8C"Newberg Pool .. ) 0
'~__./"' ~~------------------------~~ 0
10
!- 5 Cl)
a: w
20 w w !-
u. w
Discharge= 3
5280 ft /s
(150m%)
~ r.' !- 30 Q. w c
~
~
r.' !-
Discharge= 6100 tt% 10 Q. w
(173m%) c
40
50 L-------L-----~------~------~15
River mile 9.2 (Tidal Reach)
10
20
!-w w u. ~ 30
r.' !-Q. w c 40
0 200 400
I 0 100
600 800 FEET I
200 METERS
5
10
15
Cl) a: w !-w ~
~ r.' !-Q. w Cl
FIGURE 7.-Typical channel cross-sections of the Willamette River at concurrent low-flow conditions.
methods and the advantages of those finally selected are briefly described. Two of the most important methods, the air-calibration technique for field calibration of DO meters and the laboratory BOD analysis, are explained in detail in Supplements Band C.
During the course of the study, more than 2,500 20-day BOD tests were made on samples
112
of river and waste waters of the Willamette River basin using the specially designed BOD procedure. In addition, experiments were conducted to evaluate the reliability of the laboratory BOD procedure and to further quantify and isolate particular factors responsible for several types of anomalous readings (artifacts) noticed during the labora-

RIVER KILOMETERS ABOVE MOUTH
Portland
V)
> <( 0 ~ w > <( a: 1-LL 0 w ~ j:
20
10
0 187
EXPLANATION
Willamette River discharge at Salem, in cubic feet per second
2600
----4900
7000
150 100 50
RIVER Ml LES ABOVE MOUTH
FIGURE B.-Cumulative time of travel for various low flows, Willamette River.
TABLE 3.-Selected physical characteristics of the main stem Willamette River [See fig. 6 for location of reaches. Characteristics refer to summer low-flow conditions of 6x103ft3/s at Salem]
Representative Approximate Approximate midchannel traveltime
Length bed slope water depth total in reach Reach (mi) (ftlmi) Bed material (ft) Velocity (hr)
Tidal 26.5 <0.1 Intermixed clay, sand, and 40 10.11 240 Reach. gravel.
"Newberg 25.5 .12 Intermixed clay, sand, and Pool." gravel with some cobbles.
Upstream 135 2.8 Mostly cobbles and gravel. Reach.
1Calculated by volume displacement method using channel croBB-sectional data. 2Calculated from dye study conducted by U.S. Geological Survey (Harris, 1968).
25 1 .27 94
7 22.0 68
0
0
tory work. A brief summary of the special experiments and their results is offered in Supplement D.
meter, 1 referred to hereafter as DO meter, and the Martek Mark II multichannel water quality analyzer, referred to hereafter as DO monitor.
The basic instruments used for river DO and water temperature measurement were the YSI (Yellow Springs Instruments) model 54 oxygen
I13
1 Mentioned brand names do not imply endorsement by the Geological Survey.

Rivermile6.0~ (St Johns Bridge)
0
I I
0
1 N
I
I I • 5 MILES
I I
I I
I I l
I
8 KILOMETERS
FIGURE 9.-Lower Willamette River system. During low-flow conditions, Columbia River water commonly moves upstream beyond St. Johns Bridge as a distinct bottom wedge of denser water. Depending on variations in tides and river flows, the subsequent discharge of mixed Columbia-Willamette water may be out the mouth of the Willamette, through Multnomah Channel, or a combination of the two.
The DO meters included calibrated 50ft (15m) cables and Clark-type polarographic probes. The DO monitors were each equipped with 305 ft (100m) of calibrated cable with depth sensor.
114
DO meters were field calibrated every 2-3 hours using the air calibration technique described in Supplement B. This technique proved quick and accurate throughout the 2-

TABLE 4.-Summary of studies of the Willamette River conducted during 1973 and 1974
Description
Reconnaissance (review of historical data, preliminary sampling, methods testing, formulation of pl1'liminary hypotheses)
Date Sampling sites
Jan.-July Numerous sites throughout 187-1973 mi main stem, major tribu
taries, and waste-water outfalls.
DO-BOD study, RM 26.5-0 July 24-26, RM's 28.6, 25.5, 21.1, 16.8, 12.8, 1973 7 .0, 6.0, 3.5, 1.5; all major tribu
taries just above main-stem confluence; all major wastewater outfalls.
DO-BOD study, RM 187-86.5 August 6-12, RM's 185, 161, 134, 120, 96, 86.5, 1973 McKenzie River, RM 7.1;
Santiam River, RM 6; all major waste-water outfalls.
DO-BOD study, 86.5-26.5 August 15-18, RM's 86.5, 72, 50.0, 46.0, 39.0, 1973 34.0, 28.6, plus all major tribu
taries just above main-stem confluence; all major wastewater outfalls.
Nonpoint-source study of June-Aug. Coast Fork Willamette River BOD and nutrient loading. 1974 RM's 6.4 and 29.5; Middle Fork
Willamette River RM 8; McKenzie River, RM's 7.1 and 14.9; South Santiam RM's 7.6 and 23.3; Clackamas River RM0.5.
DO-BOD study, RM 86.5-0 August 6-7, RM's 86.5, 72.0, 50.0, 39.0, 28.6, 1974 21.0, 12.8, 10, 7.0, 6.0; all major
tributaries just above mainstem confluence: all major waste-water outfalls.
Nitrification study, RM August 12-14, RM's 120, 114, 86.5, 72.0, 60.0, 120-0. 1974 55.0, 50.0, 39.0, 28.6, 12.8, 7.0,
all tributaries just above mainstem confluence; all major waste-water outfalls.
year study period and evolved from dissatisfaction with the originally attempted field Winkler calibration. The Winkler technique was particularly cumbersome. In addition to delicate glassware, it. required the use of distilled water because of possible analytical interferences in river water caused by the presence of low concentrations of reduced sulfur compounds discharged in waste waters from the pulp and paper mills. Winkler calibrations proved time consuming, difficult under field conditions, and resulted in consistently poor calibration quality control as determined from analysis of fieldcrew calibration records.
DO-BOD STUDIES
The three studies below RM 86.5 employed 5-8 field crews with boats, 5-8 DO meters, and 4 DO monitors (usually in a fixed position). During the DO-BOD study of the Upstream Reach between RM 185 and 86.5, DO monitors were installed at each site described in table 4, except at RM 161, where a permanently installed
Geological Survey water-quality instrument (Honeywell Model II) was already in place (operated by the Oregon District Geological Survey, WRD). Reconnaissance sampling had shown DO concentrations in this reach to be near saturation and homogeneous in cross section, but subject to diel variations owing to photosynthesis by periphytic algae (see fig. 15). Thus, the single point continuously recording DO monitors could be used to advantage with only a minimal need for manual sampling. This was an important logistical consideration in this long, relatively inaccessible reach.
Each study reach was sampled from dawn until dusk for 2-6-day periods of steady low flow. During the three DO-BOD studies below RM 86.5 (table 4), 100-350 discrete DO and water temperature measurements were made with the DO probe at each sampling site. (The number of measurements varied owing to channel configuration and type ofinstruments used.) Every 2 hours, from approximately 6:00 a.m. to 9:00p.m., vertical sampling traverses for DO and water temperature were made from boats. Depending on channel geometry, vertical measurements were made at water surface 3, 6, 10, 15, 20, 30, 40, and 50ft (water surface 1, 2, 3, 5, 6, 9, 12, and 16m), with duplicate readings at 0.6 channel depth. At most sites additional vertical traverses were made 2 or 3 times each day at 3 horizontal locations to check for horizontal homogeniety.
At most sites, river BOD samples were collected every 4 hours at mid-channel at 0.6 channel depth with a 4-liter Scott-modified Van Dorn bottle. (Reconnaissance sampling had shown this procedure to give representative average daily BOD values owing to the relatively good mixing.) This procedure resulted in 12-20 BOD samples per study from each site. At the sampling site farthest upstream in each study reach, preliminary sampling was begun 2-7 days before intensive sampling to check for antecedent stability of the DO regimen and to insure the absence of anomalous in-river BOD concentrations. This was important for establishing reliable boundary conditions for future modeling work. Moreover, had nonstable conditions been noted, the synoptic study would have been deferred until a later date.
115
River BOD samples were placed in clean 300-ml BOD bottles and immediately packed in ice.

40~------------~r---------------~---------------.---------------,
35
900 Cl 2
830 w (I) Cl a: w 0..
800 2 0 u
1-w
w (I)
w a: LL w 5:2 25 m
0..
700 (I)
0:: ::::> IJJ u 1-LL 0
w ~
(I) u Cl 2
~ 20 ::::> 0 :::c
600 iii ::::> u ~ w·
1-
~ 500
(!) a: <(
w· (!)
~ 15
:::c 1974 u
(I)
Cl :::c u 400 (I)
0
10
7
5 JUNE JULY AUGUST SEPTEMBER
FIGURE 10.-Hydrographs showing streamflow ofWillamette River at Salem for 1973 and 1974 summer periods.
The samples were gathered at predetermined locations and delivered by truck to the Geological Survey laboratory in Portland. Initial readings in the laboratory were made 2-8 hours after sample collection.
BOD samples from tributaries and municipal and industrial waste-water outfalls were collected once or twice daily. Tributaries were grab sampled just above confluence with the Willamette main stem. Municipal effluents were composited over 24-hour periods to determine daily average BODult loads. In
I16
contrast, pulp and paper mill effluents were grab sampled because all of the effluents are discharged from aerated lagoons (fig. 11) having detention times greater than 10 days. The long detention times made it possible to reliably determine daily BODult loads on a grab sample basis. All waste-water sampling began 2-7 days prior to each river study to insure detection of any unusual antecedent conditions. Waste-water samples were collected by DEQ field crews with cooperation from each municipality and industry. The National Council for

FIGURE 11.-Aerated lagoon used for treatment of pulp and paper mill waste waters. Boise Cascade Corp. plant (Salem) is at upper left corner, Willamette River in foreground.
Air and Stream Improvement (NCASI), a technical service organization of United States wood products industries, also cooperated in the sampling effort. The waste-water BOD samples were packed in ice and delivered daily to the Geological Survey laboratory in Portland. Two or three dilutions, using fresh Willamette River wat~r for dilution water, were made for each sample and three dilution water BOD's ("blanks" or controls) were begun each day. Initial DO readings on the diluted waste-water samples were made within 8 hours of sample collection.
All river- and waste-BOD samples were incubated at 20±.1 oc for 20 days. Using the BOD probe-reaeration technique (see Supplement C), DO measurements were made at 0.5, 1, 2, 3, 4, 5, 6, 7, 10, 15, and 20dayintervals. Lee's graphical method (Supplement C) was used to calculate deoxygenation rate (k1) and BODult· Lee's method was selected over other available methods because it allowed manual graphical
inspection of all data points and direct comparison to the assumed "first-order decay" carbonaceous deoxygenation model. A computerized modification of the Reed-Theriault technique (Theriault, 1927) was also tried but discarded as giving unrealistic k1 results because of "overweighting" of anomalous early readings that occurred in some samples during the 0-3 day time interval (See Supplement C). The anomalous readings were believed due to DO supersaturation (common in tributary and Upstream Reach samples), excessive algal respiration caused by incubation in the dark, or lags in the onset of bacterial oxidation.
With the exception of the 1973 river BOD samples, allylthiourea (Tuffey, 1973) was added to all waste-water and river BOD samples to inhibit nitrification and permit independent determination of the carbonaceous deoxygenation rate. Because nitrification was in fact shown to have occurred in the uninhibited 1973 nver BOD samples, BOD results from these
117

samples were adjusted as described in table 7. These adjusted results were consistent with though not considered as reliable or definitiv~ as, the 1974 inhibited BOD samples.
Water samples for nitrogen, phosphorus, and silica analyses were collected with Van Dorn samplers from most DO-BOD sampling sites for use in algal studies. Nitrogen, phosphorus, and organic carbon analyses were also conducted on aliquots of the BOD samples from most waste-water treatment plants. Algal studies conducted concurrently with the DO-BOD studies provided information on light penetration, algal cell counts (phytoplankton and periphyton), light-and-dark bottle primary production, and algal growth potential under conditions of nutrient enrichment. Certain of the results of the algal studies are presented subsequently. A detailed discussion is presented elsewhere (Rickert and others, 1977).
NONPOINT-SOURCE BOD STUDY
Results of the 1973 DO-BOD studies showed that river BODult concentrations of < 3.0 mg/1 were common in all reaches above RM 86.5 and that river deoxygenation rates were probably in the rangekr=0.02-0.06. This suggested that the river BOD regimen was approaching a nearpristine condition characterized by loading only from land runoff and seepage (both considered to be minor during low-flow conditions) and instream primary production. To further analyze this condition, a study of diffuse-source BOD loading was undertaken.
The major Willamette River tributaries were grab sampled on three separate days during summer 1974 for BOD, nitrogen, and phosphorus (table 4). Sampling sites were located above and below major point sources of pollution as determined from reconnaissance work in each tributary basin. The Middle Fork Willamette River and the Clackamas River (fig. 1) were sampled at only one location (near their mouths) because no major point sources of pollution are known to exist in either river during summer low-flow conditions. Ten BOD analyses, plus analyses for nitrogen and phosphorus, were conducted on each sample. Point and nonpoint source BOD loads are summarized in table 6. Summary of nitrogen and phosphorus nonpoint loadings are given elsewhere (Rickert and others, 1977, p. G7).
118
NITRIFICATION STUDY
Results of 1973 DO-BOD studies strongly suggested that nitrification was occurring in the river between RM 120 and 55. A large oxygen depletion, not attributable to carbonaceous BOD loadings, was evident in this reach (see fig. 14). The depletion was coincident with a rapid conversion of ammonium to nitrate ion in the river. Because this condition had not been anticipated in 1973, a special study of nitrification was planned and undertaken in August 1974.
During three consecutive days of low steady flow (August 6-8, 1974), samples were collected by rapid downstream boat cruises and bridge sampling at the river sites shown in table 4. All . major waste-water outfalls were also sampled, and together with the river water samples, were analyzed for ammonia-, nitrite-, and nitratenitrogen concentration. River and waste-water samples were chilled, brought to the laboratory within 12 hours, and analyzed using the distillation-Nesslerization method for ammania-N (NH4-N), the Brucine method for nitrateN (N03-N), and the diazotization method for nitrite-N (N02-N). Duplicate samples were sent to the Geological Survey's central laboratory in Salt Lake City, Utah, for check analysis by methods described by Brown, Skougstad, and Fishman (1970).
Dawn to dusk DO measurements were made August 7 and 8 between RM 86.5 and 50, where the rapid oxygen depletion had been noted during 1973. Concurrent with the DO measurements, analyses for Nitrosomonas and Nitrobacter bacteria were conducted on samples obtained from water and rock slimes using techniques described by Ehrlich (1975) and Tuffey (1973).
RESULTS
BOD LOADING
Total BODult input to the main stem Willamette River in the summer of 1973 and 1974 was approximately 170,000 lb/day (77,000 kg/day). This value is based on average (measured) 1973-7 4 BOD loads from tributaries ' municipalities, and industries (table 5). Of this total, 55 percent was from known point sources (municipal and industrial outfalls), and 45 percent from diffuse sources (table 6). Almost all

TABLE 5.-BODult loading to the Willamette River from individual outfalls and tributary watersheds [Calculated loadings are based on 1974low-flow conditions (6,800 ft3/s or 190 m3/s Salem gage)]
Location ofload (RM)
Description of waste-water load or tributary
187
184 178 175 148 132.1 132 131 120 118 116
108 107.9 95.4 85.0 78.2 55.0 50.3 49.8 35.8 33.0 28.4 28.0 27.6 25.2 24.8 24.1 20.3 20.1 18.4
Confluence of Middle and Coast Forks .................. .
Springfield STP .............................................................. . Eugene STP ...................................................................... . McKenzie River ............................................................. . Wood products industry ............................................. .
Marys River .................................................................... . Corvallis STP ................................................................ .. Calapooya River ........................................................... . Albany STP ...................................................................... . Combined effluent of metals and wood products
industries ...................................................................... . Santiam River ................................................................ . Luckiamute River .......................................................... . Independence STP and Ash Creek ......................... . Wood products industry ............................................. . Salem STP ......................................................................... . Yamhill River ................................................................... . Newberg STP ................................................................ . Wood products industry ............................................. . Molalla River .................................................................... . CanbySTP ...................................................................... . Tualatin River ................................................................ . Wood products industry .............................................. . ................. do .......................................................................... . Oregon City STP ........................................................... . Clackamas River .............................................................. . West Linn Stp ................................................................... . Tryon Creek STP ........................................................... . Oak Lodge STP ............................................................... . Milwaukie STP -·····-·····-··············-··············-·······················
Total ...................................................................................................... .
Point source (lb/d)2· 3
240
3,100 8,650
56,200 4,100 2,900
120 3,100
240 1,100
960 55,000
120 960
13,000 11,800
720 100
7,200 500 70
4,300 11,100 5,000
240 240 170 430 430 240
92,300
Nonpoint source (lb/d)4
21,600 (19,200 Middle)
30,500
120
240
13,000 120
720
980
960
9,400
77,640
NoTEs.-STP, sewage treatment plant; e, estimated from Oregon DEQ routine surveillance data
'Only sources with BODult loads greater than 100 lb/d shown in table.
Total (lb/d)
21,800
3,100 8,650
36,700 4,100 2,900
240 3,100
480 1,100
960 18,000
240 960
13,000 11,800
1,440 100
7,200 1,480
70 5,260
11,100 5,000
240 9,640
170 430 430 240
169,900
Average Average carbonaceous BODwt deoxygenation
concentration rate, k1 (mg/1) (d•l)
2.1 0.04
74 .06 92 .06 2.1 .05
22 .06 300 .04
e5 .04 52 .06 4.8 .03
24 .06
36 .05 2.2 .03
e5 .06 e50 .02 85 .06 60 .05
4.9 .06 22 .06 90 .07
2.1 .04 32 .05 25 .06 70 .06 27 .05 13 .06
1.3 .07 30 .06 13 .05 26 .06 21 .06
2All point-source BODwt data above RM 85 based on 1973 samples. All point-source data below RM 85 based on 1974 samples except discharges with loads less than 500 lb/d which were sampled only in 1973.
3Below RM 85 municipalities and industries with BODwt loads greater than 1,000 lb/d were generally samples 5-10 times. Above RM 85 municipalities and industries were generally sampled 1-4 times. Tributaries were sampled 5-10 times.
4Nonpoint-source data from June to August 1974 samples (see table 4) of major tributaries and estimates for minor tributaries. 5Point-source loads primarily from upstream wood products industries.
TABLE 6.-Reach-by-reach summary of point and nonpoint BODult loading to the Willamette River for summer low-flow conditions
[Calculations based on 1974low-flow conditions (6,800 ft3 /s or 190 m3/s Salem gage) and 1973-74 average dry weather waste-water loads]
BODwt loading to main stem Willamette River
Point sources' Nonpoint sources2
(municipal and industrial outfalls) (tributaries) Totallaoding
Percentage Percentage Lb/d of Percentage Lb/d of total Percentage Lb/d Percentage
River reach of point source of total of diffuse source of total of of (RM) BODult loading loading BODult loading loading BODwt total
187-52 ········------------- .................... 62,000 68 37 67,000 86 39 129,000 76
53-26.5 ········································· 28,000 30 17 2,000 2 1 30,000 18
26.5-0 ........................................... 2,000 2 1 9,000 12 5 11,000 6
Total .............................. 92,000 100 55 78,000 100 45 170,000 100
'Outfalls discharging directly to main stem Willamette River plus flow-routed point-source loads discharged into tributaries. 2Based on BODult concentrations measured in Cascade tributaries above waste-water outfalls plus estimated nonpointcontributions from minor tributaries (that
is, those with flows less than 100 ft3/s or 28 m3/s).
the nonpoint-source BODwt inputs enter the main stem Willamette from major tributaries rather than by direct overland runoff or seepage.
119
POINT-SOURCE BOD LOADS
The 92,000-lb/d (42,000 kg/d) load from point sources includes 56,000 lb/d (25,000 kg/d) or 61 percent from industrial outfalls and 36,000lb/d

(16,000 kg/d) or 39 percent from municipal outfalls. The BOD load from the industrial outfalls is virtually all from wood-products industries. The BODult load from municipal outfalls includes an unknown proportion (perhaps as much as 30 percent) from seasonal canning operations and other small industries connected to municipal sewer systems.
The deoxygenation rates (kt =0.04-0.08) of carbonaceous material measured in pointsource waste-water discharges (all of which receives some form of secondary biological treatment) contrast with rates of kt =0.10-0.14, previously measured in BOD tests of raw or primary-treated waste water (Velz, 1951, 1961). These low rates indicate that the basic biochemical character of waste-water effluents in the basin is different from that of several decades ago. The carbonaceous material remaining in waste waters after secondary treatment is well oxidized and more resistant to biochemical decay than theraworprimary-treated waste waters previously discharged. As described in the following sections ("NonpointSource BOD Loads" and "BOD Concentrations and Rates in Willamette River"), this basic change in the biochemical nature of wastewater effluents is also reflected in the deoxygenation phenomena that occur in tributaries and the main stem Willamette.
NONPOINT-SOURCE BOD LOADS
Approximately 93 percent of the 77 ,000-lb/ d (35,000 kg/d) nonpoint-source BODult input was from four major Cascade Range tributaries: Middle Fork Willamette (19,000 lb/d or 8,600 kg/d), McKenzie (31,000 lb/d or 14,000 kg/d), Santiam (13,000 lb/d or 6,000 kg/d) and the Clackamas (9,400 lb/ d or 4,200 kg/ d). These tributary BODult loads appear large; however, this is deceptive because it is the large volume of streamflow in each tributary, rather than high BODult concentrations, that causes the large loads. Indeed, BODult concentrations are remarkably low, ranging only from 1.3 to 2.1 mg/1 in samples taken upstream of all wastewater outfalls. Considering the deoxygenation rates of kt =0.02-0.06, these data are indicative of near-pristine conditions. Even below wastewater outfalls, no tributary BODult concentrations greater than 3.0 mg/1 were measured.
Because of low streamflow, the smaller Cascade Range tributaries (Molalla, Pudding,
120
and Calapooya Rivers) and all the Coast Range tributaries contribute only minor BODult loads to the Willamette River from nonpoint sources. Furthermore, nonpoint-source BODult loads from areas adjacent to the main stem Willamette are minimal during low-flow summer conditions because of the absence of rains, land wash, and irrigation return flows. This is substantiated by a BODult mass-balance calculation described below.
BOD CONCENTRATIONS AND RATES IN WILLAMETTE RIVER
BODult concentrations were low throughout the main stem Willamette River during the 1973 and 1974 studies (table 7). Measured values ranged from 1.6 mg/1 at RM 7.0 to 4.5 mg/l at RM 72 (both values noted during August 6-7, 1974). Measured deoxygenation rates (in BOD bottles) varied from kt =0.02 to 0.06, with the majority of rates at or near kt =0.04.
To evaluate the compatability of the laboratory-determined BOD data with observed river deoxygenation, a series of DO and BOD mass-balance calculations were made using a preliminary version of the DO model described in Circular 715-J. These calculations were then analyzed in conjunction with measured nitrification and suspected benthal oxygen demand (described subsequently). The analysis led to the adoption of river deoxygenation rates of kr=0.06 for the Upstream Reach (RM 187-52) and kr=0.03 for the "Newberg Pool" and Tidal Reach. While the kr=0.06 and 0.03 do not match exactly the k1 =O.O~}l1 verage calculated from the BOD tests, they are within the measured range of 0.02-0.06 derived from the individual BOD samples tested in the laboratory. Moreover, the higher reaction rate for the shallow "surface active" Upstream Reach is consistent with the phenomenon of biological extraction and accumulation by the periphytic biofilms (see Supplement A) that are prevalent in this reach. Similarly, the lower deoxygenation rate determined for the deep, pooled reaches below RM 52 is consistent with the relatively small surfaceto-volume ratio (smaller than the BOD bottle) and slow mixing of these reaches.
A graphical summary of the computed BODult mass balance using the adopted kr values is shown in figure 12 for comparison with measured BODult concentrations. Considering the limitations in measuring BOD at

TABLE 7.-BODult concentrations and BOD bottle deoxygenation rates for samples of Willamette River during summer low-flow periods, 1973 and 1974 (see table 4 for sampling dates)l
1973 1974
Average2 Average3
Sampling Number BODult Average Number BODult Concentration Average site of concentration kt of concentration range kt
(RM) samples (mg/1) (d·l) samples (mg/1) (mg/1) (d·l)
185 5 2.3 0.04 161 ------------------ 2 2.8 .05 134 -----------·------- 6 3.0 .03 120 ....... ______________ 7 3.0 .04 86.5 -··········-·-··- 18 3.3 .04 14 2.4 1.7-3.0 0.04 72 ····---------------· 17 4.2 .06 13 3.4 2.8-4.5 .04 50 ········-----------· 17 3.7 .04 14 2.9 2.3-3.8 .04 34 -----·-·-----------· 17 3.6 .04 28.6 -·----·····-····-· 40 3.2 .04 6 2.5 2.0-3.1 .04 25.5 ··-··--·-··-·····- 15 3.4 .04 16.8 ····-···-··-······ 12 3.6 .04 12.8 ··-··--------·--- 27 3.2 .04 15 2.6 2.1-3.3 .04 7.0 ··-·········---·· 23 3.1 .04 13 2.3 1.6-3.1 .05
1All BODwt data calculated from 20-day 20°C BOD tests. See Supplements C and D for methods. 2Allylthiourea (nitrification inhibitor) was not routinely added to 1973 BOD samples. Data for 1973 are estimates based on ratios of
inhibited to uninhibited BOD's obtained from reconnaissance sampling in early summer 1973. For this reason, concentration ranges (as shown for 1974 data) are not given.
3lnhibited with allylthiourea every 5 days.
187 175 Albany
120
Salem 86
Newberg 50
RIVER Ml LES ABOVE MOUTH
Willamette Falls 26.5
1----Portland Harbor----17 13 7
><( 0 a:
~~--.---L-.-~---rL----r-----,------r---~.-----~--~-r----~-----,r-----.---~~100 ~
EXPLANATION
2 4 6 8 10 12
(/)
80 ~ a: (!) 0
60 ...J
~ u. 0 (/)
40 ~ <( (/) ;::) 0 I 1-z
TIME OF TRAVEL, IN DAYS
FIGURE 12.-Comparison ofmeasured and calculated BODult loads in the Willamette River, during August 1974low-flow conditions. Estimated rates of inriver carbonaceous deoxygenation (kr) shown at top of graph.
such low concentrations there is remarkably good agreement between computed and measured BOD along the entire segment from Eugene to Willamette Falls (RM 187-26.5). There is, however, an anomalous deviation through the Tidal Reach (in the deep Portland Harbor between RM 12.8 and 7.0) where
121
measured values of BODult are higher than computed by approximately 30 percent (see fig. 12).
ANOMALOUSLY HIGH BOD IN THE TIDAL REACH
Prior to 1970, there were large loads of suspended organic solids reaching the Willamette

from pulp and paper mills and, in Portland Harbor, from combined-sewer overflow. These materials were believed to be responsible for a significant summertime benthal oxygen demand in the "Newberg Pool" and the Tidal Reach (Velz, 1951, 1961). During 1970, benthal respirometer studies of the lower Willamette suggested a benthal oxygen demand of27,000 to 54,000 lb/ d (12,000 to 24,000 kg/ d) in the subreach between RM 13 and 7 (Sainsbury, 1970). Since 1970, industrial process alterations and new aerated waste-water treatment lagoons at the pulp and paper mills have effected a large reduction in the loading of suspended organic materials. Furthermore, the dry weather combined-sewer overflows of Portland had been rerouted for discharge to a new secondary-treatment plant on the Columbia River.
Thus, because the original sources ofbenthal deposits had been largely eliminated by 1972, it was anticipated that the benthal demand would be greatly reduced by 1973. This notion was supported by DO data collected by DEQ during the low flow period of 1972 and by the Geological Survey reconnaissance data collected during spring 1973. Indeed, the summer 1973 data substantiated that the benthal oxygen demand of previous years no longer existed in the "Newberg Pool," although an anomalous demand still existed in the Tidal Reach below RM 12.8. Based on the BODult mass-balance computations (fig. 12), the demand was estimated to be approximately 30,000 lb/d (13,000 kg/d). To further study the anomalous demand, a series of riverbed samples was collected by dredge hauls between RM 18 and 0. Microscopic examination of the sediments showed a predominance of clay-sized particles, cellulosic organic matter, and diatoms. The material was dark and slightly odorous but did not contain wood fibers as found in the earlier samples by Sainsbury (1970).
Further evidence concerning the nature of the demand was developed through laboratory investigation. A series of modified BOD tests was conducted on slurried samples of bed materials from the affected segment of Portland Harbor. The tests indicated an initial oxygen demand of 5-10 mg-02/gm of dry sediment. In most samples, this demand occurred within
I22
2-4 minutes following mixing in the BOD bottle. Mter measurement of the initial demand, each sample was reaerated and measured for 20 days using the probe-reaeration technique described in Supplement C. The BODuu values of these samples ranged from 3 to 6 mg-02/ gm of dry sediment, or approximately 50 percent of the initial oxygen demand. The deoxygenation rates of the slurried BOD samples (after .the initial demand) varied between k1 =0.03 and 0.06. As previously described this is within the same range of rates exhibited by the majority of river water samples.
During the period August 14-18, 1974, a U.S. Geological Survey oceanographic research team from Menlo Park, Calif., studied the water quality of the lower Columbia River system (independent of our synoptic studies of the Willamette River). Part of the work included longitudinal and vertical sampling traverses in the Tidal Reach (below RM 20). Results of the turbidity and DO measurements are most pertinent to the discussion here:
(1) In segment RM 13-1.5, there was a marked stratification of turbidity with depth and transient turbidity "jumps" (such as shown in fig. 13). Turbidity patterns appeared to change, possibly owing to tides, ship traffic, and dredging operations. For example, during two of the three sampling cruises high turbidity readings (rather than the low readings shown in fig. 13) were noted between RM 10 and 1.5.
(2) DO stratification was found in the segment RM 13-1.5. Between RM 5.0 and 1.5 highest DO concentrations were found in bottom waters. As described previously, this water is composed of cool, high-DO Columbia River water that moves as a bottom wedge either upstream or downstream in the Willamette, depending on tidal phase. Farther upstream, between RM 5.0 and 13, the stratification was opposite to that found between RM 5.0 and 1.5. There, the entire water column was composed of Willamette River water, the low DO concentrations in bottom waters apparently resulting from inplace oxygen demand. Stratification patterns similar to those described above had also been noted earlier in 1973 and 1974 (for example, see fig. 29).
The conditions described above suggest that the anomalous oxygen demand is partly, if not largely, of benthal origin. However, other

40 30
RIVER KILOMETERS ABOVE MOUTH
20 10 0
70
>- 60 1-Ci co a: :::> 1-w > ~ 50 <( _J
w a:
40
EXPLANATION
DEPTH, IN FEET 0-3 7
----- 16 33
3QL---------~~----------~----------~----------~--------~ 25 20 15 10 5 0
RIVER Ml LES ABOVE MOUTH
FIGURE 13.-Longitudinal and vertical turbidity patterns in the Tidal Reach, Willamette River, August 16, 1974. Relative turbidity measurements were made by a recording lysometer. Measurements are not in standard Jackson Turbidity Units but can be used to depict relative site-to-site turbidity differences.
factors are ·undoubtedly involved to some degree.
As discussed elsewhere (Rickert and others, 1977), planktonic algae carried from shallower upstream waters spend a major part of their transit time in the deep Tidal Reach below the euphotic zone of 2-3 m. This is particularly the case in the lowermost segment of the Tidal Reach below RM 13. In this segment, primary productivity measurements (Rickert and others, 1977) suggest that water column oxygen consumption due to algal respiration may exceed total oxygen production by photosynthesis. Another factor that may be responsible, in part, for the anomalous oxygen demand is waste-water discharges from ships and the few remaining submerged combinedsewer outfalls.
All of these factors are currently (1977) under
123
further investigation by the Oregon District of the Geological Survey.
Based on the results of the 1973-74 synoptic studies and data collected during the ongoing follow-up study (Steven E. Mellor, oral commun., U.S. Geological Survey, Portland, Oreg.), the anomalous oxygen demand in the Portland Harbor (approximately 30,000 lb/ d (13,000 kg/ d) between RM 12.8 and 5.0) has been tentatively proportioned as follows:
(1) 1/4-1/3 due to "inplace" benthal oxygen demand.
(2) 1/4-1/3 due to excess algal respiration (that is, 02 consumption due to respiration is greater than photosynthetic 02 production).
(3) 1/4-1/2 due to an unknown combination of (a) sewer overflows, (b) ship discharges, (c) navigation dredging and gravel mining, and (d) resuspension of benthal materials by tidal

currents and propwash. These estimates are tentative and may be
refined by results of the ongoing research.
NITRIFICATION
Preliminary analyses of 1973 DO-BOD data indicated that carbonaceous deoxygenation could not cause the 20-30 percent decrease in DO saturation (2-3 mg/l) measured between RM 120 and 50 (see fig. 21). Because this segment is shallow and swift moving, fine-sized benthal deposits are not present. Thus, rather than benthal oxygen demand, nitrification was suspected as the cause of this DO depletion. However, it was not until September 1973 when the results of chemical analyses of waste-water and river samples were received that nitrification was confirmed as the cause of the oxygen depletion. Analyses of waste-water samples indicated high concentrations of NH4-N in several industrial effluents. Furthermore, DEQ monitoring data indicated NH4-N concentrations of nearly 1 mg/1 just below Salem, with a conversion of NH4-N to N02-N and NOa-N proceeding in the downstream direction.
NITROGEN LOADING
Estimates of nitrogen loads entering the Willamette River during low-flow conditions from waste-water outfalls (point sources) and tributaries (nonpoint sources) are shown in table 8. The estimates are based on NH4-N, N02-N, and NOa-N analyses of samples collected during the summers of 1973-7 4. Most of the major municipalities and industries were sampled 5-10 times, and the major tributaries (Middle Fork, McKenzie, Santiam, and Clackamas) 2-4 times; minor industries, municipalities, and tributaries were sampled 1-3 times. Table 8 clearly shows for low-flow conditions that most of the nitrogen in the river (approximately 80 percent) comes from municipal and industrial waste-water discharged to the Upstream Reach. Analyses showed that approximately 90 percent of this nitrogen was in the form NH4-N and, thus, potentially subject to nitrification once discharged to the river.
By far the largest known NH4-N source in the Upstream Reach was at RM 85 where a wood vroducts industry discharged 16,000-30,000
lb/d (7,300-13,600 kg/d) of NH4-N during the summers of 1973 and 1974.
NITROGEN CONCENTRATIONS IN WILLAMETTE RIVER
Observations of NH4-N, N02-N, and NOa-N in the river during the August 12-14, -1974 nitrification study are shown in figure 14. The data indicate a rapid conversion of NH4-N to NOa-N between RM 120 and 50. The conversion is particularly apparent between RM 86.5 and 55. Below RM 55 in the deep "Newberg Pool" and Tidal Reach, nitrification is not indicated either by nitrogen analysis or by the DO profile (fig. 21). Above RM 120 the absence of significant nitrification is (despite the availability of a cobbly substrate for nitrifier biofilm growth) suggested by the low nitrogen concentrations and the lack of DO depletion (fig. 21).
Because rapid oxygen depletion (fig. 21) was most evident in the segment RM 86-55, the field data were used to calculate a nitrification rate coefficient, kn· Using the rate of appearance of NOa-N as a basis (fig.14), a value of kn =0.7was estimated as the effective, inriver rate of nitrification. (See Supplement A, "Nitrification" for discussion of first order equation.) Nitrate-N appearance was used as the basis for the kn calculation (instead ofNH4-N disappearance) because very little NOa-N enters the segment RM 86.5-55 from waste-water outfalls or tributaries. Also, no major tributaries enter the Willamette in this segment, and flow is essentially constant throughout. Thus, increases in river NOa-N concentrations should be attributable to conversion from NH4-N. (Nitrogen losses to algal assimilation or denitrification were assumed to be minor.)
NITRIFYING BACTERIA
The occurrence of nitrification in a shallow, surface-active reach and the contrasting absence in a deep, slow-moving reach is consistent with recent work by Tuffey, Hunter, and Matulewich (1974). They noted that nitrification in shallow, swift-flowing reaches would occur by virtue of an attached, rather than a suspended community of nitrifying organisms. To test this idea in the Willamette River, enumerations were made of nitrifying bacteria in water samples and in biological slimes
124

TABLE B.-Inorganic nitrogen loading to the main stem Willamette River during summer 1973-74 conditions
Total inorganic nitrogen1 loading
Municipal or industrial outfall2 (point sources) Tributaries3 (nonpoint-source components only) Combined -------------------
River reach Lb/d Percentage Percentage Lb/d Percentage Percentage Percentage Lb/d asN in reach of total asN in reach of total of total as N
Upstream reach (RM 187-52) --·--·····-· .. 30,()()()4 93 80 2,400 7 6 86 32,000
"Newberg Pool" (RM 52-26.5) ________ , _______________ 2,800 82 7 600 18 2 9 3,400
Tidal reach (RM 26.5-0) ····--··--------------- 1,600 84 4 300 16 5 1,900
Total. 91 9
1Approximately 90 percent of the nitrogen from municipal and industrial outfalls and 40 percent of the nitrogen from tributaries is in the NHl-N form. 20utfalls discharging either directly to Willamette River or into Middle Fork, McKenzie, Santiam, or Clackamas Rivers less than 20 mi from confluence with
Willamette. 3Estimated from nitrogen concentrations measured in tributaries above waste-water outfalls. •Nitrogen mass-balance calculations based on measured loadings and inriver concentrations indicate the possibility of up to 12,000 additionallb/d ofNH4+-N
entering this reach, most probably in the Albany-Millersburg area. DEQ is currently (1977) studying the nitrogen loading in the Upstream Reach in more detail.
RIVER MILES ABOVE MOUTH
a: L.U
Albany 120
Salem 86
Newberg 50
Willamette Falls 26.5
1----Portland Harbor--------• 17 13 7
t1.4 ..J
0: L.U a..
1.2 en ~ <( 0: ~ 1.0 ..J ..J
..,....,------- ------ ----~ ..,...., --~ -- NO~ z .8
z· I ---------0 I i= .6 <( 0: t-z .4 L.U ()
z 0 () .2 z L.U <!) 0 0 0: t 0 2 4 6 8 z TIME OF TRAVEL, IN DAYS
FIGURE 14.-lnorganic nitrogen concentration in the Willamette River during August 12-14, 1974. Breaks in lines indicate sampling locations. Each point is an average of three samples.
scraped from bottom rocks (table 9). Nitrosomonas concentrations were >1 most probable number (MPN)/ml in all water samples. In slimes, Nitrosomonas concentrations were > 1 MPN/mg above RM 86 and 1-4MPN/mg in samples collected between RM 86 and 55 (the active zone of nitrification). (Shortly below RM 55, the deep "Newberg Pool" begins, and few bottom rocks are available for attachment of biological slimes.) Nitrobacter enumerations were also made. In the zone of nitrification the
I25
counts ranged from > 1 to 4 MPN/ml in water samples and from 3-50 MPN/mg in slimes. The combined bacteriological data, though not absolutely definite, tend to support the hypothesis that nitrification occurred in slimes attached to rocks rather than in flowing water.
An interesting sidelight of the bacterial enumerations relates to the notion thatnitrifier counts in streambed slimes must be 103MPN/ mg or greater in order to cause a significant nitrification-induced oxygen demand (see Tuf-

TABLE 9.-Counts of Nitrosomonas and Nitrobacter bacteria in river water and on rock slimes, Willamette River, August 12-14, 1974
Sampling site (RM)
120 (above Albany) 114 (below Albany
and Conser Slough) .................. .
86.5 ---------------------········
79{right side ......... . left side ............ .
72 ········-··------------------·· 60 ----------------------------·· 55 ----------------------------· 50 ------------------------------39 --------·---------------------28.6 ----------------------------12.8 ---------·------------------7.0 -··························
River water1 Rock slimes2,3
Nitrosomonas Nitrobacter Nitrosomonas Nitrobacter (MPN/ml) (MPN/ml) (MPN/mg) (MPN/mg)
-<1 -<1 <1
<1 <1 <1 2 <1 1 <1 50 <1 4 4 4 <1 <1 <1 1 3 3 <1 430 1 6 <1 90 2 20 -<1 1 <1 230 <1 1 <1 1 <1 1
1Most probable number (MPN) from "Standard Methods" (American Public Health Association and others, 1971, p. 676) 3-tube dilution technique.
2Calculated from dry weight of slurry. Rock slimes were obtained from scrapings of randomly sampled river rocks. Scraped slimes were suspended in a small volume of river water, subsampled, and incubated using the 3-tube dilution technique. Details of the methodology are described by Tuffey (1973) and Ehrlich (1975).
3Below RM 55, the river channel is deep and slow moving with few rocks for attachment and growth of nitrifiers. Although nitrifiers are undoubtedly present in bottom muds, their impact on the DO regimen is insignificant because of the low rate of renewal between the mud-water interface.
fey, 1973). The 1974 data, and more recent nitrifier counts made in 1976 (D. A. Dunnette, written comm., DEQ, Portland, Oreg., 1977), do not support this notion. Instead, we hypothesize that there is no threshold number of streambed nitrifiers necessary to induce high-rate nitrification. We believe concentrations lower than 103MPN/mg can induce p.igh-rate nitrification if the reach is relatively gravelly or cob bly (high surface to volume ratio) and well mixed. Such conditions, which prevail in the Upstream Reach of the Willamette (fig. 7; table 3), allow a rapid renewal of NH4-N with a large area of streambed to which nitrifiers are attached.
PHOTOSYNTHESIS AND RESPIRATION
The amount of oxygen produced by a community of aquatic plants during a 24-hour period is an estimate of net primary production. Oxygep production occurs only during daylight hours of the 24-hour period. Therefore, if the 24-hour net primary production is positive, photosynthesis is presumably producing more oxygen than is being consumed by plant respiration. If net primary production is negative, respiration is consuming more oxygen than is being produced by photosynthesis.
I26
The amount of oxygen consumed (respiration) during a 24-hour period added to the amount of oxygen produced (net primary production) is an estimate of gross primary production. This calculation assumes that the rate of respiration is the same in the light ~sin the dark. __
Phytoplankton production was measured at various sites in the Willamette River (table 10) using either the diel-curve method or the lightand-dark bottle technique (Slack and others, 1973). For the light-and-dark bottle method, net production was determined from gross production by subtracting community respiration as calculated from inriver BOD concentrations and deoxygenation rates (see "BOD Concentrations and Rates in Willamette River"). This approach was used so that net production could be calculated for the entire water column as well as the euphotic zone.
The values summarized in table 10 must be considered only as approximations. This interpretive limitation results from (1) the many assumptions involved in primary production tests and (2) the lack of reliable methodology for accurately partioning plant respiration from total community respiration. Because of these difficulties and because of the limited number of tests conducted, it is impossible to analyze the production data in table 10 with regard to temporal and spatial patterns. Overall, however, the production data do suggest that values for net water column primary production are fairly low in magnitude (positive or negative) and clustered near zero. In itself, this distribution of values suggests that there is an approximate riverwide balance of oxygen produced by photosynthesis and oxygen consumed by plant respiration. (Indeed, this possibility has been substantiated by subsequent application of the WIRQAS DO model to all oxygen-related data presented in this report. See Circular 715-J for further details).
The notion of an approximate daily average oxygen balance between plant photosynthesis and respiration appears to be plausible, at least for long segments of the river. However, as previously described (see "Anomalously High BOD in Tidal Reach) there may be local exceptions. Also, as shown in Supplement E (figs. 27-30), photosynthesis induces diel variations in DO concentrations, particularly at the shallow sampling sites above RM 52 and in the euphotic zone of several sites below RM 52. Diel

TABLE 10.-Estimated primary production at various sites in the Willamette River, during summers of 1973 and 1974
Primary production in g-02/m2/d ----------------
Diel curve method Light-dark BOD method
River mile
1612 --···············-·-·--············· 86.52
···-···-···········-··-······-··
12.83 ··-·············--· ··········-·
12.83 ··········--··-· ............... .
12.83 ···············-····-············
12.83 --····--·····-·····-··--···-·-····
7.03 ····-······---······-··········-·
7.0 -··············-·-················ 7.0 -···········-·······-·--·--······
Date
8/09173 8/15173 7/05174 8/05174 8/06174 9/19174 7/25173 9/17174 9/19174
Gross in Net in water column water column
3.7 -1.2 2.7 -l.O
1.7 0.1
Gross in Net in-
euphotic zone euphotic zone water columnt
1.8 1.3 0.1 1.9 1.4 .2 1.6 1.5 .3 1.7 1.4 .4
4.4 3.7 .7 2.0 1.3 -1.7
NoTES.-See Rickert and others (1977) for further discussion of data in table. All measurements made during relatively steady low-flow conditions.
•Calculated from detailed channel geometry measurements assuming an effective respiration rate of 0.03/d. 2Entire water column in euphotic zone (effective channel depth <6 ft or 2m). 3Euphotic zone (depth to 1 percent light transmittance) varied between 6-10ft (2-3m).
variations in DO due to photosynthesis are not new to the Willamette River as evidenced by comparison of diel DO curves from 1929 with 1973 (fig. 15).
ATMOSPHERIC REAERA TION
Atmospheric reaeration is the transfer of oxygen from the atmosphere to river water under conditions of a DO deficit (see Supplement A). Reaeration is commonly described in mathematical terms by the reaeration equation:
where
dC - =K2(Cs -C)
dt
C=river DO concentration,
Cs=DO saturation concentration at prevailing river water temperature,
Cs-C=DO deficit,
K2=reaeration coefficient, proportional to stream depth and velocity in the form
(velocity)a . . K2 ; a and b are emp1ncal
(depth)b coefficients, and
t=time.
The rate at which a river can be reaerated at any location for a particular DO deficit is reflected by the reaeration coefficient, K2. This coefficient, is in effect a measure of the river's
127
reach-to-reach "reaeration potential" as controlled largely by cross-sectional velocity and channel morphology. Although K2 is not directly measurable, reach-to-reach estimates can be made from velocity and channel geometry data.
Several common forms of the reareation equation were used to calculate k2 values for different sites on the Willamette River (fig. 16). Note that the calculated values exhibit a consistent difference of one to two orders of magnitude between the shallow Upstream Reach (RM 187-52) and the deep "Newberg Pool" (RM 52-26.5). This relationship reflects the expected higher "reaeration potential" of the Upstream Reach due to higher velocities and shallower depths. (Note that only Velz k2 values are shown for the Tidal Reach (RM 26.5-0) because the other equations have not been calibrated for tidal rivers.)
Above RM 54, the Churchill (1962), Bennett and Rathbun (1971), and Krenke! and Orlob (1962) equations predict higher reaeration coefficients than the Velz (1970) graphical technique. However, in the deep, slow-moving Newberg Pool, the pattern is reversed. Because the predictive accuracy of the individual equations can be fully evaluated only through mass-balance computations involving all the significant self-purification processes, equation predictions were examined through preliminary use of the WIRQAS DO model. The results showed that only the Velz technique provided reasonable reaeration inputs for the Willamette River (that is, inputs that resulted in good

10 Coast Fork Wi llamette River
/,_
"""" / ' 9
8
10
~ "-.
a: w
9
8
9
~ ..
......____. ... ~
~~ / " / ' / RM 186
-/v """"' / ' / ' 1"-----fl' RM 184
t:: 8 ...J
a: w Q.
~ 10 <( a: (.!) 9 ...J ...J
~~
~
~
I ' / \ v McKenzie River '
... ....
~~
~
(A) 1929
10 8
RM 131 -/ ' ~
9 7
............._ -""' 8 - 6 ... ..., ... , ·~ ~ ~
,.-.....
/_ ' 9 6
/ "\. ./ Sant iam River
8 5
7 4
..... ....,.,--........ ~ .. _, ..... v
"-.... ~ RM 95
>· .. 1-
.........
9
8
5
> ... , .... .. ~ 4
8 .. .......__
-i-"""'
RM 86.5 ,.,..--7 4
6 ~ 8 ~ 0 z
12 24 0 12 3
24 0
0 i= <( a: 1-z w () z 0 () 12 z w (.!)
~ 11 0 Cl w 10 > ...J 0 ~ 9 Cl
12
11
10
9
....... I"
8 0
-
-j~ " /
" RM 185
~I"
/~ ' / \. I \
v \ McKenzie River '\
12 24
TIME, IN HOURS
(B) 1973
9 ~ / RM134 ,........__,
I I
' ../ Santiam River 8-~---=~---+----~--~
9
8
7
7
6
9 ... ~ ..... 8
./ - RM96
7
8r---~~---r----+---~
.. ~
~ ..
...
RM 86.5
0 12 6
24 0 TIME, IN HOURS
-
-
__. t-... v ' ~
RM 72
I"
............_ l---'"
RM 39
~ .... I"
~ r-...... ""--/ '
RM 25.5
... ... ~
--~ ...............
RM 17
12 24
~ r-....... /r
L RM 72
>
- ...... RM 34
"I'-
RM 25.5
.....,. ~ ~ -~
RM 17 ./
12 24
FIGURE 15.-Summertime (low-flow condition) diel DO curves at various sites on the Willamette River and tributaries (A) 1929 and (B) 1973. 1929 data from Rogers, Mockmore, and Adams (1930); 1973 data collected by U.S. Geological Survey, see figures 27, 28, 29, and 30.
128

agreement with observed conditions). The reasons for the apparent inability of the other equations to describe reaeration in the Willamette system are unknown.
RIVER-DISSOLVED OXYGEN
The cumulative effect of the individual
deoxygenation and reoxygenation processes described above is reflected in the temporal and spatial pattern of DO concentrations observed in the river. River DO data from the 1973-74 synoptic surveys were collated by date, time, sampling site, depth, and cross-channel position. Concurrently collected water temperature
RIVER KILOMETERS ABOVE MOUTH
300
2.0
1.0
0.5
0.2
> 0.1 <( 0 [[ w Q.
0 0.05 -w en <( m
C\1 .lie
0.02
0.002
250
161
200 150
River data for k2 calculations
River Effective Average velocity mile depth (ft) (ft/sec)
185 161 134 120 95 86.5 72.0 60.0 54.0 50.0 46.0 38.0 34.0 28.0 25.5 21.3 16.8 12.8
7.0
4.5 5.4 8.0 5.5 6.2 6.8 4.8 7.0
13.2 21.6 27.8 31.3 30.8 33.2 16.2 55.2 39.4 39.6 41.8
134 120
3.2 3.2 2.7 2.6 3.0 2.8 3.4 3.6
.84
.61
.39
.40
.29
.23
.86
.31
.25
.23
.12
100
Krenkel and Orlob (1962)
RIVER MILES ABOVE MOUTH
50 11.3
FIGURE 16.-Calculated reaeration coefficients (k2) for various sites in the Willamette River, using four different reaeration prediction methods.
129

data were used to convert DO concentration to percent saturation. A detailed graphical summary of all these data is given in figures 27-30, Supplement E. Selected results from the summary are highlighted below in order to (1) permit a comparison of Geological Survey data with independently collected data of the DEQ, (2) define DO conditions typical of individual sites in each of the three distinctive morphological reaches (fig. 6), and (3) present a representative average daily DO profile of the 187-mi (300 km) main stem Willamette River for steady, summer low-flow conditions.
INDEPENDENT CHECK OF THE DO DATA
Average DO concentrations and concentration ranges for each sampling site studied during July and August 1973 and August 1974 are shown in figures 17 and 18. Also shown are independently collected DO data from the Oregon DEQ river surveillance program(public files, DEQ, Portland, Oreg.). The DEQ data were segregated to include only those samples collected during periods of relatively stable low flow. Note that there is relatively good agreement between the two data sets.
DO VARIATIONS AT INDIVIDUAL SITES
Sampling sites less than 15ft ( 4.8 m) in depth (all sites above RM 50) showed no measurable DO variability with depth. However, the deeper sites in the "Newberg Pool" (particularly RM 39) and the Tidal Reach (RM 12.8, 7.0, and 6.0) showed slight DO and water temperature variations with depth (figs. 28-30). Highest DO concentrations in these deep reaches were generally in the near-surface waters (upper 10ft or 3.2 m), and the lowest concentrations were in near-bottom waters, particularly below 20 ft (6 m). Exceptions occurred at RM 3.5 and 1.5 (fig. 29) where the bottom inflow of cool, high-DO Columbia River water caused a reversal of this general pattern.
Above RM 50, horizontal DO variations of up to 25 percent saturation were noted at several sites because of the photosynthetic activity of periphytic algae. However, these variations were observed only in shallow ( > 3 ft or 1 m), slow-moving parts of the flow out of the main channel. Slight horizontal variations (less than 5 percent saturation) were also found at sites in the lower part of the Tidal Reach (RM 3.5 and
130
1.5) where waters from the Willamette and Columbia intermix.
Diel variations in DO and water temperature were striking in the shallow upstream sites (above RM 50) but were relatively minor at sites in the "Newberg Pool" and Tidal Reach (figs. 27 -30). A detailed example of diel DO and water temperature variability (RM 161) is shown in figure 19.The DO and temperaturecurvesatRM 161 (and all other sites above RM 50) reflect photosynthesis and respiration by periphytic diatoms and a response to diel air temperature changes. Of particular interest in figure 19 is the impact of day-to-day solar radiation patterns. August 7 and 8, 1973, were hot and sunny, but August 9 was cooler and partly cloudy. _
DO variations observed during July 24-26, 1973, at four sites in the Tidal Reach (RM 16.8, 12.8 at 6-m depth and RM 7.0 at 6- and 1-m depths) are shown in figure 20. (Note that the data at RM 7.0 show DO concentrations in the near-surface waters to be higher than those in deeper water.) Examined as a whole, the four curves in figure 20 show a gradual DO depletion between RM 16.8 and 7.0 but an upward trend in DO concentration at each site for each successive day of measurement. July 24, 1973, was preceded by a week of cloudy weather that caused a reduced level of photosynthetic activity, but the July 24-26 period was hot, sunny, and, on July 25 and 26, windy. (No quantitative solar radiation or wind data are available for inclusion here.) These factors apparently led to increases in photosynthetic oxygen production and atmospheric reaeration for each successive day.
SYNOPTIC DO PROFILE
A DO profile of the Willamette, using the average daily DO concentrations obtained from the 1973 U.S. Geological Survey data, is presented in figure 21. The profile is constructed with time of travel on the horizontal axis to permit examination of the rate of change in DO concentration in the downstream direction. The profile also includes some brief notes relative to the predominant factors controlling DO concentrations in various segments of the river.
DISCUSSION
The DO regimen of the Willamette can be

RIVER KILOMETERS ABOVE MOUTH
300 250 200 150 100 60 45 30 15 0
z 0 i= <(
110
~ 100 :::> 1-<( en 1-z ~ 90 ~ w 0..
z z 80 w C)
>-X 0
~ 70 > ...J 0 en en 0 60
EXPLANATION
Max. J Avg. T USGS Min.
Max. T I
Avg. * DEQ I
Min . .a.
150
T
100 50 30 20 10 0
RIVER MILES ABOVE MOUTH
FIGURE 17.-Dissolved oxygen concentrations measured in the Willamette River by U.S. Geological Survey and DEQ during 1973 summer low-flow period, July 5 to August 18. Note break in scale below RM 30.
conveniently examined and explained by taking a hypothetical downriver excursion while referring to the DO profile in figure 21.
HYPOTHETICAL BOAT TRIP
Assume that the boat travels at the average velocity of the river and that observers in the boat can obtain daily average DO concentrations by sampling at a single point in each cross section at any time of day.
RM 185 TO 120
The trip would begin at Eugene-Springfield and proceed downriver to RM 120 (Albany), a distance of 65 mi (105 km), in 1-1/3 days. DO concentrations throughout this segment are consistently near 100 percent oxygen saturation, or about 9.4 mg/1 at the prevailing average water temperature of 18-19°C. The McKenzie River enters the Willamette at RM 175 but, with a DO concentration of 100 percent saturation,
131
does not cause any measurable change in DO conditions. The impact on DO concentration of waste-water loads from municipalities and industries in Eugene-Springfield, Corvallis, and other smaller communities is discernible only in the immediate vicinity of outfalls. Because of the relatively light loading of ammonia in this segment, nitrification is insignificant, and the high atmospheric reaeration capability of the shallow, fast moving segment quickly counterbalances the relatively slow rate of carbonaceous deoxygenation.
RM 120 TO 50
During the next 1-2/3 days the boat travels 70 river miles (103 km) from Albany to Newberg. Beginning at RM 114, DO concentrations begin to decrease slowly and then to decrease rapidly below Salem (RM 85). Between RM 120 and 50, DO concentrations decline approximately 30 percent from near 100 percent to 70 percent, a

RIVER KILOMETERS ABOVE MOUTH
100 00 0
z Q 100 1-c:( a: ::::> 1-c:( (/)
1-z w 0 a: w 0..
z -, 80 z w (.!)
> X 0 Cl w > ..J 0 (/) (/)
Ci
80 60
I I I I I I I
.J.
EXPLANATION
Max. I Avg. l USGS Min.
Max • .,. I
Avg. t DEQ
Min.
40
T I I
I
I I
6 I I I I I I I ....
20 0
RIVER MILES ABOVE MOUTH
FIGURE 18.-Dissolved oxygen concentrations measured in the Willamette River by U.S. Geological Survey and DEQ during 1974 summer low-flow period, August 1-15.
drop of approximately 2.5 mg/1 at the prevailing water temperatures. The decrease is due to large industrial ammonia loads that induce the growth of nitrifying bacteria on the cobhly, diatom-encrusted river bottom. The bacterially induced nitrification proceeds at a high rate, outpacing the capacity of the river in this reach to produce DO by atmospheric reaeration.
RM 50 TO 10
The next 40 river miles, (64 km) require a traverse time of about 8 days. DO variations in this segment are minor relative to the large DO decrease between RM 120 and 50. The observed DO variations include (I) an approximate 5 percent increase in saturation caused by at Willamette Falls and the inflow of cool, highly oxygented water from the Clackamas River, (2) a slight decline in percent saturation between RM 21 and 12.8 resuting from carbonaceous deoxygenation, and (3) a somewhat sharper decline between RM 12.8 and 10 owing to the additive effects of carbonaceous deoxygenation and the anomalous oxygen demand. Because the rate of carbonaceous deoxygenation is slow, the total reaeration effectively balances deoxygenation in this
132
segment and keeps DO concentrations at a relatively stable level.
RM 10 TO 1.5
During the next 6 days the boat progresses only 8.5 mi (14 km). Despite the slow net downstream movement, the boat moves erratically owing to once-or-twice daily flow reversals and strong eddy currents induced by tidal effects. Between RM 10 and 6 the river often appears turbid, and there is a gradual decrease in DO concentration (7 percent) which results primarily from the anomalous demand. From RM 6._9 to 3.5, DO concentrations remain fairly constant (approximately 63 percent saturation or 5.4 mg/1). In the vicinity of RM 3.5, near the entrance to Multnomah Channel (see fig. 10), DO concentrations begin to rise sharply owing to mixing with the Columbia River. At RM 1.5, approximately 1-1/2 days travel time from RM 3.5, the DO concentration has risen to 7 4 percent saturation. Concentrations continue to rise, finally reaching 97 percent saturation at the Columbia River confluence.
HISTORICAL PERSPECTIVE
The 1973 DO profile is compared with

30
a: 120 12 w 28
1-...J
a: w 0..
z en en 0 ~ :::> i= 110 Percent DO saturation 11 <( 26 (j) <( a: ...J a: (.!) w :::> ...J (.)
1- ...J {/) <(
~ w
en w 1- ~ a: z 24 ~ ~ 100 10 z· a a: 0
~ w i= 0.. <( u.i ~ a: a: 1- :::> z z w 1-w
90 9 (.) 22 ~ (.!) z >- 0 w X (.) 0..
0 ~
a z w w 1-w (.!) a: > >-...J w
0 X 20 ~ en 80 8 0 en a 3: c w
> ...J 0 en en
Water temperature 7 a 18 70
16
TIME, tN HOURS
FIGURE 19.-Di~l dissolved oxygen and water temperature curves, Willamette River at Harrisburg (RM 161), August 7-9, 1973. August 7 and 8 were bright, sunny days; August 9 was partly cloudy.
historical DO conditions in figure 22. Similarities among the profiles include the zone of DO recovery below RM 5.0 caused by mixing with Columbia River water, a DO low point probably due to benthal oxygen demand between RM 10 and 5, and a DO increase (at least in several of the profiles) immediately below RM 26.5 caused by reaeration at Willamette Falls and the inflow of the Clackamas River.
The DO profiles do not reflect any simple time trend, although there is a clear pattern of recent improvement as shown by the 1968-73 profiles. In general, the improvement in DO conditions is attributable to the reduction in BOD loads (fig. 23) and related benthal deposits, and, after 1954, to increased flows in summer and fall
I33
from reservoir flow augmentation (table 2). Interestingly, the 1971 DO profile tends to be higher than the 1973 profile despite the fact that secondary waste-water treatment plants were not all in operation until 1972. This apparent anomaly can be explained by the higher augmented flows during summer 1971 and the fact that during 1968-71, pulp and paper mills were on a program whereby highly concentrated wastes were stored and discharged to the river only during high-flow conditions.
Despite the general improvement in recent DO conditions, Horowitz and Bazel (1974, p. 77-122) analyzed historical DEQ river BOD5 data and concluded that BOD5 concentrations had not changed significantly between 1954 and

0:: w 1-_. 0:: 7 w Cl. Cl)
~ <( 0:: (!) _. _. ~
~ z 0 ~
~ 6 1-z w (.) z 0 (.)
~ f"'-1~ //"-- ( ""' I r, //
\ ,j .,.,,." -,,"~ I / ., )
.,.," .._, ;._ .,,' z w (!)
>X 0
'---.,----·"'~ ~ r
~---" '~ ../'- \I I
Cl w .,.-~/ EXPLANATION
> _. ~5 Cl)
Cl
0 6 12 18 24 6 12 18 24
TIME, IN HOURS
RM 16.8 (depth, 20ft ) RM 12.8 (depth, 20 ft ) RM 7.0(depth, 3ft) RM 7.0 (depth, 20ft)
6 12 18 24
FIGURE 20.-Diel dissolved oxygen curves at four sites in the Tidal Reach Willamette River, July 24-26, 1973.
1971. This suggested that reductions in BOD loading had not occurred and, thus, that BOD removal could not be cited as a major cause of improved DO conditions. They discussed several reasons for this paradox, emphasizing river sampling problems and the inaccuracies of the Winkler method (used by DEQ) for measurement of DO. (The Winkler method is subject to interferences by reduced chemical compounds, including sulfite, that were sometimes present in significant quantities in the river below pulp mill waste-water outfalls.)
A confounding factor not discussed by Horowitz and Bazel is that river deoxygenation rates have decreased markedly between the 1950's and the 1970's. In the early 1950's, Velz (1951) found kr's in the range of 0.10-0.14, as contrasted with the prevailing 1973-74 k,'s of 0.02-0.06. Assuming first order BOD decay and
134
a k,.=0.04, only 40 percent ofBODult was utilized in 5 days under 1973-74 conditions as opposed to the 76 percent exerted at a k7=0.12 under 1950's conditions. Thus, depending on k7 and the time of travel between an outfall and the sampling site, 1954 and 1971 river BOD5 samples from a common site may give equivalent results in terms of concentration. However, because of the higher rate of deoxygenation, the 1954 BOD5 sample reflects more upstream oxygen depletion than the 1971 sample.
The above example underscores the inadequacies of the BOD5 test and the need for determining deoxygenation rates and BODult concentrations from a long-term BOD test (Supplement C). Without this information, determination of DO and BOD time trends are exceedingly difficult, and q uan tita ti ve analysis of the DO regimen is subject to gross errors.

RIVER MILES ABOVE MOUTH
187 134 86.5 50 39 34 28.6 17 12.8 10 7.0 6.0 3.5 1.5 0
z 0 i= <(
~ 100 1-<( (/)
1-z 90 w (.) [[ w Q.
~ 80
z w (!)
>- 70 X 0 0 w > 60 _J
0 (/) (/)
0 50
Reaeration at Willamette Falls
~
I Nitrifi- )-- 02 demand~
-cat; on -
1
atmosp""''c ,ea.,at;on
Discharge at Sa•em=6000 ft3fs (170 m3Jsl
DO recovery
~'
~Suspected benthic --L-f o2 demand --,~Mixing with the _
I • Columbia River I I I I
0 5 10 TIME OF TRAVEL, IN DAYS
15
FIGURE 21.-Composite DO profile of the Willamette River under 1973 steady low-flow conditions. The profile is plotted on a time-of-travel basis to emphasize the relative rates that DO is removed or added in various reaches. Major controlling factors are noted for appropriate reaches.
CONCLUSIONS
1. Dissolved-oxygen concentrations in the Willamette River have increased dramatically during the last two decades. The improvement has resulted primarily from basinwide secondary waste-water treatment, removal of Portland's dry-weather combined sewer overflows from the Tidal Reach, increased low-flow augmentation from storage reservoirs, and chemical recovery processes at pulp and paper mills (Gleeson, 1972). Besides the high DO concentrations, the present-day (1977) DO regimen of the Willamette also reflects certain recently evolved phenomena (see below) that may occur in other rivers as basin wide secondary treatment becomes more prevalent.
2. Augmented summer streamflows provide a large source of DO-rich water and reduce the detention time of oxygen-demanding materials in the river. The chemical recovery processes at the pulp and paper mills have effectively reduced the discharge of oxygen-demanding wood fibers and sulfite. During the 1973-74 summer studies, DO concentrations were above 5.0 mg/l throughout the river with the exception of bottom waters isolated in deep sections of Portland Harbor. As in past years, the lowest
135
DO concentrations in the Willamette continue to occur during summer low-flow conditions in the Portland Harbor between river mile (RM) 7.0 and 3.0.
3. Discharge of carbonaceous waste waters, historically the major cause of severe DO depletion in the Willamette, has been dramatically reduced. Concentrations ofBODultin the river were consistently less than 4 mg/l. Moreover, 45 percent of the BODult in the river during 1974 low-flow conditions was from nonpoint (diffuse) sources and in-stream production, rather than from waste-water outfalls. Equally as important as the reduction in BOD loads is the fact that the carbonaceous material in effluents from the secondary waste-water treatment plants is now relatively stable. Thus, the material is oxidixed more slowly in the river (k,=0.02-0.06) than the material previously discharged in primary waste-water effluents (k,=0.10-0.14).
4. The low levels of BODult and the reduced rate of carbonaceous deoxygenation imply strongly the need for long-term BOD determinations, in lieu of the traditional BOD5 test, as a basis for DO-BOD studies in rivers receiving secondary waste-water effluents. This concept, though recognized for decades by

RIVER KILOMETERS ABOVE MOUTH
1-Portland-1 Harbor Salem Newberg
a: w !:: 8 ....1
a: w a.. (I)
~ <( a: (!) 6 ....1 ....1
~ ~ z· w (!) 4 > X 0 Cl w > ....1 0 ~ 2 Cl
150 100 0
0~------~---------L--------~--------~------~ 100 80 60 40 20 0
RIVER MILES ABOVE MOUTH
FIGURE 22.-Comparison of 1973 with historical DO conditions in the Willamette River for the summer low-flow period. (Historical data are adapted from Gleeson, 1972.)
researchers, has generally not been incorporated in the design of river-quality monitoring or effluent standards programs.
5. DO conditions in the Willamette would be even better were it not for the presence of two significant oxygen-demanding processes: (1) nitrification, carried on by periphytic nitrifying bacteria in a shallow, cobblyreach between RM 120 and 52.5, and (2) an anomalous oxygen demand in the deeper part of Portland Harbor below RM 13 that is probably due primarily to benthal deposits. Of the two, nitrification has the larger impact on river DO concentrations, causing a 10-20 percent reduction in DO concentration between RM 86.5 and 52.5 during summer low-flow conditions. Nitrification was not documented during past river sampling despite sizable ammonia loads from pulp and paper mills since 1955. Whether or not the onset
I36
of nitrification is related to the reduction in carbonaceous loads by secondary treatment is uncertain.
6. Algal growth and primary production in the river have probably increased during the last several decades. However, studies (Rickert and others, 1977) suggest that the algal regime is in a stable state, with no suggestion of "blooms" or a shift from the historically predominant diatom assemblage. Primary production measurements indicate that photosynthesis and respiration by aquatic plants during summer conditions can result in a small net production of DO in some reaches. However, photosynthesis and total community (plants and animals) respiration result in an approximate balance between oxygen production and oxygen consumption over much of the river. A possible exception to this balance may occur in

~3-z w _. <(
> :::> 0 -w z 0 1-<( _. =>2ra.. 0 a.. u. 0 U)
z 0 r-
_. _. ~
~ 61rz 0 <(
EXPLANATION
0Total
-
0 Industrial
fm Municipal
-
-
-
-
-
~ o.__r---~~~····=·.~· ..... ='_::: ... ==··; ... =.:l·:~::l __ ~~~m·=; .... ·=~ .. :~ .... =!:;.::·:_~.:.::·::~ .... =:.:l;::·:· __ ~~-f~~--~~---~--~~~-~--~~~-=~--~-~ .. I I I lla 1930 1954 1963 1967 1970 1973-74
FIGURE 23.-Historical average daily BOD loads to the Willamette River during dry BODult (lb/d) BODult (kb/d)
weatherperiods.Apopulationequivalent= 0.24 = O.ll .(1930-
70 data adapted from Gleeson, p. 70; 1973-7 4 data from U.S. Geological Survey synoptic studies (see table 5).
the deeper reaches of Portland Harbor. Here, algae transported from upstream spend long periods of time in a respiratory phase (02 consumption > 02 production) because of the relatively shallow depth ("'10ft or 3m) of the euphotic zone in comparison to the total depth of the water column (-- 40 ft or 12 m).
ACKNOWLEDGMENTS
We wish to acknowledge the aid and encouragement of the Non-Federal Advisory Committee on Water Data for Public Use. Our special thanks go to the members of the Advisory Committee's Ad Hoc Working Group on River Quality Assessment. During the Willamette Study, the group included Howard B. Brown, Robert A. Canham, Edward J. Cleary, Laurence R. Jahn, John E. Kinney,
137
Walter A. Lyon, John A. Roller, and Clarence J. Velz. The personal inspiration and insights of Velz were invaluable in writing this report. Timothy L. Miller and Joseph F. Rinella aided greatly with field and laboratory work and with many of the calculations and ideas. Alex E. Gonsalves and Brandon Burch did the work on the 30 technical illustrations. We also wish to acknowledge the helpful review suggestions of David H. Peterson, Doyle W. Stephens, Keith V. Slack, Warren C. Westgarth, and Glenn D. Carter.
SELECTED REFERENCES
American Public Health Association and others, 1969, Glossary of water and wastewater control engineering: Am. Public Health Assoc., 387 p.
--1971, Standard methods for the examination of water and wastewater [13th ed.]: New York, Am. Public Health Assoc., 874 p.

Bennett, J. P., and Rathbun, R. E., 1972, Reaeration in open-channel flow: U.S. Geol. Survey Prof. Paper 737, 75 p.
Brown, Eugene, Skougstad, M. W., and Fishman, M. J., 1970, Methods for collection and analysis of water samples for dissolved minerals and gases: U.S. Geol. Survey Techniques Water Resources Inv., book 5, chap. AI, 160 p.
Churchill, M. A., Elmore, H. L., and Buchingham, R. A., 1962, The prediction of stream reaeration rates: Internat. Jour. Air and Water Pollution, v. 6, p. 467-504.
Ehrlich, G. G., 1975, Nitrifying bacteria (most probable number method): U.S. Geol. Survey Quality of Water Branch Tech. Memo. 75.13, January 24, 1975.
Gleeson, G. W., 1936, A sanitary survey of the Willamette River from Sellwood Bridge to the Columbia River: Oregon State Univ., Corvallis, Eng. Expt. Sta. Bull. Series 6, 103 p.
--1972, The return of a river, the Willamette River, Oreg.: Advisory Comm. on Environmental Sci. and Technology and Water Resources Inst., Oregon State Univ., Corvallis, 103 p.
Harris, D. D., 1968, Travel rates of water from selected streams in the Willamette River basin: U.S. Geol. Survey Hydrol. Inv. Atlas HA-273, 2 sheets.
Hines, W. G., Rickert, D. A., McKenzie, S. W., and Bennett, J.P., 1975, Formulation and use of practical models for river-quality assessment: U.S. Geol. Survey Circ. 715-B, 13 p.
Hines, W. G., Rickert, D. A., and McKenzie, S. W., 1976, Hydrologic analysis and river quality data programs: U.S. Geol. Survey Circ. 715-D, 20 p.
Horowitz, Jerome, and Bazel, L. A., 1974, Evaluation of water quality standards in California, Maryland, Ohio, and Oregon: Case studies, 1965-72: Prepared by Enviro Control, Inc., Rockville, Md., for U.S. Environmental Protection Agency, Div. Water Planning, Contract No. 68-01-184, 106 p.
Krenkel, P. A., and Orlob, G. T., 1962, Turbulent diffusion and the reaeration coefficient: Jour. Sanitary Eng., Div. Am. Soc. Civil Engineers, v. 88, no. SA-2, p. 53-83.
Lee, J. D., 1951, Sewage and Industrial Wastes: v. 23, no. 2, p. 164.
Merryfield, Fred and Wilmot, W. G., 1945, progress report on pollution of Oregon streams: Oregon State Univ., Corvallis, Eng. Expt. Sta. Bull. Series 19, 53 p.
Phelps, E. G., 1944, Stream sanitation: New York, John Wiley & Sons, Inc., 209 p.
Rickert, D. A., and Hines, W. G., 1975, A practical framework for river-quality assessment: U.S. Geol. Survey Circ. 715-A, 17 p.
Rickert, D. A., Hines, W. G., and McKenzie, S. W., 1975,
138
Planning implications of dissolved-oxygen depletion in the Willamette River, Oregon, in William Whipple, Jr. ed., Urbanization and water quality control: Minneapolis, Am. Water Resources Assoc., p. 70-84.
--1976, Project development and data programs for assessing the quality of the Willamette River, Oregon: U.S. Geol. Survey Circ. 715-C, 31 p.
Rickert, D. A., Petersen, Richard, McKenzie, S. W., Hines, W. G., and Wille, S. A., 1977, Algal conditions and the potential for future algal problems in the Willamette River, Oreg.: U.S. Geol. Survey Circ. 715-G, 39 p.
Rogers, H. S., Mockmore, C. A., and Adams, C. D., 1930, A sanitary survey of the Willamette Valley: Oregon State Univ., Corvallis, Eng. Expt. Sta. Bull. Series 2, 55p.
Sainsbury, J. B., 1970, Benthal deposits of the Willamette River, Oregon: Dept. Environmental Quality rept., Portland, Oreg. 43 p.
Slack, K. V., Averett, R. C., Greeson, P. E., and Lipscomb, R. G., 1973, Methods for collection and analysis of aquatic biological and microbiological samples: U.S. Geol. Survey Techniques Water Resources Inv. book 5, chap. 4, 165 p.
Starbird, E. A., 1972, A river restored: Oregon's Willamette: Natl. Geog., v. 141, no. 6, p. 817-834.
Theriault, E. J., 1927, The oxygen demand of polluted waters, I: U.S. Public Health Service Bull. 173.
Tuffey, T. J., 1973, The detection and study of nitrification in streams and estuaries: Ph.D thesis submitted to the Graduate School, Rutgers Univ., New Brunswick, N.J., 180 p.
Tuffey, T. J., Hunter, J. V., and Matulewich, V. A., 1974, Zones of nitrification: Water Resources Bull., v. 10, no. 3, p. 555-563.
Velz, C. J., 1951, Report on natural purification capacities, Willamette River: Natl. Council for Stream Improvement of the Pulp, Paper, and Paperboard Industries, Inc.: School of Public Health, Michigan Univ., Ann Arbor, 80 p.
--1961, Supplementary report on lovrer Willamette River waste assimilation capacity: Natl. Council for Stream Improvement of the Pulp, Paper, and Paperboard Industries, Inc.: School of Public Health, Michigan Univ., Ann Arbor, 28 p.
--1970, Applied stream sanita.tion: New York, John Wiley & Sons, Inc., 619 p.
Wezernak, C. T., and Gannon, J. J., 1967, Oxygen-nitrogen relationships in autotrophic nitrification: Applied Microbiology, v. 15, no. 5, p. 1211-1215.
Willamette Basin Task Force, 1969, Hydrology, Willamette Basin Comprehensive Study, Appendix B: Pacific Northwest River Basins Comm. Rept., 163 p.

SUPPLEMENTAL INFORMATION

SUPPLEMENT A-RIVER SELF-PURIFICATION PROCESSES
In the natural setting, self-purification capacity is not a fixed quantity but rather a range in potential that varies from season to season and through each reach of the river. Moreover, selfpurification processes occur within a river and, thus, are subservient to it's physical character-that character being largely defined by the interplay of streamflow, water temperature, and channel morphology.
In broad terms, self-purification has been defined (American Public Health Association and others, 1969) as "The natural processes occuring in a stream or other water body that result in the reduction of bacteria, satisfaction of BOD (biochemical oxygen demand), stabilization of organic constituents, replacement of depleted dissolved oxygen, and the return of the stream biota to normal."
With regard to the DO regimen of rivers, the processes of most interest are:
(1) Carbonaceous deoxygenation via microbial oxidation of dissolved or suspended organic matter (as used here, analogous to BOD).
(2) Benthal oxygen demand, caused by oxidation of settled organic or reduced -chemical materials.
(3) Nitrification, caused by microbial oxidation of ammonium to nitrite and nitrate ions.
(4) Photosynthesis (oxygen production) and respiration (oxygen consumption) by aquatic plants.
(5) Atmospheric reaeration. Atmospheric reaeration and photosynthesis are commonly termed "DO sources"; the other processes are called "DO sinks."
CARBON A CEO US DEOXYGENATION
Carbonaceous deoxygenation is the process by which aquatic organisms, in the course of respiration and synthesis (or growth), oxidize organic carbon. Dissolved oxygen is consumed in the process and waste products, predominantly carbon dioxide and water, are emitted. When a large quantity of oxidizable carbonaceous material is present, as in rivers polluted with sewage, severe oxygen depletion may develop. All stream organisms, including bacteria, fungi, protozoa, zooplankton, phytoplankton, periphyton, macro-invertebrates, rooted plants, and fish are involved in the
I40
process. However, it is usually assumed that a mixed group of heterotrophic bacteria are primarily responsible for carbonaceous deoxygenation.
The quantitative determination of carbonaceous deoxygenation in rivers is commonly based on "Phelps Law" (Phelps, 1944): "The rate of biochemical oxidation of organic matter is proportional to the remaining concentration of unoxidized substance, measured in terms of oxidizability." In mathematical form the expression is:
dL -- = K1L dt
which may be integrated to
Lt Lt logeJ: =- K1t or log10 L = -0.43K1t= -kt
and
_!:_t = 10-klt L
where Lis the initial oxidizability at time zero (the initial total amount of oxidizable matter) and Lt is the corresponding oxidizability at time t. The term Lt I L is the fraction of oxidizable organic matter remaining, and conversely, (1 -Ltl L) is the fraction that has been oxidized.
ln the simplest cases, the rate of oxidation in the river is approximated by the empirical constant k1. A typical k1, corresponding to rates found for many primary domestic sewage effluents and their receiving waters, is 0.1 at 20°C. As with most biochemical reaction rates, the rate of oxidation increases with increasing temperature and decreases with decreasing temperature. For a k1 = 0.1 and 20°C the oxidizable matter is reduced by a constant percentage, 20.6 percent (not a constant amount), each day and is 99 percent oxidized at the end of 20 days.
In many rivers, actual deoxygenation rates vary from rates determined by the standard laboratory BOD test (American Public Health Association and others, 1971, p. 489-495). The reason for this is often related to the morphology of the river channel. In shallow, cobbly reaches, biological growth attached to the· streambed extracts organic matter from the flowing water, performing in a manner similar to that of a biological trickling filter. Other

rivers may perform as natural activated sludge systems with the growth dispersed as biological floc throughout the water column. In both instances the effect on the river is removal of BOD in excess of that normally expected in the time of travel through the reach.
This accelerated removal of BOD has been termed "biological extraction" (Velz, 1970) and is relatively independent of normal carbonaceous deoxygenation. In biological extraction, the removed BOD is not oxidized at the instant of extraction but is merely transferred from the flowing stream by biophysical contact with the biological growth (biofilm). If extraction and biofilm accumulation continue uninterrupted by a scouring freshet, a steady state is approached and the daily BOD satisfied within the biofilm equals the BOD extracted. For the steady-state condition, the impact on river DO can be quantified using first-order decay kinetics. The first-order kinetics are employed by reducing the two processes to a single composite process having a higher deoxygenation rate than that calculated for carbonaceous deoxygenation alone. For conditions other than steady state, it is necessary to deal with normal satisfaction in transit and to consider separately the oxygen demand from the biofilm accumulation. This nonsteady-state situation is quite difficult to simulate accurately in a quantitative manner.
Because extraction is a function of contact opportunity of the biological growth with the flowing stream, highest rates occur in shallow, swift-flowing reaches with high surface-tovolume ratios and rapid mixing. The extraction rate is also influenced by the biochemical nature of the BOD. For example, the introduction of waste waters with high concentrations of oxidizable carbon can result in rapid extraction. In contrast, the oxidized carbonaceous materials found in effluents of secondary-treatment systems are less suitable as sources of immediate food energy for biological organisms; therefore, extraction rates tend to be lower.
BENTHAL OXYGEN DEMAND
In slow-moving reaches, reduced river velocity allows settling of suspended organic materials. If such materials are continuously deposited without disturbance by a scouring
141
freshet, accumulation continues until the material added to the deposit per day is equal to that oxidized in the accumulation per day (Velz, 1970, p. 162-178). Under these steady-state conditions a high, relatively constant oxygen demand will occur. For accumulations less than the steady-state level, the oxygen demand is correspondingly less. During winter, cold temperatures drastically reduce the rate of decomposition of the depositing materials, and excessive accumulation of the materials may occur. If such accumulations are not scoured by spring floods, they may exercise a heavy demand on oxygen resources (in excess of that under steady-state conditions) during subsequent periods of high temperature.
For quantitative determination it is necessary to make a distinction between organic deposits arising principally from (1) recently deposited raw or poorly treated municipal and industrial waste water and (2) older accumulations of partly oxidized organic river sediments derived from soil erosion, land wash, and dead terrestrial or aquatic vegetation. The latter is referred to as a benthal deposit, and the former as a sludge deposit. In many instances both types of accumulation occur simultaneously, although the decomposition rates of the two deposits can be quite different.
Sludge deposits undergo decomposition of a semianaerobic character, with reduced oxygendemanding end products readily leaching in to the stream. Fresh sludge deposits may produce large quantities of gas that result in sludge boils, inducing a process of resuspension and redeposition until decomposition is essentially complete. In contrast, benthal deposits of organic river sediments tend to be less active with much slower reaction rates. However, if extensive and relatively recent, such deposits may still depress the level of DO in reaches that are relatively stagnant.
Quantitative studies of benthal deoxygenation in rivers usually require difficult in situ benthal respirometer measurements coupled with a study of the origin and hydraulic behavior of the deposited materials. Other pertinent information can be obtained from DO sampling (preferably longitudinal, horizontal, and vertical traverses), channel geometry measurements, and bottom sampling with dredges. Modified BOD tests, using slurried

benthic material, are also useful for understanding the nature of the deposited material.
NITRIFICATION
Nitrification is the biochemical oxidation of ammonium to nitrite and nitrate ion by Nitrosomonas and Nitrobacter bacteria. Dissolved oxygen is consumed by the bacteria in the process according to the following chemical equations:
+ Nitrosomonas NH4 + 1% 02 ~========•
and
Nitrobacter N02-+11202 ~======~
Approximately 4.3 mg of dissolved oxygen is required for each milligram of ammonium-N oxidized to nitrate-N (Wezernak and Gannon, 1967).
In unpolluted waters, ammonium ion concentrations are usually very low, and nitrification cannot significantly affect the DO concentration. However, in rivers receiving large loads of ammonia, nitrification can be a major cause of deoxygenation.
Several mathematical expressions have been formulated for describing nitrification. The first-order decay expression,
dN =-K N dt n ,
where N = concentration of ammonia-nitrogen Kn =rate constant,
is the most commonly employed in practical application. Note that the expression is mathematically identical to the forementioned expression for the oxidation of organic matter.
Studies by Tuffey (1973) suggest that nitrification in rivers may not be as prevalent as commonly assumed. His conclusions suggest that nitrification of sufficient intensity to cause rapid oxygen depletion is almost always restricted to (1) shallow "surface active" reaches with good opportunity for attached growths of nitrifiers or (2) tidal rivers or estuarine embayments with very long detention
142
times and abundant suspended matter to serve as a nitrifier-attachment substrate.
PHOTOSYNTHESIS AND RESPIRATION
Photosynthesis is the process by which plants, in the presence of sunlight, water, carbon dioxide, and nutrients, grow and synthesize organic matter while giving off oxygen
(6C02 + 6H20 ligh~ C6H1206 + 602). Res-nutnents
piration is the process by which living organisms use oxygen and organic matter and release oxidation products, primarily carbon dioxide and water.
When present in large numbers, aquatic plants (phytoplankton, periphyton, and rooted plants) may be a significant source of DO during daylight hours. However, all aquatic organisms, including plants, are constantly respiring. At night when no oxygen is produced, plant respiration can cause a large decrease in river DO concentrations. The resulting diel variations in DO concentrations are usually most pronounced in (1) shallow reaches where periphytic algae or rooted plants are abundant or in (2) the euphotic zone of deep relatively stagnant reaches.
The rate of photosynthesis is usually determined by measuring the amount of oxygen produced or the amount of carbon dioxide consumed. Conversely, the rate of respiration is determined by measuring the amount of oxygen consumed or the amount of carbon dioxide produced.
Three common methods for studying photosynthesis and respiration are documented by Slack, Averett, Greeson, and Lipscomb (1973, p. 92-122). The methods are characterized by the following general approaches: (1) in situ bioassay tests using the concept of light- and dark-bottle incubation, (2) in situ light- and dark-enclosures similar to (1) except that the method is usually employed in shallow reaches where periphytic growth is prevalent, and (3) intensive diel DO measurements made at different points in the river (the diel curve method).
ATMOSPHERIC REAERA TION
As atmospheric gas, oxygen dissolves in river water as a function of: 1. The solubility of oxygen in water, which

depends on: a. The partial pressure of oxygen in the at
mosphere above the river. This can usually be considered constant for a particular altitude and temperature condition.
b. The water temperature. As water temperature increases the solubility of oxygen decreases and vice versa.
c. The concentration of dissolved solids or presence of surface films. This is usually not an important consideration except in saline coastal waters or in grossly polluted rivers.
2. The rate of solution of oxygen, which is controlled by: a. The degree of undersaturation (or oxy
gen deficit) of the water. For example, fresh water at 20°C and 760 mm pressure has an oxygen saturation value of approximately 9.2 mg/1. If the river water contains only 7.2 mg/1 of dissolved oxygen, it has an oxygen deficit of 2.0 mg/1. The rate of solution is directly proportional to the magnitude of the oxygen deficit.
b. The temperature of the water. At higher temperatures oxygen will dissolve more quickly even though the total amount of oxygen that can potentially dissolve decreases.
c. The relative exposure of the river surface to the atmosphere. For example, if the river is ice covered, the water surface is prevented from contacting the atmosphere, and no atmospheric oxygen enters solution. In contrast, windy conditions tend to increase the rate of reaeration.
3. The rate of dispersion of dissolved or gaseous oxygen under the water surface, which is by: a. Molecular diffusion. In entirely quies
cent water, the rate of dispersion is controlled entirely by molecular diffusion, which is responsible for the solution of oxygen from molecule to molecule of water. The rate is proportional to the difference in DO concentration between any two points (the concentration gradient). Reaeration would be a very slow process if molecular
diffusion were not aided by mixing. b. Mixing. Rivers are never quiescent.
Mixing phenomena induced by streamflow and channel configuration play an important part in dispersing dissolved and gaseous oxygen to the subsurface. Mixing does not alter the basic function of molecular diffusion. It is well established that no amount of mixing per se can cause solution-solution occurs at the molecular level owing to diffusion. However, by constantly renewing the airwater interface and the contact between saturated and under-saturated molecules of water, mixing increases the opportunity for molecular diffusion. Thus, if all other factors were equal and the same oxygen deficit were present, a shallow, fast-moving reach would be reaerated faster than a deep, slow-moving pool.
Reaeration is a complex dynamic process whose quantification is based on empirical equations and intensive field data. The most commonly used form of equation is
where C= dissolved oxygen concentration C8 =dissolved oxygen saturation value at
the particular temperature C8 -C= dissolved oxygen deficit K2 =the reaeration coefficient proportional
to stream depth and velocity. The reaeration coefficient cannot be mea
sured directly in sizeable stream systems, and even the reach-to-reach measurement of Cs-C requires intensive fieldwork. The ability to estimate reaeration is, thus, largely related to the ability to account for streamflow, water temperature, channel morphology, and oxygen deficit on a systematic, segment-to-segment basis.
I43
SUPPLEMENT B-FIELD CALIBRATION OF DISSOLVED-OXYGEN METERS
The DO meter selected for use during the study was the YSI model 54 with a 50-ft DO and temperature probe (model 5419). During the

summer of 1973, a series of tests were made to compare calibrations using the Winkler (wet chemical) method (American Public Health Association and others, 1971, p. 474-481) with the YSI calibration chamber (model 5075) method. The tests led to selection of the calibration chamber method as the standard procedure for field calibration. The basic procedure is outlined below:
1. All meters are turned on at least 1 hour before calibration to achieve electronic stability and are left on until all measurements are completed for the day.
2. Prior to calibration, the probe and membrane are checked for general condition and for gas bubbles inside the membrane. A loose membrane or gas bubbles were found to cause erratic DO readings.
3. Meters are shielded from direct sunlight and wind to avoid the heating and cooling of meter circuitry. DO readings were observed to change with exposure of the meter case to direct sunlight, cold, wind, or early-morning dew. Field experience suggested that uncontrolled heating and cooling could cause errors in DO measurements approaching 1.0 mg/l.
4. The DO probe is inserted into the calibration chamber and sealed with the probe's rubber gasket. Calibration is accomplished with the chamber and probe immersed in water or in air after a 5-10 minute equilibration period. The advantage of water calibration is that the chamber is immersed in the river and calibration is made under the same conditions for which the meter is to be used. However, when the chamber is immersed in water, it must be checked for leakage into the calibration chamber. Such leakage was found to cause erroneous calibrations. In air, the chamber can be used only with the newer model YSI DO probes that have the thermister located adjacent to the DO membrane. The advantages of the air calibration technique are its relative speed and ease. When using the chamber in air, it must be shielded from direct sunlight and wind to prevent calibration errors resulting from large fluctuations in temperature.
5. During the 5-10 minute equilibration period, meter stability is checked by switching back and forth between the temperature and DO modes until readings are repetitive. Then, with the probe still in the calibration chamber,
144
the meter is set at the DO saturation value using a standard DO saturation table.
6. Step 5 is repeated before each sampling traverse or at about 2-hour intervals.
SUPPLEMENT C-ANALYSIS OF BOD
The laboratory BOD tests provided data for calculating BODult and carbonaceous deoxygenation rate, k1. The test utilized a YSI DO meter (model 54) with a self-stirring probe (model 542a). Approximately 2,500 BOD samples were analyzed in 1973-7 4 using the method described below.
DILUTION WATER
Willamette River water was used as dilution water for the BOD test of waste waters because (1) the water has a ready-made bacterial "seed" acclimated to the types of waste waters entering the river, (2) the BODult concentration ("background") was low, and (3) there were sufficient nutrients and no known interferences due to toxic materials. Fresh dilution water was collected daily, and at least three BOD tests were made on each batch.
INHIBITION OF NITRIFICATION
To measure only the carbonaceous oxygen demand in the BOD test, it was necessary to use 1-allyl-2-thiourea as an inhibitor. Allylthiourea was selected over other available inhibitors on the basis of discussion with researchers having recent experience. Stock solutions were made every 14 days and added to the BOD bottle on incubation days 0, 5, 10, and 15 to provide an approximate active concentration of 0.5 mg/1 in the BOD sample (Tuffey, 1973).
CALIBRATION
Meters and BOD probes were turned on at least 1 hour before calibration and left on until the end of the day. To obtain accurate results over a wide range of DO concentrations and among several BOD probes, the wand on each self-stirring mechanism was adjusted to form a circle three-fourths in. (1.9 em) in diameter (measured with a rule in back of the moving band). Prior to calibration, each probe was checked for holes or wrinkles in the membrane and for air bubbles under the membrane.
Calibrations were made using distilled water stored at room temperature in a 14 gallon

carboy. Triplicate analyses of DO were made each day on the distilled water by the Winkler method. If the range of values from the three tests was less than 0.10 mg/1, the average value was ·used to calibrate the meters. If the range was greater than 0.10 mg/1, the calibration was repeated. A record was kept on the calibration of each meter. Throughout each day, the meters were checked for drift and, if necessary, recalibrated against the distilled water standard. When not in use, the probes were stored in BOD bottles filled with distilled water.
MEASUREMENT OF DO IN BOD BOTTLES
The initial reading of the BOD test was taken after the river or waste-water sample had warmed to 20±1 °C and the DO reading had stabilized. After the first reading, the DO was measured at increments of 1/2, 1, 2, 3, 4, 5, 6, 8, 10, 12, 15, and 20 days. This schedule of measurements was selected to provide an adequate distribution of data points to define accurately a time trend of BOD exertion. The BOD measurement procedure included (1) removal of a plastic cap which prevented evaporization of the water seal around the glass stopper of the BOD bottle, (2) pouring off the water seal, (3) rinsing the BOD probe with distilled water, (4) removing the glass stopper, (5) inserting the probe such that no aeration occurred in the BOD bottle, (6) turning on the stirring mechanism, (7) waiting 1-2 minutes for the probe to equilibrate, (8) recording the date, time, and DO reading on a data sheet, (9) removing the probe and replacing the glass stopper and water seal, and (10) replacing the plastic cap on the BOD bottle and returning the bottle to the incubator. Allylthiourea was added every 5 days using a pipette. Glass beads were periodically added to the sample to compensate for the loss in sample water caused by the probe measurement procedure. The beads prevented the formation of air bubbles in the neck of the BOD bottle.
If the estimated DO in the bottle would be below 2.0 mg/1 at the next scheduled reading, the sample was reaerated using an "aeration tube." The "aeration tube" procedure included (1) placing one end of the tube in the top of a clean, empty BOD bottle, (2) placing the other end in the sample bottle, (3) holding the bottles, ·one in each hand, and reaerating by vigorous
145
back-and-forth shaking for about 1 minute, (4) allowing the sample to drain back into the original sample bottle, (5) returning the BOD probe to the sample bottle, and (6) remeasuring and recording the new DO concentration.
LEE'S GRAPHICAL METHOD
Data from the BOD tests were analyzed by Lee's (1951) graphical method to obtain values for k1 and BODult· To use the method a series of graphs covenng a range of k1 values was constructed on the basis of first-order decay kinetics. For each graph a linear relation was obtained between BOD on theY-axis and time (t) on the X-axis by positioning ton an arbitrary linear distance (such as 10 in.) in proportion to (1-1o-kt). A series of grids for k1 intervals of0.02 was developed, and copies were reproduced for trial plots.
The basis for using the grids·is that a time series of BOD values which follow a specific reaction rate(k1) will plot as a straight line on a grid constructed for that rate. Thus, to determine the reaction rate of a sample, successive trial plots of laboratory BOD are made on selected grids. If the first trial plot bends downward, it indicates that the selected k1 is too low; if the plot bends upward, the selected k1 is too high. Subsequent selection of plotting grids leads quickly to the best straightline fit for the data, identifying the appropriate BOD reaction rate, k1 (see figs. 24-26).
Extrapolation of a single stage line to the right to "ultimate" time gives a direct value for BODult. Extrapolation of the line to the left can provide valuable insight into the nature of the BOD and the reliability of the BOD test. If the line intersects the Y-axis at zero time, the reaction has proceeded normally from initial incubation. An intercept above zero time indicates an immediate demand, with the Y intercept giving directly its magnitude. An intercept on the X-axis indicates a lag in the start of the reaction, and the X intercept gives the magnitude of the lag.
Examples of BOD analyses by Lee's method for river and waste waters in the Willamette basin are shown in figures 24, 25, and 26. Note in figure 25 the method used for compensating the anomalous DO readings that occurred in several samples during the first days of incubation. Such readings were believed asso-

Date Time Bottle Source Yr Mo Day (2400) No.
RM 86.5 74 08 06 0855 005
DO Days of Date Time concentration incu- BOD
Mo Day (2400) (mg/1) bat ion (mg/1)
08 06 2246 7.7 08 07 0903 7.6 0.4 0.1 08 08 1255 7.3 1.6 .4 08 09 1058 7.1 2.5 .6 08 10 1100 7.0 3.5 .7
08 11 1050 6.7 4.5 1.0 08 12 0945 6.6 5.5 1.1 08 14 1405 6.4 7.6 1.3 08 16 1125 6.1 9.5 1.6 08 18 0940 6.0 11.5 1.7
08 21 0845 5.8 14.4 1.9
a: 08 26 0845 5.5 19.4 2.2 w 2.5 t ..J
a: w 0..
~ 2.0 <( a: c.? ..J
1.5 ..J
~
~ z 0 1.0 BOD5=1.0
i= BOD2o=2.2 <( B0Dult=2.7 a: 1- k1=0.04 ~ 0.5 (.) z 0 (.)
0 0 0 0 2 3 4 6 8 10 12 15 20 30 co
TIME, IN DAYS
FIGURE 24.-Lee's graphical method for analyzing k1 and BODult• Willamette River, RM 86.5.
ciated with either (1) supersaturation of the original sample (common in tributary samples) or (2) excessive algal respiration in the first day or two caused by lightless incubation of the sample.
SUPPLEMENT D-SPECIAL BOD EXPERIMENTS
A series of special experiments was conducted on BOD samples to evaluate possible methodological errors. Experiments and results are briefly summarized below.
(1) Incubation in 1- and 4-liter bottles to evaluate the effect of a variable surface area. In
I46
general, incubation in large bottles with surface-to-volume ratios smaller than the standard 300-ml BOD bottle did not result in measurably different BOD2o or k1 values.
(2) Settled and unsettled BOD's to examine the oxygen demand associated with suspended matter in river samples. Results indicated that between 10 and 30 percent of 20-day BOD was due to suspended matter. Microscopic examination indicated that the settleable material was predominantly diatoms, microbial cellular materials, and fine-grained inorganic river sediments. All BOD values reported in the main text are for unsettled samples.

Date Time Bottle Source Yr Mo Day (2400) No.
McKenzie R. 74 08 23 1100 272 at Eugene
pump DO Days of
Date Time concentration incu- BOD Mo Day (2400) (mg/1) bat ion (mg/1)
08 23 1721 10.4 08 24 1055 10.1 0.7 0.3 08 25 1030 9.6 1.7 .8 08 26 1010 9.6 2.7 .8 08 27 0924 9.3 3.7 1.1
08 28 0930 9.2 4.7 1.2 08 29 1005 9.2 5.7 1.2 08 31 1235 9.1 7.8 1.3 09 02 1220 8.9 9.8 1.5
09 04 1050 8.8 11.7 1.6
09 07 1000 8.6 14.7 1.8 09 12 1208 8.4 19.8 2.0
a: w 2.5 t ...J
a: w a.. (I) 2.0 :;:! <( a: (.!)
...J
...J 1.5 :;:!
~ z 0 1.0 i= BOD5=0.6 <( a: BOD2o=1.3 1- BODutt=1.6 ~ 0.5 () k1=0.04 z 0 ()
Cl 0 0
0 2 3 4 6 8 10 12 15 20 30 co
TIME, IN DAYS
FIGURE 25.-Lee's graphical method for analyzing k1 and BODult• McKenzie River. Incubation of cool (l7°C), supersaturated sample at 20°C caused apparent immediate 0 2 demand at day zero. To correct for this, the measured data are fitted with a straight line to establish k 1 (slope ofline). A line of this slope is then drawn through zero and extrapolated to obtain a value of BODult·
(3) Additions of various doses of nitrifier inhibitor (allylthiourea) to examine (a) efficiency of nitrification inhibition and (b) the impact of the inhibitor on carbonaceous deoxygenation. Results suggested that maintenance of a 0.5 mg/1 concentration of allylthiourea in the BOD bottle effectively stopped nitrification without a significant effect on carbonaceous deoxygenation.
(4) Examination of the impact of stirring
147
frequency on BOD exertion. Tests included stirring frequencies of (a) 2-3 times per day, (b) the standard DO measurement schedule (see "Measurement of DO in BOD Bottles," Supplement C), and (c) every 5 days. Results indicated no significant differences in BOD2o from the three treatments.
(5) Comparison of samples that were (a) chilled ( 4 ° C) in the field, returned to the laboratory, and warmed to 20°C with (b)
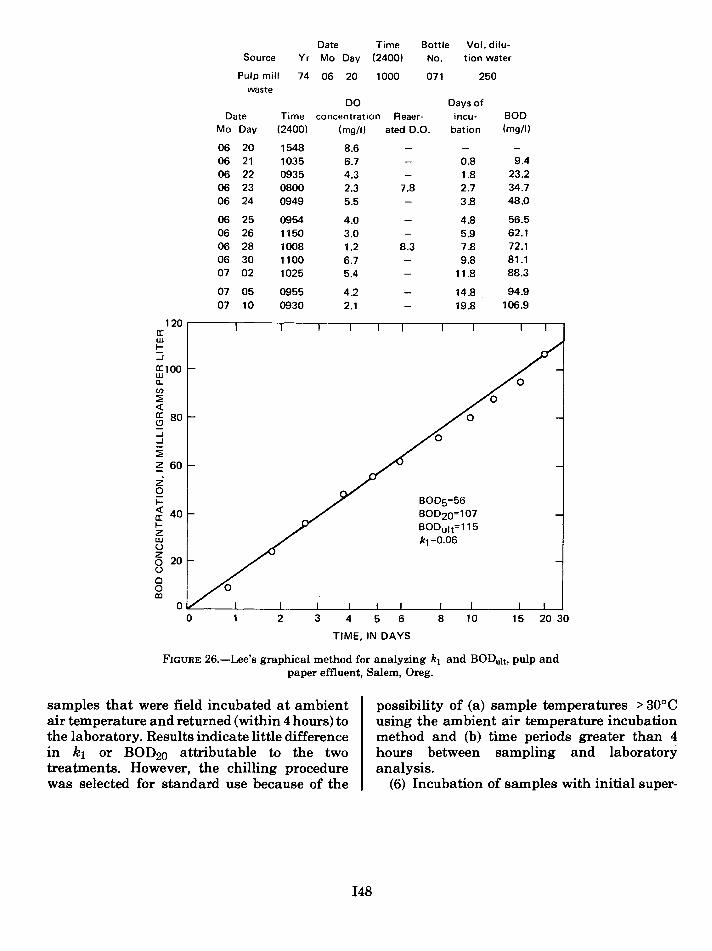
Date Time Bottle Vol. dilu-Source Yr Mo Day (2400) No. tion water
Pulp mill 74 06 20 1000 071 250 waste
DO Days of Date Time concentration Reaer- incu- BOD
Mo Day (2400) (mg/1) ated D.O. bat ion (mg/1)
06 20 1548 8.6 06 21 1035 6.7 0.8 9.4 06 22 0935 4.3 1.8 23.2 06 23 0800 2.3 7.8 2.7 34.7 06 24 0949 5.5 3.8 48.0
06 25 0954 4.0 4.8 56.5 06 26 1150 3.0 5.9 62.1 06 28 1008 1.2 8.3 7.8 72.1 06 30 1100 6.7 9.8 81.1 07 02 1025 5.4 11.8 88.3
07 05 0955 4.2 14.8 94.9 07 10 0930 2.1 19.8 106.9
120 a: w t: ...J
0:::100 w a. (/)
::2: <! ffi 80 ...J ...J
::2: ~ 60
z' 0 i= BOD5=56 <! 40 BOD2o=107 a: 1- BODult=115 z w k1=0.06 (.)
z 20 0
(.)
Cl 0 co
0 0 2 3 4 5 6 8 10 15 20 30
TIME, IN DAYS
FIGURE 26.-Lee's graphical method for analyzing k1 and BODult. pulp and paper effluent, Salem, Oreg.
samples that were field incubated at ambient air temperature and returned (within 4 hours) to the laboratory. Results indicate little difference in k1 or BOD20 attributable to the two treatments. However, the chilling procedure was selected for standard use because of the
148
possibility of (a) sample temperatures > 30°C using the ambient air temperature incubation method and (b) time periods greater than 4 hours between sampling and laboratory analysis.
(6) Incubation of samples with initial super-

saturated DO concentrations. Supersaturated conditions were prevalent in the cool, high DO waters of Cascade tributaries and upstream segments of the Willamette. Erratic readings were common in these samples during the first several days, probably owing to air-bubble formation caused by sample warming and bubble escapement during bottle openings. A modification of the Lee's grid technique (fig. 25) was used to compensate for these and other discrepancies that were believed to be artifacts not representative of the river environment.
The overall BOD measurement program yielded two major results:
(1) The BOD probe procedure (described in Supplement C) was proven to be an easy, reliable method for analyzing large numbers of river and waste-water samples. This conclusion was verified not only by these special experimental tests but also by experience gained from the large number of routine BOD measurements.
(2) The 20-day laboratory BOD test provided a reasonable representation of river and wastewater deoxygenation phenomena in the Willamette River system. This conclusion was substantiated by several independent analyses of the intensive DO balance data presented in this report and by subsequent application of the WIRQAS DO model (Circular 715-J).
SUPPLEMENT E-DETAILED RIVER DO AND WATER TEMPERATURE DATA
A synopsis of the DO and water temperature
z RM 185 McKenzie River B..M..1.6..1 RM 134 '0 Z-
wl-CD- 5 ft CD- 5 ft CD- 5 ft co-8ft
(!)<( DO= 102 DO= 100 DO= 100 DO= 97 >-CI:
n=7 n = cont n = cont n = cont x::> g~ 120
T' = 19 T = 11 T = 20 T= 20
~~ 100 ow 80 (/)() (/)CI: -w 60 Co_
0 12 24 0 12 24 0 12 24 0 12
data collected on the Willamette and major tributaries during 1973 and 197 4 is pre sen ted in figures 27-30'. Figures 27-29 show data from 1973 studies for the segments RM 185-86.5; RM 86.5-28.6, and RM 28.6-1.5. Figure 30 summarizes 1974 data for the segment RM 86.5-6.0. Several of the figures include more than one data graph per sampling site. The multiple graphs are presented because the DO data were segregated and averaged on the basis of incremental water depths. This allows the examination of the vertical variability in DO and temperature that occurred at some of the deeper sampling sites below RM 86.5. As described previously in "Results," no significant cross channel (horizontal) variations were noted.
Besides the basic data, the four figures also include complementary information on sampling site water depth, sampling method, and number of samples. Note that the number of samples varied from site to site because of differences in study duration, variations in channel configuration, equipment malfunctions, and the use (at some sites) of continuous monitors. The notations used in the figures are
24
CD-channel depth DO-average DO concentration in percent
saturation n-number of samples
cont-continuous monitoring T-average water temperature in °C.
BM...11l ~ Saotiam Bi~!H RM 86.5 CD- 6ft CD- 6ft CD- 5 ft c·D -7 tt ~
I
DO =94 DO o;= 1'()2 DO= 96 DO =98 n = 14 n = cont n = 11 n = cont "T = 20 T = 19 ~ T= 20 T= 20
,../" ~
/ 1-
0 12 24 0 12 24 0 12 24 0 12 ~
TIME, IN HOURS
24
FIGURE 27.-Dissolved-oxygen concentration in the Willamette River and major tributaries between RM 185 and 86.5, August 6-12, 1973. Each graph presents average of 3 days of sampling. No depth stratification in DO concentrations were observed at these stations. See text for explanation of symbols.
149

SAMPLING DEPTH, 0-10 FEET
RM 86.5 RM 72 RM 50 RM46 RM 39 RM 34 B..M...2S...§ CD- 7ft CD- 5 ft CD- 22ft CD- 28ft CD- 31 ft CD- 31 ft CD- 25ft
z DO= 93 DO= 82 DO= 72 DO= 74 DO= 73 -·I
DO= 73 0
n = cont n = 108 n = 128 n = 120 n = 104 n = 102 ~ f = 19 T= 20 T' = 20 T' = 21 co"' T' = 21 T' = 21 <( .... Q).
co .... a: "'u :::> Q)
100 o= 1- zo <( u (I) 80 /' I"" 1- ,-- ----z 60 _L I I
w u a: w 0..
~ z SAMPLING DEPTH, MIDFLOW (MIDDLE THIRD OF WATER COLUMN) w CJ >- _!_ _!_I
DO= 72 _!_I I
X DO= 93 05 = 81 DO= 71 DO= 72 DO= 71 DO= 72 0 n = cont n = 108 n = 120 n = 101 n = cont n = 80 n = 133 0 w T= 19 T=20 T= 20 'T= 21 "f= 21 f = 21 f = 21
> ...J 100 t- t-0 (I)
~ (I) 80 ....__ t-c ,.--.. - __.,...-
60 0 I I I
12 24 0 12 24 0 12 24 0 12 24 0 12 24 0 12 24 0 12 24
TIME, IN HOURS
FIGURE28.-Dissolved-oxygenconcentrationintheWillametteRiverbetweenRM86.5and28.6,August15-17, 1973. Each graph represents average of 3 days of sampling. Several DO measurements were made at depths less than 20 ft (6 m) at RM 50, 46, 39, 34 and 28.6. However, results are not presented here because measurements were identical to those shown in "Midflow, graphs. See text for explanation of symbols.
150

looo4 c:n .......
RM 28.6 c0-25ft
100
80
DO= 76 n = 104 T = 20
__.,...... ~ 601 I I I I
i= <{ a: ::> 1-<{ en 1-z w (.) a: w ~
z -:.100 z ~ 80 >-
00 = 76 n = 136 T= 20
-----X 60 '---L-L-"---'
0 0 w > ..J 0 ~ c
100 I 80
DO= 74 n = 150 T' = 20
____. 60 I I I I I
0 12 24 0
B.M...2U co -16 ft
DO= 79 n = 106 T' = 21
____.......
DO= 79 n =55 T= 21
_.....--...
~
§~ :C. ~E "' cu o"' o'-1-2
12
RM 21 1 1 CD -50 ft
DO= 81 n = 104 T= 21
___,......_
SAMPLING DEPTH, 0-10 FEET
B.M..1U CD- 25ft
co= 79 n = 100 T= 22
.---
RM 12.8 CD- 55ft
I I I
DO= 77 n = 96 T= 22
__,..-1
RM 7.0 C'D-'mt
DO= 67 n = 104 T = 22
B.M.6..Q CD- 43ft
Oo=64 n = 71 T = 22
SAMPLING DEPTH, MIDFLOW (MIDDLE THIRD OF WATER COLUMN)
DO= 78 n =54 T= 21
-
DO= 80 n =52 'T = 21
1----24 0 12 24 0
DO= 76 n =50 T= 22
-
DO= 74 n = 46 T= 22
---DO =64 n =51 T' = 22
SAMPLING DEPTH, 20 FEET OR MORE
!:"' 0~ =o. ~E .,cu 0"' 0 ... 1-2
I
DO= 73 n = 39 T=22
.__,....
12 24 0 12 24 0
TIME, IN HOURS
DO= 63 n =52 T= 22
12 24 0
DO= 63 n = 34 T' = 22
~
T
DO= 61 n =54 T= 22
~
12 24 0
B.M...U CD- 40ft
DO =65 n = 72 T' = 22
DO =64 n = 36 T = 22
T
DO= 71 n =54 'T = 21
~ L-...1..-.L.
12 24 0
B..M..1...5 CD- 40ft
DO= 75 n = 104 T' = 22
\./'"'
DO= 76 n =52 'T = 21
~
DO =84 n =53 'T = 20
'--. I
12 24
FIGURE 29.-Dissolved-oxygen concentration in the Willamette River between RM 28.6 and 1.5, July 24-26, 1973. Each graph represents average of 3 days of sampling. See text for explanation of symbols.

......... CJ1 t-:l
100
80
AM- 86.5 CD- 7ft ...,....--r-oo = 92 n = 108 T= 19
z 60 ....._L...-...JL...--L........I
0 i= <{ a: ~ 1-<{ tl)
1-z w u a: w Q.
~.100 z ~ 80
I I
DO"' 92 n =54 'T = 19
~
~ 60 ....._...__...__L....J 0 0 w > ...J 0 tl) tl)
i5
100 ~
80
60 LJ.. 0
s: ... oCI> =C. -5~ o"' 0 .... t-.E
12 24
AM 72 CD- 5 ft ...--.-.-DO= 87 n = 98 T= 20
~~
f-
...L...l_._L
I DO •87 n = 101 T= 20
AM 50 CD- 22ft
DO= 77 n = 72 T = 21
~ ...1.._.l..._.L
AM 39 Co:3Tft
DO =84 n = 64 'f = 22
~
SAMPLING DEPTH, 0-10 FEET
AM 28.6 AM 21.1 CD - 25 ft CD - 50 ft
' DO= 80 n = 72 'f= 2~
~ ...L...l_._L
' ' ' DO= 83 n = 64 T= 23
I _.......-..._ ..,i__L_J_
AM 12.8 C~t
I I i 150 = 84 n = 72 T=24
.,./ ...L-J.._j_
AM 10 Co:40ft
t I I
i50 = 84 n = 72 T= 24
/' _L____l_
SAMPLING DEPTH, MIDFLOW (MIDDLE THIRD OF WATER COLUMN)
I
DO= 77 n =50 T = 21
-
I I I
DO= 79 n = 72 'T = 22
t-
I
DO =80 n = 74 T= 23
I
DO= 82 n = 61 T = 23
-
I
i50 = 80 n = 40 T = 24
-
I I
DO= 80 n = 40 'f= 24
-~ 1- _,..---
t- ---- ---- ~ .,.,...,-_ ,...._r--
0
s: ... 0~ :=a. ~E ... m -o ... 0 0 1--
I
12 24 0
I
I
s:.., 0~ -a. iOE ~m 0 .... oo 1--
12 24 0
I 1 I
SAMPLING DEPTH, 20 FEET OR MORE
I I I
DO= 79 n = 33
"T = 22
---.... -
I I
DO= 79 n = 18 'f = 23
---I
DO= 82 n = 49 "T = 23
----
I
00=79 n =51 'f= 24
----I I I I I I I I I I I I I I I I I I
t-
12 24 0 12 24 0 12 24 0 12 24 0
TIME, IN HOURS
.J.__i__j_
I 150 = 78 n =54 'f = 24
-__,__
...L....J..._J_
12 24
RM7.0 ci)':4'21t
I I I 00 = 79 n = 72 T=24
~ f' ...i__L_1
I I I
DO= 73 n =54 T= 23
t- -
......__....... ....L_1_.l
I I I
00=69 n =54 T= 23
1'-("7"
--
0 12 24 0
AM 6.0 C~t
I I I DO= 75 n = 68 'f = 24
~ ..l..__.I.__L
I T
DO= 69 n =51 "f = 23
1:::i::::
DO= 64 n =51 'f = 23
12 24
FIGURE 30.-Dissolved-oxygen concentration in the Willamette River between RM 86.5 and 6.0, August 6-7, 1974. Each graph represents average of2 days of sampling. See text for explanation of symbols.