distance-to-default in banking: a bridge too far? · wp/06/215 distance-to-default in banking: a...
TRANSCRIPT

WP/06/215
Distance-to-Default in Banking: A Bridge Too Far?
Jorge A. Chan-Lau and Amadou N.R. Sy

© 2006 International Monetary Fund WP/06/215
IMF Working Paper
Monetary and Financial Systems Department
Distance-to-Default in Banking: A Bridge Too Far?
Prepared by Jorge A. Chan-Lau and Amadou N.R. Sy1
Authorized for distribution by David Marston and Abdessatar Ouanès
September 2006
Abstract
This Working Paper should not be reported as representing the views of the IMF. The views expressed in this Working Paper are those of the author(s) and do not necessarily represent those of the IMF or IMF policy. Working Papers describe research in progress by the author(s) and are published to elicit comments and to further debate.
In contrast to corporate defaults, regulators typically take a number of statutory actions to avoid the large fiscal costs associated with bank defaults. The distance-to-default, a widely used market-based measure of corporate default risk, ignores such regulatory actions. To overcome this limitation, this paper introduces the concept of distance-to-capital that accounts for pre-default regulatory actions such as those in a prompt-corrective-actions framework. We show that both risk measures can be analyzed using the same theoretical framework but differ depending on the level of capital adequacy thresholds and asset volatility. We also use the framework to illustrate pre-default regulatory actions in Japan in 2001-03. JEL Classification Numbers: G12, G21 Keywords: Banks, insolvency, closure, prompt corrective action, distance-to-default,
distance-to-capital Author(s) E-Mail Address: [email protected]; [email protected] 1 The authors wish to thank Aditya Narain, Andre Santos, In Won Song, and Yuji Yokoburi for their helpful comments. Any errors or omissions remain the authors’ sole responsibility.

2
Contents Page
I. Introduction ............................................................................................................................3
II. What Happens Before a Bank Default? ................................................................................4
III. A Unified Framework for Distance Measures : Distance-to-Capital...................................7 A. Distance-to-Capital: Rationale..................................................................................7 B. Distanceto-Capital: Derivation..................................................................................8
IV. Case Study: The Resona and Ashikaga Banks ..................................................................12
V. Conclusions.........................................................................................................................15
References................................................................................................................................16 Tables 1. Capital Thresholds and Bank Classification Under the U.S. Prompt-Corrective-Action Framework .........................................................................................................................6 Figures 1. Ashikaga Bank and Resona Bank: Distance-to-Capital.......................................................14 2. Asset Volatility vs. the Difference Between the Distance-to-Default and the Distance-to-Capital................................................................................................15

3
I. INTRODUCTION
Financial stability has moved to the forefront of financial surveillance work done in central banks and multilateral financial institutions. For instance, numerous central banks have started publishing financial stability reports, and the International Monetary Fund and the World Bank conduct periodic financial sector stability assessments of their member countries (Cihak, 2005). Among the quantitative tools used for assessing financial stability, an increasing number of central banks and international financial institutions are encouraging the use of market-based risk measures for banks and nonfinancial corporates, as exemplified by Tudela and Young (2003) and Chan-Lau (2006). Market-based risk measures aim at supplementing more traditional analyses based on financial statements and income account statements with the added advantage of using the forward-looking information incorporated into security prices. Securities prices are available at a high frequency and even on a real-time basis. In contrast, balance sheet data are available with lags and reported on a quarterly basis only. Whenever liquid markets for equities, bonds, and derivatives are available, market risk-based measures have been found to be more reliable than other measures relying on financial statements (Hillegeist, Keating, Cram, and Lundstedt, 2004). One particular market-based measure, the distance-to-default measure, first introduced commercially by Moody’s KMV, has become a widely used indicator of default risk for nonfinancial corporations. The application of the distance-to-default to measure risks in financial institutions is not straightforward partly due to the differences between the liabilities of these institutions compared to those of nonfinancial corporations. However, empirical studies have shown that the distance-to-default predicts well ratings downgrades of banks in developed countries and in emerging market countries. Despite the empirical support for using the distance-to-default for financial institutions as a forecasting tool of bank distress, the definition of default embedded in this measure may not capture the regulatory and supervisory complexities associated with bank interventions and bank closures. Specifically, the distance-to-default may understate the likelihood that a bank may be required to undertake corrective actions by regulators. The distance-to-default, then, may be “a bridge too far” for regulatory purposes. Regulators have a strong incentive to intervene well ahead of a bank’s default. Bank defaults (or insolvencies) have substantial welfare costs, as reported in Hoelscher and Quintyn (2003). The fiscal costs associated with banking crises can range from 3 percent of GDP, as experienced in the United States, to as high as 50 percent of GDP, as experienced in Chile and Indonesia. As a result, many countries have in place prompt-corrective-action frameworks aimed at preventing bank failure. Under these frameworks, low capitalization

4
ratios would require banks to take corrective measures even if they are still solvent. Clearly, the distance-to-default fails to capture the possibility of bank intervention by regulators. This paper is at the crossroads of two literatures. The first literature addresses the topic of bank capital regulation, including deposit insurance, and more specifically prompt corrective actions. The second literature addresses the topic of market-based measures of corporate vulnerabilities. The objective of this paper is to incorporate the insights from the capital regulation literature into quantitative measures of risk. In particular, we propose alternative distance measures of risk to the distance-to-default. These alternative measures incorporate “triggers” embedded in the prompt-corrective-action frameworks, and hence, provide better signals of when a bank would be required to take corrective actions or be subject to intervention by regulators. The rest of the paper is structured as follows. In Section II we discuss briefly the rationale for a prompt-corrective-action framework and describe those currently prevalent in Japan, the United Kingdom, and the United States. The prompt-corrective-action framework suggests that distance measures of risk other than distance-to-default may be appropriate. The conceptual differences between these distance measures are discussed in Section IV. This section also presents a unified framework for analyzing these different measures. The framework is then applied to a case study of two Japanese problem banks, Ashikaga and Resona, in Section IV. The case study also serves to illustrate the differences between the different distance measures of risk. Finally, we present our conclusions in Section V.
II. WHAT HAPPENS BEFORE A BANK DEFAULT?
Banks defaults are different from corporate defaults. In contrast to corporate defaults, a number of supervisory and regulatory actions typically precede bank defaults. Indeed, while pre-failure intervention is typically voluntary for corporates, it is most often involuntary and statutory for banks. For instance, Bliss and Kaufman (2006) compare the differences between the U.S. corporate and banking bankruptcy codes and note that while intervention is by negotiation for corporations, it is governed by statute for banks. Effective bank supervisors are supposed to take pertinent and timely corrective actions against problem banks in accordance with the banking law or prudential regulations. For instance, the Basel Committee on Banking Supervision (2002) provides guidance on the identification of weak banks, and the implementation of corrective and other actions such as bank resolution and exit. The Basel Committee recommends that banks hold capital in excess of a regulatory minimum on the basis of a number of risk factors. Typically, banks are required to maintain a capital adequacy ratio in excess of a regulatory minimum of 8 percent

5
of the risky assets.2 A number of countries have adopted the recommendations of the Basel Committee, while others impose different minimum solvency ratios. A growing number of countries have also implemented prompt-corrective-action (PCA) frameworks to identify and deal with weak banks, prior to default, to reinforce their supervisory framework. In these PCA frameworks, a number of statutory actions are taken if a bank does not meet the solvency requirements even if the bank is not in default. PCAs are typically rules-based frameworks, where rules are based on specific levels of bank capital. PCAs and in particular statutory actions prior to bank failures are often motivated by the large fiscal costs associated with bank failures and the need to avoid regulatory forbearance. Avoiding such costs has become a key objective of policy makers, especially in the aftermath of the banking crises in the 1980s and 1990s in a large number of countries. As a result, policy makers in a number of countries such as Japan, Korea, and most recently Mexico, have followed the U.S. PCA framework. This framework requires that banking supervisors and banks take a number of predefined actions depending on how undercapitalized a bank is. The adoption of a PCA framework is also increasingly considered in a number of banking systems, including the European Union.3 The precursor of most PCA frameworks is the structured early intervention and resolution model (SEIR) introduced by Benston and Kaufman (1988) (see Nieto and Wall, 2003). The SEIR is a system of mandatory responses based on predetermined capital asset ratios that trigger structured actions by the supervisor. In the United States, the 1991 Federal Deposit Insurance Corporation Improvement Act (FDICIA) emphasized the importance of capital ratios in addressing the problems that led to a large number of bank and thrift failures in the 1980s. The FDICIA contains two important provisions: (i) an early closure policy that allows bank regulators to close failing institutions even at a positive level of capital; and (ii) mandatory PCA, which allows early intervention in problem banks by bank regulators. As a result, the FDICIA includes PCA standards (in particular Section 131) which define five capital thresholds for banks. Each threshold determines the supervisory actions bank regulators can take, with increasingly severe restrictions being applied to banks as their capital ratios declined (Aggarwal and Jacques, 1998). The capital thresholds under the U.S. PCA framework are shown in Table 1. If a bank falls into one of three undercapitalized categories, mandatory restrictions are placed on its activities at an increasingly severe rate. For instance, undercapitalized banks are required to submit and implement a capital restoration plan, limit asset growth, and restrict 2 See Morrison and White (2005) for a general model of how capital regulation may or may not promote the stability of banking systems. Their model incorporates moral hazard, safety net, as well as adverse selection elements of capital regulation.
3 See Nieto and Wall (2003) for a discussion of the preconditions for the adoption of a PCA framework.

6
new lines of business. Significantly undercapitalized banks, in addition to the restrictions applied to undercapitalized banks, must restrict interest rates paid on deposits and limit transactions with affiliates, affiliated banks, and others. For critically undercapitalized banks, more stringent restrictions on activities are required and a conservator (receiver) is appointed within 90 days of the bank becoming critically undercapitalized.
Table 1. Capital Thresholds and Bank Classification Under the U.S. Prompt-Corrective-Action Framework
Capital Threshold Total Risk-Based Capital Tier 1 Risk-Based Ratio Tier 1 Leverage Ratio Well Capitalized ≥10% ≥6% ≥5%
Adequately capitalized ≥8% ≥4% ≥4% Undercapitalized <8% <4% <4%
Significantly undercapitalized
<6% <3% <3%
Critically undercapitalized
Tangible equity ≤ 2%
Source: U.S. Federal Deposit Insurance Corporation. In Japan, the PCA framework is comparable to that of the United States. The Japanese PCA thresholds depend on whether banks have international operations or domestic operations only. In the first case, the thresholds for capital adequacy ratios are 8 percent, 4 percent, 2 percent, and 0 percent. In the second case, the thresholds are 4 percent, 2 percent, 1 percent, and 0 percent. The PCA zone with a capital adequacy ratio (CAR) equal or below 0 percent could be interpreted as an insolvency or default barrier as a bank has to close down its operations when its CAR reaches 0 percent. In contrast, as in the United States, a number of increasingly severe restrictions are taken in the other PCA zones.4 The United Kingdom’s framework is a special case as it can be interpreted as increasing the “granularity” of the PCA zones compared to Japan and the United States. Indeed, in the United Kingdom, the Financial Supervisory Agency (FSA) requires different capital adequacy ratios for different banks. The FSA considers that the basic 8 percent regulatory minimum capital requirement is only appropriate for a well-diversified bank whose business, management, systems, and controls are deemed strong by the supervisory authority, and where the risks the bank are exposed to are captured adequately by the existing capital model. For an institution that does not satisfy these conditions, the FSA will use an individual capital ratios framework (ICRF) to determine an individual capital ratio above the 8 percent minimum.5 As a result, the FSA determines an appropriate capital add-on to the 4 See Financial Supervision Agency (Japan) at www.fsa.go.jp.
5 Financial Services Authority (2001), “Individual Capital Ratios for Banks,” Policy Statement.

7
base 8 percent so that the bank’s individual capital ratio reflects a number of risk factors. This is the “trigger” ratio. The FSA, however, expects that banks maintain capital at a level higher than the “trigger” ratio, which is the “target” ratio. Unlike the U.S. framework, a number of countries, such as India, allow some discretion to the supervisor in the types of actions that can be taken once a PCA threshold is breached (see RBI, 2000). The following sections develop a unified framework which goes beyond the typical distance-to-default measure to include market-based measures of the distance to different capital thresholds (or PCA zones). Our main argument supporting this distance-risk measure framework is that bank regulators may be interested in events which occur before defaults, especially when a PCA framework exists.
III. A UNIFIED FRAMEWORK FOR DISTANCE MEASURES : DISTANCE-TO-CAPITAL
A. Distance-to-Capital: Rationale
Policy makers as well as bank regulators increasingly rely on market-based measures of bank soundness to supplement accounting-based indicators. The distance-to-default measure, among market-based measures, has gained prominence in the past few years, partly due to its successful commercial implementation by Moody’s KMV. This measure of credit risk is based on Merton (1974), who models the equity of a firm as a call option on the value of its assets. The exercise price is equal to the value of the liabilities since the firm defaults when its asset value falls below the face value of its debt. The distance-to-default measure, hence, is associated with the probability that the market value of a firm’s assets falls below the value of its debt. For implementation purposes, the face value of debt is assumed equal to the sum of the short-term liabilities plus half the long-term liabilities, as obtained from balance-sheet data. The model is then calibrated using the market value of the firm and the observed (or implied) equity price volatility. Among market practitioners, it is widely agreed that the distance-to-default is a useful measures for assessing the credit risk of a nonfinancial corporation. Also, for banks both in mature and emerging market economies the distance-to-default has proved useful for predicting rating downgrades.6 When applied to banks, though, the concept of distance-to-default as an absolute default risk measure is not without a number of limitations. First, the risk associated with leverage for a bank differs significantly from that for a nonfinancial corporation. The business model of a bank rests on leverage, as banks mainly fulfill an intermediary role between depositors and borrowers. For a given credit rating or level of credit risk, banks are more leveraged than a
6 See for instance Gropp, Vesala, and Vulpe (2002) for banks in developed countries, and Chan-Lau, Jobert, and Kong (2004) for banks in emerging market countries.

8
nonfinancial corporation. The distance-to-default, however, would assign a higher risk score to the bank due to its higher leverage. Second, the distance-to-default assumes that a bank’s total equity capital can be used as a buffer. However, bank regulators and supervisors typically take action before a bank’s total equity capital is exhausted. From the perspective of a bank regulator or supervisor, hence, the value of the liabilities of a bank is not the only relevant default barrier. Within the PCA framework discussed above, the distance-to-default may overstate the likelihood that the bank would be required to undertake corrective measures as its capital ratio falls. As a viable alternative to the distance-to-default, we present risk measures for banks that take into account factors that may lead to intervention by banking supervisors. In this section, we propose a unified framework, the distance-to-capital, which includes a number of market-based measures of bank problems. In particular, we use the idea common to PCA frameworks that increasingly lower bank capital adequacy ratios indicate mounting bank problems. In this framework, capital thresholds as defined by the PCA framework or by the bank supervisor complement the typical default threshold. Bank default, therefore, becomes only one additional threshold which is, typically, reached at a later stage. In our framework, the PCA framework or the bank supervisor first identifies the relevant capital thresholds, which are typically defined as different values of a bank’s capital adequacy ratio. In a second stage, the bank’s distance-to-capital thresholds can be calculated, including the distance-to-default. The framework is derived next.
B. Distance-to-Capital: Derivation
The proposed distance-to-capital measure, which includes the distance-to-default measure, is a special case derived from the structural model of corporate debt first introduced by Black and Scholes (1973) and Merton (1974). The framework is built on a simple accounting identity: the value of the firm, V, (or the value of its assets) should be equal to the sum of the values of its debt, D, and equity, E. Because debt is senior to equity, shareholders are residual claimants on the firm: the firm’s assets are first used to pay debtholders, and whatever is left is distributed to shareholders. Concisely, the value of equity can be written as
max(0, )E V D= − . (1) The payoff to equity holders is equivalent to a call option on the value of the firm with a strike price equal to the face value of debt. The strike price of the option is also known as default barrier. Given an option pricing formula, knowledge of any two of the following three variables, the value of the firm, the debt owed by the firm, and the market value of equity, is sufficient for estimating the remaining unknown variable. In most practical applications, the
9
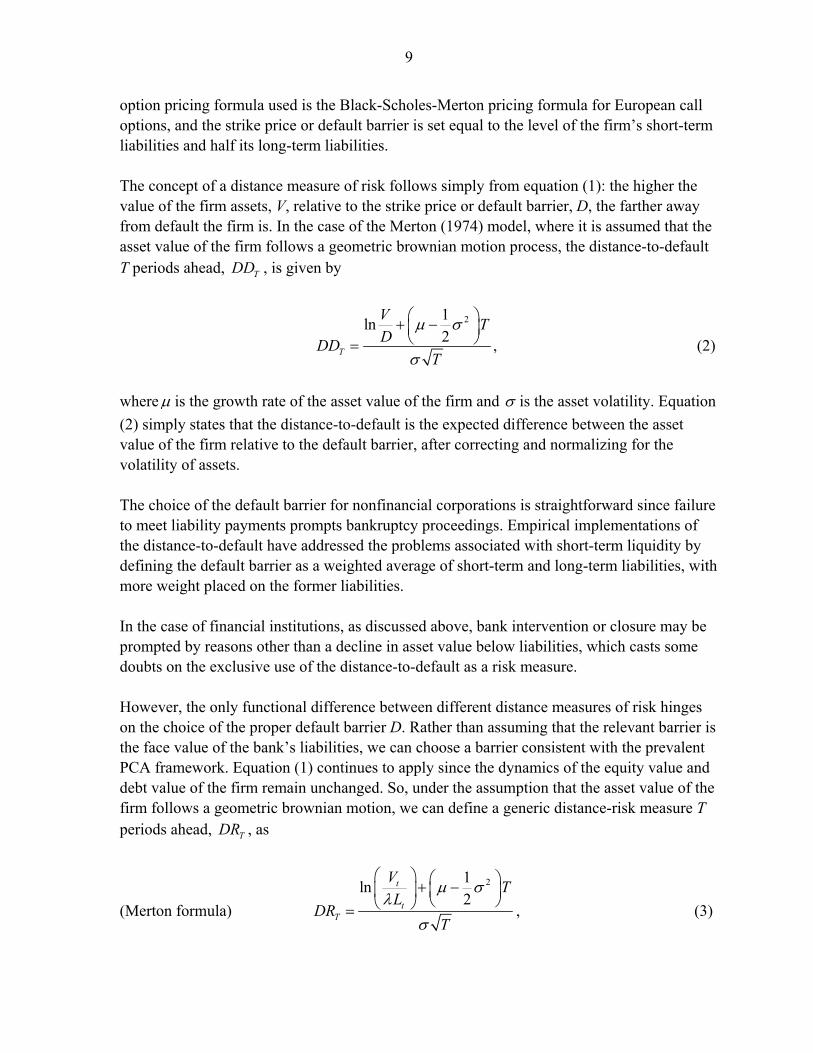
option pricing formula used is the Black-Scholes-Merton pricing formula for European call options, and the strike price or default barrier is set equal to the level of the firm’s short-term liabilities and half its long-term liabilities. The concept of a distance measure of risk follows simply from equation (1): the higher the value of the firm assets, V, relative to the strike price or default barrier, D, the farther away from default the firm is. In the case of the Merton (1974) model, where it is assumed that the asset value of the firm follows a geometric brownian motion process, the distance-to-default T periods ahead, TDD , is given by
21ln2 ,T
V TDDD
T
µ σ
σ
⎛ ⎞+ −⎜ ⎟⎝ ⎠= (2)
whereµ is the growth rate of the asset value of the firm and σ is the asset volatility. Equation (2) simply states that the distance-to-default is the expected difference between the asset value of the firm relative to the default barrier, after correcting and normalizing for the volatility of assets. The choice of the default barrier for nonfinancial corporations is straightforward since failure to meet liability payments prompts bankruptcy proceedings. Empirical implementations of the distance-to-default have addressed the problems associated with short-term liquidity by defining the default barrier as a weighted average of short-term and long-term liabilities, with more weight placed on the former liabilities. In the case of financial institutions, as discussed above, bank intervention or closure may be prompted by reasons other than a decline in asset value below liabilities, which casts some doubts on the exclusive use of the distance-to-default as a risk measure. However, the only functional difference between different distance measures of risk hinges on the choice of the proper default barrier D. Rather than assuming that the relevant barrier is the face value of the bank’s liabilities, we can choose a barrier consistent with the prevalent PCA framework. Equation (1) continues to apply since the dynamics of the equity value and debt value of the firm remain unchanged. So, under the assumption that the asset value of the firm follows a geometric brownian motion, we can define a generic distance-risk measure T periods ahead, TDR , as
(Merton formula)
21ln2
t
tT
V TL
DRT
µ σλ
σ
⎛ ⎞ ⎛ ⎞+ −⎜ ⎟ ⎜ ⎟⎝ ⎠⎝ ⎠= , (3)
10
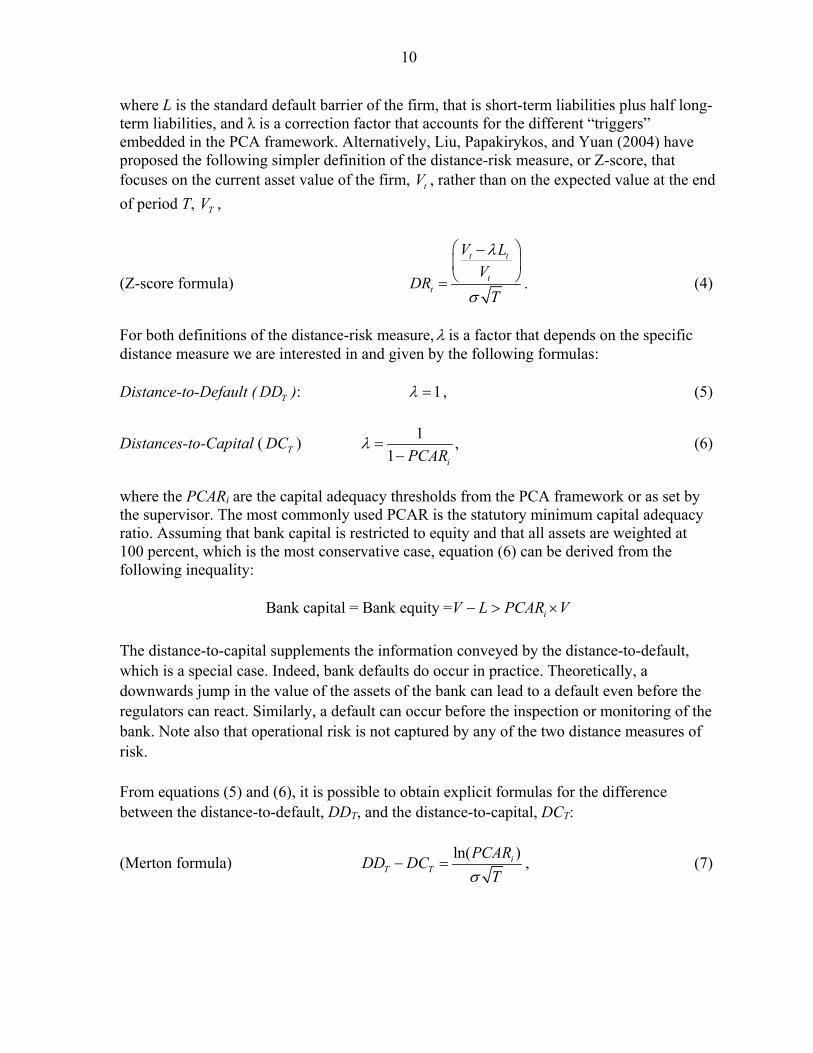
where L is the standard default barrier of the firm, that is short-term liabilities plus half long-term liabilities, and λ is a correction factor that accounts for the different “triggers” embedded in the PCA framework. Alternatively, Liu, Papakirykos, and Yuan (2004) have proposed the following simpler definition of the distance-risk measure, or Z-score, that focuses on the current asset value of the firm, tV , rather than on the expected value at the end of period T, TV ,
(Z-score formula)
t t
tt
V LV
DRT
λ
σ
⎛ ⎞−⎜ ⎟⎝ ⎠= . (4)
For both definitions of the distance-risk measure,λ is a factor that depends on the specific distance measure we are interested in and given by the following formulas: Distance-to-Default ( TDD ): 1λ = , (5)
Distances-to-Capital ( TDC ) 11 iPCAR
λ =−
, (6)
where the PCARi are the capital adequacy thresholds from the PCA framework or as set by the supervisor. The most commonly used PCAR is the statutory minimum capital adequacy ratio. Assuming that bank capital is restricted to equity and that all assets are weighted at 100 percent, which is the most conservative case, equation (6) can be derived from the following inequality:
Bank capital = Bank equity = iV L PCAR V− > × The distance-to-capital supplements the information conveyed by the distance-to-default, which is a special case. Indeed, bank defaults do occur in practice. Theoretically, a downwards jump in the value of the assets of the bank can lead to a default even before the regulators can react. Similarly, a default can occur before the inspection or monitoring of the bank. Note also that operational risk is not captured by any of the two distance measures of risk. From equations (5) and (6), it is possible to obtain explicit formulas for the difference between the distance-to-default, DDT, and the distance-to-capital, DCT:
(Merton formula) ln( )iT T
PCARDD DCTσ
− = , (7)

11
(Z-score) 1
i
iT T
PCAR VPCAR L
DD DCTσ
⎛ ⎞⎜ ⎟−⎝ ⎠− = . (8)
It is important to analyze the key factors that would make the two market-based risk measures differ. First and not surprisingly, the distance-to-capital becomes increasingly larger than the distance-to-default as the level of capital adequacy threshold from the PCA framework (PCAR) increases (Equations 7 and 8).7 Intuitively and notwithstanding “jumps,” one should expect a problem bank having trouble meeting a large regulatory capital buffer much prior to default. Second, in Merton’s framework, the difference between the distance-to-default and the distance-to-capital depends only on the level of the capital adequacy threshold and the asset volatility of the bank. In the Z-score framework, the difference is also affected by the asset-liability ratio of the bank. An examination of equations (7) and (8) indicates that the difference between both measures is negligible when assets are very volatile in the Merton and Z-score frameworks. Furthermore, the Z-score difference declines as the leverage of the bank increases, which drives down the asset-liability ratio. Equity volatility and leverage usually rise when a bank faces difficulties causing the distance-to-default and the distance-to-capital to converge. Our framework accommodates the distance-to-insolvency measures introduced and applied by Danmarks Nationalbank (2004). The distance-to-insolvency risk measure assumes that a bank is constrained by its minimum statutory capital-adequacy requirement. Similarly, our framework also accommodates the distance-to-closure measure introduced by Liu, Papakirykos, and Yuan (2004). These authors note that, contrary to default concept used in the distance-to-default measure, banks may be allowed to continue operating by supervisors even if their asset values fall below the value of their liabilities. In general, the bank supervisor may have established a number of different bank closure rules associated with its PCA framework. Similarly, bank closure rules may have been established in the context of a deposit insurance law. Such regulatory requirements would also change the “relevant” value of the call option’s exercise price and can be modeled accordingly. It should be bear in mind that our model assumes a simple balance sheet and does not take into account off-balance sheet items. Recent models of distance-to-default proposed by Moody’s KMV and described in Crosbie and Bohn (2003), and Sellers and Arora (2004) address this shortcoming and attempt to model the specificities of large complex financial
7From Equations 7 and 8, the difference between the distance-to-default and the distance to capital is greater or equal to zero.

12
institutions. The extension of the distance-to-capital to these more advanced frameworks is straightforward.
IV. CASE STUDY: THE RESONA AND ASHIKAGA BANKS
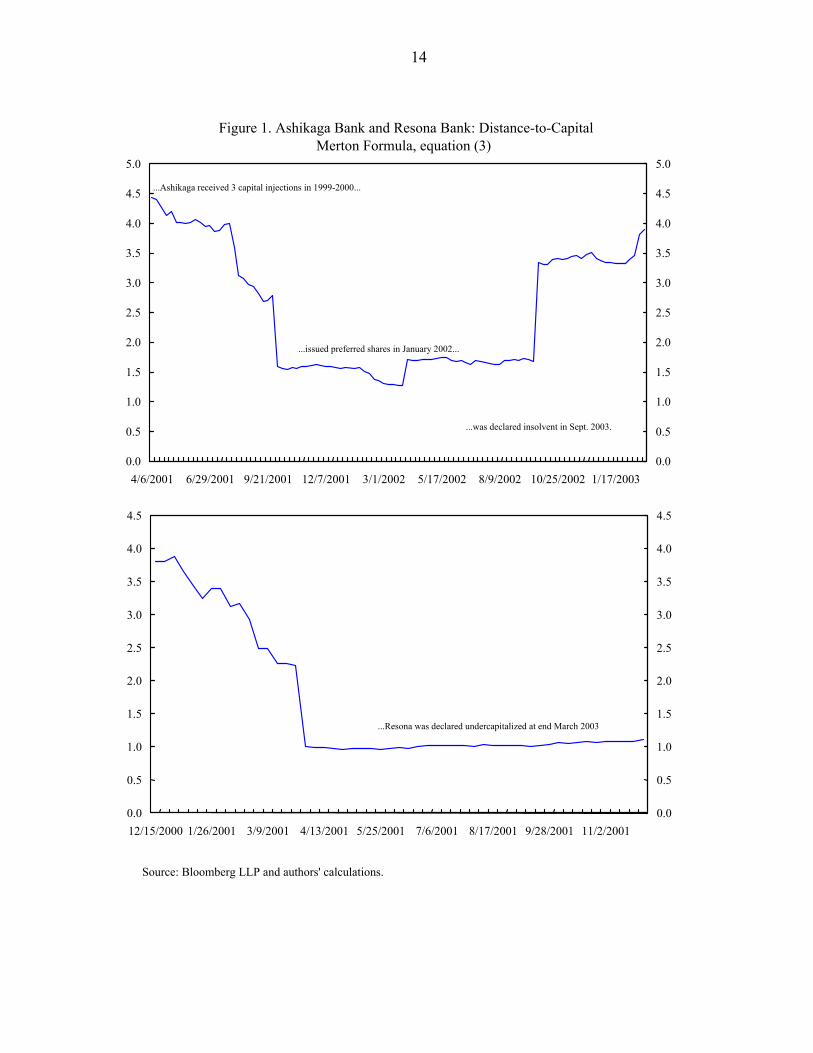
Banking sector problems in Japan in 2001–03 provide an interesting illustration of the use of a PCA framework and the difficult policy choices related to the treatment of undercapitalized and insolvent banks (see Ito, 2003). Indeed, a number of large Japanese mega- and regional banks became undercapitalized in 2001–02 as a consequence of high nonperforming loans (NPLs) in the aftermath of the burst of the technology bubble. Banks’ risk-adjusted capital fell very close to the regulatory minima of 8 percent for internationally active banks and 4 percent for domestic-business-only banks. On November 29, 2003, the Ashikaga Bank, a regional bank and important member of the Ashigin Financial Group, was nationalized after it was found to be insolvent in September 2003 (that is its debts exceeded its assets) (or in our terminology its assets hit the default barrier). As per the PCA framework and Deposit Insurance Law, Article 102–3, the Japanese Financial Services Agency (FSA) intervened to protect depositors and replace management. Shareholders lost their stake in the bank as share values reached zero. Prior to its nationalization, Ashikaga had been in trouble in the later half of 1990s as it experienced a bank run in 1997 and received public capital injections three times between 1999 and 2000. To strengthen its capital base, it issued 60 million yen of preferred shares in November 1999, and 30 billion yen of shares in January 2002. On May 17, 2003 the Resona Bank, a major part of the Resona Holding Financial Group (the then fifth largest banking group), received a capital injection after its capital adequacy ratio fell below the 4 percent PCA threshold. Article 102–1 of the Deposit Insurance Law was invoked to justify the need for government to inject capital and avoid a financial crisis, as the Resona Bank was judged to be important for financial systemic stability. All deposits were protected and management was also replaced. However, in contrast to the Ashikaga Bank, share prices tripled in a few months following the capital injection. Shares of Resona were subsequently exchanged for shares of the parent company. The Resona Bank was created in 2001 as a result of a merger of a number of banks with balance sheet problems. In May 2003, an auditing firm reported that the Resona Bank had become undercapitalized as of end March 2003, and the bank subsequently received a capital injection from the government. In both cases, prompt corrective actions were taken and the Deposit Insurance Law invoked. Stock prices of other weak regional banks fell as market participants appeared to have interpreted the regulatory actions as an increased commitment from the Japanese government to address banking sector problems. However, some questions were raised by policy makers. Ito (2003), for instance, stressed the importance of accounting rules on capital and noted that the differences in the accounting treatment of the capital of the two banks led to the disparity in their treatment.

13
In particular, different evaluation of deferred tax assets for both banks led to different values of capital adequacy ratios. In fact, Japanese accounting principles allowed loss-making banks to carry over a tax rebate—the differed tax asset—that it may receive if it earns enough profits in the future. Deferred tax assets are counted as core capital for banks. In the case of the Ashikaga Bank, all the deferred tax assets were denied by auditors and the bank became insolvent as a result. In contrast, the Resona Bank was allowed to defer three years of tax assets although the amount of deferred tax assets exceeded the amount of capital. As a result, the bank was not found to be insolvent but its capital adequacy ratio fell below the 4 percent PCA threshold. Figure 1 illustrates the behavior of the distance-to-capital measures for both banks, which indicate undercapitalization problems as early as 2001. The distance-to-capital for Ashikaga Bank dropped sharply in August and September 2001 prior to the January 2002 capital injection. Not surprisingly, the distance-to-capital increased afterwards. In contrast, the distance-to-capital for the Resona Bank dropped sharply in the first quarter of 2001, indicating serious undercapitalization. The examples of the Ashikaga and Resona Banks also illustrate a number of issues that are important for policy makers (and investors). First, market-based measures of bank problems based on capital adequacy thresholds—such as in a PCA framework—are useful because (i) bank supervisors may take a number of statutory actions before a bank default (insolvency); and (ii) the commonly used distance-to-default measure may overlook statutory actions that may occur before the default barrier is reached. Second, marked-based measures of bank problems based on capital adequacy thresholds are, not surprisingly, very sensitive to the definition and estimation of bank capital adequacy. Indeed, if supervisory or accounting frameworks for identifying impaired assets and creating the relevant proper provisions are weak, then bank capital and the capital adequacy ratios will be overstated. A PCA framework cannot, therefore, be useful without effective supervisory and accounting frameworks. As an illustration of the difference between the distance-to-default and the distance-to-capital, we calculate the difference between the two measures for the two Japanese banks. Not surprisingly, the distance-to-capital is lower than the distance-to-default (about 10–15 and 5–10 percent lower for Ashikaga Bank and Resona Bank, respectively), and both measures exhibit high correlation. The dynamics of the difference between the distance measures is the mirror image of the asset volatility dynamics and the lower the asset volatility, the higher the difference between the two measures (Figure 2). This suggests that the distance-to-capital is likely to be lower than the distance-to-default in “tranquil” periods.
14
Figure 1. Ashikaga Bank and Resona Bank: Distance-to-Capital Merton Formula, equation (3)
Source: Bloomberg LLP and authors' calculations.
0.0
0.5
1.0
1.5
2.0
2.5
3.0
3.5
4.0
4.5
5.0
4/6/2001 6/29/2001 9/21/2001 12/7/2001 3/1/2002 5/17/2002 8/9/2002 10/25/2002 1/17/2003 0.0
0.5
1.0
1.5
2.0
2.5
3.0
3.5
4.0
4.5
5.0
...Ashikaga received 3 capital injections in 1999-2000...
...issued preferred shares in January 2002...
...was declared insolvent in Sept. 2003.
0.0
0.5
1.0
1.5
2.0
2.5
3.0
3.5
4.0
4.5
12/15/2000 1/26/2001 3/9/2001 4/13/2001 5/25/2001 7/6/2001 8/17/2001 9/28/2001 11/2/2001 0.0
0.5
1.0
1.5
2.0
2.5
3.0
3.5
4.0
4.5
...Resona was declared undercapitalized at end March 2003

15
V. CONCLUSIONS
The concept of distance-to-capital introduced in this paper is an improvement over the use of the to measure the risks of individual banks. The distance-to-default, which is widely used to measure default risk among nonfinancial corporations, fails to capture the complexities associated to the existence of PCA frameworks in bank regulation. Such complexities are easily captured by the distance-to-capital measure. Furthermore, the methods used for calculating the distance-to-default can be easily extended to for calculating the distance-to-capital. While the approach proposed in this paper applies to individual banks, it appears desirable to extend it to derive a system-wide distance-to-capital measure. Such a measure could, in principle, be useful for policy makers to monitor the stability of the financial system as a whole. There are, however a number of issues with this approach. First, the existence of numerous capital thresholds would make the exercises less relevant. In contrast, one could envisage the use of a uniform capital threshold such as the minimum capital adequacy ratio or the default barrier to build a system-wide measure. Second, the aggregation of individual bank data can mask important idiosyncrasies. One alternative, suggested by the European Central Bank (2005) for distance-to-default measures, would be to focus on worst-case individual measures, such as the 10th percentile of individual distance-to-defaults measures.
Figure 2. Asset Volatility vs. the Difference Between the Distance-to-Default and the Distance-to-Capital
Source: Bloomberg LLP and authors' calculations.
Ashikaga Bank
Merton formula,
equation (7)
Z-score formula,
equation (8)
Asset volatility
0.0
0.1
0.2
0.3
0.4
0.5
0.6
0.7
4/6/2001 8/24/2001 1/4/2002 5/17/2002 9/30/2002 2/14/20030.0
0.1
0.2
0.3
0.4
0.5
0.6
0.7
Resona Bank
Asset Volatility
Merton formula,
equation (7), right axis
Z-score formula,
equation (8), right axis
0.0
0.2
0.4
0.6
0.8
1.0
1.2
1.4
1.6
1.8
10/6/2000 1/19/2001 4/27/2001 8/10/2001 11/16/20010
0.05
0.1
0.15
0.2
0.25
0.3

16
REFERENCES
Aggarwal Raj, and K. T. Jacques, 1998, “Assessing the Impact of Prompt Corrective Action on Bank Capital and Risk,” Economic Policy Review, October, pp. 23–32 (New York; Federal Reserve Bank of New York).
Basel Committee on Banking Supervision, 2002, “Supervisory Guidance on Dealing with
Weak Banks,” (Basel, Bank for International Settlements). Black, Fischer, and Myron S. Scholes, 1973, “The Pricing of Options and Corporate
Liabilities,” Journal of Political Economy , Vol. 3, pp. 637–654. Bliss, Robert, and George Kaufman, 2006, “U.S. Corporate and Bank Insolvency Regimes:
An Economic Comparison and Evaluation,” Working Paper 2006-01 (Chicago; Federal Reserve Bank of Chicago).
Chan-Lau, Jorge A., 2006, “Market-Based Estimation of Default Probabilities and Its
Application to Financial Surveillance,” IMF Working Paper 06/104 (Washington: international Monetary Fund).
Chan-Lau, Jorge A., Arnaud Jobert, and Janet Q. Kong, 2004, “An Option-Based Approach
to Bank Vulnerabilities in Emerging Markets,” (Washington: International Monetary Fund). Available via the internet at http://papers.ssrn.com/sol3/papers.cfm?abstract_id=520182.
Cihak, Martin, 2005, “How Do Central Banks Write on Financial Stability?” (unpublished;
Washington: International Monetary Fund). Crosbie, Peter, and Jeff Bohn, 2003, “Modeling Default Risk,” Moody’s KMV White Paper,
(San Francisco: Moody’s Investor Service) December 18. Danmarks National Bank, 2004, Financial Stability Report (Copenhagen). Available via the
internet at http://www.nationalbanken.dk European Central Bank, 2005, Financial Stability Review, June (Frankfurt). Gropp, Reint, Jukka Vesala, and Giuseppe Vulpes, 2002, “Equity and Bond Market Signals
as Leading Indicators of Bank Fragility,” forthcoming Journal of Money, Credit and Banking.
Hillegeist, Stephen, Elizabeth K. Keating, Donald P. Cram, and Kyle G. Lundstedt, 2004,
“Assessing the Probability of Bankruptcy,” Review of Accounting Studies, Vol. 9, pp. 5–24.
Hoelscher, David, and Mark Quintyn, 2003, Managing Systemic Banking Crises, Occasional
Paper No. 224 (Washington, International Monetary Fund).

17
Ito, Takatoshi, 2003, “Banking Sector Problems in Japan,” World Bank/IMF/SEACEN Regional Seminar on Comparative Experiences in Confronting Banking Sector Problems in Asia and Pacific Region, Kuala Lumpur, December 2.
Kaufman, George G., 2002, “Prompt Corrective Action in Banking: 10 Years Later,”
Research in Financial Services: Private and Public Policy, Vol. 14. Liu, Ying, Eli Papakirykos, and Mingwei Yuan, 2004, “Market Valuation and Risk
Assessment of Canadian Banks,” Working Paper 2004-34 (Ottawa, Bank of Canada). Merton, Robert C., 1974, “On the Pricing of Corporate Debt: the Risk Structure of Interest Rates,” Journal of Finance Vol. 29, pp. 449–470. Morrison, Alan D., and Lucy White, 2005, “Crises and Capital Requirements in Banking,”
American Economic Review, Vol. 95, No. 5, pp.1548–72. Nieto, María J., and Larry D. Wall. 2006, “Preconditions for a Successful Implementation of
Supervisors’ Prompt Corrective Action: Is There a Case for a Banking Standard in the EU?” LSE Financial Markets Group Special Paper Series, No. 165, March.
Reserve Bank of India (RBI), 2000, “Discussion Paper on Prompt Corrective Action,”
Department of Banking Supervision, Central Office, Policy Planning Division, July (Mumbai).
Sellers, Martha, and Navneet Arora, 2004, “Financial EDF Measures: A New Model of Dual
Business Lines,” Moody’s KMV White Paper, August (San Francisco: Moody’s Investor Service).
Tudela, Merxe, and Garry Young, 2003, “Predicting Default Among U.K. Companies: A
Merton Approach,” Bank of England Financial Stability Review, June, pp. 104–114.