distinct patterns of somatic genome alterations in lung ... ntrk1, ntrk2, erbb2, and . braf....
TRANSCRIPT
Nature GeNetics VOLUME 48 | NUMBER 6 | JUNE 2016 607
A rt i c l e s
Lung cancer remains the leading cause of death from cancer around the world1. An estimated 221,000 new cases and 158,000 deaths from lung cancer occurred in the United States alone in 2015 (ref. 2). The two major histological classes are non-small-cell lung can-cer (NSCLC) and small-cell lung cancer (SCLC). NSCLCs mostly comprise lung ADCs and lung SqCCs. These two NSCLC subtypes have both unique and shared clinical and histopathological charac-teristics. For example, whereas smoking is the major risk factor for both subtypes, approximately 10–15% of lung ADCs are observed in never-smokers3. Molecularly targeted therapies directed against receptor tyrosine kinases (RTKs) lead to dramatic responses in subsets of patients with lung ADCs harboring activating genomic alterations in the corresponding kinase genes, including EGFR, ALK, and ROS1 (ref. 4). Other targeted therapies under current investi-gation are directed against activating alterations in the MET, RET, NTRK1, NTRK2, ERBB2, and BRAF kinases4,5.
Recent efforts have focused on comprehensively characterizing the changes found in the genome, epigenome, transcriptome, and pro-teome in lung ADCs and SqCCs to discover new cancer driver genes that may be clinically actionable6–8. Identifying new cancer-related
To compare lung adenocarcinoma (ADC) and lung squamous cell carcinoma (SqCC) and to identify new drivers of lung carcinogenesis, we examined the exome sequences and copy number profiles of 660 lung ADC and 484 lung SqCC tumor–normal pairs. Recurrent alterations in lung SqCCs were more similar to those of other squamous carcinomas than to alterations in lung ADCs. New significantly mutated genes included PPP3CA, DOT1L, and FTSJD1 in lung ADC, RASA1 in lung SqCC, and KLF5, EP300, and CREBBP in both tumor types. New amplification peaks encompassed MIR21 in lung ADC, MIR205 in lung SqCC, and MAPK1 in both. Lung ADCs lacking receptor tyrosine kinase–Ras–Raf pathway alterations had mutations in SOS1, VAV1, RASA1, and ARHGAP35. Regarding neoantigens, 47% of the lung ADC and 53% of the lung SqCC tumors had at least five predicted neoepitopes. Although targeted therapies for lung ADC and SqCC are largely distinct, immunotherapies may aid in treatment for both subtypes.
genes can be challenging because of the large number of passenger mutations that can accumulate from prolonged exposure to tobacco carcinogens and from inherent mutagenic processes such as aberrant activity of APOBEC cytidine deaminases9. Profiling larger numbers of samples within a tumor type and combining samples across tumor types can help overcome this problem, by providing the additional statistical power necessary to distinguish important genes mutated at a lower frequency than other genes with passenger mutations10. In addition, a comprehensive comparison of recurrently altered genes found in lung ADC and lung SqCC has not been performed. Such analyses may yield insights into the similarities and differences in carcinogenesis between the diseases and elucidate the degree to which common or distinct targeted and immunological therapeutic strate-gies can be used to treat each cancer type.
RESULTSComparison of somatically altered genesTo compare the somatic profiles of lung ADC and lung SqCC and to identify new genetic alterations, we studied 660 lung ADC–nor-mal paired exome sequences (including 274 previously unpublished
Distinct patterns of somatic genome alterations in lung adenocarcinomas and squamous cell carcinomasJoshua D Campbell1,2, Anton Alexandrov3,4, Jaegil Kim1, Jeremiah Wala1,2, Alice H Berger1,2, Chandra Sekhar Pedamallu1,2, Sachet A Shukla1,2, Guangwu Guo1,2, Angela N Brooks1,2, Bradley A Murray1,2, Marcin Imielinski1,2,5, Xin Hu6, Shiyun Ling6, Rehan Akbani6, Mara Rosenberg1, Carrie Cibulskis1, Aruna Ramachandran1,2, Eric A Collisson7, David J Kwiatkowski1,8, Michael S Lawrence1, John N Weinstein6, Roel G W Verhaak6, Catherine J Wu1,2, Peter S Hammerman1,2, Andrew D Cherniack1,2, Gad Getz1,9, Cancer Genome Atlas Research Network10, Maxim N Artyomov3, Robert Schreiber3, Ramaswamy Govindan11, Matthew Meyerson1,2,12
1Cancer Program, Eli and Edythe L. Broad Institute of Harvard and MIT, Cambridge, Massachusetts, USA. 2Department of Medical Oncology, Dana-Farber Cancer Institute, Boston, Massachusetts, USA. 3Department of Pathology and Immunology, Washington University, St. Louis, Missouri, USA. 4Computer Technologies Laboratory, ITMO University, St. Petersburg, Russia. 5Molecular Pathology Unit, Massachusetts General Hospital, Charlestown, Massachusetts, USA. 6Department of Bioinformatics and Computational Biology, University of Texas MD Anderson Cancer Center, Houston, Texas, USA. 7Department of Medicine, University of California, San Francisco, San Francisco, California, USA. 8Department of Medicine, Brigham and Women’s Hospital, Boston, Massachusetts, USA. 9Department of Pathology, Massachusetts General Hospital, Boston, Massachusetts, USA. 10A full list of members and affiliations appears at the end of the paper. 11Department of Medicine, Washington University School of Medicine, St. Louis, Missouri, USA. 12Department of Pathology, Harvard Medical School, Boston, Massachusetts, USA. Correspondence should be addressed to M.M. ([email protected]) or R.G. ([email protected]).
Received 4 September 2015; accepted 12 April 2016; published online 9 May 2016; doi:10.1038/ng.3564
npg
© 2
016
Nat
ure
Am
eric
a, In
c. A
ll rig
hts
rese
rved
.np
g©
2016
Nat
ure
Am
eric
a, In
c. A
ll rig
hts
rese
rved
.
608 VOLUME 48 | NUMBER 6 | JUNE 2016 Nature GeNetics
A rt i c l e s
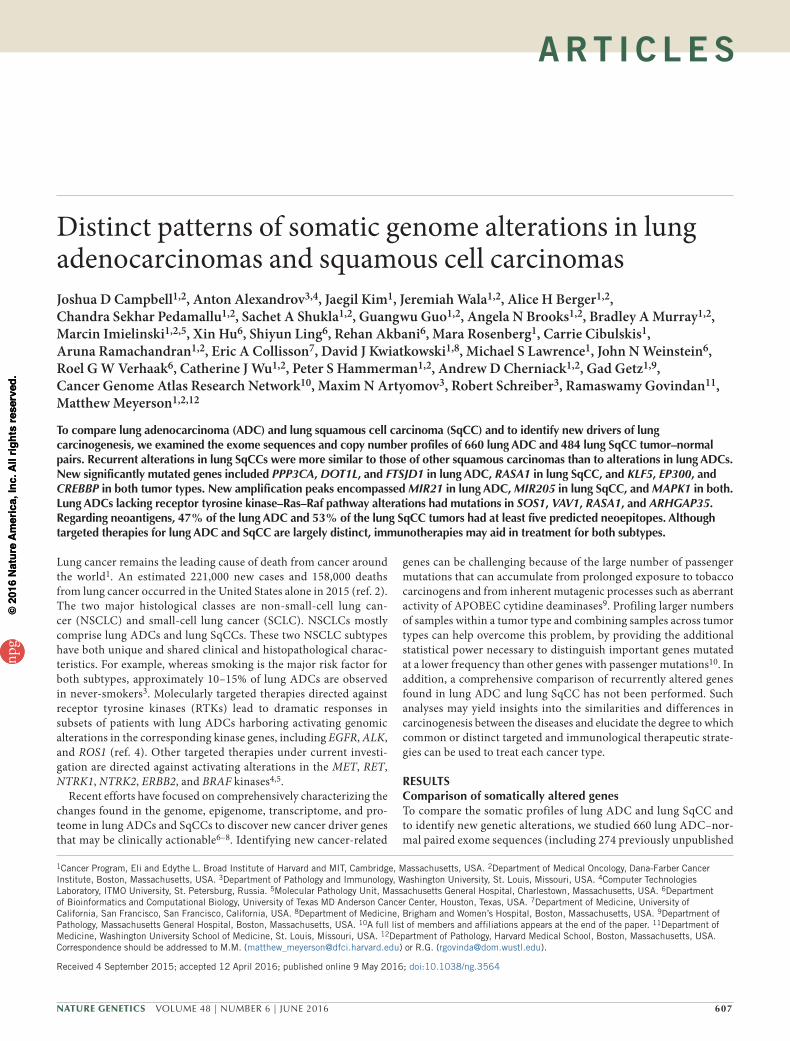
cases and 227 previously described cases from The Cancer Genome Atlas (TCGA)6 together with 159 cases from the cohort in Imielinski et al.8) and 484 lung SqCC–normal paired exome sequences (includ-ing 308 previously unpublished cases and 176 previously described cases from TCGA7; Supplementary Tables 1–4). Similarly to previous studies6,7, we observed median somatic mutation rates of 8.7 mutations/Mb and 9.7 mutations/Mb for lung ADCs and SqCCs, respectively. After excluding genes with lower median expression (log2 (FPKM) <6.16 for lung ADCs and <6.27 for lung SqCCs; Online Methods and Supplementary Fig. 1), we identi-fied 38 genes as significantly mutated in lung ADC and 20 genes as significantly mutated in lung SqCC using MutSig2CV10 (q value < 0.1; Supplementary Tables 5 and 6). Only six genes—TP53, RB1, ARID1A, CDKN2A, PIK3CA, and NF1—were significantly mutated in both tumor types, and, of these, TP53, CDKN2A, and PIK3CA had a significantly higher mutation frequency in lung SqCC tumors (P < 0.01, Fisher’s exact test; Fig. 1a). Likewise, only 11 of 42 focal amplification peaks were identified as altered in both tumor types (Fig. 1b), and 13 of 50 focal deletion peaks were altered in both tumor types (Fig. 1c). Interestingly, when compared to 19 other tumor types from TCGA10, the lists of significantly mutated genes for lung ADC and lung SqCC had greater overlap with lists of sig-nificantly mutated genes from other tumor types (>13% overlap; false discovery rate (FDR) q value < 0.1) than with each other (12% overlap; P = 0.105; Supplementary Fig. 2), consistent with previous pan-cancer analyses11. Recurrently mutated and amplified genes in lung SqCC most closely resembled the genes altered in head and neck squamous cell carcinoma (HNSC) and bladder cancer (BLCA), two other epithelial cancers with epidemiological associations with smoking (>25% overlap; Supplementary Fig. 2). Among these over-lapping genes, TP53, CDKN2A, and FAT1 are specifically enriched for alterations in human papillomavirus (HPV)-negative HNSC12. In contrast, the significantly mutated genes in lung ADC were most similar to those in glioblastoma (GBM) and colorectal cancer (CRC) (FDR q value < 0.1). Although lung ADC and lung SqCC did share several focal deletion peaks, five of these peaks are putative fragile sites (shown in green in Fig. 1c). Taken together, these results suggest that the somatic drivers of carcinogenesis may be largely distinct in lung ADC and lung SqCC.
Mutational signatures in lung cancerVarious carcinogenic and cancer-related processes contribute to the mutational patterns observed in tumors13,14. Previous large-scale studies of lung cancer genomes have identified signatures associated with non-smoking and smoking cases6,8,15; here we extend these findings through the improved statistical power of our larger sample set. Using non-negative matrix factorization (NMF)13,16 (Online Methods), we identified six mutational signatures in this cohort, many of which are strongly correlated with previously defined signatures in the Catalogue of Somatic Mutations in Cancer (COSMIC) data-base13,17 (Supplementary Figs. 3–5 and Supplementary Table 7). These included a UV-related signature of C>T changes at TCC or CCC sites (COSMIC signature 7, abbreviated SI7), a smoking-related signature of C>A transversions (SI4), a mismatch-repair (MMR) signature of C>T changes at GCG sites (SI15/SI6), two APOBEC-related signatures of C>G or C>T changes at TCT or TCA sites (SI13 and SI2), and a final signature with a moderate correlation to COSMIC signature 5 (SI5) with putative ‘molecular clock’ properties18 (Supplementary Fig. 5). In addition to identifying mutational signa-tures, NMF also estimates the number of mutations contributed by each signature in each tumor. The estimated number of SI4 (smoking- related) mutations per megabase displayed a bimodal pattern in lung ADC but not in lung SqCC (Fig. 2a). Furthermore, the rate of SI4 mutations per megabase was able to classify tumors into those from never- versus ever-smokers substantially better in lung ADC (area under the curve (AUC) = 0.87; Supplementary Fig. 6) than in lung SqCC (AUC = 0.62), suggesting that the smoking statuses for the 18 never-smokers with lung SqCC may be inaccurate. Eighty-seven percent of lung ADCs from never-smokers were categorized as trans-version low (≤0.696 SI4 mutations/Mb; P = 8.5 × 10−37, Fisher’s exact test; Fig. 2b and Supplementary Fig. 6). However, only 45% of trans-version-low lung ADCs were from patients who were never-smokers (Fig. 2b). For each tumor, we also derived the fraction of estimated mutations for a signature by dividing the number of estimated muta-tions for that signature by the sum of estimated mutations from all signatures. Lung SqCCs displayed significantly higher overall rates of SI5 mutations per megabase when compared to all lung ADCs (P < 0.001, Wilcoxon rank-sum test). However, lung ADCs from never-smokers displayed the highest fraction of estimated mutations
Lung SqCC q value
Lung
AD
C q
val
ue
ARID1A
CDKN2A
NF1
PIK3CA
RB1
TP53
APC
ARID2
ATM
BRAF
CTNNB1
ERBB2
MAP2K1
METMGA
NRASRAF1
RIT1
SETD2
SMAD4
U2AF1
EGFRKEAP1KRAS
RBM10SMARCA4STK11
FAT1HRAS KDM6A
MLL2
NFE2L2
NOTCH1
PTEN
a Significantly mutated genes
NS
NS10–1
10–2
10–4
10–8
10–1 10–2 10–4 10–8
Lung SqCC q valueLu
ng A
DC
q v
alue
Lung SqCC q value
Lung
AD
C q
val
ue
CDKN2A
PTPRD
WWOX PDE4D LRP1B
CSMD1
B2M
ZMYND11
RB1Xp22.2
6q22.31
21q21.14q22.1
SMAD4
NS
NS
10–1
10–2
10–4
10–8
10–16
10–32
10–64
10–128
b c Focal deletions
MYCTERT
CCND1
MDM2
EGFRCCNE1
ERBB2WHSC1L1–FGFR1
PDGFRA–KIT–KDR18q11.2
19p13.2
Focal amplificationsNKX2−1
MCL1
KRASCDK4
MECOM–TERC
MET
SOX2
REL–BCL11A
NFE2L2
CDK6
BCL2L1MYCL1NS
10–1
10–2
10–4
10–8
10–16
10–32
10–64
NS 10–1 10–2 10–4 10–8 10–1610–3210–6410–128 10–1 10–2 10–4 10–810–1610–3210–6410–128
PTENFOXP1
FAT1NF1KDM6A
Figure 1 Distinct somatic alterations in lung ADC and lung SqCC. (a) The MutSig2CV algorithm10 was used to identify significantly mutated genes across 660 lung ADCs and 484 lung SqCCs. Genes with q values <0.1 were considered to be significantly mutated. The q value for each gene in the lung ADC cohort is plotted against the respective q value in the lung SqCC cohort. The majority of significantly mutated genes were unique to either tumor type. (b,c) The GISTIC 2.0 algorithm was used to identify significantly recurrent copy number gains and losses. The q values for amplifications (b) and deletions (c) in the lung ADC cohort are plotted against the respective q values in the lung SqCC cohort. Peaks with q values <0.25 were considered to be significant. Deletions located within putative fragile sites are highlighted with green labels. Only points corresponding to genes with a previously characterized role in lung cancer are labeled. NS, not significant.
npg
© 2
016
Nat
ure
Am
eric
a, In
c. A
ll rig
hts
rese
rved
.np
g©
2016
Nat
ure
Am
eric
a, In
c. A
ll rig
hts
rese
rved
.

Nature GeNetics VOLUME 48 | NUMBER 6 | JUNE 2016 609
A rt i c l e s
from this signature on average (Fig. 2c and Supplementary Fig. 7). In lung SqCC, we also observed moderate associations of tumor stage with SI5 activity and total mutation rate (P < 0.01; Supplementary Fig. 8).
The mutational profiles of three lung SqCCs (~1% of lung SqCCs) exhibited a pattern of UV-related mutations (SI7) commonly observed in melanoma and displayed a significantly higher mutation rate of somatic single-nucleotide variants (SSNVs) and somatic dinucleotide polymorphisms (DNPs) when compared to the other lung tumors (P < 0.01) but not higher rates of indels (P > 0.05; Fig. 2d). One of these patients (TCGA-18-3409) had a previous history of basal cell carcinoma in the forehead, raising the possibility that metastasis from the skin to the lung had occurred. The other two lung SqCCs with this signature may also represent squamous cell skin carcinomas meta-static to the lung. The mutational profiles for another seven tumors (four lung ADCs and three lung SqCCs) exhibited an MMR-like sig-nature (SI15/SI6) commonly observed in CRCs with microsatellite instability (MSI) (Fig. 2e)13. These tumors had significantly higher rates of both SSNVs and short indels when compared to all other lung tumors with expression data (P < 0.001). They also displayed lower expression levels of the MMR gene MLH1 (P = 0.011), suggesting a potential etiology for this signature in lung.
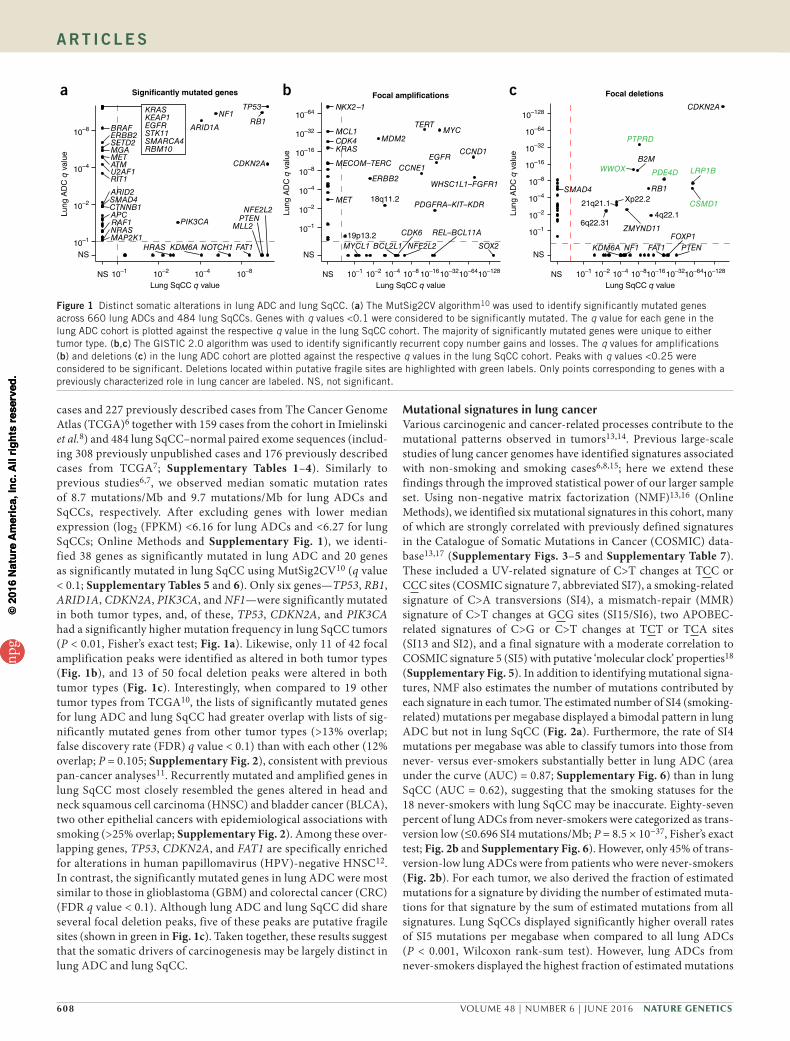
New significantly mutated genesComparing the significantly mutated genes to those in other tumor types from TCGA Pan-Cancer study10 showed that there were several
genes significantly mutated exclusively in lung ADC, includ-ing STK11, RBM10, KEAP1, RAF1, RIT1, and MET (MutSig2CV q value < 0.1; Fig. 3a and Supplementary Table 5). NFE2L2, KDM6A, RASA1, NOTCH1, and HRAS were significantly mutated in lung SqCC but not in other cancer types (excluding HNSC and BLCA) (Fig. 3b and Supplementary Table 6). Genes that reached modest statistical significance in lung ADC that have been observed previ-ously to be altered in lung cancer or in other tumor types included AKT1, with a recurrent mutation encoding p.Glu17Lys, CDK4, with a recurrent mutation encoding p.Arg24Leu, and DNMT3A (P < 0.005; Supplementary Table 5). The new significantly mutated genes exclu-sive to lung ADC and which are not altered in other tumor types included PPP3CA, which encodes the catalytic subunit for the calcium- dependent phosphatase, calcineurin. The mutations in PPP3CA clus-tered in the sequence encoding the autoinhibitory domain near the C terminus of the protein, suggesting that they may be gain-of-function alterations (Fig. 4a). In addition, mutations mapping to the autoinhib-itory domain also tended to co-occur with activating KRAS mutations (P = 0.033), suggesting a potential relationship between the K-Ras and calcineurin signaling pathways. Significantly mutated methyltrans-ferase genes included MLL3 (KMT2C) and SETD2. A new gene in this class was the H3K79 methyltransferase DOT1L, which was mutated
Never-smokerEver-smoker
0 1 2 3 4
Pro
babi
lity
dens
ity
0
0.1
0.2
0.3
0.4
0.5
0.6
Estimated SI4mutations/Mb + 1 (log)
Lung ADCLung SqCC
TV-L TV-H
0
100
200
300
400
TV-L TV-H TV-L TV-HTransversionstatus
Num
ber
of tu
mor
s
Lung ADC Lung SqCC
0
5
10
15
20
0
0.2
0.4
0.6
0.8
1.0
Est
imat
ed s
igna
ture
mut
atio
ns/M
bF
ract
ion
of e
stim
ated
sign
atur
e m
utat
ions
92 163131 143 18 24276 127n
NS LFS SFS CSSmoking status NS LFS SFS CS
SI4SI7
SI15/SI6SI13SI2SI5
Signaturea
b
c
ADC(n = 660)
SqCC(n = 484)
0
20
40
60
80
100
UVlow
(n = 1,141)
SS
NV
s/M
b
0
20
40
60
80
100
120
UVlow
(n = 1,141)
DN
Ps/
Mb
0
1
2
3
4
5
6
UVlow
(n = 1,141)
Inde
ls/M
b
0
1
2
3
4
5
ADC(n = 660)
SqCC(n = 484)
0
10
20
30
40
50
MMRlow
(n = 1,137)
SS
NV
s/M
b
0
20
40
60
80
100
120
MMRlow
(n = 1,137)
Sho
rt in
dels
/Mb
0
1
2
3
4
5
MMRlow
(n = 965)M
LH1
expr
essi
on (
log 2)
7
8
9
10
11
UVhigh
(n = 3)
UVhigh
(n = 3)
UVhigh
(n = 3)
MMRhigh
(n = 7)
MMRhigh
(n = 7)
MMRhigh
(n = 6)
d
e
****
*** *** *
UV
est
imat
edm
utat
ions
/Mb
MM
R e
stim
ated
m
utat
ions
/Mb
Figure 2 Comparison of mutational signatures in lung cancer. Six mutational signatures were identified using NMF on 192 distinct mutation types. (a) The estimated number of SI4 (smoking-related) mutations per megabase in each tumor displayed a bimodal pattern in lung ADC (red). TV-L, transversion low; TV-H, transversion high. (b) Lung ADCs categorized as transversion low were enriched for clinically annotated lifelong never-smokers (P = 8.5 × 10−37). (c) The estimated number of mutations for each signature per megabase (top) and the fraction of estimated mutations for each signature (bottom) were averaged across lifelong never-smokers (NS), longer-term former smokers (LFS), shorter-term former smokers (SFS), and current smokers (CS) for both lung ADCs and lung SqCCs (excluding the UV-high and MMR-high tumors discussed below). (d) Three lung SqCCs had a high number of estimated mutations from a UV-associated signature commonly observed in melanoma. These tumors displayed a significantly higher overall rate of SSNVs and DNPs when compared to all other lung tumors (P < 0.01). (e) The mutational profiles for another seven tumors exhibited an MMR-like signature commonly observed in MSI CRCs. These tumors had significantly higher rates of both SSNVs and short indels (P < 0.001), as well as lower levels of MHL1 expression (P = 0.011). Asterisks indicate significance levels from Wilcoxon rank-sum tests: *P < 0.05, **P < 0.01, ***P < 0.001. Each boxplot shows the median (middle bar), first quartile (bottom of the box), and third quartile (top of the box). Boxplot whiskers demark 1.5 times the interquartile range or minimum–maximum values.
npg
© 2
016
Nat
ure
Am
eric
a, In
c. A
ll rig
hts
rese
rved
.np
g©
2016
Nat
ure
Am
eric
a, In
c. A
ll rig
hts
rese
rved
.
610 VOLUME 48 | NUMBER 6 | JUNE 2016 Nature GeNetics
A rt i c l e s
in 3% of lung ADCs with enrichment for truncating mutations (Fig. 4a). Recurrent mutations in lung ADC have previously been reported in splicing factors such as U2AF1, and loss-of-function mutations have been identified in the RNA-binding protein RBM10 (ref. 8). In the current data set, a cap methyltransferase, FTSJD1 (also known as CMTR2), was significantly mutated and enriched for frameshift mutations (Fig. 4a). We also examined genes for other known proteins in this class and found recurrent mutations in SF3B1 (ref. 19) and SNRPD3 (Supplementary Fig. 9). EGFR mutations were enriched in females, and SMARCA4 mutations were enriched in males (FDR q value < 0.1; Supplementary Table 8). RBM10 mutations were modestly enriched in males, as previously reported (q value = 0.219)6. The new signifi-cantly mutated genes in lung SqCC that were enriched for frameshift mutations (P < 0.001) included RASA1, whose protein product is p120GAP20 (Fig. 4b). CUL3, whose protein product is a known interaction partner of KEAP1, also reached statistical significance in the lung SqCC cohort21 (Fig. 4b). RB1 mutations were enriched in females, whereas PASK mutations were exclusive to males (FDR q value < 0.1; Supplementary Table 9). We did not observe sig-nificant associations between mutation status and patient survival or tumor stage after correction for multiple-hypothesis testing (Supplementary Tables 10–13). Controlling for tumor stage did not identify additional significant associations between mutation status and survival.
Previous studies have shown that joint analysis of different tumor types can yield additional statistical power to detect low-frequency events, even if the tumor types are from vastly different tissues of ori-gin and/or etiologies10. Additionally, although the individual drivers may be distinct between two tumor types, pathways such as mitogen-activated protein (MAP) kinase signaling are often altered similarly in both. We therefore hypothesized that combining the lung ADC and lung SqCC tumor cohorts (into a pan-lung cohort) would identify addi-tional recurrent somatic pathway alterations common to both tumor types. We found 14 genes significantly mutated in the pan-lung cohort that were not significantly mutated in either individual tumor type (q value < 0.1; Supplementary Fig. 10 and Supplementary Table 14). Many of these genes are involved in epigenetic regulation or immune-related pathways. KLF5, a transcription factor critical for lung devel-opment22, contained a new recurrent mutation mapping to the zinc-finger domain, which was observed in both ADCs and SqCCs (Fig. 4c). A regulator of KLF5, the E3 ubiquitin ligase FBXW7 (ref. 23),
was also significantly mutated in the lung SqCC and pan-lung cohorts but did not co-occur with KLF5 mutations. A super-enhancer duplica-tion associated with increased KLF5 expression has also recently been reported in HNSC by our group24, and KLF5 has been reported to be recurrently mutated in BLCA25. The paralogs EP300 and CREBBP had a mutational hotspot region mapping to the histone acetyltransferase (HAT) domain. All missense mutations mapping to the HAT domain and other loss-of-function alterations outside this domain were non-overlapping for these two proteins. For sites with sufficient sequenc-ing depth in the RNA-seq analysis (power >95%), we observed an SSNV validation rate of 88%.
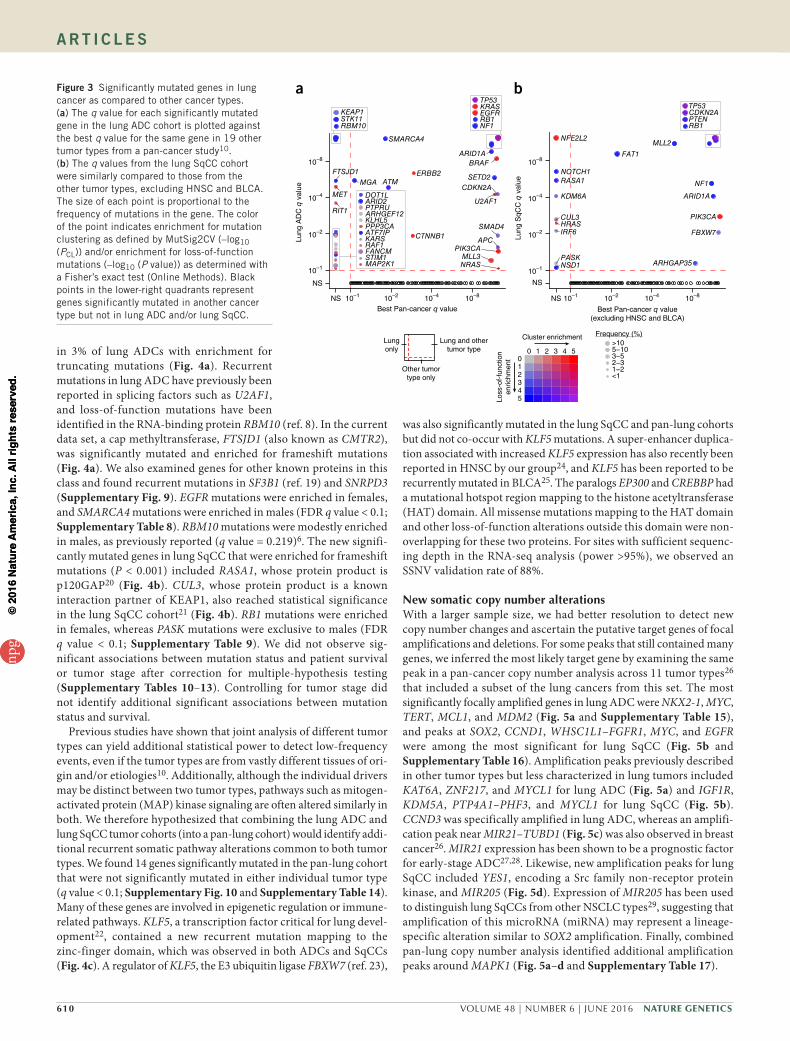
New somatic copy number alterationsWith a larger sample size, we had better resolution to detect new copy number changes and ascertain the putative target genes of focal amplifications and deletions. For some peaks that still contained many genes, we inferred the most likely target gene by examining the same peak in a pan-cancer copy number analysis across 11 tumor types26 that included a subset of the lung cancers from this set. The most significantly focally amplified genes in lung ADC were NKX2-1, MYC, TERT, MCL1, and MDM2 (Fig. 5a and Supplementary Table 15), and peaks at SOX2, CCND1, WHSC1L1–FGFR1, MYC, and EGFR were among the most significant for lung SqCC (Fig. 5b and Supplementary Table 16). Amplification peaks previously described in other tumor types but less characterized in lung tumors included KAT6A, ZNF217, and MYCL1 for lung ADC (Fig. 5a) and IGF1R, KDM5A, PTP4A1–PHF3, and MYCL1 for lung SqCC (Fig. 5b). CCND3 was specifically amplified in lung ADC, whereas an amplifi-cation peak near MIR21–TUBD1 (Fig. 5c) was also observed in breast cancer26. MIR21 expression has been shown to be a prognostic factor for early-stage ADC27,28. Likewise, new amplification peaks for lung SqCC included YES1, encoding a Src family non-receptor protein kinase, and MIR205 (Fig. 5d). Expression of MIR205 has been used to distinguish lung SqCCs from other NSCLC types29, suggesting that amplification of this microRNA (miRNA) may represent a lineage-specific alteration similar to SOX2 amplification. Finally, combined pan-lung copy number analysis identified additional amplification peaks around MAPK1 (Fig. 5a–d and Supplementary Table 17).
Lung and othertumor type
Lungonly
Other tumortype only
0 1 2 3 4 5012345
Cluster enrichment
Loss
-of-
func
tion
enric
hmen
t
>105−103−52−31−2<1
Frequency (%)
Best Pan-cancer q valueLu
ng A
DC
q v
alue
APC
ARID1A
ATM
BRAF
CDKN2A
CTNNB1
ERBB2FTSJD1
MET
MGA
MLL3NRAS
PIK3CA
RIT1
SETD2
SMAD4
SMARCA4
U2AF1
ARHGEF12
ARID2
ATF7IP
DOT1L
FANCM
KARS
KLHL5
MAP2K1
PPP3CA
PTPRU
RAF1
STIM1
EGFRKRAS
NF1RB1
TP53
KEAP1
RBM10STK11
Best Pan-cancer q value(excluding HNSC and BLCA)
Lung
SqC
C q
val
ue
CDKN2APTENRB1
TP53
NS 10–1 10–2 10–4 10–8 NS 10–1 10–2 10–4 10–8
NS
10–1
10–2
10–4
10–8
NS
10–1
10–2
10–4
10–8
ARHGAP35
ARID1A
CUL3
FAT1
FBXW7HRASIRF6
KDM6A
MLL2
NF1
NFE2L2
NOTCH1
NSD1PASK
PIK3CA
RASA1
a bFigure 3 Significantly mutated genes in lung cancer as compared to other cancer types. (a) The q value for each significantly mutated gene in the lung ADC cohort is plotted against the best q value for the same gene in 19 other tumor types from a pan-cancer study10. (b) The q values from the lung SqCC cohort were similarly compared to those from the other tumor types, excluding HNSC and BLCA. The size of each point is proportional to the frequency of mutations in the gene. The color of the point indicates enrichment for mutation clustering as defined by MutSig2CV (–log10 (PCL)) and/or enrichment for loss-of-function mutations (–log10 (P value)) as determined with a Fisher’s exact test (Online Methods). Black points in the lower-right quadrants represent genes significantly mutated in another cancer type but not in lung ADC and/or lung SqCC.
npg
© 2
016
Nat
ure
Am
eric
a, In
c. A
ll rig
hts
rese
rved
.np
g©
2016
Nat
ure
Am
eric
a, In
c. A
ll rig
hts
rese
rved
.

Nature GeNetics VOLUME 48 | NUMBER 6 | JUNE 2016 611
A rt i c l e s
Focal deletion peaks in lung ADC included the chromatin modi-fier genes SMARCA4 and ARID2 (Supplementary Fig. 11 and Supplementary Table 18), which were also significantly mutated and enriched for loss-of-function mutations. New lung SqCC focal deletions observed in other tumor types included ZMYND11, CREBBP, ROBO1, USP22, and KDM6A (Supplementary Fig. 11 and Supplementary Table 19). B2M (β2 microglobulin), encoding a com-ponent of the MHC complex, was focally deleted in both tumor types, was enriched for loss-of-function mutations in both tumor types (P < 0.01), and was significantly mutated in the pan-lung analysis (FDR q value = 0.006). Combined pan-lung copy number analysis identified another focal deletion peak around TRAF3 (Supplementary Table 20), which was also reported in HNSC12. In general, mRNA expression
was significantly associated (P < 0.05) with copy number levels for target genes (Supplementary Figs. 12 and 13). We did not observe substantial batch effects within or across tumor types in either the mRNA expression or copy number variation data (Supplementary Figs. 14 and 15).
Identifying RTK–Ras–Raf drivers in lung ADCIn lung ADC, mutually exclusive alterations have been characterized in components of the RTK–Ras–Raf signaling pathway. These altera-tions are of particular interest because of the dramatic responses that have been observed to RTK inhibitors in clinical trials such as those for patients with lung ADC harboring EGFR mutation or ALK or ROS1 translocations30. However, many lung ADCs do not exhibit a known
a
0 200 400 600 800 1,000 1,200 1,400 1,600
p.K
90N
p.E
248*
p.E
348*
p.G
412f
sp.
N52
2fs
p.A
529P
p.L5
51F
p.A
591T
p.C
637G
p.P
664A
p.A
678V
p.R
681R
p.E
682*
p.Q
839*
p.E
843*
p.S
911L
p.G
936C
p.S
1035
*p.
T10
68fs
p.G
1443
Vp.
G14
71A
p.A
1522
T
S-adenosyl-L-methionine bindingRequired for interaction with nucleosomes and DNA
SAM-binding motif 1SAM-binding motif 2SAM-binding motif 3
0 100 200 300 400 500 600 700
p.R
5I
p.Q
113E
p.E
145*
p.N
155I
p.I1
87fs
p.E
246D
p.Y
256*
p.25
7_25
8CE
>*
p.G
309*
p.G
309V
p.H
327Y
p.G
386*
p.E
391*
p.S
423f
sp.
E45
1*p.
D45
7Np.
G47
7fs
p.G
484A
p.L4
97fs
p.C
511f
sp.
G52
8*p.
K53
6*
p.S
717*
p.Q
719*
p.M
727I
p.K
732*
p.L7
42V
0 100 200 300 400 500 600 700
p.G
9G
p.N
49D
p.S
53R
p.G
175R
p.S
199*
p.E
238*
p.E
243K
p.S
255*
p.L3
21F
p.A
371A
p.S
389L
p.E
424K
p.K
610f
s
p.V
643f
sp.
V67
7Fp.
R69
9Ip.
KK
715f
sp.
K73
1Mp.
K74
2Np.
R75
1Tp.
R75
6L
0 200 400 600 800 1,000
p.A
40G
p.S
250*
p.S
260C
p.R
283C
p.W
317*
p.L3
30L
p.V
368I
p.P
403A
p.P
403S
p.N
N40
6fs
p.L4
82L
p.W
490*
p.R
512*
p.R
537f
s
p.R
709*
p.M
718I
p.D
782Y
p.E
783A
p.M
802I
p.E
836f
sp.
G87
5Ep.
R90
3*p.
I905
Np.
910_
911L
N>
Hp.
Q93
8*p.
LS99
1del
p.S
1006
*p.
Q10
20H
0 100 200 300 400 500
p.P
25P
p.V
85F
p.V
174L
p.F
239f
s
p.E
418D
p.M
431I
p.E
453G
p.D
477H
p.D
477Y
p.R
478*
p.R
478L
p.N
480I
p.N
480K
p.E
481*
p.E
481K
p.R
487G
CatalyticCalcineurin B binding site 1 potentialCalcineurin B binding site 2 potential
Calmodulin binding potentialInhibitory domain
Lung ADC
c
bLung SqCC RASA1
PPP3CA
DOT1L
FTSJD1
CUL3
Lung
SqC
CLu
ng A
DC
p.I1
61M
p.P
301S
p.R
314T
p.R
395S
p.D
418Y
p.E
419K
p.E
419Q
0 50 100 200 250 350 450
p.P
81H
p.T
125T
p.P
156T
p.P
182L
p.H
196N
p.E
202Q
p.P
309S
p.D
418N
p.E
419Q
p.F
433F
Interaction with WWP1
Lung
SqC
CLu
ng A
DC
p.A
13A
p.A
171A
p.G
446C
p.D
618N
p.E
628Q
p.Q
1036
*p.
K10
45N
p.Y
1198
F
p.T
1300
Tp.
I136
6fs
p.Q
1464
Lp.
D14
85Y
p.E
1505
*p.
R16
27Q
p.Q
1904
P
p.Q
2261
Q
p.E
3*p.
E3D
p.G
152C
p.Y
257D
p.P
332L
p.M
749I
p.S
772L
p.Q
1223
*p.
C13
85Y
p.L1
398P
p.D
1399
Np.
Y14
14C
p.G
1443
Vp.
D14
45G
p.P
1452
Lp.
Y14
67F
p.D
1507
Np.
W15
09R
p.L1
563L
p.L1
631L
p.G
2123
Wp.
H21
25Q
p.P
2163
P
ZF-TAZKIX
BromoHAT
ZZ Creb binding
Lung
SqC
CLu
ng A
DC
p.Q
136H
p.G
142R
p.G
174R
p.R
218I
p.P
275Q
p.Q
301H
p.N
305D
p.E
349*
p.R
378Q
p.T
396R
p.N
530I
p.G
556G
p.L8
33L
p.G
837V
p.D
1049
Dp.
E10
54K
p.G
1069
Dp.
W11
51L
p.R
1173
Rp.
D12
24Y
p.D
1273
Np.
E12
85G
p.K
1367
Np.
E14
00*
p.E
1416
Qp.
W14
72C
p.E
1550
Kp.
E15
50Q
p.R
1602
Fp.
C17
10S
p.E
1724
Kp.
Q17
56*
p.G
1757
Cp.
R18
68L
p.R
1875
Lp.
P20
36A
p.A
2044
Sp.
Q22
30R
p.M
2301
Ip.
L232
1Lp.
R23
53L
p.G
2401
Wp.
D24
29Y
p.A
15A
p.G
29F
p.T
228A
p.V
304V
p.P
383R
p.M
493I
p.Q
503*
p.P
616R
p.S
646I
p.V
701V
p.G
777G
p.P
814L
p.Q
816f
sp.
G81
8Gp.
G89
6Gp.
Q94
3*p.
P97
5fs
p.R
1140
Qp.
R11
73Q
p.R
KV
1202
fsp.
Y12
98C
p.D
1309
Hp.
K13
27*
p.C
1408
Yp.
G14
11E
p.D
1435
Yp.
R14
46C
p.R
1446
Hp.
A14
48fs
p.Y
1450
Dp.
H15
17L
p.F
V16
33fs
p.E
1766
Kp.
S17
67L
p.R
1768
Cp.
A18
24T
p.Q
2043
Hp.
L216
4Lp.
M22
25I
p.S
2315
Cp.
L233
0Rp.
H23
84Q
ZF-TAZKIX
BromoHAT
ZZ Creb binding
Pan-lung KLF5
EP300
CREBBP
SilentMissense
Nonsense In-frame indel
Splice siteFrameshift indel Splice-site Indel
Figure 4 New significantly mutated genes in lung cancer. (a,b) Alteration profiles are shown for new genes specific to each lung tumor type, including PPP3CA, DOT1L, and FTSJD1 for lung ADC (a) and RASA1 and CUL3 for lung SqCC (b). (c) Combined (pan-lung) analysis of both tumor types identified additional significantly mutated genes with hotspots, including KLF5 and two paralogs, EP300 and CREBBP.
npg
© 2
016
Nat
ure
Am
eric
a, In
c. A
ll rig
hts
rese
rved
.np
g©
2016
Nat
ure
Am
eric
a, In
c. A
ll rig
hts
rese
rved
.
612 VOLUME 48 | NUMBER 6 | JUNE 2016 Nature GeNetics
A rt i c l e s
activating mutation in the pathway, raising the possibility that additional genes with low-fre-quency somatic events are yet to be identified. To further understand the somatic landscape of this pathway, we first characterized altera-tions among known pathway members and then identified new genes with mutually exclusive alterations. New alterations in known pathway genes included a recurrent in-frame insertion in MAP2K1 and a fusion of MET with its neighboring gene, CAPZA2 (Fig. 6 and Supplementary Table 21)31. Previously reported TRIM24–NTRK2 and KIF5B–MET fusions31 were observed in tumors without other known activating alterations. Interestingly, another NTRK2 fusion with TP63 was also found in a lung SqCC (Fig. 6 and Supplementary Table 21). As observed previously, high levels of MET and ERBB2 amplification were enriched in tumors without other known activating alterations in this pathway (P < 0.01; Supplementary Fig. 16)6. A single lung ADC (TCGA-49-4512) harbored an activating EGFR alteration resulting in kinase domain duplication32. By manual review, we found additional canonical muta-tions in KRAS, EGFR, or ERBB2 in 17 tumors and complex indels in EGFR or MET in 11 tumors, some of which have been previously reported6,8,33 (Supplementary Table 22).
Lung ADCs that had an activating SSNV, indel, amplification, or gene fusion affecting a known RTK–Ras–Raf driver6,34,35 were des-ignated ‘oncogene positive’ (n = 418), whereas the remaining lung ADCs were considered ‘oncogene negative’ (n = 242). For the pur-poses of this analysis, we did not include NF1-altered tumors in the oncogene-positive group, as mutations in this gene are not entirely mutually exclusive with alterations in other genes related to the RTK–Ras–Raf pathway. To identify additional potential drivers in this path-way, we determined whether genes that were significantly mutated in any of the MutSig2CV analyses (Supplementary Tables 5, 6, and 14) or that are important in regulation of the Ras pathway36 were enriched for alterations in oncogene-negative samples using a Fisher’s exact test. In total, 15 genes were significantly enriched for altera-tions among oncogene-negative samples, including the known Ras pathway components SOS1 and RASA1 and the Rho kinase pathway components VAV1 and ARHGAP35 (q value < 0.1; Fig. 7a,c and
Supplementary Table 23). SOS1 is a guanine-nucleotide-exchange factor (GEF) bound to the RTK complex and assists in the activation of Ras proteins37. Recurrent mutations were observed encoding a p.Asn233Tyr substitution in the autoinhibitory domain (DH) of SOS1 in four lung ADCs, and the p.Asp309Tyr substitution in the same region has been reported in Noonan syndrome38,39 (Supplementary Fig. 17). Similarly, VAV1 is a GEF for the Rho family GTPases. Interactions between the calponin homology (CH), acidic (Ac), and pleckstrin homology (PH) domains are important for autoinhibition of the catalytic Dbl homology domain40. The p.Ser67Tyr substitution is located near the interface of the CH, Ac, and PH domains, and mutagenesis affecting this site has been shown to increase overall GEF activity40 (Supplementary Fig. 17). RASA1 and ARHGAP35 (p190RhoGAP) encode GTPase-activating proteins (GAPs) for the Ras and Rho kinases, respectively, and were each enriched for loss-of-function mutations (P < 0.01). We also identified amplification peaks near FGFR1–WHSC1L1 (8p11.21), PDGFRA–KIT–KDR (4q12), and MAPK1 (22q11) that were only significant in the oncogene-negative tumor set (q value < 0.25; Fig. 7b,c). In total, 499 (76%) lung ADCs displayed an alteration in known or putative RTK–Ras–Raf driver genes (Fig. 7c). Moreover, 193 of 227 (85%) lung ADCs that previously underwent secondary expert pathological review and had RNA-seq data available for fusion analysis6 harbored a predicted activating alteration in the RTK–Ras–Raf pathway.
New co-occurrences included MET amplifications and NF1 muta-tions (P = 0.019; Supplementary Fig. 16). Additionally, high-level EGFR amplification significantly overlapped with activating EGFR
c
d
Lung
AD
Cno
rmal
ized
exp
ress
ion
Lung ADC focal copy number ratio
Lung
SqC
Cno
rmal
ized
exp
ress
ion
Lung SqCC focal copy number ratio
CCND3
0 1 2 3
9
10
11
12
13
14MIR21
−0.5 0.5 1.0 1.5 2.016
17
18
19
MAPK1
−1 0 1 2 310
11
12
13
14
YES1
−1 0 1 2 3
8
9
10
11
12
13
MIR205
0 1 2 3
468
10121416
MAPK1
−1 0 1 2 3
11
12
13
14
0
Best pan-cancer tumor q value
NKX2−1
MYCTERT MCL1
KRAS CDK4 CCND1
MDM2
MECOM–TERC
EGFRCCNE1
ERBB2CCND3
ZNF217
MIR21–TUBD1
KAT6A
MAPK1 METWHSC1L1–FGFR1
[MYCL1]PDGFRA–KIT–KDR
Best pan-cancer tumor q value(excluding HNSC and BLCA)
Lung
SqC
C q
val
ue
NS
NS
10–1
10–1
10–2
10–2
10–4
10–4
10–8
10–8
10–16
10–1
6
10–32
10–3
2
10–64
10–6
4
10–128
NS
10–1
10–2
10–4
10–8
10–16
10–32
10–64
10–128
10–1
28
Lung
AD
C q
val
ue
NS10
–1
10–2
10–4
10–8
10–1
6
10–3
2
10–6
4
10–1
28
>2510–255–102.5–5<2.5
a bSOX2
WHSC1L1–FGFR1CCND1
MYC
EGFR
PDGFRA–KIT–KDRREL–BCL11A
[MCL1]
NFE2L2CCNE1
TERT
[GF1R]
CDK6
BCL2L1[MAPK1]
PTP4A1–PHF3
FOXA1MDM2
[AKT1]YES1 MYCL1[KDM5A]
ERBB2MIR205
Figure 5 Significant amplifications in lung cancer. (a) The q value for each amplification peak in lung ADC is plotted against the best q value for the same region across nine other non-lung tumor types26. (b) The q values for amplification peaks in lung SqCC are compared against seven other tumor types, excluding HNSC and BLCA. The size of each point is proportional to the frequency of focal amplification. Brackets around gene names indicate that the most likely target gene was inferred from pan-cancer copy number analysis across 11 tumor types or from the combined pan-lung copy number analysis. Black points in the lower-right quadrants indicate genes significantly altered by amplifications in another cancer type but not in lung ADC and/or lung SqCC. (c,d) Gene expression is plotted against focal copy number ratios for new amplification peaks that include CCND3, MIR21, and MAPK1 in lung ADC (c) and YES1, MIR205, and MAPK1 in lung SqCC (d).
npg
© 2
016
Nat
ure
Am
eric
a, In
c. A
ll rig
hts
rese
rved
.np
g©
2016
Nat
ure
Am
eric
a, In
c. A
ll rig
hts
rese
rved
.

Nature GeNetics VOLUME 48 | NUMBER 6 | JUNE 2016 613
A rt i c l e s
mutations (P = 1.9 × 10⁻⁸)41,42, and STK11 mutations signifi-cantly overlapped with activating KRAS mutations (P = 1.1 × 10⁻⁶; Fig. 7c)43,44. Furthermore, 28 lung ADCs that remain oncogene negative for the RTK–Ras–Raf pathway harbored STK11 mutations (Fig. 7c), suggesting the possibility of an additional, hitherto unrec-ognized KRAS-related genome alteration complementary to STK11 mutation in these cancer samples.
Assessment of neoantigen load and recurrenceBecause of the increasing interest in the use of immune checkpoint inhibitors in lung cancer45,46, we comprehensively analyzed the poten-tial immunogenic properties of the mutational landscape. For each patient, we evaluated the ability of the protein sequence resulting from
each somatic missense mutation to be processed and presented to immune cells by any one of the patient-specific HLA alleles47,48. We then assessed the association between the number of immunogenic mutations (resulting in neoepitopes or neoantigens) and clinical char-acteristics and identified the most common neoepitopes observed in lung cancer. Both nonsynonymous mutation and neoepitope counts were not significantly different between lung ADCs and lung SqCCs
from ever-smokers (Fig. 8a,b). However, these counts were significantly lower in lung ADCs from never-smokers in comparison to lung ADCs from ever-smokers (P < 0.001, Wilcoxon rank-sum test; Fig. 8a,b) and were associated with overall smoking history
NTRK2TRIM24
METCAPZA2
METKIF5B
NTRK2TP63
Exon 2 Exon 15LUAD-TCGA-78-7220
Exon 23 Exon 14LUAD-TCGA-93-A4JN
LUAD-TCGA-55-8091Exon 12 Exon 12
LUSC-TCGA-O2-A52VExon 6 Exon 12
Low High
Normalized exonic expression
3–3 0
Figure 6 Fusions involving MET and NTRK2. Two fusions of MET were identified that retained the sequence encoding the RTK domain, including one with its neighboring gene, CAPZA2. This fusion most likely arose via tandem duplication resulting in the 3′ end of MET being fused with the 5′ end of CAPZA2. Previously reported TRIM24–NTRK2 and KIF5B–MET fusions31 were observed in lung ADCs without other known activating alterations in RTK–Ras–Raf signaling. Another NTRK2 fusion with TP63 was also found in a lung SqCC. For each fusion, the expression of exons retained in the putative fusion transcript was relatively higher than the expression of exons not in the putative fusion transcript (as indicated by the gray box).
0 0.05 0.10 0.15 0.20 0.25 0.67
−1.5
−1.0
−0.5
0
0.5
1.0
1.5
2.0
Fraction of mutated oncogene-negative tumors
Onc
ogen
e-ne
gativ
e en
richm
ent
(Fis
her's
exa
ct L
OR
)
a b
c
NKX2−1
MCL1
TERT MYCCCND1
MECOM–TERC
MDM2
KRASEGFRMIR21–TUBD1
CDK4
FGFR1–WHSC1L1
MAPK1
PDGFRA–KIT–KDR
PTP4A1–PHF3
Onc
ogen
e-ne
gativ
e q
val
ue
Oncogene-positive q value
NS
10–1
10–2
10–4
10–8
10–16
10–32
NS 10–1 10–2 10–4 10–8 10–16 10–32
ERBB2
CCND3CCNE1MET
KAT6A
VAV1HRASARAFNRASRAF1SOS1
MAP2K1RIT1
ERBB2MET
BRAFEGFRKRAS
<1<1<1<111122261332
NTRK2METRETALK
ROS1
<1<1<111
PDGFRA–KIT–KDRMAPK1FGFR1ERBB2
MET
<11122
RASA1ARHGAP35
NF1
2411
EGFRSTK11
316
Missense mutation
Splice-site mutation or exon skipping
In-frame indel
Frameshift indel or nonsense mutation
High-level amplification
Fusion RNA-seq NA
Gain-of-function SSNVs or indels
Fusions
Amplifications
Tumor suppressors
Co-occurrences
n = 499 28 133
Frequency
LATS1 NF1
FANCM
KEAP1
SOS1RASA1
CREBBPARHGAP35
MLL3
KARS
VAV1
ATF7IP
COL5A2
TP53 SMARCA4
RBM10
AmplificationsMutations
Figure 7 New alterations in the RTK–Rho/Ras–Raf pathway in lung ADC. Lung ADCs were classified as oncogene positive if they harbored a known activating or recurrent alteration in previously characterized pathway components and were classified as oncogene negative otherwise. (a) Fifteen genes (red points) were significantly enriched for mutations among oncogene-negative tumors (Fisher’s exact test, FDR q value < 0.1; supplementary table 23). A log-transformed odds ratio (LOR) greater than 0 indicates that the frequency of mutations was higher in the oncogene-negative set. (b) Significant amplification peaks near FGFR1–WHSC1L1, PDGFRA–KIT–KDR, and MAPK1 were only found in the oncogene-negative tumor set using GISTIC 2.0 (q value < 0.25). (c) Co-mutation plot for known and new activators of the pathway. Tumors were considered to have high-level amplification for a given gene if they had a total log2-transformed copy number ratio greater than 1. For genes with gain-of-function SSNVs or indels, only recurrently mutated sites or sites with previous experimental functional evidence were included. New genes enriched for alterations among oncogene-negative tumors that are members of the RTK–Rho/Ras–Raf pathway are labeled in red in all panels. Dashed lines separate tumors that harbor a known or putative alteration in this pathway (n = 499), tumors that do not harbor an alteration in this pathway but have a mutation in STK11 (n = 28), and tumors that do not harbor an alteration in this pathway or STK11 (n = 133). NA, RNA-seq data were not available.
npg
© 2
016
Nat
ure
Am
eric
a, In
c. A
ll rig
hts
rese
rved
.np
g©
2016
Nat
ure
Am
eric
a, In
c. A
ll rig
hts
rese
rved
.

614 VOLUME 48 | NUMBER 6 | JUNE 2016 Nature GeNetics
A rt i c l e s
in lung ADCs but not lung SqCCs (P < 0.001, Kruskal–Wallis test; Supplementary Fig. 18). Alterations predicted to generate neoepitopes in at least four tumors included PIK3CA p.Glu542Lys, NFE2L2 p.Glu79Gln, B-Raf p.Gly466Val, EGFR p.Gly719Ala, and several alterations in TP53, including p.Val157Phe, p.Gly154Val, p.Arg175Gly, and p.Pro278Ala (Fig. 8c). A gene not previously impli-cated in lung cancer, C3orf59 (also known as MB21D2), harbored a recurrent mutation encoding p.Gln311Glu, which has predicted neoepitope properties (Fig. 8c). Overall, 47% of lung ADC and 53% of lung SqCC samples had at least five predicted neoepitopes, suggesting great potential for immunotherapy.
DISCUSSIONWe examined the exome sequences and copy number profiles of 1,144 lung cancers to explore similarities and differences between lung ADC and lung SqCC. Consistent with studies of gene expression11, this comparison showed that both mutated genes and recurrent somatic copy number alterations are largely distinct for the two lung cancer types. The similarity between lung SqCCs, HNSCs, and a subset of BLCAs was also observed when 12 tumor types were reclassified using clustering of five molecular data types11. These differences suggest that somatic alterations can have different oncogenic potential in dif-ferent cellular contexts. Thus, cancers arising from developmentally similar cells of origin across different tissues will be more similar than cancers arising from different cells of origin within an anatomi-cally defined tissue. As we had only one tumor sample per patient, we were not able to analyze intratumoral heterogeneity, as has been done in other studies49,50.
Several new focal amplification peaks containing protein- coding genes, including MAPK1, YES1, and CCND3, were identified. Interestingly, we also found two peaks that contained or were near miRNA genes (MIR21 in lung ADC and MIR205 in lung SqCC). We have also recently reported the duplication of a noncoding super-enhancer that results in increased MYC expression24. As the mutational analyses in this study focused on whole-exome sequencing of protein-coding genes, we were not able to examine mutations in noncoding genes or regulatory elements. Future studies examining large numbers of whole genomes from lung cancer may be better suited for discovery of other oncogenic alterations in noncoding genes or regulatory elements.
Our study has uncovered multiple significantly mutated genes in the RTK–Ras–Raf pathway, including newly identified genes such as RASA1, SOS1, and VAV1. Previous studies examining smaller numbers of lung tumors were not able to detect recurrent muta-tions in SOS1 (refs. 8,39). The fact that we were able to detect these mutants further highlights the usefulness of increasing sample size to detect rare events. Because we did not have matching RNA-seq data for every tumor, we may be underestimating the rates of oncogenic fusions or MET exon 14 skipping events. As 15–25% of lung ADCs still do not have a known, detectable alteration in the RTK–Ras–Raf pathway, we may yet be underpowered to find additional rare, recur-rent mutations in known and new pathway components. Similar considerations may be relevant for other pathways. For example,
we identified new epigenetic modifier mutations in CREBBP and EP300, previously shown in SCLC51.
Finally, we examined the immunogenicity of individual mis-sense mutations to understand more fully the association between neoepitope loads, overall nonsynonymous mutation rates, and clini-cal variables such as smoking status. Some highly recurrent muta-tions were predicted to result in neoepitopes. Future studies may further unravel the relationship between these candidates and clini-cal responses to immune checkpoint inhibitors and customized vaccine therapies.
URLs. Picard tools, http://broadinstitute.github.io/picard/; MutSig algorithm, http://www.broadinstitute.org/cancer/cga/MutSig; Indelocator, http://www.broadinstitute.org/cancer/cga/indelocator; Broad Institute Firehose pipeline, http://www.broadinstitute.org/cancer/cga/; Oncotator, http://www.broadinstitute.org/oncotator/; power calculations, http://www.tumorportal.org/; PRADA fusions, http://www.tumorfusions.org/; mutational signatures, http://www.mathworks.com/matlabcentral/fileexchange/38724; University of California Santa Cruz Cancer Genomics Hub, http://cghub.ucsc.edu/; TCGA Data Portal, http://tcga-data.nci.nih.gov/tcga/; Pan-Lung Tumor Portal, http://pubs.broadinstitute.org/panlung/.
METhODSMethods and any associated references are available in the online version of the paper.
Accession codes. Binary alignment (BAM) files for all TCGA sam-ples6,7 can be downloaded from the University of California Santa Cruz Cancer Genomics Hub using the UUIDs in Supplementary Table 2. Additional clinical and molecular data for TCGA samples can be accessed via the TCGA Data Portal (see URLs).
Note: Any Supplementary Information and Source Data files are available in the online version of the paper.
ACKNoWLEDGMENtSThis work was supported by grants from the National Cancer Institute as part of The Cancer Genome Atlas project: U24CA126546, U24CA143867, U24CA143845,
Number of recurrent neoepitopes0 5 10 15 20
EGFR p.G719A
TP53 p.P278A
TP53 p.R175G
B-Raf p.G466V
NFE2L2 p.E79Q
TP53 p.G154V
C3orf59 p.Q311E
PIK3CA p.E542K
TP53 p.V157F
Lung ADCLung SqCC
a
c
b
01248
163264
128256512
1,0242,048
0
1
2
4
8
16
32
64
Never-smokerADCs
(n = 93)
Ever-smokerADCs
(n = 440)
AllSqCCs
(n = 468)
Never-smokerADCs
(n = 72)
Ever-smokerADCs
(n = 405)
AllSqCCs
(n = 460)
Non
syno
nym
ous
coun
t
Neo
epito
pe c
ount
NS*** NS***Figure 8 Neoepitope load in lung cancer. The immunogenicity of each missense mutation was predicted after inferring HLA alleles in each tumor with available RNA-seq data. (a,b) Nonsynonymous mutation counts (a) and neoepitope counts (b) were not significantly different between ever-smokers from lung ADCs and lung SqCCs (P > 0.05). However, these counts were significantly lower in lung ADCs from never-smokers than in lung ADCs from ever-smokers (***P < 0.001). (c) Some of the most common alterations predicted to be neoepitopes included TP53 p.Val157Phe, PIK3CA p.Glu542Lys, and C3orf59 p.Gln311Glu.
npg
© 2
016
Nat
ure
Am
eric
a, In
c. A
ll rig
hts
rese
rved
.np
g©
2016
Nat
ure
Am
eric
a, In
c. A
ll rig
hts
rese
rved
.

Nature GeNetics VOLUME 48 | NUMBER 6 | JUNE 2016 615
A rt i c l e s
U24CA126544, and U24CA143883. Additionally, this work was funded by National Cancer Institute grant K08CA163677 (P.S.H.), grant 074-U01 from the government of the Russian Federation (A.A.), US Department of Defense contract W81XWH-12-1-0269 (M.M.), the American Cancer Society Research Professor Award (M.M.), and National Cancer Institute grant R35CA197568 (M.M.).
AUtHoR CoNtRIBUtIoNSJ.D.C. performed sample quality control, mutation calling and review, ABSOLUTE analysis of tumors from the cohort of Imielinski et al., identification and comparison of recurrently altered genes, mutational signature identification and characterization, identification of EGFR complex indels, and manuscript writing. A.A., M.N.A., and R.S. generated neoantigen calls. J.K. contributed to mutational signature analyses. J.W. contributed to EGFR complex indel characterization. A.H.B. contributed to oncogene-negative analysis and manuscript preparation. C.S.P. generated the pan-lung portal. A.N.B. identified MET exon 14 skipping events using RNA-seq. X.H. and R.G.W.V. generated fusion calls. S.L. and R.A. performed batch effect analyses. G. Guo contributed to MET exon 14 complex indel identification. M.R., M.I., M.S.L., and G. Getz contributed algorithms for mutation calling and analyses. B.A.M. and A.D.C. contributed to copy number and ABSOLUTE analyses. S.A.S. and C.J.W. performed HLA genotyping. C.C. contributed to sample coordination and quality control. A.R., A.D.C., E.A.C., J.N.W., P.S.H., and D.J.K. contributed to manuscript preparation. R.G. and M.M. conceived and designed the study and wrote the manuscript.
CoMPEtING FINANCIAL INtEREStSThe authors declare competing financial interests: details are available in the online version of the paper.
Reprints and permissions information is available online at http://www.nature.com/reprints/index.html.
1. Stewart, B.W. & Wild, C.P. World Cancer Report 2014 (International Agency for Research on Cancer, 2014).
2. Siegel, R.L., Miller, K.D. & Jemal, A. Cancer statistics, 2015. CA Cancer J. Clin. 65, 5–29 (2015).
3. Samet, J.M. et al. Lung cancer in never smokers: clinical epidemiology and environmental risk factors. Clin. Cancer Res. 15, 5626–5645 (2009).
4. Cardarella, S. & Johnson, B.E. The impact of genomic changes on treatment of lung cancer. Am. J. Respir. Crit. Care Med. 188, 770–775 (2013).
5. Vaishnavi, A. et al. Oncogenic and drug-sensitive NTRK1 rearrangements in lung cancer. Nat. Med. 19, 1469–1472 (2013).
6. Cancer Genome Atlas Research Network. Comprehensive molecular profiling of lung adenocarcinoma. Nature 511, 543–550 (2014).
7. Cancer Genome Atlas Research Network. Comprehensive genomic characterization of squamous cell lung cancers. Nature 489, 519–525 (2012).
8. Imielinski, M. et al. Mapping the hallmarks of lung adenocarcinoma with massively parallel sequencing. Cell 150, 1107–1120 (2012).
9. Roberts, S.A. et al. An APOBEC cytidine deaminase mutagenesis pattern is widespread in human cancers. Nat. Genet. 45, 970–976 (2013).
10. Lawrence, M.S. et al. Discovery and saturation analysis of cancer genes across 21 tumour types. Nature 505, 495–501 (2014).
11. Hoadley, K.A. et al. Multiplatform analysis of 12 cancer types reveals molecular classification within and across tissues of origin. Cell 158, 929–944 (2014).
12. Cancer Genome Atlas Network. Comprehensive genomic characterization of head and neck squamous cell carcinomas. Nature 517, 576–582 (2015).
13. Alexandrov, L.B. et al. Signatures of mutational processes in human cancer. Nature 500, 415–421 (2013).
14. Lawrence, M.S. et al. Mutational heterogeneity in cancer and the search for new cancer-associated genes. Nature 499, 214–218 (2013).
15. Govindan, R. et al. Genomic landscape of non–small cell lung cancer in smokers and never-smokers. Cell 150, 1121–1134 (2012).
16. Alexandrov, L.B., Nik-Zainal, S., Wedge, D.C., Campbell, P.J. & Stratton, M.R. Deciphering signatures of mutational processes operative in human cancer. Cell Reports 3, 246–259 (2013).
17. Forbes, S.A. et al. COSMIC: exploring the world’s knowledge of somatic mutations in human cancer. Nucleic Acids Res. 43, D805–D811 (2015).
18. Alexandrov, L.B. et al. Clock-like mutational processes in human somatic cells. Nat. Genet. 47, 1402–1407 (2015).
19. Quesada, V. et al. Exome sequencing identifies recurrent mutations of the splicing factor SF3B1 gene in chronic lymphocytic leukemia. Nat. Genet. 44, 47–52 (2012).
20. Bernards, A. GAPs galore! A survey of putative Ras superfamily GTPase activating proteins in man and Drosophila. Biochim. Biophys. Acta 1603, 47–82 (2003).
21. Hast, B.E. et al. Cancer-derived mutations in KEAP1 impair NRF2 degradation but not ubiquitination. Cancer Res. 74, 808–817 (2014).
22. Wan, H. et al. Kruppel-like factor 5 is required for perinatal lung morphogenesis and function. Development 135, 2563–2572 (2008).
23. Zhao, D., Zheng, H.Q., Zhou, Z. & Chen, C. The Fbw7 tumor suppressor targets KLF5 for ubiquitin-mediated degradation and suppresses breast cell proliferation. Cancer Res. 70, 4728–4738 (2010).
24. Zhang, X. et al. Identification of focally amplified lineage-specific super-enhancers in human epithelial cancers. Nat. Genet. 48, 176–182 (2016).
25. Cancer Genome Atlas Research Network. Comprehensive molecular characterization of urothelial bladder carcinoma. Nature 507, 315–322 (2014).
26. Zack, T.I. et al. Pan-cancer patterns of somatic copy number alteration. Nat. Genet. 45, 1134–1140 (2013).
27. Akagi, I. et al. Combination of protein coding and noncoding gene expression as a robust prognostic classifier in stage I lung adenocarcinoma. Cancer Res. 73, 3821–3832 (2013).
28. Saito, M. et al. The association of microRNA expression with prognosis and progression in early-stage, non–small cell lung adenocarcinoma: a retrospective analysis of three cohorts. Clin. Cancer Res. 17, 1875–1882 (2011).
29. Lebanony, D. et al. Diagnostic assay based on hsa-miR-205 expression distinguishes squamous from nonsquamous non-small-cell lung carcinoma. J. Clin. Oncol. 27, 2030–2037 (2009).
30. Oxnard, G.R., Binder, A. & Jänne, P.A. New targetable oncogenes in non-small-cell lung cancer. J. Clin. Oncol. 31, 1097–1104 (2013).
31. Stransky, N., Cerami, E., Schalm, S., Kim, J.L. & Lengauer, C. The landscape of kinase fusions in cancer. Nat. Commun. 5, 4846 (2014).
32. Gallant, J.N. et al. EGFR kinase domain duplication (EGFR-KDD) is a novel oncogenic driver in lung cancer that is clinically responsive to afatinib. Cancer Discov. 5, 1155–1163 (2015).
33. Ye, K. et al. Systematic discovery of complex insertions and deletions in human cancers. Nat. Med. 22, 97–104 (2016).
34. Pao, W. & Girard, N. New driver mutations in non-small-cell lung cancer. Lancet Oncol. 12, 175–180 (2011).
35. Pao, W. & Hutchinson, K.E. Chipping away at the lung cancer genome. Nat. Med. 18, 349–351 (2012).
36. Stephen, A.G., Esposito, D., Bagni, R.K. & McCormick, F. Dragging Ras back in the ring. Cancer Cell 25, 272–281 (2014).
37. Rajalingam, K., Schreck, R., Rapp, U.R. & Albert, S. Ras oncogenes and their downstream targets. Biochim. Biophys. Acta 1773, 1177–1195 (2007).
38. Lepri, F. et al. SOS1 mutations in Noonan syndrome: molecular spectrum, structural insights on pathogenic effects, and genotype–phenotype correlations. Hum. Mutat. 32, 760–772 (2011).
39. Swanson, K.D. et al. SOS1 mutations are rare in human malignancies: implications for Noonan syndrome patients. Genes Chromosom. Cancer 47, 253–259 (2008).
40. Yu, B. et al. Structural and energetic mechanisms of cooperative autoinhibition and activation of Vav1. Cell 140, 246–256 (2010).
41. Shan, L. et al. Concurrence of EGFR amplification and sensitizing mutations indicate a better survival benefit from EGFR-TKI therapy in lung adenocarcinoma patients. Lung Cancer 89, 337–342 (2015).
42. Sholl, L.M. et al. Lung adenocarcinoma with EGFR amplification has distinct clinicopathologic and molecular features in never-smokers. Cancer Res. 69, 8341–8348 (2009).
43. Liu, Y. et al. Metabolic and functional genomic studies identify deoxythymidylate kinase as a target in LKB1-mutant lung cancer. Cancer Discov. 3, 870–879 (2013).
44. Kim, H.S. et al. Systematic identification of molecular subtype–selective vulnerabilities in non-small-cell lung cancer. Cell 155, 552–566 (2013).
45. Brahmer, J. et al. Nivolumab versus docetaxel in advanced squamous-cell non–small-cell lung cancer. N. Engl. J. Med. 373, 123–135 (2015).
46. Rizvi, N.A. et al. Mutational landscape determines sensitivity to PD-1 blockade in non–small cell lung cancer. Science 348, 124–128 (2015).
47. Shukla, S.A. et al. Comprehensive analysis of cancer-associated somatic mutations in class I HLA genes. Nat. Biotechnol. 33, 1152–1158 (2015).
48. Gubin, M.M. et al. Checkpoint blockade cancer immunotherapy targets tumour-specific mutant antigens. Nature 515, 577–581 (2014).
49. Zhang, J. et al. Intratumor heterogeneity in localized lung adenocarcinomas delineated by multiregion sequencing. Science 346, 256–259 (2014).
50. de Bruin, E.C. et al. Spatial and temporal diversity in genomic instability processes defines lung cancer evolution. Science 346, 251–256 (2014).
51. Peifer, M. et al. Integrative genome analyses identify key somatic driver mutations of small-cell lung cancer. Nat. Genet. 44, 1104–1110 (2012).
Collaborators:Jean C Zenklusen13, Jiashan Zhang13, Ina Felau13, John A Demchok13, Liming Yang13, Zhining Wang13, Martin L Ferguson13, Roy tarnuzzer13, Carolyn M Hutter13, Heidi J Sofia13, todd Pihl14, Yunhu Wan14, Sudha Chudamani15, Jia Liu15, Charlie Sun14, Rashi Naresh14, Laxmi Lolla15, Ye Wu15, Chad J Creighton16,
npg
© 2
016
Nat
ure
Am
eric
a, In
c. A
ll rig
hts
rese
rved
.np
g©
2016
Nat
ure
Am
eric
a, In
c. A
ll rig
hts
rese
rved
.

616 VOLUME 48 | NUMBER 6 | JUNE 2016 Nature GeNetics
13National Cancer Institute, US National Institutes of Health, Bethesda, Maryland, USA. 14SRA International, Fairfax, Virginia, USA. 15Leidos Biomedical, Rockville, Maryland, USA. 16Baylor College of Medicine, Houston, Texas, USA. 17University of North Carolina at Chapel Hill, Chapel Hill, North Carolina, USA. 18Department of Pathology and Laboratory Medicine, School of Medicine, University of North Carolina at Chapel Hill, Chapel Hill, North Carolina, USA. 19Lineberger Comprehensive Cancer Center, University of North Carolina at Chapel Hill, Chapel Hill, North Carolina, USA. 20Department of Internal Medicine, University of North Carolina at Chapel Hill, Chapel Hill, North Carolina, USA. 21Department of Genetics, University of North Carolina at Chapel Hill, Chapel Hill, North Carolina, USA. 22Department of Biology, University of North Carolina at Chapel Hill, Chapel Hill, North Carolina, USA. 23Carolina Center for Genome Sciences, University of North Carolina at Chapel Hill, Chapel Hill, North Carolina, USA. 24Research Computing Center, University of North Carolina at Chapel Hill, Chapel Hill, North Carolina, USA. 25University of North Carolina Tissue Procurement Facility, Chapel Hill, North Carolina, USA. 26Center for Biomedical Informatics, Harvard Medical School, Boston, Massachusetts, USA. 27Department of Genomic Medicine, University of Texas MD Anderson Cancer Center, Houston, Texas, USA. 28University Health Network and Princess Margaret Cancer Centre, Toronto, Ontario, Canada. 29Thoraxklinik am Universitätsklinikum Heidelberg, Heidelberg, Germany. 30Translational Lung Research Centre Heidelberg, German Centre for Lung Research, Heidelberg, Germany. 31Harvard Medical School, Boston, Massachusetts, USA. 32Brigham and Women’s Hospital, Boston, Massachusetts, USA. 33Research Institute at Nationwide Children’s Hospital, Columbus, Ohio, USA. 34The Ohio State University, Columbus, Ohio, USA. 35Department of Biomolecular Engineering, University of California, Santa Cruz, Santa Cruz, California, USA. 36Department of Translational Genomics, Cologne, Germany. 37Center for Molecular Medicine Cologne, Cologne, Germany. 38Department of Cancer Biology, Dana-Farber Cancer Institute, Boston, Massachusetts, USA. 39Department of Medicine, Harvard Medical School, Boston, Massachusetts, USA. 40Department of Thoracic Head and Neck Medical Oncology, MD Anderson Cancer Center, Houston, Texas, USA. 41Center for Epigenetics, Van Andel Research Institute, Grand Rapids, Michigan, USA. 42Norris Comprehensive Cancer Center, University of Southern California, Los Angeles, California, USA. 43Sidney Kimmel Comprehensive Cancer Center, Johns Hopkins University, Baltimore, Maryland, USA. 44Hillman Cancer Center, University of Pittsburgh Cancer Institute, Pittsburgh, Pennsylvania, USA. 45International Genomics Consortium, Phoenix, Arizona, USA. 46Department of Systems Biology, University of Texas MD Anderson Cancer Center, Houston, Texas, USA.
W Kimryn Rathmell17, J todd Auman17,18, Saianand Balu19, tom Bodenheimer19, D Neil Hayes19,20, Katherine A Hoadley19,21, Alan P Hoyle19, Corbin D Jones22,23, Stuart R Jefferys19, Shaowu Meng19, Piotr A Mieczkowski21, Lisle E Mose19, Charles M Perou18,19,21, Jeffrey Roach24, Yan Shi19, Janae V Simons19, tara Skelly21, Matthew G Soloway19, Donghui tan21, Junyuan Wu19, Umadevi Veluvolu21, Joel S Parker19,21, Matthew D Wilkerson21, Lori Boice17,25, Mei Huang17,25, Leigh B thorne18,19,25, Gad Getz1,9, Michael S Noble1, Hailei Zhang1, David I Heiman1, Juok Cho1, Nils Gehlenborg1,26, Gordon Saksena1, Doug Voet1, Pei Lin1, Scott Frazer1, Jaegil Kim1, Michael S Lawrence1, Lynda Chin1,27, Ming-Sound tsao28, Frances Allison28, Dianne Chadwick28, thomas Muley29,30, Michael Meister29,30, Hendrik Dienemann29,30, Raju Kucherlapati31,32, Peter Park31,32, Jay Bowen33, Julie M Gastier-Foster33,34, Mark Gerken33, Kristen M Leraas33, tara M Lichtenberg33, Nilsa C Ramirez33,34, Lisa Wise33, Erik Zmuda33, Josh Stuart35, Eric Collisson7, Martin Peifer36,37, David Kwiatkowski1,8, Joshua D Campbell1,2, Bradley A Murray1,2, Andrew D Cherniack1,2, Alice H Berger1,2, Carrie Sougnez1, Steven E Schumacher1,38, Juliann Shih1,2, Rameen Beroukhim1,2,39, travis I Zack1,38, Stacey B Gabriel1, Matthew Meyerson1,2,12, Lauren A Byers40, tanja Davidsen13, Peter W Laird41, Daniel J Weisenberger42, David J Van Den Berg42, Moiz S Bootwalla42, Phillip H Lai42, Dennis t Maglinte42, Stephen B Baylin43, James G Herman44, Ludmila Danilova43, Leslie Cope43, Daniel J Crain45, Erin Curley45, Johanna Gardner45, Kevin Lau45, David Mallery45, Scott Morris45, Joeseph Paulauskis45, Robert Penny45, Candace Shelton45, troy Shelton45, Mark Sherman45, Peggy Yena45 & Gordon B Mills46
A rt i c l e s
npg
© 2
016
Nat
ure
Am
eric
a, In
c. A
ll rig
hts
rese
rved
.np
g©
2016
Nat
ure
Am
eric
a, In
c. A
ll rig
hts
rese
rved
.

Nature GeNeticsdoi:10.1038/ng.3564
ONLINE METhODSSample collection and pathology review. Sample collection and DNA sequencing were performed for the Imielinski et al. and TCGA cohorts as previously described6–8. All specimens were obtained from patients with appropriate consent and with approval from the relevant institutional review boards. All patients were naive to treatment with the exception of four patients with lung SqCC and three patients with lung ADC who received neoadju-vant treatment before resection (Supplementary Table 2). Initial pathologi-cal review was performed at the contributing tissue source sites, where each tumor was given an initial histological classification. After shipment of the frozen tissue to the Biospecimen Core Resource (BCR), one or two additional frozen sections were cut and stained with hematoxylin and eosin to confirm the histological classification of the original tissue source site. 159 of the lung ADCs from Imielinski et al., 289 of the lung ADCs from TCGA, and 213 of the lung SqCCs from TCGA had also undergone additional histological review by an expert pathology committee led by W. Travis (Memorial Sloan Kettering Cancer Center) in previous studies6–8. Nucleic acid extraction and molecular quality control were performed at the BCR.
DNA sequencing, alignment, and mutation calling. Exome capture was performed using the Agilent SureSelect Human All Exon 50Mb kit followed by Illumina paired-end sequencing. Reads were processed using the Picard pipeline6. This pipeline uses BWA for read alignment, Picard tools for marking duplicates, and the Genome Analysis Toolkit (GATK) for realignment around small indels as well as recalibration of base quality52. Contamination in tumor exomes was estimated using ContEst53. Only tumors with <5% contamination, an available SNP6.0 array for copy number analysis, and a valid ABSOLUTE54 solution were considered in the final analysis. The final sample set included 227 previously described lung ADCs from TCGA6, 274 newly reported lung ADCs from TCGA, and 159 lung ADCs from the cohort of Imielinski et al.8, together with 176 previously described lung SqCCs from TCGA7 and 308 newly reported lung SqCCs from TCGA. SSNVs and indels were called using MuTect55 and Indelocator (see URLs), respectively. These algorithms compare the tumor to the matched normal sample to exclude germline variants. Somatic calls were excluded if found in a panel of over 2,900 normal exomes, as previ-ously described10. Coding mutation patterns can be viewed for individual genes in the Pan-Lung Tumor Portal (see URLs).
Identification of significantly mutated genes. Significantly mutated genes were identified using MutSig2CV, which combines P values from tests for high mutational frequency relative to the background mutation rate (PCV), clustering of mutations within a gene (PCL), and enrichment of mutations at evolutionarily conserved sites (PFN)10. For 660 lung ADCs, we had 100% power to detect genes mutated in 10% of patients and 73% power to detect genes mutated in 5% of patients, assuming a mutation rate of 8.7 mutations/Mb10. For 484 lung SqCCs, we had 100% power to detect genes mutated in 10% of patients and 41% power to detect genes mutated in 5% of patients, assuming a mutation rate of 9.7 mutations/Mb10. To reduce the number of hypotheses tested in the MutSig2CV analysis, we excluded genes that exhibited low expression across tumors with relatively high purity. The median log2 (FPKM) value for each gene was obtained for 185 ADCs and 238 SqCCs that had a purity estimate from ABSOLUTE of >50% and available RNA-seq data (Supplementary Fig. 1). For each tumor type, a mixture model of two normal distributions was fit in R using the mclust package v4.2. Genes with 95% prob-ability of belonging to the cluster with higher expression were considered in multiple-hypothesis correction of the MutSig2CV combined P values. One gene, TRERF1, was excluded from the final results because closer inspection of its mutations showed a recurrent frameshift deletion that was likely a false positive, as all of these mutations had low allelic fractions (<1.5%) and had no supporting reads in matching RNA-seq data. A one-sided Fisher’s exact test was used to determine whether the ratio of loss-of-function mutations (includ-ing nonsense, frameshift, and de novo out-of-frame start codon mutations) to other mutations for a given gene was significantly higher than the ratio of loss-of-function mutations to other mutations across all other genes.
Identification of recurrent copy number changes. DNA was hybridized onto Affymetrix SNP6.0 arrays, and signal intensities were normalized as previously
described6. Segmentation was performed using the Circular Binary Segmentation algorithm56 followed by Ziggurat Deconstruction to infer the length and ampli-tude of each segment. Recurrent peaks for focal somatic copy number altera-tion were identified using GISTIC 2.0 (ref. 57). A peak was considered to be focally amplified or deleted within a tumor if the GISTIC 2.0–estimated focal copy number ratio was greater than 0.1 or less than −0.1, respectively. Purity and ploidy were estimated using ABSOLUTE54. Two peaks were considered the same across tumor types if (i) the known target gene of each peak was the same or (ii) the genomic location of the peaks overlapped after adding 1 Mb to the start and end locations of each gene. For the second criterion, only peaks that contained fewer than 25 genes and were smaller than 10 Mb were considered.
RNA sequencing for expression and fusion analyses. Of the 1,144 tumors exam-ined in this study, 495 lung ADCs and 476 lung SqCCs had corresponding RNA-seq data from TCGA. RNA reads were generated, aligned to the hg19 genome assembly with Mapsplice58, and normalized with RSEM59 to FPKM expres-sion estimates, as previously described6. Expression values less than 1 FPKM were set to 1, and all data were log2 transformed. Skipping of MET exon 14 was identified with juncBASE60 as previously described6. Lists of fusions were obtained from previous studies6,31,61. Fusions for additional tumors were iden-tified with the PRADA pipeline62. To plot the exonic expression of fusion transcripts, exon expression levels were measured and normalized to RPKM values, as previously described6. Expression for an individual exon was first z score transformed across all tumors within each tumor type. Subsequently, all exons for a gene were z score transformed again within each tumor. The transcript annotations used for this analysis included ENST00000397752 for MET, ENST00000361183 for CAPZA2, ENST00000302418 for KIF5B, ENST00000323115 for NTRK2, ENST00000343526 for TRIM24, and ENST00000354600 for TP63.
Identification of mutational signatures. NMF was used to deconvolute a K × G matrix of mutation catalogs into a K × N matrix of mutational proc-esses and an N × G matrix of mutational exposures (where G is the number of lung cancer exomes, K is the number of mutational states, and N is the number of estimated mutational processes)16. Code for NMF was obtained from MATLAB Central (see URLs) and run using the nnmf function from the MATLAB Statistics Toolbox. We used 6 mutation types with 16 different tri-nucleotide contexts and 2 transcriptional strands, for a total of 192 mutational states. The number of possible signatures was varied from one to ten, and signature stability was assessed via bootstrapping as previously described16. Within each tumor, the fraction of estimated mutations for a signature was derived by dividing the number of estimated mutations for that signature by the sum of the estimated mutations from all signatures.
Predicting immunogenicity. HLA alleles were called with POLYSOLVER47 for all lung cancer exomes. For each tumor, epitope predictions were made by considering interaction between confidently called HLA alleles and single-residue missense alterations. Separate lists were generated consisting of wild-type and mutant peptides of 8, 9, 10, and 11 amino acids in length, as these are known to be the possible lengths for peptides presented by human MHC class I molecules63. We then predicted MHC binding affinity for each of the peptides as described previously48. First, a proteasome processing score was calculated using the NetChop program64. Then, we used the NetMHC65, NetMHCpan66, SMM67, and SMMPMBEC68 methods to predict MHC binding affinity values for each peptide and used the median value across all algorithms as a compos-ite measure of binding strength. We also defined the neoepitope ratio for each mutant and wild-type peptide pair as the median affinity value for the mutant peptide divided by the median affinity value for the wild-type peptide. This value was found to be a reliable comparator of the relative immunogenicities of the mutant versus wild-type peptide sequences48. Peptide pairs were further considered if the mutant peptide displayed a processing score ≥0.7, a median affinity value ≥0.01, and a neoepitope ratio ≥1 and the mRNA transcript of the gene was expressed in the RNA-seq data for that tumor (among the 15,000 most highly expressed genes in each tumor). Because epitope binding is HLA dependent, the previous steps were performed for each of the called MHC I proteins. After this, only peptides predicted to be the best epitopes for each mutation were considered.
npg
© 2
016
Nat
ure
Am
eric
a, In
c. A
ll rig
hts
rese
rved
.np
g©
2016
Nat
ure
Am
eric
a, In
c. A
ll rig
hts
rese
rved
.

Nature GeNetics doi:10.1038/ng.3564
Statistical comparisons. Nonparametric tests such as the Wilcoxon rank-sum test (comparison between two groups) or the Kruskal–Wallis test (comparison between more than two groups) were used for continuous variables unless otherwise noted. The Fisher’s exact test was used when comparing two cat-egorical variables. In total, longitudinal data on survival were available for 481 patients with lung ADC and 473 patients with lung SqCC from TCGA. The Cox proportional hazards model was used to examine associations between patient survival and mutation status, with and without controlling for tumor stage. Correction for multiple-hypothesis testing was performed with the Benjamini–Hochberg procedure.
Sample collection and pathology review. Clinical and molecular data from Imielinski et al.8 are available in the database of Genotypes and Phenotypes (dbGaP) under accession phs000488.v1.p1.
52. DePristo, M.A. et al. A framework for variation discovery and genotyping using next-generation DNA sequencing data. Nat. Genet. 43, 491–498 (2011).
53. Cibulskis, K. et al. ContEst: estimating cross-contamination of human samples in next-generation sequencing data. Bioinformatics 27, 2601–2602 (2011).
54. Carter, S.L. et al. Absolute quantification of somatic DNA alterations in human cancer. Nat. Biotechnol. 30, 413–421 (2012).
55. Cibulskis, K. et al. Sensitive detection of somatic point mutations in impure and heterogeneous cancer samples. Nat. Biotechnol. 31, 213–219 (2013).
56. Olshen, A.B., Venkatraman, E.S., Lucito, R. & Wigler, M. Circular binary segmentation for the analysis of array-based DNA copy number data. Biostatistics 5, 557–572 (2004).
57. Mermel, C.H. et al. GISTIC2.0 facilitates sensitive and confident localization of the targets of focal somatic copy-number alteration in human cancers. Genome Biol. 12, R41 (2011).
58. Wang, K. et al. MapSplice: accurate mapping of RNA-seq reads for splice junction discovery. Nucleic Acids Res. 38, e178 (2010).
59. Li, B. & Dewey, C.N. RSEM: accurate transcript quantification from RNA-Seq data with or without a reference genome. BMC Bioinformatics 12, 323 (2011).
60. Brooks, A.N. et al. Conservation of an RNA regulatory map between Drosophila and mammals. Genome Res. 21, 193–202 (2011).
61. Yoshihara, K. et al. The landscape and therapeutic relevance of cancer-associated transcript fusions. Oncogene 34, 4845–4854 (2015).
62. Torres-García, W. et al. PRADA: pipeline for RNA sequencing data analysis. Bioinformatics 30, 2224–2226 (2014).
63. Alberts, B. Molecular Biology of the Cell (Garland Science, 2002).64. Nielsen, M., Lundegaard, C., Lund, O. & Kesmir, C. The role of the proteasome in
generating cytotoxic T-cell epitopes: insights obtained from improved predictions of proteasomal cleavage. Immunogenetics 57, 33–41 (2005).
65. Nielsen, M. et al. Reliable prediction of T-cell epitopes using neural networks with novel sequence representations. Protein Sci. 12, 1007–1017 (2003).
66. Hoof, I. et al. NetMHCpan, a method for MHC class I binding prediction beyond humans. Immunogenetics 61, 1–13 (2009).
67. Peters, B. & Sette, A. Generating quantitative models describing the sequence specificity of biological processes with the stabilized matrix method. BMC Bioinformatics 6, 132 (2005).
68. Kim, Y., Sidney, J., Pinilla, C., Sette, A. & Peters, B. Derivation of an amino acid similarity matrix for peptide: MHC binding and its application as a Bayesian prior. BMC Bioinformatics 10, 394 (2009).
npg
© 2
016
Nat
ure
Am
eric
a, In
c. A
ll rig
hts
rese
rved
.np
g©
2016
Nat
ure
Am
eric
a, In
c. A
ll rig
hts
rese
rved
.