distinct sensory representations of wind...
TRANSCRIPT
DISTINCT SENSORY REPRESENTATIONS OF WIND AND
NEAR-FIELD SOUND IN THE DROSOPHILA BRAIN
Thesis by
Suzuko Yorozu
In Partial Fulfillment of the Requirements
for the Degree of
Doctor of Philosophy
California Institute of Technology
Pasadena, California
2010
(Defended May 10, 2010)

ii
© 2010
Suzuko Yorozu
All Rights Reserved
iii
Acknowledgements
I am grateful for the support and advice of many people who helped me to
complete the work in this thesis. Firstly, and most importantly, I wish to thank my
advisor, David Anderson, who taught me to be a creative but careful thinker, an effective
communicator, and a better scientist. His intellectual rigor together with his creativity
and dedication for science make him a great mentor and an exceptional scientist. His
curiosity and clear thinking has always been an inspiration and guidance for my research
work. I will always be grateful for his advice and support.
I was incredibly lucky to have the chance to interact with other exceptional
scientists as my committee members, including Seymour Benzer, Paul Sternberg, Kai
Zinn, and Michael Dickenson. I greatly appreciate their support and helpful suggestions
during my graduate work. I also greatly enjoyed interacting with Seymour who truly
loved science, food, culture, and life.
The Anderson lab houses a wealth of knowledge and talent. I deeply appreciate
the time that Allan Wong spent to train me and introduce me to the calcium response
imaging technique, which allowed me to obtain many interesting results in my work. I
appreciated Anne Hergarden for being a friendly colleague. I enjoyed sharing our office
together, and talking about science and life in general. I also would like to thank other
lab members, Heiko Dankert, Tim Tayler, Tim Lebestky, Kiichi Watanabe, Liming
Wang, Hidehiko Inagaki, Haijiang Cai, Dayu Lin, Hyosang Lee, Todd Anthony, Sophia
Vrontou, Wulf Haubensak, Prabhat Kunwar, and Li-ching Lo for their support and
advice.
iv
My graduate experience was blessed by the support of exceptional lab managers,
Gaby Mosconi and Gina Moncuso. They not only helped me carry out the project
efficiently, but their caring characters brought lots of smiles and comfort to the lab. I also
don’t want to forget to thank Gaby for bringing us weekly delicious treats, which made
our weekend work so much easier.
I would like to thank Mark Konishi and his former post-doc fellow, Brian J.
Fischer, for their advice and support, and for letting me use their lab space and
equipment. I also thank Gilles Laurent for inviting me to carry out a rotation project in
his lab. I would especially like to thank Stijn Cassenaer, Glenn Turner, and Vivek
Jayaman for introducing me to electrophysiological recording techniques, which became
very handy for this thesis project.
I also met wonderful people outside the lab Caltech. I am grateful to Peter Lee,
whose wisdom and encouragement helped me through some difficult times. Also,
countless thanks goes to my boot camp class members at the Caltech gym: Candice, Tina,
Gordon, Michelle, Monica, and other girls. Their energy and friendly faces made me
forget all the insignificant worries and doubts that I had in me. I truly enjoyed their
company. I also thank HeeJu Kim, Monica Martinez, and Jung Sook Chang for their
emotional support.
Foremost, I thank my family for continuous support throughout my life. The
confidence and strength that I gained from them cannot be quantified.
v
ABSTRACT
Behavioral responses to wind are thought to play a critical role in controlling the
dispersal and population genetics of wild Drosophila species, as well as their navigation
in flight, but their underlying neurobiological basis is unknown. I show that Drosophila
melanogaster, like wild-caught Drosophila strains, exhibits robust wind-induced
suppression of locomotion (WISL), in response to air currents delivered at speeds
normally encountered in nature. Furthermore, I identify wind-sensitive neurons in the
Johnston’s organ (JO), an antennal mechanosensory structure previously implicated in
near-field sound detection. Using Gal4 lines targeted to different subsets of JO neurons,
and a genetically encoded calcium indicator, I show that wind and near-field sound
(courtship song) activate distinct JO populations, which project to different regions of the
antennal and mechanosensory motor center (AMMC) in the central brain. Selective
genetic ablation of wind-sensitive JO neurons in the antenna abolishes WISL behavior,
without impairing hearing. Different neuronal sub-populations within the wind-sensitive
population, moreover, respond to different directions of arista deflection caused by
airflow and project to different regions of the AMMC, providing a rudimentary map of
wind direction in the brain. Importantly, sound- and wind-sensitive JO neurons exhibit
different intrinsic response properties: the former are phasically activated by small,
bidirectional displacements of the aristae, while the latter are tonically activated by
unidirectional, static deflections of larger magnitude. These different intrinsic properties
are well suited to the detection of oscillatory pulses of near-field sound and laminar
airflow, respectively. These data identify wind-sensitive neurons in JO, a structure that

vi
has been primarily associated with hearing, and reveal how the brain can distinguish
different types of air particle movements, using a common sensory organ.
vii
TABLE OF CONTENTS
Acknowledgements…………………………………………………………….…iii
Abstract…………………………………………………………………….…..…..v
Table of Contents…………………………………………………………..…….vii
List of Illustrations………………………………………..……………….…….viii
Chapter 1…………………………………………………………………..……….1
Introduction
Chapter 2………………………………………………………………..…….….35
Distinct sensory representations of wind and near-field sound in the
Drosophila brain
Chapter 3…………………………………………………………………………81
Remaining outstanding questions and future directions
Appendix ...…………………………………………………………………….....95
Distinct sensory representations of wind and near-field sound in the
Drosphila brain
viii
LIST OF ILLUSTRATIONS
Chapter 1
Figure 1 The mach band effect can be explained by the lateral
inhibition ……………………………………………………25
Chapter 2
Figure 1 Wind-induced suppression of locomotion behavior………... 62
Figure 2 WISL behavior is dependent on chordotonal mechanosensory
neurons in the Johnston’s organ……………………………. 63
Figure 3 Electrophysiological analyses of wind- and wound-induced
responses in Drosophila…………………………………..... 64
Figure 4 Different sub-populations of JO neurons are activated by wind and
sound………………………………………………..….. 65
Figure 5 Calcium imaging reveals distinct populations of wind- and sound-
responsive JO neurons…………………………….… 66
Figure 6 A and B neurons are sensitive to frequency, while E neurons are
sensitive to a wide range of wind speed………………….… 67
Figure 7 Map of wind direction in the AMMC…………………….... 68
Figure 8 Effect of arista ablation on wind and sound sensitivity….… 69
ix
Figure 9 Anterial displacement of arista causes the activation of C neurons,
while posterial displacement of arista causes the activation of E
neurons………………………………...……70
Figure 10 Ablation of wind-sensitive (C and E) neurons abolishes WISL
behavior………………………………………………….… 71
Figure 11 Quantification of WISL behavior in flies lacking JO-CE
neurons…………………………………………………….. 72
Figure 12 Wind- and sound-sensitive JO neurons have different intrinsic
response properties………………………………………… 73
Chapter 3
Figure 13 Tonotopic map in the Johnston’s organ…………………… 91
Figure 14 Cell bodies of A neurons are bigger than those of B, C, and E
neurons………………………………………………….…. 92
Figure 15 Full-length arista is required for the detection of high frequency
sound but not for low frequency sound………… 93

1
Chapter 1
Introduction
2
Introduction
All animals have evolved to respond rapidly to various sensory stimuli that
threaten or enhance their survival and reproduction. At any moment in nature, animals
have to figure out details about various aspects of stimuli surrounding them to make a
judgment about the current status of the environment, whether the stimuli pose a threat or
an opportunity to feed or mate. For example, animals may need to figure out whether the
predator in the far distance is moving or stationary. How fast is it moving? At the same
time, they might have to figure out from which direction a conspecific calling song is
coming, and whether it is getting louder or quieter. They need to be able to detect and
discriminate biologically relevant stimuli accurately and quickly to maximize their
survival. So, how did the animal’s nervous system evolve to facilitate rapid and accurate
sensory information processing? Are there common strategies used by many sensory
systems from various organisms for efficient sensory information processing?
One of the goals in neurobiology is to understand how sensory information is
processed, from its initial detection in the periphery to the eventual generation of percepts
that drive behavioral outputs. There are many types of mechanisms and strategies that
may be involved in sensory information processing. Some mechanisms might be specific
for processing certain types of sensory stimuli, while others might be common to all
sensory systems, since they are essential for efficient sensory information processing.
Among all mechanisms and strategies used by various sensory systems, which are the
critical components for accurate and rapid sensory information processing? To provide
insight into these questions, I will discuss first the general mechanisms involved in
sensory systems, and second the common mechanisms used by various systems to
3
facilitate efficient sensory information processing, by comparing three types of
mammalian sensory systems. Finally, I will also compare mammalian and insect sensory
systems to discuss whether there are common strategies used for efficient and accurate
sensory information processing by different organisms across phylogeny.
The sensory nervous system
Our brain receives sensory information about sight, sound, taste, touch, smell,
temperature, balance, and limb position, among other stimuli from specialized sensory
organs in the peripheral nervous system. Each sensory organ contains specialized
sensory receptor cells whose major function is to transform physical or chemical stimuli
into a code of neural impulses and transmit these electrical signals to neurons in the
higher-order processing centers for further computations and transformations (Bloom and
Lazerson, 1988; Kandel et al., 2000). In some systems, the receptor cells have the
afferent fibers projecting to the second-order processing center (i.e., olfaction), while in
other systems (i.e., hearing and gustation), the receptor cells do not have fibers, but they
communicate to other fiber-bearing cells that project to the central nervous system
(Norgren, 1983; Rusznak and Szucs, 2009; Sullivan et al., 1995). After multiple
transformations in the higher order processing centers, the brain pieces together all of the
information it receives from various sensory modalities at any given moment to construct
a coherent percept of the external world (Bloom and Lazerson, 1988; Kandel et al.,
2000).
Sensory receptor cells convey four basic types of information about the stimulus:
modality, time, intensity, and location (Fechner, [1860] 1966). All four of these
4
elementary attributes of stimuli influence our sensory perception in important ways, and
how our sensory systems encode these elements impacts their efficiency. We will now
briefly look at the four basic attributes of stimuli encoded by the sensory receptors.
Encoding modality
Modality defines the general classes of stimulus that receptors are specialized to
recognize. For example, vision, audition, olfaction, gustation, and somesthesia (which
includes tactile, pain, temperature, itch, proprioception, and visceral sense) are the major
modalities that humans experience. Each modality is encoded by a specific class of
receptors, and usually no overlapping usage of receptors is observed between modalities
(Kandel et al., 2000). For each modality, there are several constituent qualities or
submodalities, which are encoded by different receptors. For example, gustation has five
constituent qualities: sweet, sour, salty, bitter, and Umami, and are encoded by different
gustatory receptors (Chandrashekar et al., 2006; Montell, 2009). Thus, each modality is
represented by the ensemble of receptors that belong to a specific class.
Encoding stimulus intensity
Sensory receptors also encode information about the intensity of stimulus. The
intensity of a stimulus refers to its magnitude or strength, which contributes to the
salience of the stimulus under certain circumstances. For example, the louder the sound
of a predator or the stronger the scent of a predator, the closer the danger is for many
animals in nature. Thus, accurate knowledge of the intensity of a stimulus directly relates
to the survival of animals in nature.
5
The encoding of stimulus intensity is usually achieved by varying the firing
frequency of the sensory afferent fibers (Adrian and Zotterman, 1926). When the
stimulus magnitude increases, the firing frequency of the afferent fibers also increases.
Moreover, the stronger the stimulus, the greater the number of afferent fibers (and
receptors) that are activated; thus, intensity of stimulus is coded by the firing frequency
of an ensemble of afferent fibers (and sensory receptor cells).
The lowest possible stimulus magnitude that an organism can detect is reflected in
the activation threshold of the sensory receptors, and is related to the sensitivity of the
system. In order to truly increase the sensitivity of the system, the receptors should be
able to detect both low stimulus intensities and a wide dynamic range of stimulus
intensities. Different sensory systems have developed different mechanisms to improve
sensitivity, as will be discussed later in this chapter.
Encoding stimulus time
The duration and temporal properties of a stimulus (i.e., the rate at which the
stimulus intensity increases or decreases) are encoded by various types of receptors with
different response properties (i.e., adaptation rate and activation threshold). In the
mammalian glabrous skin, there are several types of mechanoreceptor structures,
including the slowly adapting Merkel discs, rapidly adapting Meissner’s corpuscles and
Pacinian corpuscles, that encode different temporal aspects of light touch stimulation
(Johnson, 2001; Johnson and Hsiao, 1992). For example, when a probe touches the skin
for several seconds, the initial spike discharge reflects both the total amount of pressure
applied to the skin and the speed at which the skin is indented. The acceleration and
6
velocity of skin indentation are encoded by the rapidly adapting Meissner’s corpuscles
and Pacinian’s corpuscles, which respond only at the beginning and end of the stimulus,
and are specialized to encode the rate at which stimulus is applied or removed
(Loewenstein and Mendelson, 1965; Torre et al., 1995). In contrast, the stimulus
duration is encoded by the slowly adapting Merkel discs, which are able to respond
throughout continuous prolonged stimulation (Vallbo and Johansson, 1984). The
activation of rapidly adapting receptors at the beginning and end of stimulation provide a
information about the changing sensory environment while the activation of slowly
adapting receptors provide a information about the presence of a prolonged stimulus.
Encoding stimulus location
The location of the stimulus conveys important spatial information about the
stimulus, such as its size and directionality (Kandel et al., 2000). For example, animals in
nature have to figure out the size of an approaching object (i.e., predator), from which
direction the object is approaching, or from which direction a con-specific calling song is
coming. The accurate representation of the location and size of a stimulus is thus
obviously an important aspect of sensory coding. For many modalities, such as vision,
audition, touch, pain, and temperature, the spatial location of a stimulus is represented by
the spatial arrangement of the ensembles of activated receptors in a sense organ, which is
called a receptive field (Hubel, 1963; Hubel and Wiesel, 1968; Kandel et al., 2000).
The size of a receptive field influences how well a sensory system can resolve
small details of the stimulus. Denser populations of receptors have smaller receptive
fields, which allows finer resolution of spatial details of the stimulus (Cleland et al.,
7
1979; Vallbo and Johansson, 1978). The size of receptive fields is not uniform within a
given sensory organ. For example, mechanoreceptors are not uniformly distributed
across our body parts. Our fingertips contain smaller receptive fields with more densely
populated receptors, compared to our thoracic region, which allows us to discriminate
fine details of objects that we touch (Weinstein, 1968). Similarly, the fovea of the retina
has a better ability to resolve small details of the visual stimulus compared to the retinal
periphery, because the fovea contains a denser population of cone photoreceptors with
smaller receptive fields (Hubel, 1988). Thus the size of a receptive field is related to the
acuity of a given sensory system.
As we have discussed so far, receptors transform physical stimuli into a code of
neural impulses, which contains basic information about stimulus modality, intensity,
time, and location. These four elementary attributes of stimuli influence our perception of
the salience of stimuli and percepts in different ways.
Accumulating evidence suggests that there are common strategies used by many
sensory systems to improve their sensitivity, acuity, and speed of information processing.
For the improvement of sensitivity, most sensory systems seem to modify either the
structure or circuit organization in the periphery. For the improvement of acuity (or
ability to resolve small differences), many sensory systems utilize inhibitory mechanisms
in both the periphery and higher order processing centers of the brain. Finally, to
improve the speed of information processing, many systems modify the circuit
organization. To illustrate these points, I will mainly focus on the sensory systems that
are activated by physical stimuli (pressure, sound waves, and photons), and compare
8
three mammalian sensory systems, which are located in bilaterally symmetrical organs-
the visual, auditory, and tactile systems.
Common mechanisms to improve sensitivity
The sensitivity of most sensory systems is primarily determined by the property of
the sensory receptor cells; however, it can be improved by different amplification
mechanisms. Some sensory systems make use of structure-based amplification, while
others make use of circuit-based amplification.
Many nocturnal animals have exquisite nighttime vision due to the tapetum
lucidum, an extra layer of tissue behind the retina, which contains reflective material such
as zinc-cysteine and riboflavin (Ollivier et al., 2004). The tapetum lucidum allows light
to pass through the photoreceptors twice to increase the sensitivity of the eyes in a dim
light environment. Although there are variations among different organisms regarding
the structure, location, and choice of reflective materials, the tapetum lucidum represents
a remarkable example of a sensory organ that achieves structure-based amplification as
an adaptation to a dim light environment.
Our hearing organs also utilize a structure-based amplification mechanism. Most
mammalian cochlea contain two types of hair cells, inner and outer hair cells (Moller,
2003). The inner hair cell is the auditory receptor, which transforms acoustic energy into
electrical signals, while outer hair cells are involved in gain control. The outer hair cells,
together with the stapedius muscle in the middle ear that controls how hard the stapes hits
the oval window, are capable of both amplifying faint sound to increase our hearing
range and reducing the energy of loud sound to protect our ears from damage (Moller,
9
2003). This gain control by the outer hair cells is due to the motion of the outer hair cell
body in response to changes in the cell membrane potential, called electromotility
(Holley and Ashmore, 1988; Liberman et al., 2002). When an isolated outer hair cell is
depolarized, its cell body shortens. Conversely, when an isolated outer hair cell is
hyperpolarized, its cell body elongates (Holley and Ashmore, 1988). At low sound
intensities, the outer hair cells improve the mechanical performance of the cochlea by
increasing the magnitude of electromotility, which in turn, amplifies the basilar
membrane motion to increase hearing sensitivity (Ashmore, 2008; Dallos, 2008).
In contrast to nocturnal animals, diurnal animals do not have a tapetum lucidum,
thus their nighttime vision is nowhere near as sensitive as that of nocturnal animals.
Nevertheless, they also utilize sensitivity amplification mechanisms to improve their
nighttime vision. However, in this case the mechanism is circuit-based rather than
structure-based. The retina of diurnal mammals, including humans, contains two major
types of photoreceptors, rods and cones. Rods contain more photosensitive visual
pigments than cones, thus, rods function well in nighttime vision, while cones function
better in high illumination conditions (Kandel et al., 2000; Moller, 2003). Thus
sensitivity is an issue for rods rather than cones. While rods are sensitive enough to
respond to a single photon of light (Baylor et al., 1979; Baylor et al., 1984), their signals
are further amplified by converging axons of multiple rods onto a single target bipolar
cell. However, improved sensitivity with high convergence of rods onto a single
ganglion cell comes at a cost of visual acuity, since a high convergence of rods increases
the size of the ganglion cell receptive fields, which causes reduced acuity (Kandel et al.,
2000). This is why it is difficult to resolve small differences in dim light conditions. The
10
circuit-based amplification using a high convergence of receptors onto the target neuron
is also observed in the olfactory system (Masse et al., 2009; Mori et al., 1999; Sullivan et
al., 1995). Multiple olfactory receptor neurons expressing the same odorant receptor
converge on the same glomerulus in the olfactory bulb.
Cones, in contrast, require more acuity than sensitivity, since they function in
high illumination conditions. Cones, especially in the fovea, do not show high
convergence onto a single bipolar cell; rather, they synapse on multiple bipolar cells, and
achieve high acuity by increasing the receptor density in the fovea, where receptive fields
are very small. Similar to the cones of the eyes, the tactile system requires more acuity
than sensitivity. The high acuity is achieved by increasing the receptor density in certain
areas of the body surface (i.e., fingertips and tongue) and by making the receptive fields
smaller to increase their acuity (Johansson and Vallbo, 1983).
Thus, most sensory systems seem to have a mechanism to improve sensitivity (or
acuity), however, the mechanisms used are different depending on the system.
Lateral inhibition is a general mechanism to improve acuity
The interaction between the excitation and inhibition is the basis for many kinds
of computational processes that occur in the nervous system (Kandel et al., 2000; von
Bekesy, 1967b). Lateral inhibition is an inhibitory mechanism that arises from the
activities of local inhibitory interneurons to modulate the activities of the neighboring
excitatory neurons. The Nobel Prize–winning work by Haldan Keffer Hartline
demonstrated that lateral inhibition (in the retina) is a neural mechanism that most
animals, including humans, use to better discriminate borders by increasing the contrast
11
(Hartline et al., 1956; Ratliff et al., 1959). The effect of lateral inhibition in the retina can
be best illustrated by the phenomenon called “Mach band,” which was discovered by
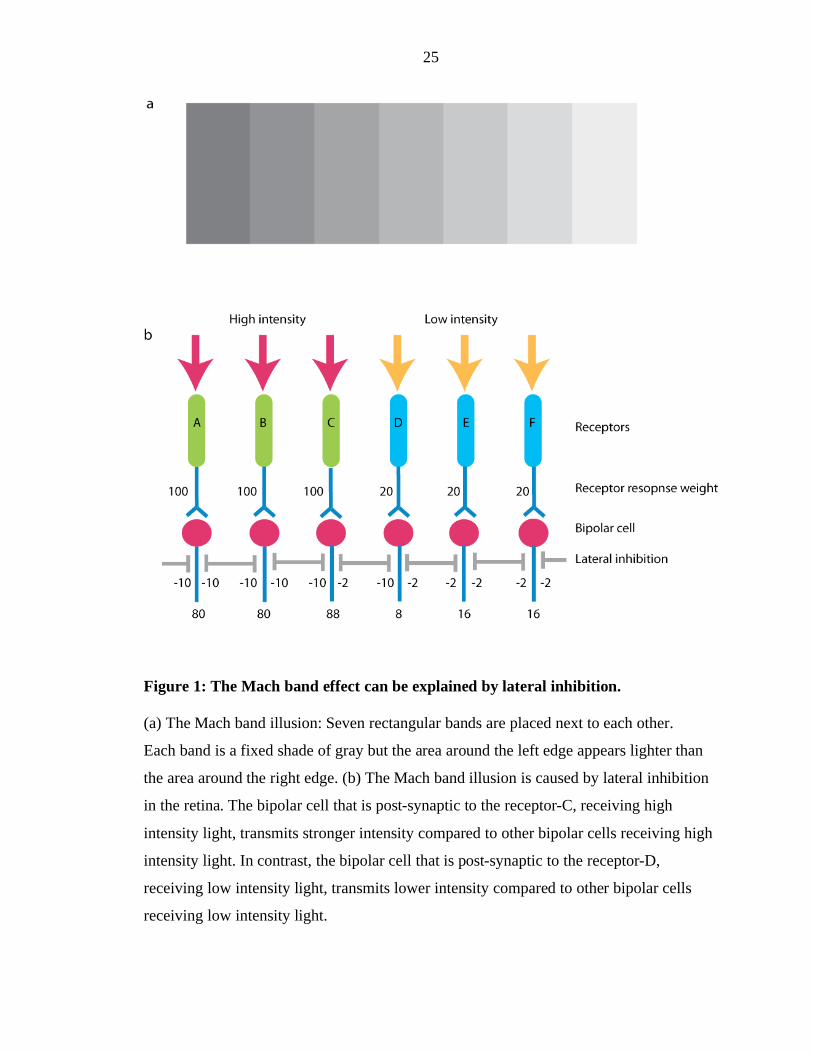
Ernst Mach (Ratliff, 1965). Figure 1 shows seven gray rectangular bands next to each
other. Each of the seven bands is a fixed shade of gray but the area around the left edge
appears lighter than the center area, and the area around the right edge appears darker
than the center. The Mach band illusion is caused by lateral inhibition of the
photoreceptor cells by the horizontal (inhibitory) cells in the retina (Fig. 1a–b). Lateral
inhibition in the retina is an example of how sensory information processing begins in the
periphery. In addition, the Mach band effect demonstrates that what we see is not exactly
“what is out there.” It is an excellent illustration of how the brain is organized to
“actively” construct our perception rather than to reproduce a faithful replication of the
physical world in order to facilitate our sensory interpretation.
The use of inhibitory mechanisms to improve acuity is a general phenomenon that
applies to other sensory systems (von Bekesy, 1967a). For example, lateral inhibition is
particularly important for fine tactile discrimination involved in Braille reading (DiCarlo
and Johnson, 2002; DiCarlo et al., 1998; von Bekesy, 1960). When two Braille dots
strike our fingertip, two populations of Merkel cells are activated. When two dots are far
apart, two non-overlapping Merkel cell populations are activated on the skin. In contrast,
when two dots are closer together, two overlapping populations are activated. If there is
no lateral inhibition between the two overlapping populations, we will not be able to
discriminate the two closely positioned dots. Lateral inhibition enhances the separation
of the two active populations, which allows us to discriminate two closely positioned dots
in space.
12
Lateral inhibition is also used to enhance pitch discrimination in mammalian
auditory systems (Ma and Suga, 2004; Paolini et al., 2005; Paolini et al., 1998; Suga,
1995). The transformation of acoustic energy into electrical impulses involves the
displacement of the basilar membrane, which causes the inner hair cells to bend against
the tectorial membrane. The mechanical bending of the hair cells thus allows us to hear
sound, and our ability to hear different sound frequencies depends on the location of the
basilar membrane displacement, since the basilar membrane of the cochlea is organized
into a tonotopic map: Higher frequency sound causes maximum displacement of the
basilar membrane closer to its base near the stapes, while lower frequency sound
produces maximum displacement of the basilar membrane closer to its apex near the
helicotrema (Kandel et al., 2000; Moller, 2003). Our ability to discriminate similar
frequencies is due to the lateral inhibition that occurs in the medulla. Each inner hair cell
is innervated by multiples of spiral ganglion cells that project to the cochlear nuclei of the
medulla. In the rat cochlear nuclei, there are three interconnected sub-nuclei that receive
tonotopically organized inputs from the cochlea. Paolini et al. (1998) showed that lateral
inhibition between these sub-nuclei sharpens the frequency discrimination.
Strategies for fast information processing
The visual environment consists of enormous amounts of information, which is
extracted by our visual system. Color, depth, shape, orientation direction, and motion are
just a few of the many features through which we interpret our visual environment. To
achieve efficient processing for large amounts of information, the visual system utilizes a
combination of parallel and hierarchical processing, which is also facilitated by the
13
layered structural organization of the cortex (Kandel et al., 2000; Nassi and Callaway,
2009). Distinct features, such as color, depth, shape, and motion, are processed in
parallel channels, and within each channel, hierarchical processing takes place in such a
manner that simpler properties emerge first in the periphery, and more sophisticated
properties emerge later at higher processing centers in the cortex. At each information
relay along the hierarchical processing centers, selective filtering of visual information
occurs via complex interactions between inhibitory and excitatory neurons (e.g. lateral
inhibition) to extract specific properties. Interestingly, the parallel processing of distinct
features starts as early as the first synapse of the retina, because ganglion cells in the
retina exhibit feature selectivity (Masland, 2001; Nassi and Callaway, 2009; Wassle,
2004). For example, there are object motion-selective ganglion cells called Brisk
transient-Y cells (Olveczky et al., 2003), direction-selective ganglion cells (Barlow and
Hill, 1963; Barlow and Levick, 1965; Fried et al., 2002), and color-selective ganglion
cells called Midget (Diller et al., 2004; Wassle, 2004). The feature selective ganglion
cells project to specific layers of the lateral geniculate nucleus. Color-selective ganglion
cells project to layers 3–6 via the parvocellular pathway, while the direction-selective and
object motion-sensitive ganglion cells project to layers 1–2 via the magnocellular
pathway (Merigan and Maunsell, 1993). The information for color vision and motion
detection is further processed by different layers of the primary visual cortex (Fitzpatrick
et al., 1985; Hawken et al., 1988; Livingstone and Hubel, 1984; Ts'o and Gilbert, 1988).
Thus, the visual system speeds up the information processing time by processing
different features of visual information in the separate channels simultaneously. It is
important to note that information from the parallel pathways is eventually unified to
14
generate a coherent visual image.
Parallel processing is not a unique property of the visual system; it is also found
in most sensory modalities in the mammalian brain. The somatosensory system of
rodents also utilizes parallel processing. In rats and other rodents, whiskers are highly
sensitive and specialized sensory organs that allow the animals to navigate and recognize
objects; thus whiskers convey both tactile and spatial information. Three parallel
pathways from the periphery to the thalamus exist for processing object identity, object
location, and the temporal information of whisking for motor control (Yu et al., 2006).
The information regarding object identity is conveyed by the lemniscal pathway, while
the spatial information regarding the location of an object is conveyed by the
extralemniscal pathway (Pierret et al., 2000; Yu et al., 2006). Finally, the temporal
information regarding the motor control of whisking is conveyed by the paralemniscal
pathway. Thus, the whisking system in rats also utilizes layered structures to facilitate
parallel processing of different features of whisking information.
In the auditory system, similar parallel pathways for sound localization and
temporal pattern discrimination have been identified in the auditory cortex of humans
(Courtney et al., 1996; Ungerleider and Haxby, 1994), monkeys (Romanski et al., 1999;
Tian et al., 2001), and cats (Lomber and Malhotra, 2008). Therefore, parallel processing
of different features within a modality seems to be a general principle used by most
sensory systems for speedy information processing.
It is noteworthy that in most sensory systems, there are topographic
representations of sensory maps associated with information processing centers in the
periphery, cortex, and intervening relay nuclei. For example, in the visual and
15
somatosensory systems, the topographic arrangement of receptors in the periphery is
maintained in the cortex, as retinotopic and somatopic maps. Some maps are simple and
well organized, such as the tonotopic map in the basilar membrane and auditory cortex
(Merzenich and Brugge, 1973) and somatotopic maps in the somatosensory cortex
(Penfield and Rasmussen, 1950), while other maps, such as orientation columns and
ocular dominance columns in the primary visual cortex, are organized into a complex
pattern (Blasdel and Salama, 1986; Hubel et al., 1978). The fact that orderly maps of the
periphery are maintained throughout the chain of hierarchical nuclei up to the primary
cortex makes us wonder what functional advantage, if any, such sensory maps might
serve? It is plausible that sensory maps facilitate circuit operation, such as lateral
inhibition, which benefits from topographic organization of functionally related areas
(Kaas, 1997). It is also plausible that the sensory map in the cortex is required for the
process of piecing together information from the parallel pathways to generate a coherent
percept. Whatever the reasons, the presence of sensory maps seems to indicate a
presence of some forms of information processing in the pathway.
Based on the mammalian visual, tactile, and auditory systems, there are emerging
common mechanisms and circuit organization that are required to build an efficient
sensory system. First, most systems seem to have mechanisms to improve sensitivity
using either structure-based or circuit-based amplification. Second, most sensory systems
seem to use some inhibitory mechanisms (i.e., lateral inhibition) to improve their ability
to discriminate small differences. Third, most systems use a combination of parallel and
hierarchical processing to speed up the information processing time. Fourth, the cortex
of many sensory systems is layered to facilitate parallel information processing. Finally,
16
many sensory systems seem to have sensory maps at the cortex and relay nuclei, which
seem to provide some functional advantages. These strategies seem reasonable, but are
they conserved across evolution? Are these strategies the only way to build an efficient
sensory system? To provide insights into the potential evolutionary conservation of
mechanisms for efficient sensory information processing, I will now discuss examples of
invertebrate sensory systems.
Insect visual systems
Bees navigate the natural world much as we do, and they must also similarly cope
with all the challenges of processing visual cues in order to respond to biologically
relevant stimuli. Although bees have smaller brains, with a smaller number of neurons,
compared to mammals, they still have to perform visual information processing. Thus,
their visual system must be more efficient in order to cope with the challenges imposed
by small brains. What mechanisms and structural organizational features allow small
insect brains to perform efficient visual information processing? Do insects with small
brains also use similar mechanisms and circuit organizations as mammals with large
brains? Or do they use different strategies to compensate for their small nervous system?
The flow of visual information in the bee’s visual system begins from the retina to
the lamina, and to the medulla, and then to the lobula, which has a similar functional role
as the primary visual cortex (Paulk et al., 2008). Neurons in the lobula exhibit a variety
of functional properties similar to those observed in the mammalian visual system, such
17
as orientation selectivity, direction specific and non-direction-specific motion sensitivity,
color opponency, and spatially antagonistic receptive fields (DeVoe et al., 1982; Hertel,
1980; Maddess and Yang, 1997; Menzel, 1973; Yang et al., 2004). Interestingly, the
lobula also has six layers, much like the primary visual cortex of mammals, and these six
layers are engaged in parallel processing of different features of visual stimuli (Paulk et
al., 2009; Paulk et al., 2008). Layers 1–4 show achromatic motion sensitivity, while
layers 5–6 show color sensitivity. Furthermore, color and motion-selective information is
further processed in parallel channels by the anterior portion of the lateral protocerebrum
for colors, and the posterior portion of lateral protocerebrum for motion (Paulk et al.,
2009). Thus, the visual system of bumblebees also possesses parallel visual pathways that
are comparable to the magnocellular (for motion) and parvocellular (for color)
subsystems of primates.
Interestingly, evidence suggests that this parallel segregation of pathways for
color and visual-motion processing begins at the level of specialized receptors with
distinct response properties in the retina. Paulk et al. (2008) showed that there are four
major types of receptors in the bumblebee’s retina. The first group shows tonic
responses, the second group shows phasic responses only at the onset of the stimulus
(referred as “phasic”), the third group shows phasic responses at both onset and offset of
the stimulus (referred as “ON-OFF”), and the fourth group shows tonic responses with
phasic bursting at the onset of stimulus (referred as “phasic-tonic”). They found that the
majority of the “phasic” receptors exhibit habituation for repeated stimuli and are
involved in encoding color sensitivity, while the majority of the “ON-OFF” receptors
exhibit a high accuracy of spike timing and are involved in achromatic motion sensitivity.
18
Thus, receptors with specific response properties seem to be involved in specific feature
processing in bees.
Similar to the mammalian visual systems, bees also utilize a layered structure to
facilitate parallel processing for different features of visual stimuli. These mechanisms
seem to be a general rule that also applies to other insect species, such as the blowfly
Phaenicia sericata (Okamura and Strausfeld, 2007), Mantis shrimp (Cronin and
Marshall, 2001), and Drosophila (Borst, 2009; Douglass and Strausfeld, 1996). Thus,
these similarities between the mammalian and various insects’ visual systems suggest
that these mechanisms are evolutionarily conserved, and seem to follow general rules for
achieving rapid information processing, at least in the visual system.
Insect auditory systems
The hearing organs of insects have evolved many times independently, under
different environmental and evolutionary contexts (Yack, 2004). Consequently, there are
many variations among different insect species as to where the hearing organ is located,
what type of hearing organ they have (i.e., tympanal membrane, Johnston’s organ,
subgenual organ), and the mechanisms and neural circuitry underlying auditory
information processing (Yager, 1999). The obvious difference between mammalian ears
and the ears of insect species is reflected in the type of auditory receptors they have. The
mammalian auditory receptor, the inner hair cell, in itself does not have a specific
frequency tuning; instead the location of the basilar membrane displacement determines
the frequency tuning of the inner hair cells (Moller, 2003). In contrast, the auditory
receptors of most insect species with tympanal membranes (except moths) have intrinsic,
19
specific frequency tuning properties. They normally have two or more types of receptors
with slightly different frequency tuning curves to cover the entire range of audible
frequencies. The discrimination of frequencies requires the comparisons of relative
levels of excitation across a group of receptors with different preferred frequency tuning
(Esch et al., 1980; Hutchings and Lewis, 1981; Michelsen, 1966; Michelsen, 1968;
Oldfeld, 1982).
What is common between mammalian and insect auditory systems is the presence
of tonotopic representations (Kaas, 1997). In many insects, such as bushcrickets and
grasshoppers, the central projections of the sensory receptor neurons are organized into a
tonopotic map (Hennig et al., 2004; Imaizumi and Pollack, 2005; Mason and Faure,
2004; Stolting and Stumpner, 1998). In bushcrickets, for example, receptor cells that are
tuned to lower frequencies project towards the anterior portion of the prothoracic
ganglion, while receptor cells that are tuned to higher frequencies project towards the
posterior portion of the prothoracic ganglion. Interestingly, the receptor cells that are
tuned to sound frequencies of the conspecific calling song have a larger representation in
the tonotopic map compared to the frequencies outside of the conspecific calling song
(Oldfeld, 1983; Romer, 1983). This is reminiscent of the homunculus, in which more
sensitive body surfaces, such as the fingertips and lips, are represented in a much larger
areas of the cortex compared to less sensitive body surface areas, such as the trunk
(Penfield and Rasmussen, 1950). Interestingly, the sharpening of frequency tuning takes
place at the prothoracic ganglion, where a tonotopic map exists (Atkins et al., 1989;
Boyan, 1981; Romer, 1987). In addition, crickets and grasshoppers also utilize inhibitory
mechanisms to sharpen the frequency tuning. It was shown that when such inhibition is
20
eliminated by the application of picrotoxin, the frequency tuning broadens (Romer and
Seikowski, 1985; Stumpner, 1998; Stumpner, 2002).
The segregation into separate parallel channels dedicated to processing directional
and temporal patterns of sound stimuli is well documented in the vertebrate auditory
systems (Covey and Casseday, 1991; Oertel, 1999; Takahashi et al., 1984; Viete et al.,
1997). Interestingly, grasshoppers also process directional and temporal patterns of
sound stimuli in parallel pathways, in much the same way as vertebrates. Grasshoppers
determine the direction of sound sources using the interaural intensity differences
between the right and left tympanal ears on their first abdominal segments (Hennig et al.,
2004; Mason and Faure, 2004). It is important to note that vertebrates with large heads
use both interaural intensity and interaural time differences for sound localization;
However, insects with a small body sizes mainly rely on interaural intensity differences,
since it is difficult to resolve small differences in the arrival time of a sound stimulus
between the right and left ears of a small body.
Crickets, in contrast, process the direction and temporal patterns of sound stimuli
in a serial order instead of processing in parallel pathways (Schul, 1998; Stabel et al.,
1989; von Helversen and von Helversen, 1995). In bushcrickets, information regarding
both directional and temporal patterns of the sound stimuli converges on a pair of
interneurons called ascending interneuron-1 and -2 (AN1 and AN2) (Schildberger and
Horner, 1988), while in grasshoppers, the ascending interneurons are functionally
separated in two parallel pathways to process directional and temporal information (Franz
and Ronacher, 2002; Schildberger and Horner, 1988).
21
So what are the costs and benefits of parallel vs. serial processing of directional
and temporal patterns of sound stimuli in grasshoppers and crickets, respectively? In
both grasshoppers and crickets, information regarding the frequency, direction, and
temporal pattern is used for positive phonotaxis behavior in such a way that they orient
towards louder and more attractive patterns of sound stimuli (Stabel et al., 1989; von
Helversen and von Helversen, 1997). Interestingly, crickets, with serial processing,
exhibit positive phonotaxis with better angular resolution than grasshoppers, with parallel
processing (Hennig et al., 2004). Grasshoppers tend to either over- or under estimate the
angles of sound sources; however, under complex circumstances in which the direction
and temporal patterns of two competing sound stimuli are ambiguous, crickets (with
serial processing) fail to exhibit a positive phonotaxis behavior (Stabel et al., 1989).
Thus, it seems that crickets (with serial processing) have an advantage in angular
resolution, but this gain is opposed by a loss in fidelity for pattern processing under
complex circumstances. Although more detailed analyses with various organisms are
required for informative generalization, there seems to exist a trade-off between the serial
and parallel processing strategies, and this might explain why higher-order organisms
with larger brains use the combination of serial and parallel processing for efficiency and
accuracy of sensory information processing.
So, what is the best strategy to build the most efficient and accurate sensory
system? We do not have a clear answer but there are general trends. Based on the
comparisons between different sensory systems in mammals and other organisms across
phylogeny, there are several strategies and mechanisms that are commonly used for
efficient information processing. First, most sensory systems use amplification
22
mechanisms to improve sensitivity of the system, whether structure-based or circuit-
based. Second, most sensory systems use inhibitory mechanisms, such as lateral
inhibition, to improve the ability to discriminate small differences. Third, most sensory
systems preserve topographic representations of peripheral sensory information at the
multiple levels of information processing centers, which seems to argue that topographic
representation of sensory stimuli is beneficial for sensory information processing.
Fourth, the example of insect auditory systems suggests that both serial and parallel
processing have a cost and benefit. This might be the reason why many sensory systems,
especially in higher organisms, use a combination of parallel and serial processing for
speed and accuracy, and these separate channels are later combined in the association
areas of the brain to generate a coherent percept. Finally, the use of layered structures,
such as the cortex, seems extremely efficient for parallel processing. Layered structures
are utilized by many sensory systems in many organisms, from insects to humans.
What is most striking of all is that the brain acquires and processes information
using separate channels first. This is evident from the fact that sensory information from
different modalities is acquired and processed via different sensory systems.
Furthermore, different features of stimuli (or submodalities) are also processed in
separate parallel channels. It is only at the later stages of information processing that all
information from different modalities (and submodalities) is pieced together to generate a
coherent percept. Is this a general theme used by the brain? Are all modalities acquired
and processed by the separate sensory organs with distinct classes of sensory receptors?
When I started my project, I was investigating the neural circuitry underlying
wind detection in Drosophila with a simple curiosity to identify the mechanisms and
23
neural circuits involved in wind detection. However, in the course of my study, I found
that Drosophila detect wind using a mechanosensory organ called Johnston’s organ,
which is known to be implicated in sound detection (Bennet-Clark, 1971; Boekhoff-Falk,
2005; Eberl, 1999; Tauber and Eberl, 2003). This dual role in sound and wind detection
seems contrary to the central concept that different modalities are processed by distinct
pathways via distinct sensory organs each equipped with specialized set of receptors. Is
Drosophila an unusual case in which both wind and sound are processed using a common
sensory organ? Do other insects have separate sensory organs to process wind and
sound? Most insect species including cockroaches and crickets, wind and sound
information are processed via separate sensory organs. For example, the cockroach
detects wind using the filiform sensilla of the cercal system, located at the posterior end
of the abdomen, while sound is detected by the subgenual organ, which is located on its
proximal tibia (Keegan and Comer, 1993; Kondoh et al., 1993; Moran and Rowley, 1975;
Rinberg and Davidowitz, 2003; Shaw, 1994). Crickets also detect wind using the cercal
system located at the posterior end of their abdomen, while they use a tympanal
membrane on their forelegs to detect sound (Hedwig, 2006; Kanou et al., 2006; Mason
and Faure, 2004). Thus, Drosophila might be considered unusual in using a single
sensory organ to detect both wind and sound. The question is how. The fact that the
receptor subtypes and neural circuits implicated in sound or wind pathways in Drosophila
were unknown, and the unique arrangement of the wind/sound detector in the common
sensory organ, antennae, therefore raises several interesting questions: How do flies
distinguish wind from sound using a common sensory organ? Do the same population of
receptors encode wind and sound? How are wind and sound pathways organized in the
24
Johnston’s organ and in the brain? Are wind and sound processed by separate pathways
or by the same pathway?
To gain insight into these issues, I investigated the following questions using a
combination of behavioral and electrophysiological analyses, and in-vivo calcium
response imaging: 1) Which receptor neurons are implicated in sound and wind
detection? Do the receptor neurons implicated in sound and wind detection belong to the
same or to different populations? 2) If distinct populations of receptor neurons are
implicated in sound vs. wind detection, then do they differ in their intrinsic response
properties? 3) Are wind and sound processed in separate or the same pathways, and 4) Is
there a sensory map of wind or sound?
In this project, I will focus on the mechanisms and information processing in the
periphery. The understanding of the peripheral organization of a sensory system is an
essential first step, and also provides insights into how these circuits are organized in the
brain. A comprehensive circuit analysis beyond the primary sensory neurons is however,
beyond the scope of this project. I will lay out the peripheral organization of these
pathways for the future comprehensive analysis of the circuits involved in wind and
sound information processing in Drosophila.
25
Figure 1: The Mach band effect can be explained by lateral inhibition.
(a) The Mach band illusion: Seven rectangular bands are placed next to each other.
Each band is a fixed shade of gray but the area around the left edge appears lighter than
the area around the right edge. (b) The Mach band illusion is caused by lateral inhibition
in the retina. The bipolar cell that is post-synaptic to the receptor-C, receiving high
intensity light, transmits stronger intensity compared to other bipolar cells receiving high
intensity light. In contrast, the bipolar cell that is post-synaptic to the receptor-D,
receiving low intensity light, transmits lower intensity compared to other bipolar cells
receiving low intensity light.
26
REFERENCES
Adrian, E. D., and Zotterman, Y. (1926). The impulses produced by sensory nerve-
endings: part II. The response of a single end-organ. J Physiol 61, 151-171.
Ashmore, J. (2008). Cochlear outer hair cell motility. Physiol Rev 88, 173-210.
Atkins, S., Atkins, G., Rhodes, M., and Stout, J. (1989). Influence of syllable period on
song encoding properties of an ascending auditory interneuron in the cricket Acheta
domestica. J Comp Physiol A Neuroethol Sens Neural Behav Physiol 165, 827-836.
Barlow, H. B., and Hill, R. M. (1963). Selective sensitivity to direction of movement in
ganglion cells of the rabbit retina. Science 139, 412-414.
Barlow, H. B., and Levick, W. R. (1965). The mechanism of directionally selective units
in the rabbit's retina. J Physiol 178, 447-504.
Baylor, D. A., Lamb, T. D., and Yau, K. W. (1979). Responses of retinal rods to single
photons. J Physiol 288, 613-634.
Baylor, D. A., Nunn, B. J., and Schnapf, J. L. (1984). The photocurrent, noise and
spectral sensitivity of rods of the monkey Macaca fascicularis. J Physiol 357, 575-607.
Bennet-Clark, H. (1971). Acoustics of insect song. Nature 234, 255-259.
Blasdel, G. G., and Salama, G. (1986). Voltage-sensitive dyes reveal a modular
organization in monkey striate cortex. Nature 321, 579-585.
Bloom, F. E., and Lazerson, A., eds. (1988). Brain, mind, and behavior, 2 edn (New
York: Freeman).
Boekhoff-Falk, G. (2005). Hearing in Drosophila: development of Johnston's organ and
emerging parallels to vertebrate ear development. Dev Dyn 232, 550-558.
Borst, A. (2009). Drosophila's view on insect vision. Curr Biol 19, R36-47.
Boyan, G. (1981). Two-tone suppression of an identified auditory neurone in the brain of
the cricket Gryllus bimaculatus (De Geer). J Comp Physiol A Neuroethol Sens Neural
Behav Physiol 144, 117-125.
Chandrashekar, J., Hoon, M. A., Ryba, N. J., and Zuker, C. S. (2006). The receptors and
cells for mammalian taste. Nature 444, 288-294.
Cleland, B. G., Harding, T. H., and Tulunay-Keesey, U. (1979). Visual resolution and
receptive field size: examination of two kinds of cat retinal ganglion cell. Science 205,
1015-1017.
27
Courtney, S. M., Ungerleider, L. G., Keil, K., and Haxby, J. V. (1996). Object and spatial
visual working memory activate separate neural systems in human cortex. Cereb Cortex
6, 39-49.
Covey, E., and Casseday, J. (1991). The monaural nuclei of the lateral lemniscus in an
echolocating bat: parallel pathways for analyzing temporal features of sound. J Neurosci
11, 3456-3470.
Cronin, T. W., and Marshall, J. (2001). Parallel processing and image analysis in the eyes
of mantis shrimps. Biol Bull 200, 177-183.
Dallos, P. (2008). Cochlear amplification, outer hair cells and prestin. Curr Opin
Neurobiol 18, 370-376.
DeVoe, R., Kaiser, W., Ohm, J., and Stone, L. (1982). Horizontal movement detectors of
honeybees: directionally-selective visual neurons in the lobula and brain. J Comp Physiol
A Neuroethol Sens Neural Behav Physiol 147, 155-170.
DiCarlo, J. J., and Johnson, K. O. (2002). Receptive field structure in cortical area 3b of
the alert monkey. Behav Brain Res 135, 167-178.
DiCarlo, J. J., Johnson, K. O., and Hsiao, S. S. (1998). Structure of receptive fields in
area 3b of primary somatosensory cortex in the alert monkey. J Neurosci 18, 2626-2645.
Diller, L., Packer, O. S., Verweij, J., McMahon, M. J., Williams, D. R., and Dacey, D. M.
(2004). L and M cone contributions to the midget and parasol ganglion cell receptive
fields of macaque monkey retina. J Neurosci 24, 1079-1088.
Douglass, J. K., and Strausfeld, N. J. (1996). Visual motion-detection circuits in flies:
parallel direction- and non-direction-sensitive pathways between the medulla and lobula
plate. J Neurosci 16, 4551-4562.
Eberl, D. F. (1999). Feeling the vibes: chordotonal mechanisms in insect hearing. Curr
Opin Neurobiol 9, 389-393.
Esch, H., Huber, F., and Wohlers, D. (1980). Primary auditory neurons in crickets:
Physiology and central projections. J Comp Physiol A Neuroethol Sens Neural Behav
Physiol 137, 27-38.
Fechner, G., ed. ([1860] 1966). Elements of psychophysics (New York: Holt, Rinehart
and Winston).
Fitzpatrick, D., Lund, J. S., and Blasdel, G. G. (1985). Intrinsic connections of macaque
striate cortex: afferent and efferent connections of lamina 4C. J Neurosci 5, 3329-3349.
Franz, A., and Ronacher, B. (2002). Temperature dependence of temporal resolution in
an insect nervous system. J Comp Physiol A Neuroethol Sens Neural Behav Physiol 188,
261-271.
28
Fried, S. I., Munch, T. A., and Werblin, F. S. (2002). Mechanisms and circuitry
underlying directional selectivity in the retina. Nature 420, 411-414.
Hartline, H. K., Wagner, H. G., and Ratliff, F. (1956). Inhibition in the eye of Limulus. J
Gen Physiol 39, 651-673.
Hawken, M. J., Parker, A. J., and Lund, J. S. (1988). Laminar organization and contrast
sensitivity of direction-selective cells in the striate cortex of the Old World monkey. J
Neurosci 8, 3541-3548.
Hedwig, B. (2006). Pulses, patterns and paths: neurobiology of acoustic behaviour in
crickets. J Comp Physiol A Neuroethol Sens Neural Behav Physiol 192, 677-689.
Hennig, R. M., Franz, A., and Stumpner, A. (2004). Processing of auditory information in
insects. Microsc Res Tech 63, 351-374.
Hertel, H. (1980). Chromatic properties of identified interneurons in the optic lobes of the
bee. J Comp Physiol A Neuroethol Sens Neural Behav Physiol 137, 215-231.
Holley, M. C., and Ashmore, J. F. (1988). On the mechanism of a high-frequency force
generator in outer hair cells isolated from the guinea pig cochlea. Proc R Soc Lond B
Biol Sci 232, 413-429.
Hubel, D. H. (1963). The Visual Cortex of the Brain. Sci Am 209, 54-62.
Hubel, D. H. (1988). Eye, brain, and vision, Vol 22 (New York: Scientific American
Library series).
Hubel, D. H., and Wiesel, T. N. (1968). Receptive fields and functional architecture of
monkey striate cortex. J Physiol 195, 215-243.
Hubel, D. H., Wiesel, T. N., and Stryker, M. P. (1978). Anatomical demonstration of
orientation columns in macaque monkey. J Comp Neurol 177, 361-380.
Hutchings, M., and Lewis, B. (1981). Response properties of primary auditory fibers in
the cricket Teleogryllus oceanicus. J Comp Physiol A Neuroethol Sens Neural Behav
Physiol 143, 129-134.
Imaizumi, K., and Pollack, G. S. (2005). Central projections of auditory receptor neurons
of crickets. J Comp Neurol 493, 439-447.
Johansson, R. S., and Vallbo, A. B. (1983). Tactile sensory coding in the glabrous skin of
the human hand. Trends Neurosci 6, 27-32.
Johnson, K. O. (2001). The roles and functions of cutaneous mechanoreceptors. Curr
Opin Neurobiol 11, 455-461.
29
Johnson, K. O., and Hsiao, S. S. (1992). Neural mechanisms of tactual form and texture
perception. Annu Rev Neurosci 15, 227-250.
Kaas, J. H. (1997). Topographic maps are fundamental to sensory processing. Brain Res
Bull 44, 107-112.
Kandel, E., Schwartz, J., and Jessell, T., eds. (2000). Principles of neural science, 4 edn
(McGraw-Hill).
Kanou, M., Nawae, M., and Kuroishi, H. (2006). Cercal sensory system and giant
interneurons in Gryllodes sigillatus. Zoolog Sci 23, 365-373.
Keegan, A. P., and Comer, C. M. (1993). The wind-elicited escape response of
cockroaches (Periplaneta americana) is influenced by lesions rostral to the escape
circuit. Brain Res 620, 310-316.
Kondoh, Y., Arima, T., Okuma, J., and Hasegawa, Y. (1993). Response dynamics and
directional properties of nonspiking local interneurons in the cockroach cercal system. J
Neurosci 13, 2287-2305.
Liberman, M. C., Gao, J., He, D. Z., Wu, X., Jia, S., and Zuo, J. (2002). Prestin is
required for electromotility of the outer hair cell and for the cochlear amplifier. Nature
419, 300-304.
Livingstone, M. S., and Hubel, D. H. (1984). Anatomy and physiology of a color system
in the primate visual cortex. J Neurosci 4, 309-356.
Loewenstein, W. R., and Mendelson, M. (1965). Components of Receptor Adaptation in
a Pacinian Corpuscle. J Physiol 177, 377-397.
Lomber, S. G., and Malhotra, S. (2008). Double dissociation of "what" and "where"
processing in auditory cortex. Nat Neurosci 11, 609-616.
Ma, X., and Suga, N. (2004). Lateral inhibition for center-surround reorganization of the
frequency map of bat auditory cortex. J Neurophysiol 92, 3192-3199.
Maddess, T., and Yang, E. (1997). Orientation-sensitive Neurons in the Brain of the
Honey Bee (Apis mellifera). J Insect Physiol 43, 329-336.
Masland, R. H. (2001). The fundamental plan of the retina. Nat Neurosci 4, 877-886.
Mason, A. C., and Faure, P. A. (2004). The physiology of insect auditory afferents.
Microsc Res Tech 63, 338-350.
Masse, N. Y., Turner, G. C., and Jefferis, G. S. (2009). Olfactory information processing
in Drosophila. Curr Biol 19, R700-713.
30
Menzel, R. (1973). Spectral responses of moving detecting and "sustaining" fibres in the
optic lobe of the bee. J Comp Physiol A Neuroethol Sens Neural Behav Physiol 82, 135-
150.
Merigan, W. H., and Maunsell, J. H. (1993). How parallel are the primate visual
pathways? Annu Rev Neurosci 16, 369-402.
Merzenich, M. M., and Brugge, J. F. (1973). Representation of the cochlear partition of
the superior temporal plane of the macaque monkey. Brain Res 50, 275-296.
Michelsen, A. (1966). Pitch discrimination in the locust ear: observations on single sense
cells. J Insect Physiol 12, 1119-1131.
Michelsen, A. (1968). Frequency discrimination in the locust ear by means of four groups
of receptor cells. Nature 220, 585-586.
Moller, A. R. (2003). Sensory systems: anatomy and physiology: Academic Press).
Montell, C. (2009). A taste of the Drosophila gustatory receptors. Curr Opin Neurobiol
19, 345-353.
Moran, D. T., and Rowley, J. C., 3rd (1975). The fine structure of the cockroach
subgenual organ. Tissue Cell 7, 91-105.
Mori, K., Nagao, H., and Yoshihara, Y. (1999). The olfactory bulb: coding and
processing of odor molecule information. Science 286, 711-715.
Nassi, J. J., and Callaway, E. M. (2009). Parallel processing strategies of the primate
visual system. Nat Rev Neurosci 10, 360-372.
Norgren, R. (1983). The gustatory system in mammals. Am J Otolaryngol 4, 234-237.
Oertel, D. (1999). The role of timing in the brain stem auditory nuclei of vertebrates.
Annu Rev Physiol 61, 497-519.
Okamura, J. Y., and Strausfeld, N. J. (2007). Visual system of calliphorid flies: motion-
and orientation-sensitive visual interneurons supplying dorsal optic glomeruli. J Comp
Neurol 500, 189-208.
Oldfeld, B. (1982). Tonotopic organisation of auditory receptors in Tettigoniidae
Orthoptera Ensifera. J Comp Physiol A Neuroethol Sens Neural Behav Physiol 147, 461-
470.
Oldfeld, B. (1983). Central projections of primary auditory fibres in Tettigoniidae
Orthoptera Ensifera. J Comp Physiol A Neuroethol Sens Neural Behav Physiol 151, 389-
395.
31
Ollivier, F., Samuelson, D., Brooks, D., Lewis, P., Kallberg, M., and Komaromy, A.
(2004). Comparative morphology of the tapetum lucidum (among selected species).
Veterinary Ophthalmology 7 11-22.
Olveczky, B. P., Baccus, S. A., and Meister, M. (2003). Segregation of object and
background motion in the retina. Nature 423, 401-408.
Paolini, A. G., Clarey, J. C., Needham, K., and Clark, G. M. (2005). Balanced inhibition
and excitation underlies spike firing regularity in ventral cochlear nucleus chopper
neurons. Eur J Neurosci 21, 1236-1248.
Paolini, A. G., Cotterill, E. L., Bairaktaris, D., and Clark, G. M. (1998). Muscimol
suppression of the dorsal cochlear nucleus modifies frequency tuning in rats. Brain Res
785, 309-316.
Paulk, A. C., Dacks, A. M., Phillips-Portillo, J., Fellous, J. M., and Gronenberg, W.
(2009). Visual processing in the central bee brain. J Neurosci 29, 9987-9999.
Paulk, A. C., Phillips-Portillo, J., Dacks, A. M., Fellous, J. M., and Gronenberg, W.
(2008). The processing of color, motion, and stimulus timing are anatomically segregated
in the bumblebee brain. J Neurosci 28, 6319-6332.
Penfield, W., and Rasmussen, T. (1950). The cerebral cortex of man: a clinical study of
localization of function (New York: Macmillan).
Pierret, T., Lavallee, P., and Deschenes, M. (2000). Parallel streams for the relay of
vibrissal information through thalamic barreloids. J Neurosci 20, 7455-7462.
Ratliff, F. (1965). Mach Bands: quantitative studies on neural network in the retina (San
Francisco: Holden-Day).
Ratliff, F., Miller, W. H., and Hartline, H. K. (1959). Neural interaction in the eye and the
integration of receptor activity. Ann N Y Acad Sci 74, 210-222.
Rinberg, D., and Davidowitz, H. (2003). Wind spectra and the response of the cercal
system in the cockroach. J Comp Physiol A Neuroethol Sens Neural Behav Physiol 189,
867-876.
Romanski, L. M., Tian, B., Fritz, J., Mishkin, M., Goldman-Rakic, P. S., and
Rauschecker, J. P. (1999). Dual streams of auditory afferents target multiple domains in
the primate prefrontal cortex. Nat Neurosci 2, 1131-1136.
Romer, H. (1983). Tonotopic organization of the auditory neuropile in the bushcricket
Tettigonia viridissima. Nature 306, 60-62.
Romer, H. (1987). Representation of auditory distance within a central neuropil of the
bushcricket Mygalopsis marki. J Comp Physiol A Neuroethol Sens Neural Behav Physiol
161, 33-42.
32
Romer, H., and Seikowski, U. (1985). Responses to model songs of auditory neurons in
the thoracic ganglia and brain of the locust. J Comp Physiol A Neuroethol Sens Neural
Behav Physiol 156, 845-860.
Rusznak, Z., and Szucs, G. (2009). Spiral ganglion neurones: an overview of
morphology, firing behaviour, ionic channels and function. Pflugers Arch 457, 1303-
1325.
Schildberger, K., and Horner, M. (1988). The function of auditory neurons in cricket
phonotaxis. J Comp Physiol A Neuroethol Sens Neural Behav Physiol 163, 621-631.
Schul, J. (1998). Song recognition by temporal cues in a group of closely related
bushcricket species (genus Tettigonia). J Comp Physiol A Neuroethol Sens Neural Behav
Physiol 183, 401-410.
Shaw, S. (1994). Detection of Airborne Sound by a Cockroach "Vibration Detector": a
Possible Missing Link in Insect Auditory Evolution. J Exp Biol 193, 13-47.
Stabel, J., Wendler, G., and Scharstein, H. (1989). Cricket phonotaxis: localization
depends on recognition of the calling song pattern. J Comp Physiol A Neuroethol Sens
Neural Behav Physiol 165, 165-177.
Stolting, H., and Stumpner, A. (1998). Tonotopic organization of auditory receptors of
the bushcricket Pholidoptera griseoaptera (Tettigoniidae, decticinae). Cell Tissue Res
294, 377-386.
Stumpner, A. (1998). Picrotoxin eliminates frequency selectivity of an auditory
interneuron in a bushcricket. J Neurophysiol 79, 2408-2415.
Stumpner, A. (2002). A species-specific frequency filter through specific inhibition, not
specific excitation. J Comp Physiol A Neuroethol Sens Neural Behav Physiol 188, 239-
248.
Suga, N. (1995). Sharpening of frequency tuning by inhibition in the central auditory
system: tribute to Yasuji Katsuki. Neurosci Res 21, 287-299.
Sullivan, S. L., Ressler, K. J., and Buck, L. B. (1995). Spatial patterning and information
coding in the olfactory system. Curr Opin Genet Dev 5, 516-523.
Takahashi, T., Moiseff, A., and Konishi, M. (1984). Time and intensity cues are
processed independently in the auditory system of the owl. . J Neurosci 4, 1781-1786.
Tauber, E., and Eberl, D. F. (2003). Acoustic communication in Drosophila. Behav
Processes 64, 197-210.
Tian, B., Reser, D., Durham, A., Kustov, A., and Rauschecker, J. P. (2001). Functional
specialization in rhesus monkey auditory cortex. Science 292, 290-293.
33
Torre, V., Ashmore, J. F., Lamb, T. D., and Menini, A. (1995). Transduction and
adaptation in sensory receptor cells. J Neurosci 15, 7757-7768.
Ts'o, D. Y., and Gilbert, C. D. (1988). The organization of chromatic and spatial
interactions in the primate striate cortex. J Neurosci 8, 1712-1727.
Ungerleider, L. G., and Haxby, J. V. (1994). "What" and "where" in the human brain.
Curr Opin Neurobiol 4, 157-165.
Vallbo, A. B., and Johansson, R. S. (1978). The tactile sensory innervation of the
glabrous skin of the human hand, In Active touch, G. Gordon, ed. (New York:
Pergamon), pp. 29-54.
Vallbo, A. B., and Johansson, R. S. (1984). Properties of cutaneous mechanoreceptors in
the human hand related to touch sensation. Hum Neurobiol 3, 3-14.
Viete, S., Pena, J. L., and Konishi, M. (1997). Effects of interaural intensity difference on
the processing of interaural time difference in the owl's nucleus laminaris. J Neurosci 17,
1815-1824.
von Bekesy, G. (1960). Neural inhibitory units of the eye and skin: quantitative
description of contrast phenomena. J Opt Soc Am 50, 1060-1070.
von Bekesy, G. (1967a). Mach band type lateral inhibition in different sense organs. J
Gen Physiol 50, 519-532.
von Bekesy, G. (1967b). Sensory inhibition (Princeton, NJ: Princeton University Press).
von Helversen, D., and von Helversen, O. (1995). Acoustic pattern recognition and
orientation in orthopteran insects: parallel or serial processing? J Comp Physiol A
Neuroethol Sens Neural Behav Physiol 177, 767-774.
von Helversen, D., and von Helversen, O. (1997). Recognition of sex in the acoustic
communication of the grasshopper Chorthippus biguttulus (Orthoptera, Acrididae). J
Comp Physiol A Neuroethol Sens Neural Behav Physiol 4, 373-386.
Wassle, H. (2004). Parallel processing in the mammalian retina. Nat Rev Neurosci 5,
747-757.
Weinstein, S. (1968). The skin senses, Paper presented at: International Symposium on
Skin Senses (IL: Thomas: Springfield).
Yack, J. E. (2004). The structure and function of auditory chordotonal organs in insects.
Microsc Res Tech 63, 315-337.
Yager, D. D. (1999). Structure, development, and evolution of insect auditory systems.
Microsc Res Tech 47, 380-400.

34
Yang, E. C., Lin, H. C., and Hung, Y. S. (2004). Patterns of chromatic information
processing in the lobula of the honeybee, Apis mellifera L. J Insect Physiol 50, 913-925.
Yu, C., Derdikman, D., Haidarliu, S., and Ahissar, E. (2006). Parallel thalamic pathways
for whisking and touch signals in the rat. PLoS Biol 4, e124.
35
Chapter 2
Distinct populations of Johnston’s organ neurons detect wind and near-field sound
in the Drosophila brain
Suzuko Yorozu, Allan Wong, Brian J. Fischer, Heiko Dankert, Maurice J. Kernan,
Azusa Kamikouchi, Kei Ito, and David J. Anderson.
36
ABSTRACT
Behavioral responses to wind are thought to play a critical role in controlling the
dispersal and population genetics of wild Drosophila species (Johnston and Heed, 1976;
Johnston and Templeton, 1982), as well as their navigation in flight (Budick et al., 2007),
but their underlying neurobiological basis is unknown. I show that Drosophila
melanogaster, like wild-caught Drosophila strains (Richardson and Johnston, 1975),
exhibits robust wind-induced suppression of locomotion (WISL), in response to air
currents delivered at speeds normally encountered in nature (Johnston and Heed, 1976;
Johnston and Templeton, 1982). Furthermore, I identify wind-sensitive neurons in the
Johnston’s organ (JO), an antennal mechanosensory structure previously implicated in
near-field sound detection (Caldwell and Eberl, 2002; Kernan, 2007). Using Gal4 lines
targeted to different subsets of JO neurons (Kamikouchi et al., 2006), and a genetically
encoded calcium indicator, I show that wind and near-field sound (courtship song)
activate distinct JO populations, which project to different regions of the antennal and
mechanosensory motor center (AMMC) in the central brain. Selective genetic ablation of
wind-sensitive JO neurons in the antenna abolishes WISL behavior, without impairing
hearing. Different neuronal subsets within the wind-sensitive population, moreover,
respond to different directions of arista deflection caused by airflow and project to
different regions of the AMMC, providing a rudimentary map of wind direction in the
brain. Importantly, sound- and wind-sensitive JO neurons exhibit different intrinsic
response properties: the former are phasically activated by small, bidirectional,
displacements of the aristae, while the latter are tonically activated by unidirectional,
static deflections of larger magnitude. These different intrinsic properties are well suited

37
to the detection of oscillatory pulses of near-field sound and laminar airflow,
respectively. These data identify wind-sensitive neurons in the JO, a structure that has
been primarily associated with hearing, and reveal how the brain can distinguish different
types of air particle movements, using a common sensory organ.
38
Introduction
Gene flow is a fundamental determinant of genetic diversification in sexual
organisms. Levels of gene flow between populations influence the degree to which
closely related interbreeding organisms will either share a common evolutionary
trajectory, or will diverge over time through genetic drift and natural selection (Slatkin,
1985; Slatkin, 1987; Wright, 1943). There are a number of factors that affect the rate of
gene flow between populations. Evolutional biologists argue that dispersal ability is a
highly significant predictor of gene flow and play an important role in speciation (Smith
and Farrell, 2006).
Johnston and his colleagues have studied wind-induced behavioral responses of
various wild Hawaiian Drosophila species and show that many Drosophila species
exhibit suppression of locomotor activities at high-speed wind within their natural habitat
(Johnston and Heed, 1976; Johnston and Templeton, 1982). For example, D.
mercatorum, D. hydei, and D. minica inhabit environments where trade winds blow in the
range of 5–25 km/hr (1.4–6.9 m/s). Wild-caught D. mercatorum and D. hydei exhibit
locomotor arrest at wind speeds of >10 km/hr (2.8 m/s), while wild-caught D. minica
exhibited locomotor arrest at air speeds between 6 and 7 km/hr (1.67–1.94 m/s).
Johnston and colleagues therefore, argue that wind induced suppression of locomotion
may be the dominant environmental influence affecting dispersal of wild Drosophila
populations and thereby an important determinant of their “genoclines,” geographic
gradients in gene frequencies.
39
While many Drosophila species exhibit wind-induced suppression of locomotion
during high-speed wind, they also exhibit anemotaxis, orientation towards or away from
the wind source, during low-speed wind. It is believed that the anemotaxis behavior is
important for many insect species to locate and identify a wide variety of resources
important for survival, such as food, potential mates, and predators (Willis and Avondet,
2005; Willis et al., 2008). Successful resource localization requires their ability to detect
odor and direction of wind bearing that odor. They use the wind direction as the primary
directional cue that enables them to steer their movements toward or away from the odor
source (Willis and Avondet, 2005; Willis et al., 2008).
Therefore, the ability to detect wind and wind-induced behavior, such as
anemotaxis and wind-induced suppression of locomotion, have important consequences
for flies’ survival and implication in shaping their population genetics; however, the
underlying neurobiological bases of wind detection in Drosophila is unknown. In this
project, I investigated which sensory organ is implicated in wind detection, and how wind
information is represented in the brain.
RESULTS
Drosophila exhibit wind-induced suppression of locomotion
When Drosophila is exposed to a constant flow of gentle air current (0.7–1.6
m/s), it exhibits a rapid and reversible suppression of walking activity (Fig. 1a–b;
Supplementary Movie 1). We call this behavior wind-induced suppression of locomotion
(WISL). The WISL behavior is also exhibited by wild-caught Hawaiian Drosophila
species, at wind speeds (1.7 m/s–2.8 m/s) within the range measured in their natural
40
habitats (Johnston and Heed, 1976; Johnston and Templeton, 1982; Richardson and
Johnston, 1975) (J. S. Johnston, personal communication; Supplementary Footnote S1).
To test whether the WISL is a stable and repeatable general phenotype, we tested WISL
in various conditions including different times of day, genders, lighting, and arousal
level. To test the effect of arousal level, we introduced mechanical startle prior to the
introduction of airflow (Fig. 1b–d). None of these variables affected the WISL behavior,
suggesting that WISL is a stable and repeatable general phenotype.
Drosophila detect wind using the Johnston’s organ
Recent antennal-gluing experiments have implicated the antennae, and by
extension the JO, in wind-sensation in Drosophila (Bennet-Clark, 1971; Budick et al.,
2007). Surgical removal of the third antennal segment (a3), or gluing of a3 to the second
antennal segment (a2) causes a functional impairment of the JO (Manning, 1967), since
both a2 and a3 segments (including the aristae) form a functional unit of the JO.
Interestingly, both of these surgical manipulations eliminated WISL (Fig. 1c–d).
Furthermore, genetic ablation of JO neurons using nanchung-Gal4 (Kim et al., 2003) and
UAS-hid, a Drosophila pro-apoptotic gene (Wang et al., 1999), also eliminated WISL
(Fig. 2a–c). A similar result was also obtained from a “deaf” mutant called nanchung.
The nanchung mutant has a loss-of-mutation in the nanchung gene encoding the TRPV
channel normally expressed in JO neurons. The nanchung mutants show no
electrophysiological responses to courtship song (Kim et al., 2003), thus they are defined
as deaf, and they also fail to exhibit WISL (data not shown). Therefore, these results
seem to suggest that the JO is implicated in both sound and wind detection.
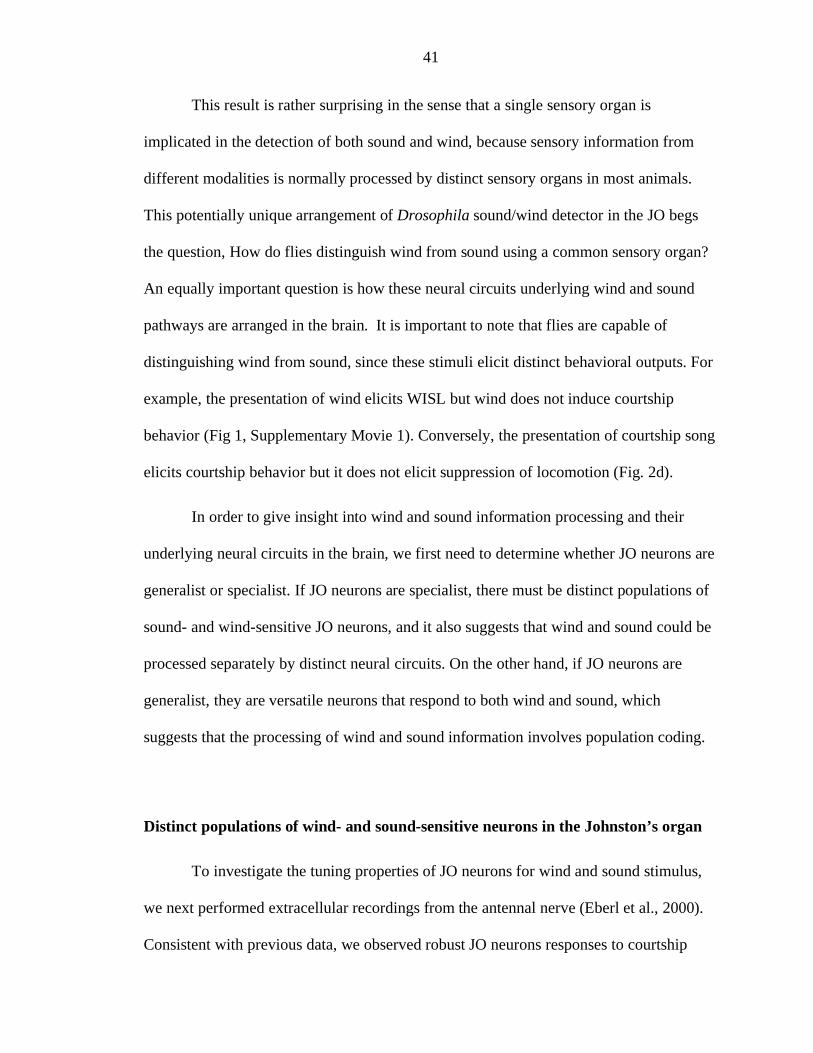
41
This result is rather surprising in the sense that a single sensory organ is
implicated in the detection of both sound and wind, because sensory information from
different modalities is normally processed by distinct sensory organs in most animals.
This potentially unique arrangement of Drosophila sound/wind detector in the JO begs
the question, How do flies distinguish wind from sound using a common sensory organ?
An equally important question is how these neural circuits underlying wind and sound
pathways are arranged in the brain. It is important to note that flies are capable of
distinguishing wind from sound, since these stimuli elicit distinct behavioral outputs. For
example, the presentation of wind elicits WISL but wind does not induce courtship
behavior (Fig 1, Supplementary Movie 1). Conversely, the presentation of courtship song
elicits courtship behavior but it does not elicit suppression of locomotion (Fig. 2d).
In order to give insight into wind and sound information processing and their
underlying neural circuits in the brain, we first need to determine whether JO neurons are
generalist or specialist. If JO neurons are specialist, there must be distinct populations of
sound- and wind-sensitive JO neurons, and it also suggests that wind and sound could be
processed separately by distinct neural circuits. On the other hand, if JO neurons are
generalist, they are versatile neurons that respond to both wind and sound, which
suggests that the processing of wind and sound information involves population coding.
Distinct populations of wind- and sound-sensitive neurons in the Johnston’s organ
To investigate the tuning properties of JO neurons for wind and sound stimulus,
we next performed extracellular recordings from the antennal nerve (Eberl et al., 2000).
Consistent with previous data, we observed robust JO neurons responses to courtship
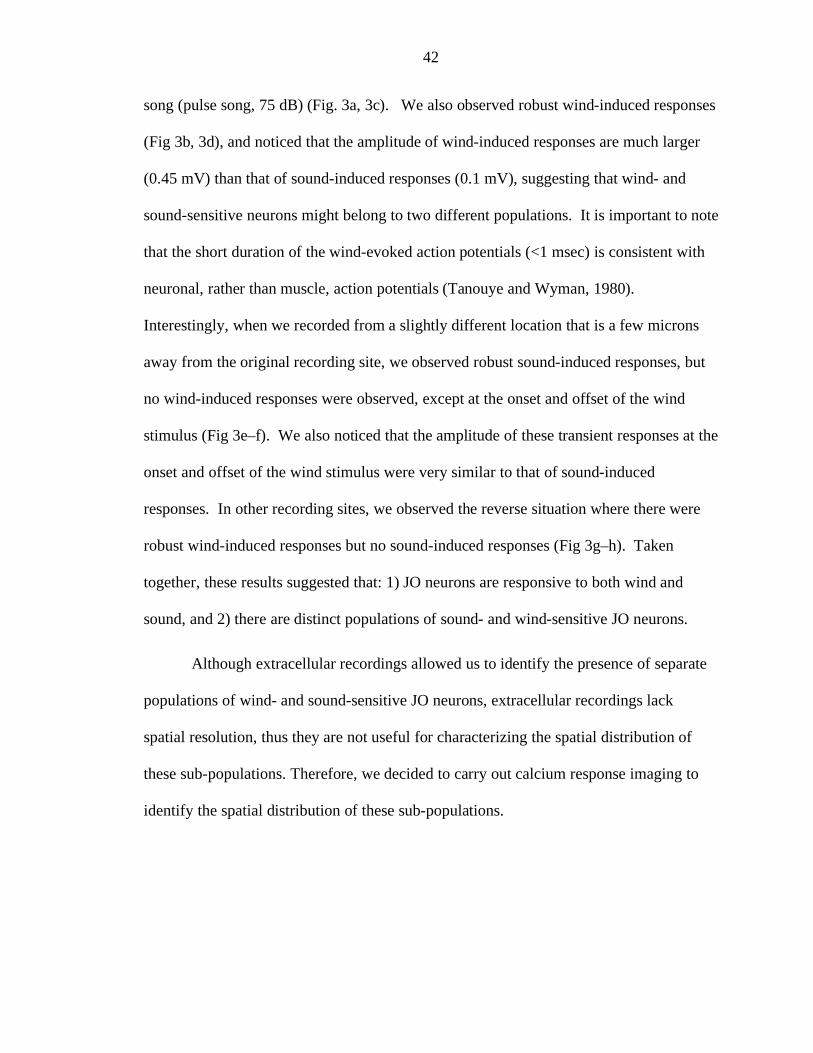
42
song (pulse song, 75 dB) (Fig. 3a, 3c). We also observed robust wind-induced responses
(Fig 3b, 3d), and noticed that the amplitude of wind-induced responses are much larger
(0.45 mV) than that of sound-induced responses (0.1 mV), suggesting that wind- and
sound-sensitive neurons might belong to two different populations. It is important to note
that the short duration of the wind-evoked action potentials (<1 msec) is consistent with
neuronal, rather than muscle, action potentials (Tanouye and Wyman, 1980).
Interestingly, when we recorded from a slightly different location that is a few microns
away from the original recording site, we observed robust sound-induced responses, but
no wind-induced responses were observed, except at the onset and offset of the wind
stimulus (Fig 3e–f). We also noticed that the amplitude of these transient responses at the
onset and offset of the wind stimulus were very similar to that of sound-induced
responses. In other recording sites, we observed the reverse situation where there were
robust wind-induced responses but no sound-induced responses (Fig 3g–h). Taken
together, these results suggested that: 1) JO neurons are responsive to both wind and
sound, and 2) there are distinct populations of sound- and wind-sensitive JO neurons.
Although extracellular recordings allowed us to identify the presence of separate
populations of wind- and sound-sensitive JO neurons, extracellular recordings lack
spatial resolution, thus they are not useful for characterizing the spatial distribution of
these sub-populations. Therefore, we decided to carry out calcium response imaging to
identify the spatial distribution of these sub-populations.
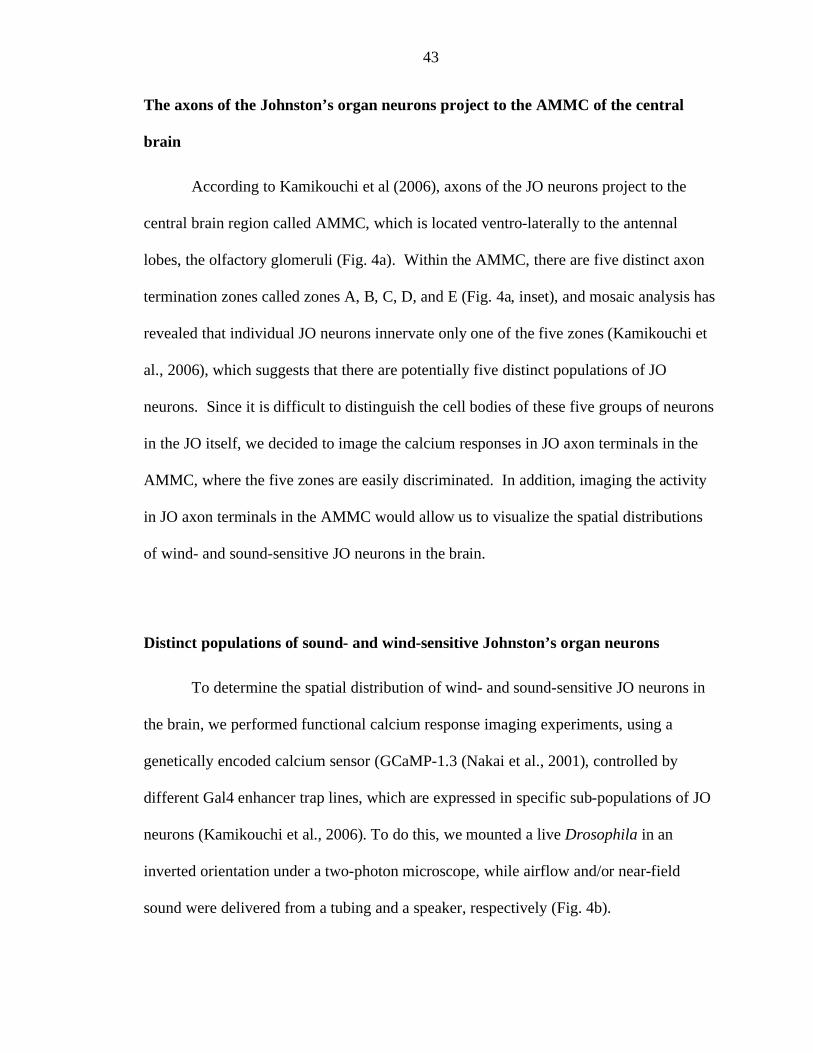
43
The axons of the Johnston’s organ neurons project to the AMMC of the central
brain
According to Kamikouchi et al (2006), axons of the JO neurons project to the
central brain region called AMMC, which is located ventro-laterally to the antennal
lobes, the olfactory glomeruli (Fig. 4a). Within the AMMC, there are five distinct axon
termination zones called zones A, B, C, D, and E (Fig. 4a, inset), and mosaic analysis has
revealed that individual JO neurons innervate only one of the five zones (Kamikouchi et
al., 2006), which suggests that there are potentially five distinct populations of JO
neurons. Since it is difficult to distinguish the cell bodies of these five groups of neurons
in the JO itself, we decided to image the calcium responses in JO axon terminals in the
AMMC, where the five zones are easily discriminated. In addition, imaging the activity
in JO axon terminals in the AMMC would allow us to visualize the spatial distributions
of wind- and sound-sensitive JO neurons in the brain.
Distinct populations of sound- and wind-sensitive Johnston’s organ neurons
To determine the spatial distribution of wind- and sound-sensitive JO neurons in
the brain, we performed functional calcium response imaging experiments, using a
genetically encoded calcium sensor (GCaMP-1.3 (Nakai et al., 2001), controlled by
different Gal4 enhancer trap lines, which are expressed in specific sub-populations of JO
neurons (Kamikouchi et al., 2006). To do this, we mounted a live Drosophila in an
inverted orientation under a two-photon microscope, while airflow and/or near-field
sound were delivered from a tubing and a speaker, respectively (Fig. 4b).
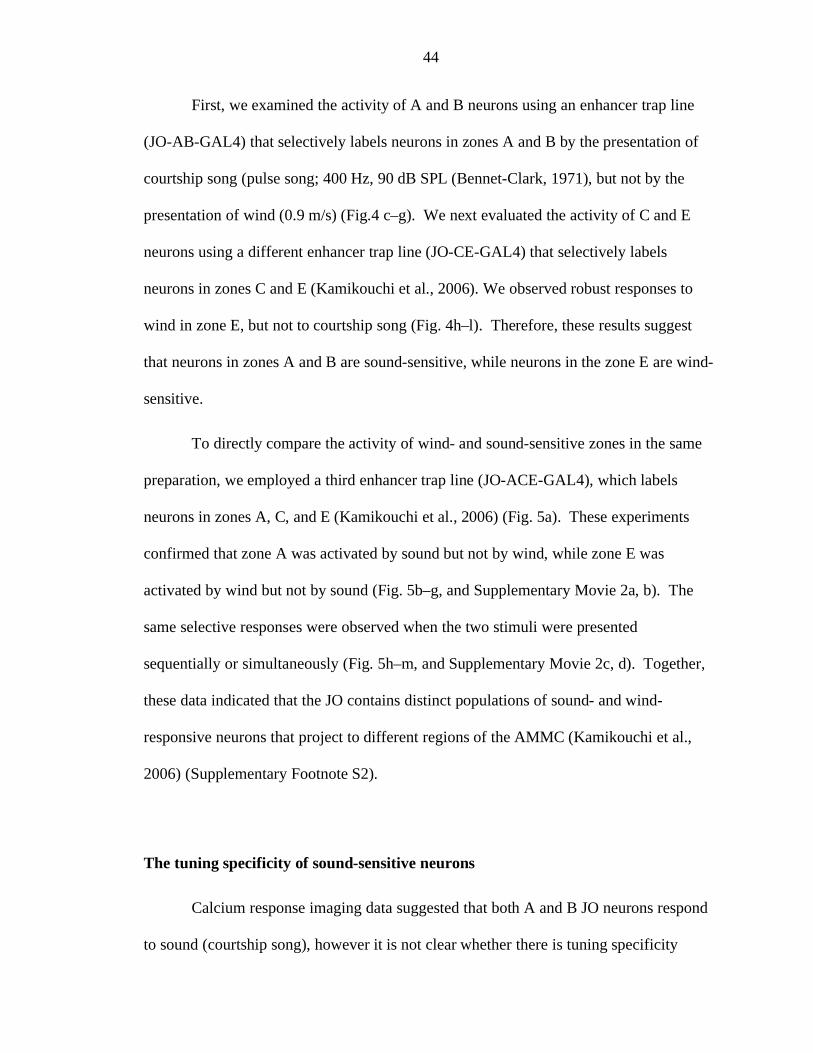
44
First, we examined the activity of A and B neurons using an enhancer trap line
(JO-AB-GAL4) that selectively labels neurons in zones A and B by the presentation of
courtship song (pulse song; 400 Hz, 90 dB SPL (Bennet-Clark, 1971), but not by the
presentation of wind (0.9 m/s) (Fig.4 c–g). We next evaluated the activity of C and E
neurons using a different enhancer trap line (JO-CE-GAL4) that selectively labels
neurons in zones C and E (Kamikouchi et al., 2006). We observed robust responses to
wind in zone E, but not to courtship song (Fig. 4h–l). Therefore, these results suggest
that neurons in zones A and B are sound-sensitive, while neurons in the zone E are wind-
sensitive.
To directly compare the activity of wind- and sound-sensitive zones in the same
preparation, we employed a third enhancer trap line (JO-ACE-GAL4), which labels
neurons in zones A, C, and E (Kamikouchi et al., 2006) (Fig. 5a). These experiments
confirmed that zone A was activated by sound but not by wind, while zone E was
activated by wind but not by sound (Fig. 5b–g, and Supplementary Movie 2a, b). The
same selective responses were observed when the two stimuli were presented
sequentially or simultaneously (Fig. 5h–m, and Supplementary Movie 2c, d). Together,
these data indicated that the JO contains distinct populations of sound- and wind-
responsive neurons that project to different regions of the AMMC (Kamikouchi et al.,
2006) (Supplementary Footnote S2).
The tuning specificity of sound-sensitive neurons
Calcium response imaging data suggested that both A and B JO neurons respond
to sound (courtship song), however it is not clear whether there is tuning specificity
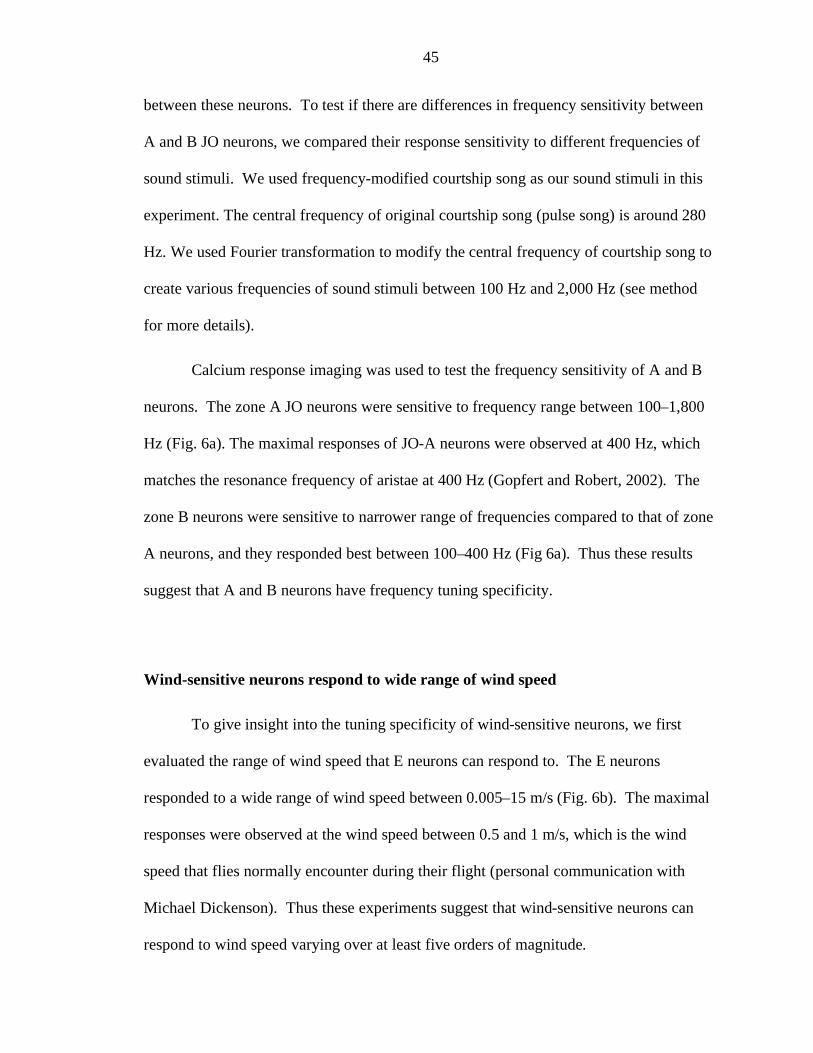
45
between these neurons. To test if there are differences in frequency sensitivity between
A and B JO neurons, we compared their response sensitivity to different frequencies of
sound stimuli. We used frequency-modified courtship song as our sound stimuli in this
experiment. The central frequency of original courtship song (pulse song) is around 280
Hz. We used Fourier transformation to modify the central frequency of courtship song to
create various frequencies of sound stimuli between 100 Hz and 2,000 Hz (see method
for more details).
Calcium response imaging was used to test the frequency sensitivity of A and B
neurons. The zone A JO neurons were sensitive to frequency range between 100–1,800
Hz (Fig. 6a). The maximal responses of JO-A neurons were observed at 400 Hz, which
matches the resonance frequency of aristae at 400 Hz (Gopfert and Robert, 2002). The
zone B neurons were sensitive to narrower range of frequencies compared to that of zone
A neurons, and they responded best between 100–400 Hz (Fig 6a). Thus these results
suggest that A and B neurons have frequency tuning specificity.
Wind-sensitive neurons respond to wide range of wind speed
To give insight into the tuning specificity of wind-sensitive neurons, we first
evaluated the range of wind speed that E neurons can respond to. The E neurons
responded to a wide range of wind speed between 0.005–15 m/s (Fig. 6b). The maximal
responses were observed at the wind speed between 0.5 and 1 m/s, which is the wind
speed that flies normally encounter during their flight (personal communication with
Michael Dickenson). Thus these experiments suggest that wind-sensitive neurons can
respond to wind speed varying over at least five orders of magnitude.
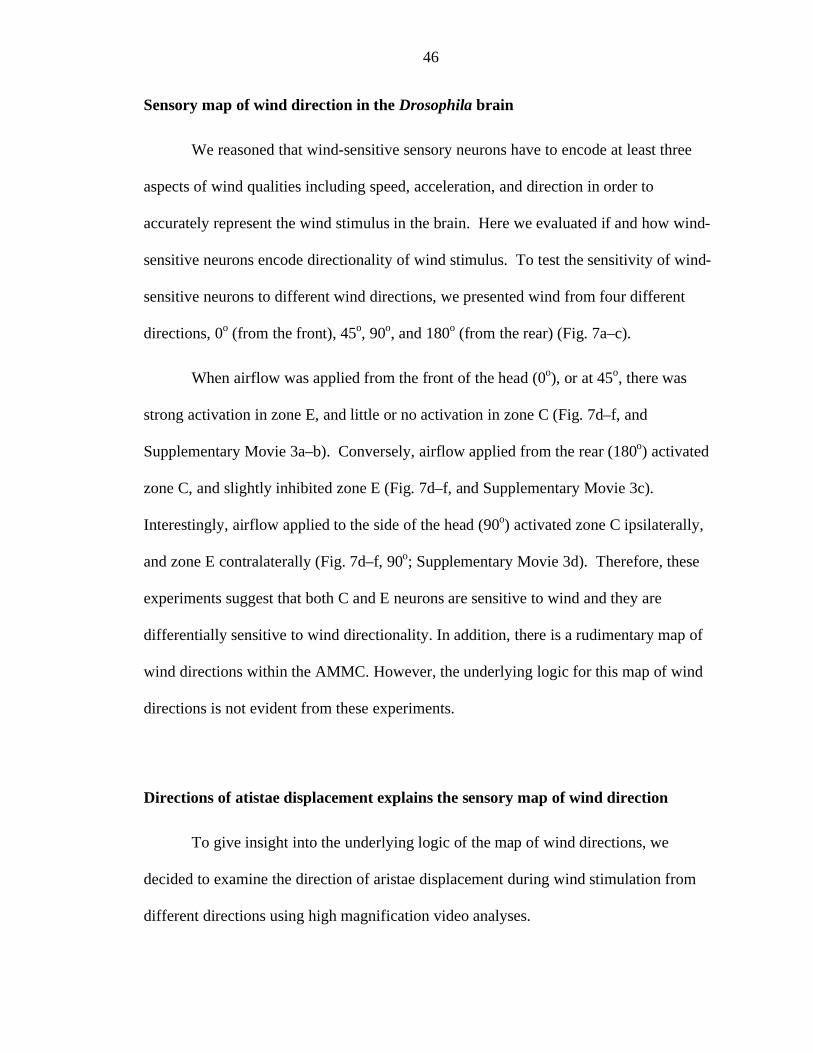
46
Sensory map of wind direction in the Drosophila brain
We reasoned that wind-sensitive sensory neurons have to encode at least three
aspects of wind qualities including speed, acceleration, and direction in order to
accurately represent the wind stimulus in the brain. Here we evaluated if and how wind-
sensitive neurons encode directionality of wind stimulus. To test the sensitivity of wind-
sensitive neurons to different wind directions, we presented wind from four different
directions, 0o (from the front), 45
o, 90
o, and 180
o (from the rear) (Fig. 7a–c).
When airflow was applied from the front of the head (0o), or at 45
o, there was
strong activation in zone E, and little or no activation in zone C (Fig. 7d–f, and
Supplementary Movie 3a–b). Conversely, airflow applied from the rear (180o) activated
zone C, and slightly inhibited zone E (Fig. 7d–f, and Supplementary Movie 3c).
Interestingly, airflow applied to the side of the head (90o) activated zone C ipsilaterally,
and zone E contralaterally (Fig. 7d–f, 90o; Supplementary Movie 3d). Therefore, these
experiments suggest that both C and E neurons are sensitive to wind and they are
differentially sensitive to wind directionality. In addition, there is a rudimentary map of
wind directions within the AMMC. However, the underlying logic for this map of wind
directions is not evident from these experiments.
Directions of atistae displacement explains the sensory map of wind direction
To give insight into the underlying logic of the map of wind directions, we
decided to examine the direction of aristae displacement during wind stimulation from
different directions using high magnification video analyses.
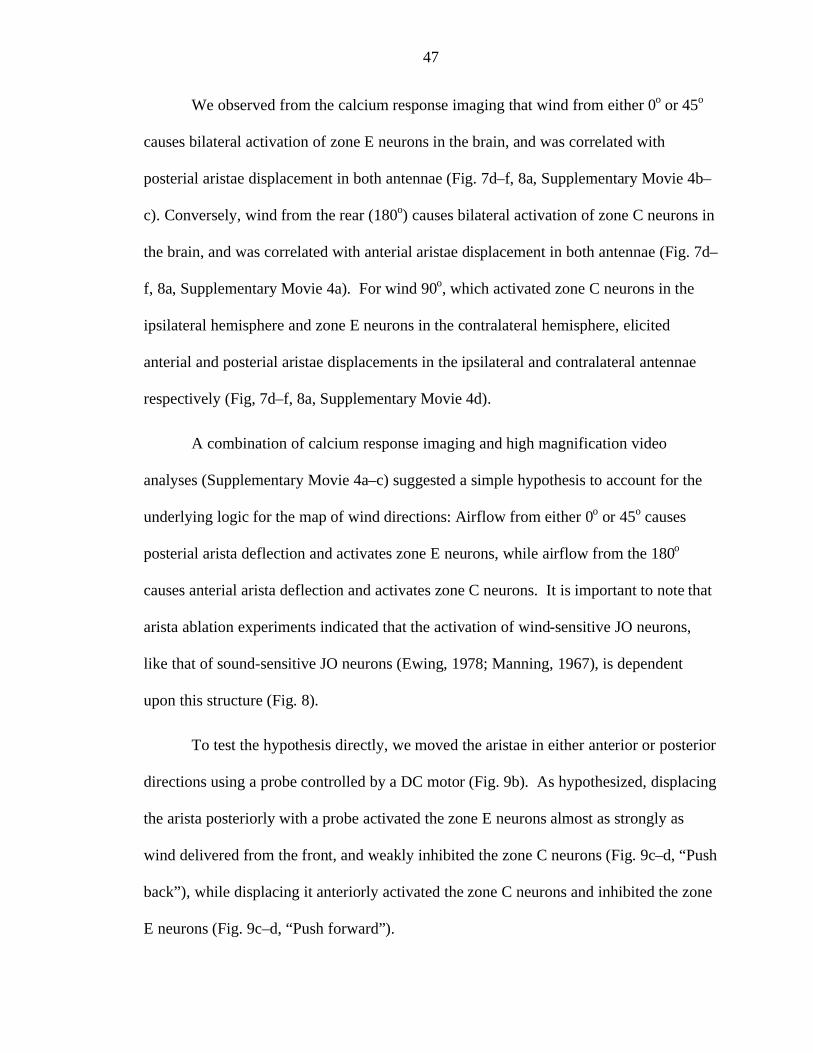
47
We observed from the calcium response imaging that wind from either 0o or 45
o
causes bilateral activation of zone E neurons in the brain, and was correlated with
posterial aristae displacement in both antennae (Fig. 7d–f, 8a, Supplementary Movie 4b–
c). Conversely, wind from the rear (180o) causes bilateral activation of zone C neurons in
the brain, and was correlated with anterial aristae displacement in both antennae (Fig. 7d–
f, 8a, Supplementary Movie 4a). For wind 90o, which activated zone C neurons in the
ipsilateral hemisphere and zone E neurons in the contralateral hemisphere, elicited
anterial and posterial aristae displacements in the ipsilateral and contralateral antennae
respectively (Fig, 7d–f, 8a, Supplementary Movie 4d).
A combination of calcium response imaging and high magnification video
analyses (Supplementary Movie 4a–c) suggested a simple hypothesis to account for the
underlying logic for the map of wind directions: Airflow from either 0o or 45
o causes
posterial arista deflection and activates zone E neurons, while airflow from the 180o
causes anterial arista deflection and activates zone C neurons. It is important to note that
arista ablation experiments indicated that the activation of wind-sensitive JO neurons,
like that of sound-sensitive JO neurons (Ewing, 1978; Manning, 1967), is dependent
upon this structure (Fig. 8).
To test the hypothesis directly, we moved the aristae in either anterior or posterior
directions using a probe controlled by a DC motor (Fig. 9b). As hypothesized, displacing
the arista posteriorly with a probe activated the zone E neurons almost as strongly as
wind delivered from the front, and weakly inhibited the zone C neurons (Fig. 9c–d, “Push
back”), while displacing it anteriorly activated the zone C neurons and inhibited the zone
E neurons (Fig. 9c–d, “Push forward”).
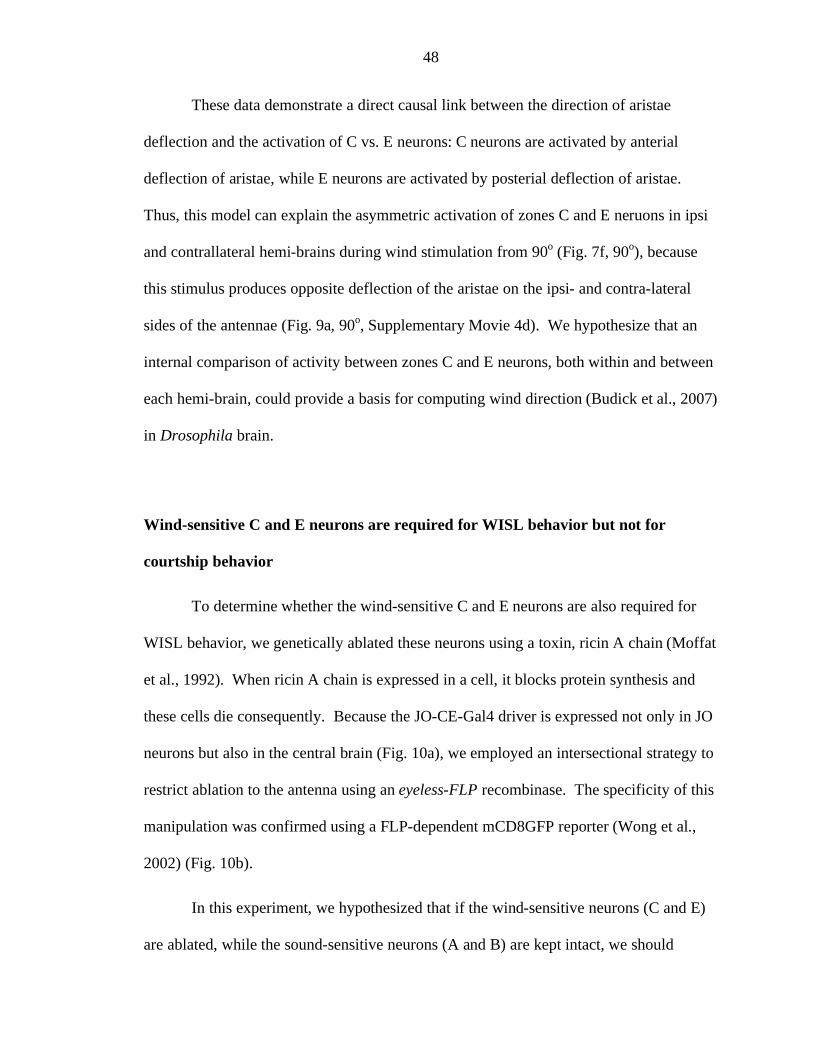
48
These data demonstrate a direct causal link between the direction of aristae
deflection and the activation of C vs. E neurons: C neurons are activated by anterial
deflection of aristae, while E neurons are activated by posterial deflection of aristae.
Thus, this model can explain the asymmetric activation of zones C and E neruons in ipsi
and contrallateral hemi-brains during wind stimulation from 90o (Fig. 7f, 90
o), because
this stimulus produces opposite deflection of the aristae on the ipsi- and contra-lateral
sides of the antennae (Fig. 9a, 90o, Supplementary Movie 4d). We hypothesize that an
internal comparison of activity between zones C and E neurons, both within and between
each hemi-brain, could provide a basis for computing wind direction (Budick et al., 2007)
in Drosophila brain.
Wind-sensitive C and E neurons are required for WISL behavior but not for
courtship behavior
To determine whether the wind-sensitive C and E neurons are also required for
WISL behavior, we genetically ablated these neurons using a toxin, ricin A chain (Moffat
et al., 1992). When ricin A chain is expressed in a cell, it blocks protein synthesis and
these cells die consequently. Because the JO-CE-Gal4 driver is expressed not only in JO
neurons but also in the central brain (Fig. 10a), we employed an intersectional strategy to
restrict ablation to the antenna using an eyeless-FLP recombinase. The specificity of this
manipulation was confirmed using a FLP-dependent mCD8GFP reporter (Wong et al.,
2002) (Fig. 10b).
In this experiment, we hypothesized that if the wind-sensitive neurons (C and E)
are ablated, while the sound-sensitive neurons (A and B) are kept intact, we should
49
expect to see a loss of WISL behavior but intact sound-induced behavior (courtship
behavior). To test the sound-induced behavior, we measured the time it takes for a
female (without JO-C and -E neurons) to copulate with a wild-type male who can sing a
wild-type courtship song. The latency to copulation is a good measure of hearing ability
because the time it takes for a female to copulate is greatly influenced by her ability to
hear the courtship song.
Following ablation of C and E neurons, WISL behavior was eliminated (Fig.
10g), while basal locomotor activity (prior to wind exposure) and phototaxis behavior
were unaffected (Fig. 10g,10i, and 11a). This result supports the calcium imaging data
showing that JO neurons in zones C and E are necessary for wind detection. Importantly,
female flies lacking JO-C and -E neurons had normal hearing, as evidenced by their
unperturbed receptivity to courtship by wild-type males, a behavior that depends on the
females’ ability to hear male courtship song. In contrast, females lacking nanchung, a
gene required for hearing (Kim et al., 2003) or whose aristae were glued to the head to
block the firing of JO neurons (Manning, 1967), exhibited a greatly increased latency to
copulation (Fig. 10h, Nan/Nan; Bi-Gl).
These data indicate that JO-CE neurons are necessary for WISL behavior, but
dispensable for a hearing-dependent behavior. Thus, clearly supports the calcium
response imaging data showing that JO-C and -E neurons (but not JO-A and -B neurons)
are implicated in wind detection.
50
Distinct intrinsic response properties for wind- and sound-sensitive neurons
So far, we demonstrated that A and B neurons are sensitive to sound, while C and
E neurons are sensitive to wind based on calcium response imaging and behavioral
analyses. However, it is not clear what stimulus features are responsible for the selective
activation of sound- vs. wind-sensitive neurons in the JO. We first asked whether these
two classes of mechanoreceptors are sensitive to different stimulus amplitudes, i.e., air
particle velocities (vair). A pressure gradient microphone positioned at the antenna
(Göpfert and Robert, 2002) yielded a vair = 0.011 m/s for the 400 Hz sound stimulus
played at 90 dB, which maximally activated JO-AB neurons (Fig. 6a). Yet this sound
stimulus did not activate zone E neurons (Fig. 4g), even though these neurons are
activated by airflow at a vair as low as 0.005 m/s (Fig. 6b). Thus, the selectivity of JO-CE
and -AB neurons for wind vs. sound is not simply due to differences in stimulus
magnitude.
To understand the selective nature of these wind- and sound-responsive JO
neurons, we investigated the intrinsic response properties of these distinct classes of
neurons. To this end, we compared the threshold and response characteristics of sound-
and wind-sensitive JO neurons in response to various magnitudes and patterns of aristae
displacement controlled by a probe connected to a DC motor (Fig 12a–b). Sound-
sensitive neurons in zone A (Fig. 12c, red traces), were activated by displacements as
small as 0.01 mm (Fig. 12c, red hatched bars), while wind-sensitive neurons in zone E
(Fig. 12e, green traces) were only weakly activated at displacements below 0.04 mm
(Fig. 12c, green bars). Thus, zone A neurons have a lower activation threshold than zone
E neurons (see also Fig. 12g, 12j).
51
Strikingly, we observed that zone E neurons remained active for as long as the
aristae were displaced, while zone A neurons were only transiently activated at the onset
and offset of the probe displacement (Fig. 12h, k). This suggested that zone E neurons
might adapt slowly, and therefore respond tonically, while zone A neurons might adapt
rapidly, and therefore respond phasically. To confirm this, we moved the aristae in three
successive steps of 0.033 mm each (total displacement of 0.099 mm; Fig. 12i). Zone A
neurons exhibited transient (phasic) responses after each displacement (Fig. 12l, red
traces), while zone E neurons were tonically activated for the entire duration of three-step
displacements, and were maximally activated after the second step (Fig. 12l, green
traces).
These data indicate that sound-sensitive (A) and wind-sensitive (E) neurons
respond phasically and tonically to arista displacement, with low vs. high activation
thresholds, respectively (see Supplementary Footnote S3). Furthermore, zone A neurons
were activated by bidirectional arista displacement, while zone E neurons were activated
by only unidirectional arista diaplacement (Fig. 12h, k). It is important to note that the
reason why wind-sensitive neurons respond only unidirectional arista deflection is
because these C and E neurons are direction sensitive (as discussed above).
These different intrinsic response properties are well matched to the oscillatory
arista movements caused by pulses of near-field sound vs. unidirectional arista
deflections caused by wind. The fly’s ability to discriminate wind vs. sound using a
common sensory organ is thus explained by different populations of JO neurons with
different intrinsic response properties, which project to distinct area of the AMMC in the
brain.
52
Tonic vs. phasic response properties are conserved properties of mechanoreceptors
The identification of different sub-populations of JO neurons with tonic vs. phasic
response properties illustrates a general and conserved feature of mechanosensation
across evolution. In the superficial layer of mammalian skin, there are two types of
mechanoreceptors that are used to encode for different aspects of light touch sensations.
Slowly adapting, tonically activated Merkel cells are used to encode for the shape of an
object causing the skin indentation, while rapidly adapting, phasically activated
Meissner’s corpuscles are used to encode for the movement of an object causing the skin
indentation (Johnson and Hsiao, 1992). In the Drosophila, these two properties have been
adapted to detect different types of bulk air particle movements by different subsets of JO
neurons. In addition, Dickinson and Palka (1987) have also reported that Drosophila has
slowly and rapidly adapting campaniform sensillae on their wings. It is hypothesized that
the rapidly adapting campaniform sensillae are involved in the sensory feedback during
flight while the slowly adapting campaniform sensillae are involved in the glooming
behavior. Interestingly, slowly adapting Merkel cells have a higher activation threshold
compared to rapidly adapting Meissner’s corpuscles (Csillag, 2005; Muniak et al., 2007),
which also resembles the slowly adapting, wind-sensitive JO neurons with a higher
activation threshold compared to rapidly adapting sound-sensitive JO neurons. Since
sensory information from different modalities is normally processed by separate sensory
organs in most animals, it seems unusual for Drosophila to use a single sensory organ to
mediate both wind and sound detection. It is possible that since sound frequency of
Drosophila courtship song, the only known sound stimulus for Drosophila, is very low
53
(~280 Hz), it is not surprising that Drosophila’s JO has evolved to respond to both wind
and low-frequency sound stimuli.
Conclusions
The data presented here indicate that the JO is not simply a hearing organ
(Kernan, 2007), but also mediates wind detection. A combination of electrophysiological
recordings, calcium response imaging, and behavioral analyses of JO neurons reveal that
there are distinct populations of sound- and wind-sensitive JO neurons. The stimulus
selectivity of these distinct classes of JO neurons is due to different intrinsic response
properties (i.e. activation threshold, adaptation rate, and the ability to respond to
unidirectional vs. bidirectional aristae displacements), which serves as the bases for flies’
ability to discriminate between wind and sound stimuli.
We have also identified the sensory map of wind direction within the AMMC of
the brain. The underlying logic for the map of wind direction can be explained by the
ability of C and E JO neurons to respond to arista displacements in a direction-sensitive
manner. We hypothesize that this map of wind direction probably involves an internal
comparison of activity patterns between zones C and E, both within and between each
hemi-brain, which potentially provides a basis for computing wind direction in the
Drosophila brain. It is also possible that a fly brain might use the activation timing
differences between the right and left hemi-brains to compute the subtle variation of wind
directions. For example, both 0o and 45
o wind activate zone E JO neurons in both hemi-
brains. However, flies could potentially use the interaural timing differences between the
right and left hemi-brains to determine the differences between 0o and 30
o wind
54
directions. This type of sensory map that involves the comparison of activity between the
hemi-brains has been well characterized for the map of sound localization involving
interaural time differences and interaural intensity differences described in the owl brain
(Carr and Konishi, 1988; Knudsen and Konishi, 1978; Takahashi, 1989). Sensory maps
are very old in evolutionary history as they are ubiquitous in many organisms in most
sensory systems, because they seem to serve some functional advantages for neural
computations. The functional significance of the map of wind directions in Drosophila
remains to be investigated.
In the accompanying paper, Kamikouchi et al. (2009) show that zone C and E
neurons are required for the behavioral response to gravity (negative geotaxis), a force
that could also produce static deflection of arista, albeit of a smaller magnitude than those
produced by wind (Supplementary Footnote S4). Based on our data, the wind-sensitive
(C and E) neurons have a high activation threshold (compared to that of sound-sensitive
JO neurons) and thus they do not seem to be involved in processing small arista
deflection induced by gravity; however, this discrepancy can be explained: 1) if there are
sub-populations of C and E neurons that are sensitive to wind vs. gravity, or/and 2) there
is a gain control mechanism that can amplify the minute arista deflection caused by
gravitational force. Whether there are distinct sub-populations of C and E neurons for
wind vs. gravity detections and if there is a gain control mechanisms that can amplify the
minute gravitational forces acting on aristae remain unknown.
Wind-activated neurons in the JO are, moreover, required for an innate behavioral
response to wind. The function of WISL in nature is not clear. Field studies have
suggested that wind is a major environmental factor affecting the dispersal of wild
55
Drosophila populations (Johnston and Heed, 1976; Johnston and Templeton, 1982;
Richardson and Johnston, 1975). WISL may have evolved to control population
dispersal, and thereby maintain genetic homogeneity (Johnston and Heed, 1976; Johnston
and Templeton, 1982). Alternatively, WISL may represent a defense mechanism that
serves to protect individual flies from injury, or to prevent dispersal from food resources.
Identification of the sensory neurons that mediate WISL opens the way to a systematic
analysis of the genes and neural circuitry that underlie this robust, innate behavioral
response to wind.
MATERIALS AND METHODS
Fly stocks
Flies carrying JO4-GAL4 (also called JO-ACE), JO31-GAL4 (also called JO-CE), JO15-
GAL4 (also called JO-AB) were described in (Kamikouchi et al., 2006). UAS-GCaMP
(Wang et al., 2003) and UAS-mCD8-GFP flies were obtained from Y. Wang (Wang et
al., 2004) and R. Axel, UAS-FRT-STOP-FRT-Ricin flies were obtained from D. Berdnik
(Berdnik et al., 2006), JO-CE-GAL4;eyFLP flies were obtained from H. Inagaki, Canton-
S flies from J. Dubnau, and UAS-hid flies from B. Hay. Flies were maintained on corn
meal-molasses food at 25°C on a (12/12) light-dark cycle.
WISL behavioral apparatus
The WISL assay was performed in a 6 x 6 x 1.5 cm transparent acrylic plastic box (WISL
chamber), which has airflow inputs and outputs (1 cm diameter) on two of the four
vertical sides of the box. The input tubing carries airflow from a tank containing
56
breathable air, connected to a flow regulator. The output tubing allows the airflow to
escape from the box, and is connected to a flow meter that measures the speed of the
airflow. The WISL chamber was mounted on a transparent plastic table and was trans-
illuminated with a fluorescent light from underneath. A video camera (Sony, DCR-HC40
NTSC) was set up above the WISL chamber to record the flies’ locomotor activity.
WISL assay protocol
20 flies per trial were sorted 36–48 hours prior to testing, using nitrogen gas or cold
anesthesia. On the testing day, 20 flies were aspirated into the WISL chamber and
allowed to acclimate for 7–8 min just before initiating the trial. A standard WISL trial
lasts for 270 seconds. During the first 55 seconds of the trial period, the flies’ baseline
locomotor activity was recorded. At 55 seconds, a brief mechanical stimulation (5 manual
strikes on the table that the WISL chamber was mounted on) was given to increase the
flies’ locomotor activity. The airflow exposure was initiated at 80 seconds and terminated
at 200 seconds, for a total of 120 seconds (2 minutes) of exposure. Locomotor activity
was recorded at 10 frames per second and average velocity was computed using custom
software written in Matlab (MathWorks Inc.) (Lebestky et al., 2009).
Courtship (female receptivity) assay
Naive Canton-S males and virgin females of the genotype of interest were collected
immediately after eclosion, using nitrogen or CO2 gas anesthesia. Naive males were
individually housed while virgin females were group housed for 6 days until the test day.
Single naive Canton-S male and a single virgin female of the genotype of interest were
57
placed in a mating chamber (1 x 1 x 0.4 cm square chamber), and the time at which a
successful copulation occurred was recorded for each mating pair. Successful copulation
typically lasts 15–25 minutes.
Phototaxis assay
40 flies per trial were sorted 48 hours prior to testing, using nitrogen or CO2 gas
anesthesia. On the test day, 40 flies were tapped into the elevator of a T-maze and
allowed to rest for 1 minute in a dark. Then, the elevator was lowered to the choice point
where flies were given 1 minute to make a choice between a dark tube, or a tube
illuminated with a 40 W fluorescent light, positioned approximately 20 cm away. The
phototaxis response was analyzed by calculating the PI using the following formula: PI =
[(2* COR) – 1] *100. COR = (number of flies that chose the illuminated tube/total
number of flies). PI = 0 indicates an equal distribution of flies between the dark and
illuminated tubes. PI = 100% indicates that all flies chose the illuminated tube.
Antenna manipulations
In order to test the role of the JO in wind detection, a3 segments were surgically removed
using a pair of forceps 48 hours prior to the WISL testing. For the antennal gluing
experiment, a small drop of UV-activated glue was placed at the junction between the a2
and a3 segments bilaterally, and cured with a UV lamp for 3–5 seconds, 48 hours before
the testing. For the mechanical probe antennal displacement experiment, a sharpened
tungsten needle was used to move the aristae in different direction and patterns. The
probe was mounted on a DC motor/controller (LTA-HS and SMC100CC, Newport),
58
which was controlled by custom Matlab software (MathWorks Inc). To push the aristae
backward, the probe was positioned anterior to the aristae; conversely, to push the aristae
forward the probe was positioned posterior to the aristae. In the “push back” (and “push
forward”) conditions, the aristae were pushed backward (and forward) in a single
increment of varying distances (either 0.01, 0.02, 0.025, 0.03, 0.04, 0.05, 0.07, 0.09, or
0.11 mm), held for 8 seconds in the displaced position and then returned to the original
position. In another experiment, the aristae were pushed backwards in three successive
steps of 0.033 mm (a total of 0.099 mm), held in place for 2.9 seconds after each
successive step, and then returned to the original position. In all conditions, the probe and
aristae movements were verified using a video camera (GE680, Proscillica) that was set
up underneath the fly preparation mounted on the microscope stage as described above.
Electrophysiology
Sample preparation and electrophysiological recording from the Johnston’s organ axons
were performed as described in (Eberl et al., 2000). Briefly, extracellular recordings
from the Johnston’s organ axons were recorded at the a1/a2 joint using a tungsten or
glass electrode (0.5 M ). All recordings were carried out in a sound-proof chamber.
Pulse song segments of recorded D. melanogaster courtship song [provided by J. Hall
(Wheeler et al., 1988) and D. Eberl] were used as the sound stimulus and airflow rate
between 0.3–0.9 m/second was used as wind stimulus.
Calcium response imaging and sample preparation
Flies were anesthetized in a plastic vial on ice for 15–20 sec, and were then gently
59
inserted into a hole of a thin plastic rectangular plate. Small drops of wax (55°C) were
applied to prevent the fly from moving out from the hole. After the fly was stabilized in
the plastic hole, the preparation was oriented in an up-side-down position (see Fig. 2b of
the main text). The proboscis, ventral part of thorax and abdomen, and legs were
protruding from the upper side of the horizontal plane of the plastic, while the rest of the
fly head (including the antennae, but excluding the proboscis), thorax, and dorsal part of
abdomen were protruding from the bottom side of the horizontal plane of the plastic. In a
saline bath, the proboscis was cut off and the area surrounding the proboscis was
surgically removed to expose the ventral side of the brain. Fat and air sacs were gently
removed to have a clear view of the brain. For calcium response imaging, the water
immersion objective lens (40X, N.A.=0.8, Olympus) was lowered near the exposed brain,
while the underside of the plastic specimen mount, which contained the intact antennae,
was kept dry and exposed to wind and sound stimuli.
Sound stimuli used in these experiments were recorded segments (provided by J. Hall and
D. Eberl) of the pulse song portion of D. melanogaster courtship song, played at 75–100
dB at the aristae using a loudspeaker (ProMonitor 800 loudspeaker, Definitive
Technology) and amplifier (P.A. amplifier, Radioshack) and was measured using a digital
sound meter (DSM-325, Mannix). We tested the frequency tuning of zones A and B
using narrowband signals derived from the original pulse-song. The original pulse-song
was filtered in order to set the center of the frequency spectrum at a desired frequency
between 100 and 2000 ± 200 Hz (using the Fourier transformation).
60
Wind stimuli used in imaging experiments were delivered at speeds between 0.005–15
m/sec. Wind speed was controlled by flow regulator (mass flow meters and controllers—
Smart Trak series 100, Sierra Instrument Inc.) and was measured using an anenometer
(Testo-435, Testo GmbH & Co.). VClamp software (Pairie Technology) was used to
control all aspects of sound and wind stimuli used in the imaging experiments.
All imaging was performed on an Ultima two-photon laser scanning microscope (Prairie
Technology). Live images were acquired at 6.1 frames per second using an Olympus 40X
(N.A. = 0.8) water immersion objective at 128 x 128 resolution with an imaging
wavelength at 925 nm. GCaMP responses were quantified using custom software written
in Matlab. The relative change in fluorescence intensity ( F/F) was computed by first
calculating the average pixel values in the region of interest during the experimental
period and applying a three frame moving average smoothing function. This average
fluorescence value, Fav, was then converted to F/F using the formula F/F = (Fav –
F0)/F0, where F0 is the baseline fluorescence value, measured as the average of frames 2–
9. Average F/F for specific stimulus period was compared between different JON zones
to test for statistical significance by ANOVA.
ACKNOWLEDGEMENTS
We thank Ulrike Heberlein and Fred Wolf (UCSF) for hosting a sabbatical that
led to the discovery of WISL; Lihi Zelnik, Michael Reiser and Pietro Perona for creating
locomotor tracking software; Dan Eberl and Jeff Hall for D. melanogaster courtship song
recordings; Gaby Maimon for making fly holders for imaging experiments; Mike Roy for
61
building behavioral chambers for WISL and female receptivity assays; Hidehiko Inagaki
for sharing unpublished data and JO-CE-GAL4;eyFLP flies; Bruce Hay for UAS-hid
flies; Daniela Berdnik for UAS-FRT-STOP-FRT-Ricin flies; Michael Dickinson for
anemometers and helpful discussions; J. L. Anderson for advice on fluid mechanics;
Martin Göpfert for providing a pressure gradient microphone; Mark Konishi for advice
and use of lab facilities; and Gaby Mosconi for laboratory management. D. J. A. is an
Investigator of the Howard Hughes Medical Institute. This work was supported in part
by an NSF FIBR grant.
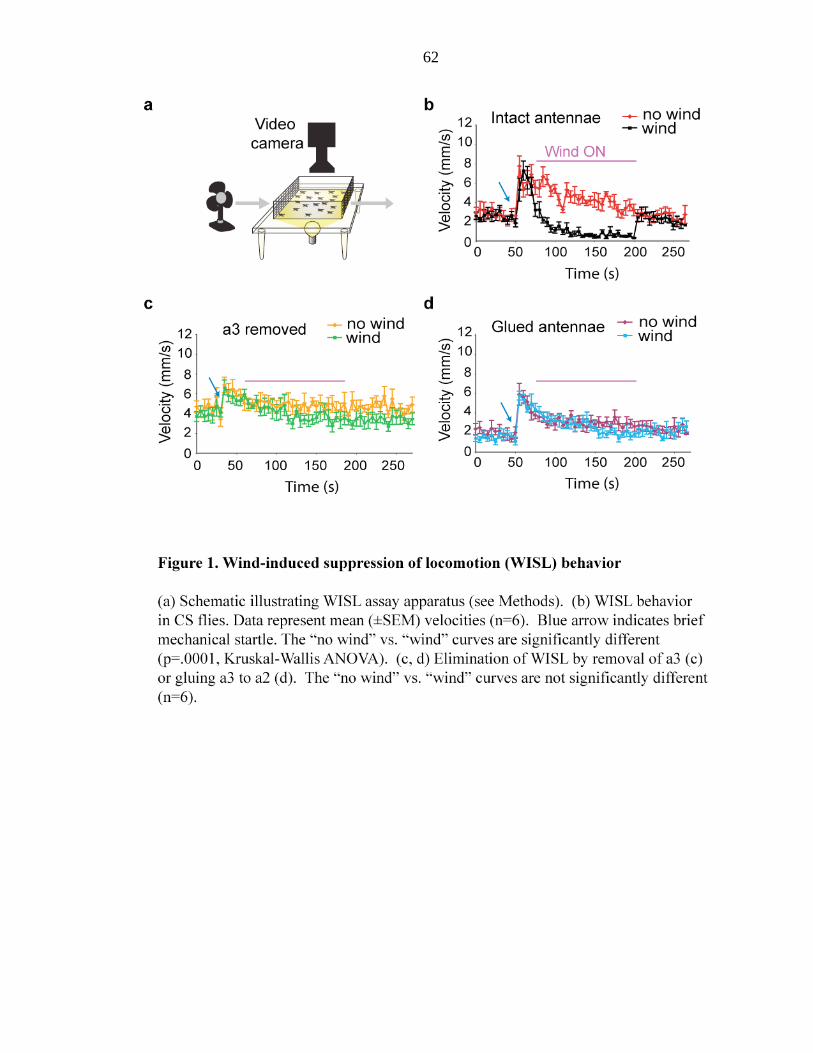
62
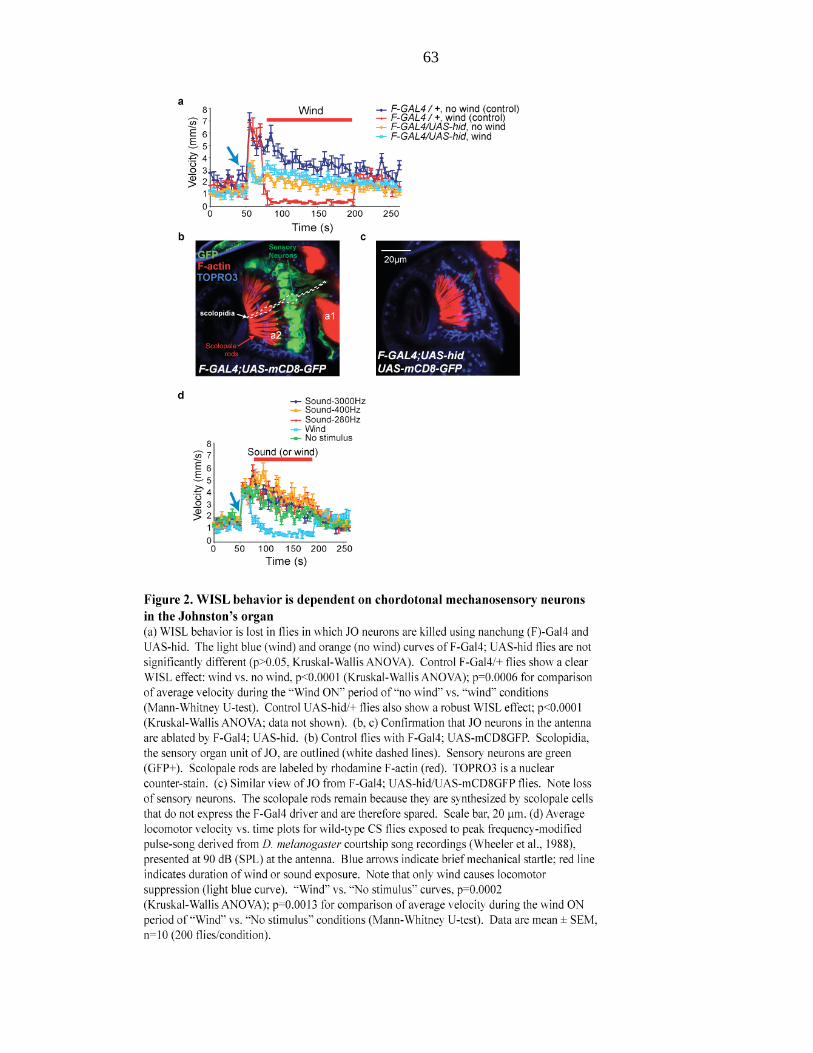
63
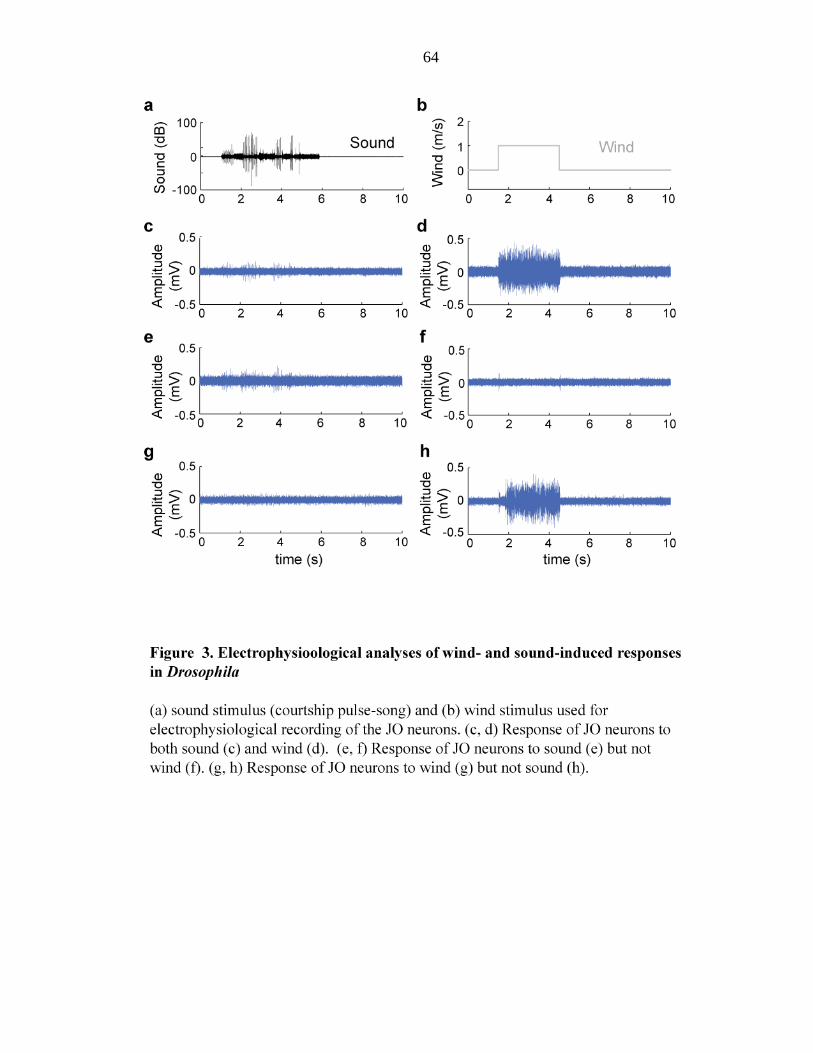
64
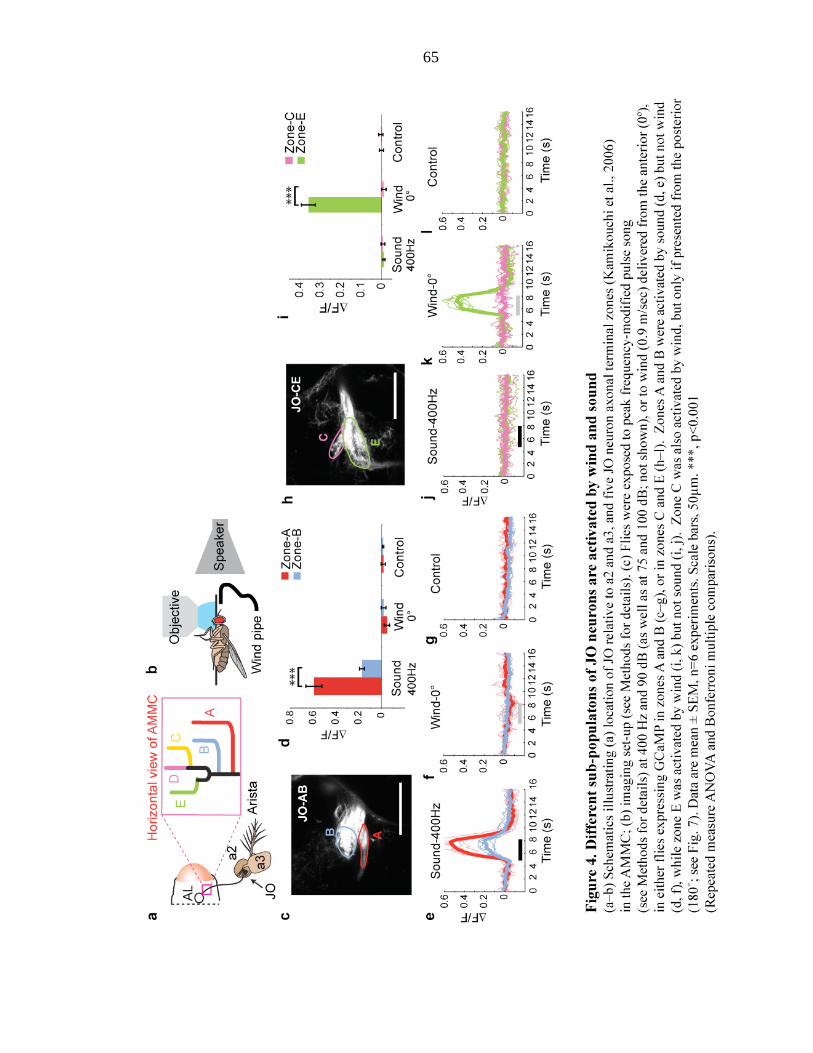
65
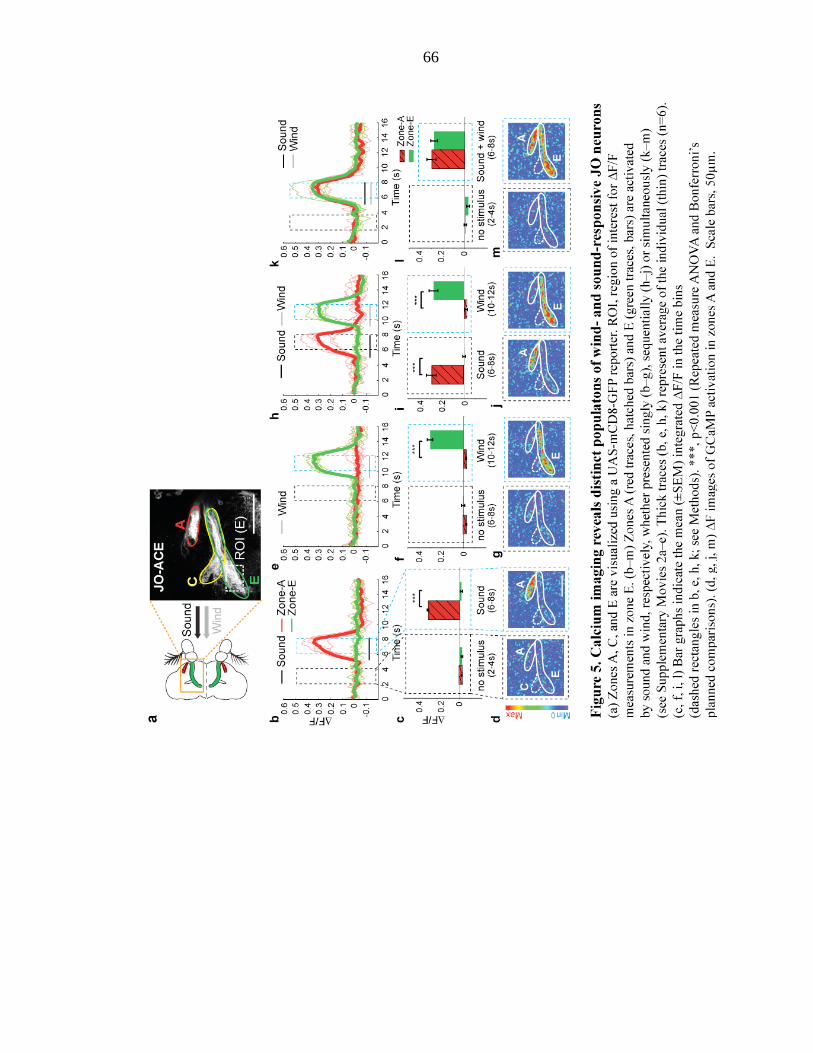
66
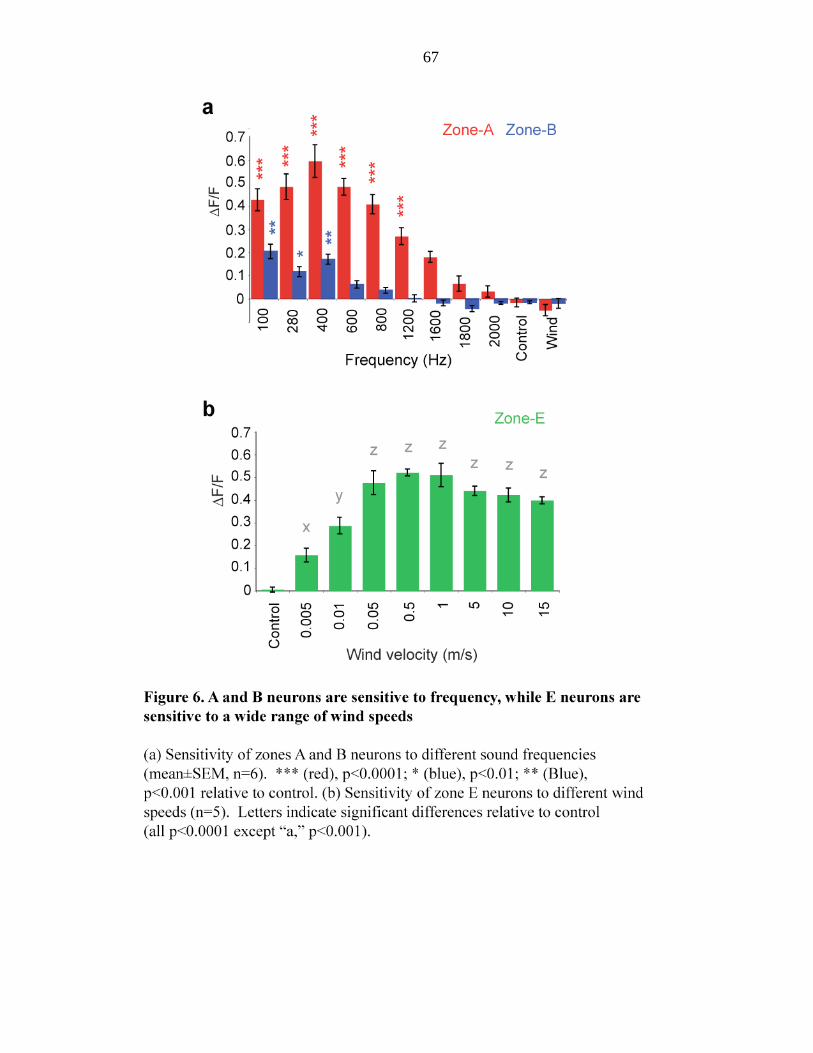
67
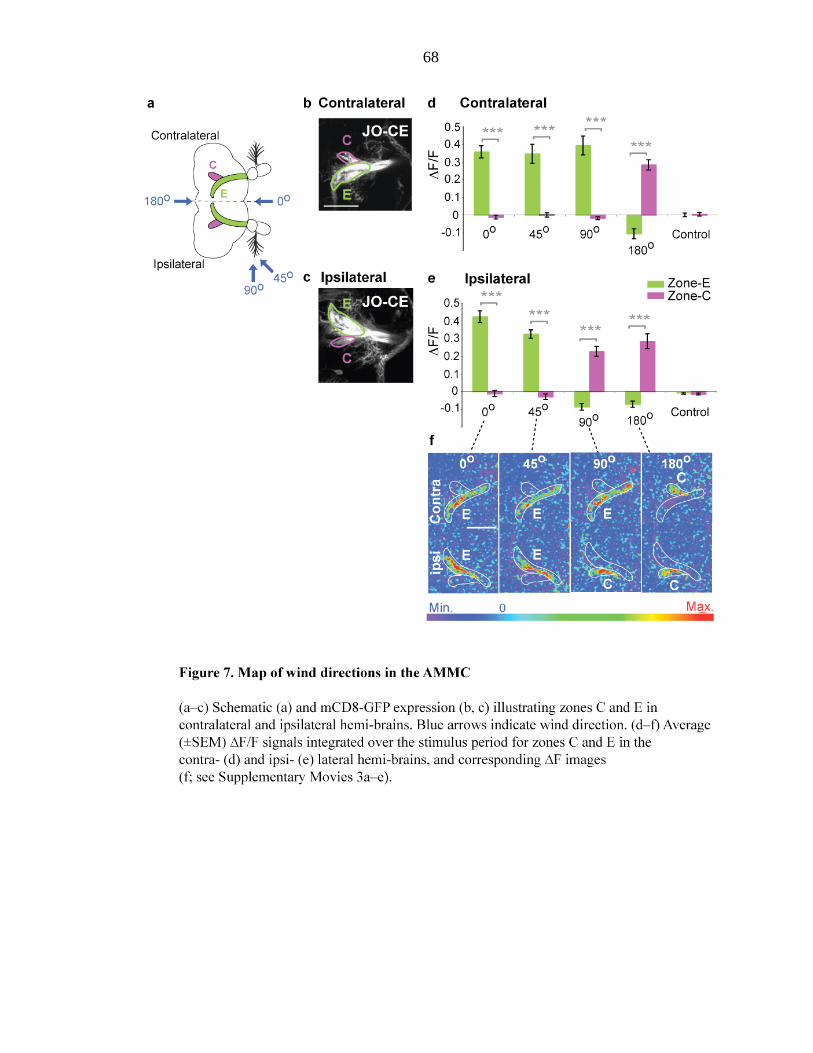
68
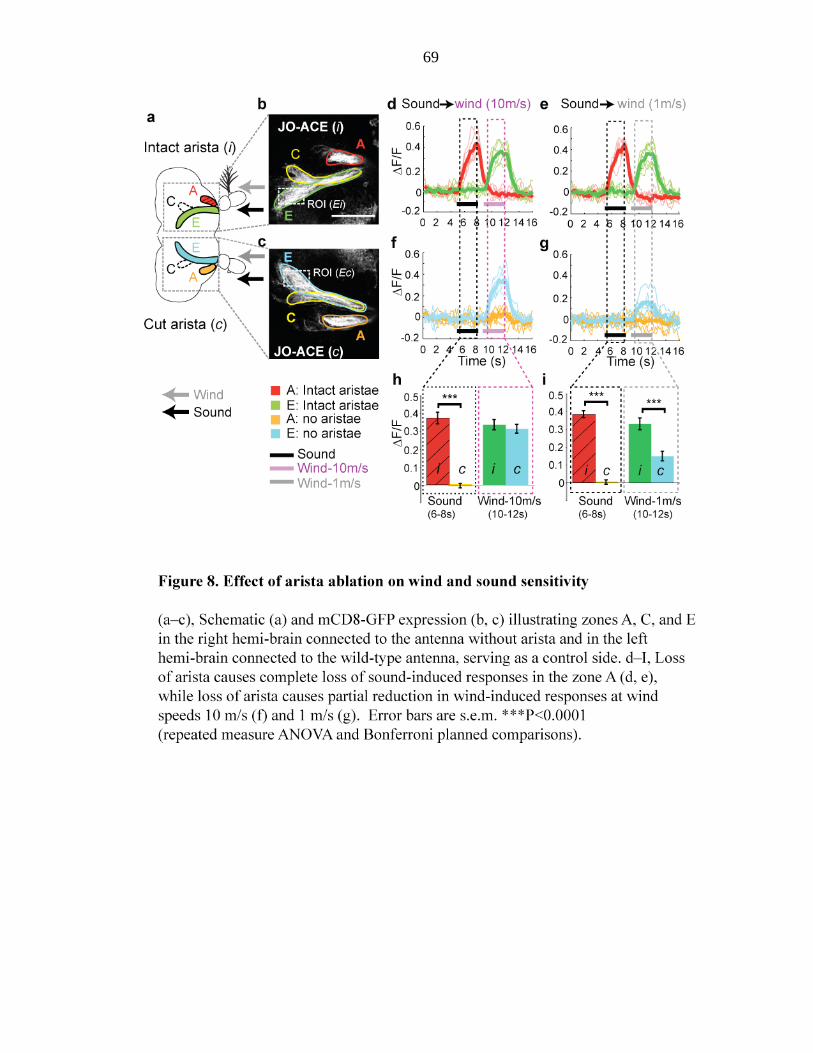
69
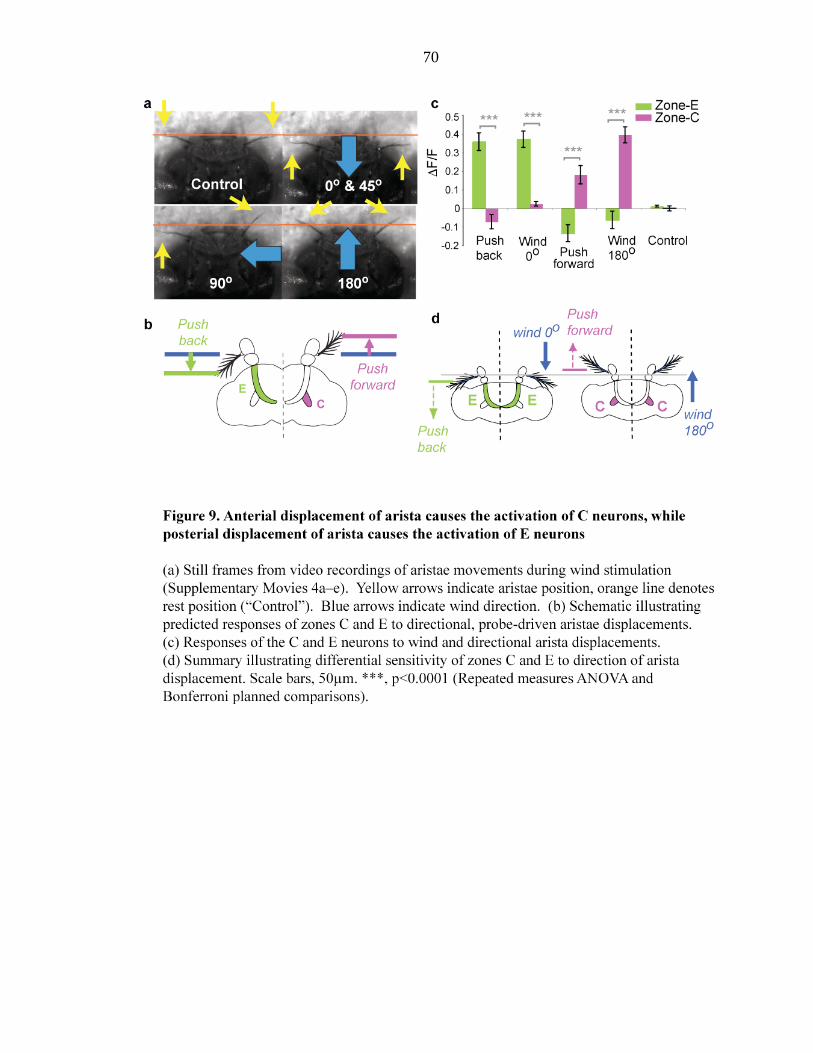
70
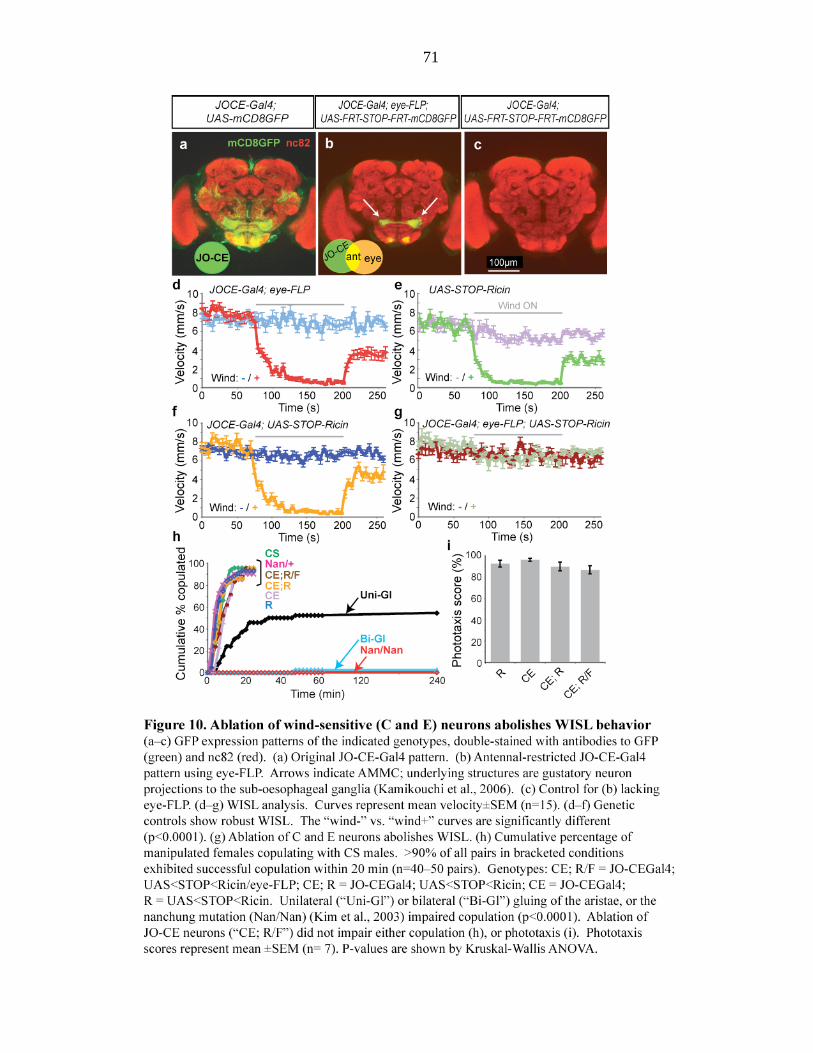
71
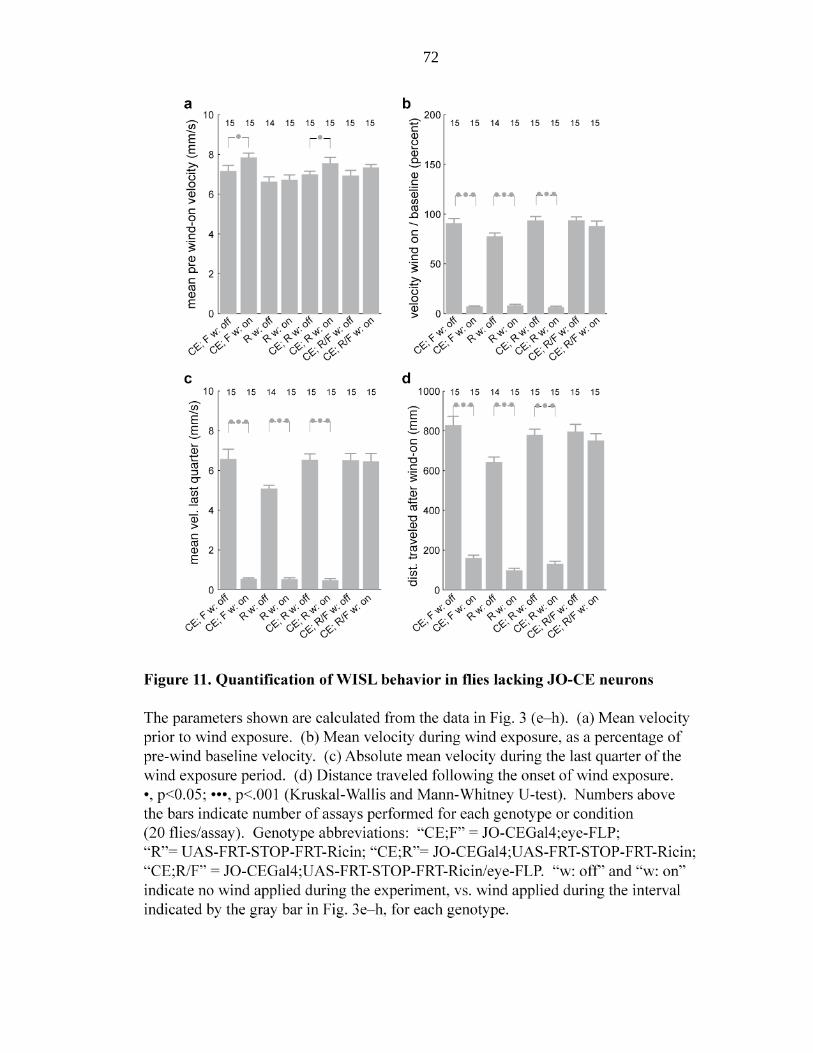
72
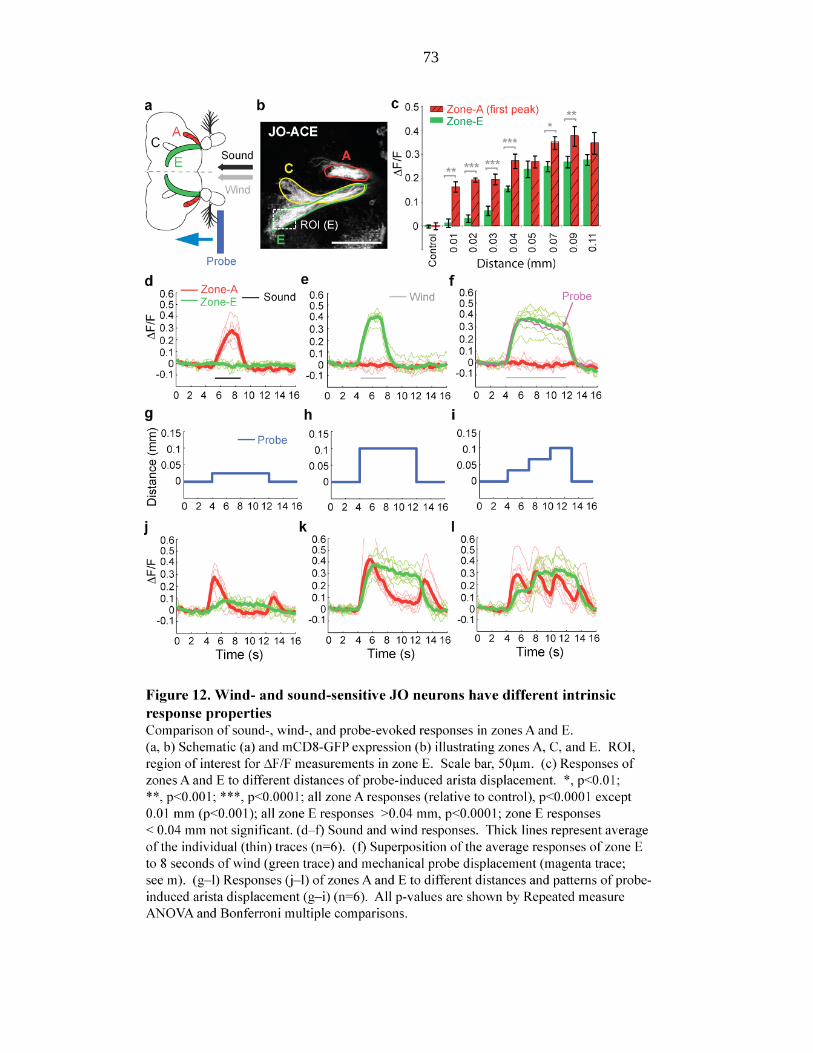
73
74
Supplementary Footnote S1
J. S. Johnston and colleagues have measured wind speeds in the habitats of several wild-
caught Drosophila species (Johnston and Heed, 1976; Johnston and Templeton, 1982),
including both tropical and desert environments. In Kamuela, Hawaii, for example, D.
mercatorum and D. hydei inhabit environments where trade winds blow in the range of
5–25 km/hr (1.4–6.9 m/s), with an average velocity of 15 km/hr (4.17 m/sec); gusts over
35 km/hr (9.72 m/s) are not uncommon (Johnston and Templeton, 1982). Wind speeds in
the range of 0.46–4.64 m/s have been measured in the Arizona desert, the habitat of D.
nigrospiracula (Johnston and Heed, 1976). We observed wind-induced suppression of
walking in D. melanogaster between 0.7–1.6 m/s; these velocities are therefore well
within the range of wind speeds measured in several Drosophila natural habitats. Wild-
caught D. mercatorum and D. hydei exhibited locomotor arrest in the laboratory at wind
speeds of 10 km/hr (2.8 m/sec) and greater (Johnston and Templeton, 1982), while wild-
caught D. mimica, another Hawaiian species, exhibited locomotor arrest at air speeds
between 6 and 7 km/hr (1.67–1.94 m/s) (Richardson and Johnston, 1975). Anecdotal
evidence that wind suppresses Drosophila locomotor activity in the wild derives from the
observation that during occasional days in Hawaii when the trade winds stop, called
“Kona” weather (Johnston and Templeton, 1982), Drosophila in flight are abundant,
while during the trade winds very few Drosophila are observed in flight because most of
them are immobilized on their Opuntia substrate (J. S. Johnston, personal
communication). These data suggest that WISL is a naturally occurring behavior
exhibited by Drosophila at wind speeds normally encountered in their wild ecological
habitat. Johnston and colleagues speculate that this behavior may be the dominant
75
environmental influence (rather than, e.g., temperature and humidity) affecting the
dispersal of wild Drosophila populations, and thereby an important determinant of their
“genoclines,” geographic gradients in gene frequencies (Johnston and Templeton, 1982;
Richardson and Johnston, 1975).
Supplementary Footnote S2
Our detection of distinct sound- and wind-evoked spiking responses in antennal nerve
electrophysiological recordings (Fig. 3) argues that the differential activation of sound-
vs. wind-sensitive axons observed by GCaMP imaging is unlikely to be explained by
local circuit interactions within the AMMC. Electrophysiological recordings from
sound-selective locations in the antennal nerve usually revealed one or two spikes at the
onset and offset of the wind stimulus (Fig. 3e vs. f). These brief spiking responses
probably reflect the fact that phasically responsive JO neurons can be transiently
activated by deflections of the aristae caused by wind.
Supplementary Footnote S3
Our calcium imaging experiments indicate that arista movements triggered by the
mechanical probe activate both wind- and sound-sensitive neurons (Fig. 12k, l), while the
natural stimuli (wind and sound) activate these neurons in a mutually exclusive manner
(Fig. 12d, e). Wind-sensitive neurons may not be activated by sound stimuli, because the
magnitude of the antennal displacements produced by courtship song may be too small to
76
evoke a detectable response (see also Supplementary Footnote S4). This hypothesis is
supported by the fact that short-distance mechanical displacements of the aristae activate
sound- but not wind-sensitive neurons (Fig. 12e). Why, then, are sound-sensitive neurons
not also activated by wind? In fact, our electrophysiological data indicate that they are
activated, albeit very transiently: Brief spiking responses are observed in sound-sensitive
JO neurons at the onset and offset of the wind stimulus (Fig. 3e, f, blue traces; see
Supplementary Footnote S2). These transient spiking epochs are unlikely to produce
sufficient accumulations of intracellular calcium to yield detectable GCaMP signals
(Pologruto et al., 2004). In contrast, the GCaMP signals elicited in sound-sensitive JO
neurons by controlled mechanical displacements (Fig 12g–l, red lines) may reflect more
extended spiking responses caused by damped oscillatory vibrations of the probe as it
pushes against the arista. Finally, it is possible that wind- and sound-selective neurons
differ in their sensitivity to the position, velocity, or acceleration of the antenna caused by
these different stimuli, as shown for limb chordotonal organs in the stick insect (Hofmann
and Koch, 1985; Hofmann et al., 1985). The mechanical probe may not faithfully mimic
these natural stimulus-specific differences in antennal movements.
77
Supplementary Footnote S4
We did not observe activation of zone C/E JO neurons by antennal deflections below ~30
m, while Kamikouchi et al. observed activation with deflections as small as 1 m,
consistent with the estimated deflection caused by the earth’s gravitational field acting on
the mass of the antenna. This difference is probably due to differences in the calcium
imaging methods used in the two studies. Our approach measures activity in JO neuron
axon terminals, which most likely reflects influx of extracellular Ca2+
due to spike firing.
In contrast, Kamikouchi et al. measure activity in JO cell bodies, which may reflect both
Ca2+
influx and release from intracellular stores. In addition, the kinetics of the decay of
Cam2.1 signal in response to transient Ca2+
increases is much slower (~2 s) than that of
GCaMP (330 ms) (Mank et al., 2006), so that the method employed by Kamikouchi et al.
integrates small changes in [Ca2+
]in over a longer period of time.
78
REFERENCES
Bennet-Clark, H. (1971). Acoustics of insect song. Nature 234, 255-259.
Berdnik, D., Chihara, T., Couto, A., and Luo, L. (2006). Wiring stability of the adult
Drosophila olfactory circuit after lesion. J Neurosci 26, 3367-3376.
Budick, S. A., Reiser, M. B., and Dickinson, M. H. (2007). The role of visual and
mechanosensory cues in structuring forward flight in Drosophila melanogaster. J Exp
Biol 210, 4092-4103.
Caldwell, J. C., and Eberl, D. F. (2002). Towards a molecular understanding of
Drosophila hearing. J Neurobiol 53, 172-189.
Carr, C. E., and Konishi, M. (1988). Axonal delay lines for time measurement in the
owl's brainstem. Proc Natl Acad Sci USA 85, 8311-8315.
Csillag, A. L., ed. (2005). Atlas of the sensory organs: functional and clinical anatomy
(New Jersey: Humana press).
Dickinson, M. H. and Palka, J. (1987) Physiological properties, time of development, and
central projection are correlated in the wing mechanoreceptors of Drosophila. J Neurosci
7, 4201-4208.
Eberl, D. F., Hardy, R. W., and Kernan, M. J. (2000). Genetically similar transduction
mechanisms for touch and hearing in Drosophila. J Neurosci 20, 5981-5988.
Ewing, A. W. (1978). The antenna of Drosophila as a "love song" receptor. Physiol
Entomol 3, 33-36.
Göpfert, M. C., and Robert, D. (2002). The mechanical basis of Drosophila audition. J
Exp Biol 205, 1199-1208.
Göpfert, M. C., and Robert, D. (2002). The mechanical basis of Drosophila audition. J
Exp Biol 205, 1199-1208.
Hofmann, T., and Koch, U. T. (1985). Acceleration receptors in the femoral chordotonal
organ of the stick insect, Cuniculina Impigra. J Exp Biol.
Hofmann, T., Koch, U. T., and Bassler, U. (1985). Physiology of the femoral chordotonal
organ in the stick insect, Cuniculina Impigra. J Exp Biol.
Johnson, K. O., and Hsiao, S. S. (1992). Neural mechanisms of tactual form and texture
perception. Annu Rev Neurosci 15, 227-250.
Johnston, J., and Heed, W. (1976). Dispersal of desert-adapted Drosophila: the saguaro-
breeding D. nigrospiracula. Am Nat 110, 629-651.
79
Johnston, J., and Templeton, A. (1982). Dispersal and clines in Opuntia breeding
Drosophila mercatorum and Drosophila hydei at Kamuela, Hawaii, In Ecological
Genetics and Evolution, J. S. F. Barker, and W. T. Starmer, eds. (Sydney: Academic
Press), pp. 241-256.
Kamikouchi, A., Shimada, T., and Ito, K. (2006). Comprehensive classification of the
auditory sensory projections in the brain of the fruit fly Drosophila melanogaster. J
Comp Neurol 499, 317-356.
Kernan, M. J. (2007). Mechanotransduction and auditory transduction in Drosophila.
Pflugers Arch 454, 703-720.
Kim, J., Chung, Y. D., Park, D. Y., Choi, S., Shin, D. W., Soh, H., Lee, H. W., Son, W.,
Yim, J., Park, C. S., et al. (2003). A TRPV family ion channel required for hearing in
Drosophila. Nature 424, 81-84.
Knudsen, E. I., and Konishi, M. (1978). A neural map of auditory space in the owl.
Science 200, 795-797.
Lebestky, T., Chang, J. S., Dankert, H., Zelnik, L., Kim, Y. C., Han, K. A., Wolf, F. W.,
Perona, P., and Anderson, D. J. (2009). Two different forms of arousal in Drosophila are
oppositely regulated by the dopamine D1 receptor ortholog DopR via distinct neural
circuits. Neuron 64, 522-536.
Mank, M., Reiff, D. F., Heim, N., Friedrich, M. W., Borst, A., and Griesbeck, O. (2006).
A FRET-based calcium biosensor with fast signal kinetics and high fluorescence change.
Biophys J 90, 1790-1796.
Manning, A. (1967). Antennae and sexual receptivity in Drosophila melanogaster
females. Science 158, 136-137.
Moffat, K. G., Gould, J. H., Smith, H. K., and O'Kane, C. J. (1992). Inducible cell
ablation in Drosophila by cold-sensitive ricin A chain. Development 114, 681-687.
Muniak, M. A., Ray, S., Hsiao, S. S., Dammann, J. F., and Bensmaia, S. J. (2007). The
neural coding of stimulus intensity: linking the population response of mechanoreceptive
afferents with psychophysical behavior. J Neurosci 27, 11687-11699.
Nakai, J., Ohkura, M., and Imoto, K. (2001). A high signal-to-noise Ca(2+) probe
composed of a single green fluorescent protein. Nat Biotechnol 19, 137-141.
Pologruto, T. A., Yasuda, R., and Svoboda, K. (2004). Monitoring neural activity and
[Ca2+] with genetically encoded Ca2+ indicators. J Neurosci 24, 9572-9579.
Richardson, R. H., and Johnston, J. S. (1975). Behavioral components of dispersal in
Drosophila mimica. Oecologia 20, 287-299.
Slatkin, M. (1985). Gene flow in natural populations. Annu Rev Ecol Syst 16, 393-430.
80
Slatkin, M. (1987). Gene flow and the geographic structure of natural populations.
Science 236, 787-792.
Smith, C. I., and Farrell, B. D. (2006). Evolutionary consequences of dispersal ability in
cactus-feeding insects. Genetica 126, 323-334.
Takahashi, T. T. (1989). The neural coding of auditory space. J Exp Biol 146, 307-322.
Tanouye, M. A., and Wyman, R. J. (1980). Motor outputs of giant nerve fiber in
Drosophila. J Neurophysiol 44, 405-421.
Wang, J. W., Wong, A. M., Flores, J., Vosshall, L. B., and Axel, R. (2003). Two-photon
calcium imaging reveals an odor-evoked map of activity in the fly brain. Cell 112, 271-
282.
Wang, S. L., Hawkins, C. J., Yoo, S. J., Muller, H. A., and Hay, B. A. (1999). The
Drosophila caspase inhibitor DIAP1 is essential for cell survival and is negatively
regulated by HID. Cell 98, 453-463.
Wang, Y., Guo, H. F., Pologruto, T. A., Hannan, F., Hakker, I., Svoboda, K., and Zhong,
Y. (2004). Stereotyped odor-evoked activity in the mushroom body of Drosophila
revealed by green fluorescent protein-based Ca2+ imaging. J Neurosci 24, 6507-6514.
Wheeler, D. A., Fields, W. L., and Hall, J. C. (1988). Spectral analysis of Drosophila
courtship songs: D. melanogaster, D. simulans, and their interspecific hybrid. Behav
Genet 18, 675-703.
Willis, M. A., and Avondet, J. L. (2005). Odor-modulated orientation in walking male
cockroaches Periplaneta americana, and the effects of odor plumes of different structure.
J Exp Biol 208, 721-735.
Willis, M. A., Avondet, J. L., and Finnell, A. S. (2008). Effects of altering flow and odor
information on plume tracking behavior in walking cockroaches, Periplaneta americana
(L.). J Exp Biol 211, 2317-2326.
Wong, A. M., Wang, J. W., and Axel, R. (2002). Spatial representation of the glomerular
map in the Drosophila protocerebrum. Cell 109, 229-241.
Wright, S. (1943). Isolation by distance. Genetics 28, 114-138.
81
Chapter 3
Remaining outstanding questions and future directions
82
There is a tonotopic representation in the Johnston’s organ
The basilar membrane of the mammalian cochlea is organized into a tonotopic
map (Moller, 2003), which functions as an initial stage of spectral analyses even before
acoustic energy reaches the auditory receptor cells, the inner hair cells. Thus, the
tonotopic map in the basilar membrane provides a great functional advantage. Since
sensory maps may serve adaptive advantage, and are found in auditory systems of various
organisms (Mason and Faure, 2004; Stolting and Stumpner, 1998), we wanted to
investigate if there is a tonotopic map in the Drosophila JO.
In order to investigate the location of cell bodies for all class of JO neurons (zones
A, B, C, and E neurons) within the JO, I decided to use the genetically encoded photo-
activatable GFP (PA-GFP) to photo-convert each class of JO neurons by illuminating
their axon terminal zones in the AMMC. Illumination with 710 nm light cause photo-
conversion of the PA-GFP to change its emission spectrum and become visible (Datta et
al., 2008). The photo-converted GFP will eventually travel down to the cell body from
the axon terminal zone by diffusion, which allows us to determine the relative location of
the cell bodies of A, B, C, and E neurons in the JO.
PA-GFP experiments suggest that JO neurons are organized in a ring of arrays
from the medial to lateral portion of the antenna in the JO (Fig. 13–h). The tip of the
scolopedia is attached to the tip of the a3 segment and cell bodies are located at the outer
ring of the array. Cell bodies of zone C neurons were located at the medial end of the
array, while cell bodies of the zone E neurons were located at the lateral end of the arrays
(Fig. 13 d–f, 13i). There was no overlap between the cell bodies of zones C and E
neurons, since they were located at the opposite end of the array. Cell bodies of the zone
83
A neurons occupy the narrow midpoint area of the array, where axon bundles are exiting
from the JO towards the brain (Fig. 13a–b). The cell bodies of zone A neurons never
overlap with that of zone C or E neurons (Fig. 13–i). The cell bodies of zone B neurons
occupy the wider area around the middle portion of the array compared to A neurons,
thus they overlap with the cell bodies of zones A around the central potion (Fig. 13a, c, i).
B neurons also overlapped with C neurons near the medial end, and E neurons near the
lateral end (Fig. 13a–f, 13i).
As discussed in chapter 2, Zone A neurons respond to high frequency sound,
while zone B neurons respond to low frequency sound (Fig. 6a). In contrast, zone C and
E neurons respond to wind (Fig. 7). If we consider wind as an extremely low frequency
“auditory” stimulus (~1 Hz), it looks like the JO neurons are organized in a tonopotic
map: The cell bodies of C and E neurons, which respond to extremely low frequency
stimulus (wind), are located at the extreme ends of the array, while the cell bodies of B
neurons, which respond to lower frequency sound occupies the middle portion of the
array. Finally, the cell bodies of A neurons, which respond to higher frequency sound,
occupy the central portion of the array; thus from the direction of the medial to the central
to the lateral end of the array, cell bodies are organized in the order of: C neurons (wind)
B (low frequency) A (high frequency) B (low frequency) E (wind). It is
important to note that there are no clear boundaries in this tonotopic map but the area
occupied by A neurons never overlaps with the area occupied by C and E neurons. It is
also interesting to note that cell bodies of A neurons are much larger (~6–7 m, diameter)
than these of B, C, and E neurons (~3–4 m, diameter) (Fig. 14). Whether the size of cell
body relates to any function is not known.
84
As discussed in Chapter 2, wind from the front (0o) activated zone E neurons, and
slightly inhibited C neurons, while wind from the rear (180o) activated C neurons and
inhibited E neurons in the AMMC. Thus, there are antagonistic activation patterns
between C and E neurons (Fig. 7). At first, we thought that there is lateral inhibition
between C and E neurons, however it is also possible to hypothesize that the structural
arrangement of C vs. E neurons within the JO (medial vs. lateral end of the JO array)
might also explain the antagonistic activation patterns between the C and E neurons. For
example, when aristae are deflected posteriorly (by 0o wind), the attachment sites of
scolopedia for E neurons get tensioned, and cause activation of E neurons, while C
neurons’ scolopedia get relaxed, causing hyperpolalization of the C neurons (Fig. 13j).
Conversely, when aristae is deflected anteriorly (by 180o wind), the scolopedia for C
neurons get tensioned, and activate C neurons, while E neurons’ scolopedia get relaxed,
causing hyperpolarization of E neurons (Fig. 13j).
The antagonistic activation patterns between C and E neurons are interesting from
both functional and mechanistic perspectives. These antagonistic activation patterns
remind us of lateral inhibition in the antennal lobes of olfactory system, which is known
to sharpen the odor acuity. Whether these antagonistic relations between the C and E
neurons are related to the acuity of the fly’s wind detection system is not known. Also,
whether these antagonistic relations are indeed due to their cell bodies’ location within
the JO or/and lateral inhibition also remains to be determined.
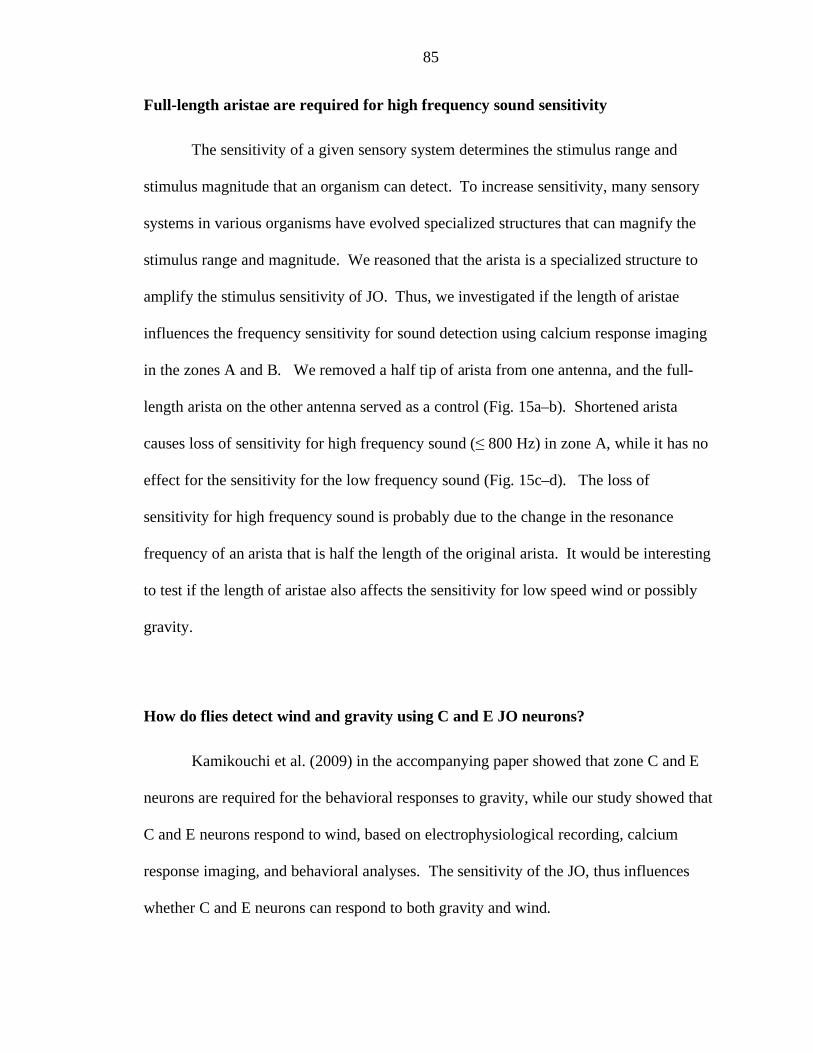
85
Full-length aristae are required for high frequency sound sensitivity
The sensitivity of a given sensory system determines the stimulus range and
stimulus magnitude that an organism can detect. To increase sensitivity, many sensory
systems in various organisms have evolved specialized structures that can magnify the
stimulus range and magnitude. We reasoned that the arista is a specialized structure to
amplify the stimulus sensitivity of JO. Thus, we investigated if the length of aristae
influences the frequency sensitivity for sound detection using calcium response imaging
in the zones A and B. We removed a half tip of arista from one antenna, and the full-
length arista on the other antenna served as a control (Fig. 15a–b). Shortened arista
causes loss of sensitivity for high frequency sound ( 800 Hz) in zone A, while it has no
effect for the sensitivity for the low frequency sound (Fig. 15c–d). The loss of
sensitivity for high frequency sound is probably due to the change in the resonance
frequency of an arista that is half the length of the original arista. It would be interesting
to test if the length of aristae also affects the sensitivity for low speed wind or possibly
gravity.
How do flies detect wind and gravity using C and E JO neurons?
Kamikouchi et al. (2009) in the accompanying paper showed that zone C and E
neurons are required for the behavioral responses to gravity, while our study showed that
C and E neurons respond to wind, based on electrophysiological recording, calcium
response imaging, and behavioral analyses. The sensitivity of the JO, thus influences
whether C and E neurons can respond to both gravity and wind.
86
According to our study, wind-responsive C and E neurons have a higher
activation threshold ( 30 m) compared to that of the sound responsive neurons based
on the arista pushing experiments (Fig. 12c). Since arista deflection caused by
gravitational force is estimated as approximately 1 m (Kamikouchi et al., 2009), it is
hard to imagine how C and E neurons could respond to a small forces such as gravity, in
addition to wind stimuli. However, it is possible for C and E neurons to respond to both
wind and gravity: 1) if the sensitivity of C and E neurons is enhanced by a structure-
based amplification mechanism during signal transduction or by circuit-based gain
control (i.e. spatial integration that allows the convergence of receptor neurons’ outputs),
or/and 2) if there are distinct sub-populations of C and E neurons that are wind- vs.
gravity-sensitive.
Various amplification mechanisms for sensory systems are described in different
sensory systems in various organisms. For example, the mammalian cochlea has outer
hair cells that function as a structure-based mechanical amplifier to amplify small
intensity sounds and reduce the sensitivity for very loud sound to protect our ear (Dallos,
2008; Hudspeth, 2008). Outer hair cells generate force to augment auditory sensitivity
and frequency selectivity (Fettiplace and Hackney, 2006; Holley and Ashmore, 1988).
In the Drosophila JO, it is reported that sound-processing JO neurons have a
structure-based amplification mechanism that can amplify low intensity sound and reduce
the sensitivity for high intensity sound (Gopfert et al., 2006; Nadrowski et al., 2008;
Nadrowski and Gopfert, 2009). A few genes, including Nanchung and Inactive, which
encode TRP Vanilloid channels and NompC, which encodes the TRPN1 channel, have
been implicated in the amplification mechanism in Drosophila (Gopfert et al., 2006).
87
Kamikouchi et al. (2009) have shown that NompC, a gene implicated in sound
amplification, is not involved in the behavioral response to gravity. Thus, if there are
amplification mechanisms for C and E neurons, they probably involve different sets of
genes that contribute to gravity sensitivity. Whether there are amplification mechanisms
that allow the same population of C and E neurons to respond to both wind and gravity
remains unknown.
An alternative explanation for the involvement of C and E neurons for detection
of wind and gravity is to have distinct sub-populations of C and E neurons that
selectively respond to wind vs. gravity. Since it is technically challenging to evaluate the
effect of gravity using calcium response imaging or electrophysiological recording, there
are no data to support the existence of distinct sub-populations within the C and E
populations at this point. It would be helpful to have GAL4 lines that are expressed in
sub-populations of the C and E neurons, or intersectional strategies to manipulate sub-
populations of C and E neurons.
How do flies distinguish wind from the front (0o) and 45
o angle?
As discussed in chapter 2, we identified a sensory map of wind directions (Fig. 7),
which potentially facilitates the discrimination of different wind directions. We
hypothesized a model for the discrimination of wind directions involving the comparison
of activation patterns between the zone C and E neurons within each heni-brains, and
between the right and left hemi-brains. However, this model does not completely explain
how flies can discriminate wind from the front (0o) and 45
o angle, because they cause the
same activation patterns in the Drosophila brain (Fig. 7d–f). However, if we modify this
88
model by including the comparison of activation timing or intensity in the left and right
hemi-brains, this model can explain how flies could discriminate the wind from the front
(0o) and 45
o angle. For example, if we imagine that wind from the 45
o angle would
activate E neurons in one side of hemi-brain before the other side, there are time
differences between the activation of E neurons in the right and left hemi-brains. If the
wind-sensitive JO neurons in the right and left antennae can encode for these time
differences, this model can still explain the fly’s ability to discriminate 0o vs. 45
o wind.
Alternatively, it is also possible that there are differences in the speed of wind that
reaches right and left antennae. The interaural intensity difference might affect the
numbers of E neurons that are activated by 0o vs. 45
o wind in the right and left hemi-
brains. In this case, if we carry out calcium response imaging and compare the
differences in the activation intensity in zone E between the right and left hemi-brains,
we should see stronger increases in the fluorescence in the ipsilateral side compared to
that of the contralateral side. Other insects, such as grasshoppers, indeed utilize
interaural intensity differences between the right and left tympanal membranes to
determine the location of a sound source (Hennig et al., 2004).
How do flies detect changes in wind direction or changes in speed?
In the Drosophila’s natural environment, the speed and direction of wind might
change haphazardly; thus flies have to be able to detect the changes in speed and wind
direction in order to navigate properly during flight or to avoid potential life threatening
conditions. For example, what if the wind direction shifts from 45o northeast to 45
o
northwest? Either 45o northeast or 45
o northwest wind would activate E neurons in both
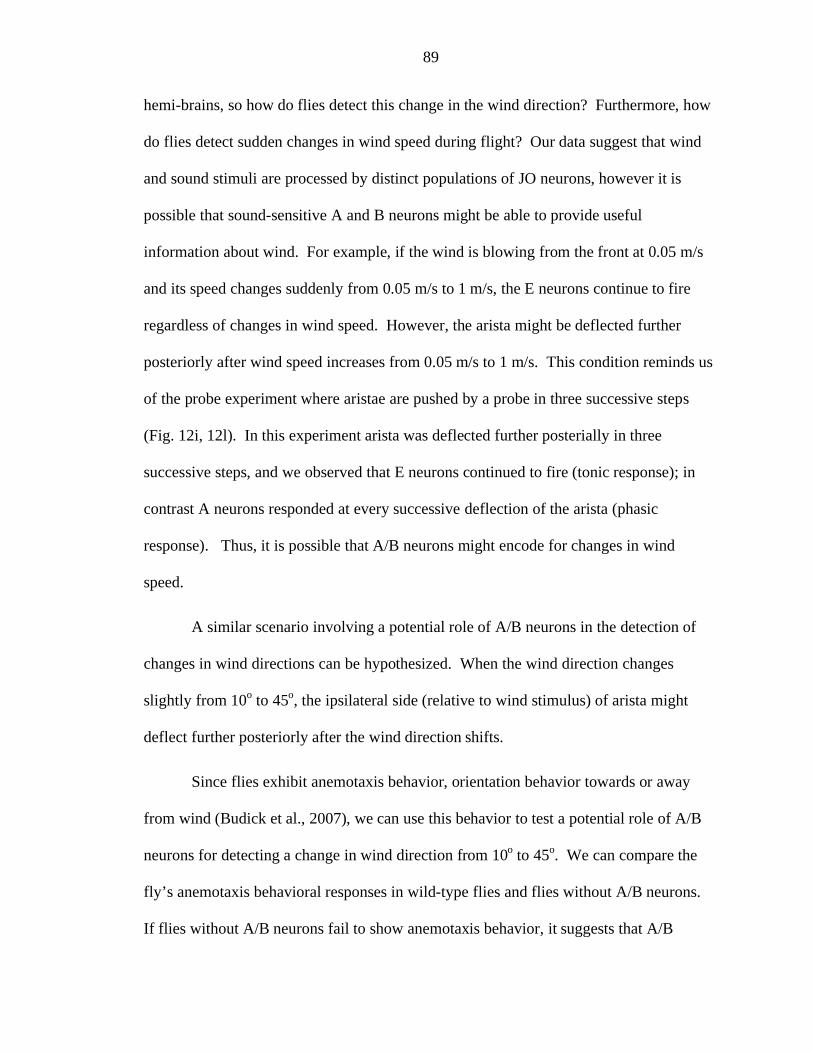
89
hemi-brains, so how do flies detect this change in the wind direction? Furthermore, how
do flies detect sudden changes in wind speed during flight? Our data suggest that wind
and sound stimuli are processed by distinct populations of JO neurons, however it is
possible that sound-sensitive A and B neurons might be able to provide useful
information about wind. For example, if the wind is blowing from the front at 0.05 m/s
and its speed changes suddenly from 0.05 m/s to 1 m/s, the E neurons continue to fire
regardless of changes in wind speed. However, the arista might be deflected further
posteriorly after wind speed increases from 0.05 m/s to 1 m/s. This condition reminds us
of the probe experiment where aristae are pushed by a probe in three successive steps
(Fig. 12i, 12l). In this experiment arista was deflected further posterially in three
successive steps, and we observed that E neurons continued to fire (tonic response); in
contrast A neurons responded at every successive deflection of the arista (phasic
response). Thus, it is possible that A/B neurons might encode for changes in wind
speed.
A similar scenario involving a potential role of A/B neurons in the detection of
changes in wind directions can be hypothesized. When the wind direction changes
slightly from 10o to 45
o, the ipsilateral side (relative to wind stimulus) of arista might
deflect further posteriorly after the wind direction shifts.
Since flies exhibit anemotaxis behavior, orientation behavior towards or away
from wind (Budick et al., 2007), we can use this behavior to test a potential role of A/B
neurons for detecting a change in wind direction from 10o to 45
o. We can compare the
fly’s anemotaxis behavioral responses in wild-type flies and flies without A/B neurons.
If flies without A/B neurons fail to show anemotaxis behavior, it suggests that A/B
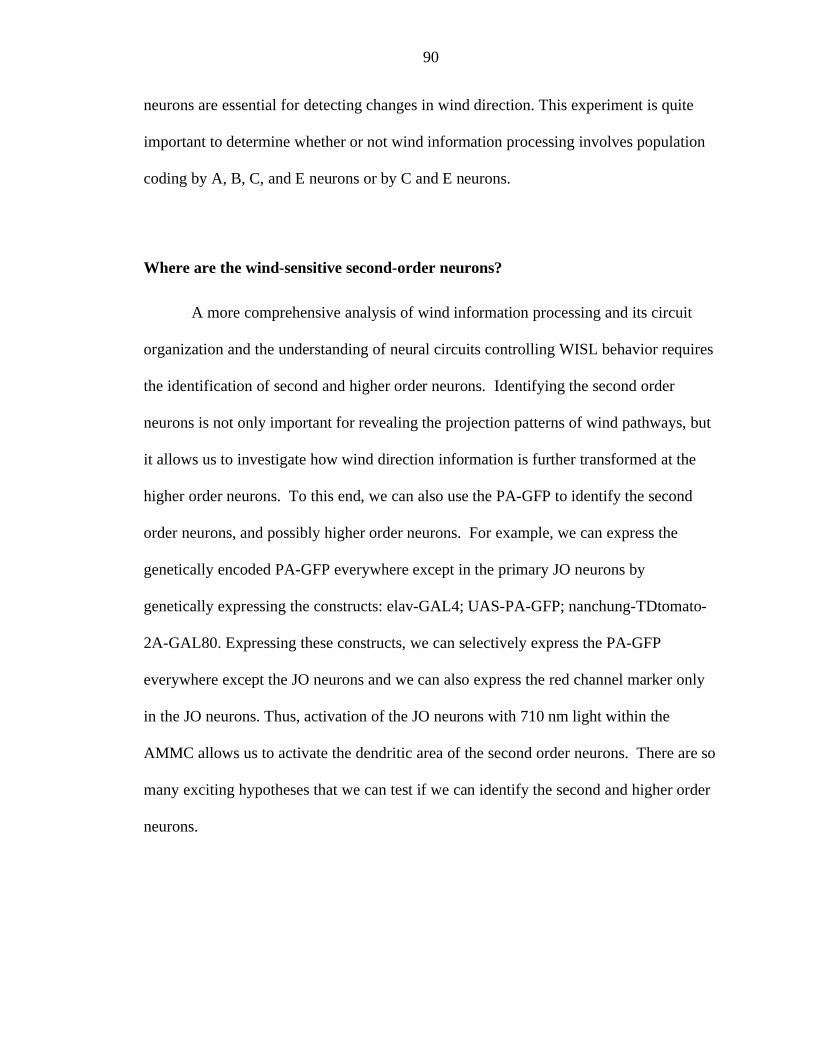
90
neurons are essential for detecting changes in wind direction. This experiment is quite
important to determine whether or not wind information processing involves population
coding by A, B, C, and E neurons or by C and E neurons.
Where are the wind-sensitive second-order neurons?
A more comprehensive analysis of wind information processing and its circuit
organization and the understanding of neural circuits controlling WISL behavior requires
the identification of second and higher order neurons. Identifying the second order
neurons is not only important for revealing the projection patterns of wind pathways, but
it allows us to investigate how wind direction information is further transformed at the
higher order neurons. To this end, we can also use the PA-GFP to identify the second
order neurons, and possibly higher order neurons. For example, we can express the
genetically encoded PA-GFP everywhere except in the primary JO neurons by
genetically expressing the constructs: elav-GAL4; UAS-PA-GFP; nanchung-TDtomato-
2A-GAL80. Expressing these constructs, we can selectively express the PA-GFP
everywhere except the JO neurons and we can also express the red channel marker only
in the JO neurons. Thus, activation of the JO neurons with 710 nm light within the
AMMC allows us to activate the dendritic area of the second order neurons. There are so
many exciting hypotheses that we can test if we can identify the second and higher order
neurons.
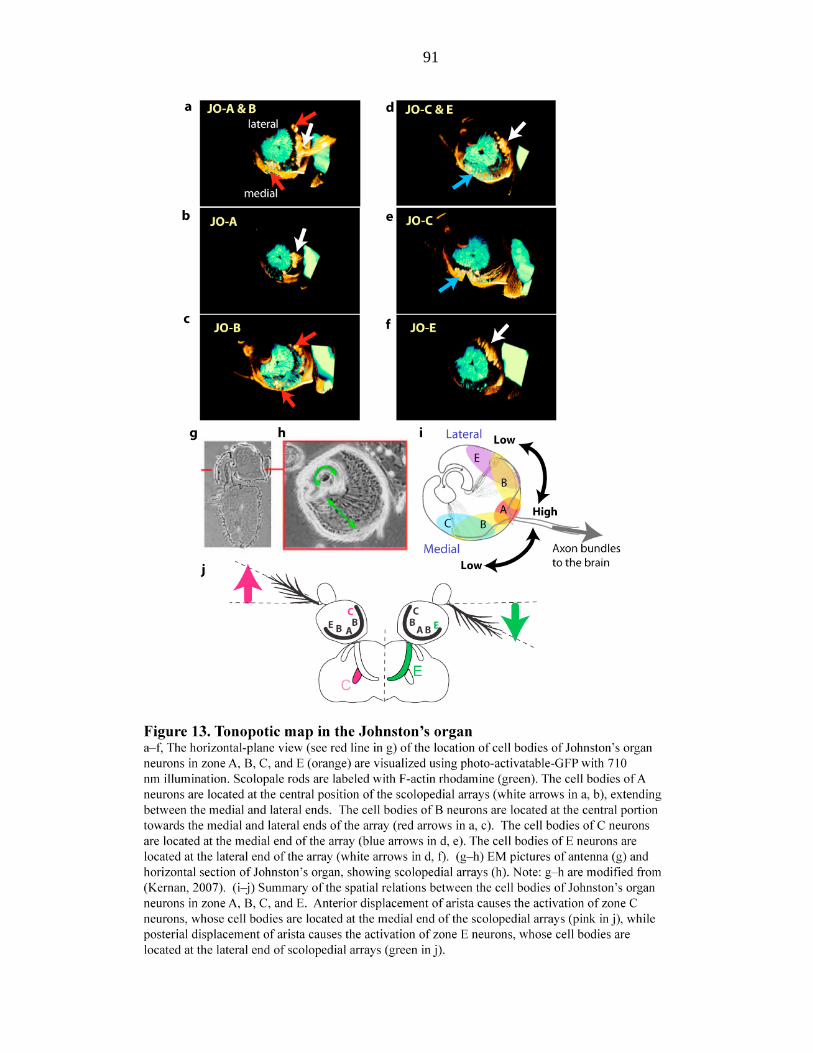
91
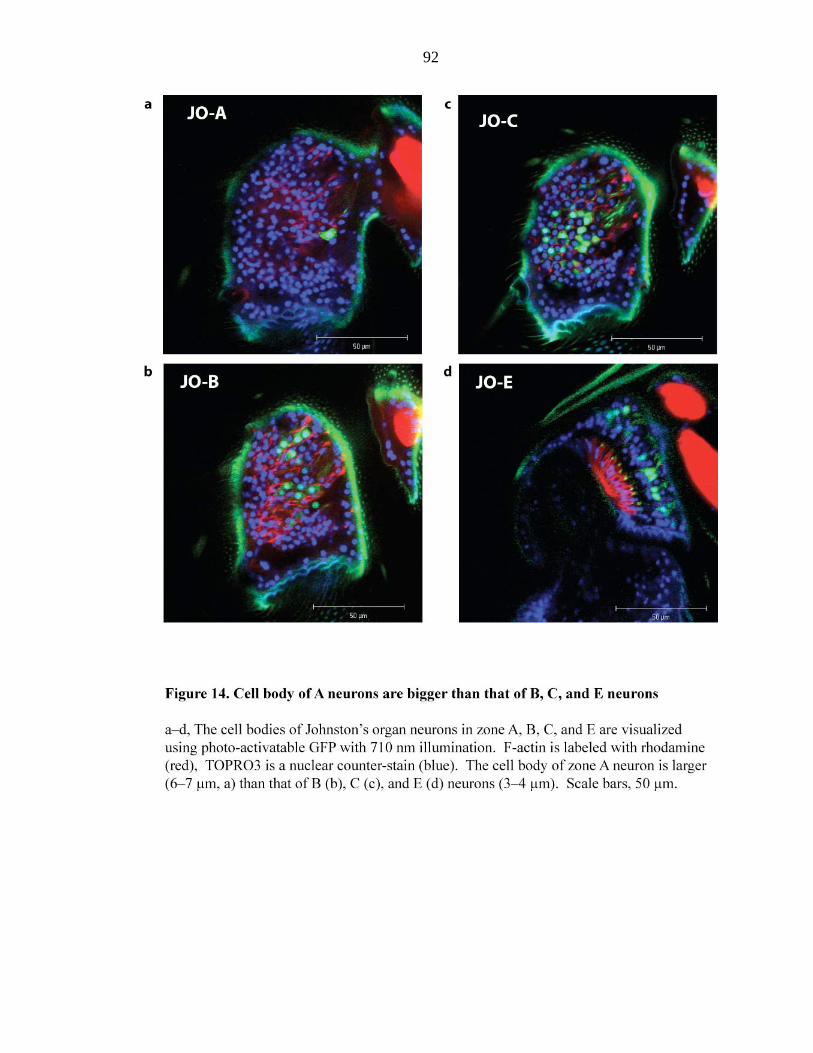
92
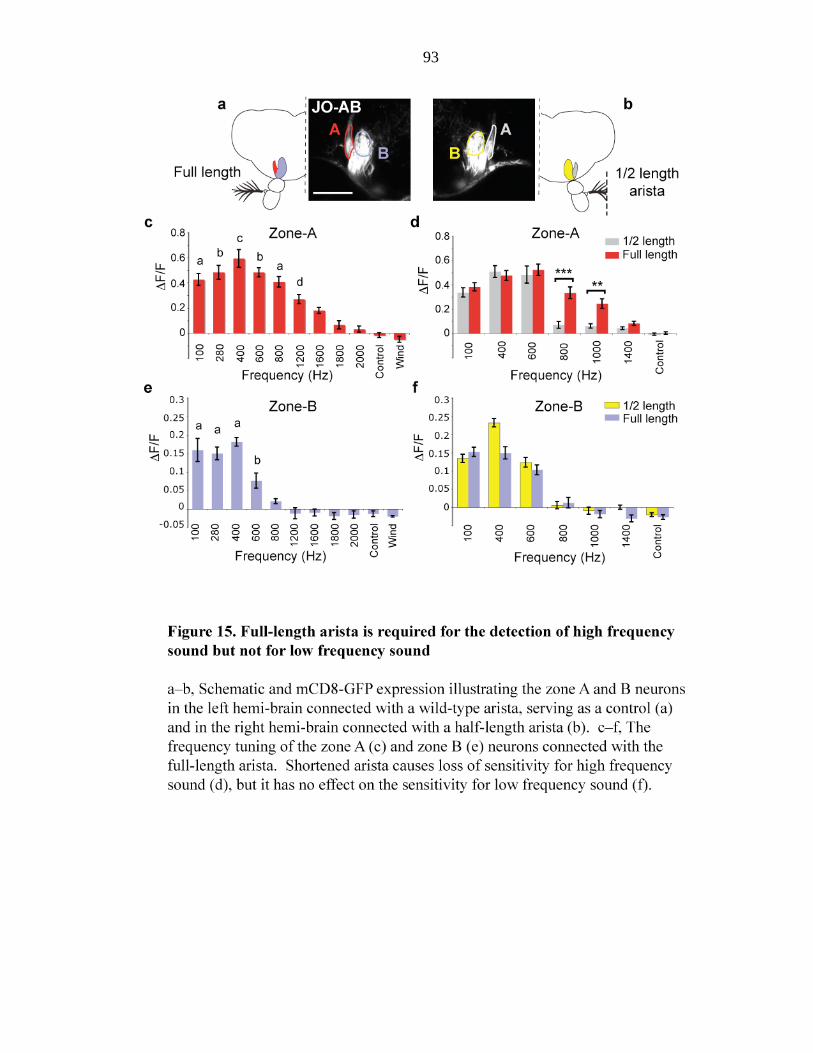
93
94
REFERENCES
Budick, S. A., Reiser, M. B., and Dickinson, M. H. (2007). The role of visual and
mechanosensory cues in structuring forward flight in Drosophila melanogaster. J Exp
Biol 210, 4092-4103.
Dallos, P. (2008). Cochlear amplification, outer hair cells and prestin. Curr Opin
Neurobiol 18, 370-376.
Datta, S. R., Vasconcelos, M. L., Ruta, V., Luo, S., Wong, A., Demir, E., Flores, J.,
Balonze, K., Dickson, B. J., and Axel, R. (2008). The Drosophila pheromone cVA
activates a sexually dimorphic neural circuit. Nature 452, 473-477.
Fettiplace, R., and Hackney, C. M. (2006). The sensory and motor roles of auditory hair
cells. Nat Rev Neurosci 7, 19-29.
Gopfert, M. C., Albert, J. T., Nadrowski, B., and Kamikouchi, A. (2006). Specification of
auditory sensitivity by Drosophila TRP channels. Nat Neurosci 9, 999-1000.
Hennig, R. M., Franz, A., and Stumpner, A. (2004). Processing of auditory information in
insects. Microsc Res Tech 63, 351-374.
Holley, M. C., and Ashmore, J. F. (1988). On the mechanism of a high-frequency force
generator in outer hair cells isolated from the guinea pig cochlea. Proc R Soc Lond B
Biol Sci 232, 413-429.
Hudspeth, A. J. (2008). Making an effort to listen: mechanical amplification in the ear.
Neuron 59, 530-545.
Kamikouchi, A., Inagaki, H. K., Effertz, T., Hendrich, O., Fiala, A., Gopfert, M. C., and
Ito, K. (2009). The neural basis of Drosophila gravity-sensing and hearing. Nature 458,
165-171.
Mason, A. C., and Faure, P. A. (2004). The physiology of insect auditory afferents.
Microsc Res Tech 63, 338-350.
Moller, A. R. (2003). Sensory systems: anatomy and physiology: Academic Press).
Nadrowski, B., Albert, J. T., and Gopfert, M. C. (2008). Transducer-based force
generation explains active process in Drosophila hearing. Curr Biol 18, 1365-1372.
Nadrowski, B., and Gopfert, M. C. (2009). Level-dependent auditory tuning: Transducer-
based active processes in hearing and best-frequency shifts. Commun Integr Biol 2, 7-10.
Stolting, H., and Stumpner, A. (1998). Tonotopic organization of auditory receptors of
the bushcricket Pholidoptera griseoaptera (Tettigoniidae, decticinae). Cell Tissue Res
294, 377-386.
95
Appendix
Distinct sensory representations of wind and near-field sound
in the Drosophila brain
Suzuko Yorozu, Allan Wong, Brian J. Fischer, Heiko Dankert,
Maurice J. Kernan, Azusa Kamikouchi, Kei Ito, and David J. Anderson
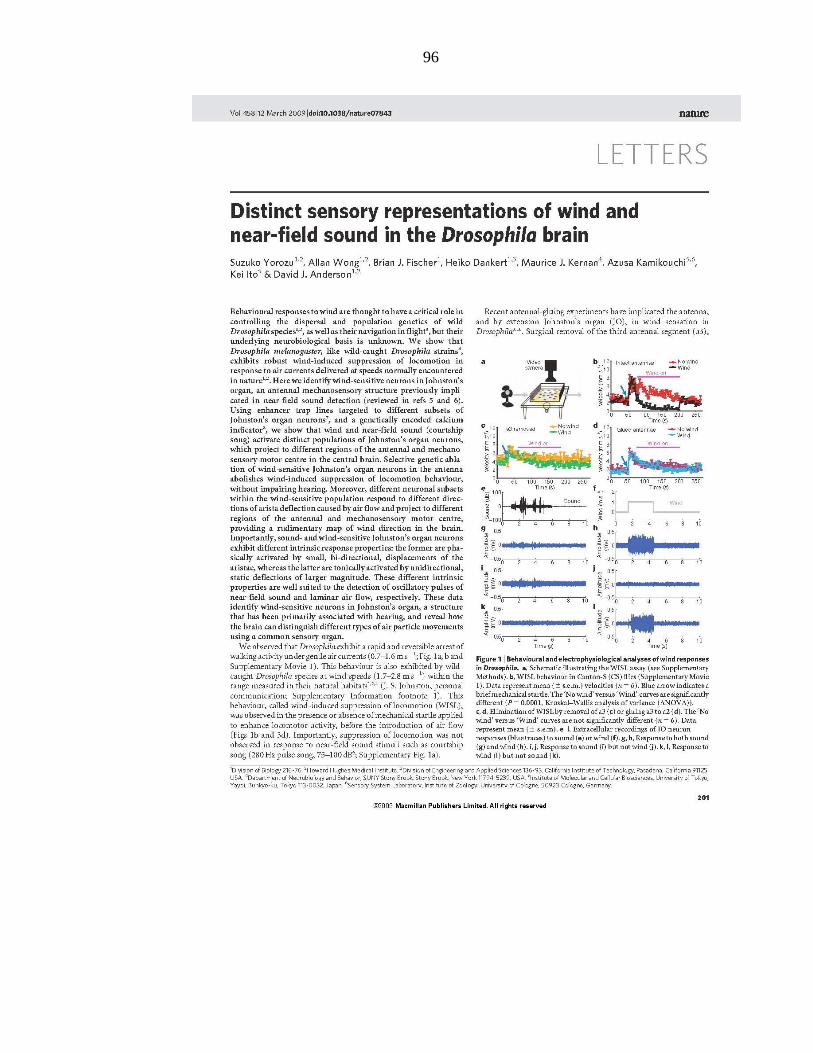
96
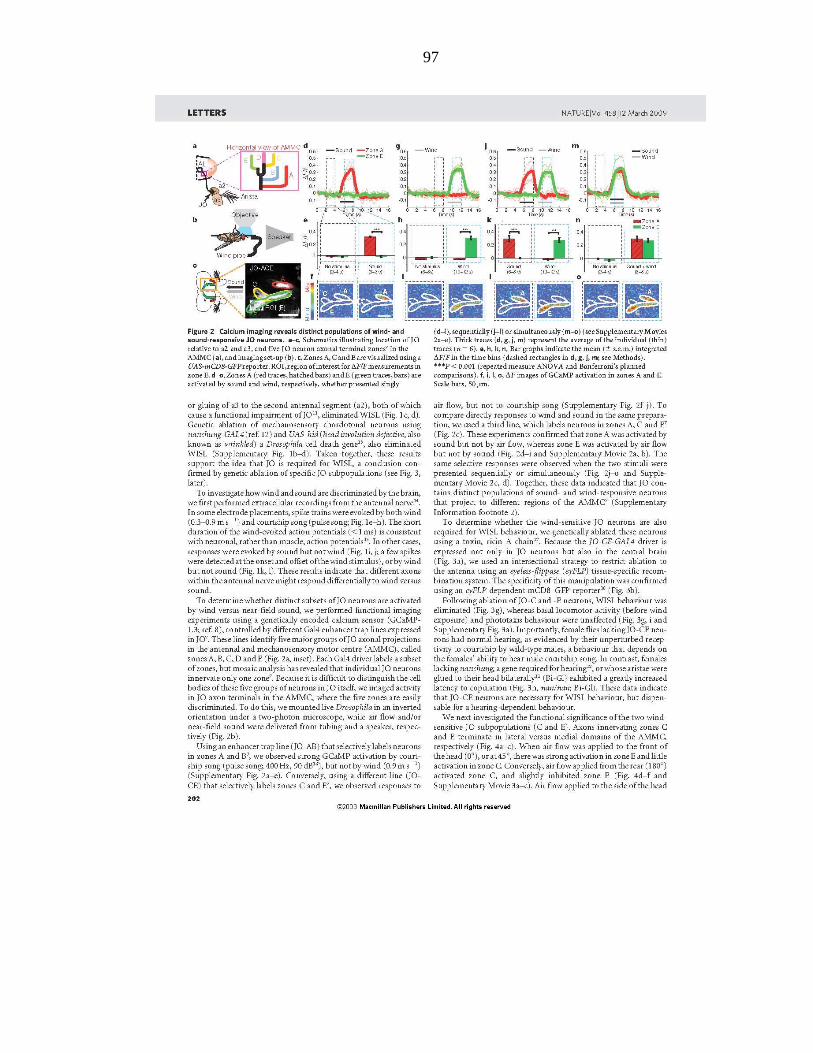
97
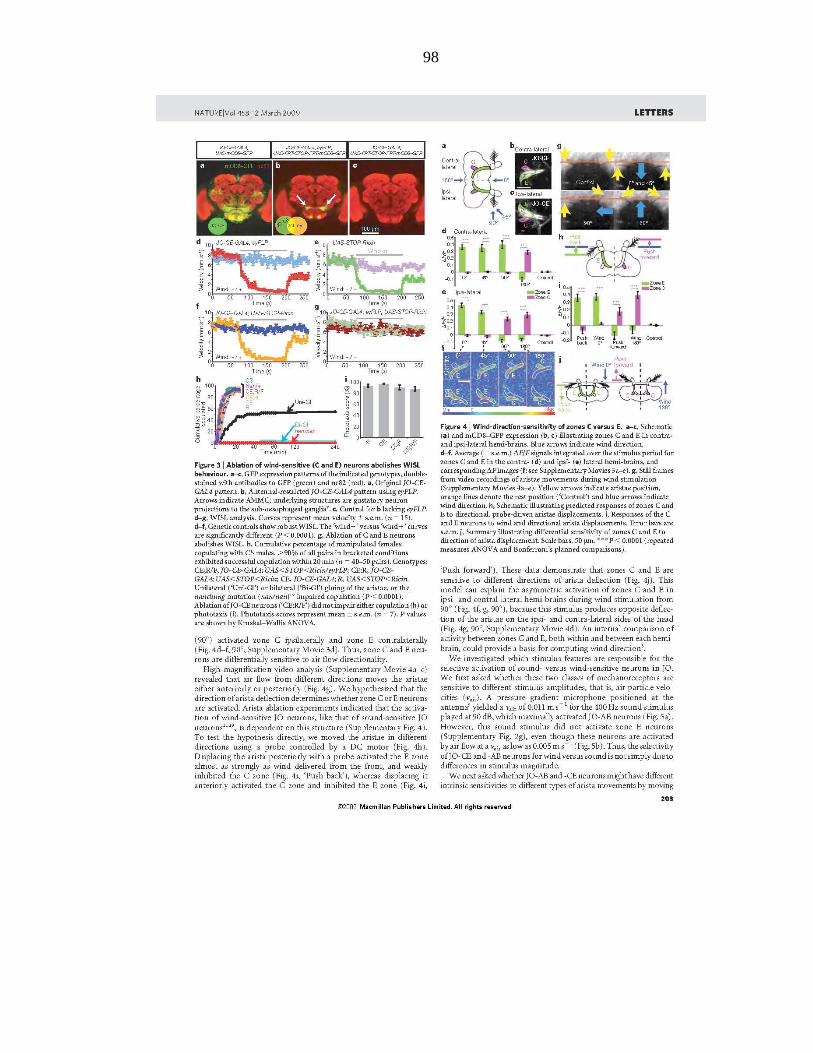
98
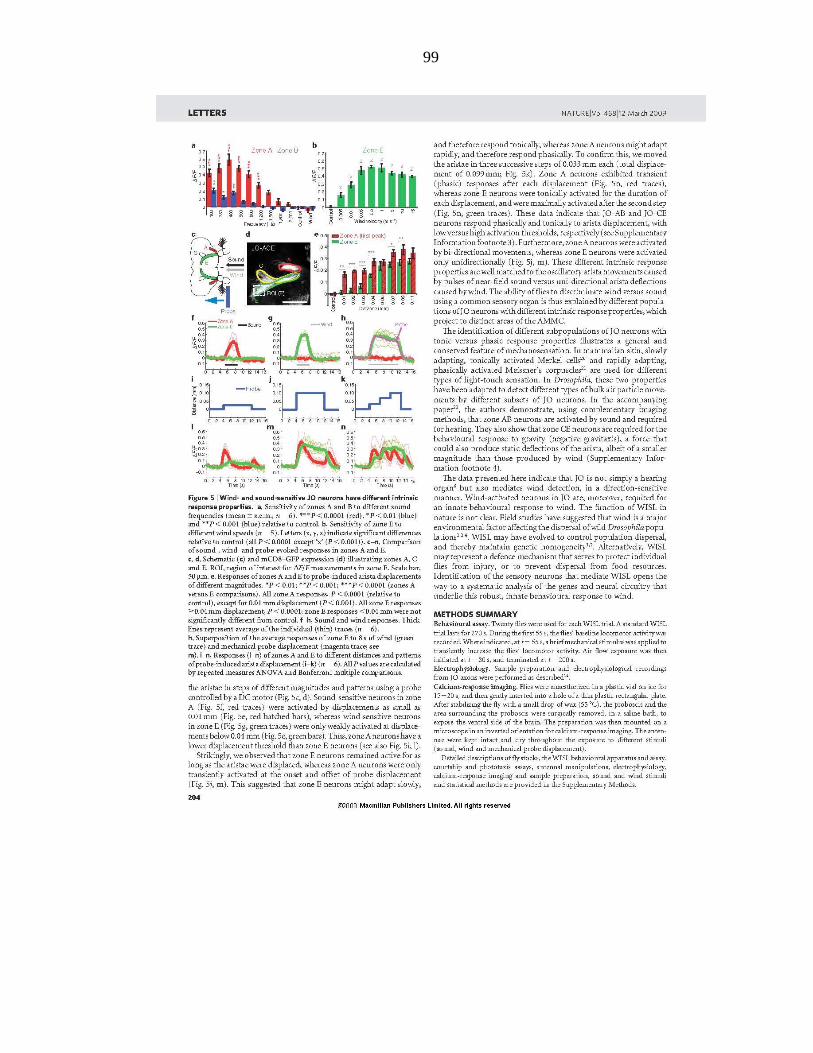
99
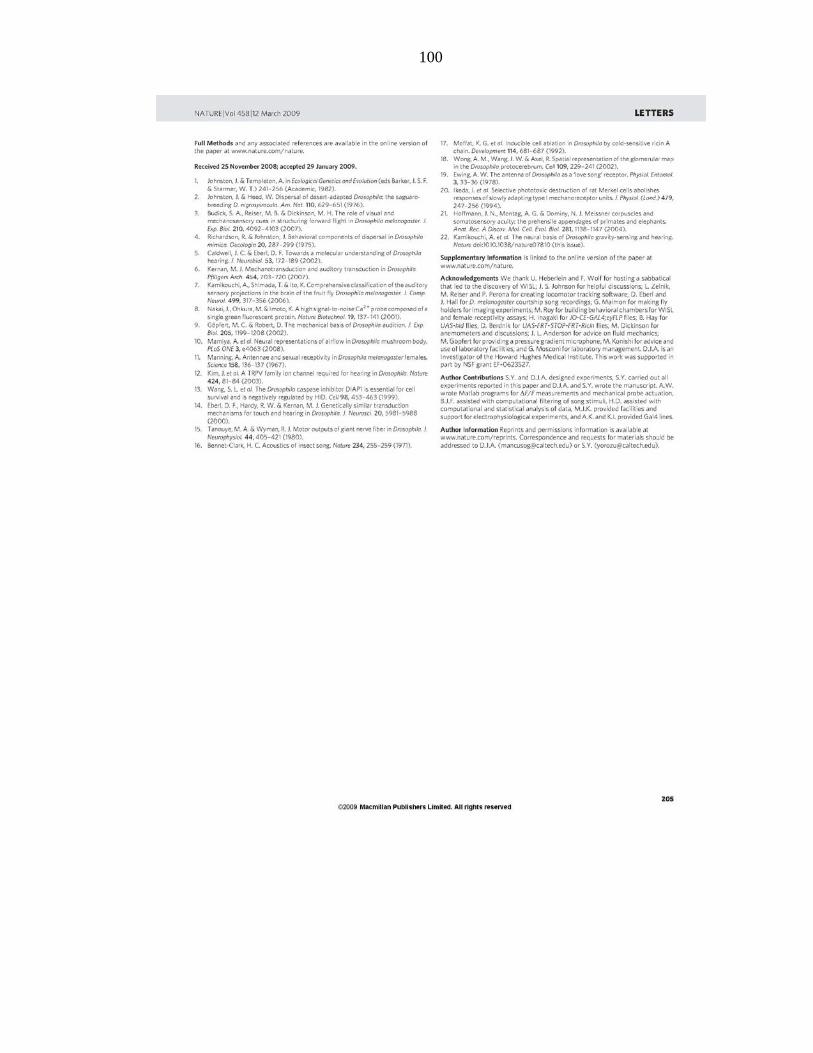
100
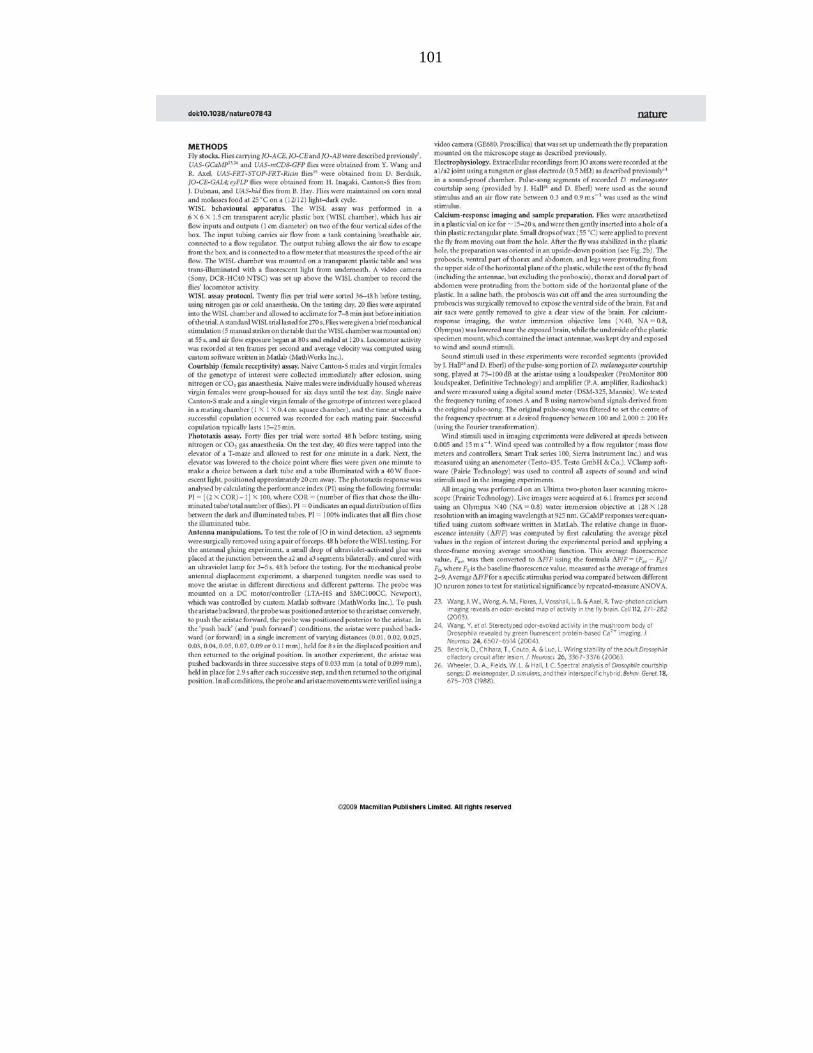
101
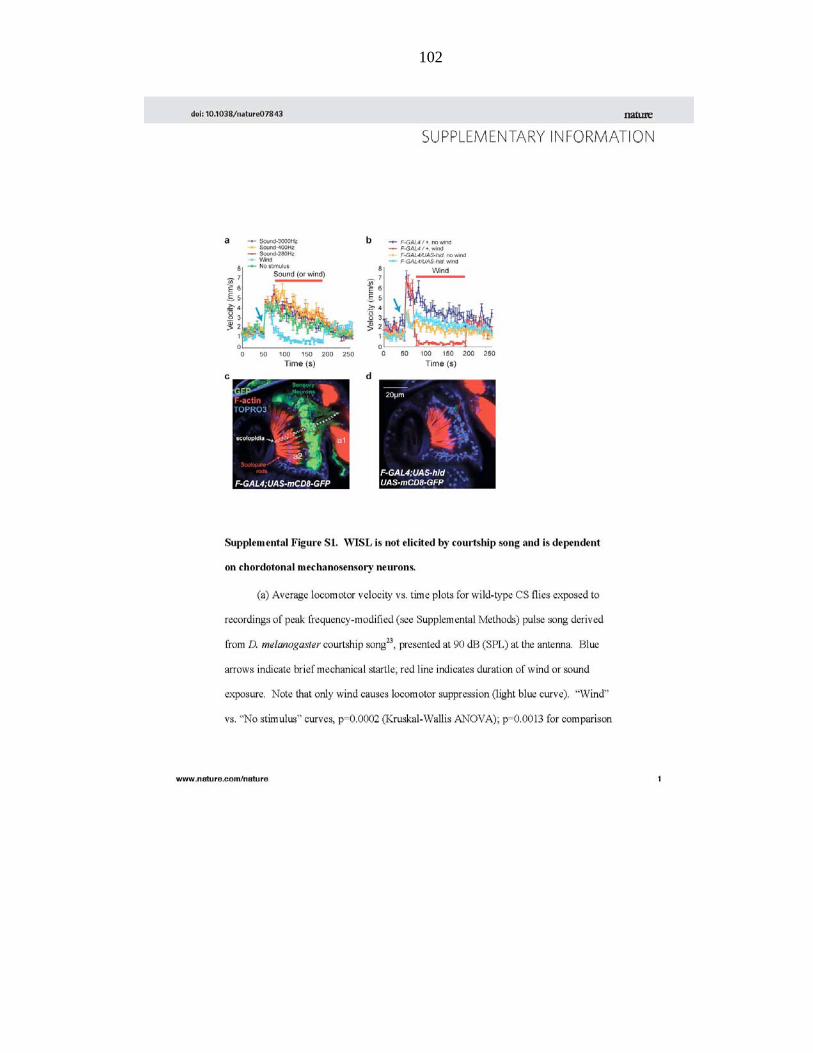
102
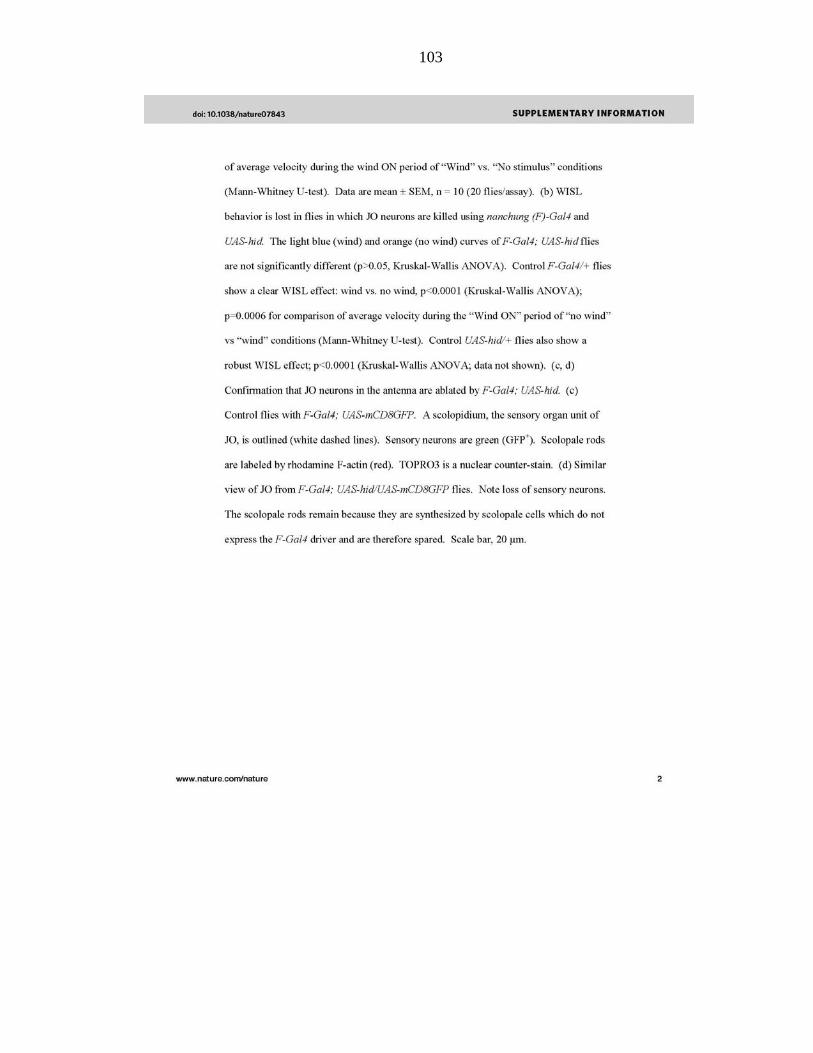
103
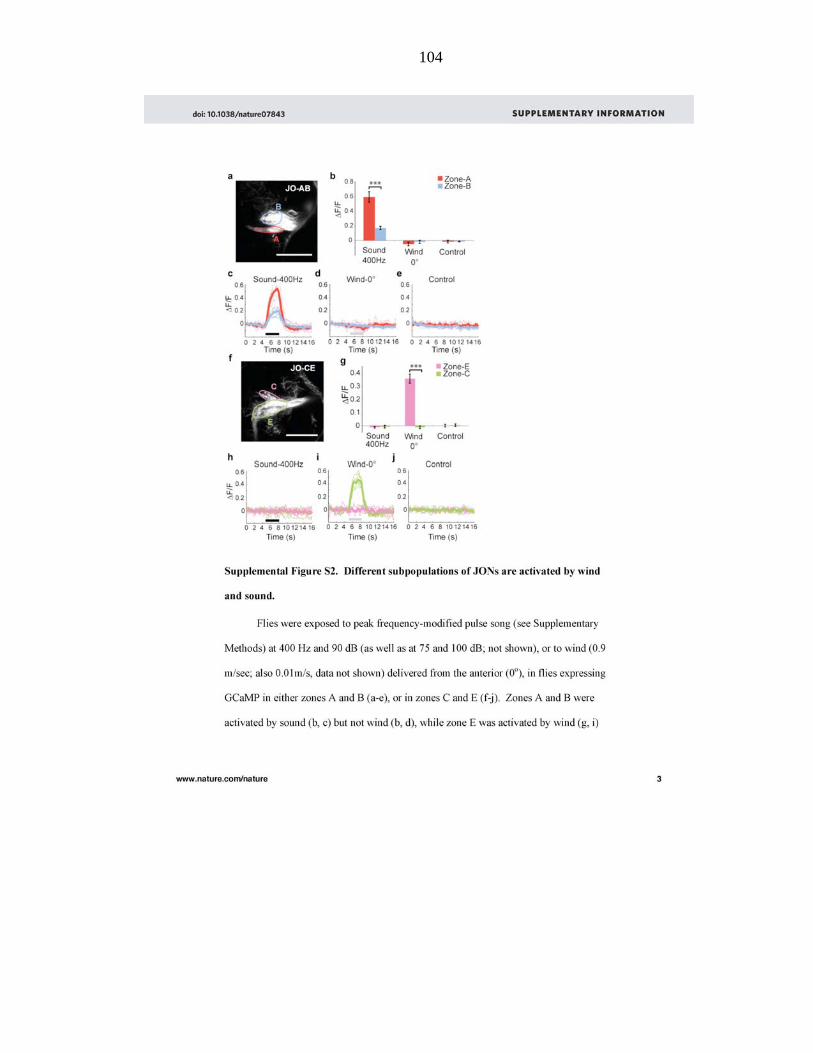
104
105
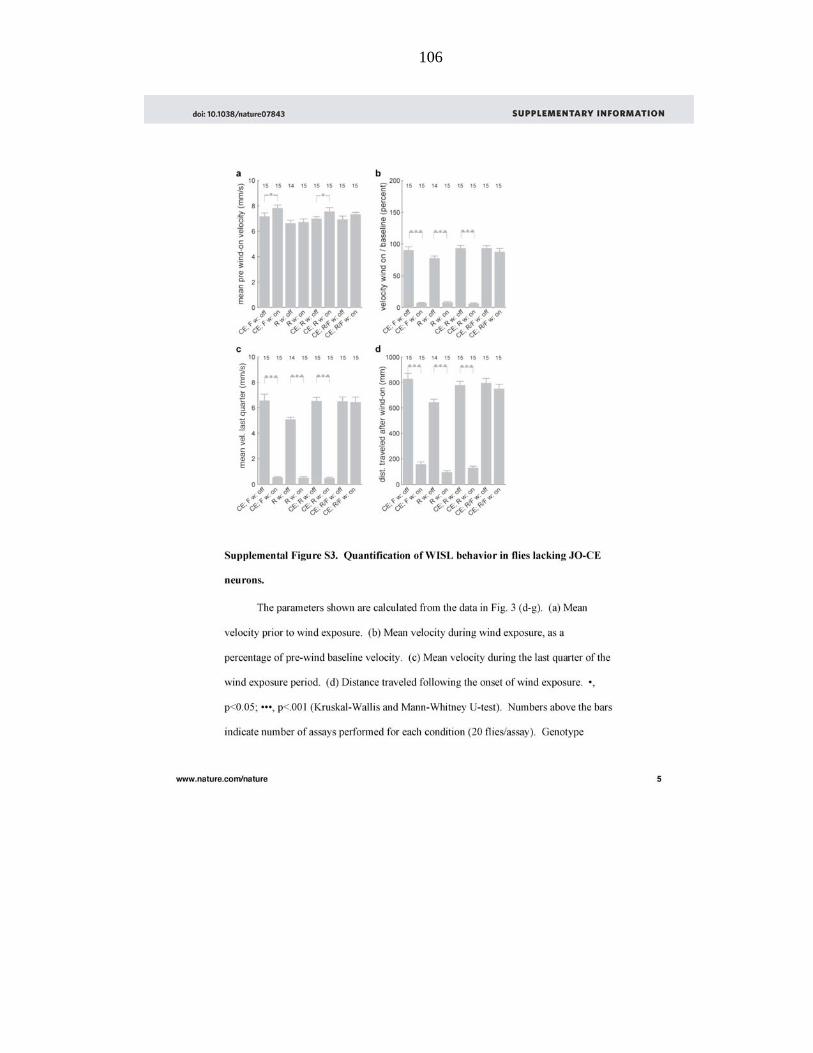
106
107
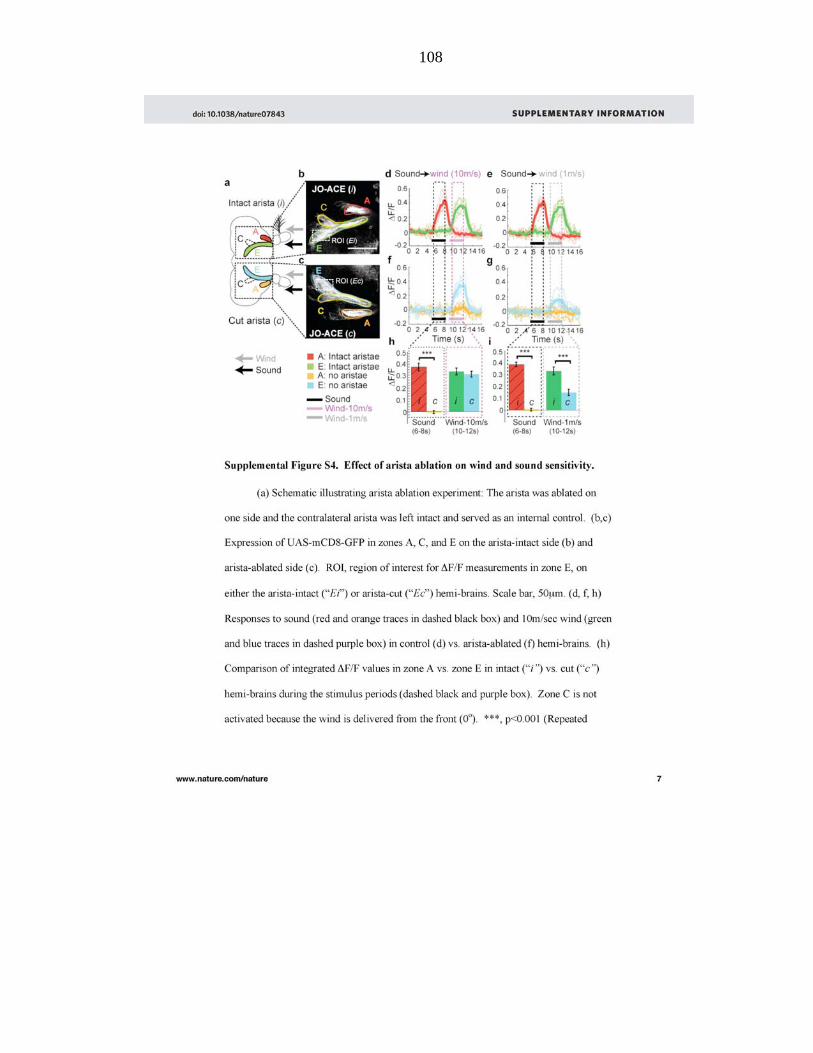
108
109
110

111
112
113
114
115
116