distracted investors and earnings management 1...distracted investors and earnings management 1...
TRANSCRIPT

Electronic copy available at: https://ssrn.com/abstract=3023754
1
Distracted Investors and Earnings Management 1
ALEXANDRE GAREL, Auckland University of Technology and Labex ReFi
JOSE MARTIN-FLORES, ESCP Europe and Labex ReFi
ARTHUR PETIT-ROMEC, Université Côte d'Azur–SKEMA Business School and Labex ReFi
AYESHA SCOTT, Auckland University of Technology
Draft version: 22/08/2017
ABSTRACT
In this study, we examine whether investor distraction affects earnings management. We use a
firm-level measure of investor distraction that captures times when institutional investors shift
their attention to unrelated parts of their portfolios. Distracted investors temporarily loosen their
monitoring intensity and managers may take advantage. Our main finding is that, when
shareholders are distracted, managers engage more in earnings management by both
manipulating accruals and real activities. Due to the exogenous nature of the measure of
investor distraction, we argue that this association is causal. We further document that the
presence of other monitoring forces such as analyst coverage and leverage diminishes the effect
of investor distraction on earnings management.
Key words: distracted investors, earnings management, accruals, real earnings management
1 We are grateful for the constructive insights of Franck Bancel, Thomas Bourveau, Rüdiger Fahlenbrach, Bart
Frijns, Alberto Manconi, Christophe Moussu, Alireza Tourani-Rad, and seminar participants at Auckland
University of Technology, ESCP Europe, Labex ReFi, and SKEMA Business School. We are grateful to Alberto
Manconi for sharing his measure of investor distraction. Jose Martin-Flores acknowledges his time spent at
Laboratory of Excellence on Financial Regulation (Labex ReFi) supported by PRES heSam under the reference
ANR-10-LABX-0095.
Electronic copy available at: https://ssrn.com/abstract=3023754
2
1. Introduction
The objective of this paper is to examine how investor attention influences earnings
management decisions. Attention is generally considered to be a resource in limited supply
(e.g., Kahneman 1973; Baker, and Wurgler 2011). Institutional investors, who often hold a
portfolio of hundreds or thousands of stocks, are subject to attention constraints. They cannot
equally focus on all stocks they hold at a given point in time. Investors are thus prevented from
monitoring all their portfolio firms with the same intensity simultaneously (Kempf, Manconi,
and Spalt 2017). The implication of these attention constraints is that institutional investors may
become “distracted” shareholders at certain points in time. While “distracted”, they provide less
than the optimal level of monitoring intensity. We investigate whether managers react to the
temporary loosening of monitoring scrutiny, induced by investor distraction, by altering their
earnings management decisions2.
Accounting research documents that managers generally use two channels to inflate
earnings and misrepresent the firm’s financial information (Dechow, Ge, and Schrand 2010).
First, a manager may manage accruals (e.g., Healy 1985; Jones 1991; Dechow, Sloan, and
Sweeney 1995; Kothari, Leone, and Wasley 2005). She can borrow earnings from future
periods, through the acceleration of revenues or deceleration of expenses, in order to improve
current earnings. Second, a manager can manipulate real activities to increase earnings (e.g.,
Bushee 1998; Roychowdhury 2006; Mizik, and Jacobson 2007; Cohen, and Zarowin 2010).
She can use price discounts to temporary increase sales, overproduction to report lower cost of
goods sold, and reduction of discretionary expenditures to improve reported margins.
Importantly, earnings management can be difficult for investors to detect in the short run
2 The earnings management setting is particularly well suited to investigate the impact of shareholder distraction
on corporate actions because we can match the time-variation in earnings management decisions to the time-
variation in the level of distraction of a firm’s shareholders.
Electronic copy available at: https://ssrn.com/abstract=3023754
3
(Kothari et al., 2015) and may have negative consequences on firms’ long-run performance
(e.g., Teoh, Welch, and Wong 1998; Mizik et al. 2007; Bhojraj et al. 2009; Gunny 2010; Li
2010; Cohen et al. 2010; Kim, and Sohn 2013; Kothari, Mizik, and Roychowdhury 2015).
Shareholders therefore have an incentive to prevent management from manipulating earnings.
How does investor distraction influence earnings management? A first possibility is that
the temporarily looser monitoring induced by distracted investors does not alter managers’
earnings management decisions. Additional attention provided by “undistracted” shareholders
could substitute for the lack of attention of distracted shareholders. A second possibility is that
managers in firms with distracted investors engage less in earnings management. This scenario
may occur if, because of investor distraction, managers feel released from the pressure to report
good performance and perceive reduced costs attached to reporting bad or lower than expected
performance. A third possibility is that managers in firms with distracted investors engage more
in earnings management. In this case, the temporary looser monitoring, induced by investor
distraction, makes earnings management more difficult to detect. If so, managers would have
more latitude to inflate reported earnings by manipulating accruals and real activities.
Using a sample of 10,471 firm-year observations from 1995 to 2010, we analyze the
empirical relationship between investor distraction and earnings management under the forms
of discretionary accruals and real earnings management. To calculate discretionary accruals,
we use the model developed in Kothari et al. (2005). To capture the manipulation of real
activities, we follow Roychowdhury (2006) and focus on earnings management by
manipulating sales, engaging in overproduction and cutting discretionary expenses. An
important issue in our empirical analysis is that distraction cannot be directly observed. We thus
follow Kempf et al. (2017), and use a firm-level measure of investor distraction. We use
exogenous shocks to unrelated industries held by a given firm’s institutional shareholders to
4
mark periods where shareholders are likely to shift attention away from the firm towards the
part of their portfolio subject to the shock3. Kempf et al. (2017) confirm that this proxy does
measure lack of investor attention. In particular, they show that when this proxy indicates a
high level of investor distraction, investors are less likely to participate in conference calls and
less likely to initiate a proposal in general meetings. In our empirical analysis, we examine how
this measure of shareholder distraction affects earnings management decisions.4
Our main finding is that when shareholders are distracted, managers engage more in
earnings management both by manipulating accruals and by manipulating real activities. The
effect of investor distraction on earnings management is more significant for discretionary
accruals. Our results are robust to the introduction of standard determinants of earnings
management (size, leverage, book-to-market ratio, profitability, asset growth, volatility,
momentum, analyst coverage, institutional ownership as well as year, industry and firm fixed
effects). Moreover, we argue that the effect of investor distraction on earnings management is
causal. This is because, by construction, the distraction measure we use captures shifts in
investor attention due to shocks in unrelated industries, as discussed by Kempf et al. (2017). It
therefore constitutes an exogenous change in monitoring intensity at the firm level.
The positive association between investor distraction and earnings management
indicates that the looser monitoring induced by distracted investors is not fully compensated for
3 Institutional investors own the great majority of U.S. firms and existing evidence suggests that they are powerful
shareholders that exert significant influence over managers (Froot, Scharfstein, and Stein 1992; Hartzell, and
Starks 2003; Parrino, Sias, and Starks 2003; Graham, Harvey, and Rajgopal 2005; McCahery, Sautner, and Starks
2016). An important feature about U.S. institutional investors is that they are required by the SEC to periodically
report their portfolio holdings. One can therefore observe the pool of institutional shareholders for each firm, and
know for each institutional investor which other stocks they concurrently hold. This enables us to capture shifts in
investor attention by looking at shareholders’ portfolios. 4 A more detailed description of the measure of distraction is provided in the methodology section. Intuitively, at
the firm level, the distraction measure is a function of something distracting going on in another industry and of
how much the firm’s institutional investors are exposed to this industry (i.e., the weight of the industry in the
investor’s portfolio). The measure is then weighted across all the firm’s institutional investors, where the weight
captures how potentially important the investor is as a monitor of the firm (i.e., its ownership percentage and the
fraction of the portfolio value invested in the firm).

5
by other investors. However, we expect the effect of investor distraction on earnings
management to be less pronounced in firms where other monitoring forces are at play. Two
potential sources of monitoring that may compensate for investor distraction are analyst
coverage and financial leverage. Analysts are external monitors of managerial decisions
(Jensen, and Meckling 1976; Healy, and Palepu 2001). With substantial training in finance,
accounting and good industry background knowledge, analysts track corporate financial
statements on a regular basis. Previous research shows that analyst coverage deters earnings
manipulations (e.g., Yu 2008; Degeorge et al. 2013). Next to analyst coverage, financial
leverage is a strong disciplinary tool to reduce managerial discretion and flexibility (Jensen
1986). Previous research shows that leverage is negatively associated with earnings
management (e.g., Jelinek 2007; Nikolaev 2010).
We test whether the influence of investor distraction on earnings management is
mitigated by analyst coverage or financial leverage. We focus on the manipulation of accruals,
because the effect of investor distraction is more significant for this type of earnings
management. Our empirical analysis shows that the interaction terms between investor
distraction and analyst coverage and between investor distraction and financial leverage both
have a significant negative effect on earnings management. These findings are consistent with
the idea that, in presence of other monitoring forces, managers are less able to take advantage
of the loosening in institutional investor monitoring to manage earnings.
Our paper contributes to the literature on the links between institutional ownership and
earnings management. Previous research documents that institutional investors, in particular
those with large holdings and longer investment horizons, monitor managers and deter earnings
management (e.g., Bushee 1998; Chung, Firth, and Kim 2002; Roychowdhury 2006; Koh
2007). In this paper, we introduce the possibility that monitoring intensity of institutional

6
investors may vary over time. We argue that institutional investors cannot simultaneously
monitor all firms with the same intensity and that it may affect earnings management practices.
Our results suggest that what matters to deter earnings management is not only the level of
institutional ownership but also the monitoring intensity exerted by institutional investors.
More generally, our study extends recent literature uncovering new factors that influence
earnings management. For instance, recent studies show that leader’s reported performance
(Bratten, Payne, and Thomas 2015), internal governance (Ali, and Zhang 2015), performance
commitments (Hou et al. 2015), short selling (Fang, Huang, and Karpoff 2016) and severance
pay (Brown 2015) influences earnings management practices. We identify investor distraction
as a new determinant of earnings management.
Our study finally relates to recent literature investigating the impact of investor distraction
on corporate actions. Kempf et al. (2017) show that, when shareholders are distracted, managers
announce and make more diversifying, value-destroying acquisitions. Shareholder distraction
induces managers to invest less in CSR activities and weakens board oversight (Chen, Dong,
and Lin 2016; Liu et al. 2017). In a related stream of the literature, DellaVigna, and Pollet
(2009) and Hirshleifer, Lim, and Teoh (2009) link market underreaction to earnings
announcements to the limited attention of investors. Despite a growing number of studies on
the impact of attention constraints in the economics and finance literature, to date investor
distraction is largely unexplored by the accounting literature. Our paper furthers this literature
by relating investor distraction to earnings management, which represents an important
corporate decision that has consequences for long-term value creation.
The paper proceeds as follows. Section 2 provides the background literature necessary to
develop our hypotheses. Section 3 describes our data and methodology, with results and
discussion contained in Section 4. Section 5 concludes.

7
2. Related literature and hypothesis development
Earnings management
Several studies analyze the forms and consequences of earnings management.5 Dechow et
al. (2010) find managers generally inflate earnings and misrepresent the firm’s financial
information either by manipulating accruals or by manipulating real activities. Importantly,
both may have negative consequences for a firm’s long-term performance. Earnings
management degrades the information quality of earnings used by outside investors, leading to
a higher cost of capital to finance new projects (e.g., Kim et al. 2013). Additionally, earnings
management negatively impacts future earnings and stock returns.
In the case of accruals management, borrowing earnings from future periods generates a
future loss. Teoh et al. (1998) provides evidence that issuers with unusually high accruals in the
IPO year experience poor stock return performance in the three years thereafter. For real
earnings management, escalated sales are likely to disappear once the firm reverts to old prices,
overproduction creates less sustainable earnings and leads to excessive inventory, cuts in
discretionary advertising expenses are likely to lower future sales, and cuts in discretionary
R&D or employee training can hurt a firm’s competitive edge over the longer term. A series of
papers document the negative influence of real earnings management on firm future
performance. For example, Bhojraj et al. (2009) examine the performance consequences of
cutting discretionary expenditures and managing accruals to exceed analyst forecasts. They
show that firms that narrowly beat analyst forecasts with low quality earnings exhibit a short-
term stock price benefit relative to firms that miss forecasts with high quality earnings, however
they show that this trend reverses over a 3-year horizon. Similarly, Kothari et al. (2015) and
Cohen et al. (2010) link post-SEO stock-market underperformance to manipulation of real
5 See for example Healy 1985; Jones 1991; Dechow et al. 1995; Kothari et al. 2005; Bushee 1998; Roychowdhury
2006; Mizik and Jacobson 2007; Cohen and Zarowin 2010; Baber et al. 1991.

8
activities, and Gunny (2010) finds that real earnings management negatively impact future
operating performance. Further, Mizik et al. (2007) focus on marketing activities and show that
firms cutting marketing spending have significantly lower long-term post-SEO performance.
Focusing on production costs, Li (2010) documents that stocks of firms with abnormally high
levels of production costs underperform in the subsequent three years.
It is often difficult for investors to detect earnings management in the short-run (Kothari et
al. 2015). This implies that a strong and continuous monitoring from investors is required to
prevent managers from engaging in earnings management.
Institutional investors and monitoring
Institutional ownership has sharply increased over the last decades. Today, institutional
investors own the great majority of U.S. firms and represent the most economically influential
group of shareholders. As of 2012, U.S. institutional investors hold more than 70% of the
aggregate market value of all NYSE/AMEX/NASDAQ stocks (Kempf et al. 2017). Existing
evidence suggests that they exert significant power over managers and influence firms’
decisions (e.g., Froot et al. 1992; Parrino et al. 2003; Hartzell et al. 2003; Graham et al. 2005;
McCahery et al. 2016) and, in particular those institutional investors with large holdings and
long-term investment horizon, monitor managers and deter earnings management (e.g., Bushee
1998; Chung et al. 2002; Roychowdhury 2006; Koh 2007). This group of investors monitor
firms to ensure that managers maximize long-term shareholder value (e.g., Shleifer, and Vishny
1986; Maug 1998) and take action when they are not satisfied with management. They either
intervene in the firm (“voice”) or sell their shares (“exit”), or threaten to do so (e.g., Admati,
and Pfleiderer 2009; Edmans 2009; Edmans, Fang, and Zur 2013). However, institutional
investors do not monitor every firm with the same intensity. Among other factors, the intensity
9
with which an institutional investor monitors a firm depends on its stakes in that firm (Edmans,
and Holderness 2016) and on the firm’s weight in its portfolio (Fich, Harford, and Tran 2015).
In this paper, we introduce the possibility that the monitoring intensity of institutional
investors may vary over time. Monitoring capacity is a scarce resource that can temporarily
lead investors to supply less than optimal monitoring intensity. The idea that an institutional
investor’s attention is a resource in limited supply is grounded in behavioral psychology (e.g.,
Kahneman 1973; Baker et al. 2011)6 and backed by survey evidence reporting that time and
staffing considerations are the main impediment to investors’ engagement with corporations
(Goldstein 2011). Put simply, institutional investors are subject to attention constraints and
therefore they are unable to monitor all firms they hold simultaneously. As a result, investors
are likely to become distracted at certain points in time, as they focus their attention on a
particular component of their portfolio (Kempf et al. 2017).
Hypothesis development
Earnings management has important consequences for long-run value creation and thus it
is necessary to understand the factors that favor or deter it. We examine how shareholder
distraction influences earnings management. We propose three possible scenarios regarding the
potential impact of investor distraction on earnings management. The empirical analysis
examines which one prevails.
The first possibility is that the temporarily looser monitoring induced by “distracted”
investors does not alter managers’ earnings management decisions (Hypothesis 1). In this
instance, additional attention of those shareholders who are “undistracted” may substitute for
6 Experimental laboratory evidence shows that limited attention affects how both naïve and sophisticated
individual investors, as well as finance professionals, interpret accounting data (see the review of Libby,
Bloomfield, and Nelson (2002)).

10
the lack of attention of distracted shareholders. Alternatively, one could argue that managers
may not notice investor distraction and thus do not respond to it. However, survey evidence
suggests that managers generally know who their key shareholders are and interact frequently
with them directly or through Investor Relations departments (e.g., Froot et al. 1992; Parrino et
al. 2003; Hartzell et al. 2003; Graham et al. 2005; McCahery et al. 2016). In addition, Kempf
et al. (2017) show that, when a firm’s investors are distracted, they are less likely to participate
in conference calls and less likely to initiate a proposal in general meetings. These findings
suggest that, through investor inaction, shareholder distraction should be relatively easy to
detect for managers.
HYPOTHESIS 1. There is no association between investor distraction and earnings
management
The second possible scenario is that managers in firms with “distracted” investors engage
less in earnings management (Hypothesis 2). When shareholders are distracted, managers may
feel released from the pressure to report good performance and perceive reduced costs attached
to reporting bad or lower than expected performance.
HYPOTHESIS 2. There is a negative association between investor distraction and
earnings management
The third possibility is that managers in firms with “distracted” investors engage more in
earnings management. The temporarily looser monitoring induced by “distracted” investors
implies that earnings management is more difficult to detect, which offers managers more
discretion to manage reported earnings and to misrepresent the firm’s financial information

11
(Kothari et al. 2015). Managers may therefore take advantage of shareholder distraction to
manage earnings in order to inflate short-term performance, at the detriment of firm long-term
performance.
HYPOTHESIS 3. There is a positive association between investor distraction and
earnings management
Hypothesis 3 predicts that the temporarily looser monitoring induced by distracted investors
promotes earnings management because it is not fully compensated for by undistracted
shareholders. However, we expect the effect of investor distraction on earnings management to
be less pronounced in firms where other monitoring forces are at play and partially compensate
for investor distraction. We focus on two other sources of monitoring, namely analyst coverage
(Hypothesis 3a) and financial leverage (Hypothesis 3b).
Analysts are external monitors of managerial decisions (Jensen et al. 1976; Healy et al.
2001). With substantial training in finance and accounting and good industry background
knowledge, analysts track corporate financial statements on a regular basis and deter earnings
manipulations. Empirically, Yu (2008) finds that firms followed by more analysts manage their
earnings less. Degeorge et al. (2013), using data from 21 countries, find that in countries with
high financial development, increased within-firm analyst coverage results in less earnings
management.
Next to analyst coverage, financial leverage is a strong disciplinary tool to reduce
managerial discretion and flexibility (Jensen 1986). Financial leverage constrains managers’
abilities to take decisions that do not maximize firm value in two ways. First, required debt
repayments reduce the cash available to management for non-optimal spending. Second, when
a firm employs debt financing, it undergoes the scrutiny of lenders. Previous research shows
12
that leverage is negatively associated with earnings management. Jelinek (2007) documents
that increased leverage is associated with a reduction in earnings management. Nikolaev (2010)
shows that debt contracts entail covenants constraining managerial opportunism and increase
the demand for timely recognition of economic losses in accounting earnings.
HYPOTHESIS 3a. The positive effect of investor distraction on earnings
management is less pronounced for firms with greater analyst coverage
HYPOTHESIS 3b. The positive effect of investor distraction on earnings
management is less pronounced for firms with greater financial leverage
3. Data and research design
Data sources
To perform our analysis, we collect data from four main databases. Accounting data are
from COMPUSTAT, market data from CRSP, data on analyst coverage are from I/B/E/S, and
institutional investor data are from Thomson Reuters 13F Filings. We obtain data on investor
distraction from Alberto Manconi. We require our sample firms to have available data from
these different data sources. We further restrict our sample to firms for which we can compute
our main dependent, independent, and control variables. We exclude financials as well as
utilities and firms that do not have data for at least five consecutive years. Because data for
investor distraction are only available until 2010, our sample ends in 2010. Our final sample
consists of 10,471 U.S. firm-year observations over the 1995-2010 period.
Measuring earnings management

13
Our main dependent variables are standard measures of earnings management capturing
either the manipulation of accruals or the manipulation of real activities. Based on a model
developed by Kothari et al. (2005), we calculate Discretionary Accruals as the residuals from
the following regression (industry subscripts omitted):
𝐴𝑐𝑐𝑟𝑢𝑎𝑙𝑠𝑖𝑡 = 𝛽0 + 𝛽1 (1
𝐴𝑆𝑆𝐸𝑇𝑆𝑖𝑡−1) + 𝛽2(∆𝑆𝐴𝐿𝐸𝑆𝑖𝑡 − ∆𝑅𝐸𝐶𝑖𝑡) + 𝛽3𝑃𝑃𝐸𝑖𝑡 + 𝛽4𝑅𝑂𝐴𝑖𝑡 + 𝜀𝑖𝑡
(1)
where
𝐴𝑐𝑐𝑟𝑢𝑎𝑙𝑠𝑖𝑡 are total accruals computed as the change in non-cash current assets minus the
change in current liabilities excluding the current portion of long-term debt, minus depreciation
and amortization, scaled by lagged total assets.
𝐴𝑆𝑆𝐸𝑇𝑆𝑖𝑡−1 are the total assets for the previous year.
∆𝑆𝐴𝐿𝐸𝑆𝑖𝑡 is the difference between sales in the current year and previous year scaled by one-
year lagged total assets
∆𝑅𝐸𝐶𝑖𝑡 is the difference between accounts receivable at the end of the current year and account
receivable at the end of the previous year scaled by one-year lagged total assets
𝑃𝑃𝐸𝑖𝑡 is the net amount of property, plant, and equipment at the end of the year scaled by one-
year lagged total assets
𝑅𝑂𝐴𝑖𝑡 is the income before extraordinary items scaled by one-year lagged total assets
Each fiscal year, we assign firms to the 48 industry classifications of Fama and French. If,
for a given fiscal year – industry, more than 15 observations are available, we estimate the
model (1). Further details of the computation are in the Appendix.
Next, we compute several measures of real earnings management. Following
Roychowdhury (2006), we consider three types of REM activities: sales manipulation
14
(abnormal reduction cash flows from operations), overproduction (abnormal increase in
production costs), and cutting discretionary expenses (abnormal decrease in R&D, advertising
and SG&A expenditures).
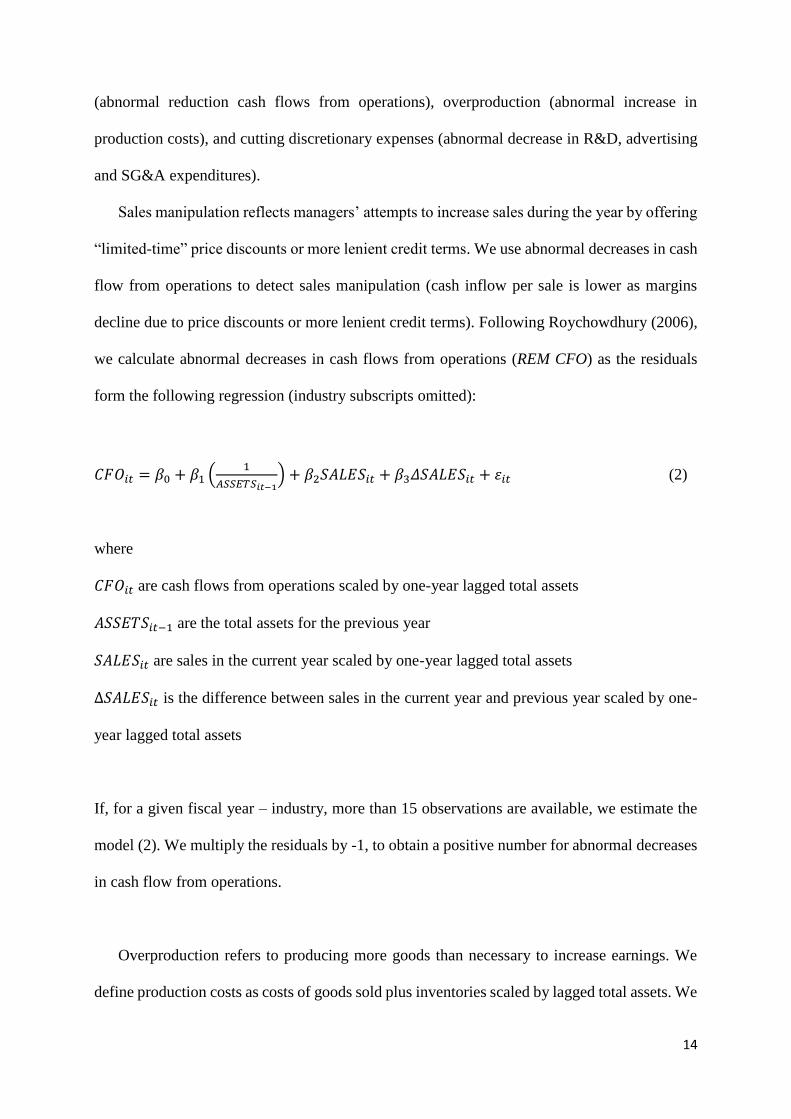
Sales manipulation reflects managers’ attempts to increase sales during the year by offering
“limited-time” price discounts or more lenient credit terms. We use abnormal decreases in cash
flow from operations to detect sales manipulation (cash inflow per sale is lower as margins
decline due to price discounts or more lenient credit terms). Following Roychowdhury (2006),
we calculate abnormal decreases in cash flows from operations (REM CFO) as the residuals
form the following regression (industry subscripts omitted):
𝐶𝐹𝑂𝑖𝑡 = 𝛽0 + 𝛽1 (1
𝐴𝑆𝑆𝐸𝑇𝑆𝑖𝑡−1) + 𝛽2𝑆𝐴𝐿𝐸𝑆𝑖𝑡 + 𝛽3𝛥𝑆𝐴𝐿𝐸𝑆𝑖𝑡 + 𝜀𝑖𝑡 (2)
where
𝐶𝐹𝑂𝑖𝑡 are cash flows from operations scaled by one-year lagged total assets
𝐴𝑆𝑆𝐸𝑇𝑆𝑖𝑡−1 are the total assets for the previous year
𝑆𝐴𝐿𝐸𝑆𝑖𝑡 are sales in the current year scaled by one-year lagged total assets
∆𝑆𝐴𝐿𝐸𝑆𝑖𝑡 is the difference between sales in the current year and previous year scaled by one-
year lagged total assets
If, for a given fiscal year – industry, more than 15 observations are available, we estimate the
model (2). We multiply the residuals by -1, to obtain a positive number for abnormal decreases
in cash flow from operations.
Overproduction refers to producing more goods than necessary to increase earnings. We
define production costs as costs of goods sold plus inventories scaled by lagged total assets. We

15
identify overproduction by means of abnormal positive productions costs. Following
Roychowdhury (2006), we calculate compute abnormal production costs (REM Prod) as the
residuals of the following regression:
𝑃𝑟𝑜𝑑𝑖𝑡 = 𝛽0 + 𝛽1 (1
𝐴𝑆𝑆𝐸𝑇𝑆𝑖𝑡−1) + 𝛽2𝑆𝐴𝐿𝐸𝑆𝑖𝑡 + 𝛽3𝛥𝑆𝐴𝐿𝐸𝑆𝑖𝑡 + 𝛽4𝛥𝐿𝑆𝐴𝐿𝐸𝑆𝑖𝑡 + 𝜀𝑖𝑡 (3)
where
𝑃𝑅𝑂𝐷𝑖𝑡 are the production costs scaled by one-year lagged total assets
𝐴𝑆𝑆𝐸𝑇𝑆𝑖𝑡−1 are the total assets for the previous year
𝑆𝐴𝐿𝐸𝑆𝑖𝑡 are sales in the current year scaled by one-year lagged total assets
∆𝑆𝐴𝐿𝐸𝑆𝑖𝑡 is the difference between sales in the current year and previous year scaled by one-
year lagged total assets
∆𝐿𝑆𝐴𝐿𝐸𝑆𝑖𝑡 is the lagged difference between sales in the current year and previous year scaled
by one-year lagged total assets
If, for a given fiscal year – industry, more than 15 observations are available, we estimate
the model (3).
Discretionary expenses often include advertising, employee training, maintenance, and
other expenses. The manager has the discretion to cut such expenses to increase reported
earnings. Following Roychowdhury (2006), we calculate compute abnormal discretionary
expenditures (REM Disc. Exp.) as the residuals of the following regression:
𝐷𝑖𝑠𝑐. 𝐸𝑥𝑝.𝑖𝑡 = 𝛽0 + 𝛽1 (1
𝐴𝑆𝑆𝐸𝑇𝑆𝑖𝑡−1) + 𝛽2𝑆𝐴𝐿𝐸𝑆𝑖𝑡 + 𝜀𝑖𝑡 (4)
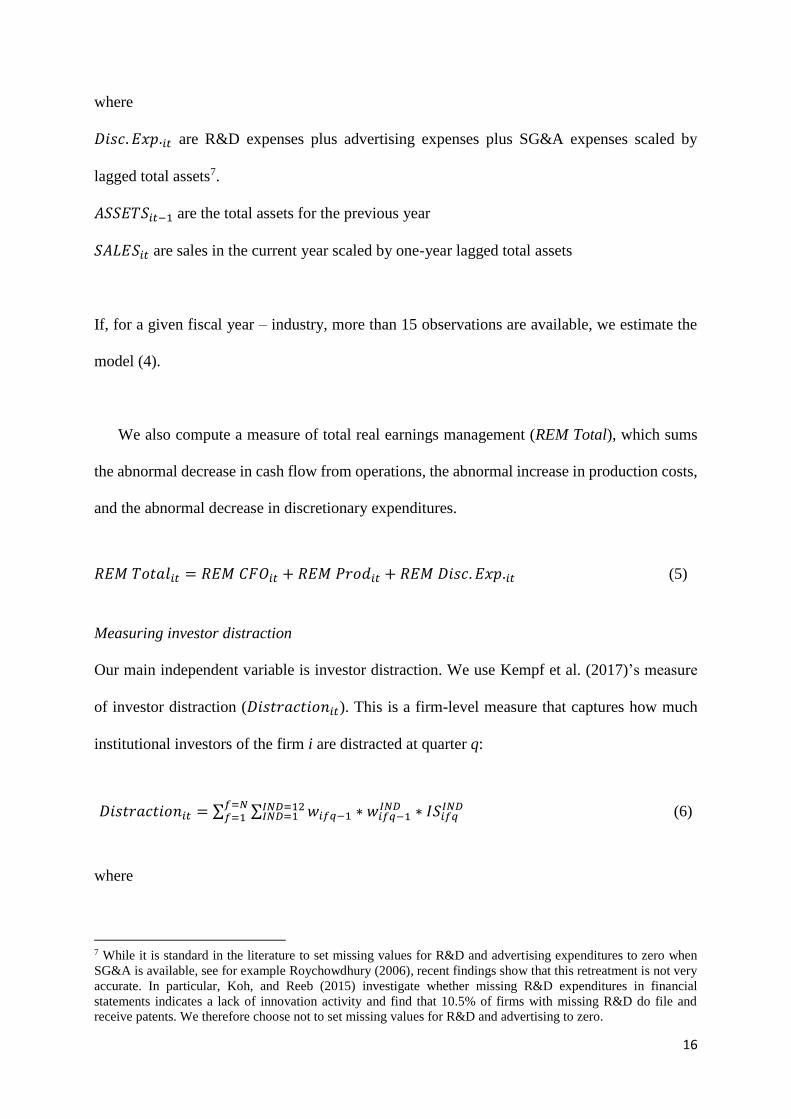
16
where
𝐷𝑖𝑠𝑐. 𝐸𝑥𝑝.𝑖𝑡 are R&D expenses plus advertising expenses plus SG&A expenses scaled by
lagged total assets7.
𝐴𝑆𝑆𝐸𝑇𝑆𝑖𝑡−1 are the total assets for the previous year
𝑆𝐴𝐿𝐸𝑆𝑖𝑡 are sales in the current year scaled by one-year lagged total assets
If, for a given fiscal year – industry, more than 15 observations are available, we estimate the
model (4).
We also compute a measure of total real earnings management (REM Total), which sums
the abnormal decrease in cash flow from operations, the abnormal increase in production costs,
and the abnormal decrease in discretionary expenditures.
𝑅𝐸𝑀 𝑇𝑜𝑡𝑎𝑙𝑖𝑡 = 𝑅𝐸𝑀 𝐶𝐹𝑂𝑖𝑡 + 𝑅𝐸𝑀 𝑃𝑟𝑜𝑑𝑖𝑡 + 𝑅𝐸𝑀 𝐷𝑖𝑠𝑐. 𝐸𝑥𝑝.𝑖𝑡 (5)
Measuring investor distraction
Our main independent variable is investor distraction. We use Kempf et al. (2017)’s measure
of investor distraction (𝐷𝑖𝑠𝑡𝑟𝑎𝑐𝑡𝑖𝑜𝑛𝑖𝑡). This is a firm-level measure that captures how much
institutional investors of the firm i are distracted at quarter q:
𝐷𝑖𝑠𝑡𝑟𝑎𝑐𝑡𝑖𝑜𝑛𝑖𝑡 = ∑ ∑ 𝑤𝑖𝑓𝑞−1 ∗ 𝑤𝑖𝑓𝑞−1𝐼𝑁𝐷 ∗ 𝐼𝑆𝑖𝑓𝑞
𝐼𝑁𝐷𝐼𝑁𝐷=12𝐼𝑁𝐷=1
𝑓=𝑁𝑓=1 (6)
where
7 While it is standard in the literature to set missing values for R&D and advertising expenditures to zero when
SG&A is available, see for example Roychowdhury (2006), recent findings show that this retreatment is not very
accurate. In particular, Koh, and Reeb (2015) investigate whether missing R&D expenditures in financial
statements indicates a lack of innovation activity and find that 10.5% of firms with missing R&D do file and
receive patents. We therefore choose not to set missing values for R&D and advertising to zero.
17
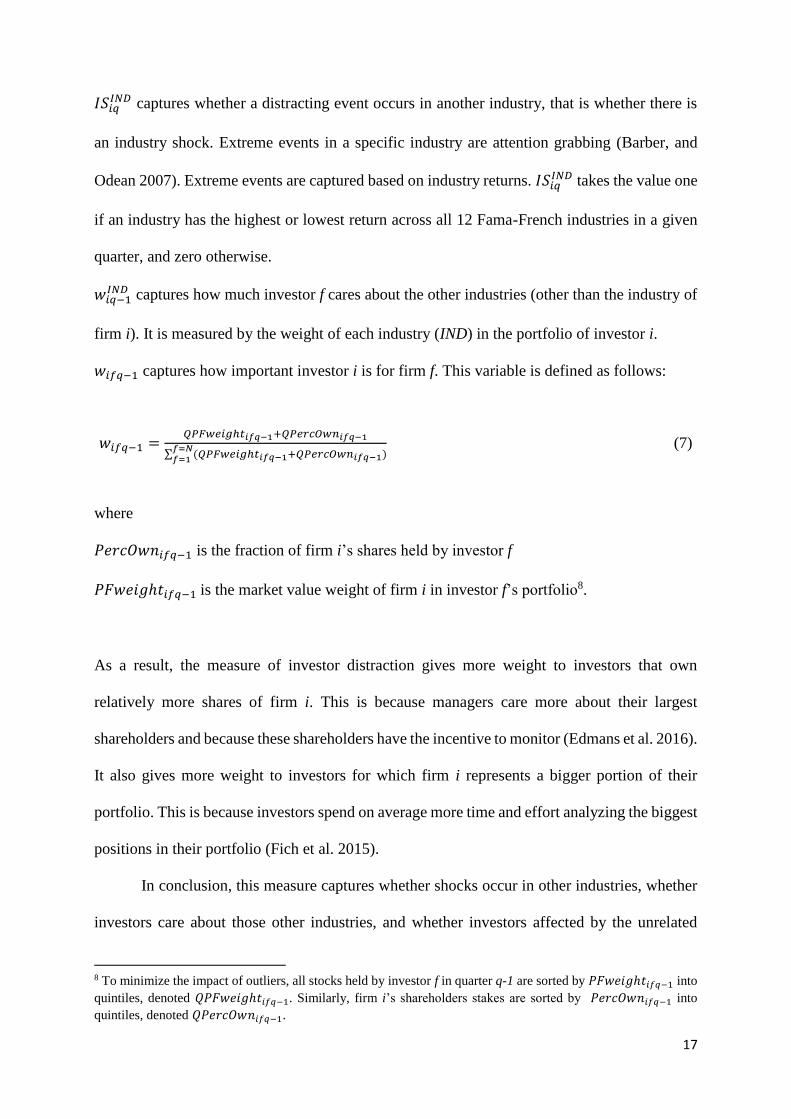
𝐼𝑆𝑖𝑞𝐼𝑁𝐷 captures whether a distracting event occurs in another industry, that is whether there is
an industry shock. Extreme events in a specific industry are attention grabbing (Barber, and
Odean 2007). Extreme events are captured based on industry returns. 𝐼𝑆𝑖𝑞𝐼𝑁𝐷 takes the value one
if an industry has the highest or lowest return across all 12 Fama-French industries in a given
quarter, and zero otherwise.
𝑤𝑖𝑞−1𝐼𝑁𝐷 captures how much investor f cares about the other industries (other than the industry of
firm i). It is measured by the weight of each industry (IND) in the portfolio of investor i.
𝑤𝑖𝑓𝑞−1 captures how important investor i is for firm f. This variable is defined as follows:
𝑤𝑖𝑓𝑞−1 =𝑄𝑃𝐹𝑤𝑒𝑖𝑔ℎ𝑡𝑖𝑓𝑞−1+𝑄𝑃𝑒𝑟𝑐𝑂𝑤𝑛𝑖𝑓𝑞−1
∑ (𝑄𝑃𝐹𝑤𝑒𝑖𝑔ℎ𝑡𝑖𝑓𝑞−1+𝑄𝑃𝑒𝑟𝑐𝑂𝑤𝑛𝑖𝑓𝑞−1)𝑓=𝑁𝑓=1
(7)
where
𝑃𝑒𝑟𝑐𝑂𝑤𝑛𝑖𝑓𝑞−1 is the fraction of firm i’s shares held by investor f
𝑃𝐹𝑤𝑒𝑖𝑔ℎ𝑡𝑖𝑓𝑞−1 is the market value weight of firm i in investor f’s portfolio8.
As a result, the measure of investor distraction gives more weight to investors that own
relatively more shares of firm i. This is because managers care more about their largest
shareholders and because these shareholders have the incentive to monitor (Edmans et al. 2016).
It also gives more weight to investors for which firm i represents a bigger portion of their
portfolio. This is because investors spend on average more time and effort analyzing the biggest
positions in their portfolio (Fich et al. 2015).
In conclusion, this measure captures whether shocks occur in other industries, whether
investors care about those other industries, and whether investors affected by the unrelated
8 To minimize the impact of outliers, all stocks held by investor f in quarter q-1 are sorted by 𝑃𝐹𝑤𝑒𝑖𝑔ℎ𝑡𝑖𝑓𝑞−1 into
quintiles, denoted 𝑄𝑃𝐹𝑤𝑒𝑖𝑔ℎ𝑡𝑖𝑓𝑞−1. Similarly, firm i’s shareholders stakes are sorted by 𝑃𝑒𝑟𝑐𝑂𝑤𝑛𝑖𝑓𝑞−1 into
quintiles, denoted 𝑄𝑃𝑒𝑟𝑐𝑂𝑤𝑛𝑖𝑓𝑞−1.

18
industry shocks are potentially important monitors. Note that we smooth the measure over the
last four quarters before the quarter at which we observe earnings management.
Research design
The main objective of our empirical analysis is to study the effect of investor distraction on
earnings management. We control for standard determinants of earnings management based on
prior literature (e.g., Bushee 1998; Kothari et al. 2005; Roychowdhury 2006; Yu 2008; Kothari
et al. 2015; Bratten et al. 2015). Because our main dependent variables are residuals of
regressions already including sales and sales growth, we do not add them in the regressions.
We lagged by one year our control variables to limit potential simultaneity bias. In our baseline
analysis, we run the following regression:
𝐸𝑎𝑟𝑛𝑖𝑛𝑔𝑠 𝑀𝑎𝑛𝑎𝑔𝑒𝑚𝑒𝑛𝑡𝑖,𝑡 = 𝛽0 + 𝛽1𝐷𝑖𝑠𝑡𝑟𝑎𝑐𝑡𝑖𝑜𝑛𝑖,𝑡 + 𝛽2𝑆𝑖𝑧𝑒𝑖,𝑡−1 + 𝛽3𝐿𝑒𝑣𝑒𝑟𝑎𝑔𝑒𝑖,𝑡−1 +
𝛽4𝐵𝑜𝑜𝑘𝑇𝑜𝑀𝑎𝑟𝑘𝑒𝑡𝑖,𝑡−1 + 𝑃𝑟𝑜𝑓𝑖𝑡𝑎𝑏𝑖𝑙𝑖𝑡𝑦𝑖,𝑡−1 + 𝐴𝑠𝑠𝑒𝑡 𝐺𝑟𝑜𝑤𝑡ℎ𝑖,𝑡−1 + 𝛽5𝑀𝑜𝑚𝑒𝑚𝑡𝑢𝑚𝑖,𝑡−1 +
𝛽6𝑉𝑜𝑙𝑎𝑡𝑖𝑙𝑖𝑡𝑦𝑖,𝑡−1 + 𝛽7𝐴𝑛𝑎𝑙𝑦𝑠𝑡 𝐶𝑜𝑣𝑒𝑟𝑎𝑔𝑒𝑖,𝑡−1 + 𝛽8𝐼𝑛𝑠𝑡𝑖𝑡𝑢𝑡𝑖𝑜𝑛𝑎𝑙 𝑂𝑤𝑛𝑒𝑟𝑠ℎ𝑖𝑝𝑖,𝑡−1 +
𝐹𝑖𝑠𝑐𝑎𝑙 𝑦𝑒𝑎𝑟 𝐹𝐸𝑡 + 𝐹𝑖𝑟𝑚 𝐹𝐸𝑖 + 𝜀𝑖,𝑡−1 (8)
where
Earnings Management is measured by Discretionary Accruals or one of the measures of real
earnings management (REM CFO, REM Prod, REM Disc. Exp., and REM Total).
Distraction is the Kempf et al. (2017)’s measure of investor distraction smoothed over the last
four quarters before the quarter at which we observe earnings management.
Size is the lagged natural logarithm of total assets.
Profitability is the ratio of income before extraordinary items divided by total assets.
Leverage is the ratio of total debt over total assets.
BookToMarket is the ratio of the book value of the firm divided by its market value.
Asset growth is the ratio of the change in total assets divided by lagged total assets.

19
Momentum is the cumulated monthly returns in excess of the CRSP universe value-weighted
returns over the last twelve months.9
Volatility is the standard deviation of daily returns in excess of the CRSP universe value-
weighted returns measured over the three previous fiscal years.
Analyst coverage is the number of analysts forecasting one-year ahead EPS.
Institutional ownership is the percentage of ownership by institutional investors with respect to
the firm’s total shares outstanding.
Size, profitability and book-to-market are standard control variables of corporate policies.
We control for leverage because it proxies for constrained free cash flows that should restrain
managerial opportunism (e.g., Jensen 1986; Jelinek 2007; Nikolaev 2010). We expect a
negative effect on earnings management. We control for asset growth, because fast growing
firms are likely to devote more efforts to keep increasing their growth rate rather than to focus
on their margins or profitability (e.g., Aghion, and Stein 2008). Moreover, real activities
management tends to undermine future growth and value creation. Fast growing firms should
thus have lower incentives to engage in real activities management10. Overall, we expect asset
growth to be negatively associated with earnings management. We also control for momentum
and volatility. Momentum indicates whether the firm has been over performing the market
benchmark over the previous fiscal year. We thus expect a negative effect on earnings
management because the management of an already well-performing firm does not need to have
recourse to earnings management to inflate the firm share price. We expect a positive effect of
volatility on earnings management because a more volatile share price implies a higher
likelihood of drops in share price, which can encourage management to manipulate earnings.
9 We correct for delisting following Shumway (1997).
10 Previous literature confirms that asset growth affects variation in earnings management (Bratten et al., 2016).

20
Moreover, we take into account analyst coverage because it proxies for the external monitoring
of earnings management by financial analysts (e.g., Jensen et al. 1976; Healy et al. 2001; Yu
2008; Degeorge et al. 2013). We expect a negative effect of analyst coverage on earnings
management. Finally, we control for institutional ownership because it captures the monitoring
effect that institutional investors as a whole may have on earnings management (e.g., Froot et
al. 1992; Parrino et al. 2003; Hartzell et al. 2003; Graham et al. 2005; McCahery et al. 2016;
Bushee 1998; Koh 2007). We thus expect a negative effect on earnings management.
Depending on the specification, we add either industry or firm fixed effects. Standard errors
are clustered by firms and robust to heteroscedasticity (Petersen 2009). While fiscal year fixed
effects control for homogeneous shock across firms for a given fiscal year, industry and firm
fixed effects respectively capture time-invariant industry and firm characteristics. Further
details on variables computation are in the Appendix.
To test hypotheses 3a and 3b and investigate whether the effect of investor distraction
on earnings management is attenuated in presence of other monitoring forces (analyst coverage
and financial leverage), we run the following two regressions:
𝐸𝑎𝑟𝑛𝑖𝑛𝑔𝑠 𝑀𝑎𝑛𝑎𝑔𝑒𝑚𝑒𝑛𝑡𝑖,𝑡 = 𝛽0 + 𝐼1𝐷𝑖𝑠𝑡𝑟𝑎𝑐𝑡𝑖𝑜𝑛𝑖,𝑡 ∗ 𝐴𝑛𝑎𝑙𝑦𝑠𝑡 𝐶𝑜𝑣𝑒𝑟𝑎𝑔𝑒𝑖,𝑡−1 + 𝛽1𝐷𝑖𝑠𝑡𝑟𝑎𝑐𝑡𝑖𝑜𝑛𝑖,𝑡 + 𝛽2𝑆𝑖𝑧𝑒𝑖,𝑡−1 + 𝛽3𝐿𝑒𝑣𝑒𝑟𝑎𝑔𝑒𝑖,𝑡−1 + 𝛽4𝐵𝑜𝑜𝑘𝑇𝑜𝑀𝑎𝑟𝑘𝑒𝑡𝑖,𝑡−1 +𝑃𝑟𝑜𝑓𝑖𝑡𝑎𝑏𝑖𝑙𝑖𝑡𝑦𝑖,𝑡−1 + 𝐴𝑠𝑠𝑒𝑡 𝐺𝑟𝑜𝑤𝑡ℎ𝑖,𝑡−1 + 𝛽5𝑀𝑜𝑚𝑒𝑚𝑡𝑢𝑚𝑖,𝑡−1 + 𝛽6𝑉𝑜𝑙𝑎𝑡𝑖𝑙𝑖𝑡𝑦𝑖,𝑡−1 +𝛽7𝐴𝑛𝑎𝑙𝑦𝑠𝑡 𝐶𝑜𝑣𝑒𝑟𝑎𝑔𝑒𝑖,𝑡−1 + 𝛽8𝐼𝑛𝑠𝑡𝑖𝑡𝑢𝑡𝑖𝑜𝑛𝑎𝑙 𝑂𝑤𝑛𝑒𝑟𝑠ℎ𝑖𝑝𝑖,𝑡−1 + 𝐹𝑖𝑠𝑐𝑎𝑙 𝑦𝑒𝑎𝑟 𝐹𝐸𝑡 +𝐹𝑖𝑟𝑚 𝐹𝐸𝑖 + 𝜀𝑖,𝑡−1 (9)
𝐸𝑎𝑟𝑛𝑖𝑛𝑔𝑠 𝑀𝑎𝑛𝑎𝑔𝑒𝑚𝑒𝑛𝑡𝑖,𝑡 = 𝛽0 + 𝐼2𝐷𝑖𝑠𝑡𝑟𝑎𝑐𝑡𝑖𝑜𝑛𝑖,𝑡 ∗ 𝐿𝑒𝑣𝑒𝑟𝑎𝑔𝑒𝑖,𝑡−1 + 𝛽1𝐷𝑖𝑠𝑡𝑟𝑎𝑐𝑡𝑖𝑜𝑛𝑖,𝑡 +𝛽2𝑆𝑖𝑧𝑒𝑖,𝑡−1 + 𝛽3𝐿𝑒𝑣𝑒𝑟𝑎𝑔𝑒𝑖,𝑡−1 + 𝛽4𝐵𝑜𝑜𝑘𝑇𝑜𝑀𝑎𝑟𝑘𝑒𝑡𝑖,𝑡−1 + 𝑃𝑟𝑜𝑓𝑖𝑡𝑎𝑏𝑖𝑙𝑖𝑡𝑦𝑖,𝑡−1 +𝐴𝑠𝑠𝑒𝑡 𝐺𝑟𝑜𝑤𝑡ℎ𝑖,𝑡−1 + 𝛽5𝑀𝑜𝑚𝑒𝑚𝑡𝑢𝑚𝑖,𝑡−1 + 𝛽6𝑉𝑜𝑙𝑎𝑡𝑖𝑙𝑖𝑡𝑦𝑖,𝑡−1 +𝛽7𝐴𝑛𝑎𝑙𝑦𝑠𝑡 𝐶𝑜𝑣𝑒𝑟𝑎𝑔𝑒𝑖,𝑡−1 + 𝛽8𝐼𝑛𝑠𝑡𝑖𝑡𝑢𝑡𝑖𝑜𝑛𝑎𝑙 𝑂𝑤𝑛𝑒𝑟𝑠ℎ𝑖𝑝𝑖,𝑡−1 + 𝐹𝑖𝑠𝑐𝑎𝑙 𝑦𝑒𝑎𝑟 𝐹𝐸𝑡 +𝐹𝑖𝑟𝑚 𝐹𝐸𝑖 + 𝜀𝑖,𝑡−1 (10)

21
Where 𝐷𝑖𝑠𝑡𝑟𝑎𝑐𝑡𝑖𝑜𝑛𝑖𝑡 ∗ 𝐴𝑛𝑎𝑙𝑦𝑠𝑡 𝐶𝑜𝑣𝑒𝑟𝑎𝑔𝑒𝑖,𝑡−1 and 𝐷𝑖𝑠𝑡𝑟𝑎𝑐𝑡𝑖𝑜𝑛𝑖𝑡 ∗ 𝐿𝑒𝑣𝑒𝑟𝑎𝑔𝑒𝑖,𝑡−1 are two
interactions terms capturing the effect of investor distraction conditional on the number analysts
covering the firm and the firm’s financial leverage. We are interested in the sign and
significance of the coefficients 𝐼1 and 𝐼2.
4. Results
Descriptive statistics
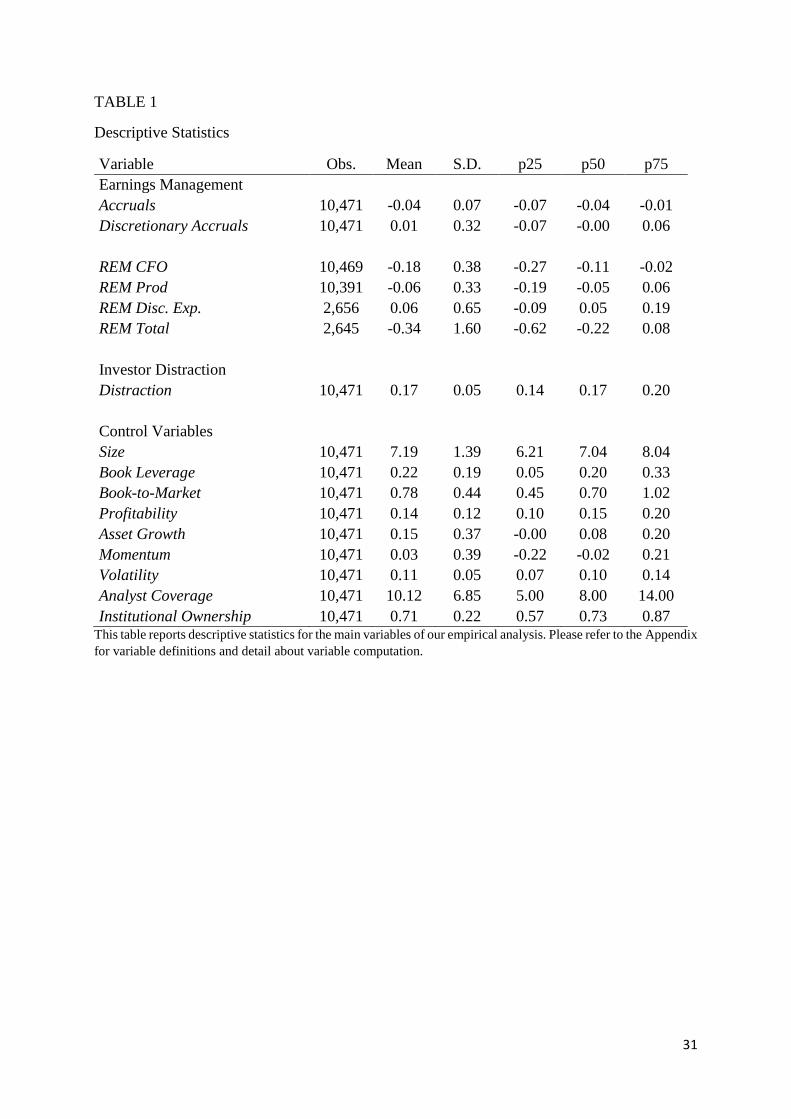
Table 1 contains descriptive statistics for the variables described in Section 3. For a median
firm the absolute value of discretionary accruals is 4% of lagged assets, which is of similar
magnitude as that of other studies (e.g., Francis et al. 2004; Bergstresser, and Philippon 2006;
Yu 2008). Discretionary accruals represent on average 25% of the total accruals (absolute value
of 0.01/-0.04). The median firm in our sample abnormally decreases its cash flow from
operations but does not abnormally increase its production costs or abnormally decrease its
discretionary expenditures. Our measure of total real earnings management has a positive value
for only 30% of the firm-year observations. The median firm in our sample has a book leverage
of 20%, a book-to-market of 0.78, profitability of 15% and asset growth of 8%. The median
firm is covered by eight analysts and has an institutional ownership of 73%. The median firm
has a volatility of the monthly stock returns over the 36 months prior to earnings report of 10%.
The cumulated returns in excess of the CRSP benchmark over the 12 months prior to the
earnings report are 3% on average. Finally, the average level of distraction is 0.17, which is in
line with Kempf et al. (2017) and Chen et al. (2016).
[Insert Table 1 about here]
Earnings management and investor distraction

22
Table 2 reports the results of the regression of discretionary accruals on investor distraction
plus the control variables (equation 8). Column 1 shows the results for the specification
including industry fixed effects and Column 2 shows the results for the specification including
firm fixed effects. In both cases, investor distraction has a very significant (p-value < 0.01)
positive association with discretionary accruals.
[Insert Table 2 about here]
The coefficients on our control variables have their expected signs although some of them
are not significant11. For the specification with firm fixed effects, results show that analyst
coverage and book leverage are negatively related to discretionary accruals, which is consistent
with the monitoring role of analysts and the disciplining effect of leverage. The absence of a
significant effect of institutional ownership as a whole on discretionary accruals calls for further
discussion. One potential explanation for this result is the existence of heterogeneity in the
effect of institutional investors on earnings management. While long-term investors with big
stakes in the company have higher means and incentives to monitor management and deter
earnings management, investors with a short-term investment strategy might encourage
earnings management because it inflates stock price in the short-run (e.g., Bushee 1998; Koh
2007; Cella, Ellul, and Giannetti 2013). The insignificant coefficient on institutional ownership
as a whole might thus hide conflicting effects from two different subgroups of institutional
investors12. A second explanation is that what matters to deter earnings management is not so
11 A possible explanation is that firm fixed effects partially capture the influence of some firm characteristics that
are persistent over time. 12 Hotchkiss, and Strickland (2003) document no effect of institutional ownership as a whole on stock price
reactions to earning announcements but they find a positive impact for firms with a higher proportion of ownership
by momentum investors and high turnover investors. Bushee, and Noe (2000) show that the net effect on stock
return volatility of having both transient investors and quasi-indexer in a firm is roughly zero, because each type
of investor has opposite effects.
23
much the level of institutional ownership but rather the monitoring intensity exerted by
institutional investors that we capture through our measure of investor distraction.
[Insert Table 3 about here]
Table 3 reports the results of the regressions of different types of real earnings management
on investor distraction plus the control variables. Columns 1-4 show the results using
specifications with industry fixed effects for abnormal cash flow from operations, abnormal
production costs, abnormal discretionary expenditures, and total real earnings management.
Columns 4-8 show the results of specifications including firm fixed effects. A first takeaway is
that, in both specifications, firms with greater investor distraction experience a significant
decrease in abnormal cash flow from operations (p<0.01) and increase in abnormal production
costs (p<0.01). The effect of investor distraction on discretionary expenditures is however not
significant13. This may be because opportunistic reductions of R&D and SG&A expenditures
are an opaque channel to overstate earnings, which impairs investors’ ability to detect earnings
management and to assess its consequences for future performance. In that sense, Kothari et al.
(2015) show that earnings management through discretionary expenses is difficult to detect for
investors even when firms are under considerable scrutiny (SEO). Thus, in that case, whether
shareholders are distracted or not may not affect the ability of managers to engage in
manipulation of discretionary expenditures. The overall effect of investor distraction on total
real earnings management is positive and significant.
The results from Tables 2 and 3 provide empirical evidence in favor of Hypothesis 3 and
do not support Hypothesis 1 and 2. They indicate that, when shareholders are distracted,
13 In unreported regressions, we investigate the effect of investor distraction on the following different types of
discretionary expenditures: R&D, SG&A, and advertising expenditures. While there is positive and significant
effect of investor distraction at a 10% significance level on advertising and SG&A expenditures, we do not observe
any significant effect on R&D expenditures.
24
managers manipulate not just accruals but also real activities in order to inflate reported
earnings. Our findings are consistent with the idea that managers take advantage of the
temporarily loosening of monitoring intensity induced by distracted investors to engage in both
forms of earnings management. When investors are distracted, they are less likely to detect
earnings management, which provides extra incentive for managers to engage in it.
We argue that the effect of investor distraction on earnings management is causal. This is
because, by construction, the measure of investor distraction we use captures shifts in investor
attention due to shocks in unrelated industries of their portfolio firms, as discussed by Kempf
et al. (2017). It therefore constitutes an exogenous change in monitoring intensity at the firm
level. As such, we can interpret our findings as follows. An exogenous increase in investor
distraction produces an exogenous reduction in the monitoring intensity of shareholders. As
investors are less able to detect earnings management and to react to it, managers are more
likely to engage in earnings management.
Is the decrease in investor monitoring compensated for by analyst coverage or financial
leverage?
The positive association between investor distraction and earnings management indicates
that the temporary looser monitoring induced by distracted investors is not fully compensated
for by other investors that are not distracted. However, we expect the effect of investor
distraction on earnings management to be less pronounced in firms where other monitoring
forces are at play. These additional monitors may partially compensate for investor distraction.
Based on prior literature, we concentrate on two other sources of monitoring: analyst coverage
and financial leverage. We focus on earnings management in the form of discretionary accruals
because the effect of investor distraction on this type of earnings management is more
significant. In addition, most papers that document a monitoring effect of leverage and analyst
25
coverage on earnings management use discretionary accruals (e.g., Degeorge et al. 2013;
Jelinek 2007; Nikolaev 2010; Yu 2008).
Columns 1-2 of Table 4 report the results of regression 9 of discretionary accruals on
investor distraction, investor distraction interacted with analyst coverage, and our usual control
variables, with industry and firm fixed effects respectively. Investor distraction still has a
positive effect on earnings management but the interaction between investor distraction and
analyst coverage has a negative impact. The influence of investor distraction on discretionary
accruals therefore decreases with analyst coverage. The coefficient on the interaction term is
negative and significant (p<0.01). Setting all variables to their mean values, all else equal, an
increase in analyst coverage by one analyst from its mean value decreases the effect of investor
distraction on discretionary accruals by more than 13% from 0.53 to 0.46.
Columns 3-4 of Table 4 report the results of regression 10 of discretionary accruals on
investor distraction, investor distraction interacted with lagged book leverage, and the usual
control variables, with industry and firm fixed effects respectively. As was the case for analyst
coverage, the influence of investor distraction on discretionary accruals decreases with book
leverage. The coefficient on the interaction term is negative and significant (p<0.01). Setting
all variables to their mean values, all else equal, an increase in book leverage by 10 percentage
points from its mean value more than halves the impact of investor distraction on discretionary
accruals from 0.47 to 0.21.
[Insert Table 4 about here]
While we cannot rule out alternative explanations for each result taken separately, taken
together these results suggest that the impact of investor distraction on earnings management is
more pronounced in firms where institutional investors are the main source of monitoring and

26
diminished for firms where other external and internal monitoring forces are at play. These
results thus validate Hypotheses 3a and 3b.
5. Conclusion
The paper examines how investor attention affects earnings management decisions. Our key
conjecture is that institutional investors are subject to attention constraints. These constraints
impede them from exerting equal monitoring intensity for all firms in which they invest
simultaneously. At a given point in time, institutional investors may become distracted
shareholders, in the sense that they shift their attention to other parts of their portfolio and
loosen their monitoring intensity. We follow Kempf et al. (2017) and use a firm-level proxy for
investor distraction, which captures when institutional investors experience shocks in unrelated
parts of their portfolios.
We find strong evidence that managers take advantage of shareholder distraction to engage
in earnings management. We document a significant impact on both discretionary accruals and
real activities manipulation. We argue this effect is causal because the distraction measure
captures shifts in investor attention caused by shocks in unrelated industries. Further, we show
that the presence of other monitoring forces such as analyst coverage and leverage diminishes
this effect. Our results are consistent with the idea that earnings management is difficult to
detect (Kothari et al. 2015) and without continuous and stringent monitoring, managers have
more discretion to engage in earnings management.
Previous research extensively studies the forms and consequences of earnings management.
In particular, it reveals that the manipulation of accruals and real activities might have negative
consequences for long-run value creation (e.g., Teoh et al. 1998; Mizik et al. 2007; Bhojraj et
al. 2009; Gunny 2010; Li 2010; Cohen et al. 2010; Kim et al. 2013; Kothari et al. 2015). The
main contribution of this paper is two-fold. First, it sheds light on a new determinant of accruals

27
and real activities management. Second, our results suggest that earnings management is an
important channel through which lower monitoring intensity by institutional shareholders
impacts firm value.
.

28
References
Admati, A. R., and P. Pfleiderer. 2009. The “Wall Street Walk” and shareholder activism: Exit
as a form of voice. Review of Financial Studies 22 (7): 2645-2685.
Aghion, P., and J. C. Stein. 2008. Growth vs. margins: Destabilizing consequences of giving
the stock market what it wants. Journal of Finance 63 (3).
Ali, A., and W. Zhang. 2015. CEO tenure and earnings management. Journal of accounting
and economics 59 (1): 60-79.
Baker, M., and J. Wurgler. 2011. Behavioral corporate finance: An updated survey: National
Bureau of Economic Research.
Barber, B. M., and T. Odean. 2007. All that glitters: The effect of attention and news on the
buying behavior of individual and institutional investors. The Review of Financial
Studies 21 (2): 785-818.
Bergstresser, D., and T. Philippon. 2006. CEO incentives and earnings management. Journal
of Financial Economics 80 (3): 511-529.
Bhojraj, S., P. Hribar, M. Picconi, and J. McInnis. 2009. Making sense of cents: An examination
of firms that marginally miss or beat analyst forecasts. The journal of finance 64 (5):
2361-2388.
Bratten, B., J. L. Payne, and W. B. Thomas. 2015. Earnings Management: Do Firms Play
“Follow the Leader”? Contemporary Accounting Research.
Brown, K. E. 2015. Ex ante severance agreements and earnings management. Contemporary
Accounting Research 32 (3): 897-940.
Bushee, B. J. 1998. The influence of institutional investors on myopic R&D investment
behavior. Accounting review 73 (3): 305-333.
Bushee, B. J., and C. F. Noe. 2000. Corporate disclosure practices, institutional investors, and
stock return volatility. Journal of accounting research: 171-202.
Cella, C., A. Ellul, and M. Giannetti. 2013. Investors' horizons and the amplification of market
shocks. Review of Financial Studies: hht023.
Chen, T., H. Dong, and C. Lin. 2016. Institutional Shareholders and Corporate Social
Responsibility: Evidence from Two Quasi-Natural Experiments.
Chung, R., M. Firth, and J.-B. Kim. 2002. Institutional monitoring and opportunistic earnings
management. Journal of Corporate Finance 8 (1): 29-48.
Cohen, D. A., and P. Zarowin. 2010. Accrual-based and real earnings management activities
around seasoned equity offerings. Journal of accounting and economics 50 (1): 2-19.
Dechow, P., W. Ge, and C. Schrand. 2010. Understanding earnings quality: A review of the
proxies, their determinants and their consequences. Journal of accounting and
economics 50 (2): 344-401.
Dechow, P. M., R. G. Sloan, and A. P. Sweeney. 1995. Detecting earnings management.
Accounting review 70 (2): 193-225.
Degeorge, F., Y. Ding, T. Jeanjean, and H. Stolowy. 2013. Analyst coverage, earnings
management and financial development: An international study. Journal of Accounting
and Public Policy 32 (1): 1-25.
DellaVigna, S., and J. M. Pollet. 2009. Investor inattention and Friday earnings announcements.
The journal of finance 64 (2): 709-749.
Edmans, A. 2009. Blockholder trading, market efficiency, and managerial myopia. The journal
of finance 64 (6): 2481-2513.
Edmans, A., V. W. Fang, and E. Zur. 2013. The effect of liquidity on governance. Review of
Financial Studies: hht012.
Edmans, A., and C. G. Holderness. 2016. Blockholders: A Survey of Theory and Evidence.

29
Fang, V. W., A. H. Huang, and J. M. Karpoff. 2016. Short selling and earnings management:
A controlled experiment. The journal of finance 71 (3): 1251-1294.
Fich, E. M., J. Harford, and A. L. Tran. 2015. Motivated monitors: The importance of
institutional investors׳ portfolio weights. Journal of Financial Economics 118 (1): 21-
48.
Francis, J., R. LaFond, P. M. Olsson, and K. Schipper. 2004. Costs of equity and earnings
attributes. The Accounting Review 79 (4): 967-1010.
Froot, K. A., D. S. Scharfstein, and J. C. Stein. 1992. Herd on the street: Informational
inefficiencies in a market with short‐term speculation. The journal of finance 47 (4):
1461-1484.
Goldstein, M. 2011. The state of engagement between US corporations and shareholders.
Institutional Shareholder Services 5: 1-30.
Graham, J. R., C. R. Harvey, and S. Rajgopal. 2005. The economic implications of corporate
financial reporting. Journal of accounting and economics 40 (1): 3-73.
Gunny, K. A. 2010. The relation between earnings management using real activities
manipulation and future performance: Evidence from meeting earnings benchmarks.
Contemporary Accounting Research 27 (3): 855-888.
Hartzell, J. C., and L. T. Starks. 2003. Institutional investors and executive compensation. The
journal of finance 58 (6): 2351-2374.
Healy, P. M. 1985. The effect of bonus schemes on accounting decisions. Journal of accounting
and economics 7 (1-3): 85-107.
Healy, P. M., and K. G. Palepu. 2001. Information asymmetry, corporate disclosure, and the
capital markets: A review of the empirical disclosure literature. Journal of accounting
and economics 31 (1): 405-440.
Hirshleifer, D., S. S. Lim, and S. H. Teoh. 2009. Driven to distraction: Extraneous events and
underreaction to earnings news. The journal of finance 64 (5): 2289-2325.
Hotchkiss, E. S., and D. Strickland. 2003. Does shareholder composition matter? Evidence from
the market reaction to corporate earnings announcements. The journal of finance 58 (4):
1469-1498.
Hou, Q., Q. Jin, R. Yang, H. Yuan, and G. Zhang. 2015. Performance commitments of
controlling shareholders and earnings management. Contemporary Accounting
Research 32 (3): 1099-1127.
Jelinek, K. 2007. The effect of leverage increases on earnings management. The Journal of
Business and Economic Studies 13 (2): 24.
Jensen, M. C. 1986. Agency costs of free cash flow, corporate finance, and takeovers. The
American Economic Review 76 (2): 323-329.
Jensen, M. C., and W. H. Meckling. 1976. Theory of the firm: Managerial behavior, agency
costs and ownership structure. Journal of Financial Economics 3 (4): 305-360.
Jones, J. J. 1991. Earnings management during import relief investigations. Journal of
accounting research: 193-228.
Kahneman, D. 1973. Attention and effort. Vol. 1063: Prentice-Hall Englewood Cliffs, NJ.
Kempf, E., A. Manconi, and O. Spalt. 2017. Distracted shareholders and corporate actions. The
Review of Financial Studies 30 (5): 1660-1695.
Kim, J.-B., and B. C. Sohn. 2013. Real earnings management and cost of capital. Journal of
Accounting and Public Policy 32 (6): 518-543.
Koh, P.-S. 2007. Institutional investor type, earnings management and benchmark beaters.
Journal of Accounting and Public Policy 26 (3): 267-299.
Koh, P.-S., and D. M. Reeb. 2015. Missing R&D. Journal of accounting and economics 60 (1):
73-94.

30
Kothari, S., N. Mizik, and S. Roychowdhury. 2015. Managing for the moment: The role of
earnings management via real activities versus accruals in SEO valuation. The
Accounting Review 91 (2): 559-586.
Kothari, S. P., A. J. Leone, and C. E. Wasley. 2005. Performance matched discretionary accrual
measures. Journal of accounting and economics 39 (1): 163-197.
Li, X. 2010. Real earnings management and subsequent stock returns.
Libby, R., R. Bloomfield, and M. W. Nelson. 2002. Experimental research in financial
accounting. Accounting, Organizations and Society 27 (8): 775-810.
Liu, C. Y., A. Low, R. Masulis, and L. Zhang. 2017. Monitoring the Monitor: Distracted
Institutional Investors and Board Governance.
Maug, E. 1998. Large shareholders as monitors: is there a trade‐off between liquidity and
control? The journal of finance 53 (1): 65-98.
McCahery, J. A., Z. Sautner, and L. T. Starks. 2016. Behind the scenes: The corporate
governance preferences of institutional investors. The journal of finance.
Mizik, N., and R. Jacobson. 2007. Myopic marketing management: Evidence of the
phenomenon and its long-term performance consequences in the SEO context.
Marketing Science 26 (3): 361-379.
Nikolaev, V. V. 2010. Debt covenants and accounting conservatism. Journal of accounting
research 48 (1): 51-89.
Parrino, R., R. W. Sias, and L. T. Starks. 2003. Voting with their feet: Institutional ownership
changes around forced CEO turnover. Journal of Financial Economics 68 (1): 3-46.
Petersen, M. A. 2009. Estimating Standard Errors in Finance Panel Data Sets: Comparing
Approaches. Review of Financial Studies 22 (1): 435-480.
Roychowdhury, S. 2006. Earnings management through real activities manipulation. Journal
of accounting and economics 42 (3): 335-370.
Shleifer, A., and R. W. Vishny. 1986. Large shareholders and corporate control. Journal of
political economy 94 (3, Part 1): 461-488.
Shumway, T. 1997. The delisting bias in CRSP data. The journal of finance 52 (1): 327-340.
Teoh, S. H., I. Welch, and T. J. Wong. 1998. Earnings management and the long‐run market
performance of initial public offerings. The journal of finance 53 (6): 1935-1974.
Yu, F. F. 2008. Analyst coverage and earnings management. Journal of Financial Economics
88 (2): 245-271.
31
TABLE 1
Descriptive Statistics
Variable Obs. Mean S.D. p25 p50 p75
Earnings Management Accruals 10,471 -0.04 0.07 -0.07 -0.04 -0.01
Discretionary Accruals 10,471 0.01 0.32 -0.07 -0.00 0.06
REM CFO 10,469 -0.18 0.38 -0.27 -0.11 -0.02
REM Prod 10,391 -0.06 0.33 -0.19 -0.05 0.06
REM Disc. Exp. 2,656 0.06 0.65 -0.09 0.05 0.19
REM Total 2,645 -0.34 1.60 -0.62 -0.22 0.08
Investor Distraction Distraction 10,471 0.17 0.05 0.14 0.17 0.20
Control Variables Size 10,471 7.19 1.39 6.21 7.04 8.04
Book Leverage 10,471 0.22 0.19 0.05 0.20 0.33
Book-to-Market 10,471 0.78 0.44 0.45 0.70 1.02
Profitability 10,471 0.14 0.12 0.10 0.15 0.20
Asset Growth 10,471 0.15 0.37 -0.00 0.08 0.20
Momentum 10,471 0.03 0.39 -0.22 -0.02 0.21
Volatility 10,471 0.11 0.05 0.07 0.10 0.14
Analyst Coverage 10,471 10.12 6.85 5.00 8.00 14.00
Institutional Ownership 10,471 0.71 0.22 0.57 0.73 0.87 This table reports descriptive statistics for the main variables of our empirical analysis. Please refer to the Appendix
for variable definitions and detail about variable computation.

32
TABLE 2
Discretionary accruals and investor distraction
Discretionary Accruals Industry Fixed Effects Firm Fixed Effects
Distraction 0.535*** 0.524***
(0.122) (0.171)
Size 0.006 -0.031*
(0.005) (0.019)
Book Leverage -0.015 -0.138***
(0.024) (0.047)
Book-to-Market 0.001 -0.011
(0.011) (0.023)
Momentum -0.031*** -0.051***
(0.009) (0.013)
Volatility 0.041 0.279
(0.103) (0.241)
Profitability -0.083 -0.358***
(0.050) (0.088)
Asset Growth 0.006 0.020
(0.009) (0.016)
Analyst Coverage -0.001 -0.001
(0.001) (0.002)
Institutional Ownership 0.040* 0.074
(0.021) (0.052)
Observations 10,471 10,471
Year fixed effects YES YES
Industry fixed effects YES NO
Firm fixed effects NO YES
Firm cluster YES YES
Adjusted R-squared 0.152 0.124 This table reports the results of regressions of discretionary accruals on investor distraction and some control
variables. All specifications include year fixed effects. In column 1, we add industry fixed effects to the regression.
In column 2, we add firm fixed effects. Standard errors (in parentheses) are clustered by firms and robust to
heteroscedasticity. Constants are not reported. *, **, and *** represent significance levels of 0.10, 0.05 and 0.01,
respectively. Definitions for all variables are provided in the appendix.

33
TABLE 3
Real earnings management and investor distraction
Real Earnings
Management (REM)
(1) (2) (3) (4) (5) (6) (7) (8)
REM
CFO REM Prod
REM Disc.
Exp. REM Total REM CFO REM Prod
REM Disc.
Exp. REM Total
Distraction 0.585*** 0.484*** 0.100 0.917** 0.432*** 0.304** -0.114 0.794*
(0.120) (0.113) (0.326) (0.451) (0.142) (0.128) (0.318) (0.440)
Size -0.003 0.019*** 0.054*** 0.088*** -0.017 0.028 -0.052 0.206**
(0.005) (0.006) (0.017) (0.026) (0.021) (0.019) (0.064) (0.092)
Book Leverage -0.025 0.069** 0.077 0.145 -0.195*** 0.016 0.307 -0.035
(0.020) (0.028) (0.098) (0.149) (0.057) (0.051) (0.247) (0.309)
Book-to-Market 0.048*** 0.061*** 0.088** 0.234*** 0.062** -0.029 -0.049 -0.038
(0.014) (0.014) (0.034) (0.066) (0.024) (0.021) (0.052) (0.107)
Momentum -0.046*** -0.036*** 0.026 -0.088* -0.047*** -0.029*** 0.035 -0.005
(0.011) (0.009) (0.029) (0.049) (0.014) (0.010) (0.032) (0.061)
Volatility 0.147 -0.110 0.330 0.580 0.458** -0.055 0.112 0.060
(0.107) (0.116) (0.321) (0.558) (0.206) (0.169) (0.439) (0.883)
Profitability -0.444*** -0.728*** 0.765*** 0.105 -0.435** -0.556*** 0.554* 0.450
(0.060) (0.060) (0.149) (0.300) (0.170) (0.143) (0.328) (0.668)
Asset Growth -0.035*** -0.000 -0.031 -0.061 -0.039*** -0.025 -0.042 -0.135**
(0.008) (0.008) (0.022) (0.041) (0.014) (0.016) (0.037) (0.067)
Analyst Coverage -0.003*** -0.004*** -0.008*** -0.019*** -0.003 -0.005*** 0.001 -0.014*
(0.001) (0.001) (0.003) (0.004) (0.002) (0.002) (0.006) (0.008)
Institutional Ownership -0.037 -0.016 0.051 0.102 -0.044 -0.026 0.014 -0.284
(0.024) (0.026) (0.082) (0.136) (0.064) (0.043) (0.137) (0.257)
Observations 10,467 10,390 2,656 2,645 10,467 10,390 2,656 2,645
Year FE YES YES YES YES YES YES YES YES
Industry FE YES YES YES YES NO NO NO NO
Firm FE NO NO NO NO YES YES YES YES
Firm cluster YES YES YES YES YES YES YES YES
Adjusted R-squared 0.180 0.121 0.131 0.160 0.181 0.316 0.294 0.339
This table reports the results of regressions of real earnings management on investor distraction and some control
variables. All specifications include year fixed effects. In columns 1-4, we add industry fixed effects to the
regression. In columns 5-8, we add firm fixed effects. Standard errors (in parentheses) are clustered by firms and
robust to heteroscedasticity. Constants are not reported. *, **, and *** represent significance levels of 0.10, 0.05
and 0.01, respectively. Definitions for all variables are provided in the appendix.

34
TABLE 4
Effect of investor distraction on earnings management conditional on analyst coverage or
financial leverage
Analyst Coverage Book Leverage
Discretionary Accruals Ind. FE Firm FE Ind. FE Firm FE
Distraction 1.004*** 1.241*** 1.023*** 1.064***
(0.178) (0.251) (0.147) (0.214)
Distraction*Analyst Coverage -0.048*** -0.070***
(0.013) (0.018)
Distraction*Book Leverage -2.621*** -2.666***
(0.438) (0.583)
Control variables YES YES YES YES
Observations 10,471 10,471 10,471 10,471
Year fixed effects YES NO YES NO
Industry fixed effects NO YES NO YES
Firm fixed effects YES YES YES YES
Firm cluster YES YES YES YES
Adjusted R-squared 0.154 0.126 0.156 0.127
This table reports the results of regressions of discretionary accruals on investor distraction and some control
variables. All specifications include year fixed effects. In columns 1 and 3, we add industry fixed effects to the
regression. In columns 2 and 4, we add firm fixed effects. In columns 1 and 2, we add to the regression the
interaction term Distraction*Analyst Coverage. In columns 3 and 4, we add to the regression the interaction term
Distraction*Book Leverage. Standard errors (in parentheses) are clustered by firms and robust to
heteroscedasticity. Constants and other control variables are not reported. *, **, and *** represent significance
levels of 0.10, 0.05 and 0.01, respectively. Definitions for all variables are provided in the appendix.

35
Appendix
Variables Definitions
Accruals
Computed according to Kothari et al. (2005). We define total accruals as the change
in non-cash current assets minus the change in current liabilities excluding the
current portion of long-term debt, minus depreciation and amortization, scaled by
lagged total assets. Using Compustat data items:
𝐴𝑐𝑐𝑟𝑢𝑎𝑙𝑠 =∆𝐷𝐴𝑇𝐴4 − ∆𝐷𝐴𝑇𝐴1 − ∆𝐷𝐴𝑇𝐴5 + ∆𝐷𝐴𝑇𝐴34 − ∆𝐷𝐴𝑇𝐴14
𝐿. 𝐷𝐴𝑇𝐴6
Discretionary Accruals
We follow Kothari et al. (2005). For each Fama-French industry and fiscal year, if
more than 15 observations are available, discretionary accruals are the residuals of
the regression of total accruals on the inverse of lagged total assets, the change in
sales minus the change in receivables scaled by lagged total assets, net property,
plants and equipment scaled by lagged total assets, and return on assets defined as
income before extraordinary items divided by total assets.
𝐴𝑐𝑐𝑟𝑢𝑎𝑙𝑠𝑖𝑡 = 𝛽0 + 𝛽1 (1
𝐴𝑆𝑆𝐸𝑇𝑆𝑖𝑡−1
) + 𝛽2(∆𝑆𝐴𝐿𝐸𝑆𝑖𝑡 − ∆𝑅𝐸𝐶𝑖𝑡) + 𝛽3𝑃𝑃𝐸𝑖𝑡 + 𝛽4𝑅𝑂𝐴𝑖,𝑡 + 𝜀𝑖𝑡
Where sales is the Compustat item DATA12, receivables is the Compustat item
DATA2, assets is the Compustat item DATA6, net property, plants and equipment is
the Compustat item DATA141, and income before extraordinary items is the
Compustat item DATA18.
REM CFO
We follow Roychowdhury (2006) to compute abnormal cash flow from operations.
For every Fama-French industry and fiscal year, abnormal cash flow from operations
are the residuals of the following regression:
𝐶𝐹𝑂𝑖𝑡 = 𝛽0 + 𝛽1 (1
𝐴𝑆𝑆𝐸𝑇𝑆𝑖𝑡−1
) + 𝛽2𝑆𝐴𝐿𝐸𝑆𝑖𝑡 + 𝛽3𝛥𝑆𝐴𝐿𝐸𝑆𝑖𝑡 + 𝜀𝑖𝑡
Where CFO is the cash flow from operation (Compustat DATA308) scaled by lagged
total assets, SALES (Compustat DATA12) is sales scaled by lagged total assets
(Compustat DATA6), and ΔSALES is the change in sales scaled by lagged total assets.
Abnormal decreases in cash flow from operations are used as a signal of sales
manipulation (cash inflow per sale is lower as margins decline due to price discounts
or more lenient credit terms). We multiply the residuals by -1, to obtain a positive
number for an abnormal decrease in cash flow from operations.
REM Prod
We follow Roychowdhury (2006) to compute abnormal production costs. We define
production costs as costs of goods sold (Compustat DATA41) plus inventories
(Compustat DATA3) scaled by lagged total assets (Compustat DATA6).
For every Fama-French industry and fiscal year, abnormal productions costs are the
residuals of the following regression:
𝑃𝑅𝑂𝐷𝑖𝑡 = 𝛽0 + 𝛽1 (1
𝐴𝑆𝑆𝐸𝑇𝑆𝑖𝑡−1) + 𝛽2𝑆𝐴𝐿𝐸𝑆𝑖𝑡 + 𝛽3𝛥𝑆𝐴𝐿𝐸𝑆𝑖𝑡 + 𝛽4𝛥𝐿𝑆𝐴𝐿𝐸𝑆𝑖𝑡 + 𝜀𝑖𝑡
Where SALES (Compustat DATA12) is sales scaled by lagged total assets (Compustat
DATA6), ΔSALES is the change in sales scaled by lagged total assets, and ΔLSALES
is the lagged change in sales scaled by lagged total assets.

36
REM Disc. Exp.
We follow Roychowdhury (2006) to compute abnormal reductions of discretionary
expenditure. We define discretionary expenditures as R&D (Compustat DATA46)
plus advertising (Compustat DATA45) plus SG&A (Compustat DATA132) scaled by
lagged total assets (Compustat DATA6).
For every Fama-French industry and fiscal year, abnormal discretionary expenditures
are the residuals of the following regression:
𝐷𝐼𝑆𝐶. 𝐸𝑋𝑃 = 𝛽0 + 𝛽1 (1
𝐴𝑆𝑆𝐸𝑇𝑆𝑖𝑡−1
) + 𝛽2𝑆𝐴𝐿𝐸𝑆𝑖𝑡 + 𝜀𝑖𝑡
Where SALES (Compustat DATA12) is sales scaled by lagged total assets (Compustat
DATA6).
Abnormal reductions in discretionary expenses are used as an attempt to reduce
reported expenses to increase earnings. We multiply the residuals by -1, to obtain a
positive number for an abnormal decrease in discretionary expenditures.
REM Total
Sum of real activities manipulations that are earnings-increasing. That is sum of
abnormal decreases in cash flow from operations, abnormal increases in costs of
productions, and abnormal decreases in discretionary expenditures:
𝑅𝐸𝑀 𝑇𝑂𝑇𝐴𝐿𝑖𝑡 = 𝑅𝐸𝑀 𝐶𝐹𝑂𝑖𝑡 + 𝑅𝐸𝑀 𝑃𝑅𝑂𝐷𝑖𝑡 + 𝑅𝐸𝑀 𝐷𝑖𝑠𝑐. 𝐸𝑥𝑝.𝑖𝑡
Distraction
We use the measure of investor distraction developed by Kempf, Manconi and Spalt
(2017). We obtain the data for the period 1986-2010 from Alberto Manconi. They
compute an investor-level distraction score, and then aggregate across all investors
in the firm. 𝐷𝑖𝑠𝑡𝑟𝑎𝑐𝑡𝑖𝑜𝑛𝑖𝑞 measures how much institutional investors of the firm i
are distracted at quarter q:
𝐷𝑖𝑠𝑡𝑟𝑎𝑐𝑡𝑖𝑜𝑛𝑖𝑞 = ∑ ∑ 𝑤𝑖𝑓𝑞−1 ∗ 𝑤𝑖𝑞−1𝐼𝑁𝐷 ∗ 𝐼𝑆𝑖𝑞
𝐼𝑁𝐷
𝐼𝑁𝐷=12
𝐼𝑁𝐷=1
𝑓=𝑁
𝑓=1
Where:
𝐼𝑆𝑖𝑞𝐼𝑁𝐷 captures whether a distracting event occurs in another industry, that is whether
there is an industry shock (highest or lowest return across all 12 Fama-French
industries).
𝑤𝑖𝑞−1𝐼𝑁𝐷 captures how much investor f cares about the other industry (other than the
industry of firm i), that it the weight of each other industry in its portfolio.
𝑤𝑖𝑓𝑞−1 captures both the weight of investor f in the firm i and the weight of firm in
investor’s f portfolio:
𝑤𝑖𝑓𝑞−1 =𝑄𝑃𝐹𝑤𝑒𝑖𝑔ℎ𝑡𝑖𝑓𝑞−1 + 𝑄𝑃𝑒𝑟𝑐𝑂𝑤𝑛𝑖𝑓𝑞−1
∑ (𝑄𝑃𝐹𝑤𝑒𝑖𝑔ℎ𝑡𝑖𝑓𝑞−1 + 𝑄𝑃𝑒𝑟𝑐𝑂𝑤𝑛𝑖𝑓𝑞−1)𝑓=𝑁𝑓=1
With 𝑃𝑒𝑟𝑐𝑂𝑤𝑛𝑖𝑓𝑞−1 the fraction of firm i’s shares held by investor f,
𝑃𝐹𝑤𝑒𝑖𝑔ℎ𝑡𝑖𝑓𝑞−1 the market value weight of firm i in investor f’s portfolio. To
minimize the impact of outliers and measurement error, they sort all stocks held by
investor f in quarter q-1 by 𝑃𝐹𝑤𝑒𝑖𝑔ℎ𝑡𝑖𝑓𝑞−1 into quintiles, denoted 𝑄𝑃𝐹𝑤𝑒𝑖𝑔ℎ𝑡𝑖𝑓𝑞−1.
Similarly, they sort firm i’s shareholders by 𝑃𝑒𝑟𝑐𝑂𝑤𝑛𝑖𝑓𝑞−1 into quintiles, denoted
𝑄𝑃𝑒𝑟𝑐𝑂𝑤𝑛𝑖𝑓𝑞−1.
Size
Natural logarithm of total assets (Compustat DATA6).
Book Leverage
Total debt (Compustat DATA34 + DATA9) divided by total assets (Compustat
DATA6).

37
Book-to-Market
Total assets (Compustat DATA6) divided by market capitalization (Compustat
DATA25 * DATA199) plus preferred stocks (Compustat DATA10), total debt
(Compustat DATA34 + DATA9) and minus deferred taxes (Compustat DATA74).
Profitability
Return on assets defined as income before extraordinary items divided by total assets
(Compustat DATA18 / DATA6 )
Asset Growth
Change in total assets divided by lagged total assets (Compustat DATA6).
Momentum
Cumulated monthly returns in excess of the CRPS universe value-weighted returns
over the last twelve months (CRPS: RET - VWRET). We correct for delisting as in
Shumway (1997).
Volatility
Standard deviation of the monthly return in excess of the CRPS universe value-
weighted returns over the last three years.
Analyst Coverage
Number of analysts forecasting one-year-ahead earnings (IBES numest).
Institutional Ownership
Institutional investor ownership expressed as a percentage of a firm’s total shares
outstanding (Thomson Reuters 13-F Filings database).