distributed and collaborative software evolution analysis ... · distributed and collaborative...
TRANSCRIPT

Distributed and Collaborative Software Evolution
Analysis with Churrasco
Marco D’Ambrosa, Michele Lanzaa
aREVEAL @ Faculty of Informatics - University of Lugano, Switzerland
Abstract
Analyzing the evolution of large and long-lived software systems is a com-plex problem that requires extensive tool support due to the amount andcomplexity of the data that needs to be processed. In this paper we presentChurrasco, a tool to support collaborative software evolution analysis througha web interface. After describing the tool and its architecture, we provide ausage scenario of Churrasco on a large open source software system and wepresent two collaboration experiments performed with respectively 8 and 4participants.
Key words: Software Evolution Analysis, Collaboration, Visualization
1. Introduction
Software evolution analysis is concerned with the causes and the effectsof software change. There is a large number of approaches, which all usedifferent types of information about the history and the (evolving) structureof a system. The overall goal is on the one hand to perform retrospectiveanalysis, useful for a number of maintenance activities, and on the other handto predict the future evolution of a system. Such analyses are intrinsicallycomplex, because modeling the evolution of complex systems implies
1. the retrieval of data from software repositories, managed by softwareconfiguration management systems such as CVS or SVN,
2. the parsing of the obtained raw data to extract relevant facts and tominimize the noise that such large data sets exhibit, and
Email addresses: [email protected] (Marco D’Ambros),[email protected] (Michele Lanza)
Preprint submitted to Experimental Software Toolkits March 2, 2010
3. the population of models that are then the basis for any analysis. Toolssupporting software evolution analysis should hide these tasks from theusers, to let them focus on the actual analysis.
Moreover, such tools should provide means to break down informationcomplexity, typical for large and long-lived software systems. We argue thatany software evolution analysis tool should possess the following character-istics:
Flexible Meta-model. Several, and largely similar, approaches have beenproposed to create and populate a model of an evolving software sys-tem, considering a variety of information sources, such as the historiesof software artifacts (as recorded by a versioning system), the problemreports stored by systems such as Bugzilla [1], e-mail archives, user doc-umentation [2], etc. Even if such models are appropriate for modelingthe evolution, they are “hard-coded” in the sense that their creatorstook deliberate design choices in accordance with their research goals.We postulate that software evolution tools should be flexible with re-spect to the underlying meta-model: If the meta-model is changed orextended because some new type of information is at hand or becausesome new analysis is required, the tool should adapt itself to the newmeta-model.
Accessibility. Researchers have developed a plethora of evolution anal-ysis tools and environments. One commonality among many proto-types is their limited usability, i.e., often only the developers them-selves know how to use them, thus hindering the development and/orcross-fertilization of novel analysis techniques. There are some notableexceptions, such as Moose [4], which have been used by a large numberof researchers over the years. Researchers also investigated ways toexchange information about software systems [5, 6], approaches whichhowever are seldom followed up because of lack of time or manpower.We argue that software evolution tools should be easily accessible: Theyshould be usable from any machine running any operating system, with-out any strings attached.
Incremental Storage of Results. Results of analyses and findings onsoftware systems produced by tools are often written into files and/ormanually crafted reports, and are therefore of limited use. We claim
2
that analysis results should be incrementally and consistently storedback into the analyzed models: This allows researchers to develop novelanalyses that exploit from the results of a previous analysis (cross-fertilization of ideas/results). It can also serve as a basis for a bench-mark for analyses targeting the same problem, and ultimately wouldalso allow one to to combine techniques targeting different problems.
Support for Collaboration. The need of collaboration in software devel-opment is getting more and more attention. Tools which support col-laboration, such as Jazz for Eclipse [7], were only recently introduced,but hint at a larger current trend. Just as the software developmentteams are geographically distributed, consultants and analysts are too.Specialists in different domains of expertise should be allowed to col-laborate without the need of being phisically present together. Becauseof these reasons, we argue that software evolution analysis should bea collaborative activity. As a consequence, software evolution analysistools should support collaboration, by allowing different users, with dif-ferent expertises, from different locations, to collaboratively analyze asystem.
We present Churrasco [8], a tool for collaborative software analysis, whichis available at http://churrasco.inf.unisi.ch. Churrasco has the follow-ing characteristics:
• It hides all data retrieval and processing tasks from the users, to letthem focus on the actual analysis, and provides an easily accessibleinterface over a web browser to model the data sources to be analyzed.
• It copes with modeling and populating problems by providing a flexi-ble and extensible object-relational persistency mechanism. Any datameta-model can be dynamically changed and extended, and all the datais stored in a central database.
• It provides a set of collaborative visual analyses and supports collabo-rative analysis by allowing users to annotate the analyzed data.
• It stores the findings into a central database to create an incrementallyenriched body of knowledge about a system, which can be exploited bysubsequent users.
3
Structure of the paper. In Section 2 we describe the Churrasco framework,its architecture, and its main components. We then provide an example of acollaborative session and describe two collaboration experiments performedwith Churrasco (Section 3). We discuss our approach in Section 4 and exam-ine tool building issues in Section 5. We survey related work in Section 6, andconclude in Section 7 with a summary of our contributions and directions offuture work.
2. Churrasco
Extensible Evolutionary meta-model
Target System
SVN Repository
Bugzilla RepositorySource Code
MOOSEReengineering Environment
Bugzilla Module
SVN Module
Meta-baseDatabase
Object relational mapping module
(GLORP)Visualization
Module
Bugzilla bugs & activities
SVN
Annotation Module
Annotationmeta-model
EMOF description
Versioning systemmeta-model
EMOF description EMOF description
EMOF description
Defect meta-model
FAMIXmeta-model
EMOF description
...
Churrasco Components External Components
1
2
3
56
4System
ComplexityEvolution Radar
Correlation View
Timeline View
Web PortalVisualizerImporter
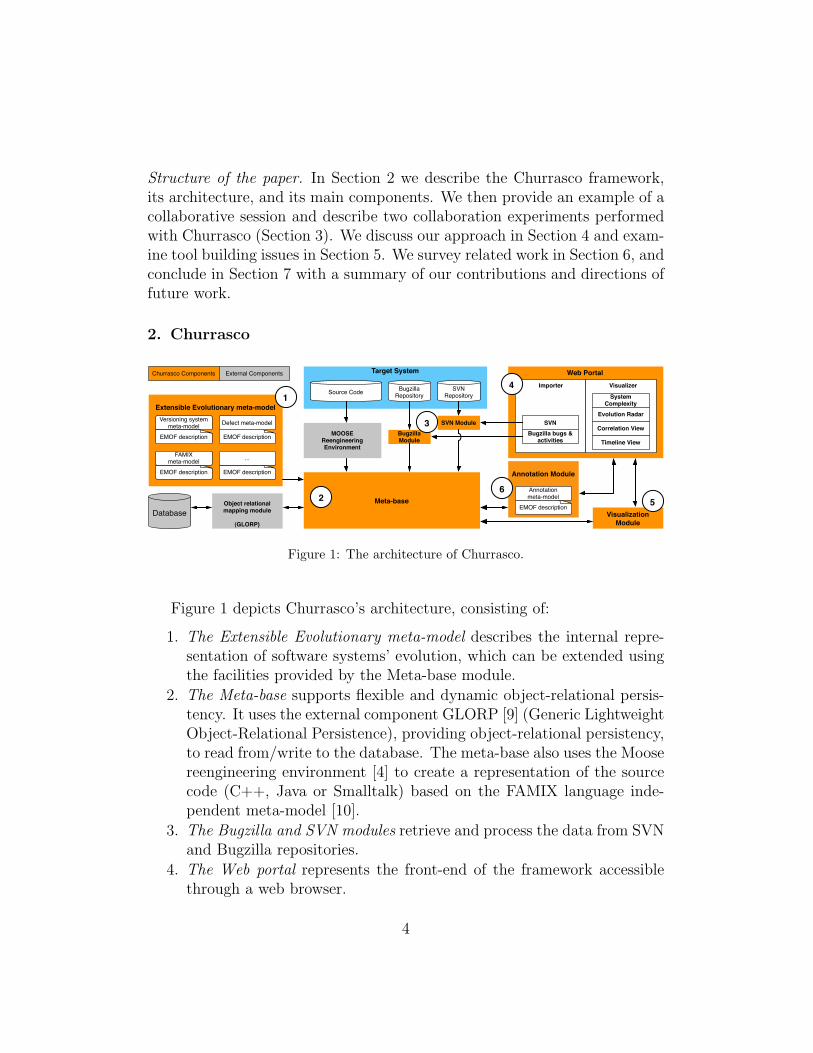
Figure 1: The architecture of Churrasco.
Figure 1 depicts Churrasco’s architecture, consisting of:
1. The Extensible Evolutionary meta-model describes the internal repre-sentation of software systems’ evolution, which can be extended usingthe facilities provided by the Meta-base module.
2. The Meta-base supports flexible and dynamic object-relational persis-tency. It uses the external component GLORP [9] (Generic LightweightObject-Relational Persistence), providing object-relational persistency,to read from/write to the database. The meta-base also uses the Moosereengineering environment [4] to create a representation of the sourcecode (C++, Java or Smalltalk) based on the FAMIX language inde-pendent meta-model [10].
3. The Bugzilla and SVN modules retrieve and process the data from SVNand Bugzilla repositories.
4. The Web portal represents the front-end of the framework accessiblethrough a web browser.
4
5. The Visualization module supports software evolution analysis by cre-ating and exporting interactive Scalable Vector Graphics (SVG) visu-alizations.
6. The Annotation module supports collaborative analysis by enrichingany entity in the system with annotations. It communicates with theweb visualizations to depict the annotations within the visualizations.
2.1. The Meta-base
Churrasco’s Meta-base [11] provides flexibility and persistency to anymeta-model, in particular to our evolution meta-model. It takes as input ameta-model described in EMOF and outputs a descriptor, which defines themapping between the object instances of the meta-model, i.e., the model, andtables in the database. EMOF (Essential Meta Object Facilities) is a subsetof MOF1, a meta-meta-model used to describe meta-models. The Meta-baseensures persistency with the object-relational module GLORP. By generat-ing descriptors of the mapping between the database and the meta-model,the Meta-base can be adapted dynamically and automatically to any meta-model. This allows Churrasco users to modify and extend dynamically anymeta-model. For more details, we refer the interested reader to [11].
2.2. The SVN and Bugzilla modules
These modules retrieve and process data from, respectively, Subversionand Bugzilla repositories. They take as input the URL of the repositories andthen populate the models using the Meta-base. They are initially launchedfrom the web importer (discussed later) to create the models, and then theyautomatically update all the models in the database every night, with thenew information (new commits or bug reports).
The SVN module populates the versioning system model, by checkingout (or updating) the project with the given repository, creating and parsingSVN log files. The checked out system is then used to create the FAMIXmodel of the system with the external component Moose.
The Bugzilla module retrieves and parses all the bug reports (in XML for-mat) from the given repository. Subsequently it populates the correspondingpart of the defect model. It then retrieves all bug activities from the given
1MOF and EMOF are standards defined by the OMG (Object Management Group)for Model Driven Engineering. For more details consult the specications at: http://www.omg.org/docs/html/06-01-01/Output/06-01-01.htm
5
repository. Since Bugzilla does not provide this information in XML format,Churrasco parses HTML pages and populates the corresponding part of themodel. Finally, it links software artifacts with bug reports. To do this it com-bines the technique proposed by Fischer et al. [1] (matching bug report IDsand keywords in the commit comments) with a timestamp-based approach.
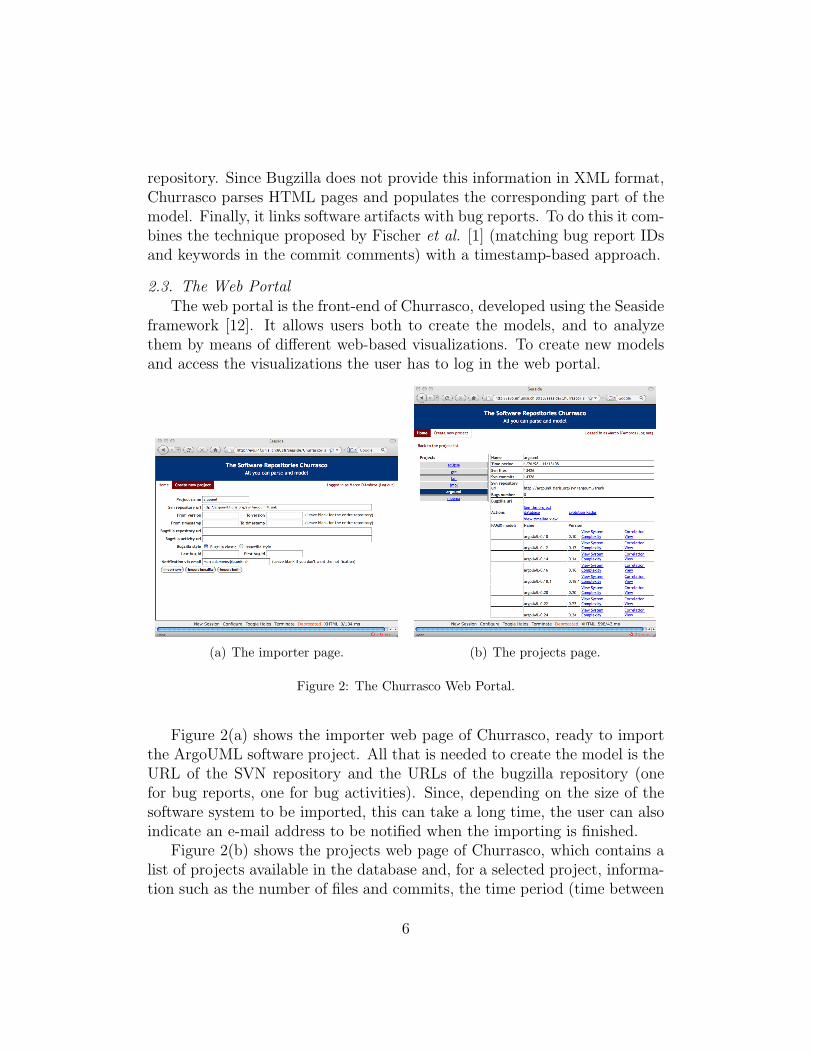
2.3. The Web PortalThe web portal is the front-end of Churrasco, developed using the Seaside
framework [12]. It allows users both to create the models, and to analyzethem by means of different web-based visualizations. To create new modelsand access the visualizations the user has to log in the web portal.
(a) The importer page. (b) The projects page.
Figure 2: The Churrasco Web Portal.
Figure 2(a) shows the importer web page of Churrasco, ready to importthe ArgoUML software project. All that is needed to create the model is theURL of the SVN repository and the URLs of the bugzilla repository (onefor bug reports, one for bug activities). Since, depending on the size of thesoftware system to be imported, this can take a long time, the user can alsoindicate an e-mail address to be notified when the importing is finished.
Figure 2(b) shows the projects web page of Churrasco, which contains alist of projects available in the database and, for a selected project, informa-tion such as the number of files and commits, the time period (time between
6
the first and last commit), the number of bugs, a collection of FAMIX mod-els corresponding to different versions of the system etc. Finally, the pagealso provides a set of actions to the user, i.e., links to the web visualizationsprovided by Churrasco.
2.4. The Visualization Module
This module offers the following set of interactive visualizations that sup-port software evolution analysis:
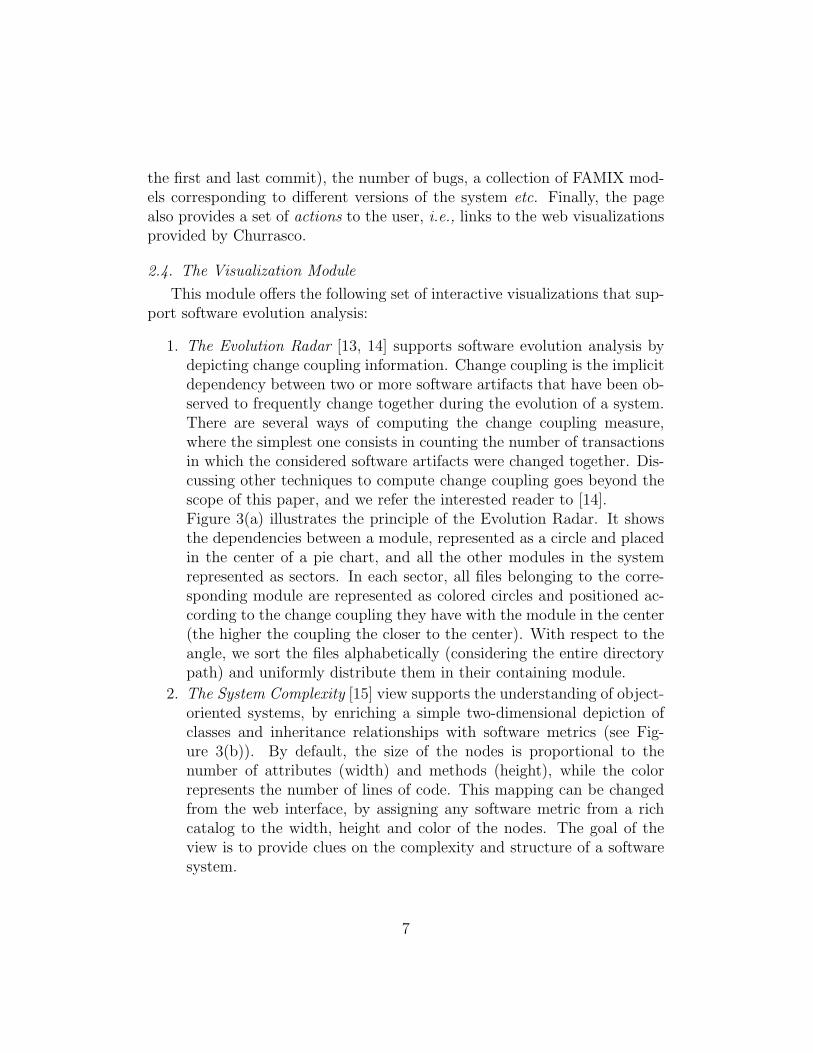
1. The Evolution Radar [13, 14] supports software evolution analysis bydepicting change coupling information. Change coupling is the implicitdependency between two or more software artifacts that have been ob-served to frequently change together during the evolution of a system.There are several ways of computing the change coupling measure,where the simplest one consists in counting the number of transactionsin which the considered software artifacts were changed together. Dis-cussing other techniques to compute change coupling goes beyond thescope of this paper, and we refer the interested reader to [14].Figure 3(a) illustrates the principle of the Evolution Radar. It showsthe dependencies between a module, represented as a circle and placedin the center of a pie chart, and all the other modules in the systemrepresented as sectors. In each sector, all files belonging to the corre-sponding module are represented as colored circles and positioned ac-cording to the change coupling they have with the module in the center(the higher the coupling the closer to the center). With respect to theangle, we sort the files alphabetically (considering the entire directorypath) and uniformly distribute them in their containing module.
2. The System Complexity [15] view supports the understanding of object-oriented systems, by enriching a simple two-dimensional depiction ofclasses and inheritance relationships with software metrics (see Fig-ure 3(b)). By default, the size of the nodes is proportional to thenumber of attributes (width) and methods (height), while the colorrepresents the number of lines of code. This mapping can be changedfrom the web interface, by assigning any software metric from a richcatalog to the width, height and color of the nodes. The goal of theview is to provide clues on the complexity and structure of a softwaresystem.
7
(a) Evolution Radar.
Class A
Class B
Width metric
Height metric Color metric
(greyscale)
Inheritance relation
(b) System Complexity.
x
y
Heightmetric
Widthmetric
Colormetric
Outlier
x metric
ymetric
(c) Correlation View.
Figure 3: Evolution Radar, System Complexity and Correlation View principles.
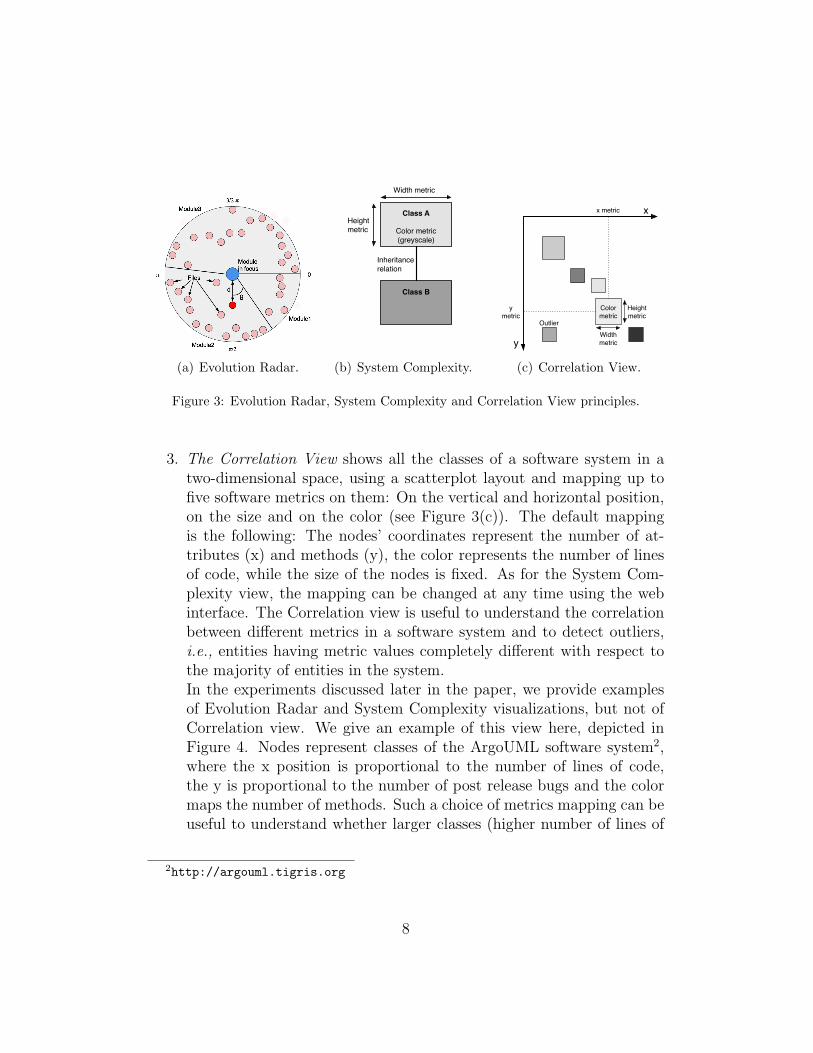
3. The Correlation View shows all the classes of a software system in atwo-dimensional space, using a scatterplot layout and mapping up tofive software metrics on them: On the vertical and horizontal position,on the size and on the color (see Figure 3(c)). The default mappingis the following: The nodes’ coordinates represent the number of at-tributes (x) and methods (y), the color represents the number of linesof code, while the size of the nodes is fixed. As for the System Com-plexity view, the mapping can be changed at any time using the webinterface. The Correlation view is useful to understand the correlationbetween different metrics in a software system and to detect outliers,i.e., entities having metric values completely different with respect tothe majority of entities in the system.In the experiments discussed later in the paper, we provide examplesof Evolution Radar and System Complexity visualizations, but not ofCorrelation view. We give an example of this view here, depicted inFigure 4. Nodes represent classes of the ArgoUML software system2,where the x position is proportional to the number of lines of code,the y is proportional to the number of post release bugs and the colormaps the number of methods. Such a choice of metrics mapping can beuseful to understand whether larger classes (higher number of lines of
2http://argouml.tigris.org
8
# bugs
LOC
B
A
Figure 4: A Correlation view applied to the ArgoUML software system. Nodes representclasses, nodes’ position represents number of lines of code (x) and number of post releasebugs (y), and nodes’ color maps the number of methods.
code) generate more bugs. This correlation does not hold in the case ofArgoUML (see Figure 4). Moreover, we spot some outliers in the view:The one marked as “A”, which has an outstanding number of bugs,and the ones marked as “B”, with an outstanding number of lines ofcode.
The visualizations are created using the Mondrian framework [16] (re-siding in Moose) and the Episode framework [17] (residing in Churrasco’svisualization module). To make the visualizations interactive within the webportal, Episode attaches Ajax callbacks to the figures.
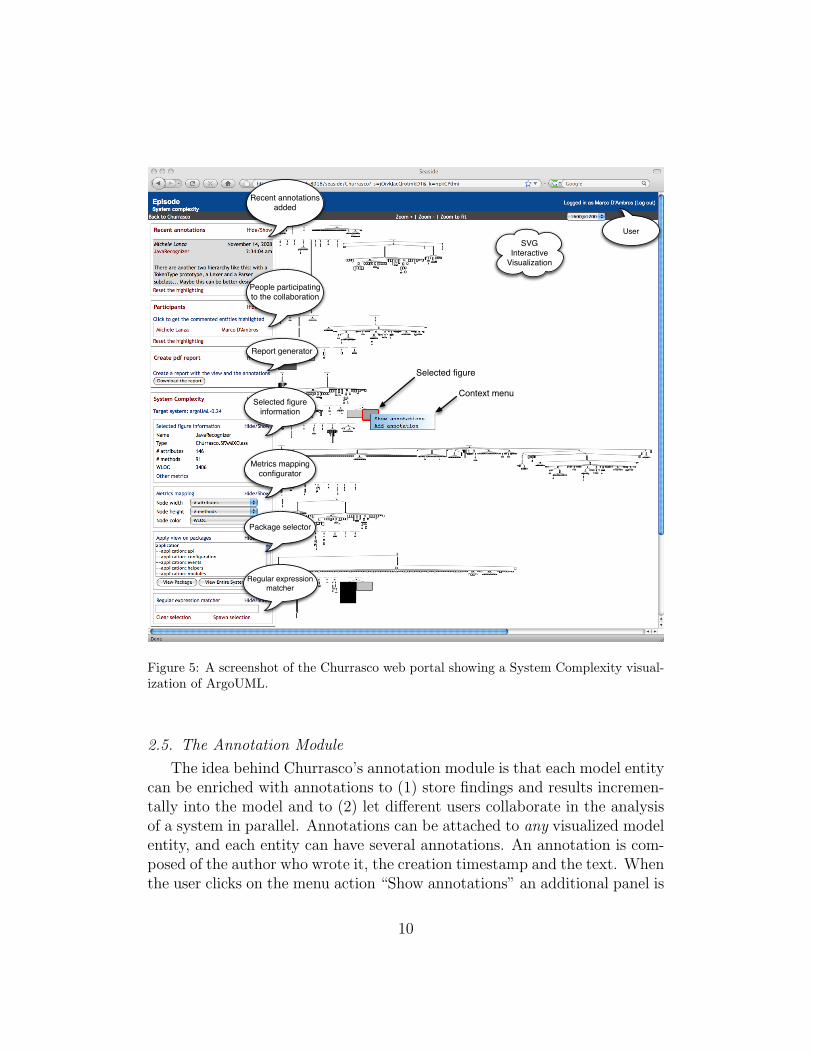
Figure 5 shows an example of a System Complexity visualization renderedin the Churrasco web portal. The main panel is the view where all the figuresare rendered as SVG graphics. The figures are interactive: Clicking on one ofthem will highlight the figure (red boundary), generate a context menu andshow the figure details (the name, type and metrics values) in the figure in-formation panel on the left. Under the information panel Churrasco providesthree other panels useful to configure and interact with the visualization:
1. The metrics mapping configurator which allows the user to customizethe view by changing the metrics mapping.
2. The package selector which allows the user to select, and then visualize,multiple packages or the entire system.
3. The regular expression matcher with which the user can select entitiesin the visualization according to a regular expression.
9
SVG Interactive
Visualization
Recent annotationsadded
People participating to the collaboration
Selected figureinformation
Metrics mappingconfigurator
Package selector
Regular expressionmatcher
User
Selected figure
Context menu
Report generator
Figure 5: A screenshot of the Churrasco web portal showing a System Complexity visual-ization of ArgoUML.
2.5. The Annotation Module
The idea behind Churrasco’s annotation module is that each model entitycan be enriched with annotations to (1) store findings and results incremen-tally into the model and to (2) let different users collaborate in the analysisof a system in parallel. Annotations can be attached to any visualized modelentity, and each entity can have several annotations. An annotation is com-posed of the author who wrote it, the creation timestamp and the text. Whenthe user clicks on the menu action “Show annotations” an additional panel is
10
rendered at the top left corner of the web page (above the recent annotationpanel). The panel shows all the annotations for the selected entity and allowsthe user to delete (only) his/her annotations. Clicking on the “Add annota-tion” menu item will result in displaying another panel (again in the top leftcorner) that allows the user to write and add new annotations to the selectedentity. Since the annotations are stored in a centralized database, any newannotation is immediately visible to all the people using Churrasco, thus al-lowing different users to collaborate in the analysis. Churrasco features threeother panels aimed at supporting collaboration:
1. The “Recent annotations” panel displays the most recent annotationsadded, together with the name of the annotated entity, and by clickingon it the user can highlight the corresponding figure in the visualization.
2. The “Participants” panel lists all the people who annotated the visual-izations, i.e., people collaborating in the analysis. When one of thesenames is clicked, all the figures annotated by the corresponding personare highlighted in the view, to see which part of the system that personis working on.
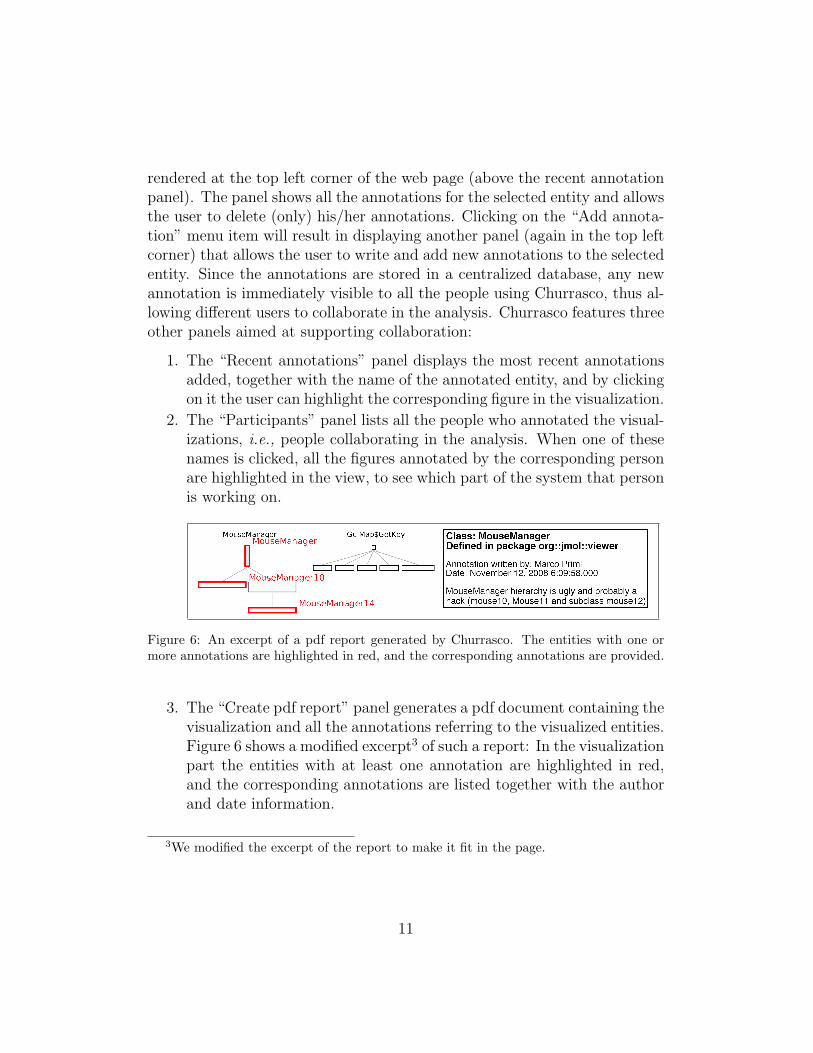
Figure 6: An excerpt of a pdf report generated by Churrasco. The entities with one ormore annotations are highlighted in red, and the corresponding annotations are provided.
3. The “Create pdf report” panel generates a pdf document containing thevisualization and all the annotations referring to the visualized entities.Figure 6 shows a modified excerpt3 of such a report: In the visualizationpart the entities with at least one annotation are highlighted in red,and the corresponding annotations are listed together with the authorand date information.
3We modified the excerpt of the report to make it fit in the page.
11
3. Churrasco in Action
We show Churrasco’s use through one simple example scenario, presentednext, and two collaboration experiments with respectively 8 and 4 partici-pants.
3.1. Analyzing ArgoUML
FacadeMDRImpl
FacadeUmlFactoryMDRImpl
Factoryhierarchy
AbstractModelFactoryhierarchy
Model package(Marco's view)
Entire system(Michele's view)
FacadeMDRImpl
Factoryhierarchy
AbstractModelFactoryhierarchy
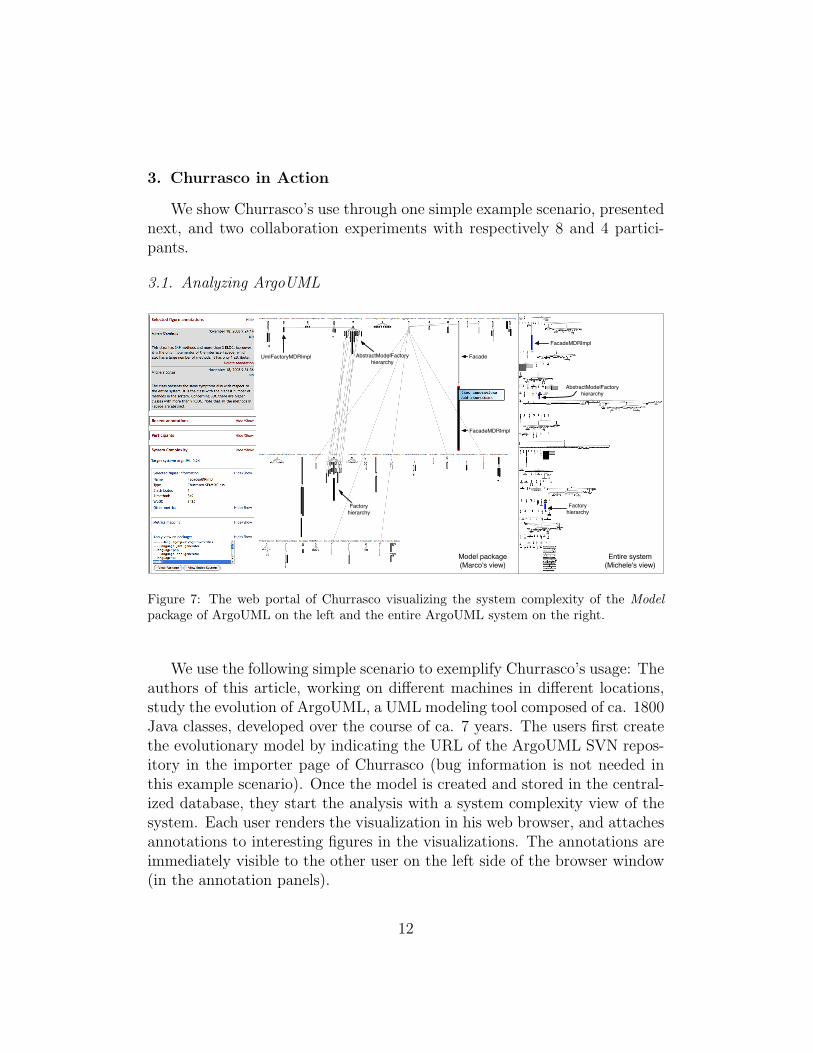
Figure 7: The web portal of Churrasco visualizing the system complexity of the Modelpackage of ArgoUML on the left and the entire ArgoUML system on the right.
We use the following simple scenario to exemplify Churrasco’s usage: Theauthors of this article, working on different machines in different locations,study the evolution of ArgoUML, a UML modeling tool composed of ca. 1800Java classes, developed over the course of ca. 7 years. The users first createthe evolutionary model by indicating the URL of the ArgoUML SVN repos-itory in the importer page of Churrasco (bug information is not needed inthis example scenario). Once the model is created and stored in the central-ized database, they start the analysis with a system complexity view of thesystem. Each user renders the visualization in his web browser, and attachesannotations to interesting figures in the visualizations. The annotations areimmediately visible to the other user on the left side of the browser window(in the annotation panels).
12
While Michele is analyzing the entire system, Marco focuses on the Modelpackage, which contains several classes characterized by large number ofmethods and many lines of code. The entities annotated by Marco in thefine-grained view are then visible to Michele in the coarse-grained systemcomplexity. Marco has the advantage of a more focused view, while Michelesees the entire context. Figure 7 shows Marco’s view on the left, whileMichele’s one is depicted on the right. Marco selected the FacadeMDRImplclass (highlighted in red in Marco’s view), and is reading Michele’s com-ments about that class (highlighted in blue in Michele’s view). These aretwo examples of collaboration:
1. Marco, focusing on the Model namespace, annotates that the class Fa-cadeMDRImpl shows symptoms of bad design: It has 350 methods,3400 lines of code, only 3 attributes, and it is the only implementor ofthe Facade interface. Michele adds a second annotation that Marco’sobservation holds also with respect to the entire system, and that Fa-cadeMDRImpl is the class with the highest number of methods in theentire system.
2. Marco sees that several classes in the Factory hierarchy implementthe Factory interface and also inherit from classes belonging to theAbstractModelFactory hierarchy. This is not visible in Michele’s view(where Factory and AbstractModelFactory are highlighed in blue), whodiscovers that fact by highlighting the entities annotated by Marco andthen reading the annotations.
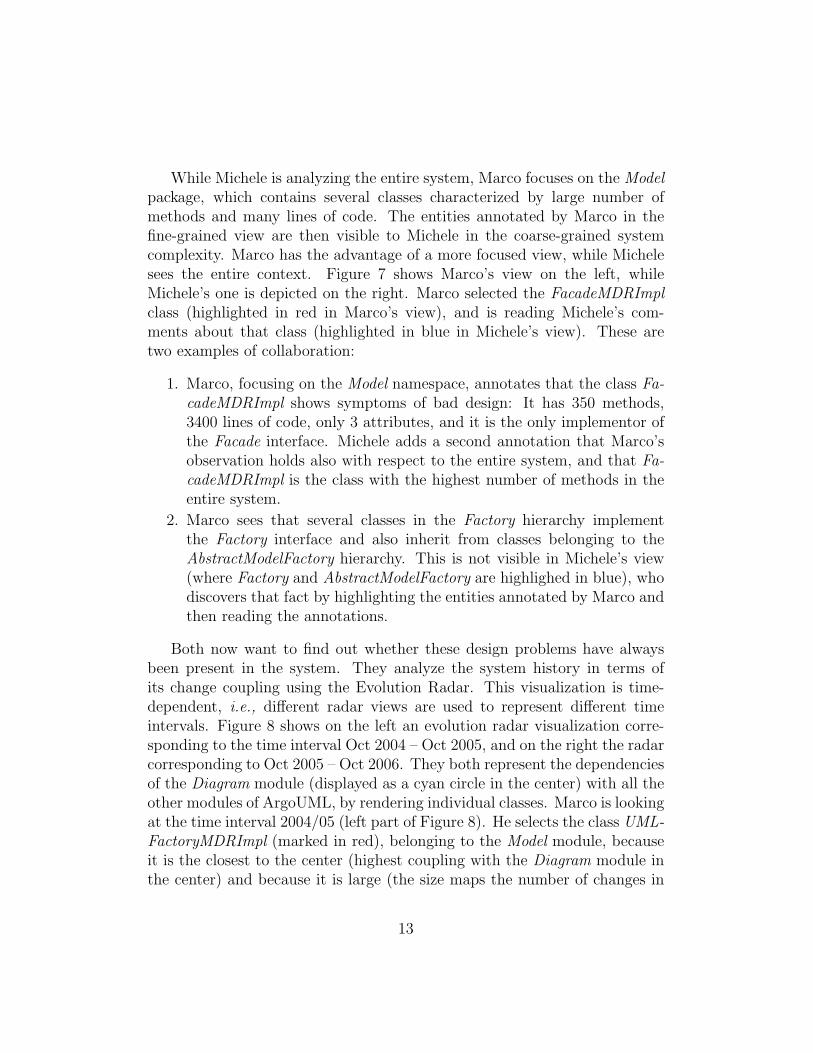
Both now want to find out whether these design problems have alwaysbeen present in the system. They analyze the system history in terms ofits change coupling using the Evolution Radar. This visualization is time-dependent, i.e., different radar views are used to represent different timeintervals. Figure 8 shows on the left an evolution radar visualization corre-sponding to the time interval Oct 2004 – Oct 2005, and on the right the radarcorresponding to Oct 2005 – Oct 2006. They both represent the dependenciesof the Diagram module (displayed as a cyan circle in the center) with all theother modules of ArgoUML, by rendering individual classes. Marco is lookingat the time interval 2004/05 (left part of Figure 8). He selects the class UML-FactoryMDRImpl (marked in red), belonging to the Model module, becauseit is the closest to the center (highest coupling with the Diagram module inthe center) and because it is large (the size maps the number of changes in
13
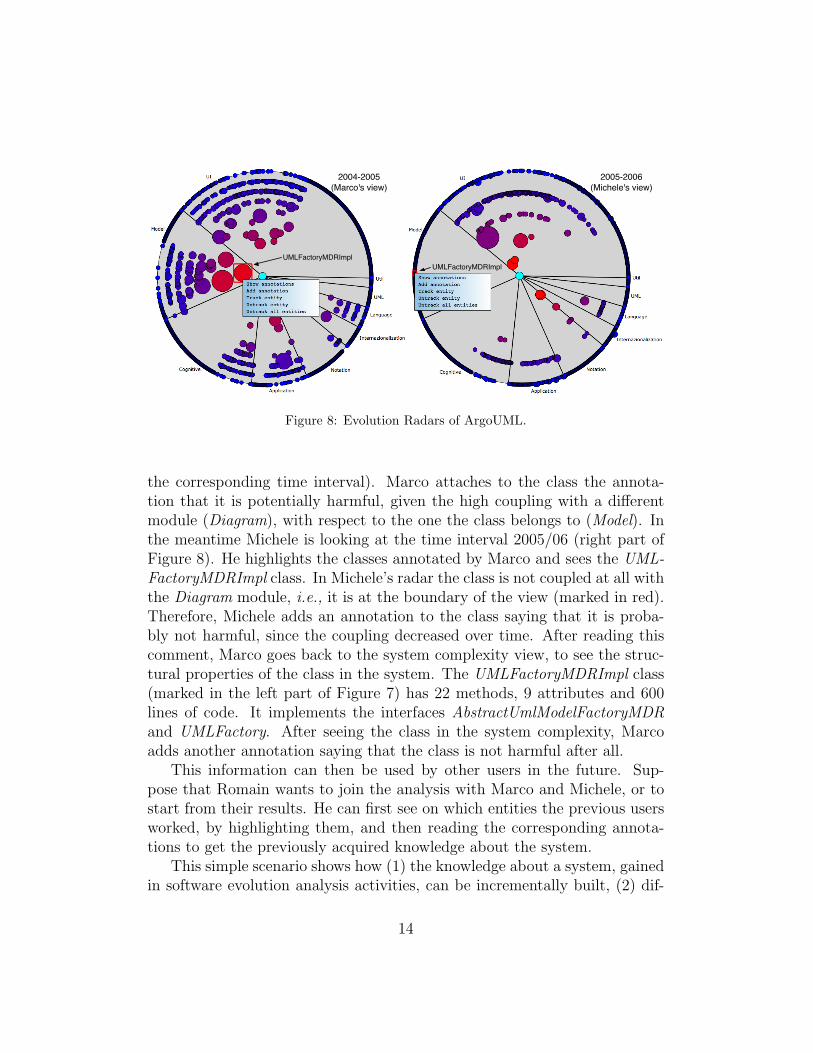
2004-2005(Marco's view)
2005-2006(Michele's view)
UMLFactoryMDRImplUMLFactoryMDRImpl
Figure 8: Evolution Radars of ArgoUML.
the corresponding time interval). Marco attaches to the class the annota-tion that it is potentially harmful, given the high coupling with a differentmodule (Diagram), with respect to the one the class belongs to (Model). Inthe meantime Michele is looking at the time interval 2005/06 (right part ofFigure 8). He highlights the classes annotated by Marco and sees the UML-FactoryMDRImpl class. In Michele’s radar the class is not coupled at all withthe Diagram module, i.e., it is at the boundary of the view (marked in red).Therefore, Michele adds an annotation to the class saying that it is proba-bly not harmful, since the coupling decreased over time. After reading thiscomment, Marco goes back to the system complexity view, to see the struc-tural properties of the class in the system. The UMLFactoryMDRImpl class(marked in the left part of Figure 7) has 22 methods, 9 attributes and 600lines of code. It implements the interfaces AbstractUmlModelFactoryMDRand UMLFactory. After seeing the class in the system complexity, Marcoadds another annotation saying that the class is not harmful after all.
This information can then be used by other users in the future. Sup-pose that Romain wants to join the analysis with Marco and Michele, or tostart from their results. He can first see on which entities the previous usersworked, by highlighting them, and then reading the corresponding annota-tions to get the previously acquired knowledge about the system.
This simple scenario shows how (1) the knowledge about a system, gainedin software evolution analysis activities, can be incrementally built, (2) dif-
14
ferent users from different locations can collaborate, and (3) different visual-ization techniques can be combined to improve the analysis.
3.2. First Collaboration Experiment
The previous example showed that Churrasco supports collaborative anal-ysis. However, the example is hardly a collaborative experiment, because (1)there were only two participants (2) who were the developers of the tool, (3)possessing prior knowledge about the analyzed software system. Therefore,we performed a collaboration experiment, in a more realistic setting, withthe following goals: (1) evaluate whether Churrasco is a good means to sup-port collaboration in software evolution analysis, (2) test the usability of thetool, and (3) test the scalability of the tool with respect to the number ofparticipants.
We performed the experiment in the context of a university course onsoftware design and evolution. The experiment lasted 3 hours: During thefirst 30 minutes we explained the concept of the tool and how to use it, inthe following two hours (with a 15 minutes break in the middle) the studentsperformed the actual experiment and in the last 15 minutes they filled ina questionnaire about the experiment and the tool. The participants were:5 master students, 2 doctoral students working in the software evolutiondomain and 1 professor. The Master students were lectured on reverse engi-neering topics before the experiment.
JMolViewer
Viewer
Graphics3D
Eval
JMolSimpleViewer
JMolPngEncoder
BondIterator
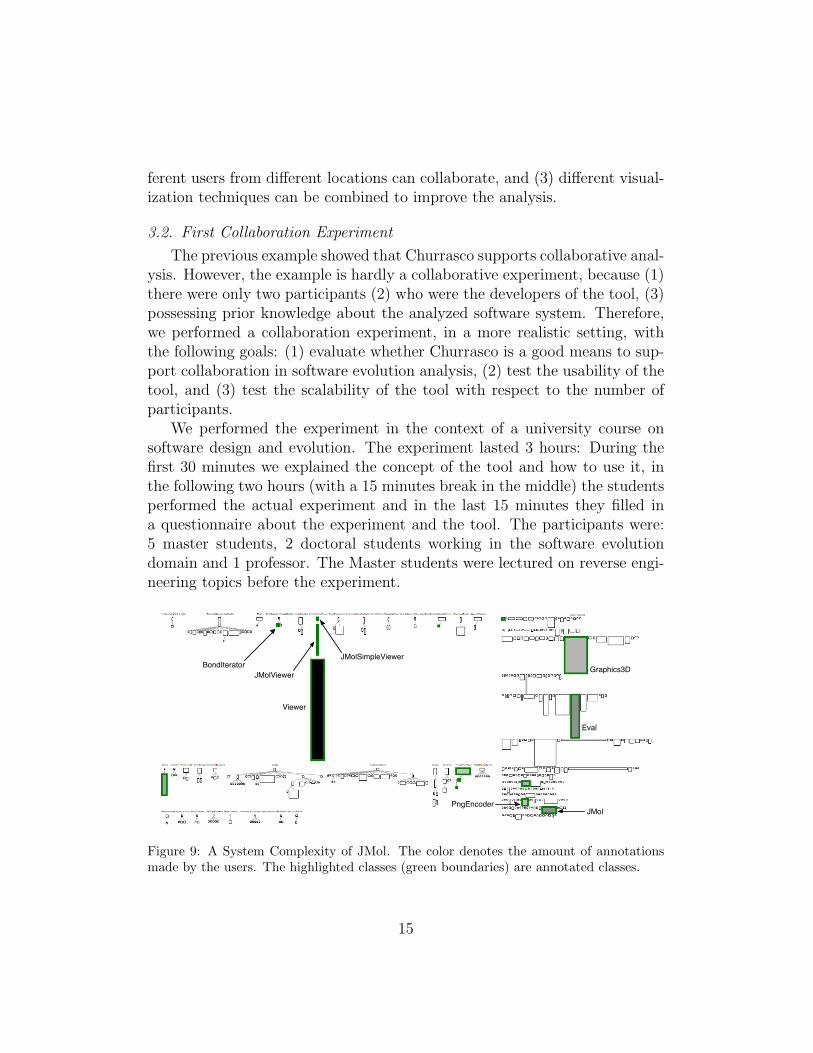
Figure 9: A System Complexity of JMol. The color denotes the amount of annotationsmade by the users. The highlighted classes (green boundaries) are annotated classes.
15
The task consisted in using the System Complexity and the CorrelationView and looking at the source code to (1) discover classes on which onewould focus reengineering efforts (explaining why), and to (2) discover classeswith a big change impact and explain why. The target system chosen for theexperiment was JMol, a 3D viewer for chemical structures, consisting of ca.900 Java classes. Among the participants only one possessed some knowledgeabout the system.
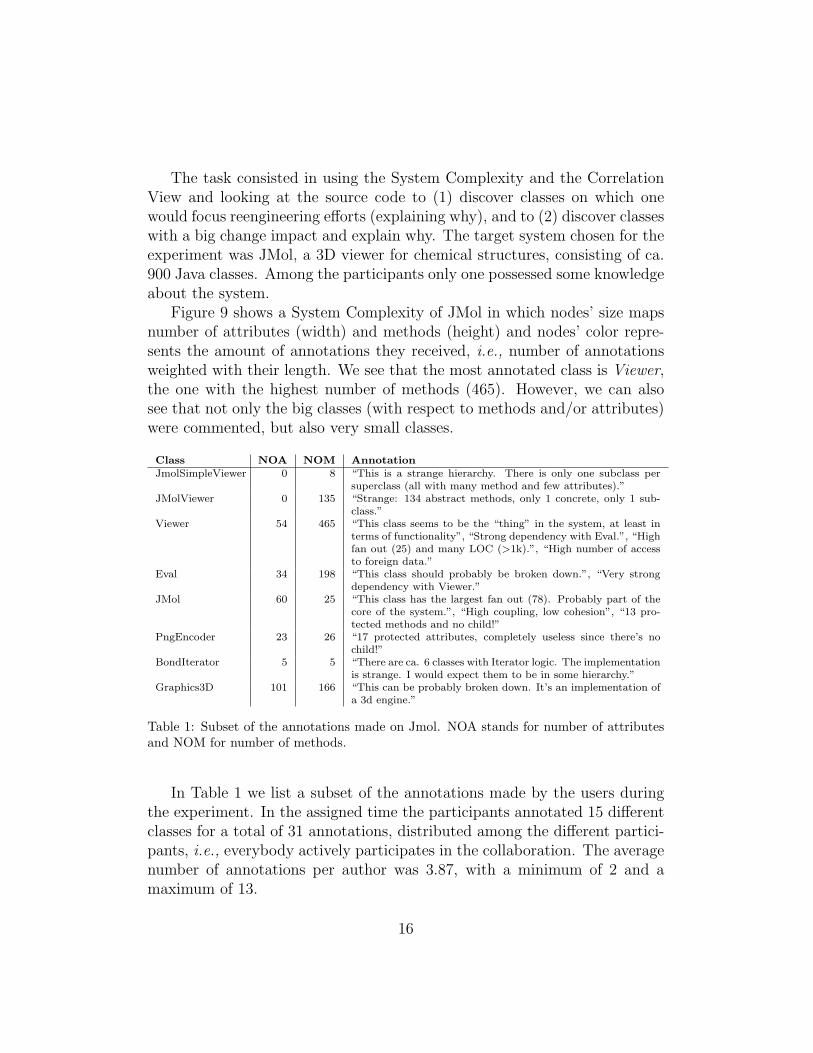
Figure 9 shows a System Complexity of JMol in which nodes’ size mapsnumber of attributes (width) and methods (height) and nodes’ color repre-sents the amount of annotations they received, i.e., number of annotationsweighted with their length. We see that the most annotated class is Viewer,the one with the highest number of methods (465). However, we can alsosee that not only the big classes (with respect to methods and/or attributes)were commented, but also very small classes.
Class NOA NOM AnnotationJmolSimpleViewer 0 8 “This is a strange hierarchy. There is only one subclass per
superclass (all with many method and few attributes).”JMolViewer 0 135 “Strange: 134 abstract methods, only 1 concrete, only 1 sub-
class.”Viewer 54 465 “This class seems to be the “thing” in the system, at least in
terms of functionality”, “Strong dependency with Eval.”, “Highfan out (25) and many LOC (>1k).”, “High number of accessto foreign data.”
Eval 34 198 “This class should probably be broken down.”, “Very strongdependency with Viewer.”
JMol 60 25 “This class has the largest fan out (78). Probably part of thecore of the system.”, “High coupling, low cohesion”, “13 pro-tected methods and no child!”
PngEncoder 23 26 “17 protected attributes, completely useless since there’s nochild!”
BondIterator 5 5 “There are ca. 6 classes with Iterator logic. The implementationis strange. I would expect them to be in some hierarchy.”
Graphics3D 101 166 “This can be probably broken down. It’s an implementation ofa 3d engine.”
Table 1: Subset of the annotations made on Jmol. NOA stands for number of attributesand NOM for number of methods.
In Table 1 we list a subset of the annotations made by the users duringthe experiment. In the assigned time the participants annotated 15 differentclasses for a total of 31 annotations, distributed among the different partici-pants, i.e., everybody actively participates in the collaboration. The averagenumber of annotations per author was 3.87, with a minimum of 2 and amaximum of 13.
16
The annotations were also used to discuss about certain properties of theanalyzed classes. In most of the cases the discussion consisted in combiningdifferent pieces of knowledge about the class (local properties as number ofmethods with properties of the hierarchy with dependency etc.).
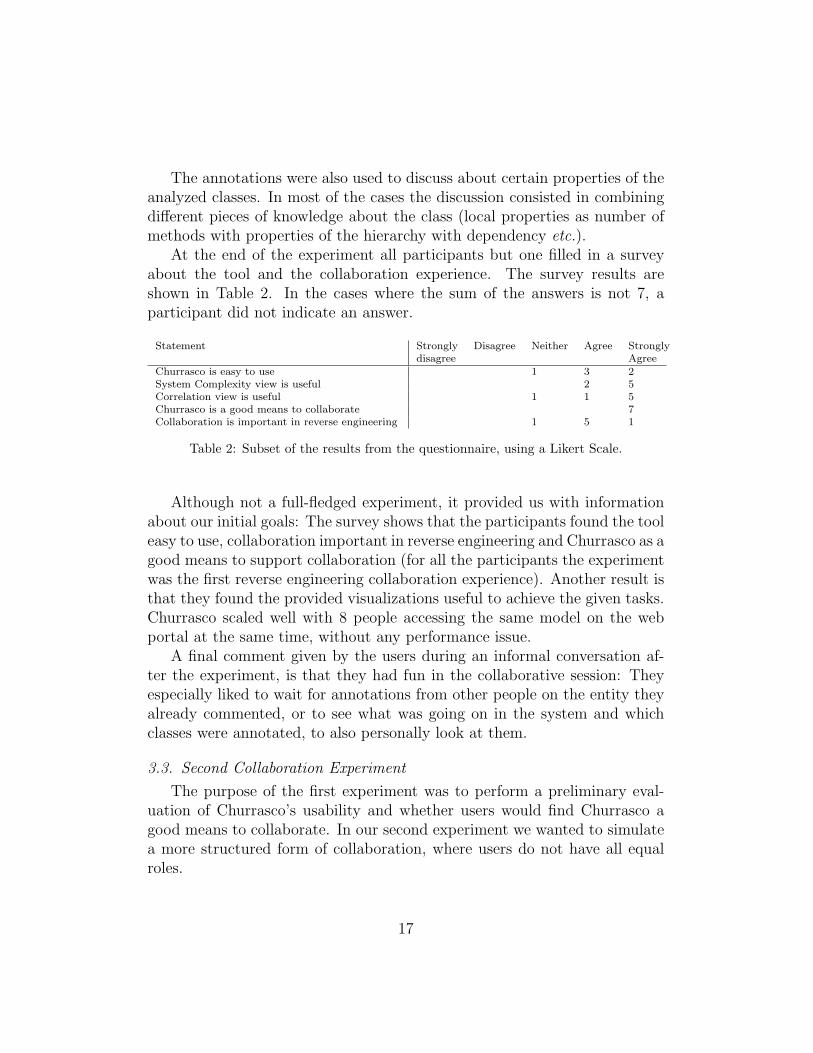
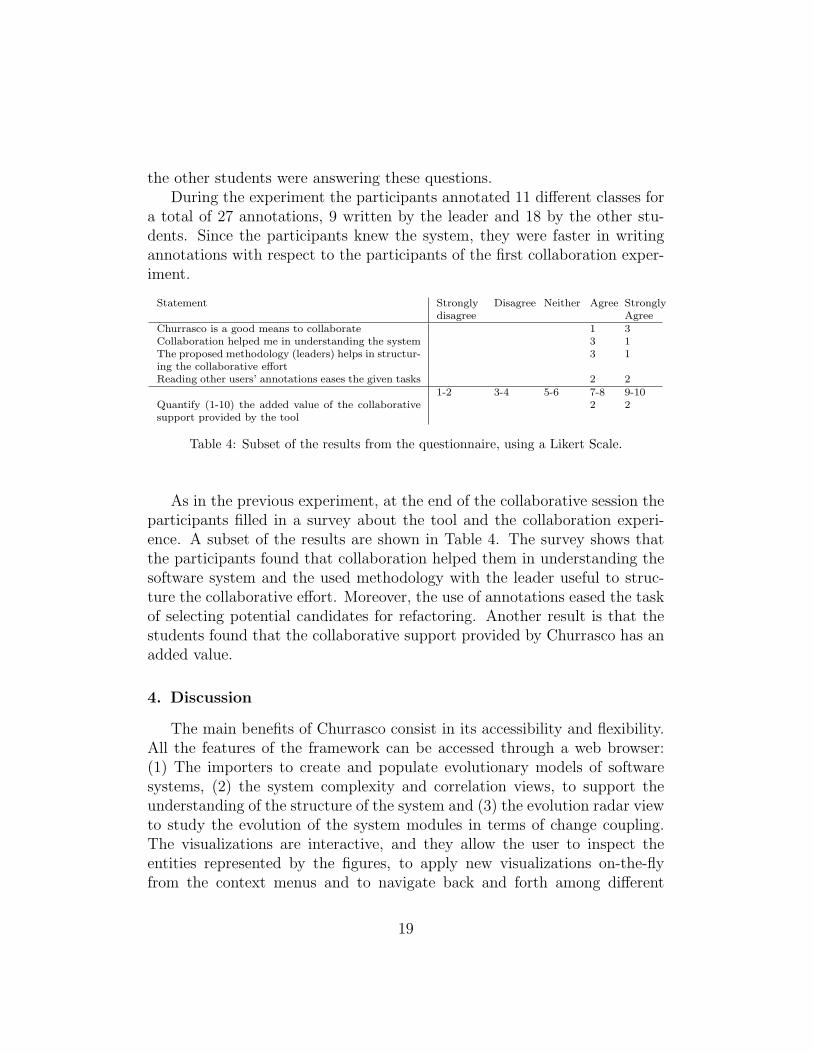
At the end of the experiment all participants but one filled in a surveyabout the tool and the collaboration experience. The survey results areshown in Table 2. In the cases where the sum of the answers is not 7, aparticipant did not indicate an answer.
Statement Stronglydisagree
Disagree Neither Agree StronglyAgree
Churrasco is easy to use 1 3 2System Complexity view is useful 2 5Correlation view is useful 1 1 5Churrasco is a good means to collaborate 7Collaboration is important in reverse engineering 1 5 1
Table 2: Subset of the results from the questionnaire, using a Likert Scale.
Although not a full-fledged experiment, it provided us with informationabout our initial goals: The survey shows that the participants found the tooleasy to use, collaboration important in reverse engineering and Churrasco as agood means to support collaboration (for all the participants the experimentwas the first reverse engineering collaboration experience). Another result isthat they found the provided visualizations useful to achieve the given tasks.Churrasco scaled well with 8 people accessing the same model on the webportal at the same time, without any performance issue.
A final comment given by the users during an informal conversation af-ter the experiment, is that they had fun in the collaborative session: Theyespecially liked to wait for annotations from other people on the entity theyalready commented, or to see what was going on in the system and whichclasses were annotated, to also personally look at them.
3.3. Second Collaboration Experiment
The purpose of the first experiment was to perform a preliminary eval-uation of Churrasco’s usability and whether users would find Churrasco agood means to collaborate. In our second experiment we wanted to simulatea more structured form of collaboration, where users do not have all equalroles.
17
We performed the experiment in the context of a university course onsoftware engineering, with a set-up very similar to the one of the previousexperiment. This time the participants were 4 bachelor students with littleknowledge about reverse engineering. The experiment took place during thelast week of a project in which all students had developed a web applicationin Smalltalk during 6 weeks. During the last week of the project the studentscould not add new features to the system, but they could only restructure /refactor it to improve its design and code quality.
The task that the students had in the experiment was to identify whichparts of the system should be refactored, using the System complexity andCorrelation views in Churrasco. The students had different roles in the col-laboration: One acted as a leader, responsible to analyze the system, byselecting classes which he thought were candidates for refactoring, while theother students would check in detail whether the classes in question neededto be refactored or not.
With the annotations, the leader could also ask questions that the fol-lowers then answered. Typical questions were: “What is the responsibilityof this class?”, “Can we remove this class?”, “These hierarchies seems tobe duplicated, can we merge them?”,“Why this class is in this hierarchy?Shouldn’t it be a subclass of that class?” etc.
The target software system was composed of 166 classes, 983 methods fora total of ca. 5,000 lines of Smalltalk code.
Class ElementModelWhat is the difference between Element Model and Element? Are both hierarchies replicated?One is the model that manages the functionalities of the element, the other one manages the dis-playing of the element (it is a proxy pattern).One is for the layout behavior while the other is for the widget behavior.
Class WBLBorderLayoutModelThis layout seems to have more behavior than the others, even though it has the same number ofattributes. Maybe it is doing too much and it should be a composite layout?It has a lot of complex operations which being detached can raise the complexity much more. Asyou say it has functionalities that can be put in more than 1 class.The layout is complex. Dividing it into several classes will require too much time and effort.
Table 3: Subset of the annotations made on the Smalltalk web application.
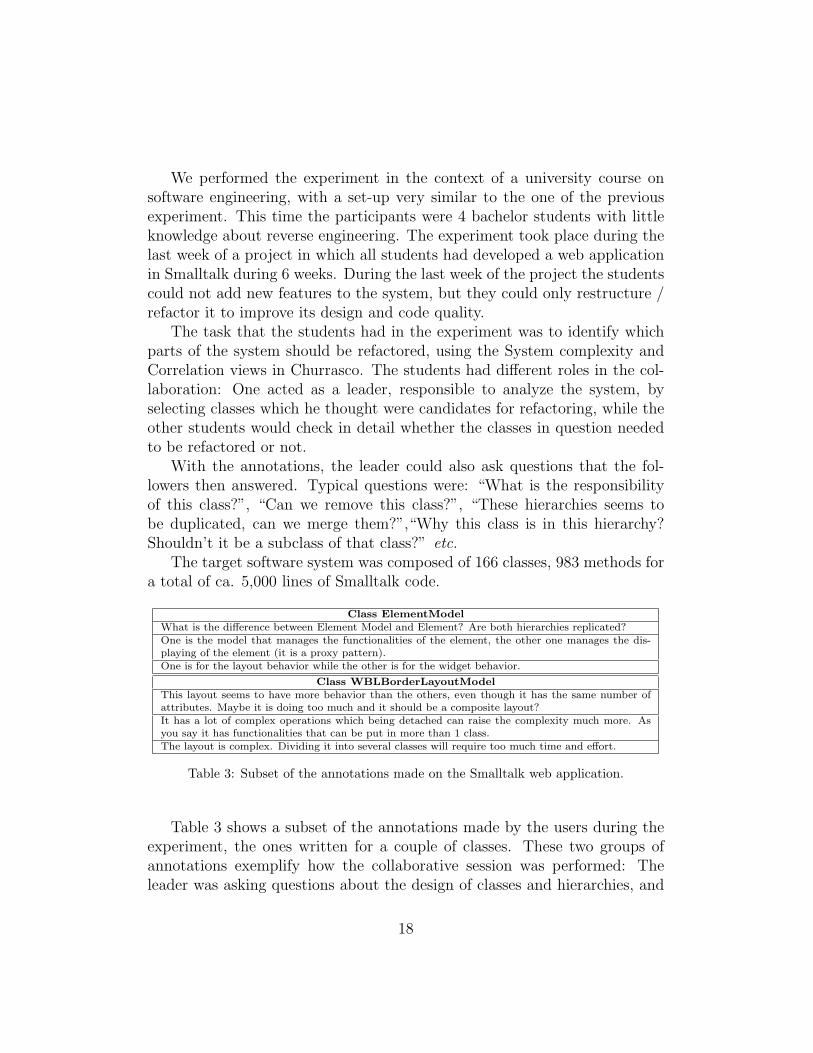
Table 3 shows a subset of the annotations made by the users during theexperiment, the ones written for a couple of classes. These two groups ofannotations exemplify how the collaborative session was performed: Theleader was asking questions about the design of classes and hierarchies, and
18
the other students were answering these questions.During the experiment the participants annotated 11 different classes for
a total of 27 annotations, 9 written by the leader and 18 by the other stu-dents. Since the participants knew the system, they were faster in writingannotations with respect to the participants of the first collaboration exper-iment.
Statement Stronglydisagree
Disagree Neither Agree StronglyAgree
Churrasco is a good means to collaborate 1 3Collaboration helped me in understanding the system 3 1The proposed methodology (leaders) helps in structur-ing the collaborative effort
3 1
Reading other users’ annotations eases the given tasks 2 21-2 3-4 5-6 7-8 9-10
Quantify (1-10) the added value of the collaborativesupport provided by the tool
2 2
Table 4: Subset of the results from the questionnaire, using a Likert Scale.
As in the previous experiment, at the end of the collaborative session theparticipants filled in a survey about the tool and the collaboration experi-ence. A subset of the results are shown in Table 4. The survey shows thatthe participants found that collaboration helped them in understanding thesoftware system and the used methodology with the leader useful to struc-ture the collaborative effort. Moreover, the use of annotations eased the taskof selecting potential candidates for refactoring. Another result is that thestudents found that the collaborative support provided by Churrasco has anadded value.
4. Discussion
The main benefits of Churrasco consist in its accessibility and flexibility.All the features of the framework can be accessed through a web browser:(1) The importers to create and populate evolutionary models of softwaresystems, (2) the system complexity and correlation views, to support theunderstanding of the structure of the system and (3) the evolution radar viewto study the evolution of the system modules in terms of change coupling.The visualizations are interactive, and they allow the user to inspect theentities represented by the figures, to apply new visualizations on-the-flyfrom the context menus and to navigate back and forth among different
19
views. The framework can be extended with respect to the meta-model andwith respect to the visualizations. Using the facilities provided by the meta-base, the underlying evolutionary meta-model of Churrasco can be enrichedwith new types of information.
5. Tool Building Issues
Developing a web-based tool that supports scalable and interactive visu-alizations raises issues related to interacting, updating, and debugging.
Interacting. Supporting interaction through a web browser is still anon-trivial task, and even supposedly simple features, such as context menus,must be implemented from scratch. In our Churrasco tool we have imple-mented the context menus as SVG composite figures, with callbacks attached,which are rendered on top of the SVG visualization. Moreover, it is hard toguarantee a responsive user interface, since every web application introducesa latency due to the transport of information.
Updating. The standard way of rendering a web visualization is thatevery time something changes in the page, the whole page is refreshed to showthe updated version. In the context menu example, whenever the user clickson a figure the page changes because a new figure appears, and thereforethe page needs to be refreshed to show the menu. This introduces latencieswhich make the web application unusable when it comes to rendering verylarge SVG files. For this reason, we implemented many actions that do notrequire a complete re-rendering of a page using Ajax requests. Examples ofsuch actions are: Rendering of context menus, highlighting figures, displayingfigure information, displaying and adding annotations.
Debugging. A barrier to develop web applications is the lacking sup-port for debugging. Even if there are some applications like Firebug providingHTML inspection, Javascript debugging and DOM exploration, the debug-ging support is not comparable with the one given in mainstream integrateddevelopment environments such as Eclipse.
All in all, while building Churrasco we learned that creating a web appli-cation that supports interactive visualizations implies a number of technolog-ical challenges. With the current status quo of web development frameworksit should make any intention of porting existing applications to the web foregoa careful evaluation of whether the result is worth the effort. On the otherhand, web applications introduce a number of novel ways to interact withsystems that will open up new research directions.
20
6. Related Work
A number of approaches support web-based software evolution analysisand visualizations.
Beyer and Hassan proposed Evolution Storyboards [18], a visualizationtechnique that offers dynamic views. The storyboards, rendered as SVG files(visible in a web browser), depict the history of a project using a sequenceof panels, each representing a particular time period in the life of a softwareproject. These visualizations are not, or only partially, interactive, i.e., theyonly show the names of the entities represented by the SVG or VRML figures.In contrast the views offered in the Churrasco web portal are fully interactive,providing context menus for the figures and navigation capabilities.
Lungu et al. presented an web-based approach to visualize entire soft-ware repositories [19]. Their technique, validated on Smalltalk repositories,focuses on understanding the structure of the organization behind the repos-itories, by studying the interaction among the developers. They also provideviews to see the evolution of the repositories over time. Both the approachesare fully interactive and web-based, but while Lungu’s approach focuses onthe entire repository evolution with coarse-grained views, Churrasco targetssingle projects with fine-grained visualizations.
In [20] Mancoridis et al. presented REportal, a web-based portal sitefor the reverse engineering of software systems. REportal allows users toupload their code (Java or C++) and then to browse, analyze and queryit. These services are implemented by reverse engineering tools developedby the authors over the years. REportal supports software analysis throughbrowsing and querying, whereas Churrasco supports the analysis by meansof interactive visualizations.
In [21] Nentwich et al. introduced BOX, a portable, distributed andinteroperable approach to browse UML models. BOX translates a UMLmodel that is represented in XMI into VML (Vector Markup Language),which can be directly displayed in a web browser. BOX enables softwareengineers to access and review UML models without the need to purchaselicenses of tools that produced the models. While BOX is focused on designdocuments, such as UML diagrams, in Churrasco we focus on the historyand structure of software systems.
A major difference between all the mentioned approaches and Churrascois that these techniques support single user software evolution analysis, whileChurrasco supports collaborative analysis.
21
7. Conclusions
We have presented Churrasco, a tool which supports collaborative soft-ware evolution analysis and visualization. The main features of Churrascoare:
• Flexible meta-model support. The meta-model used in Churrasco todescribe the evolution of a software system can be dynamically changedand/or extended, by means of the meta-base component.
• Accessibility. The tool is fully web-based, i.e., the entire analysis ofa software system, from the initial model creation to the final study,can be performed from a web browser, without having to install orconfigure any tool.
• Modeling of results. Churrasco relies on a centralized database and sup-ports annotations. Thus, the knowledge of the system, gained duringthe analysis, can be incrementally stored on the model of the systemitself.
• Collaboration. We have shown, through a couple of collaboration exper-iments with respectively 8 and 4 participants, how Churrasco supportscollaborative software evolution analysis.
7.1. Future Work
Our future work targets two main directions: Extending the tool and per-forming more experiments. Concerning the tool, we plan to extend the Chur-rasco meta-model by including information extracted from mail archives, andwe plan to create the corresponding importer which retrieves such data inbatch mode. Moreover, we want to enrich the set of views offered by Chur-rasco with visualizations of bug information. For examples of such bug visu-alizations, we refer the reader to [22].
With respect to the experiments, we plan to perform both a quantitativeexperiment on Churrasco’s usefulness and a qualitative one (by means ofinterviews) on its usability and usefulness.
Acknowledgments. We gratefully acknowledge the financial supportof the Swiss National Science foundation for the project “DiCoSA” (SNFProject No. 118063).
22
References
[1] M. Fischer, M. Pinzger, H. Gall, Populating a release history database fromversion control and bug tracking systems, in: Proceedings of the InternationalConference on Software Maintenance (ICSM 2003), IEEE CS Press, 2003, pp.23–32.
[2] D. Cubranic, G. Murphy, Hipikat: Recommending pertinent software devel-opment artifacts, in: Proceedings of the 25th International Conference onSoftware Engineering (ICSE 2003), ACM Press, 2003, pp. 408–418.
[3] S. Ducasse, T. Gı̂rba, O. Nierstrasz, Moose: an agile reengineering environ-ment, in: Proceedings of the 10th European software engineering conferenceheld jointly with 13th ACM SIGSOFT international symposium on Founda-tions of software engineering (ESEC/FSE 2005), 2005, pp. 99–102.
[4] S. Kim, T. Zimmermann, M. Kim, A. Hassan, A. Mockus, T. Gı̂rba,M. Pinzger, J. Whitehead, A. Zeller, TA-RE: An exchange language for min-ing software repositories, in: Proceedings of the 3rd International Workshopon Mining Software Repositories (MSR 2006), ACM, 2006, pp. 22–25.
[5] S. Tichelaar, S. Ducasse, S. Demeyer, FAMIX: Exchange experiences withCDIF and XMI, in: Proceedings of the ICSE 2000 Workshop on StandardExchange Format (WoSEF 2000), 2000.
[6] R. Frost, Jazz and the eclipse way of collaboration, IEEE Software 24 (6)(2007) 114–117.
[7] M. D’Ambros, M. Lanza, A flexible framework to support collaborative soft-ware evolution analysis, in: Proceedings of the 12th IEEE European Confer-ence on Software Maintenance and Reengineering (CSMR 2008), IEEE CSPress, 2008, pp. 3–12.
[8] A. Knight, Glorp: generic lightweight object-relational persistence, in: Pro-ceeding of OOPSLA 2000 (Addendum), ACM Press, 2000, pp. 173–174.
[9] S. Demeyer, S. Tichelaar, S. Ducasse, FAMIX 2.1 — The FAMOOS Informa-tion Exchange Model, Tech. rep., University of Bern (2001).
[10] M. D’Ambros, M. Lanza, M. Pinzger, The metabase: Generating object per-sistency using meta descriptions, in: Proceedings of the 1st Workshop onFAMIX and Moose in Reengineering (FAMOOSR 2007), 2007.
23
[11] S. Ducasse, A. Lienhard, L. Renggli, Seaside: A flexible environment forbuilding dynamic web applications, IEEE Software 24 (5) (2007) 56–63.
[12] M. D’Ambros, M. Lanza, M. Lungu, The evolution radar: Visualizing inte-grated logical coupling information, in: Proceedings of the 3rd InternationalWorkshop on Mining Software Repositories (MSR 2006), ACM, 2006, pp.26–32.
[13] M. D’Ambros, M. Lanza, Reverse engineering with logical coupling, in: Pro-ceedings of the 13th Working Conference on Reverse Engineering (WCRE2006), IEEE CS Press, 2006, pp. 189–198.
[14] M. Lanza, S. Ducasse, Polymetric views — a lightweight visual approachto reverse engineering, Transactions on Software Engineering (TSE) 29 (9)(2003) 782–795.
[15] M. Meyer, T. Gı̂rba, M. Lungu, Mondrian: An agile visualization framework,in: ACM Symposium on Software Visualization (SoftVis 2006), ACM Press,2006, pp. 135–144.
[16] M. Primi, The episode framework - exporting visualization tools to the web,Bachelor’s thesis, University of Lugano (Jun. 2007).
[17] D. Beyer, A. E. Hassan, Animated visualization of software history usingevolution storyboards, in: Proceedings of the 13th Working Conference onReverse Engineering (WCRE 2006), IEEE CS Press, 2006, pp. 199–210.
[18] M. Lungu, M. Lanza, T. Gı̂rba, R. Heeck, Reverse engineering super-repositories, in: Proceedings of the 14th IEEE Working Conference on ReverseEngineering (WCRE 2007), IEEE CS Press, 2007, pp. 120–129.
[19] S. Mancoridis, T. S. Souder, Y.-F. Chen, E. R. Gansner, J. L. Korn, Reportal:A web-based portal site for reverse engineering, in: Proceedings of the 8thWorking Conference on Reverse Engineering (WCRE 2001), IEEE ComputerSociety, 2001, p. 221.
[20] C. Nentwich, W. Emmerich, A. Finkelstein, A. Zisman, BOX: Browsing ob-jects in XML, Software Practice and Experience 30 (15) (2000) 1661–1676.
[21] M. D’Ambros, M. Lanza, M. Pinzger, “a bug’s life” — visualizing a bugdatabase, in: Proceedings of the 4th IEEE International Workshop on Visu-alizing Software For Understanding and Analysis (VISSOFT 2007), IEEE CSPress, 2007, pp. 113–120.
24