distributed fault diagnosis system based on wireless
TRANSCRIPT

Enviado: 23/08/2020 Recibido: 02/09/2020 Aceptado: 15/10/2020
VISIÓN ELECTRÓNICA
Algo más que un estado sólido
https://doi.org/10.14483/issn.2248-4728
Cite this article as: J. A. Caballero Peña, J. A. Rosero García, “Distributed Fault Diagnosis System based on Wireless Sensor Networks”, Visión Electrónica, vol. 14, no. 2, July 2020. https://doi.org/10.14483/22484728.17058
A CASE-STUDY VISION
Distributed Fault Diagnosis System based on Wireless Sensor Networks
Sistema de Diagnóstico Distribuido de Fallas basado en redes inalámbricas de sensores
Jairo Andrés Caballero-Peña1, Javier Alveiro Rosero-García2
Abstract
This article presents the development of a distributed fault diagnosis and monitoring system
whose remote nodes are responsible for data collection and distributed analysis to identify
problems that could lead to critical faults in industrial processes or systems. The developed
intelligent remote node was implemented with MCU LPCXpresso54114 connected to a ZigBee
protocol wireless sensor network through XBee communication module. The gateway node is
a Raspberrry PI with HTTP communication and JSON format to the PI System industrial
monitoring system database. Motor Current Signature Analysis (MCSA) was implemented and
validated to identify interturn faults of induction motors. The developed platform is a tool to
perform comparison and validation of analysis techniques, indicators, and fault classification,
because there are different combinations that can be applied to improve diagnosis reliability,
1 BSc. in Electronic and Electrical Engineering, Universidad Nacional de Colombia, Colombia. MSc. in Electrical
Engineering, Universidad Nacional de Colombia, Colombia. Current position: Young researcher, Electrical Machines & Drives - research group. Technical support engineer, Staekka SAS, Colombia. E-mail: [email protected] ORCID: https://orcid.org/0000-0002-5350-4785
2 BSc. in Electrical Engineering, Universidad del Valle, Colombia. PhD. in Electronic Engineering, Universidad Politécnica de Cataluña (UPC), Spain. MSc. in Administration, Universidad Nacional de Colombia, Colombia. Current position: Tenured professor and director of Electrical Machines & Drives - research group, Department of Electric and Electronics Engineering, Universidad Nacional de Colombia, Colombia. E-mail: [email protected] ORCID: https://orcid.org/0000-0003-2690-4772

Jairo Andrés Caballero-Peña, Javier Alveiro Rosero-García
Universidad Distrital Francisco José de Caldas – Facultad Tecnológica
fault observability, differentiation between fault conditions, classification accuracy, tolerance to
transients, sensitivity, among others.
Keywords: Distributed Analysis, Fault Diagnosis, Induction Motor, Motor-Current Signature
Analysis, Stator Current, Wireless Sensor Networks, ZigBee.
Resumen
En este artículo presenta el desarrollo de un sistema de monitoreo y diagnóstico distribuido
cuyos nodos remotos se encarguen de la recolección de datos y su posterior análisis para la
identificación de anomalías que representen fallas críticas para el proceso o sistema industrial.
El dispositivo desarrollado como nodo remoto inteligente se implementó con MCU
LPCXpresso54114 con conexión a una red inalámbrica de sensores basada en protocolo
ZigBee mediante tarjetas de comunicación XBee. El nodo concentrador está compuesto de
una tarjeta Raspberrry PI con comunicación mediante protocolo HTTP y formato JSON a la
base de datos del sistema de monitoreo industrial PI System. Se implementó y validó el
acondicionamiento de señal para la medición de corrientes de estator (MCSA) que permitió
identificar fallas entre espiras de motores de inducción tipo jaula de ardilla. La plataforma
presentada finalmente es una herramienta para realizar comparación y validación de técnicas
de análisis, indicadores y de clasificación de fallas, puesto que existen diversas combinaciones
que pueden ser aplicadas con el fin de mejorar la confiabilidad del diagnóstico, la observación
de la falla, la diferenciación entre condiciones de falla, la precisión de la clasificación, la
tolerancia a transitorios, sensibilidad, entre otros.
Palabras clave: Análisis distribuido, Diagnóstico de fallas, Motor de Inducción, Motor-Current
Signature Analysis, Corriente de estator, Redes inalámbricas de sensores, ZigBee.

Distributed Fault Diagnosis System based on Wireless Sensor Networks
Visión Electrónica • vol. 14 no. 2 (2020) • July-December • ISSN 1909-9746 • ISSN-E 2248-4728 • Bogotá (Colombia
1. Introduction
Research on motor fault diagnosis has become relevant nowadays as it allows the identification
of problems prior to a major event that affects the overall performance of an electric motor-
driven system (EMDS), so as to reduce production downtimes, economic losses, and the
impact on the useful life of the plant and equipment [1][2][3]. Eighty percent of the motors used
industrially are induction motors and 21% of the faults that occur in electric motors is short-
circuit faults in the stator [4]. For this reason, the study of these faults has made significant
progress regarding their early diagnosis in order to identify interturn faults, which are caused
by deterioration of the insulation and lead to more serious faults: ground faults [5].
Monitoring systems generally employ various sensors that report information to a server that
performs centralized analysis based on historical data and its behavior. Currently, the use of
wireless sensor networks (WSN) and their integration with system on chip (SoC) devices make
a distributed diagnosis possible [6], in which the remote node is responsible for a total diagnosis
of the fault and reports only the status of the equipment or carries out a partial analysis first and
then a more advanced analysis. This reduces maintenance costs, facilitates the installation of
new signals, provides flexibility in network and system configuration, reduces the power
consumption of the remote node [6][7], and ensures greater communication security and
reliability [3].
There is a great variety of methods for extracting parameters or fault indicators in which motor-
current signature analysis (MCSA) is the most implemented on diagnostic systems, as it is a
non-invasive process, supports different types of faults (breaks, stator, driver, or mechanical
load) and involves a low cost of the integration of the sensors (without special requirements)
[8]. Additionally, the behavior of this type of analysis is characterized by faults and diverse
analysis techniques for identifying the presence of a fault [9]. MCSA has proved to be suitable

Jairo Andrés Caballero-Peña, Javier Alveiro Rosero-García
Universidad Distrital Francisco José de Caldas – Facultad Tecnológica
for implementation in programmable devices such as MCU and DSP [10][11][12], As for [13], a
real-time analysis platform with centralized processing was developed; it was based on
techniques such as Fast Fourier Transform (FFT), Discrete Wavelet Transform (DWT), Hilbert-
Huang Transform (HHT), or the Discrete Harmonic Wavelet Transform (DHWT) [14], whose
memory and processing capacity requirements are acceptable.
Analysis techniques show the characteristic behavior of a fault, but only data classification
techniques help to determine the presence or probability of fault as well as its location or
severity [15][16][17][18], thereby improving the accuracy and diagnostic precision. In
programmable devices the proposed analysis techniques include behavior limits based on
historical records (Threshold) [11][18], artificial neural networks (ANN) [17], support vector
machines (SVM) [10][19] and probabilistic tools [20].
Diagnostic techniques evolve constantly as improvements are continually proposed to enhance
sensitivity, accuracy, differentiation from other types of faults, or speed of analysis
[5][21][22][23][24], these improvements include linear transformations as sequence
components, dq0, quadrature or Park transformation, alternative data classification tools
(artificial intelligence) or big data analysis. Therefore, the objective of this study was the
development and implementation of a motor-current signature analysis (MCSA) based on a
WSN through ZigBee protocol for remote diagnosis of faults in induction motors, in order to
evaluate the performance of analysis techniques, fault classification, and proposed indicators.
The proposed system performed diagnosis through SVM based on fault indicators extracted by
FFT and DWT from the measured stator currents.
2. Architecture of the diagnostic system
The general operation of the system consists of remote nodes and gateways communicated
wirelessly with ZigBee protocol through XBee communication modules, which simplify the
Distributed Fault Diagnosis System based on Wireless Sensor Networks
Visión Electrónica • vol. 14 no. 2 (2020) • July-December • ISSN 1909-9746 • ISSN-E 2248-4728 • Bogotá (Colombia
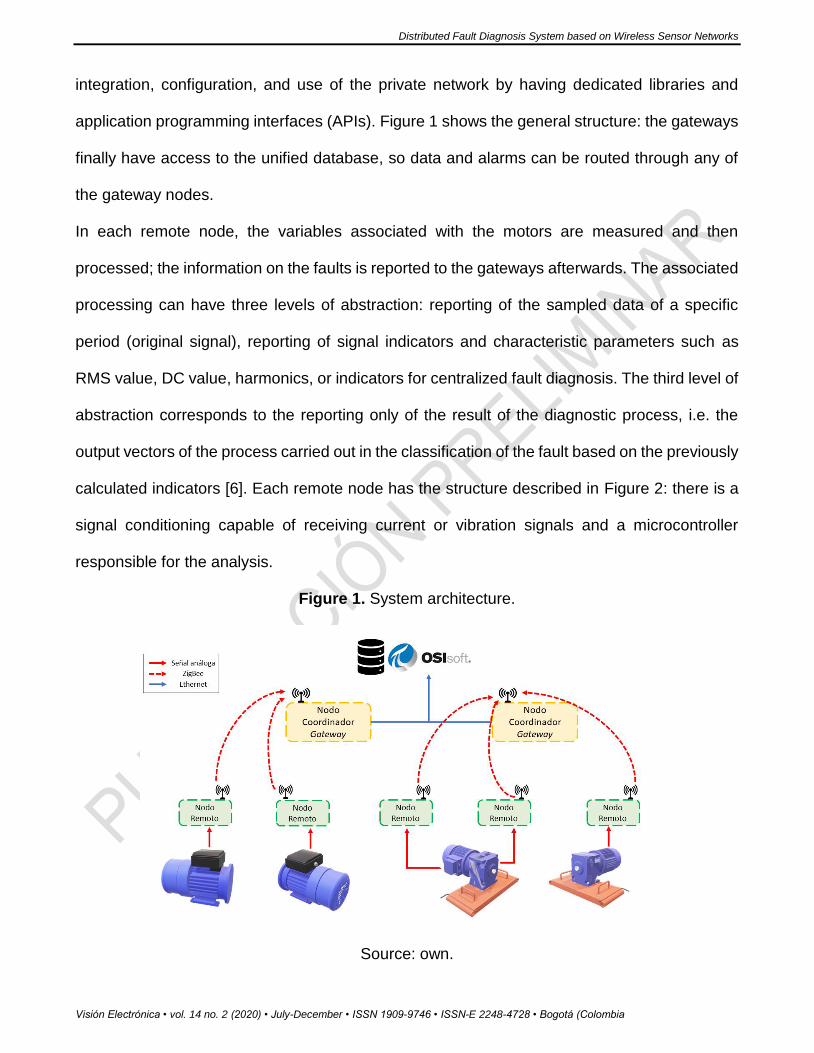
integration, configuration, and use of the private network by having dedicated libraries and
application programming interfaces (APIs). Figure 1 shows the general structure: the gateways
finally have access to the unified database, so data and alarms can be routed through any of
the gateway nodes.
In each remote node, the variables associated with the motors are measured and then
processed; the information on the faults is reported to the gateways afterwards. The associated
processing can have three levels of abstraction: reporting of the sampled data of a specific
period (original signal), reporting of signal indicators and characteristic parameters such as
RMS value, DC value, harmonics, or indicators for centralized fault diagnosis. The third level of
abstraction corresponds to the reporting only of the result of the diagnostic process, i.e. the
output vectors of the process carried out in the classification of the fault based on the previously
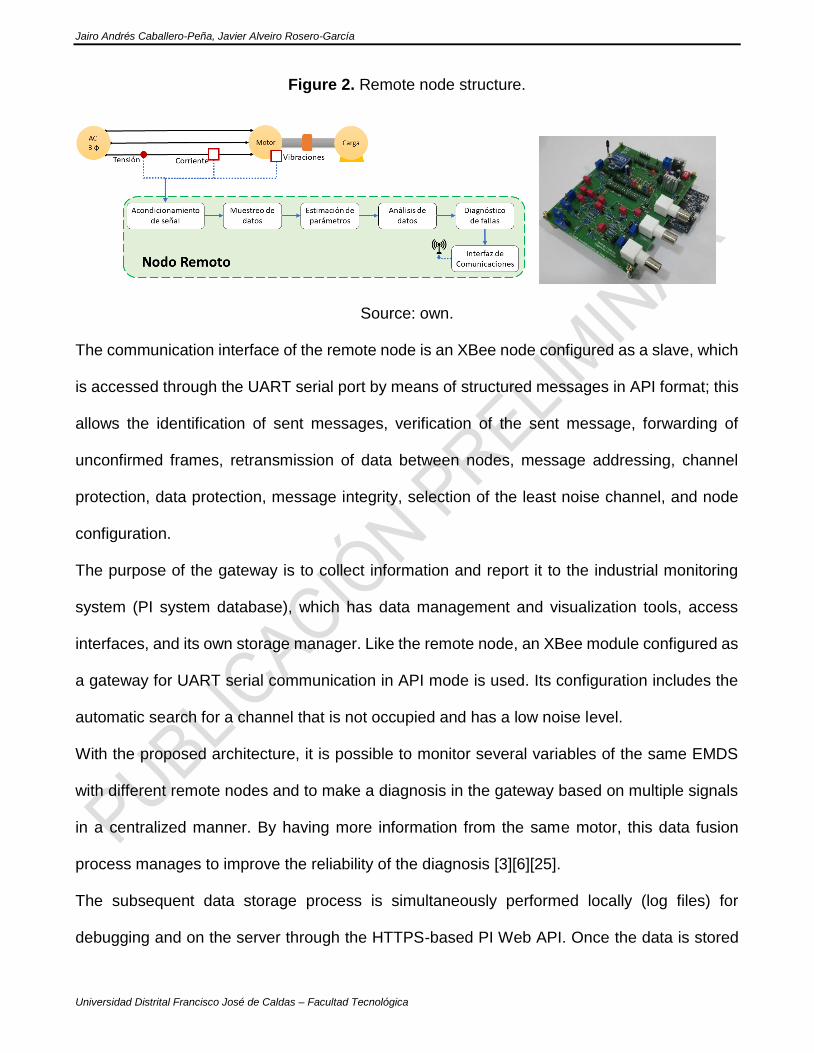
calculated indicators [6]. Each remote node has the structure described in Figure 2: there is a
signal conditioning capable of receiving current or vibration signals and a microcontroller
responsible for the analysis.
Figure 1. System architecture.
Source: own.
Jairo Andrés Caballero-Peña, Javier Alveiro Rosero-García
Universidad Distrital Francisco José de Caldas – Facultad Tecnológica
Figure 2. Remote node structure.
Source: own.
The communication interface of the remote node is an XBee node configured as a slave, which
is accessed through the UART serial port by means of structured messages in API format; this
allows the identification of sent messages, verification of the sent message, forwarding of
unconfirmed frames, retransmission of data between nodes, message addressing, channel
protection, data protection, message integrity, selection of the least noise channel, and node
configuration.
The purpose of the gateway is to collect information and report it to the industrial monitoring
system (PI system database), which has data management and visualization tools, access
interfaces, and its own storage manager. Like the remote node, an XBee module configured as
a gateway for UART serial communication in API mode is used. Its configuration includes the
automatic search for a channel that is not occupied and has a low noise level.
With the proposed architecture, it is possible to monitor several variables of the same EMDS
with different remote nodes and to make a diagnosis in the gateway based on multiple signals
in a centralized manner. By having more information from the same motor, this data fusion
process manages to improve the reliability of the diagnosis [3][6][25].
The subsequent data storage process is simultaneously performed locally (log files) for
debugging and on the server through the HTTPS-based PI Web API. Once the data is stored

Distributed Fault Diagnosis System based on Wireless Sensor Networks
Visión Electrónica • vol. 14 no. 2 (2020) • July-December • ISSN 1909-9746 • ISSN-E 2248-4728 • Bogotá (Colombia
in the database, several queries are made to create the monitoring user interfaces, the periodic
data reporting, and the alarm reporting to the system or maintenance operators. The tools used
to provide access to information are PI Coresight for web visualization without software
requirements, PI ProcessBook for execution on equipment with OSISoft licensed software, and
again PI Web API as the interoperable solution for managing data to and from the database.
2.1. Implementation requirements
The requirements for the diagnosis system were validated and reviewed according to the
previous implementation advances on MCU or similar equipment. For the different analyses it
is necessary to have floating point units (e.g. TM4C1233H6PM [26]) to ensure the precision of
the diagnosis or classification of the fault, in which standardized values are generally operated.
In the case of implementing Wavelet through impulse response convolution, it is necessary to
use enhanced processors such as parallel multiplication units, multiply-accumulate operation
(MAC) features, or accumulators, available mainly in DSP.
For vibration-based bearing analysis, the typical analysis frequency is 256 Hz and MCSA is 5
kHz using 10-16 bit ADC [27]. Therefore, the sampling frequency was established as four times
the maximum analysis frequency: 𝑓𝑠 = 20 𝑘𝐻𝑧. The sampling process required an antialiasing
filter that prevent the imaging, eliminate the subsampling of high frequency signals (multiples
of the sampling frequency) and allows the passage of the target signal. At 25 kHz the
attenuation should be maximum 74 dB, and at the cutoff frequency the attenuation should be 3
dB. There is no restriction on the type of filter used, but the offset introduced should be
considered when including analyses involving the offset of the measured signals, for example
impedance analysis. The given requirements are not achieved with a filter of order 10 or higher,
equivalent to having at least 5 stages with amplifiers. Then, the cut-off band attenuation should
be reduced to 33 dB or 35 dB, thereby lowering the complexity of the filter implementation. An

Jairo Andrés Caballero-Peña, Javier Alveiro Rosero-García
Universidad Distrital Francisco José de Caldas – Facultad Tecnológica
alternative to allow different sampling frequencies and to reach a filter up to order 8 on the same
hardware in order to adjust the analysis according to the needs of the analysis is the use of
switched-capacitor filters, which adjust their cut-off frequency according to the frequency of
their control signal (clk). In this way, an additional requirement besides the MCU is the option
to generate a clock signal adjustable in real time to control the Fc through software according
to the needs of the sampling or the analysis. Therefore, an appropriate adjustment can be made
to the sampling rate, the number of samples, and the use of the device memory with the aim of
considering changes in various analysis techniques. For example, when analyzing interturn
faults the frequencies associated with faults are cyclic in the spectrum at multiples of the
synchronism frequency usually greater than 700 Hz, whereas for mechanical faults the
frequencies to be reviewed are usually frequencies lower than those of the network (60 Hz).
2.2. Platform definition
A search and comparison of development platforms with low consumption MCU or DSP were
performed and the following evaluation criteria were established: power consumption,
configuration in sleep mode, current consumption in Stand By mode, serial communication
modules, RAM and Flash memory, processor, floating point processing unit, number of cores,
supply voltage, ADC channels, number of ADC bits, maximum sample rate, available inputs
and outputs, communication ports, additional modules, available development cards, price, and
libraries for development. The most important criteria were energy consumption due to the
requirement to operate autonomously with batteries, the processor with a floating-point unit
(fundamental condition), the estimated sampling frequency for six different signals, and the
memory capacity. As for the latter, it was sought as much as possible in order to ensure the
highest sample capacity (low-frequency analysis) and to store the temporal signals required in
processes such as HHT (decomposition in empirical methods). As a result, the

Distributed Fault Diagnosis System based on Wireless Sensor Networks
Visión Electrónica • vol. 14 no. 2 (2020) • July-December • ISSN 1909-9746 • ISSN-E 2248-4728 • Bogotá (Colombia
LPCXpresso5411x series was selected, an LPC54114J256 MCU based on an ARM Cortex M4
processor with an ARM Cortex M0+ coprocessor. The corresponding NXP development board
is an OM13089 (LPCXpresso54114), which can be programmed on C++ via USB serial
communication with its bootloader.
3. Implementation of the diagnostic system
3.1. Signal conditioning
The signal conditioning (see Figure 3) was developed for coupling signals delivered by a current
clamp (voltage transducer) or an accelerometer with voltage output 0 V to 5 V. A high
impedance rail-to-rail operational amplifier (low offset and noise) was used for each phase to
avoid unwanted signal loading or attenuation problems. The first stage of offset was
implemented with a non-inverting adder configuration in order to allow application with a single
+ 5V source (all stages with positive Vout). The final offset stage corresponds to the DC level
correction introduced by the implemented switchable filter and should be calibrated before
operation.
Figure 3. Block diagram of signal conditioning.
Source: own.

Jairo Andrés Caballero-Peña, Javier Alveiro Rosero-García
Universidad Distrital Francisco José de Caldas – Facultad Tecnológica
The MAX291 was used to adjust the cutoff frequency up to 25 kHz (or MAX295 for cutoff
frequencies up to 50 kHz), male BNC connectors for male BNC connectors for connecting
current clamps, low-power low-noise (high performance) OPA4188AID operational amplifiers,
protection against overvoltage and transient reverse voltage that may reach the MCU’s ADC
inputs (clipper), Zener diodes to ensure a more stable offset in relation to the external variations
of the power supply, and a power supply based on a single external voltage (9 V batteries) that
generates a floating ground and achieves a symmetrical output (±5 V).
Laboratory tests were performed on the dynamic filter by introducing a TTL clock signal (𝑐𝑙𝑘)
and sinusoidal variable input signals. Because the control signal is 100 times or 50 times 𝑓𝑐
depending on the implemented switched-capacitor filter, the 𝑐𝑙𝑘 signal can be up to 2.5 MHz.
A 𝑐𝑙𝑘 signal attenuation occurred due to the capacitive effect of the probe and parasitic
capacitances on the PCB, which was corrected by changing the PCB substrate, performing a
symmetric routing of the signal, and removing the VIA-hole in the prototype.
To verify the operation of the filter, the frequency sweep was performed for two different cutoff
frequencies (𝑓𝑐) with their respective control frequency (𝑓𝑐𝑙𝑘 ). Figure 4 shows the normalized
frequency response in relation to 𝑓𝑐, with similar attenuation slopes and corner frequencies. The
installed amplifier is the MAX 291 with a cutoff frequency range from 0.1 Hz to 25 kHz and a
control ratio of 100:1; the observations showed that the frequencies that were not affected by
the filter had a permanent attenuation due to the gain of the operational amplifiers to ensure
the measurement range of the MCU. The attenuation at 𝑓𝑖𝑛 = 0 𝐻𝑧 (DC values) is due to the
filter introducing an offset associated with the filter operation. The typical attenuation expected
in a low-pass filter at the cutoff frequency is -3 dB (gain 0.5 V/V), but the attenuation at the
cutoff frequency of the switched-capacitor filter was found to be -1.196 and -1.366, 𝑓𝑐 = 10 𝑘𝐻𝑧

Distributed Fault Diagnosis System based on Wireless Sensor Networks
Visión Electrónica • vol. 14 no. 2 (2020) • July-December • ISSN 1909-9746 • ISSN-E 2248-4728 • Bogotá (Colombia
and 𝑓𝑐 = 20 𝑘𝐻𝑧, respectively. A correction was then made to the control frequency by 10% to
ensure attenuation by shifting 𝑓𝑐𝑙𝑘 to a lower frequency.
Figure 4. Normalized transfer function of the dynamic filter for various 𝑓𝑐.
Source: own.
Table 1 shows the target cutoff frequency, the control frequency, the gain measured at the
target cutoff frequency, and the gain at the corrected cutoff frequency. As can be seen, the
attenuation of 3 dB is achieved by correcting 𝑓𝑐 and, therefore, at least the control frequency
should be adjusted by 10% for correct control.
Table 1. Comparison of the gain for different cutoff frequencies.
Gain [dB]
𝑓𝑐 [kHz] 𝑓𝑐𝑙𝑘 [kHz] 𝑓𝑖𝑛
𝑓𝑐= 1
𝑓𝑖𝑛
𝑓𝑐= 1.1
0.1 10 -1.213 -3.161
0.5 50 -1.196 -3.188
1.0 100 -1.213 -3.201
2.0 200 -1.204 -3.188
5.0 500 -1.146 -3.071
10.0 1000 -1.196 -3.188
20.0 2000 -1.366 -3.201
Source: own.
Table 2 shows the calculated attenuation for each cutoff frequency adjusted. The average
attenuation in the transition band is 80,332 dB/decade. These variations occurred because the

Jairo Andrés Caballero-Peña, Javier Alveiro Rosero-García
Universidad Distrital Francisco José de Caldas – Facultad Tecnológica
final section of the characteristic curve cannot be approximated to perfect straight lines (see
Figure 4). This behavior can be confirmed in the datasheet [28] and can be approximated with
three different slope lines.
Table 2. Comparison of the gain for different cutoff frequencies.
𝒇𝒄 𝒇𝒄𝒍𝒌 Attenuation [𝒅𝑩/𝒅𝒆𝒄𝒂𝒅𝒆]
0.1 10 80.368
0.5 50 80.423
1.0 100 83.636
2.0 200 79.465
5.0 500 79.176
10.0 1000 78.463
20.0 2000 80.791
Source: own.
The phase angle characterization was performed by configuring two cutoff frequencies (Fc), 5
kHz and 20 kHz, taking into account that in the last stage of signal conditioning an amplifier
performs a subtraction to adjust the offset, which introduces an inversion of the reflected signal
into an additional 180-degree offset. In general, the response of the phase angle behavior of
the Butterworth filter can be a linear approximation as the frequency of the input signal
increases; however, it should not be considered as such in case detailed phase angle analysis
is needed, since in the case of the switched-capacitor filter the error varies as the 𝑓𝑐 or 𝑓𝑐𝑙𝑘 is
modified and the non-linearities affect the zero crossing of the phase angle. The zero crossing
should match 𝑓𝑐
2, but for 𝑓𝑐 = 5 𝑘𝐻𝑧 it is 0.5857 ∗ 𝑓𝑐, i.e. 17.15% higher, and for 𝑓𝑐 = 20 𝑘𝐻𝑧 the
error is 14.73% above 𝑓𝑐
2.
Finally, to improve energy consumption efficiency the power supply of the systems should be
high efficiency and independently controllable, so that the signal conditioning, the MCU, and
the communication module can be operated in Wake-Up cycles. In this way, the elements of

Distributed Fault Diagnosis System based on Wireless Sensor Networks
Visión Electrónica • vol. 14 no. 2 (2020) • July-December • ISSN 1909-9746 • ISSN-E 2248-4728 • Bogotá (Colombia
the system operate only when required, i.e. data collection and data analysis or transmission,
so as to maximize the time of use of the batteries [3].
3.2. Remote node
The software for the remote node employs several hardware modules with the ability to launch
hardware interruptions to leave only the tasks of data analysis, data reporting, and
communication network configuration in the main processor. Figure 5 and Figure 6 show the
flow chart of the remote node and the interruption cycles in which the tasks of data sampling,
storage of the measured channels, and control of energy consumption of the signal conditioning
are performed (Wake Up, Sleep Mode).
Figure 5. Flowchart of the remote node software.
Source: own.
The development of the remote node software required the development and integration of
libraries for the operation of the XBee communication module in API format via serial port. The

Jairo Andrés Caballero-Peña, Javier Alveiro Rosero-García
Universidad Distrital Francisco José de Caldas – Facultad Tecnológica
developed code involved employing the existing MCU3 drivers related to the data sending
through serial port by using the Direct Memory Access (DMA) block and the UART port. The
advantages of using messages in API format include the use of broadcast messages, automatic
network selection, message receipt acknowledgment (ack), dynamic data routing, and XBee
network configuration.
Figure 6. Flowchart of the remote node software (hardware interruption cycle).
Source: own.
Based on the available drivers, the ADC block was adjusted for the sampling of up to 9 channels
together with their respective timers to make data acquisition at the beginning of the periodic
fault analysis and periodic status monitoring of the communication system. The switched-
capacitor filter control signal was generated by the PWM block.
The section of the software corresponding to the analysis and the diagnosis required the
configuration of the Cortex Microcontroller Software Interface Standard (CMSIS) libraries for
the Cortex-M processor, with the aim of using the integrated functions for float type vector's
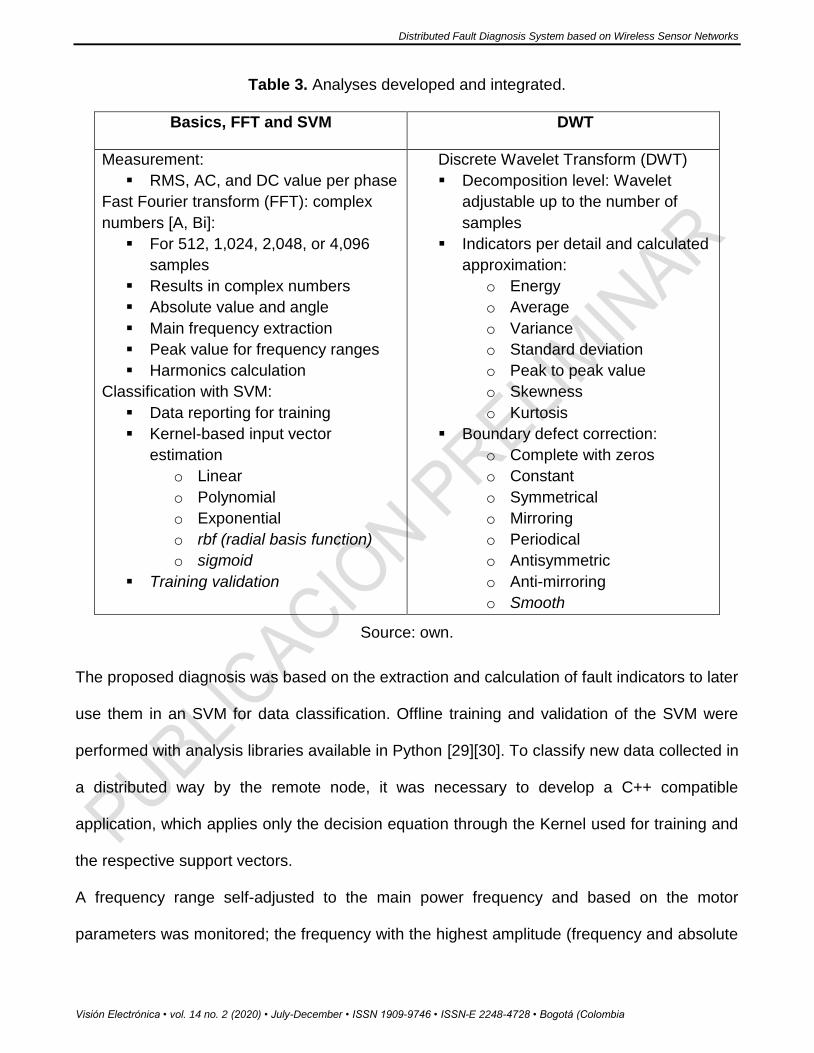
operation. Based on these, the functions presented in the Table 3 were implemented.
3 MCUXpresso IDE
Distributed Fault Diagnosis System based on Wireless Sensor Networks
Visión Electrónica • vol. 14 no. 2 (2020) • July-December • ISSN 1909-9746 • ISSN-E 2248-4728 • Bogotá (Colombia
Table 3. Analyses developed and integrated.
Basics, FFT and SVM DWT
Measurement:
▪ RMS, AC, and DC value per phase
Fast Fourier transform (FFT): complex
numbers [A, Bi]:
▪ For 512, 1,024, 2,048, or 4,096
samples
▪ Results in complex numbers
▪ Absolute value and angle
▪ Main frequency extraction
▪ Peak value for frequency ranges
▪ Harmonics calculation
Classification with SVM:
▪ Data reporting for training
▪ Kernel-based input vector
estimation
o Linear
o Polynomial
o Exponential
o rbf (radial basis function)
o sigmoid
▪ Training validation
Discrete Wavelet Transform (DWT)
▪ Decomposition level: Wavelet
adjustable up to the number of
samples
▪ Indicators per detail and calculated
approximation:
o Energy
o Average
o Variance
o Standard deviation
o Peak to peak value
o Skewness
o Kurtosis
▪ Boundary defect correction:
o Complete with zeros
o Constant
o Symmetrical
o Mirroring
o Periodical
o Antisymmetric
o Anti-mirroring
o Smooth
Source: own.
The proposed diagnosis was based on the extraction and calculation of fault indicators to later
use them in an SVM for data classification. Offline training and validation of the SVM were
performed with analysis libraries available in Python [29][30]. To classify new data collected in
a distributed way by the remote node, it was necessary to develop a C++ compatible
application, which applies only the decision equation through the Kernel used for training and
the respective support vectors.
A frequency range self-adjusted to the main power frequency and based on the motor
parameters was monitored; the frequency with the highest amplitude (frequency and absolute

Jairo Andrés Caballero-Peña, Javier Alveiro Rosero-García
Universidad Distrital Francisco José de Caldas – Facultad Tecnológica
value) was extracted as an indicator from this range. Based on previous fault frequency
characterizations [31][32], the bandwidth to be monitored was restricted to load variations (𝑠-
slip changes) independent of the supply frequency. For FFT, the proposed indicators
corresponded to each of the harmonics of the fundamental frequency: 60 Hz. As for DWT, the
energy values were calculated for each approximation and detail that underpinned the fault
diagnosis (training and prediction).
3.3. Gateway
The gateway should have a serial communication port, ethernet communication, configurable
I/O ports, and capacity for the installation and execution of libraries in Python. Therefore,
prototype development boards or industrial computers can be used. This study was carried out
on a Raspberry Pi 3 Model B+ with a Debian operating system because of its easy prototyping.
For the coordinator node or gateway, a shield was developed to integrate the XBee
communication card (power supply, control and communication signals) into the I/O ports
required to indicate alarms or generate alerts on the visual status of communications towards
the remote nodes and/or towards the server (database and remote visualization).
An application was developed on Python4 to configure the serial port of the Raspberry by
verifying if it is available previously, otherwise the application does not run. The elements and
objects necessary to use XBee were subsequently configured through its library for Python. In
this process, a parallel execution process (callback) was configured to continuously monitor the
input buffer of the serial port and to generate an interruption when receiving a message in API
format, thereby reducing response times.
Figure 7 shows the block diagram of the process carried out on the main threat, and Figure 8
shows the process carried out in the background when receiving a message. The main
4 https://python-xbee.readthedocs.io/en/latest/ and https://github.com/digidotcom/python-xbee

Distributed Fault Diagnosis System based on Wireless Sensor Networks
Visión Electrónica • vol. 14 no. 2 (2020) • July-December • ISSN 1909-9746 • ISSN-E 2248-4728 • Bogotá (Colombia
execution loop periodically monitors the status and availability of the XBee network (at least
one remote device connected) and indicates the running status of the secondary message
reception process through a blinker. In case of an error in any of the steps described above
(exception), the software closes the serial port before end to avoid errors during the next launch
or execution of the application. The process of restarting in case of an internal error was
implemented in a script executed as a Watchdog (Crontab on Debian) every minute.
Figure 7. Flowchart of the gateway software.
Source: own.
Jairo Andrés Caballero-Peña, Javier Alveiro Rosero-García
Universidad Distrital Francisco José de Caldas – Facultad Tecnológica
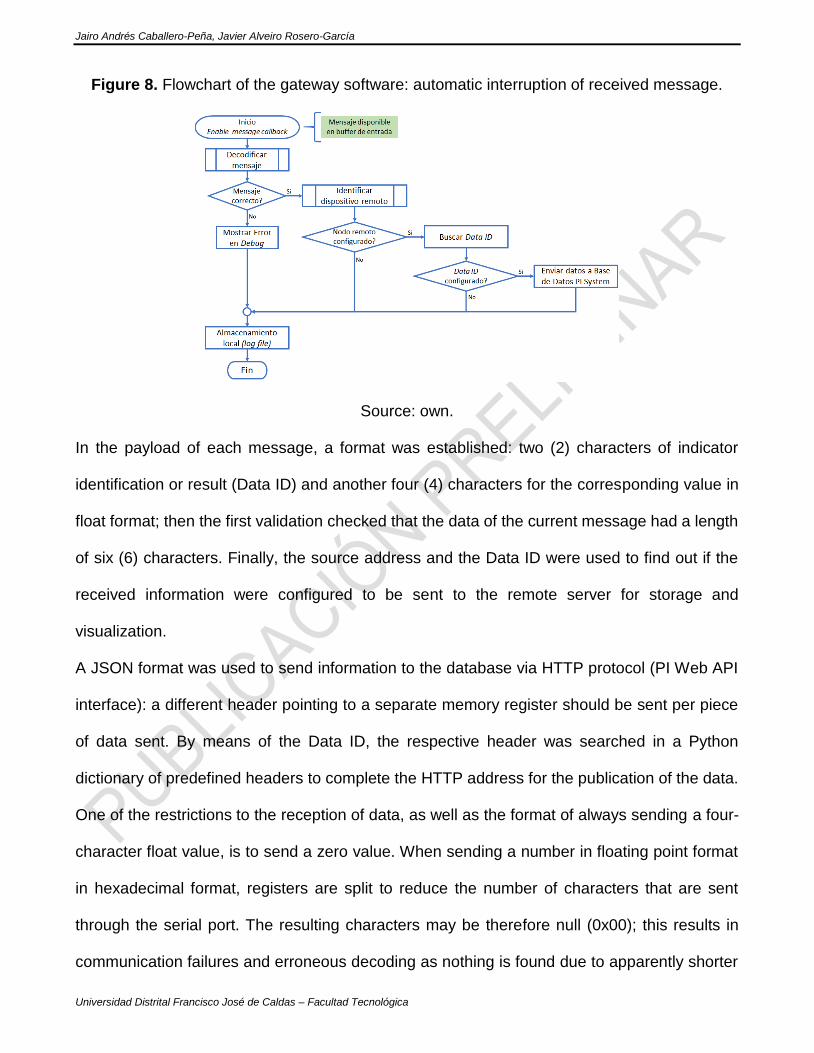
Figure 8. Flowchart of the gateway software: automatic interruption of received message.
Source: own.
In the payload of each message, a format was established: two (2) characters of indicator
identification or result (Data ID) and another four (4) characters for the corresponding value in
float format; then the first validation checked that the data of the current message had a length
of six (6) characters. Finally, the source address and the Data ID were used to find out if the
received information were configured to be sent to the remote server for storage and
visualization.
A JSON format was used to send information to the database via HTTP protocol (PI Web API
interface): a different header pointing to a separate memory register should be sent per piece
of data sent. By means of the Data ID, the respective header was searched in a Python
dictionary of predefined headers to complete the HTTP address for the publication of the data.
One of the restrictions to the reception of data, as well as the format of always sending a four-
character float value, is to send a zero value. When sending a number in floating point format
in hexadecimal format, registers are split to reduce the number of characters that are sent
through the serial port. The resulting characters may be therefore null (0x00); this results in
communication failures and erroneous decoding as nothing is found due to apparently shorter
Distributed Fault Diagnosis System based on Wireless Sensor Networks
Visión Electrónica • vol. 14 no. 2 (2020) • July-December • ISSN 1909-9746 • ISSN-E 2248-4728 • Bogotá (Colombia
data length. Then, the variation ranges of each piece of data reported were verified so that all
of them were lower than one (𝑥 < 1) with some scale factor (forced filling of a float register) or
never had zero values.
3.4. Server
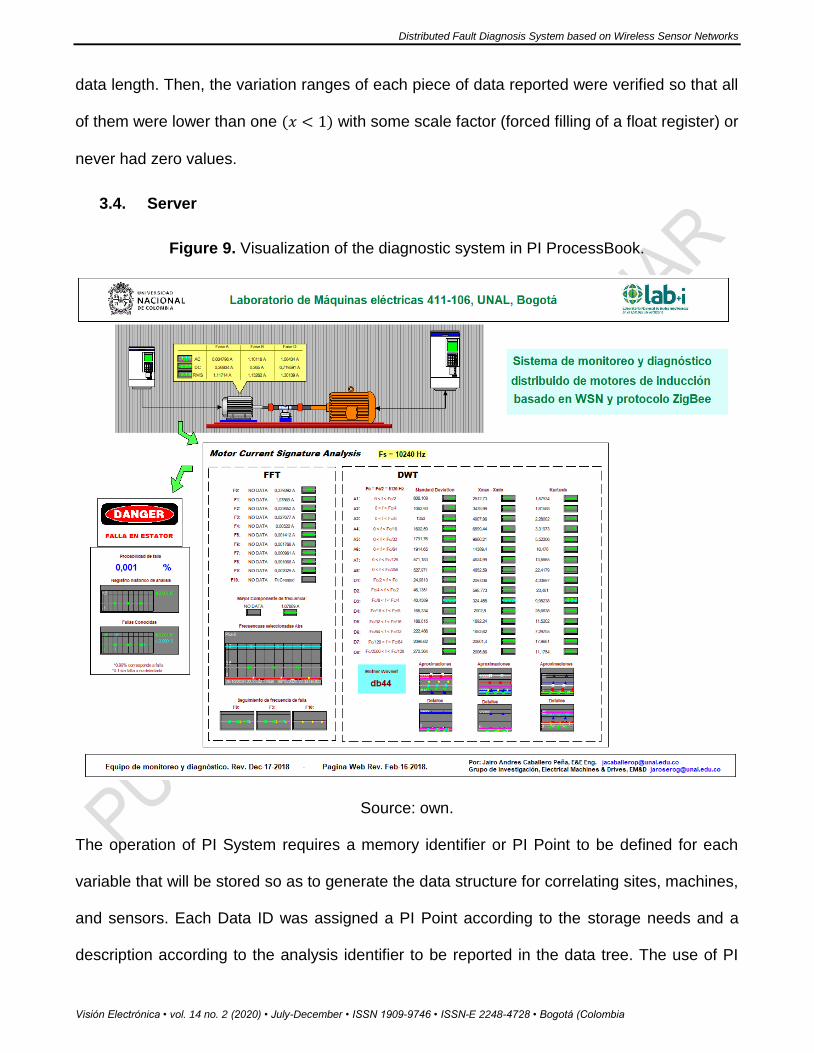
Figure 9. Visualization of the diagnostic system in PI ProcessBook.
Source: own.
The operation of PI System requires a memory identifier or PI Point to be defined for each
variable that will be stored so as to generate the data structure for correlating sites, machines,
and sensors. Each Data ID was assigned a PI Point according to the storage needs and a
description according to the analysis identifier to be reported in the data tree. The use of PI

Jairo Andrés Caballero-Peña, Javier Alveiro Rosero-García
Universidad Distrital Francisco José de Caldas – Facultad Tecnológica
Point allows different PI System applications to directly access the memory data for a faster
operation; this helps to synchronize and separate data recording and loading tasks, data
management (correlation of monitoring variables), fixed operations and analysis, and
visualization interfaces.
One of the applications that operate directly with memory records is PI ProcessBook, which
shows industrial process status variables in real-time and sends commands from the desktop,
similar to the operation of a SCADA system. The visualization of the diagnostic system was
developed on this interface: it shows the defined indicators, the status variables, and alerts in
case of faults in the motor being monitored (see Figure 9); it is also possible to check the
historical record of each variable to compare its behavior.
To use ProcessBook, it is necessary to install Pi System and its libraries in the monitoring
computer, in addition to having a stable connection directly to the data server (Archive). As an
alternative, for basic visualizations open to the public as other applications do, PI Vision
(formerly PI Coresight) was used, whose operation is based on offering a web service for
visualization in HTTP on a public IP. The latter was configured to provide the same visualization
in ProcessBook within the interface of the Laboratory of Smart Grids lab+i at Universidad
Nacional de Colombia.
4. System’s test and verification
T The diagnostic system was implemented on a Siemens three-phase induction motor of 7.5
HP (5.6 kW) at 220 V, YY connection, nominal speed of 1,732 rpm, and FP of 0.73; this motor
was adapted to generate interturn faults among 2, 4, and 6 turns of the stator in a controlled
way (see Figure 10). Additionally, internal thermocouples were installed to monitor the winding
temperature. This motor was located on a test bench to control torque and speed with the aim
of adjusting the desired operation point of the motor for different tests.

Distributed Fault Diagnosis System based on Wireless Sensor Networks
Visión Electrónica • vol. 14 no. 2 (2020) • July-December • ISSN 1909-9746 • ISSN-E 2248-4728 • Bogotá (Colombia
Figure 10. Motor configuration with breakers for controlled interturn faults [32].
Figure 11 shows the test procedure for collecting training data and subsequently verifying
operation. When setting the test condition, the torque and speed are adjusted to the reference
conditions or those to be analyzed; in this case the speed was set at 100% to fully know the
fault frequencies and the torque at 60% to prevent permanent damage of the motor insulation.
For each piece of data recorded, an additional control signal was configured to indicate when
a C1, C2 or C3 fault was applied; in this way, the data on fault and no faults was marked for
analysis.
Figure 11. Test procedure for diagnosis.
Source: own.
To verify the operation, the data was recorded again; in case of faults, the result of the SVM
diagnosis was compared with the described control signal. Figure 12 shows an example: the

Jairo Andrés Caballero-Peña, Javier Alveiro Rosero-García
Universidad Distrital Francisco José de Caldas – Facultad Tecnológica
dotted signal indicates the result of the fault diagnosis (0 or 1) and the continuous line
corresponds to the control signal to mark the fault; in this case a correct diagnosis of three C1
faults (2 turns) was achieved.
Figure 12. Expected result of fault diagnosis through PI Vision visualization.
Source: own.
The diagnosis applied to validate the diagnostic system was based on the analysis of the
current imbalance resulting from the application of an interturn fault. In Figure 13, the phase
with the fault has an increase of 10%; therefore, the indicators used correspond to the AC value
of the phase with fault compared to one of the other two, as shown in Figure 14.
Based on these indicators with their known data on fault and no fault, the SVM was configured
to propose a linear classification kernel that achieved a score of 0.98 (see Figure 15). The
validation tests showed that the fault was always detected during the conditions given in the
laboratory (see Figure 12); however, it is worth mentioning that a current imbalance in the stator
can be generated by more than one fault (AC/AC driver’s faults, load imbalances, voltage
imbalances, among others). Consequently, this method is appropriate to validate the system
but not to make a correct diagnosis of the induction motor.

Distributed Fault Diagnosis System based on Wireless Sensor Networks
Visión Electrónica • vol. 14 no. 2 (2020) • July-December • ISSN 1909-9746 • ISSN-E 2248-4728 • Bogotá (Colombia
Figure 13. AC value of phase A and RMS of the main component in frequency through FFT
of phase A for C1 fault with 100% speed.
Source: own.
Figure 14. XY comparison of AC values of phase A and B for C1 fault with rated speed and
60% of the load.
Source: own.

Jairo Andrés Caballero-Peña, Javier Alveiro Rosero-García
Universidad Distrital Francisco José de Caldas – Facultad Tecnológica
Figure 15. Normalized classification based on AC value of phase A and B for C1 fault with
rated speed and 60% of load.
Source: own.
5. Conclusions
The platform was developed to identify interturn faults of the stator of an induction motor by
calculating various indicators in a distributed manner to subsequently notify the result of the
analysis to the industrial monitoring platform. The proposed structure aimed to reduce energy
consumption and the bandwidth required for communication with the hub, changes in the needs
of the server as less memory capacity is required, and the scalability of the system to integrate
various monitoring devices.
The implementation of a wireless sensor network (WSN) integrated to the industrial monitoring
system improves the reliability, access, and availability of data because of several gateways
for data collection and routing through remote nodes. In addition, it improves tolerance to faults
in the communication network, has greater capacity for distributed analysis, provides higher
quality of information for decision making, and analyzes variables not previously considered in
industrial systems.

Distributed Fault Diagnosis System based on Wireless Sensor Networks
Visión Electrónica • vol. 14 no. 2 (2020) • July-December • ISSN 1909-9746 • ISSN-E 2248-4728 • Bogotá (Colombia
Acknowledgments
Gratefulness to Electrical Machines & Drives – research group and UN Innnova program by
academic division of Universidad Nacional de Colombia.
References
[1] J. P. Amaro, F. J. T. E. Ferreira, R. Cortesão, N. Vinagre, R. P. Bras, "Low cost wireless
sensor network for in-field operation monitoring of induction motors", Proc. IEEE Int.
Conf. Ind. Technol., pp. 1044-1049, 2010. https://doi.org/10.1109/ICIT.2010.5472560
[2] M. Bordasch, C. Brand, P. Gohner, "Fault-based identification and inspection of fault
developments to enhance availability in industrial automation systems", IEEE 20th
Conference on Emerging Technologies & Factory Automation (ETFA), 2015, pp. 1-8.
https://doi.org/10.1109/ETFA.2015.7301515
[3] L. Hou, N. W. Bergmann, "Novel industrial wireless sensor networks for machine
condition monitoring and fault diagnosis", IEEE Trans. Instrum. Meas., vol. 61, no. 10,
pp. 2787-2798, 2012. https://doi.org/10.1109/TIM.2012.2200817
[4] F. J. Ferreira, G. Baoming, A. T. de Almeida, "Reliability and operation of high-efficiency
induction motors", IEEE/IAS 51st Ind. Commer. Power Syst. Tech. Conf., pp. 1-13,
2015. https://doi.org/10.1109/ICPS.2015.7266412
[5] A. Gandhi, T. Corrigan, L. Parsa, "Recent Advances in Modeling and Online Detection
of Stator Interturn Faults in Electrical Motors", IEEE Transactions on Industrial
Electronics, vol. 58, no. 5. pp. 1564-1575, 2011.
https://doi.org/10.1109/TIE.2010.2089937
[6] N. W. Bergmann, L. Q. Hou, "Energy Efficient Machine Condition Monitoring Using
Wireless Sensor Networks", Int. Conf. Wirel. Commun. Sens. Netw., pp. 285-290, 2014.
https://doi.org/10.1109/WCSN.2014.65
[7] L. Hou, N. W. Bergmann, "Induction motor condition monitoring using industrial wireless
sensor networks", Sixth Int. Conf. Intell. Sensors, Sens. Networks Inf. Process., pp. 49-
54, 2010. https://doi.org/10.1109/ISSNIP.2010.5706739
[8] S. Nandi, H. A. Toliyat, X. Li, "Condition monitoring and fault diagnosis of electrical
motors - A review", IEEE Trans. Energy Convers., vol. 20, no. 4, pp. 719-729, 2005.
https://doi.org/10.1109/TEC.2005.847955
[9] R. Windings, "In-service monitoring of stator and rotor windings," pp. 389-437, 2014.
https://doi.org/10.1002/9781118886663.ch16
[10] G. Jagadanand, F. L. Dias, "ARM based induction motor fault detection using wavelet
and support vector machine", IEEE International Conference on Signal Processing,

Jairo Andrés Caballero-Peña, Javier Alveiro Rosero-García
Universidad Distrital Francisco José de Caldas – Facultad Tecnológica
Informatics, Communication and Energy Systems (SPICES), pp. 1-4, 2015.
https://doi.org/10.1109/SPICES.2015.7091503
[11] M. A. Khan, T. S. Radwan, M. A. Rahman, "Real-time implementation of wavelet packet
transform-based diagnosis and protection of three-phase induction motors", IEEE
Trans. Energy Convers, vol. 22, no. 3, pp. 647-655, 2007.
https://doi.org/10.1109/TEC.2006.882417
[12] S. Mallat, "Wavelet Bases," in A Wavelet Tour of Signal Processing, Third., Elsevier
Ltd, pp. 263-376, 2009. https://doi.org/10.1016/B978-0-12-374370-1.00011-2
[13] H. Douglas, P. Pillay, P. Barendse, "The detection of interturn stator faults in doubly-
fed induction generators", Conference Record - IAS Annual Meeting (IEEE Industry
Applications Society), vol. 2, pp. 1097-1102, 2005.
[14] A. Sapena-Baño, "Condition monitoring of electrical machines using low computing
power devices", Int. Conf. Electr. Mach., pp. 1516-1522, 2014.
https://doi.org/10.1109/ICELMACH.2014.6960383
[15] S. Das, P. Purkait, D. Dey, S. Chakravorti, "Monitoring of inter-turn insulation failure in
induction motor using advanced signal and data processing tools", IEEE Trans.
Dielectr. Electr. Insul., vol. 18, no. 5, pp. 746-751, 2002.
https://doi.org/10.1109/TDEI.2011.6032830
[16] P. S. Barendse, B. Herndler, M. A. Khan, P. Pillay, "The application of wavelets for the
detection of inter-turn faults in induction machines", IEEE Int. Electr. Mach. Drives Conf.
IEMDC '09, pp. 1401-1407, 2009. https://doi.org/10.1109/IEMDC.2009.5075386
[17] N. R. Devi, S. A. Gafoor, P. V. R. Rao, "Wavelet ANN based stator internal faults
protection scheme for 3-phase induction motor", Proc. 2010 5th IEEE Conf. Ind.
Electron. Appl. ICIEA 2010, pp. 1457-1461, 2010.
[18] N. Rama Devi, D. V. Siva Sarma, P. V. Ramana Rao, "Detection of stator incipient
faults and identification of faulty phase in three-phase induction motor - simulation and
experimental verification", IET Electr. Power Appl., vol. 9, no. 8, pp. 540-548, 2015.
https://doi.org/10.1049/iet-epa.2015.0024
[19] N. Laouti, S. Othman, M. Alamir, N. Sheibat, "Combination of Model-based Observer
and Support Vector Machines for Fault Detection of Wind Turbines", Int. J. Autom.
Comp., vol. 11, no. 3, pp. 274-287, 2015. https://doi.org/10.1007/s11633-014-0790-9
[20] D. A. Asfani, M. H. Purnomo, D. R. Sawitri, "Naïve Bayes classifier for Temporary short
circuit fault detection in Stator Winding", 9th IEEE International Symposium on
Diagnostics for Electric Machines, Power Electronics and Drives (SDEMPED), pp. 288-
294, 2013. https://doi.org/10.1109/DEMPED.2013.6645730
[21] S. Choi, B. Akin, M. M. Rahimian, H. A. Toliyat, "Performance-Oriented Electric Motors
Diagnostics in Modern Energy Conversion Systems", IEEE Transactions on Industrial

Distributed Fault Diagnosis System based on Wireless Sensor Networks
Visión Electrónica • vol. 14 no. 2 (2020) • July-December • ISSN 1909-9746 • ISSN-E 2248-4728 • Bogotá (Colombia
Electronics, vol. 59, no. 2. pp. 1266-1277, 2012.
https://doi.org/10.1109/TIE.2011.2158037
[22] G. A. Capolino, J. A. Antonino-Daviu, M. Riera-Guasp, "Modern diagnostics techniques
for electrical machines, power electronics, and drives", IEEE Trans. Ind. Electron., vol.
62, no. 3, p. 8, 2015. https://doi.org/10.1109/TIE.2015.2391186
[23] H. Henao, "Trends in Fault Diagnosis for Electrical Machines: A Review of Diagnostic
Techniques", IEEE Ind. Electron. Mag., vol. 8, no. 2, pp. 31-42, 2014.
https://doi.org/10.1109/MIE.2013.2287651
[24] A. Schmitt, H. Silva, R. Scalassara, P. Goedtel, "Bearing Fault Detection Using Relative
Entropy of Wavelet Components and Artificial Neural Networks", pp. 538-543, 2013.
https://doi.org/10.1109/DEMPED.2013.6645767
[25] L. Hou, N. W. Bergmann, "Induction motor fault diagnosis using industrial wireless
sensor networks and Dempster-Shafer classifier fusion", IECON 2011 - 37th Annual
Conference of the IEEE Industrial Electronics Society, pp. 2992-2997, 2011.
https://doi.org/10.1109/IECON.2011.6119786
[26] G. Feng, A. Mustafa, J. X. Gu, D. Zhen, F. Gu, A. D. Ball, "The real-time implementation
of envelope analysis for bearing fault diagnosis based on wireless sensor network",
19th International Conference on Automation and Computing (ICAC), pp. 1-6, 2013.
[27] E. T. Esfahani, S. Wang, V. Sundararajan, "Multisensor wireless system for eccentricity
and bearing fault detection in induction motors", IEEE/ASME Trans. Mechatronics, vol.
19, no. 3, pp. 818-826, 2014. https://doi.org/10.1109/TMECH.2013.2260865
[28] Maxim Integrated, "MAX291/MAX292/MAX295/MAX296 8th-Order, Lowpass,
Switched-Capacitor Filters", no. Rev 5., pp. 1-10.
[29] L. Buitinck, "API design for machine learning software: experiences from the scikit-learn
project", ECML PKDD Workshop: Languages for Data Mining and Machine Learning,
pp. 108-122, 2013.
[30] F. Pedregosa, "Scikit-learn: Machine Learning in Python", J. Mach. Learn. Res., vol.
12, pp. 2825-2830, 2011.
[31] G. M. Joksimovic, J. Penman, "The detection of inter-turn short circuits in the stator
windings of operating motors", IEEE Trans. Ind. Electron., vol. 47, no. 5, pp. 1078-1084,
2000. https://doi.org/10.1109/41.873216
[32] M. A. Delgado Narváez, "Monitoreo y Diagnóstico de Electric Machine Drive Systems
(EMDS)", Universidad Nacional de Colombia, 2017. [33] S. G. M octezuma Guti érrez, A. Cruz Pazarán, R . Galicia Mej ía, L. N. Oli va M oreno, “Desarroll o de pl ataforma para i mplementación de robots colaborati vos”, Visi ón el ectr ónica, vol. 12, no. 1, pp. 22-31, 2018. https://doi.org/10.14483/22484728.13308