distributed generation valuation and compensation
TRANSCRIPT

PNNL-27271
Prepared for the U.S. Department of Energy under Contract DE-AC05-76RL01830
Distributed Generation Valuation and Compensation
White Paper
February 2018
AC Orrell
JS Homer
Y Tang


PNNL-27271
Distributed Generation Valuation and Compensation
White Paper
February 2018
AC Orrell
JS Homer
Y Tang
Prepared for
the U.S. Department of Energy
under Contract DE-AC05-76RL01830
Pacific Northwest National Laboratory
Richland, Washington 99352

iii
Executive Summary
This white paper can help guide a state as it considers issues associated with distributed generation
valuation and compensation. States may address a common set of questions and issues in the valuation
process, but differences in market expectations, policy priorities, and regulations result in different
responses. Key issues include the following.
Context is important. Valuations and compensation strategies will vary based on goals and objectives
they are being designed to achieve. Goals and objectives should be made clear up front and will drive
the perspective used in performing valuations and how outcomes are applied.
An important early step in performing valuations is to survey the different value components and their
associated costs and benefits that could be used as the valuation building blocks. Examples of
valuation building blocks include avoided costs associated with fuel, generation capacity,
transmission capacity, reserve capacity, distribution capacity, fixed and variable operations, and
maintenance and environmental compliance and/or impacts.
Utilities and stakeholders can have different interpretations of how value elements should be
calculated. In some states, the objective of standardized calculators and methods is to reduce
ambiguity and inconsistencies in how valuations are performed.
Certain value elements are difficult or impossible to quantify and most efforts to establish workable
value of solar or value of distributed energy resource tariffs are emerging and nascent. Assessing
locational and temporal value of distributed generation and applying that in compensation schemes is
a new and emerging field of study being explored by a handful of research organizations and
advanced states and utilities.
The most advanced states, such as California, are using demonstration projects to test valuation and
compensation methodologies or are applying valuation and compensation strategies to a subset of
customer projects, such as for community solar projects (e.g., Oregon and New York), before rolling
out programs to the full customer base.
A variety of states are moving away from full net metering, in many cases substituting avoided cost
rates (sometimes with an adder) in lieu of full retail rate compensation, instead of pursuing valuation
of distributed energy resource approaches. For example, in Indiana a 25% adder is applied to average
wholesale electricity prices and in Mississippi a 2.5 cents/kWh adder is applied to avoided cost rates.
These adders appear to have been established through policy directives rather than comprehensive
cost of service valuations.


v
Acknowledgments
The authors wish to acknowledge the contributions and valuable assistance provided by Katharine
McErlean, Jim Zolnierek, Torsten Clausen, Terrance Garmon, and Cholly Smith at the Illinois Commerce
Commission. This work was made possible by funding from the U.S. Department of Energy Solar Energy
Technology Office (SETO) as part of a program to provide analytical support to state public utility
commissions. Special thanks to Michele Boyd, Elaine Ulrich, and Garrett Nilsen at SETO. Internal review
and editing were provided by Abhishek Somani and Heather Culley.

vii
Acronyms and Abbreviations
CGS Customer grid-supply
CPR Clean Power Research
CPUC California Public Utilities Commission
CSS Customer self-supply
DER Distributed energy resource
DRP Distribution Resource Plans
DRV Demand reduction value
ERCOT Electric Reliability Council of Texas
FEJA Future Energy Jobs Act
FIT feed-in tariff
HECO Hawaiian Electric Company
ICC Illinois Commerce Commission
IOU Investor-owned utilities
LBMP Locational Based Marginal Price
LCOE Levelized cost of energy
LNBA Locational Net Benefits Analysis
LSRV Locational system relief value
MCOS Marginal cost of service
NARUC National Association of Regulatory Utility Commissioners
NEM Net energy metering
NYPSC New York Public Service Commission
OPUC Oregon Public Utilities Commission
PUC Public Utilities Commission
PURPA Public Utility Regulatory Policies Act
REC Renewable energy certificate
RGGI Regional Greenhouse Gas Initiative
RVOS Resource value of solar
SETO Solar Energy Technology Office
TOU Time-of-use
VOST Value of solar tariff


ix
Contents
Executive Summary ..................................................................................................................................... iii
Acknowledgments ......................................................................................................................................... v
Acronyms and Abbreviations ..................................................................................................................... vii
1.0 Introduction .......................................................................................................................................... 1
1.1 Report Purpose ............................................................................................................................. 1
1.2 Background .................................................................................................................................. 1
1.3 Importance of Context .................................................................................................................. 2
1.4 Illinois Context ............................................................................................................................. 4
2.0 Distributed Generation Valuation and Compensation .......................................................................... 5
2.1 Market Types ............................................................................................................................... 5
2.2 Value of Resource and Value of Service...................................................................................... 5
2.3 Valuation Building Blocks ........................................................................................................... 6
2.4 Valuation Challenges ................................................................................................................... 7
3.0 State Approaches .................................................................................................................................. 8
3.1 California ...................................................................................................................................... 8
3.2 New York ..................................................................................................................................... 9
3.3 Oregon ........................................................................................................................................ 10
3.4 Minnesota ................................................................................................................................... 11
3.5 Austin Energy ............................................................................................................................. 13
3.6 Maine .......................................................................................................................................... 14
3.7 Hawaii ........................................................................................................................................ 14
3.8 Indiana ........................................................................................................................................ 15
3.9 Mississippi .................................................................................................................................. 15
3.10 Arizona ....................................................................................................................................... 15
3.11 New Jersey ................................................................................................................................. 15
4.0 Summary and Conclusions ................................................................................................................. 16
5.0 References .......................................................................................................................................... 17
Appendix A – Valuation Elements Graphic ............................................................................................. A.1

x
Figures
1 Stakeholder Perspectives ...................................................................................................................... 3
2 Relative Weights of Minnesota Value of Solar Components ............................................................... 7
3 Components of LNBA Tool.................................................................................................................. 8
4 Minnesota VOS Calculation Table ..................................................................................................... 12
5 Minnesota Example VOS Data Table ................................................................................................. 13
Tables
1 Potential Value Calculation Elements .................................................................................................. 6
2 LNBA Avoided Cost Components ....................................................................................................... 9
3 New York’s VDER Components .......................................................................................................... 9

1
1.0 Introduction
The adoption of distributed generation has different implications for system owners, utilities, utility
customers (including both participating customers who have distributed generation and non-participating
customers), and the overall society. As a result, distributed generation can be valued differently by
stakeholders. Valuation calculations or processes can be tied to distributed generation compensation
mechanisms, such as value of solar tariffs or distributed generation rebates.
In a value of distributed generation calculation, all values, both positive (i.e., benefits) and negative
(i.e., costs), are considered to achieve a net value. This allows for a well-designed compensation
mechanism to be achieved that mitigates negative effects, reinforces positive effects, and supports the full
and fair value of distributed generation to all stakeholders (NREL 2017).
1.1 Report Purpose
This white paper can help guide a state in determining its goals and objectives for distributed generation
valuation and compensation. States may address a common set of questions and issues in the valuation
process, but differences in system contexts, market expectations, policy priorities, and regulations result
in different responses (NREL 2013). This report highlights what some states are doing, and their current
challenges, to show how distributed generation valuation and compensation are currently being
considered.
1.2 Background
Valuation and compensation of distributed generation has changed over the years to keep pace with the
evolution of distributed generation. The primary compensation mechanisms in the United States have
included payments per the Public Utility Regulatory Policies Act (PURPA), net energy metering (NEM)
programs, and next generation programs, such as value of solar tariffs and successor NEM programs.
PURPA, enacted in 1978, was designed to encourage energy conservation and to support domestic
renewable energy sources (Warren 2017). PURPA requires utilities to purchase electricity from
renewable energy generating facilities of 80 MW or less (FERC 2017) at the utility’s avoided cost rate,
the incremental cost equal to or less than what a utility would have to pay for electricity from a traditional
power plant.
Because PURPA requires utilities to allow customers to self-generate electricity and be compensated for
it, PURPA essentially laid the foundation for future NEM programs (Freeing the Grid 2015) and feed-in
tariffs. While PURPA is a federally mandated compensation policy, NEM is a state policy that
compensates generation at retail electricity rates, not avoided cost rates.
Thirty-eight states have mandated NEM rules as of November 2017, but many states are scaling back
their NEM requirements, or introducing replacement programs, such as value of solar tariffs, buy-all, sell-
all, or net billing programs, as discussed in Section 3.0. Even with these next generation programs that are
moving away from valuing compensation at the retail electricity rate, PURPA still provides a minimum
level of distributed generation compensation protection.
In contrast to NEM, a feed-in tariff (FIT) compensates generation at a set FIT rate that is typically higher
than the retail rate (EIA 2013). A FIT is typically designed and implemented to achieve overarching
policy goals such as accelerating renewable energy investment and/or reducing greenhouse gas emissions.

2
Feed-in tariff programs are not common in the United States, but are used in many European countries
and Japan.
1.3 Importance of Context
A state’s goals for what it is ultimately trying to achieve with a program, tariff, incentive, or rebate will
impact its valuation calculations. Goals can include reducing state carbon emissions, replacing net
metering, encouraging renewable energy development, encouraging market participation from a variety of
resources, encouraging only cost-effective renewable energy development, or some combination of
factors. This context can come from state legislation, executive goals, and/or state commission actions. As
a state moves toward developing valuation and compensation schemes for distributed generation, it is
important they have a clear understanding and statement of the goals and objectives the programs are
being designed to achieve.
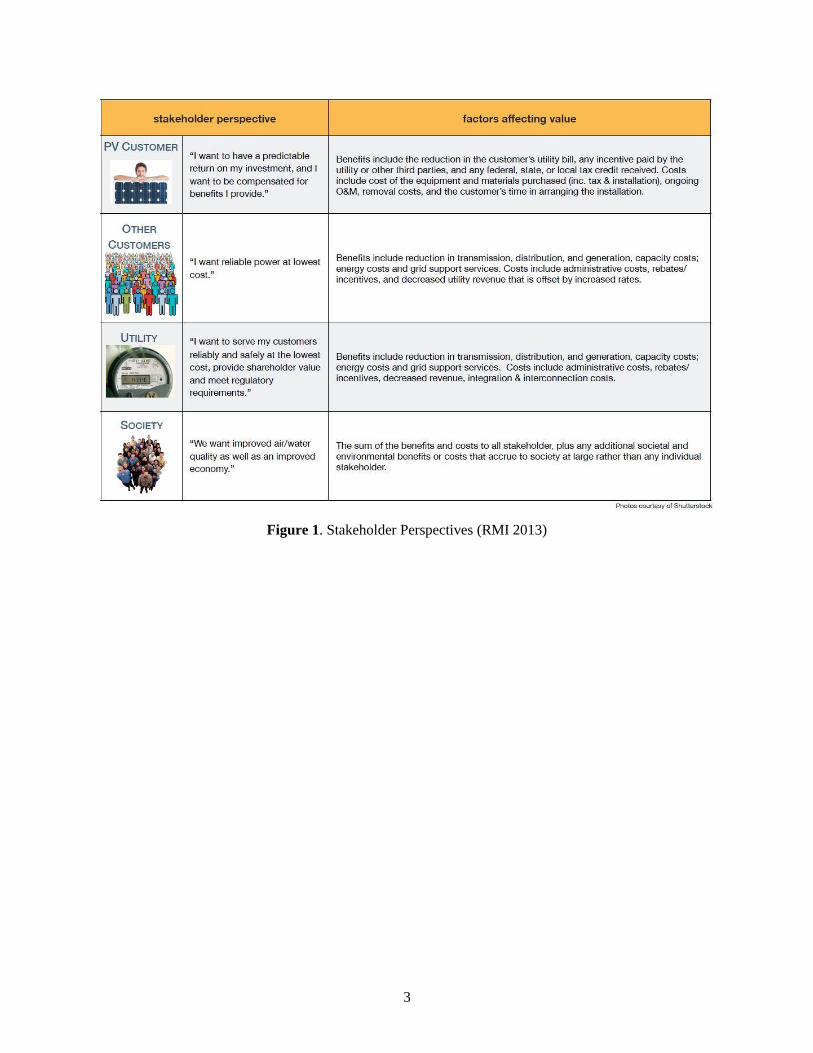
Context therefore drives the valuation process and the perspective used in the valuation. Three different
perspectives are typically considered—that of the participating customer, the utility (and thus the utility
customer), or society as a whole. The views of other stakeholders, primarily the non-participating
customer, but also the distributed generation industry and the policy maker, can also be considered as they
relate to the three main perspectives.
As noted by the consulting firm Energy and Environmental Economics, Inc. (E3), improvement in
environmental quality is a value for society. Improvement in the environment can be quantified or
assessed in different ways—one such way is to apply the social cost of carbon in the valuation and
another is to ensure that the costs of complying with environmental laws or renewable portfolio standards
(RPS) are included.
Selecting a primary perspective will determine which elements should be considered and how they should
be included in a valuation calculation. Figure 1 (from Rocky Mountain Institute) summarizes these
perspectives.
3
Figure 1. Stakeholder Perspectives (RMI 2013)

4
1.4 Illinois Context
As the Illinois Commerce Commission (ICC) considers the valuation process for a distributed generation
rebate (referred to by some as the smart inverter rebate), different perspectives will need to be accounted
for and a determination made as to how to interpret existing policies, directions, and legislation, namely
the context provided in the directions and language of the Future Energy Jobs Act (FEJA) (Public Act
099-0906).
The FEJA declares that the state should encourage “the adoption and deployment of cost-effective
distributed energy resource technologies and devices…which can…stimulate economic growth, enhance
the continued diversification of Illinois' energy resource mix, and protect the Illinois
environment;…which should benefit all citizens of the State, including low-income households…”
(Illinois 2017). These ideas indicate a desire for the valuation to achieve many goals from economic
development to environmental protection.
The FEJA covers other related topics as well, including expanding net metering to include community-
owned (typically solar) projects. The FEJA refers to the credit for owners of or subscribers to these types
of projects as the “energy supply rate”—there was disagreement among stakeholders on how to value the
energy supply rate. The ICC issued an order concluding that only the value of the electricity produced
should be energy supply rate (and transmission service or other charges should not be bundled with the
electricity charge) (ICC 2017). This rate is applicable to just community-owned projects, as defined in the
FEJA, and differs from the net metering policy for individual distributed generation owners.
In addition to these high-level objectives and language, the FEJA also makes specific mandates. It
specifies that the valuation “must reflect the value of the distributed generation, consider geographic,
time-based, and performance-based benefits, as well as present and future grid needs” and “be grounded
in a technical knowledge of how distributed energy systems impact the distribution network and the grid
in general.” It also declares that “the social cost of carbon is an appropriate valuation of the environmental
benefits provided by zero emission facilities” (Illinois 2017).
Related to these geographic and time-based requirements, the FEJA requires rebate recipients to have
their distributed generation interconnected to the utility’s grid with a smart inverter—the utility will be
allowed to operate and control the smart inverter with the intent of preserving distribution system
reliability (Illinois 2017). Any compensation from the utility to the distributed generation owner for this
control and use of the smart inverter is separate from the distributed generation rebate.
Finally, the FEJA states, “An electric utility shall recover from its retail customers all of the costs of the
rebates made under a tariff or tariffs…including, but not limited to, the value of the rebates and all costs
incurred by the utility to comply with and implement…” the valuation requirements set forth in the FEJA
(Illinois 2017).
Besides the distributed generation rebate, the FEJA is also the impetus for the NextGrid initiative.
NextGrid, kicked off in March 2017 by the ICC, is a consumer-focused study on topics such as leveraging
the state’s restructured energy market, investment in smart grid technology, and recent laws expanding
renewable energy and efficiency (Homer et al. 2017). NextGrid working groups may be a source of
additional input in the rebate valuation process.

5
2.0 Distributed Generation Valuation and Compensation
This section summarizes more considerations for a valuation methodology, including market types,
common valuation building blocks, and valuation challenges.
2.1 Market Types
The three main perspectives that can influence a valuation calculation are those of the participating
customer, the utility, and society. The resulting program, tariff, incentive, or rebate then impacts the
distributed generation market. Market environments have been characterized as either a price-support
market, a transitional market, or a price-competitive market (Taylor et al. 2015).
In a price-support market, the value of distributed generation rate is not sufficient to fully recover the
levelized cost of energy (LCOE) of distributed solar photovoltaic (PV) or other generation systems;
additional incentives can be used to bridge this gap. In a transitional market, the value of distributed
generation rate is nearly equal to the LCOE of the distributed solar PV and limited additional incentives
may be needed to sustain the market. In a price-competitive market, the rate is greater than the LCOE,
meaning the market is self-sustaining.
A state can consider which of these different market types exist in their jurisdiction, including existing or
planned incentives and/or tax credits, when translating valuation calculations to program design.
2.2 Value of Resource and Value of Service
A recent National Association of Regulatory Utility Commissioners (NARUC) report provides a manual
for rate design and distributed energy resources (DER) compensation policies (NARUC 2016). The report
explores characterizing valuation methodologies as either a value of resource or value of service method.
Most value of distributed generation calculations focus on value of resource components and some
attempt to address value of service components as well.
Value of resource studies evaluate saved or additional energy costs, transmission capacity costs, and
administration costs associated with a specific type of DER. With a value of resource methodology, a
value of solar or other distributed generation rate is determined through a bottom-up calculation of all the
benefits and costs that distributed generation provides to or imposes on the electricity system. These value
streams (e.g., avoided transmission capacity, administration costs) are added together to create a single
rate, expressed in cents per kilowatt-hour (kWh), at which customers are compensated for their distributed
generation (Taylor et al. 2015).
A value of service approach attempts to identify services that distributed generation can provide,
independent of the type of resource, such as providing resource adequacy and grid reliability through
voltage support or black start capabilities (NARUC 2016). There is overlap between value of resource and
value of service characterizations, including ancillary services that may include voltage or reactive power
support. The different components are presented in Section 2.3 and the complexity of valuing service and
some other components is discussed in Section 2.4.
6
2.3 Valuation Building Blocks
The first step in typical value of distributed generation calculations is to survey the different value
components, and their associated costs and benefits, that could be used as the valuation building blocks.
States include different elements in their calculations based on state-specific policy goals or legislation, as
discussed in Section 1.2, and market types, as discussed in Section 2.1. Even when value elements are
agreed upon, there are different interpretations of how they should be calculated. For this reason, some
states develop standard methods or calculators to reduce ambiguity and promote consistency.
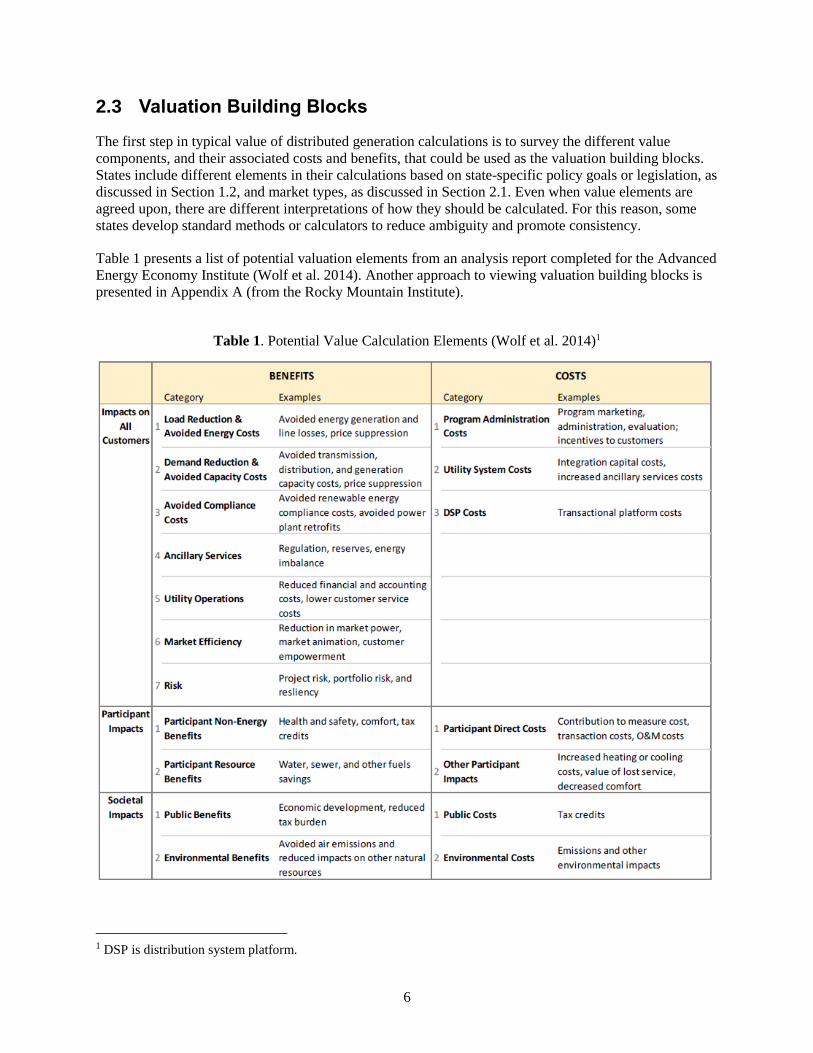
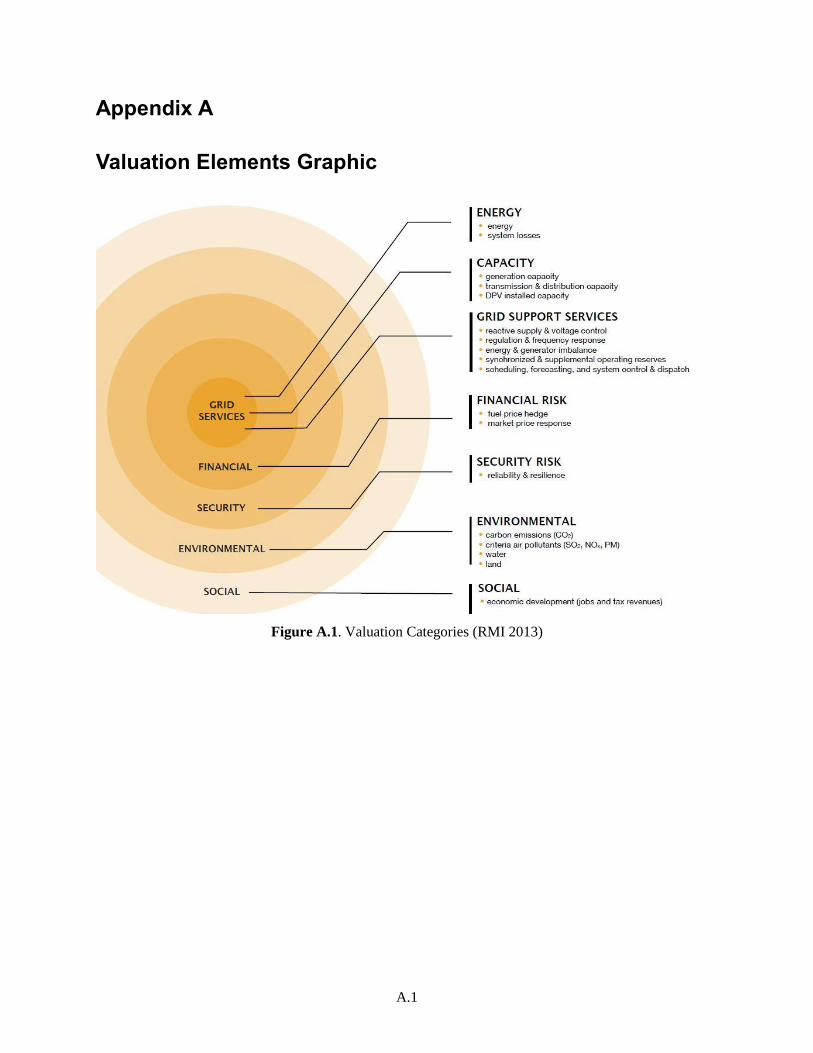
Table 1 presents a list of potential valuation elements from an analysis report completed for the Advanced
Energy Economy Institute (Wolf et al. 2014). Another approach to viewing valuation building blocks is
presented in Appendix A (from the Rocky Mountain Institute).
Table 1. Potential Value Calculation Elements (Wolf et al. 2014)1
1 DSP is distribution system platform.

7
While this list attempts to be comprehensive of all the possible elements, not all elements have equal
weight in a valuation. For example, the relative weights of the elements used in the Minnesota value of
solar calculation are shown in Figure 2 and are presented in more detail in Section 3.4.
Figure 2. Relative Weights of Minnesota Value of Solar Components (Flores-Espino 2015)
2.4 Valuation Challenges
Some elements of value can be difficult to quantify because the value of distributed generation approach
is a relatively new practice. In addition, stakeholders, particularly different utilities, have diverse business
expenses and different interpretations of elements and how to calculate them that can result in widely
varying valuations. Monetizing some elements, such as social value or the value of meeting state policy
directives around employment or low income customers, can be difficult or impossible to quantify.
A Rocky Mountain Institute review of solar PV benefit and cost studies noted a significant range of
estimated values across studies, driven primarily by differences in local context, input assumptions, and
methodologies (RMI 2013). With respect to local context, solar PV generation may provide a significant
generation capacity deferral value in certain regions, but in other regions the avoided generation capacity
value could be significantly lower (OPUC 2015). In addition, input assumptions are influenced by the
valuation perspective, and different methodologies can be used to estimate elements such as the market
price response.
Some of the more challenging elements include grid support services, RPS and environmental
compliance, financial market elements (e.g., market price response), and social value (e.g., economic
development benefits). As an example, while NEM does not account for time or locational differences in
costs or energy value, a value of distributed generation tariff or rebate may be able to account for these
elements; however, existing efforts to characterize temporal and locational value and translate them into a
rate or incentive are limited and nascent. A value of distributed generation calculation could monetize the
benefit of grid support services to maintain distribution grid stability and reliability, but these services
need to be defined and would require technology investments by both the distributed generation owner
and the utility to implement (NARUC 2016).
Determining how the value elements vary through time and at different locations across the utility service
territory is a nascent field of study, currently limited to research organizations and some of the more
advanced utilities and states. Section 3.0 describes examples of states, such as California and New York

8
that are moving in that direction and have relatively new demonstration projects or programs to do so, but
the practice and results are not well established.
3.0 State Approaches
Multiple states have implemented, or are in the process of implementing, various distributed generation
valuation approaches that consider the building blocks described in Section 2.0. Other states provide
examples of approaches that are essentially scaled back net metering programs, reducing the
compensation amount for distributed generation. The following are examples of states that have or are
studying, adopting, implementing, amending, or discontinuing policies associated with distributed solar
PV valuation and/or compensation; however, it is not a comprehensive list.1
3.1 California
In recognition that traditional distribution system planning is limited in its ability to support state policies
on DERs and emerging technologies, the California legislature passed Assembly Bill (AB) 327 in 2013,
requiring utilities to file Distribution Resource Plans (DRPs) with the California Public Utilities
Commission (CPUC 2015a). DRP proposals, the first of which were filed by July 1, 2015, included an
evaluation of locational benefits and costs of DERs on the distribution system (CPUC 2015b).
Evaluations were based on reductions or increases in local generation capacity needs, avoided or
increased investments in distribution infrastructure, safety benefits, reliability benefits, and any other
savings the distributed resources provide to the electric grid or costs to customers.
The three large investor-owned utilities (IOUs) in California (Pacific Gas & Electric, San Diego Gas &
Electric, and Southern California Edison) jointly engaged the consulting firm Energy and Environmental
Economics, Inc. (E3) to develop a technology-agnostic Excel tool for estimating location-specific avoided
costs of DER for a Locational Net Benefits Analysis (LNBA) demonstration project. As shown in Figure
3, the LNBA tool has two major parts—a project deferral benefit module, which calculates the values of
deferring a specific capital project, and a system-level avoided cost module, which estimates the system-
level avoided costs given a user-defined DER solution. The summation of the quantitative results
provided by the two modules provides an estimate of the total achievable avoidable cost for a given DER
solution at a specific location.
Figure 3. Components of LNBA Tool
1 The North Carolina Clean Energy Technology Center’s quarterly 50 States of Solar report does comprehensively
track solar PV policies for each state.

9
Table 2 lists the components of avoided costs to be calculated by the LNBA in California, as required by
CPUC. The transmission and distribution (T&D) avoided costs in the table are the central focus of the
LNBA demonstration project, since they are the LNBA components most sensitive to locations. Most of
the non-T&D components of the LNBA are borrowed from or are extensions of an existing DER Avoided
Cost calculator (DERAC) that was developed previously by E3 for the CPUC as part of demand side cost
effectiveness proceedings (Zach 2017).
Table 2. LNBA Avoided Cost Components (PG&E 2016)
Note Components of Avoided
Costs
Proposed LNBA Elements in IOU
Fillings
Central Focus Avoided T&D Sub-transmission/substation/feeder
Distribution voltage/power quality
Distribution reliability/resiliency
Transmission
System-Level
Avoided Costs
Use DERAC
Values
Avoided generation
capacity
System and local resource adequacy
Flexible resource adequacy
Avoided energy Use locational marginal prices to
determine
Avoided GHG Incorporated into avoided energy
Avoided RPS Methodology outlined in DERAC
Avoided ancillary
services
Methodology outlined in DERAC
Additional to
DERAC
- Renewable integration costs
Societal avoided costs
Public safety costs
3.2 New York
In order to maximize benefits and value to customers, DER supplies, the electric system, and society, and
to ensure clean generation, the State of New York Public Service Commission (NYPSC) directed utilities
to develop implementation proposals to calculate value of DER (VDER) tariffs in 2017. New York’s
VDER tariffs, also referred to as value stack tariffs, are intended to replace net metering for larger-scale
community solar PV projects in the short term, and will eventually be applied to all DERs across the grid.
VDER proposals have been reviewed and approved by the NYPSC, and each utility will move to full
implementation in early 2018. The components of VDER are listed in Table 3 (NYPSC 2017).
Table 3. New York’s VDER Components
Component Calculation Based On
Energy value Day-ahead hourly Locational Based Marginal Price
(LBMP) grossed up for losses (eventually moving to
subzonal prices)
Capacity value – market value Monthly NY Independent System Operator auction
price
Capacity value – out of market value The difference between the market value and the total
generating capacity payments made to value stack
customers
Environmental value – market value Higher of Tier 1 renewable energy certificate (REC)
price per kWh, or social cost of carbon per kWh less

10
Regional Greenhouse Gas Initiative (RGGI); customers
who want to retain RECs will not receive
compensation
Environmental value – out of market value Difference between compensation and market will be
recovered from customers within the same service
class as the customers receiving benefits from the DER
Demand reduction value Compensation based on marginal cost of service
studies and eligible DER performance during 10
highest usage hours at $ per kw-year value
Locational system relief value Compensation based on marginal cost of service
studies and static rate per kW-year value applied to net
injected kW
Market transition credit Static rate per kWh applied to net injected kWh; steps
down by tranche
Some stakeholder groups have expressed concern that the proposed VDER tariff methodologies result in
significantly different utility VDER tariffs because utilities are allowed to have notably different
calculations for the utility marginal cost of service (MCOS) value (the base measure of what it costs for
utilities to serve customers at different points on the grid) (St. John 2017). The MCOS in turn is used to
derive two important values in the VDER tariff—the demand reduction value (DRV) and the locational
system relief value (LSRV). Because of different calculation approaches, the VDER for ConEdison is
$226/kW and for Central Hudson is $15/kW.
Another complaint associated with New York’s VDER is that some value components can change, so
there is no long-term financial certainty of the overall VDER, which will make obtaining financing more
difficult. The DRV and LSRV calculations can be changed every three years, so the rate established for
year 1 is not guaranteed for a fixed amount of time (i.e., 10 years straight). As a result, financing parties
are likely to zero out these values in the value stack when evaluating projects, thereby lowering the
overall VDER in their own due diligence/project valuation calculations.
Changing component values is not unique to New York’s methodology. All valuation calculations include
some level of annual or biannual adjustments, or placeholder or proxy values that will change in the
future.
3.3 Oregon
Oregon Senate Bill 1547, signed into law in March 2016, requires Oregon utilities to eliminate coal as an
electricity supply source, increases the state’s RPS target to 50% renewables by 2040, and addresses new
programs to help meet these requirements (SB1547 2016). One such program is for community solar
projects. The law states that an electric company shall credit an owner of or subscriber to a community
solar project in a manner that reflects the resource value of solar energy, to be determined by the Oregon
Public Utility Commission (OPUC). Therefore, the implication is that a resource value of solar (RVOS)
compensation is intended for community solar gardens, and not as a replacement for NEM, as is the case
for Minnesota and Austin Energy.
OPUC retained E3 to develop and demonstrate a methodology for calculating the RVOS every two years
that could then be used by Oregon’s IOUs (OPUC 2015) for community solar. The OPUC’s Investigation
to Determine the Resource Value of Solar docket is ongoing.
With the decision to pursue a valuation from the utility customer perspective, OPUC has directed the
utilities to include the following values in their RVOS calculations.
11
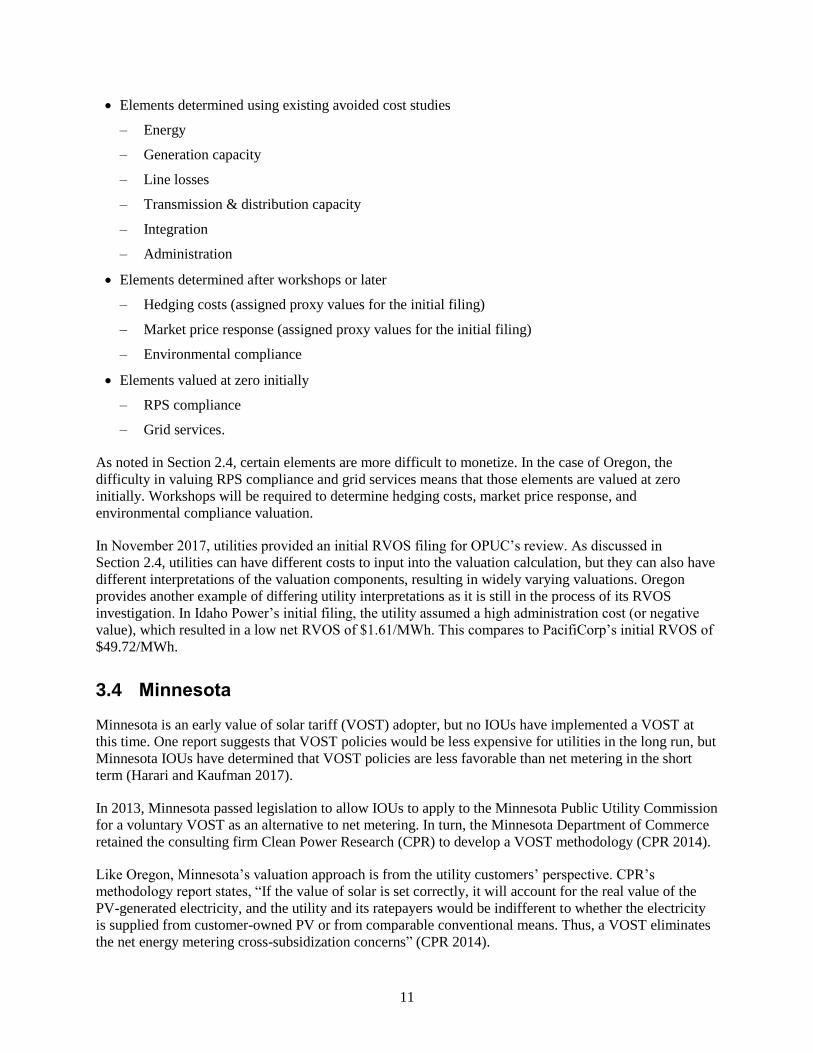
Elements determined using existing avoided cost studies
– Energy
– Generation capacity
– Line losses
– Transmission & distribution capacity
– Integration
– Administration
Elements determined after workshops or later
– Hedging costs (assigned proxy values for the initial filing)
– Market price response (assigned proxy values for the initial filing)
– Environmental compliance
Elements valued at zero initially
– RPS compliance
– Grid services.
As noted in Section 2.4, certain elements are more difficult to monetize. In the case of Oregon, the
difficulty in valuing RPS compliance and grid services means that those elements are valued at zero
initially. Workshops will be required to determine hedging costs, market price response, and
environmental compliance valuation.
In November 2017, utilities provided an initial RVOS filing for OPUC’s review. As discussed in
Section 2.4, utilities can have different costs to input into the valuation calculation, but they can also have
different interpretations of the valuation components, resulting in widely varying valuations. Oregon
provides another example of differing utility interpretations as it is still in the process of its RVOS
investigation. In Idaho Power’s initial filing, the utility assumed a high administration cost (or negative
value), which resulted in a low net RVOS of $1.61/MWh. This compares to PacifiCorp’s initial RVOS of
$49.72/MWh.
3.4 Minnesota
Minnesota is an early value of solar tariff (VOST) adopter, but no IOUs have implemented a VOST at
this time. One report suggests that VOST policies would be less expensive for utilities in the long run, but
Minnesota IOUs have determined that VOST policies are less favorable than net metering in the short
term (Harari and Kaufman 2017).
In 2013, Minnesota passed legislation to allow IOUs to apply to the Minnesota Public Utility Commission
for a voluntary VOST as an alternative to net metering. In turn, the Minnesota Department of Commerce
retained the consulting firm Clean Power Research (CPR) to develop a VOST methodology (CPR 2014).
Like Oregon, Minnesota’s valuation approach is from the utility customers’ perspective. CPR’s
methodology report states, “If the value of solar is set correctly, it will account for the real value of the
PV-generated electricity, and the utility and its ratepayers would be indifferent to whether the electricity
is supplied from customer-owned PV or from comparable conventional means. Thus, a VOST eliminates
the net energy metering cross-subsidization concerns” (CPR 2014).

12
The legislation mandated that the value of solar methodology consider the following values.
Energy and its delivery
Generation capacity
Transmission capacity
T&D line losses
Environmental value.
These values are in turn captured in the Value of Solar Calculation Table components (see Figure 4). The
valuation calculation uses the Value of Solar Calculation Table and the Value of Solar Data Table (see
Figure 5) to create a levelized value of solar that would be paid over a 25-year contract and must be
calculated annually. Avoided voltage control cost and solar integration cost in the Value of Solar
Calculation Table are placeholders for future year calculations; they do not currently have calculation
formulas associated with them.
Xcel Energy, a large IOU in Minnesota, has questioned the avoided fuel cost calculation methodology
developed by the consultant, which is the largest component of the VOST (Harari and Kaufman 2017).
This disagreement is likely a reason why Xcel Energy and other IOUs have not yet established a VOST
for any customer.
Figure 4. Minnesota Value of Solar Calculation Table (CPR 2014)
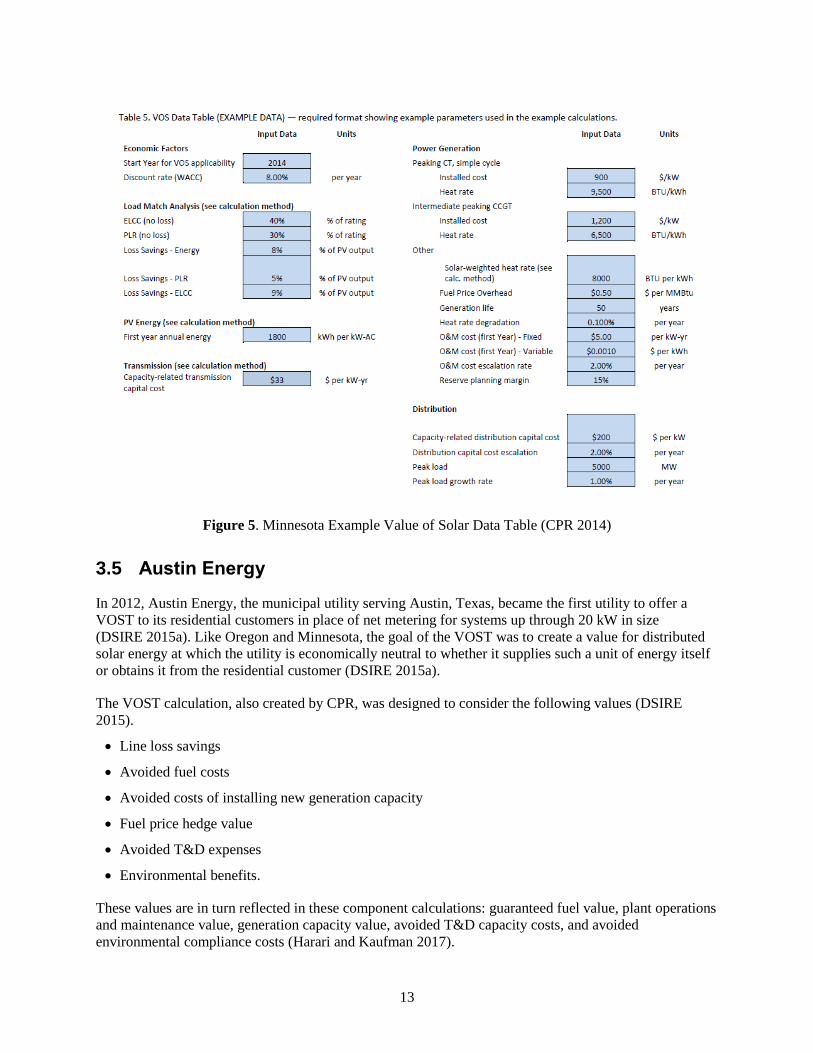
13
Figure 5. Minnesota Example Value of Solar Data Table (CPR 2014)
3.5 Austin Energy
In 2012, Austin Energy, the municipal utility serving Austin, Texas, became the first utility to offer a
VOST to its residential customers in place of net metering for systems up through 20 kW in size
(DSIRE 2015a). Like Oregon and Minnesota, the goal of the VOST was to create a value for distributed
solar energy at which the utility is economically neutral to whether it supplies such a unit of energy itself
or obtains it from the residential customer (DSIRE 2015a).
The VOST calculation, also created by CPR, was designed to consider the following values (DSIRE
2015).
Line loss savings
Avoided fuel costs
Avoided costs of installing new generation capacity
Fuel price hedge value
Avoided T&D expenses
Environmental benefits.
These values are in turn reflected in these component calculations: guaranteed fuel value, plant operations
and maintenance value, generation capacity value, avoided T&D capacity costs, and avoided
environmental compliance costs (Harari and Kaufman 2017).

14
The value of solar rate changes annually, based on updated inputs to the components such as the natural
gas price in the guaranteed fuel value calculation, but the rate customers receive is a five-year rolling
average. The VOST rate appears on residential customers’ monthly electric bills as a credit on electricity
costs and customers still pay the retail rate for all of their electricity consumption (Harari and Kaufman
2017). This approach is considered a buy-all sell-all approach that separates the payments for the solar
generation from the customer’s electricity use (Taylor et al. 2015).
Two issues unique to Austin Energy’s VOST are the utility’s regulation and location within the Electric
Reliability Council of Texas (ERCOT) (Harari and Kaufman 2017). As a municipal utility, Austin Energy
is regulated by the elected members of the Austin City Council, rather than a state public utility
commission. In addition, ERCOT’s energy pricing market is open and available for review, while
wholesale energy costs for utilities in other parts of the country are not accessible in the same way.
The City of Austin also provides a rebate for residential customers, on top of the VOST, to increase solar
PV adoption by lowering the upfront cost of a system (Taylor et al. 2015). The value of the rebate
declined over the years and is currently at $1.10/W (DSIRE 2017d). For commercial customers not
eligible for this rebate or the VOST, a production-based incentive of 9¢/kWh is available for a 10 year
period (DSIRE 2015b). With a rebate and a VOST, Austin Energy has adopted the perspective of the
participating customer, and has a price-support market, to make distributed generation cost effective for
its customer owners.
3.6 Maine
In March 2017, the Maine Public Utilities Commission (PUC) issued an order replacing net metering with
a buy-all, sell-all compensation structure (DSIRE 2017a). This change in policy was initiated by the 2014
Act to Support Solar Energy Development in Maine (Maine PUC 2015). Under the new structure, the
distributed generation owner buys all of their electricity from the utility at the retail rate and then sells all
the electricity produced by the DG system to the utility at a fixed rate (NREL 2017). In Maine’s case, the
fixed sell rate is the utility’s avoided cost rate, rather than a value of solar rate like Austin Energy.
3.7 Hawaii
Through Docket 2014-0192, the Hawaii PUC intends to spur an electricity sector reform to support
the sustainable growth of DERs. Order 33258, the first major Commission order in this docket, closed its
NEM program for new applicants and created three new tariffs for solar PV owners—the customer self-
supply (CSS) option, the customer grid-supply (CGS) option, and a time-of-use (TOU) tariff program
similar to NEM, but at a reduced credit rate (HPUC 2015a, HPUC 2015b).
The CSS option is intended for customers who plan to consume all energy produced and do not need to
export any to the grid. Hawaiian Electric Company (HECO) is considering CSS tariffs that encourage
“scheduled” exports as needed for the DERs to provide critical grid services, as well as to encourage CSS
customers to use grid-supplied energy during low-demand/high-supply periods of the day (10 a.m.–
3 p.m.). The option also allows for an expedited (~30-day) interconnection review.
The CGS option is functionally similar to NEM. Customers export excess energy to the grid and receive a
credit. The difference between NEM and CGS is that the CGS credit is set to approximate the relative
value of the energy to the system and the credit does not need to be tied to retail rates. The net effect of
the proposed CGS tariff is to reduce the solar credit that customers receive for self-generation from
30 cents/kilowatt-hour (kWh) under traditional net metering to ~15 cents/kWh, which is closer to

15
HECO’s avoided cost compared to the least cost alternative generation resource. In addition, the
minimum residential customer bill was increased from $17 to $25.
A third tariff option is a new, expanded TOU tariff that shifts energy demand to the middle of the day
(HPUC 2014). Phase I of this docket (2014-0192) concluded in September 2016, after the Commission
approved HECO’s TOU pilot program for 5,000 customers.
In addition, Hawaii PUC and HECO are developing revised grid service tariffs that aim to more flexibly
integrate controllable loads, generation, and storage resources into grid operations and to expand the
ability of loads to provide key grid services that can help balance intermittent renewable resources and
help address some of the concerns surrounding large-scale distributed generation PV and other renewable
energy resources (HECO 2017). HECO has defined four major bulk services that demand response can
provide, which HECO envisions implementing through four rate and incentive mechanisms: (1) capacity,
(2) fast frequency response, (3) regulating reserve (regulating up and down), and (4) replacement reserve.
The values for these four bulk services were based on avoided cost for each category of service, and were
determined based on modeling.
3.8 Indiana
Similar to Maine, Indiana is phasing out its net metering program by July 2022 or when individual
utilities reach 1.5% peak summer load caps, whichever is earlier. Under the new program, the
compensation rate must equal 1.25 times the utility’s average wholesale electricity price (DSIRE 2017b).
3.9 Mississippi
Under Mississippi’s revised distributed generation program, only instantaneous electricity generation and
use can be credited at the retail rate. Excess electricity exported to the utility grid is credited at the
utility’s avoided cost rate plus a 2.5¢/kWh premium (DSIRE 2016), an approach similar to Indiana’s new
compensation rate formula.
3.10 Arizona
As of December 2016, Arizona replaced its NEM program with a net billing program (DSIRE 2017c). In
net billing, a distributed generation system owner consumes self-generated electricity in real time that
displaces retail rate utility electricity; however, excess generation exported to the grid is valued at a non-
retail, predetermined avoided cost rate (NREL 2017). Each utility will determine its specific avoided cost
rate (DSIRE 2017c). Net billing is similar to NEM, but a net billing arrangement does not allow excess
generation to be credited to the distributed generation owner’s future utility bills; the excess generation is
“sold” to the grid at the predetermined rate and that credit is applied to the billing cycle.
3.11 New Jersey
New Jersey’s NEM program is currently under review. Pending Senate Bill 2276 would establish the
"New Jersey Solar Energy Study Commission" that would study all aspects of solar energy in the state
(NCCETC 2017; State of New Jersey 2016). In September 2017, the New Jersey Board of Public Utilities
initiated a generic proceeding on the state’s solar market, but the filings within the proceeding are not
public (NCCETC 2017; NJ BPU 2017).

16
4.0 Summary and Conclusions
As a state moves toward developing valuation and compensation schemes for distributed generation, it is
important to have a clear understanding and statement of the goals and objectives the programs are being
designed to achieve and what perspectives and market environments are desired.
An important step in performing valuations, after establishing overall goals and objectives, is to survey
the different value components and their associated costs and benefits that could be used as the valuation
building blocks. Examples of valuation building blocks include avoided costs associated with fuel,
generation capacity, transmission capacity, reserve capacity, distribution capacity, fixed and variable
operations, and maintenance and environmental compliance and/or impacts.
States include different value elements in their calculations based on state-specific policy goals or
legislation. In addition, utilities and stakeholders can have different interpretations of how the same value
elements are to be calculated. For this reason, standardized calculators and methods help reduce
ambiguity and inconsistencies in how valuations are performed.
Some elements of value can be difficult to quantify because the value of distributed generation approach
is a relatively new practice. Monetizing elements, such as social value or the value of meeting state policy
directives around employment or low income customers, can be difficult to do. Determining how the
value elements vary through time and at different locations across the utility service territory is a nascent
field of study, currently limited to research organizations and some of the more advanced utilities and
states.
States around the country are exploring value of solar and DER and are moving away from pure net
metering. California, Oregon, New York, and Austin Energy have or are pursuing new distributed
generation valuation and compensation mechanisms. Maine, Hawaii, Indiana, Mississippi, and Arizona
have all transitioned away from full retail net metering, and in most instances, avoided costs are the basis
of payments to customers for excess distributed generation rather than the full retail rate.
This white paper, along with learning what other states have accomplished, can help guide a state as it
considers issues associated with distributed generation valuation and compensation.

17
5.0 References
CPR – Clean Power Research. 2014. Minnesota Value of Solar: Methodology. Prepared for Minnesota
Department of Commerce, Division of Energy Resources. Available at https://www.cleanpower.com/wp-
content/uploads/MN-VOS-Methodology-2014-01-30-FINAL.pdf (published January 30, 2014).
CPUC – California Public Utilities Commission. 2015a. Order Instituting Rulemaking Regarding
Policies, Procedures and Rules for Development of Distribution Resources Plans Pursuant to Public
Utilities Code Section 769. Assigned Commissioner’s Ruling on Guidance for Public Utilities Code
Section 769 – Distribution Resource Planning. Rulemaking 14-08-013. San Francisco, California.
Accessed August 25, 2017, at
http://docs.cpuc.ca.gov/PublishedDocs/Efile/G000/M146/K374/146374514.PDF.
CPUC – California Public Utilities Commission. 2015b. Distribution Resources Plan. Sacramento,
California. Accessed August 24, 2017, at http://www.cpuc.ca.gov/General.aspx?id=5071.
DSIRE – Database for State Incentives and Renewable Energy. 2015a. Austin Energy – Value of Solar
Residential Rate. Accessed January 5, 2018 at http://programs.dsireusa.org/system/program/detail/5669
(last updated April 27, 2015).
DSIRE – Database for State Incentives and Renewable Energy. 2015b. Austin Energy – Commercial
Solar PV Incentive Program. Accessed January 17, 2018 at
http://programs.dsireusa.org/system/program/detail/3972 (last updated April 27, 2015).
DSIRE – Database for State Incentives and Renewable Energy. 2016. Mississippi Net Metering. Accessed
January 4, 2018 at http://programs.dsireusa.org/system/program/detail/5841 (last updated July 12, 2016).
DSIRE – Database for State Incentives and Renewable Energy. 2017a. Maine Distributed Generation
Buy-All, Sell-All Program. Accessed January 4, 2018 at
http://programs.dsireusa.org/system/program/detail/280 (last updated May 30, 2017).
DSIRE – Database for State Incentives and Renewable Energy. 2017b. Indiana Net Metering. Accessed
January 4, 2018 at http://programs.dsireusa.org/system/program/detail/342 (last updated August 18,
2017).
DSIRE – Database for State Incentives and Renewable Energy. 2017c. Arizona Net Billing. Accessed
January 17, 2018 at http://programs.dsireusa.org/system/program/detail/3093 (last updated May 30,
2017).
DSIRE – Database for State Incentives and Renewable Energy. 2017d. Austin Energy – Residential Solar
PV Rebate Program. Accessed January 17, 2018 at
http://programs.dsireusa.org/system/program/detail/1088 (last updated March 15, 2017).
EIA – U.S. Energy Information Administration. 2013. Feed-in tariff: A policy tool encouraging
deployment of renewable electricity technologies. Accessed January 25, 2017 at
https://www.eia.gov/todayinenergy/detail.php?id=11471 (last updated May 30, 2013).
FERC – Federal Energy Regulatory Commission. 2017. What is a Qualifying Facility? Accessed January
17, 2018 at https://www.ferc.gov/industries/electric/gen-info/qual-fac/what-is.asp (last updated December
29, 2017).

18
Flores-Espino F. 2015. Compensation for Distributed Solar: A Survey of Options to Preserve Stakeholder
Value. Golden, CO: National Renewable Energy Laboratory. Available at
https://www.nrel.gov/docs/fy15osti/62371.pdf (published September 2015).
Freeing the Grid. 2015. The Long-Standing History of Self-Generation. Accessed January 17, 2018 at
http://freeingthegrid.org/#education-center/the-long-standing-history-of-self-generation/ (last update
unknown).
Harari S and N Kaufman. 2017. Assessing the Value of Distributed Solar. New Haven, CT: Yale Center
for Business and the Environment. Available at
http://cbey.yale.edu/sites/default/files/Distributed%20Solar_FINAL.pdf (published September 2017).
Homer J, A Cooke, L Schwartz, G Leventis, F Flores-Espino, and M Coddington. 2017. State
Engagement in Electric Distribution System Planning. Richland, WA: PNNL. PNNL-27066.
HPUC – Hawaii Public Utilities Commission. 2014. Instituting a Proceeding to Investigate Distributed
Energy Resource Policies. Docket 2014-0192. Honolulu, Hawaii. Available at
http://dms.puc.hawaii.gov/dms/OpenDocServlet?RT=&document_id=91+3+ICM4+LSDB15+PC_Docket
Report59+26+A1001001A14H11B04650E7245918+A14H11B43807D731291+14+1960.
HPUC – Hawaii Public Utilities Commission. 2015a. In the Matter of Public Utilities Commission
Instituting a Proceeding to Investigate Distributed Energy Resource Policies. Docket No. 2014-0192,
Decision and Order No. 33258. Honolulu, Hawaii. Accessed August 28, 2017, at
http://dms.puc.hawaii.gov/dms/DocumentViewer?pid=A1001001A15J13B15422F90464.
HPUC – Hawaii Public Utilities Commission. 2015b. Distributed Energy Resources (Docket No. 2014-
0192) Phase 1 Decision & Order “PUC Reforms Energy Programs to Support Future Sustainable
Growth in Hawaii Rooftop Solar Market.” Honolulu, Hawaii. Accessed August 28, 2017, at
http://puc.hawaii.gov/wp-content/uploads/2015/10/DER-Phase-1-DO-Summary.pdf.
HPUC – Hawaii Public Utilities Commission. 2017. Decision and Order. Order No. 34924. Filed October
20, 2017. Honolulu, Hawaii. Accessed October 27, 2017, at http://puc.hawaii.gov/main/puc-expands-
options-for-customers-to-install-rooftop-solar-and-energy-storage/.
ICC – Illinois Commerce Commission. 2017. Final Order 17-0350. Available at
https://www.icc.illinois.gov/docket/files.aspx?no=17-0350&docId=256982 (September 27, 2017).
Illinois – State of Illinois General Assembly. 2017. Future Energy Jobs Act (Public Act 99-0906).
Available at http://www.ilga.gov/legislation/publicacts/99/PDF/099-0906.pdf.
Maine PUC – Maine Public Utilities Commission. 2015. Maine Distributed Solar Valuation Study
Executive Summary. Available at
http://www.maine.gov/mpuc/electricity/elect_generation/documents/MainePUCVOS-
ExecutiveSummary.pdf (revised April 14, 2015).
Ming Z, S Price, and B Horii. 2017. “Avoided costs 2017 interim update.” Energy and Environmental
Economics, Inc. Accessed October 13, 2017 at
http://www.cpuc.ca.gov/WorkArea/DownloadAsset.aspx?id=6442454812.
19
NARUC – The National Association of Regulatory Utility Commissioners. 2016. Distributed Energy
Resources Rate Design and Compensation. Washington, D.C.: NARUC. Available at
https://pubs.naruc.org/pub/19FDF48B-AA57-5160-DBA1-BE2E9C2F7EA0 (published November 2016).
NCCETC – North Carolina Clean Energy Technology Center. 2017. The 50 States of Solar: Q3 2017
Quarterly Report. Published October 2017.
NJ BPU – State of New Jersey Board of Public Utilities. 2017. Agenda for Board Meeting, September 22,
2017. Available at http://www.bpu.state.nj.us/bpu/pdf/boardagendas/2017/20170922a.pdf.
NREL – National Renewable Energy Laboratory. 2013. Regulatory Considerations Associated with the
Expanded Adoption of Distributed Solar. NREL/TP-6A20-60613. Golden, CO: NREL. Available at
https://www.nrel.gov/docs/fy14osti/60613.pdf (published November 2013).
NREL – National Renewable Energy Laboratory. 2017. Grid-Connected Distributed Generation:
Compensation Mechanism Basics. NREL/BR-6A20-68469. Golden, CO: NREL.
https://www.nrel.gov/docs/fy18osti/68469.pdf (published October 2017).
NYPSC – State of New York Public Service Commission. 2017. “Order on Phase One Value of
Distributed Energy Resources Implementation Proposals, Cost Mitigation Issues, and Related Matters.”
New York State Department of Public Service, Albany, New York. September 14, 2017. Accessed
October 5, 2017 at
http://documents.dps.ny.gov/public/MatterManagement/CaseMaster.aspx?MatterCaseNo=15-E-0751.
OPUC – Oregon Public Utility Commission. 2015. Investigation to Determine Resource Value of Solar.
Accessed December 2017 at
http://apps.puc.state.or.us/edockets/Docket.asp?DocketID=19362&Child=action (filing date January 27,
2015).
PG&E – Pacific Gas and Electric Company. 2016. Pacific Gas and Electric Company’s demonstration
projects A and B final reports. Accessed October 9, 2017, at
http://drpwg.org/wp-content/uploads/2016/07/R1408013-PGE-Demo-Projects-A-B-Final-Reports.pdf
RMI - Rocky Mountain Institute. 2013. A Review of Solar PV Benefit & Cost Studies, 2nd Edition.
Boulder, CO: Rocky Mountain Institute. Available at https://rmi.org/wp-
content/uploads/2017/05/RMI_Document_Repository_Public-Reprts_eLab-DER-Benefit-Cost-
Deck_2nd_Edition131015.pdf.
RMI – Rocky Mountain Institute. 2015. The Economics of Battery Energy Storage. Boulder, CO: Rocky
Mountain Institute. Available at https://rmi.org/insights/reports/economics-battery-energy-storage/
(published October 2015).
SB1547 – Oregon Senate Bill 1547. 2016. Enrolled Senate Bill 1547. Available at
https://olis.leg.state.or.us/liz/2016R1/Downloads/MeasureDocument/SB1547/Enrolled.
State of New Jersey. 2016. Senate, No. 2276. Available at
http://www.njleg.state.nj.us/2016/bills/S2500/2276_R1.pdf.
St. John J. 2017. Why Solar Advocates Are Crying Foul Over New York’s Latest REV Order. Greentech
Media. Accessed January 31, 2018 at https://www.greentechmedia.com/articles/read/why-solar-

20
advocates-are-crying-foul-over-new-yorks-latest-rev-order#gs.HYGql6A (published September 19,
2017).
Taylor M, J McLaren, K Cory, T Davidovich, J Sterling, and M Makhyoun. 2015. Value of Solar:
Program Design and Implementation Considerations. NREL/TP-6A20-62361. Golden, CO: NREL.
Available at https://www.nrel.gov/docs/fy15osti/62361.pdf (published March 2015).
Warren C. 2017. Once an Obscure Law, PURPA Now Drives Utility-Scale Solar. Regulatory Conflict
Quickly Followed. Greentech Media. Accessed January 17, 2018 at
https://www.greentechmedia.com/articles/read/purpa-is-causing-conflict-in-montana#gs.DZCIVng
(published February 23, 2017).
Wolf, T., M Whited, E Malone, T Vitolo, R Hornby. 2014. Benefit-Cost Analysis for Distributed Energy
Resources: A Framework for Accounting for All Relevant Costs and Benefits. Prepared for the Advanced
Energy Economy Institute. Cambridge, Mass.: Synapse Energy Economics, Inc. Available at
http://www.synapse-energy.com/sites/default/files/Final%20Report.pdf (published September 22, 2014)

–
Valuation Elements Graphic

A.1
Appendix A
Valuation Elements Graphic
Figure A.1. Valuation Categories (RMI 2013)
