distributed leadership: teacher and principal perceptions of
TRANSCRIPT

ABSTRACT GRANT, CARL PATRICK. The Relationship between Distributive Leadership and Leadership Effectiveness in North Carolina. (Under the direction of Drs. Thomas L. Alsbury and Tamara V. Young.)
As principals’ responsibilities increase in quantity and complexity along with
accountability demands for improved student achievement, some researchers argue that one
person can no longer successfully lead a school; rather schools should be led in a
collaborative manner with school staff members in shared decision-making through a
distributed leadership model (Gronn, 2008). According to Leithwood and colleagues (2006),
the core leadership functions in school systems that often get ‘distributed’ by principals using
distributive leadership include setting the school mission, professional development
programs, redesigning the organization, and managing instruction. The purpose of this study
was to understand the extent to which these components of distributed leadership predict a
principal’s leadership effectiveness in schools. Specifically, this study was guided by four
research questions: (a) What components of distributive leadership exist in North Carolina
schools? (b) What is the relationship between different components of distributive
leadership? (c) What characteristics of principals are associated with the use of distributive
leadership in schools? (d) What is the relationship between the teachers' perception of the
principal’s use of distributed leadership and the principal's leadership effectiveness?
The study draws on data from 70,811 teachers and principals who responded to the
2008 North Carolina Teacher Working Conditions Survey. The results indicated that most
teachers and principals in North Carolina schools agreed or strongly agreed that they had a
role in three of the four components of distributed leadership: setting the direction,

redesigning the organization, and managing the instructional program. The findings indicated
that four components of distributed leadership were moderately related to one another.
Multiple regression analyses and hierarchical linear modeling indicated that female principals
were less likely than they male peers to be perceived as allowing teachers to play a role in
managing the instructional program. Furthermore, when it comes to developing people
component, female principals were more likely, compared to male colleagues, to be
perceived as allowing teachers to play a role in fostering the development of people. The
race/ethnicity of the principal also was a significant predictor of the principal’s use of certain
components of distributed leadership. Most importantly, with the exception of redesigning
the organization, distributive leadership components were related to leadership effectiveness.
Of the different dimensions of distributive leadership, setting direction was the strongest
predictor of leadership effectiveness. Overall, this study provides empirical evidence that
distributive leadership is linked to leadership effectiveness in schools.

The Relationship between Distributed Leadership and Principal’s Leadership Effectiveness in North Carolina
by Carl P. Grant
A dissertation submitted to the Graduate Faculty of North Carolina State University
in partial fulfillment of the requirements for the Degree of
Doctor of Philosophy
Educational Research and Policy Analysis
Raleigh, North Carolina
2011
APPROVED BY:
_______________________________ ______________________________ Dr. Thomas L. Alsbury Dr. Tamara V. Young Committee Chair Committee Co-Chair ________________________________ ________________________________ Dr. Kevin P. Brady Dr. Robert C. Serow

ii
DEDICATION
To Missy, my wife and love to the ends.

iii
BIOGRAPHY
Carl P. Grant, also known as Patrick, was born in Memphis, Tennessee to Carl and
Judy Grant and has three brothers, one older brother Mike and two younger brothers Jeff
and Jerry. Mike is married to Caroline with four children and Jerry is married to Melanie
with two children. Patrick is a graduate of Briarwood Christian High School in
Birmingham, Alabama. He attended Auburn University in Alabama for undergraduate
studies in chemistry. Patrick earned a master’s degree in secondary science education from
The University of Montevallo in Alabama and a master’s degree in school administration
from North Carolina State University in North Carolina.
Patrick began his high school science teaching in Alabama. He taught for seven
years at Monroe Academy in Monroeville and Hoover High School in Hoover. Patrick
moved to North Carolina and taught science for four years at New Hanover High School
in Wilmington and Raleigh Charter High School in Raleigh. For the past four years,
Patrick has been an assistant principal at Holly Springs Elementary School in Holly
Springs, North Carolina. Patrick also taught School and Society, an undergraduate
course for pre-service teachers in the College of Education at North Carolina State
University. Patrick was a teaching assistant for advanced and applied graduate level
research methods courses and research assistant in the Educational Leadership and
Policy Studies Department.
Patrick’s research and teaching interests include applied educational research
methods, school-based leadership, organizational development, principal development,
education policy, educational philosophy, teacher development and secondary science.

iv
ACKNOWLEDGMENTS
This dissertation would have been impossible without encouragement, guidance and
assistance from others. First and foremost, I would like to recognize and give glory to God.
“For from Him and through Him and to Him are all things. To Him be the glory forever!”
Romans 11:36
I give God all of the glory for the things that He has done and continues to do in my
life. I constantly had to remind myself of the right reasons for doing my dissertation in order
that I may become more influential in bringing greater excellence to different levels of
educational systems. Within that perspective, I endeavored to work out my dissertation with
the Lord in mind.
“Whatever you do, work at it with all your heart, as working for the Lord, not for men.”
Colossians 3:23
Furthermore, the distributive leadership perspective was noted from a similar
historical perspective for Moses in the following passage of the Old Testament:
“You and these people who come to you will only wear yourselves out. The work is too heavy for you; you cannot handle it alone … But select capable men from all the people ─ men who fear God, trustworthy men who hate dishonest gain ─ and appoint them as officials over thousands, hundreds, fifties and tens … That will make your load lighter, because they will share it with you.”
Exodus 18:18-22
Jethro, Moses father-in-law, advised Moses in leading/judging the people so that he
would not get exhausted and noted the concept of shared leadership among other capable
individuals rather than the leadership resting with Moses alone.
My family continues to be a source of encouragement and love. I appreciate my

v
parents who provided for my collegiate educational foundation and modeled for me the very
determination that helped me to accomplish this task. My dad would say to us often, “you
can do anything you want in life, if you put your mind to it.” To you both, I owe a debt that
I will never be able to repay. I thank my four brothers and their wives respectively, Mike
and Caroline, Jeff, and Jerry and Melanie along with my wife’s brother and wife, Glenn and
Kenneith, as well as Missy’s parents, Glenn and Charlotte, for their encouragement and
regular inquiries into the status of my dissertation work. I appreciate and love all of you.
I am thankful for friends and their support of this project. First, I recognize Dr. Lee
Meadows for planting the idea of pursuing a doctorate in education many years ago. My
most consistent and longstanding friend, Paul, repeatedly challenged me and checked in on
my status. My pastor, Scott, and our mutual friend, Drew, provided opportunities for
scholarly discussion on spiritual, philosophical, and educational matters in many coffee
chats. Furthermore, I would like to thank my colleagues at Holly Springs Elementary
School who, during the last four years, inspired me to finish.
I owe a debt of gratitude to my dissertation committee co-chairs. Dr. Thomas L.
Alsbury always pressed me to be excellent in my writing and theoretical perspectives.
Thank you for your support and for giving me opportunities to grow as a scholar. Dr.
Tamara V. Young, I thank you for always being a good listener, giving regular advice and
honest direct feedback on my work and professional endeavors as well as giving me the
opportunity to be a teaching assistant for research methods courses. I would like to thank my
committee members for their time, patience, leadership and encouragement throughout this
process. Dr. Kevin P. Brady, thanks for being a great professor and guide, and giving me the

vi
opportunities to have candid conversations about education in North Carolina. Dr. Robert C.
Serow, I thank you for pushing me to grow as a scholarly, student researcher and giving me
opportunities to have practical experience as a college teacher by teaching the course School
and Society for the department for five semesters. I would like to give special thanks to Dr.
S. Bartholomew Craig for being a great influence and supporter in my studies and
dissertation work in the realm of organizational psychology.
I am also indebted to the faculty and staff in the Department of Educational
Leadership and Policy Studies where I worked on coursework since beginning my master’s
of School Administration degree in 2002. I was privileged to have opportunities to work
with and learn from exceptional and dynamic professors, scholars and practitioners in the
department. Each of you has been instrumental in my development as a teacher, leader, and
a scholar; and I appreciate all that you have done.
Additionally, I would be remiss if I did not thank my graduate colleagues and
friends in the Department of Educational Leadership and Policy Studies. I am privileged to
have had the opportunity to work with and learn from such a distinguished group of fellow
scholars and practitioners in education. I always enjoyed having regular professional
discussions with Dr. Wayne Lewis, Wayne Price, Nicole Tate and Dr. Shayla Thomas. I
wish each of you the very best.
Finally, it is with awe that I recognize my wife, Missy, who always showed love and
encouragement, and challenged me when needed. She believed in me even when I considered
not finishing or doubted my abilities to complete this great task. We faced every challenge
together. I love you.

vii
TABLE OF CONTENTS
LIST OF TABLES ................................................................................................................... xi CHAPTER 1 ..............................................................................................................................1
Introduction ..........................................................................................................................1
Statement of the Problem .....................................................................................................3
Purpose of the Study ............................................................................................................4
Research Questions ..............................................................................................................5
Significance of the Study .....................................................................................................5
Assumptions and Limitations ..............................................................................................7
Definition of Terms..............................................................................................................8
Theoretical Framework ........................................................................................................9
Overview of Methodological Approach ............................................................................10
CHAPTER 2 ............................................................................................................................12
Review of Literature ..........................................................................................................12
Introduction ........................................................................................................................12
Historical Perspectives of Distributed Leadership .............................................................12
Distributed Leadership Function: Setting Direction ..........................................................15
Distributed Leadership Function: Developing People .......................................................17
Distributed Leadership Function: Redesigning the Organization ......................................19
Distributed Leadership Function: Managing the Instructional Program ...........................22
Benefits of Distributed Leadership ....................................................................................23
Detractors of Distributed Leadership .................................................................................26

viii
Potential Variables Influencing Leadership Effectiveness ................................................28
CHAPTER 3 ............................................................................................................................32
Methodology ......................................................................................................................32
Introduction ........................................................................................................................32
Population and Sample ......................................................................................................32
Data Collection ..................................................................................................................33
Survey Instrument ....................................................................................................... 34
Variables of Distributive Leadership .......................................................................... 35
Confirmatory Factor Analysis and Item Reliability Analysis ..................................... 35
Leadership Effectiveness Variables ............................................................................ 37
Demographic Variables .............................................................................................. 38
Analysis..............................................................................................................................39
RQ1: The Extent of Distributive Leadership in North Carolina ................................. 40
RQ2: Correlation of Distributive Leadership Functions ............................................. 40
RQ3: Principal Characteristics and Distributive Leadership ...................................... 40
RQ4: Distributive Leadership and Leadership Effectiveness ..................................... 42
Validity and Reliability: HLM Current Model Investigation ..................................... 43
Generalizability ..................................................................................................................46
Limitations of the Study.....................................................................................................46
CHAPTER 4 ............................................................................................................................48
Results and Data Analysis .................................................................................................48
Introduction ........................................................................................................................48

ix
Descriptive Statistics: Teachers and Principals .................................................................48
The Extent of Distributive Leadership in North Carolina .................................................50
Descriptive Statistics: Distributive Leadership Functions and Leadership Effectiveness .52
Bivariate Analyses: Teacher Level Variables ....................................................................54
Bivariate Analyses: Principal Level Variables ..................................................................56
Multiple Regressions: Distributive Leadership and Principal Characteristics ..................57
Hierarchical Linear Model Building ..................................................................................60
Examination of the Null: Model 1 .............................................................................. 61
Examination of the Teacher-Level: Model 2 .............................................................. 62
Examination of the Principal-Level: Model 3 ............................................................ 65
Summary of Results ...........................................................................................................67
CHAPTER 5 ............................................................................................................................70
Discussion and Conclusions ..............................................................................................70
Introduction ........................................................................................................................70
Key Findings and Theoretical Implications .......................................................................70
Teacher and Principal Characteristics Regarding Leadership: Gender ...................... 71
Teacher and Principal Characteristics Regarding Leadership: Ethnicity ................... 71
Teacher and Principal Characteristics Regarding Leadership: Experience ................ 72
Distributive Leadership and Leadership Effectiveness............................................... 73
Distributive Leadership for Setting Direction............................................................. 73
Distributive Leadership for Developing People ......................................................... 74
Distributive Leadership for Managing Instructional Program .................................... 75

x
Distributive Leadership for Redesigning the Organization ........................................ 75
Practical Implications.........................................................................................................76
Limitations .........................................................................................................................80
Directions for Future Research ..........................................................................................81
REFERENCES ........................................................................................................................87

xi
LIST OF TABLES Table 1 Demographic Comparison of Certified Public School Personnel in North Carolina for 2007-08 and Final Respondent Data Set Derived from the 2008 North Carolina Teacher Working Conditions Survey Sample (NCTWCS) ............................................................................................33 Table 2 Factors of the Distributive Leadership Function With Items and Their Factor Loadings ..................................................................................................37 Table 3 2008 NCTWCS Demographic Items used as Variables in Detail ......................38 Table 4 General Multiple Regression Model for Distributive Leadership and Principal Characteristics .....................................................................................41 Table 5 General Hierarchical Linear Model (HLM) causal model (Level-1) with equations and symbols described ................................................................45 Table 6 General Hierarchical Linear Model (HLM) causal model (Level-2) with equations and symbols described ................................................................46 Table 7 Teachers and Principals Descriptive Statistics ...................................................49 Table 8 Survey Results for the Distributive Leadership Functions With Items ..............51 Table 9 Distributive Leadership Functions and Leadership Effectiveness Descriptive Statistics ...........................................................................................53 Table 10 Distributive Leadership Functions - Correlations ...............................................54 Table 11 Bivariate Analyses - Independent Demographic Variables and Distributive
Leadership Functions (Teacher Level) ...............................................................55 Table 12 Bivariate Analyses - Independent Variables (Principal Level)...........................56 Table 13 Summary of Regression Analysis for Demographic Variables Predicting
Distributive Leadership (DLI), Setting Direction (SD), Managing Instructional Program (MIP), Redesigning the Organization (RO), and
Developing People (DP) .....................................................................................60 Table 14 Distributive Leadership, Teacher and Principal Demographic Variables Predicting Leadership Effectiveness ...................................................................66

1
CHAPTER 1
Introduction
As principals’ responsibilities increase in quantity and complexity along with
accountability demands for improved student achievement, some researchers argue that one
person can no longer successfully lead a school; rather schools should be led in a
collaborative manner with school staff members in shared decision-making through a
distributed leadership model (Gronn, 2008). Although the educational system was designed
using a hierarchical business model, with primary responsibility for quality resting with the
administrator of the organization, there is increasing identification that leadership from
multiple and varied school faculty and staff is needed to accomplish what all schools are
called on to do (Leithwood & Mascall, 2008). Research suggests that increasing the influence
of the teacher in schools has prospective effects for school improvement with teacher
leadership moving to the forefront as a viable reform in schools (Mayrowetz, Murphy, &
Smylie, 2007).
In defining leadership as ‘influence,’ Lashway (2006) concluded that everyone in an
organization has at least some influence, suggesting that principals as leaders must rely on
others to some degree in an organization in order to actually lead. Lashway (2006) suggests
that a principal’s primary influence in the organization was to distribute leadership
throughout traditionally hierarchical levels within schools. The influence of all individuals in
a coherent direction is necessary to create the level of success demanded in today’s schools.
The concept of leadership from everyone in the organization requires principals to adapt their
management style. Coupled with effective teacher leadership, distributive leadership changes

2
the relationship between teacher leaders and their principals. However, distributive
leadership does not advocate a loss of influence by the principal, but an intentional effort to
remove the principal from sole authority at the top of a hierarchy and distribute genuine
power throughout the organization.
According to Yukl (2008), school principals, and all other business leaders, must be
equipped to modify leadership behaviors, strategies, and prescribed programs to meet
challenges for increasingly tumultuous organizations. Effective school principals play an
active role in the organizational and instructional processes of schools by taking the lead in
changing the positional power of the principal, and the distribution of power among the
administrative team and teacher leaders (DeMoss, 2002; Mulford & Moreno, 2006).
The importance of effective leadership in organizations has been recognized and
widely studied (Burns, 1978; Covey, 1993; Graham, 1995; Kouzes & Posner, 1995; Senge,
1990). Modern organizations, including schools, are investigating new forms of leadership.
Modern leadership forms move away from the solitary dominant leader to more personal
viewpoint of leadership as a collective practice where organization constituents are equally
significant in contributing understanding and intention (Drath & Palus, 1994; Rost, 1991). A
CEO of a large company put it like this, “For too long we have had a model of leadership
founded on the power of the person … to get the leadership we want requires a cultural
change — away from the individualistic model toward a team approach” (Csoka, 1997, p. 7).
Leadership is practiced by various individuals throughout any organization, regardless of
whether they hold an individual title or position.

3
Increasingly, leaders have recognized that workers can provide valuable and
important input into the successful management of any organization. As workers become
‘empowered’ they assume new leadership roles and responsibilities. This empowerment is
best demonstrated in schools that are moving toward site based management where teachers
and principals share governance (Peterson & Beekley, 1997). Sergiovanni (1996) pointed out
that as teachers become more professional, different leadership is required of the principal
because everyone in the school assumes more responsibility for change and improvement.
More and more leaders in schools and businesses are shifting their view of workers as mere
subordinates to empowered leader-followers who are part of a community working together
toward a common goal (Senge, 1990).
Statement of the Problem
Leaders significantly impact overall organizational performance (Leithwood, Harris
& Hopkins, 2008). Leadership, organizational performance, and leader effectiveness have
tangential connections. In spite of a plethora of research on the need for teacher leadership,
the effectiveness of principal’s distributing leadership to teachers is scant, and the topic needs
further investigation. There is limited empirical research examining distributive leadership
and leadership effectiveness. Because many district, state, and school policies encourage
principals to use the concept of distributing leadership, more research is needed concerning
leadership effectiveness and distributed leadership. Additionally, there is limited empirical
research that explores the relationship between principal characteristics with the use of
distributive leadership. Principal attributes and their predictive ability for leadership
effectiveness will add to the body of knowledge linking these aspects together. Little is

4
known about how the different components of distributive leadership are related and the
components most, and conversely, least related to leadership effectiveness. Evaluating the
relationship between the different components of distributive leadership help researchers and
practitioners understand strength of relationships and potentially insight into how they are
related.
Purpose of the Study
The purpose of this study is to understand the relationship distributed leadership and
principal leadership effectiveness in schools. The study draws from a sample of teachers in
public elementary, middle, and high schools across all geographic regions of North Carolina.
This study also investigates the extent to which principal and teacher attributes are related to
teachers’ perceptions of distributive leadership and leadership effectiveness in their school.
This study seeks to learn how widespread distributive leadership is in North Carolina
public schools. It also seeks to understand if distributive leadership and its specific
components are related to leadership effectiveness. Observing principal attributes related to
distributive leadership variables and leadership effectiveness will lend insight into the
practice of distributive leadership in schools. Furthering our knowledge of the use of
distributive leadership and those aspects related to leadership effectiveness will provide
empirical evidence of those relationships. Research will give administrators practical insight
about which aspects of distributive leadership are most important to being and effective
leader.
Principals and other school leaders can benefit from knowing what elements of
distributed leadership impact school leadership effectiveness. School leadership affects the

5
school improvement processes and reforms, and successful distributive leadership models
can inform administrators how they can direct financial and personnel resources toward
specific areas. Insight gained from this report can be used to help district and school
administrators better understand how effective school leadership and distributive leadership
are observed in schools.
Research Questions
The following questions guided this research study:
1. What components of distributed leadership exist in North Carolina schools?
2. What is the relationship between different components of distributive leadership?
3. What characteristics of principals are associated with the use of distributive
leadership in schools?
4. What is the relationship between the teachers' perception of the principal’s use of
distributed leadership and the principal's leadership effectiveness?
Significance of the Study
To answer these research questions, a variety of statistical procedures were employed.
Confirmatory factor analysis and correlation methods were used initially to ensure variable
viability. Multiple regressions and hierarchical linear modeling are employed to discover
relationships between principal and teacher attributes with distributive leadership and
leadership effectiveness. Findings for this study provide reliable insights about distributive
leadership. This study provides empirical data regarding the efficacy of theoretical models
calling for more participative leadership, such as distributed leadership (Somech, 2005).

6
The substantive significance of this study includes increasing the available data
concerning leaders’ behaviors and subordinates’ perceptions of those behaviors with regards
to organizational variables and leadership styles (Yukl, 1994). This study is significant
because it explores the relative contribution of the different factors of distributive leadership
as they relate to leadership effectiveness. The study is the only one of its kind in North
Carolina to discern distributive leadership patterns from the 2008 North Carolina Working
Conditions Survey and principal leadership effectiveness. For this study, Leithwood and
colleagues (2006) provide the specific theoretical model of distributive leadership that is
recommended for application in school leadership models of this type.
This study has direct implications for practice providing insight into improvements
for school principals and administrative development programs. This study offers guidance
into the level of influence distributed leadership has on overall leadership effectiveness, thus
supporting the school improvement process specified in the new North Carolina Professional
Teaching Standards. In particular, the North Carolina Professional Teaching Standards
Commission recommends that teachers work collaboratively to create professional learning
communities in developing goals and strategies for school improvement and enhanced
teacher working conditions (North Carolina Professional Teaching Standards, 2008). As
teachers demonstrate leadership in schools, they can provide input and participate in
determining the school budget, hiring of staff and the selection of professional development.
The information gathered through this study may be useful in identifying effective leadership
practices in schools.

7
Assumptions and Limitations
This study seeks to determine the relationship between a principal’s use of
distributive leadership and principal effectiveness. A limitation of this study is that some
factors that influence a principal's ability to be effective are not controlled for in this study.
Principal-specific factors that are not included in the model include principal’s cognitive and
personality traits as well as specific aspects of previous educational and training experiences.
The socioeconomic status of the student population, the level of parental involvement, the
size (enrollment), level (elementary, middle, high), and school resources are school factors
that are not considered in the models in this study. The differentiated level of professional
support for principals was also not explored in this study, including support from state,
district, and school based employees such as the number and quality of assistant principals,
classroom teachers, and support staff.
The study also assumed that distributed leadership behavior should and can be
practiced by principals in schools. According to Wallace (2001), there are some noted
assumptions about principals and schools one must consider in research studies measuring
principal practices. An assumption must be made that principals have determined the
school’s vision with an organic strategy for inspiring teachers and staff to share in it, and
have access to the resources needed to implement the vision. Another presumption of this
study was that principals have the opportunity to create an environment fostering a change in
teacher culture with predictable results.
There are some potential limitations concerning the validity of survey instrument
used in this study. In this regard, it should be noted that the authors of the North Carolina

8
Teacher Working Conditions Survey have tested the instrument for its internal validity and
reliability for data collection (Moir, 2009). Furthermore, we assumed that the teachers and
principals responding to the survey were honest in their responses and that the teacher
respondents were qualified to evaluate the principal’s effectiveness. It was also assumed that
teacher respondents are qualified to evaluate the principal’s level of use of distributed
leadership and that they understood the survey questions about their principal's use of
distributed leadership.
The teacher respondents in the study are considered ‘key informants’ as primary
individuals most knowledgeable about the school culture (Lecompte & Preissle, 1994), as
well as being a fairly accessible population (Gilchrist, 1992). In looking at data related to
teacher behavior and perception, the assumption is that teacher respondents can produce the
most clear and accurate picture of the distributive leadership climate in the school. Teacher
behavior patterns and attitudes form discernable patterns (Creswell, 2007) that can be
accurately measured through the survey instrument used in this study, and constitute an
acceptable data source for studies of this type. Finally, generalizing these research findings
are assumed to be limited to settings and cultures similar to those being observed in schools
within this study population.
Definition of Terms
Distributed Leadership is defined as decision making and influential practices performed by
personnel at multiple levels in an organization instead of individual leaders at the top
of an organizational hierarchy (Leithwood, Mascall, Strauss, Sacks, Memon, &
Yashkina, 2006). Furthermore, distributive leadership is a perspective that involves

9
the activities of multiple individuals and/or groups in schools who work at guiding
other staff. Distributive leadership also implies inter-dependency among leaders and
teachers, rather than dependency of teachers on leaders (Spillane, Halverson &
Diamond, 2004).
Principal is the head administrative officer of a school, appointed by the local school district’s
board, and licensed by the State of North Carolina. The principal is the school site
director and is responsible for leading the school community and implementing
educational plans.
Theoretical Framework
Distributed leadership theory is a specific type of participatory leadership, commonly
described as creating an environment where the ownership of decisions and answerability is
distributed among all constituents of the organization (Leithwood, Mascall, Strauss, Sacks,
Memon, & Yashkina, 2006). Increased participation of staff in organizational decisions is a
leadership application gaining recent popularity. Shedd and Bacharach (1991) reported
positive results of distributive type leadership including (a) improved job satisfaction, (b)
increased morale, (c) a stronger dedication to goals, and (d) a shared strength of mind within
the organization.
Sergiovanni (1994) recommends that the hierarchical leadership view of principals in
schools as the primary formal authority constrains school environments and proposed that
schools be perceived as organizations where professional associations and common ideals
become the basis for school improvement. In his description, teacher leaders in school
communities come together, bound to a set of collective ideals. In becoming purposeful and

10
collective environments, schools provide the organizational contexts for developing a climate
of leadership and professionalism. Principal leadership described by Sergiovanni (1994)
begins to rely less on the individual decision making power of the principal and focuses more
on the spread of decision making through others as an approach to leadership toward
accomplishing the mission of the school.
Overview of Methodological Approach
This quantitative study uses respondent data from the 2008 North Carolina Teacher
Working Conditions Survey. 104,249 educators responded to the Teacher Working
Conditions Survey, representing 87% of educators across the state of North Carolina. Every
traditional K-12 public school district in the state of North Carolina reached a district-wide
response rate of at least 40 percent, with many achieving a higher response rate (Hirsch &
Church, 2009). Confirmatory factor analysis (CFA) was used to test how well certain items
in the survey represented distributive leadership constructs. The comprehensiveness of the
sample allowed for generalizing the findings to schools in North Carolina and to states with
similar contexts.
Descriptive statistics were computed about the distributive leadership components to
answer the first research question, and thus determine the prevalence of distributive
leadership in North Carolina schools. To answer the second research question, correlation
coefficients were computed among the four dimensions of distributive leadership.
Multiple regressions were conducted to examine the third research question, specifically,
how well characteristics of principals predicted their use of distributive leadership. Lastly,

11
Hierarchical Linear Modeling (HLM) was used to determine the relationship between
distributive leadership and leadership effectiveness.

12
CHAPTER 2
Review of Literature
Introduction
Leithwood and his colleagues (2006) provide a general theoretical framework for
exploring the distribution of leadership in organizations, specifically schools. According to
Leithwood and colleagues (2006), the core leadership functions in school systems that often
get ‘distributed’ by principals using distributive leadership include: setting the school
mission, professional development programs, redesigning the organization, and managing
instruction. The over-arching hypothesis in this study is that leaders who distribute the four
leadership functions of setting direction, developing people, redesigning the organization,
and managing the instructional programs within schools, are perceived as more effective than
those who do not.
Historical Perspectives of Distributed Leadership
It has been suggested that Gibb was one of the key ‘originators’ of the concept coined
distributed leadership (Gronn, 2008). According to Gronn (2008), Gibb initiated use of the
words ‘distributed leadership’ in writing about the subject in a chapter on leadership in the
Handbook of Social Psychology in 1954. Gibb discussed leadership as not being centered on
the supremacy of one person, stating: “There is still a tendency among psychologists and
sociologists to think of every group as having a leader . . . however . . . unequivocal
unipersonal leadership rarely, if ever, occurs” (Gibb, 1958, p. 103). According to Gibb,
leaders and followers regularly trade roles and energetic followers often instigate leadership
acts. Gibb confirmed that “leadership exemplifies many of the qualities of the followers and

13
the relationship between the leader and follower is often so similar it is difficult to determine
who influences whom and to what degree” (Gibb, 1968, p. 206).
Other researchers previously asserted similar ideas by suggesting the need to remove
distinctions between leader and member tasks in organizations with the idea of a dispersion
of leadership functions among different constituents or groups in an organization. These
researchers contend that a dispersion of leadership tasks among constituents without
concentrating tasks in individuals or a few people exclusively for interdependent
organizations. These researchers also reported a concept of leadership they defined as
multilateral and shared in regard to responsibility (Benne & Sheats, 1948). Another set of
researchers defined a core attribute of leadership as “the potential social influence of one part
of the group over another, so that if one person had influence over fellow group member then
that person has some degree of leadership” (French & Snyder, 1959, p. 118). These
definitions of leadership elucidated a leader construct wherein the group standard is one of
distribution with every member of a group having some level of influence over others, and
where leadership is extensively dispersed throughout the group.
Katz and Kahn (1978) purported that the leadership components transfer upwards
from subordinates the whole organization. They defined leadership as “the exercise of
influence on organizationally relevant matters by any member of the organization noting that
organizations are more likely to be effective when the leadership tasks are distributed” (Katz
& Kahn, 1978, p. 571). The sharing of leadership functions results in a more effective use of
human resources within the organization. The strategies Katz and Kahn imagined were that
organizational leaders would use distributive forms of leadership through delegation and
14
shared decision making that put into effect a general openness to subordinates’ influence, and
increasing conditions for sharing information.
Schein (1988) discussed how official leaders and managers alone could not perform a
wide range of tasks without distributing duties among group members. Furthermore, as a set
of tasks are identified in a group, members can complete them and an effective
organizational group is one in which the tasks are favorably distributed. Distributed
leadership used in schools as a synonym for democratic leadership by giving more authority
to teachers (Harris & Muijs, 2005).
Distributive leadership primarily implies a social distribution where a leader’s power
of decision-making is dispersed to all members of the school who are then viewed as a
collaboration of leaders (Spillane, Halverson & Diamond, 2004). Distributive leadership
implies interdependency rather than single leader dependency by leaders sharing
responsibility with subordinates (Harris, 2003). In a sense, subordinate positions dissipate in
distributive leadership as leadership is shared among many individuals in the organization.
Teacher leadership is promotes the idea that members of the organization can share
leadership activities (Harris, 2003). Gronn’s (2000) viewed leadership as a stream of
influence rather than an explicit connection with a single leader. In a distributive
environment, a larger number of constituents in the organization have a stake in the
accomplishments of the school (Harris, 2003).
Distributed leadership theory promotes the decentralization of the leader as collective
episodes in the organization (Harris, 2003). Leadership in this context is fluid rather than
individually fixed as a specific role defined phenomenon within an organization (Gronn,

15
2000). Every individual can be a part of and demonstrate leadership in distributive
organizations (Goleman 2002). This type of leadership does not imply that everyone in a
group is a leader, but opens the possibility for a more collective leadership approaches
(Harris, 2003). Distributive leadership is a collective trend where leadership is a stream of
activities in which organizational constituent find themselves entangled (Gronn, 2000).
Leithwood and colleagues (2006) determined that the core leadership functions in school
systems that often get ‘distributed’ by principals using distributive leadership include: setting
the school mission, professional development programs, redesigning the organization, and
managing instruction. The next sections explore these different leadership functions within
schools.
Distributed Leadership Function: Setting Direction
When it comes to setting direction, the vision of the school organization is the
compass used in determining the way the school operates and develops. Faculty and staff
participating in a distributive leadership format develop and agree on a shared vision.
Leadership, instruction, and learning are expected to be derived from this shared vision.
Developing a shared understanding about the organizational goals provides a sense of
direction. A vision developed in isolation is less likely to influence followers because they
have no part or stake in a vision that is thrust upon them. Sharing leadership reduces teacher
seclusion and increases dedication to the collective good of the organization (Pounder, 1999),
and involving more people in school processes. Leithwood and colleagues (2006) concluded
that people are generally motivated by goals that (a) compel them in a personal way, (b) are
difficult yet attainable, and (c) are able to identify with the shared vision. Thus, those

16
teachers who are the most connected to the vision and goals of the school are more likely to
respond to and enact those goals.
Setting direction in developing a schools’ vision requires fostering acceptance of a
shared set of group goals (Leithwood et al., 2006) and bringing diverse stakeholders into the
process. Some studies indicate that coherent vision is established and maintained when
teacher leadership is supported by the direct involvement of teachers, as well as other school
stakeholders, in the leadership work of creating the mission, purpose, and culture of a school
(Neuman & Simmons, 2000). Somech (2005) noted that leaders, who influence followers to
hold a strong philosophy and acceptance of the school’s goals, provide a major catalyst to
teacher commitment and retention. Within distributive leadership structures, teachers
contribute to an assortment of leadership functions such as sustained instructional vision and
monitoring program implementation (Firestone, 1989).
School improvement plans are generally interconnected with the school vision.
Distributed leadership includes sharing decision-making when planning the school
improvement plan. Some conclude that increasing teacher influence has the potential to
effect school improvements and climate (Spillane, Halverson, & Diamond, 2004). Further, it
has been concluded that a principal’s success in the school improvement process can be
significantly increased when the ownership and leadership is widely dispersed among
teachers and staff (Fink & Brayman, 2006).
Glickman et al. (2001) developed a list of the characteristics of an improving school
with distributed leadership at the top of the list. Recent literature on school reform suggests
that improved learning outcomes resulted from the school improvement process from

17
distributed leadership approaches (Fullan, 2001; Hopkins, 2001). Furthermore, Little (1995)
and Lambert (1998) advocated that a relationship exists between teachers as leaders,
cooperation, and competency building for successful school planning and improvement.
Distributed Leadership Function: Developing People
Another important outcome of using distributive leadership in schools is the
enhancement of the professional development of teachers and staff that can be accomplished
by allowing teachers to determine the content of in-service professional development
programs. When teachers exercise their intellect, personality, and represent suitable
principles and practices, they become part of developing the people around them in the
school and the organization (Leithwood et al., 2006). Distributed leadership provides the idea
that professional development that is organically applied through common proficiencies and
mutual ways of working to create an influential learning atmosphere (Harris, 2005). Harris
(2005) noted that distributed leadership application would result in more stable organizations
through constituents sharing expertise with one another and becoming more adaptable to
change.
Teachers’ skills can be developed through the influence they exercise on each other
and from the influence of the principal. The interchange of experiences teachers enact with
their leaders affects teacher capacities and motivations (Leithwood et al., 2006).
Furthermore, when teachers’ capacities and motivations are positively enhanced through
leadership of others in the organization, they develop professionally and promote the
development of others.

18
This type of leadership improves the quality of teaching and learning, and has
generally been called ‘instructional leadership’ (Sheppard, 1996). Many educators believe
that instructional leadership is at the heart of developing teachers in the organization of
schools and research has indicated that personal attention by a leader, principal and/or
teacher, to others; and the development and use of teachers’ capacities, causes an increase in
levels of enthusiasm and optimism. At the same time, this attention reduces frustrations while
conveying a sense of mission and purpose (McColl-Kennedy & Anderson, 2002).
Furthermore, Griffin (1995) reported that distributed leadership results in constructive effects
on teaching, school climate, and overall educational quality in schools.
Within teacher leadership literature, studies show verification of the constructive
effects of distributed leadership on teachers’ self-efficacy and self-confidence measures
(MacBeath, 1998), which could be argued, contribute to an overall increase in commitment
to the organization. Evidence suggests teachers collaborate regarding quality practice and
learning. Instructional collaboration tends to increase better quality teaching (Lieberman,
Saxl, and Miles, 2000; Little, 1990). Other studies reported that teacher participation in
decisions led to a decrease in teacher absenteeism (Rosenholtz, 1989; Sickler, 1988). Initial
evidence suggests distributive communities foster teachers’ desire to be more consistently at
work and less likely to leave the school.
Leadership that consistently supports teachers is necessary in a distributive leadership
environment. When principals relinquish power in the school environment, it supports the
development of the leader and followers. It is apparent that “specific tasks and functions
would have to be retained by those in formal leadership positions, but the key to growing

19
distributed leadership resides in the involvement and support of teachers in cooperatively
guiding and shaping instructional and institutional development” (Harris, 2005, p. 261).
Leithwood et al. (2004) suggested a teacher’s positive participation in decision
making builds loyalty; enhances job satisfaction, morale, and self efficacy; and erodes
feelings of powerlessness and alienation. Distributive types of leadership have led to
improved group innovation and attitudes (De Dreu & West, 2001), which promotes teachers’
belief that their school is a good place to teach and learn. Heightened interest, innovation and
attitudes along with distributive leadership behaviors generally increase teacher retention.
Ingersoll (2007) showed the increased likelihood of a teacher’s willingness to continue in
their existing positions when distributive leadership is implemented.
Distributed Leadership Function: Redesigning the Organization
Distributive leadership occurs formally and informally in schools. In order for
distributive leadership to become the ‘lifestyle’ of the school, the dynamics of the
organization and how people work and function within the organization must change. The
purpose behind newly redesigned organizations is a change in school culture and structure
through the facilitation of the work by organizational members and the building of
collaborative processes incorporated into the overall nature of the school’s improvement
agenda (Leithwood et al., 2006). The school organization is being redesigned, due to higher
degrees of accountability, by programs such as ‘professional learning communities’ that has
emerged from the theoretical concept known as ‘learning organizations’ (Leithwood et al.,
1998).

20
Within redesigned organizations that incorporate distributive leadership, teachers
need time to collaborate with colleagues, and should be provided opportunities to learn from
one another. Research supports that strong professional relationships regarding school
development (Little, 1990). Little (1990) suggested that professional interaction provide the
foundation for developing collective ideas and for producing distributive leadership
approaches. Rosenholtz (1989) argued for teacher professionalism and collaboration as a
conduit for producing positive change in schools. He observed that effective schools have
stronger connections between what is important and behaviors between teachers and
principals. These behaviors typically result in better school performance (Rosenholtz, 1989).
Ovando (1994) found that common times for teachers to meet were a primary
component of successful schools. In order for teachers to regularly improve their practice,
they need to be given specific and dedicated time to collaborate with one another. Teachers
need time and opportunity to share and expose their classroom practices in order for there to
be a transfer and distribution of expertise within schools (Harris, 2005). In order for teachers
to act as instructional leaders, time and the opportunity to interact with peers is necessary for
advantageous collaborative influence (Harris & Muijs, 2005).
As organizations become redesigned in light of distributive leadership, teachers are
given opportunities to be a part of group decision making. Distributive leadership includes
the idea that teachers’ have influence over and participate in school-wide decisions
(Wahlstrom & Louis, 2008). Research by Harris and Muijs (2005) found distributed
leadership results in widely-shared decision-making processes viewed as the responsibility of
groups rather than the individual. Distributed leadership initiatives facilitate genuine and

21
collective decision processes (Neuman & Simmons, 2001).
Distributive leaders provide teachers opportunities for involvement and to exercise
influence on decisions. Teachers’ participation promotes commitment to decisions and
increases teacher’s eagerness to follow them (Somech, 2005). Dynamic participation
increases involvement and commitment due to the fact that individuals place more trust and
are more accepting of information personally ascertained (Armenakis et al., 1993; Beckhard
& Harris, 1987; Fishbein & Azjen, 1975; Fullan, 1997). Distributed leadership proponents
suggest that teachers’ participation is sustained because of the personally relevancy they
enjoy through personal implementation of ideas rather than responding to the schemes of
others.
Teachers have important information to share, and their participation advances
professionalism. When teachers share in decision making with leaders, they become
committed to the decision made since they have become a part of the process. Sergiovanni’s
(2001) concept of ‘leadership density’ is helpful in promoting the idea whereby a larger
number of people are involved in the work, trusted, exposed to innovative ideas, and
participate in the creation of new understanding in schools for greater leadership density
among more constituents.
Lastly, within the redesign of the organization for leadership distribution, an
environment of trust must be developed between leaders and followers. Trust in the
organization is concerned with relationships and organizational behavior. Trust among
subordinates and trust in leaders has become important for organizations to be more
collaborative in nature (Tschannen-Moran, 2004). Tarter, Bliss and Hoy (1989) found

22
principal behavior and faculty trust correlatives when principals support teachers. Schools
with high levels of engaged teachers enjoyed higher levels of trust in fellow colleagues.
Distributive forms of leadership aligned with principal behaviors affected trust (Louis, 2007).
Schools with high degrees of trust display more collaborative decision making with
improvement for student learning more dispersed (Wahlstrom & Louis, 2008). Generally,
organizations with high degrees of trust observe personnel comfortable to seek help and learn
from other teachers. Trust is a prerequisite for effective helping relationships between
professionals (Bryk & Schneider, 2002).
Distributed Leadership Function: Managing the Instructional Program
Distributed leadership incorporates activities of multiple participants in guiding
others in the process of changing instructional practice. Furthermore, distributed leadership is
particularly helpful in providing widespread quality management of the instructional program
in schools where multiple groups guide and mobilize staff in instructional change and
improvement (Spillane et al., 2004). Instructional leadership and effective school
improvement processes include areas such as decisions about staffing, monitoring school
improvement strategies and allocating resources that foster school improvement (Leithwood
et al., 2006).
Managing the instructional program in the distributive leadership framework requires
teachers be involved in the selection of instructional materials, resources and teaching
techniques, and setting grading and student assessment practices. Teacher leaders focus on
issues of curriculum, instruction, and classroom management improving peer teachers
practice (Harris & Muijs, 2005). Teacher leaders can fill a wide range of roles and tasks in

23
terms of school leadership and accomplishment of tasks. Barth (2001) shared that teacher
leadership is indispensable, and teachers need to be at least involved in functions like
textbook selection, curriculum decisions, student behavior standards, tracking of students,
professional development, promotion and retention policies, budgets, teacher evaluations,
selecting, and hiring new staff including new administrators. Smylie (1992) indicated that
teacher leadership roles include being a mentor or lead teacher, working on school
improvement teams, leading principal advisory councils, and developing and implementing
new curriculum and instructional programs.
Teacher leaders play a role in improving the quality of education by being leaders
beyond the classroom. They contribute to a community of teacher learners by influencing
others to improve their educational practice (Katzenmeyer & Moller, 2001). Academic
optimism occurs where teachers become interested in better quality instruction associated
with pre-planned approaches from principals to leadership distribution (Mascall et al., 2008).
A central purpose of teacher leadership is to improve the teaching profession and assist in
school reform (Smylie & Denny, 1990). Distributive leadership mechanisms in managing the
instructional program also must involve teachers in the hiring of new teachers and deciding
how the school budget is spent. Many teacher leaders in distributive leadership are involved
in the organizational work by setting discipline standards for student behavior, making
budget decisions, and addressing personnel concerns (Harris & Muijs, 2005).
Benefits of Distributed Leadership
According to researchers, a number of benefits are derived from the use of distributed
leadership by principals in K-12 schools (Harris, 2005 & 2008; Macbeath, 2001; Mascall,

24
2008). One organizational benefit of distributed leadership may simply follow the old adage
"two heads are better than one." Indeed, the combined capacities of more members can
capitalize on a range of individual strengths as a collective and the organization can also
becomes more interdependent. Increased participation in decision making from more
members will generally lead to greater commitment to organizational goals and strategies
(Leithwood et al., 2009). Lastly, organizations enjoy an increase in overall individual
determination that improves members’ experience of work (Leithwood et al., 2009). Gronn
(2008), reflecting back on the development of distributive leadership, preferred its
application for positive organizational outcomes for quality decisions with commitment
because more people are contributing to the decisions. Staffs in schools often feel entitled to
contribute to decisions about school developments that affect their work efforts.
Collaboration for the purpose of school excellence through distributive leadership
mechanisms spread leadership among teachers and staff in schools (Wallace, 2001)
Some argue that distributive leadership is morally just and necessary because we live
in a democratic country where personal rights are given precedence (Blase and Anderson,
1995; Bottery, 1992; Sergiovanni, 1996; Starratt, 1995; Wallace, 2001). Participating in
distributive leadership has potential intrinsic value providing fulfilling experiences for those
involved in which an atmosphere of comradeship in working with colleagues can be
produced (Nias, Southworth & Yeomans, 1989).
As stated previously, distributive leadership environments can provide staff the
opportunity to define professional development and career goals (Wallace, 2001) and provide
opportunities for informal and supplemental learning (Marsick & Watkins, 1990; Wallace,

25
1991). As a result, casual workplace ‘learning’ has the potential to improve on-the-job
performance (Wallace, 2001). Distributive leadership is purported to cause great effects on
“teacher leaders themselves, as they gain leadership skills, improving instructional practices,
and become more fully engage in their work” (Lashway, 2006, p.253). Therefore, teacher
leadership increases teacher professionalism and improves the organizational vigor and
atmosphere in schools (Murphy, 2005). Furthermore, as educators of children, staff working
relationships an act as role models in fostering each child’s social development in
representing collaborative working relationships for their students to follow (Wallace, 2001).
Distributive leadership has the potential to contribute to effective principals because
school staffs are interdependent where “every member has a contribution to make as
leadership tasks can be fulfilled only with and through other people” (Wallace, 2001, p. 154).
Extensive interdependence and personal ownership of school policy decisions is at the heart
of building professional learning teams in schools (Bell & Rhodes, 1996) if staff are working
in distributive environments. Empowerment through shared commitment enables staff to
accomplish more together than as individuals (Sergiovanni, 1990; Starratt, 1995). Wallace
(2001) noted,
In these circumstances they can achieve an optimum degree of synergy, which may
be defined as group members combining their individual energies to the best of their
ability in order to achieve shared goals. Advocates assume that staff will adhere to
these principles if given the chance: those offered their entitlement will take it up;
they will act as good role models for students; and they will collaborate and generate
synergy. (p.154)

26
Detractors of Distributed Leadership
Distributed leadership in schools has been reported to produce negative effects as
well, including a reduction in student engagement (York-Barr & Duke, 2004). In addition,
expanding leadership across organizational members can complicate the development of a
single-minded clarity of organizational purpose and sense of mission. Distributive leadership
has also “resulted in tensions and conflicts between competing leaders” where these multiple
leaders create an increase in “conflict as their competing visions, models and ideas of
‘success’, ‘good practice’, appropriate performance measurements and departmental and
individual needs become more evident” (Storey, 2004, p. 253). Teacher cultures frequently
contain individuals with incompatible ideologies, such as contradictory beliefs and values
that often coexist only in tension (Wallace, 2001).
Hargreaves (1994) found that attempts at fostering collaborative teacher climates
simply encouraged the idea of ‘contrived collegiality’ rather than genuine collaborative
school climates which arise organically outside of the distributive leadership agenda.
Distributive leadership that led to empowering other staff did not guarantee teachers would
take up this leadership entitlement. Research consistently found that a remarkable number of
small pockets of teachers in an organization will remain uncommitted to collaboration and
may at times attempt to undermine distributive leadership efforts among fellow teachers
(Torrington & Weightman, 1989).
At times, the spread of leadership may cause a lack of certainty about what needs to
be done for improved productivity in schools (Leithwood & Jantzi, 2000; Timperley, 2005).
Teachers “contradictory beliefs and values reflected the wider social and political context

27
which impacted reciprocally on team members’ use of power and affected the extent to
which leadership was shared between team members” (Wallace, 2001, p. 153).
Another noted negative side effect of distributed leadership in schools is the increase
in the burdens and responsibilities of teachers without actually increasing their power. Some
have argued that distributing leadership was merely a subtle strategy for indoctrinating
among staff values and goals of more powerful members in the organization (Ritchie &
Woods, 2007). Tannenbam (1961) showed limited support for contributions of ‘democratic’
organizational control and general organizational successes. One research study found that
“the main effects [for distributive leadership] are weak and positive and contingent on many
other conditions” (Miller & Rowan, 2006, p. 220) in regards to the effectiveness of
distributive leadership.
Storey (2004) presented many crucial unanswered questions about distributive
leadership and cited a serious lack of empirical research. Some unanswered questions
include:
How widely should leadership be distributed?; Who determines the distribution?;
What kinds of tasks or roles are to be distributed?; How will it fare in practice when
competing against the dominant cultural model of the top-down leader who is willing
to assume responsibility and to show the way?; What are the other implications of the
distributed mode?; What dynamics are unleashed when leadership is exerted a
multiple points in a school organization? (p. 253-254)
Wallace (2001) provided additional unanswered questions concerning the difficulty of
implementing distributed leadership models in schools. Those questions include:

28
How far should principals be expected to risk sharing leadership, since it negatively
effect their reputation, colleagues’ work, and ultimately children’s education? And, if
the risk of ineffective leadership can be reduced by limiting the amount of sharing, is
it justifiable for principals to adopt a contingency approach, varying the degree of
sharing as the situation evolves? (p. 157)
Overall, few empirical research explore the full meaning and implications of
distributed leadership (Lashway, 2006; Storey, 2004). Lack of a broad range of empirical
research leaves the definition of distributed leadership blurred, and its possibilities and
practices in schools are left, at times vague in description (Lashway, 2006).
Potential Variables Influencing Leadership Effectiveness
Because the principal is the ‘key educational leader’ and has the most opportunity to
exercise leadership, it seems important to define leadership effectiveness and note attributes
that may affect a principal’s capacity to lead. Invariably, personal traits contribute to
leadership effectiveness. Effective leaders can be defined as “those persons, occupying
various roles in the school, who work with others to provide direction and who exert
influence on persons and things in order to achieve the school’s goals” (Leithwood & Riehl,
2003, p. 9). In other words, effective principals facilitate effective schools for teachers and
ultimately student’s success. Furthermore, Leithwood and his colleagues (2008,) claimed that
“school leadership is second only to the classroom teaching as an influence” (p. 27) on
schools and learning.
Gender and ethnicity result in unique perspectives with noted effects on leadership.
Some studies conclude that gender or ethnicity provides differences for how leaders

29
persuade, act sensitively to others, or take certain types of risks in performing leadership
duties. Other studies have found little differences between men and women. Some found
differences in orientation toward tasks and various styles of leadership in organizations
(Smith & Piele, 2006). Some researchers have noted that female principals, at times, are rated
higher on leadership effectiveness ratings (Fowler, 1991). Kruger (1996) noted differences in
leadership between male and female principals. There have also been noted differences
between Black, White, Asians and Hispanics on effectiveness ratings (Fowler, 1991).
A final factor considered affecting leadership effectiveness is the principal ‘years of
experience.’ Principals with less or more years of experience have seen difference in
effectiveness ratings (Fowler, 1991). Oddly, some principals have been rated more effective
with only a couple of years of experience. Experience and training provides leaders with
perspective and philosophical orientation that guide how to think about their skills and what
to do in leadership situations (Smith & Piele, 2006).
Invariably, personal traits contribute to leadership effectiveness, yet no definitive list
of attributes and distinguishing qualities of effective leaders is identified from existing
research (Clark & Clark, 1990). For this study, some of the demographic information listed
previously will be specifically observed and evaluated for their effects on leadership
effectiveness and distributive leadership behaviors. Since there is limited knowledge or any
definitive list of attributes among effective leaders, the following section discusses the
demographic information from the survey with theoretical basis and some new characteristics
with little or no theoretical support. Looking at new and different characteristics will help to
broaden knowledge and provide new understanding about principals as leaders.

30
The North Carolina Teacher Working Conditions Survey instrument provides
questions linked to the theoretically and empirically derived attributes reviewed in this
chapter indicative of distributed leadership and effective leadership. Principal and teacher
attributes incorporated in this study include: gender, years of experience, ethnicity, level of
school (highest degree), and National Board for Professional Teaching Standards
certification. These are the demographic factors that will be analyzed with key variables
(attributes) supporting leadership and subordinate traits from previous empirical research on
effective leadership and use of distributed leader methods.
Proponents of distributed leadership are encouraging organizations and schools to
rely on leadership from many members of the organization, instead of the principal and other
administrators alone (Leithwood, et al., 2006). Distributive leadership in schools is purported
by some to help schools run more efficiently and effectively. The argument is that in order
for schools to be led well, the size of the task facing school leaders is too great for any one
individual to handle, and leadership must be expanded to include teachers. While proponents
believe the multifaceted aspect of distributive leadership make it necessary in schools, the
myriad of tasks and roles fulfilled by teacher leaders make a single, all encompassing
definition of teacher leadership elusive.
Among the events, environmental conditions and community that encourage and
support distributive leadership on a school campus, the role of the principal is the most
powerful. It can be argued that a system as complex as a school would benefit richly from a
continual focus on using distributive leadership. This chapter has reviewed core leadership
functions in school systems that including components of setting directions, developing

31
people, redesigning the organization, and managing the instructional programs (Leithwood et
al., 2006). Within distributive leadership, these four leadership functions are what principals
‘distribute’ in schools. Leaders who distribute the four leadership functions within schools
are perceived as more effective than those that do not.
Ultimately, the principal decides if teachers are to be included in school leadership.
Barth (2001) and Leithwood et al. (2004) discussed the important role the principal plays in
supporting teacher leadership in the form of distributing leadership to staff and teachers.
Teachers touch the school at the very core of its existence — in the classroom. Teachers
more than any other member of the education community; know what is needed, what will
work, and how best to implement reforms. The list of possible benefits and products of
distributive leadership make it worth the effort to create and sustain the inclusion of teachers
and staff in school leadership.

32
CHAPTER 3
Methodology
Introduction
This chapter describes the methods used to study the relationship between distributive
leadership and leadership effectiveness. The methodology explained in this chapter was
designed to address the following questions:
1. What components of distributed leadership exist in North Carolina schools?
2. What is the relationship between different components of distributive leadership?
3. What characteristics of principals are associated with the use of distributive
leadership in schools?
4. What is the relationship between the teachers' perception of the principal’s use of
distributed leadership and the principal's leadership effectiveness?
Population and Sample
The data set was drawn from the population of teachers and principals in North
Carolina public schools-representing all levels (elementary, middle, high), enrollment sizes,
and socioeconomic statuses-who responded to the 2008 North Carolina Teacher Working
Conditions Survey. The initial survey was made available to all certified educators
throughout the state of North Carolina, and 104,648 educators participated in the original
survey, which represented 87% or 118,505 of the total certified educators in North Carolina
(Hirsch & Church, 2009). In this study, respondents who were not teachers or principals were
removed from the sample. Cases in the data set were removed for schools if there was not a
complete set of teachers with specifically a principal respondent. Charter and special schools

33
were also removed from the data set. The final data set for this study included 70,811
teachers and principals in North Carolina of the 100,024 population (North Carolina
Department of Public Instruction, 2008).
Table 1 shows the demographic details of the respondents in this study as compared
to the total population of teachers and principals in North Carolina. The respondents to the
survey used are fairly representative of the total population of certified school personnel in
North Carolina. Specifically, the respondents were a good representation of the total
population in terms of gender and ethnicity of teachers and principals across the state of
North Carolina.
Table 1 Demographic Comparison of Certified Public School Personnel in North
Carolina for 2007-08 and Final Respondent Data Set Derived from the 2008 North Carolina Teacher Working Conditions Survey Sample (NCTWCS)
Demographic Details North Carolina 2007/2008 Personnela
Respondent Data Set Derived from the 2008 NCTWS
N P n P Teachers & Principals 100,024 N/A 70,811 N/A Males 20,601 20.6 13,127 18.5 Female 79,423 79.4 56,762 80.2 Gender - Missing data N/A N/A 922 1.3 White 82,498 82.5 58,202 82.2 Black 14,418 14.4 8,232 11.6 Other Ethnicity 3,108 3.1 3,590 5.0 Ethnicity - Missing data N/A N/A 787 1.1 Principal 2,348 2.3 1,829 2.6 Teacher 97,676 97.7 68,982 97.4 Note. a North Carolina Department of Public Instruction. (2008). North Carolina public schools: Statistical profile 2008. Raleigh, NC: Author.
Data Collection
Yukl (1994) suggested research concerning leader and specifically subordinates’
perceptions of a leader’s behavior as being useful in investigating linkages between

34
organizational variables and leadership approaches. In this research study, the perceptions of
the teachers were the primary area of interest as well as principal characteristics. In order to
assess the degree the North Carolina Teacher Working Conditions Survey measures the
theoretical constructs intended specifically components of distributive leadership specified
Leithwood et al. (2006), factor analysis of the sixteen items was conducted to determine if
the items separated into discrete factors (Moir, 2009). Previous renditions of this survey that
analyzed similar teaching conditions items had indicated a strong overlap between the school
leadership and educator leadership sections of the survey (Moir, 2009).
The items on the survey used five point Likert scale responses ranging from ‘strongly
disagree’ to ‘strongly agree.’ The online survey was administered in spring of 2008 from the
North Carolina Teacher Working Conditions Survey website. Educators were given school
codes to log in on the website in order to respond to the survey questions.
Survey Instrument
The authors of the survey used principal components analysis and varimax rotation
procedures with eigen values of one or greater as criteria for factor extraction in determining
final survey questions. See Moir (2009) for details about instrument reliability. In the 2008
North Carolina Teacher Working Conditions Survey, a five factor model was found related to
leadership, facilities and resources, professional development, time and decision making.
Questions from two of the five factors used in the study were primarily related to the
leadership factor and the decision making factor. The leadership factor included questions
regarding school leadership and educator leadership sections. The decision making factor
included sets of questions within the educator leadership section of the survey that asked

35
about the role teachers played in making decisions making about classroom teaching and
school matters (Moir, 2009). Reliability was assessed for subscales within the survey on the
five identified factors of the survey, yet this study is primarily concerned with two of those
factors: leadership had a Cronbach’s α = .93 and educator leadership had a Cronbach’s α =
0.84 (Moir, 2009).
Variables of Distributive Leadership
Confirmatory factor analysis (CFA) tested how well a subset of measured variables
represented the four distributive leadership constructs. According to Garson (2009a), CFA
sought to determine the number of factors and there loadings for the indicator variables and
how they conform to expectation on the basis of our pre-established theory, in this instance
distributive leadership functions (factors) ascribed by Leithwood and his colleagues (2006).
The assumption was that each factor was associated with a specified subset of indicator
variables from the NCTWCS items. For the confirmatory factor analysis, items were
hypothesized beforehand regarding the number of factors in the model and posing
expectations about which variables will load on which factors (Kim and Mueller, 1978).
Overall, CFA seeks to determine if measures (items) suggested do in fact really belong
together in comprising the distributive leadership functions.
Confirmatory Factor Analysis and Item Reliability Analysis
Drawing on literature (Leithwood et al., 2006), items from the survey were assigned
to the four areas of distributive leadership. To confirm that the appropriate items were indeed
representing the same underlying construct, factor analysis was carried out on sixteen
distributive leadership related items taken from the 2008 North Carolina Teacher Working

36
Conditions Survey. The dimensionality of the sixteen items was analyzed using principal
component factor analysis. Three criteria were used to determine the number of factors to
rotate: the a priori hypothesis that the measure was unidimensional, the scree test, eigen-
values and the interpretability of the factor solution (Green & Salkind, 2005).
Careful consideration of these criteria led to the identification of four factors which
were then rotated (i.e. varimax rotation). The rotated solution, as shown in Table 2, yielded
four factors that aligned with the literature for setting direction (SD), managing the
instructional program (MIP), redesigning the organization (RO) and developing people (DP).
The four significant factors extracted explained 56% of the total variance and item reliability
analysis were also performed.
Factor 1 labeled setting direction (SD) included seven items with a Cronbach α = .91
and explained 23% of the variance. The three items in Factor 2 pertain to managing the
instructional program (MIP) have a Cronbach α = .77 and accounted for 11% of the variance.
The three items in Factor 3 pertained to redesigning the organization (RO) have a Cronbach α
= .73 and accounted for 11% of the variance. The three items in Factor 4 developing people
(DP) have a Cronbach α = .72 and explained 10% of the variance. The Cronbach alpha’s for
each of the four distributive leadership constructs were above .40, suggesting that the scale
scores were relatively reliable for respondents like those in the study (Green & Salkind,
2005). The results from CFA and our item reliability analysis enabled the creation of a mean
scale score (composite variables) associated with each of the distributive leadership functions
used for the statistical analysis used to answer the research questions.

37
Table 2 Factors of the Distributive Leadership Function With Items and Their Factor Loadings
2008 NCTWCS Items Factor(s)
1 (SD) 2 (MIP) 3 (RO) 4 (DP)
The school leadership consistently supports teachers.(a) .787 .191 .189 .141
There is an atmosphere of trust and mutual respect within the school.(a) .744 .195 .176 .145
The faculty and staff have a shared vision.(a) .714 .147 .253 .155
The school leadership makes a sustained effort to address teacher concerns about empowering teachers.(a) .700 .216 .295 .224
The faculty has an effective process for making group decisions and solving problems.(a) .678 .189 .248 .287
Teachers are centrally involved in decision making about educational issues.(a) .606 .232 .252 .340
Opportunities are available for members of the community to actively contribute to this school’s success.(a) .512 .126 .255 .149
Teachers have a large role in devising teaching techniques.(b) .220 .813 .107 .109
Teachers have a large role in setting grading and student assessment practices.(b) .147 .628 .119 .135
Teachers have a large role in selecting instructional materials and resources.(b) .230 .592 .159 .297
Teachers are provided opportunities to learn from one another.(a) .283 .120 .740 .136
Adequate time is provided for professional development.(a) .270 .117 .673 .140
Teachers have time to collaborate with their colleagues.(a) .223 .135 .456 .121
Teachers have a large role in deciding how the school budget will be spent.(b) .223 .156 .138 .676
Teachers have a large role in hiring new teachers.(b) .155 .124 .093 .629
Teachers have a large role in determining the content of in-service professional development programs.(b) .267 .304 .239 .494
Note. a Items measured using 5 item Likert scale (strongly disagree, somewhat disagree, neither disagree nor agree, somewhat agree, strongly agree) Note. b Items measured using 5 item Likert sacle (no role at all, small role, moderate role, large role, the primary role)
Leadership Effectiveness Variables
Leadership effectiveness was the primary dependent variable for analysis in the study.
Leadership effectiveness was measured by the combining two different indicator questions

38
from the 2008 NCTWCS into the leadership effectiveness index. Leadership effectiveness
indices collected from the NCTWCS:
1. Overall, the school leadership in my school is effective.
2. Overall, my school is a good place to teach and learn.
Both items were measured using a five point Likert scale with strongly disagree,
somewhat disagree, neither disagree nor agree, somewhat agree, strongly agree. The two
leadership effectiveness indicators above had a Cronbach α = .67 and an inter-item
correlation of .50 from reliability analysis. The Cronbach alpha’s for the two constructs were
slightly reliable suggesting that the scale scores for respondents like those in the study were
similar.
Demographic Variables
The independent demographic variables are described in Table 3. Dummy variables
were created for each variable that had more than two categories.
Table 3 2008 NCTWCS Demographic Items used as Variables in Detail Item / Variables Details How many total years have you been employed as an educator?
First Year (Reference Group - Teachers), First Year - 10 Years (Reference Group - Principals), 2 - 3 Years, 4 - 6 years, 7 - 10 Years, 11 - 20 Years, 20+ Years
Please indicate your race/ethnicity. American Indian or Alaska Native, Asian or Pacific Islander, Black or African American, Black or African American, Hispanic, White (Reference Group), Mixed or Multiple Ethnicity, Some Other Race or Ethnicity.
Please indicate your gender. Female, Male (Reference Group). What is the highest degree you have attained?
Bachelor's degree (Reference Group), Master's degree, Doctorate, Other.
Are you certified by National Board for Professional Teaching Standards (NBPTS)?
Yes (Reference Group), No.
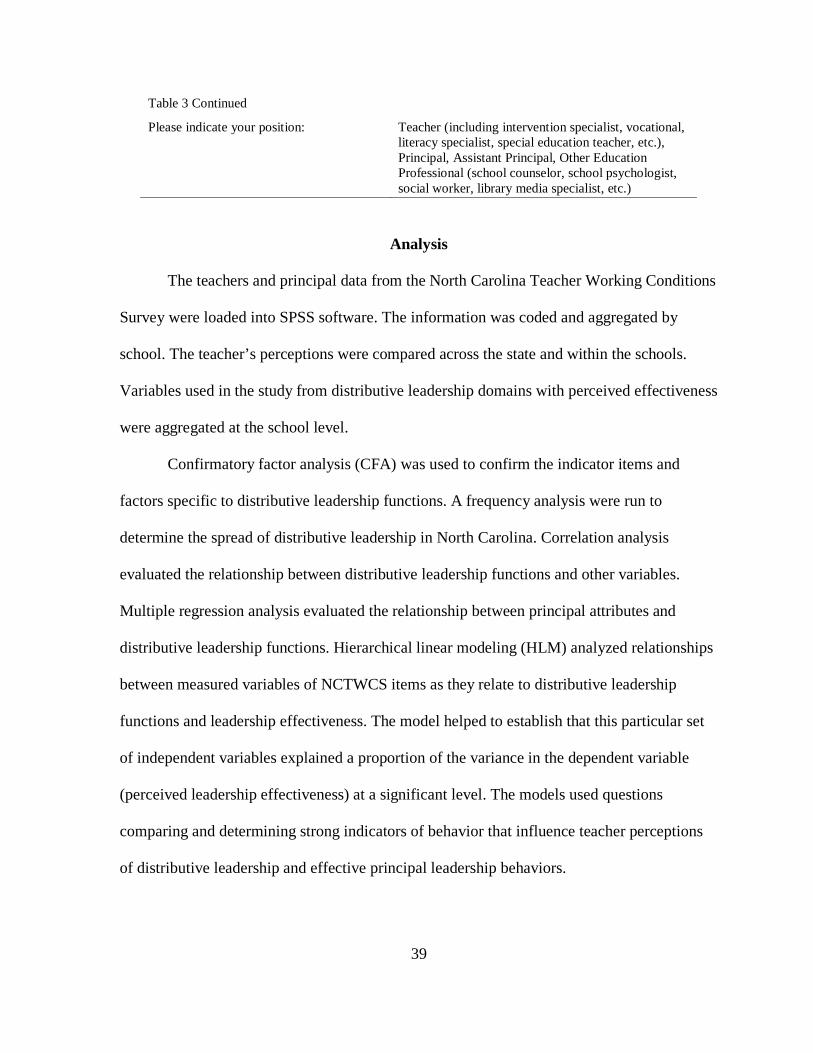
39
Table 3 Continued
Please indicate your position: Teacher (including intervention specialist, vocational, literacy specialist, special education teacher, etc.), Principal, Assistant Principal, Other Education Professional (school counselor, school psychologist, social worker, library media specialist, etc.)
Analysis
The teachers and principal data from the North Carolina Teacher Working Conditions
Survey were loaded into SPSS software. The information was coded and aggregated by
school. The teacher’s perceptions were compared across the state and within the schools.
Variables used in the study from distributive leadership domains with perceived effectiveness
were aggregated at the school level.
Confirmatory factor analysis (CFA) was used to confirm the indicator items and
factors specific to distributive leadership functions. A frequency analysis were run to
determine the spread of distributive leadership in North Carolina. Correlation analysis
evaluated the relationship between distributive leadership functions and other variables.
Multiple regression analysis evaluated the relationship between principal attributes and
distributive leadership functions. Hierarchical linear modeling (HLM) analyzed relationships
between measured variables of NCTWCS items as they relate to distributive leadership
functions and leadership effectiveness. The model helped to establish that this particular set
of independent variables explained a proportion of the variance in the dependent variable
(perceived leadership effectiveness) at a significant level. The models used questions
comparing and determining strong indicators of behavior that influence teacher perceptions
of distributive leadership and effective principal leadership behaviors.

40
RQ1: The Extent of Distributive Leadership in North Carolina
Frequency distribution with descriptive statistics regarding components of distributive
leadership items in the survey was evaluated. The means and standard deviations of survey
items associated with distributive leadership are computed. This initial snapshot of
distributive leadership across the state shows the extent to which the different components of
distributive leadership, as reported by teachers and principals are practiced in schools across
North Carolina.
RQ2: Correlation of Distributive Leadership Functions
Correlation coefficients were computed among the four functions of distributive
leadership functions to measure the strength of association between the components. This
measure varies from 0 (representing random relationships) to 1 (representing perfect linear
relationships) or -1 (representing perfect negative linear relationships) and was reported in
expressions of r2 and interpreted as percent of variance explained. Pearson product–moment
correlation is the most commonly used technique for evaluating correlations.
RQ3: Principal Characteristics and Distributive Leadership
A regression model examined the second research question which focuses on
explaining the relationship between characteristics of principals and their use of distributive
leadership. The independent variables were the demographic characteristics of principals and
the dependent variable was the distributive leadership components for each school (teacher
level data aggregated to create a school mean). Distributive leadership represents the average
of all functions of distributive leadership.

41
The regression model, Table 4, helped to establish the extent to which the sets of
independent variables (principal characteristics) explained a portion of the variance in the
dependent variable (distributive leadership) at a significant level. Statistical significance was
determined by a significance test of R2 which established the relative predictability of the
independent variables through the comparison of the beta weights (Garson, 2010).
Table 4 General Multiple Regression Model for Distributive Leadership and Principal Characteristics Ŷ(Distributive Leadership) = B0 + B1(female) + B2(Years 11 - 20) + B3(Years 20 +) +
B4(Black or African American) + B5(NBPTS) + e Dependent Variable: Ŷ = Distributive leadership index or functions aggregated by school Independent Variables: Principal Gender (Male as reference group); Principal Years of Experience (First Year to 10 Years as reference group, 3 dummy variables); Principal Race (White as reference group, 2 dummy variables); National Board for Professional Teaching Standard (No BBPTS as reference group) Error Term:
e = error term reflected in residuals Intercept term: B = regression coefficients
The B's are the regression coefficients, representing the amount the dependent
variable Ŷ changes when the corresponding independent changes by one unit. The ratio of
the beta coefficients represented the relative predictability of the independent variables on the
dependent variable. The R2 calculated for multiple regression equations and multiple
correlations is the percent of variance in the dependent variable that is explained by all of the
independent variables.
The last step for the multiple linear regression analysis is the test of significance of
the model proposed. Multiple linear regressions use two tests as to whether the final model
and the estimated coefficients are found in the general population from the respondent
sample. The F-test tested the overall model in contrast to the null hypotheses that the
independent variables have no influence on the dependent variable or whether the R² = 0.

42
Also, multiple t-tests analyzed the significance of individual coefficients and the regression
equation intercept against the null hypothesis that the coefficient and intercept is zero.
RQ4: Distributive Leadership and Leadership Effectiveness
Hierarchical Linear Modeling (HLM) was conducted to determine the relationship
between distributive leadership and leadership effectiveness. Multilevel modeling tests
simultaneously variables at different levels including variables representing values between
and within schools (Garson, 2009b).
HLM analyzed multi-level effects on outcomes in the current analyses where both
teacher- and school-level sources of variability in outcomes were simultaneously accounted
for by specifying a two-level hierarchical model to obtain the best estimates of measured
effects. Teacher demographic variables (e.g. ethnicity, gender, etc.) were modeled at the
individual level and fixed at the school level. School-level variables (e.g. principal
characteristics, distributive leadership functions aggregated, etc.) were entered and attributed
to the school outcomes. This technique examined the direct effects of distributive leadership
variability as well as teacher and principal characteristics while simultaneously modeling
both at the individual (level 1) and schools (level 2) on the outcome variable leadership
effectiveness.
The large sample size will decrease standard errors and produce more precise
estimates of regression coefficients. Multicollinearity occurs when two or more predictor
variables in a multiple regression model are highly correlated and can have an effect on
standard errors. Multicollinearity was examined regardless of the analytical decisions from
correlation analysis and used to identify pairs of predictive variables that were highly

43
correlated. The variance-inflation factors (VIF) with tolerances were calculated and the
remaining variables are within acceptable tolerances. The issue of collinearity is particularly
vital in research on school effects since many variables tend to correlate greatly at both
teacher and school levels (O’Connel & McCoach, 2008).
HLM analysis was a two-step approach to modeling the multilevel relationships.
Level 1 involved the estimates of separate regressions for each group including the
individual-level predictor and outcomes. The Level 2 model analyzed the variance in the
Level 1 intercepts and slopes using the group-level variables. The general HLM model is
expressed and described in Table 5 (level 1) and Table 6 (level 2) (Castro, 2002; Bryk &
Raudenbush, 1992 & Hofmann, 1997).
Validity and Reliability: HLM Current Model Investigation
Hierarchical linear modeling (HLM) allowed for statistical analyses of individual
teacher level data with the school (principal) data that were nested (aggregated). The
assumption of independence of individual teacher cases is not necessary in HLM analysis
because the probability of dependence of teachers in the same school is explored within the
nested data set (Aitkin & Longford, 1986; Raudenbush & Bryk, 2002). Aggregation bias is
limited since HLM analysis allows investigation of effects of similar characteristics at more
than one level. HLM analyses are conducted simultaneously at multiple levels of data
allowing separation of variance into within- and between-school elements. Modeling effects
of HLM analysis produce effect size estimates that are generally bigger (some cases smaller)
with more precision than the estimates from individual-level or school-level analyses alone
(Raudenbush & Bryk, 2002).

44
HLM analysis produced a chi-square statistic to test the significance of the between-
group variance. A significant chi-square for the dependent variable showing that between-
group variance is significantly different from zero, indicating that the intercept term varies
across groups. In addition, an intraclass correlation coefficient (ICC) was computed that
represented the percent of the total variance in the dependent variable that is between groups
(Bryk & Raudenbush, 1992). The ICC indicated the amount of variance that could potentially
be explained by a Level-2 predictor in consideration of relationships among variables at
different levels of analysis and multilevel models (Klein & Kozlowski, 2000). The HLM
hypothesized that group-level principal characteristics and aggregated distributive leadership
functions moderated the relationship between individual-level (teacher) characteristics and
distributive leadership functions. The determination as to whether HLM analysis is warranted
or that those variables would be treated as either individual or group level variables were
based on the ICC (Castro, 2002).
A significant F-test was used to indicate when the group-level properties needed to be
investigated allowing the use of both individual-level and group-level data analyses for
HLM. A t-test was used to test the significance of whether the pooled Level-1 slopes between
the independent variable and the dependent variable differ from zero. The t-test assesses
whether, on average, the relationship between the independent variables and the dependent
variables is significant supporting our research question hypothesis (Wech & Heck, 2004).
HLM procedure specifies that there must be significant variance across groups in the
Level-1 intercepts (β0j). The intercept terms represent the between-group variance in the
dependent variable after controlling for the independent variable. Chi-square tests for the

45
estimates of the intercept (u0j) and slopes (u1j) are performed to confirm that the variance in
the intercepts and slopes for the dependent variable across groups is significant. If there is not
significant between group variance, then a group effect would not exist (Wech & Heck,
2004). Calculating R2 determined if there was the proposed relationship between distributive
leadership, teacher characteristics and leadership effectiveness. This R2 is the percentage of
the individual variance in leadership effectiveness is explained by individual level-1
variables.
Results of t-test show whether the group level variable has a significant effect on the
dependent variable. Using information from the HLM intercepts and slopes as outcomes
analyses (Luke, 2004); an overall R2 for the respective Level-2 equations can be computed.
Given the R2, it was determined the independent variables’ variance between groups, and
subsequently how much of the total variance was attributed to distributive leadership.
Table 5 General Hierarchical Linear Model (HLM) causal model (Level-1) with equations and symbols described Yij (LE) = β0j + β1j (DLSD) + β2j (DLDP) + β3j (DLRO) + β4j (DLMIP) + β5j (Year Ed 2 - 3) +
β6j (Year Ed 4 - 6) + β7j (Year Ed 7 - 10) + β8j (Year Ed 11 - 20) + β9j (Year Ed 20 +) + β10j (Am. Indian or Alaska Native) + β11j (Asian or Pacific Islander) + β12j (Black or African American) + β13j (Hispanic) + β14j (Mixed or Multiple) + β15j (Other Race) + β16j (Masers) + β17j (Doctorate) + β18j (Other Degree) + β19j (Female) + β20j (NBPTS) + eij
Dependent Variable: LE= Leadership Effectiveness (Yij) Independent Variables: DLSD = Distributive Leadership Function – Setting Direction; DLDP = Distributive Leadership Function – Developing People; DLRO = Distributive Leadership Function – Redesigning the Organization; DLMIP = Distributive Leadership Function – Managing the Instructional Program; Teacher Years of Experience (First Year as reference group with 5 dummy variables); Teacher Race (White as reference group with 6 dummy variables); Teacher Gender (Male as reference group); Teacher Highest Degree (Bachelor as reference group with 3 dummy variables); National Board for Professional Teaching Standard certified (No NBPTS as reference group) Error Term: eij = residual variance; otherwise known as random errors term Intercept term: β0j = Level-1 intercept, leadership effectiveness for principal j adjusted for teacher characteristics and distributive leadership functions

46
Table 6 General Hierarchical Linear Model (HLM) causal model (Level-2) with equations and symbols described Level-2: β0j = ϓ00 + ϓ01(Year Ed 11 - 20) + ϓ02(Year Ed 20 +) + ϓ03(Black or African American) +
ϓ04(Female) + ϓ05(NBPTS) + u0j Level-2a: βgj = ϓg0 + u1j β0j = Level-1 intercept, leadership effectiveness for principal j adjusted for teacher characteristics and distributive leadership functions ϓ 00 = Level-2 intercept, grand mean of leadership effectiveness across all schools (principals) adjusted for teacher characteristics and distributive leadership functions Level-2 Independent Variables / Predictors: Principal Years of Experience (First Year to 10 Years as reference group with 3 dummy variables); Principal Race (White as reference group with 2 dummy variables); Principal Gender (Male as reference group); National Board for Professional Teaching Standard certified (No NBPTS as reference group) u0j = level-2 error term (random effect), unique effect of principal j on the mean leadership effectiveness adjusted for principal characteristics βgj = level-1 slope, effect of teacher characteristics and distributive leadership functions on leadership effectiveness adjusted for principal characteristics ϓ g0 = average regression slope across all principals adjusted for principal characteristics. u1j = error component for the slope
Generalizability
Reliability in a quantitative study entails the degree to which the study can be
replicated and the consistency of scale measurement within the survey. Although various
texts describe multiple categories of validity, two types were recognized for this study.
External validity is the extent to which findings can be applied to another group and refers to
the generalizability of the study. Generalizability across the teachers studied to other teachers
in similar settings was not directly observed. However, due to the fact that the data was
gathered across the state followed by careful analysis of findings enabled the final analysis to
be generalized to all schools in the state and outside of the state in similar contexts.
Limitations of the Study
The study may be limited by lack of responses to surveys by teachers within schools.
As data was collected, schools were included with a minimum 40% response rate on the
Teacher Working Condition Survey. Another potential threat to validity in this study was
teacher attitude toward the principal; teacher’s attitudes may influence their rating of

47
principal’s leadership effectiveness. The direction and extent of potential bias of these factors
was unknown.
Bias may also have been introduced through the reduction of the survey data set in
removing missing teachers and schools that did not have responses by the principal for the
school. The type of teachers and/or principals that may not have responded could have
altered results, interpretation and ultimately created researcher bias.
The use of school-level data not identifying individual teacher responses was a
condition of acquiring the data, and intended to ensure the anonymity of respondents.
Limited identification ultimately may limit forms of analysis and, on some levels, affect our
associations in the study. The exclusion of some variables may have lead to a mis-specified
model. Yet, maintaining a degree of anonymity for the respondents promotes a higher than
normal response rate that can minimize threats to internal validity due to respondent mistrust
regarding assurances of confidentiality (Hirsch & Church, 2009).
48
CHAPTER 4
Results and Data Analysis
Introduction
This study was designed to examine the relationship between distributed leadership
and principal leadership effectiveness. The initial analysis involved conducting confirmatory
factor analysis of leadership related items from North Carolina Teacher Working Conditions
Survey (NCTWS). Research question one is addressed by observing the frequency of
distributive leadership components across North Carolina. Next, addressed the second
research question, which involved investigating the extent to which leadership functions were
correlated to one another. Multiple regressions were conducted to determine what
characteristics predict the use of distributive leadership, which addresses the third research
question. The final phase primarily addressed the fourth research question which involved
generating the two level hierarchical linear models that predict the leadership effectiveness of
principals. This chapter presents the results of the statistical analyses of data gathered from
70,811 teachers and principal across North Carolina.
Descriptive Statistics: Teachers and Principals
As shown in Table 7, almost 50% of the 68,982 teachers represented in the data set
have eleven or more years of educational experience and first year teachers comprise the
smallest percentage (7%) of the teachers represented. The largest ethnic group represented is
White, comprising 83% of the 68,982 teachers followed by Black or African American with
12%. The sample of teachers is predominately female at 82%. And, most teachers’ highest

49
degree is bachelor’s, representing 64%, followed by master’s degree representing 33%. Only
12% of the 68,982 teachers have their NBTS certification.
As indicated in Table 7, 94% of the 1,829 principals have eleven or more years of
educational experience. The largest ethnic group represented is White comprising 76 % of
the sample followed by Black or African American, making up 21 % of the 1,829 principal
respondents. The sample of principals is more ‘evenly’ distributed between male and female
principals. Female principals represent 57% and males represent 43% of the sample. Most
principals, 78%, have a master’s degree, which is required in most cases in order to have a
principal licensure in North Carolina, and 10% of the principals have a doctorate degree as
their highest degree earned. Only 5% of the 1,829 principals have their NBTS certification.
Table 7 Teachers and Principals Descriptive Statistics
Teachers Principals
n P n P How many total years have you been employed as an educator? First Year 4,662 6.8 6 .3 2 - 3 Years 8,364 12.1 5 .3 4 - 6 Years 10,375 15.1 10 .5 7 - 10 Years 11,375 16.5 90 4.9 11 - 20 Years 17,776 25.8 694 38.0 20+ Years 16,351 23.7 1,023 56.0
Total 68,903 100.0 1,828 100.0 Please indicate your race/ethnicity. American Indian or Alaska Native 676 1.0 27 1.5
Asian or Pacific Islander 382 .6 2 .1 Black or African American 7,845 11.5 387 21.2 Hispanic 839 1.2 8 .4 White 56,818 83.3 1,384 76.0 Mixed or Multiple Ethnicity 989 1.5 7 .4 Some other race or ethnicity 653 1.0 7 .4
Total 68,202 100.0 1,822 100.0 Please indicate your gender. Female 55,726 81.9 1,036 57.0 Male 12,346 18.1 781 43.0
Total 68,072 100.0 1,817 100.0

50
Table 7 Continued What is the highest degree you have attained? Bachelor's 43,951 64.2 3 .2 Master's 22,490 32.9 1,418 77.8 Doctorate 344 .5 177 9.7 Other 1,660 2.4 224 12.3
Total 68,445 100.0 1,822 100.0 Are you certified by National Board for Professional Teaching Standards (NBPTS)? Yes 8,028 11.7 93 5.1 No 60,689 88.3 1,735 94.9
Total 68,717 100.0 1,828 100.0
The Extent of Distributive Leadership in North Carolina
Table 8 displays the frequency distribution with descriptive statistics regarding
components of distributive leadership items in the survey was evaluated. The means and
standard deviations of survey items associated with distributive leadership are computed.
This initial snapshot of distributive leadership across the state shows the extent to which the
different components of distributive leadership, as reported by teachers and principals are
practiced in schools across North Carolina.
Teachers and principals reported that the distributive leadership function, setting
direction, had the highest average mean of 3.7 across all items compared to the other
distributive leadership functions. Managing the instructional program and redesigning
organization were equal with an average mean response of 3.6. Developing people had the
weakest response rate average mean of 2.2 across all items. The item with the highest mean
response of 4.0 was for the item: Opportunities are available for members of the community
to actively contribute to this school’s success. The item with the lowest mean response of 1.9
was for the item: Teachers have a large role in hiring new teachers.

51
It is interesting to note that, on average, over 67% of the respondents either somewhat
agreed or strongly agreed with items related to distributive leadership and setting direction.
On average, over 65% of respondents somewhat agreed or strongly agreed with items related
to redesigning organization. On average, over 57% had either a large role or it was their
primary role in managing the instructional program related to distributive leadership. Lastly,
over 63% of the respondents had a small role or no role at all regarding components of
developing people within distributive leadership components.
Table 8
Survey Results for the Distributive Leadership Functions With Items
Answer Options Strongly Disagree Disagree
Neither Disagree
nor Agree
Agree Strongly Agree M SD
Distributive Leadership: Setting Direction The school leadership consistently supports teachers. 6.3 12.3 11.2 36.3 33.9 3.8 1.2
There is an atmosphere of trust and mutual respect within the school. 8.7 15.3 8.9 39.8 27.3 3.6 1.3
The faculty and staff have a shared vision. 4.5 9.9 14.6 40.8 30.2 3.8 1.1
The school leadership makes a sustained effort to address teacher concerns about empowering teachers. 7.0 12.2 16.1 38.6 26.1 3.7 1.2
The faculty has an effective process for making group decisions and solving problems. 8.0 16.5 13.8 39.4 22.3 3.5 1.2
Teachers are centrally involved in decision making about educational issues. 9.2 18.6 12.1 41.7 18.4 3.4 1.2
Opportunities are available for members of the community to actively contribute to this school’s success.
2.0 5.5 15.9 40.7 36.0 4.0 1.0
Mean for Setting Direction 6.5 12.9 13.2 39.6 27.7 3.7 1.2 Distributive Leadership: Redesigning Organization
Teachers are provided opportunities to learn from one another. 4.4 14.3 10.8 44.7 25.8 3.7 1.1
Adequate time is provided for professional development. 5.9 15.8 14.1 40.8 23.5 3.6 1.2
Teachers have time to collaborate with their colleagues. 11.2 22.3 5.7 39.6 21.2 3.4 1.3
Mean for Redesigning Organization 7.2 17.5 10.2 41.7 23.5 3.6 1.2

52
Table 8 Continued
Answer Options No Role at All
Small Role
Moderate Roll
Large Role
The Primary
Role
Distributive Leadership: Managing Instructional Program
Teachers have a large role in devising teaching techniques. 2.4 9.3 22.7 41.3 24.4 3.8 1.0
Teachers have a large role in setting grading and student assessment practices. 5.5 14.0 24.7 36.6 19.1 3.5 1.1
Teachers have a large role in selecting instructional materials and resources. 3.4 15.2 29.2 37.1 15.1 3.5 1.0
Mean for Managing Instructional Program 3.8 12.8 25.5 38.3 19.5 3.6 1.1 Distributive Leadership: Developing People
Teachers have a large role in deciding how the school budget will be spent. 38.2 31.6 20.2 8.8 1.2 2.0 1.0
Teachers have a large role in hiring new teachers. 48.5 26.9 16.7 7.2 0.8 1.9 1.0
Teachers have a large role in determining the content of in-service professional development programs. 18.0 28.1 31.2 19.3 3.3 2.6 1.1
Mean for Developing People 34.9 28.9 22.7 11.8 1.8 2.2 1.0
Descriptive Statistics: Distributive Leadership Functions and Leadership Effectiveness
Table 9 display the statistical components of the distributive leadership functions
associated from the sample respondents. The mean ranges from 2.2 for Developing People to
3.7 for Setting Direction and the standard deviation ranges from .8 for Developing People to
1.0 for Redesigning the Organization. The skewness of the distribution for each distributive
leadership function ranges from -.67 to .60 and is within acceptable skewness limits between
-.80 and +.80 for normality measures and analyses.
The distributive leadership function setting direction shows that the responses had a
mean of 3.7 (within the likert scale 1 - 5) and standard deviation of 1.0 representing the
spread of responses. The distributive leadership function managing the instructional program
shows that the respondents in this category had a mean of 3.6 and standard deviation of .9.
The distributive leadership function redesigning the organization showed that the respondents

53
had a mean of 3.6 and standard deviation of 1.0. The distributive leadership function
developing people shows the respondent’s data had a mean of 2.2 and standard deviation of
.8.
In representing a combination of all distributive leadership functions, the distributive
leadership index (Table 9), had a mean of 3.6 and standard deviation of .7. The skewness for
distributive leadership index is -.38 within the range of -.80 to +.80 that is an acceptable
range of normality measures and analyses.
Leadership effectiveness is the primary dependent variable for analysis in the study.
Leadership effectiveness is measured by the combining two different indicator questions
from the 2008 NCTWCS into the leadership effectiveness index. The leadership
effectiveness index is a combination of two leadership effectiveness measures with a mean of
3.7 (out of the 5 point likert scale) and standard deviation of 1.1 in representing the spread of
those responses. The skewness measure is -.76 and was within the acceptable range between
-.80 and +.80 for normality measures and analyses.
Table 9 Distributive Leadership Functions and Leadership Effectiveness Descriptive Statistics
N M SD Skewness Distributive Leadership Functions Setting Direction 68,964 3.7 1.0 -.67 Managing Instructional Programt 68,890 3.6 .9 -.46 Redesigning Organization 68,967 3.6 1.0 -.53 Developing People 68,869 2.2 .8 .60
Distributive Leadership Index 68,969 3.6 .7 -.38
Leadership Effectiveness Index 68,951 3.7 1.1 -.76
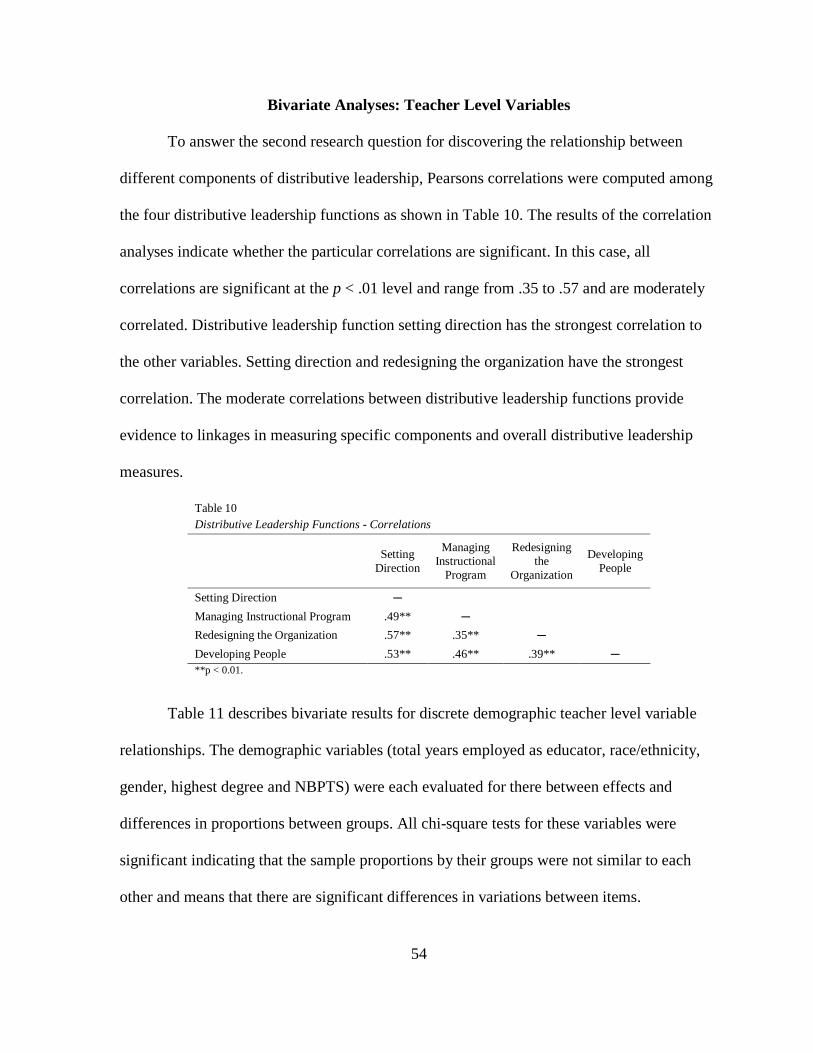
54
Bivariate Analyses: Teacher Level Variables
To answer the second research question for discovering the relationship between
different components of distributive leadership, Pearsons correlations were computed among
the four distributive leadership functions as shown in Table 10. The results of the correlation
analyses indicate whether the particular correlations are significant. In this case, all
correlations are significant at the p < .01 level and range from .35 to .57 and are moderately
correlated. Distributive leadership function setting direction has the strongest correlation to
the other variables. Setting direction and redesigning the organization have the strongest
correlation. The moderate correlations between distributive leadership functions provide
evidence to linkages in measuring specific components and overall distributive leadership
measures.
Table 10 Distributive Leadership Functions - Correlations
Setting Direction
Managing Instructional
Program
Redesigning the
Organization
Developing People
Setting Direction ─ Managing Instructional Program .49** ─ Redesigning the Organization .57** .35** ─ Developing People .53** .46** .39** ─ **p < 0.01.
Table 11 describes bivariate results for discrete demographic teacher level variable
relationships. The demographic variables (total years employed as educator, race/ethnicity,
gender, highest degree and NBPTS) were each evaluated for there between effects and
differences in proportions between groups. All chi-square tests for these variables were
significant indicating that the sample proportions by their groups were not similar to each
other and means that there are significant differences in variations between items.

55
Table 11 also summarized bivariate results for discrete demographic teacher level
variable relationships and distributive leadership functions. All demographic variables (total
years employed as educator, race/ethnicity, gender, highest degree and NBPTS) along with
the four distributive leadership functions were each evaluated for there between effects and
homogeneity of variance. The F-test for the ANOVA analyses between the demographic
variables was significant, except for distributive leadership function redesigning organization
by gender and distributive leadership function setting direction by NBPTS. The significant F-
test indicates measurable differences between the different groups of teachers for those
variables in that the variances are significantly different, not homogeneous. The relationships
relationship between distributive leadership function redesigning organization by gender and
distributive leadership function setting direction by NBPTS is not significant indicating that
the groups are not significantly different from each other.
Table 11 Bivariate Analyses - Independent Demographic Variables and Distributive Leadership Functions
(Teacher Level)
Total Years
Employed as
Educator
Race / Ethnicity Gender
Highest Degree
Attained
NBPTS Certification
Total Years Employed as Educator ─
Race/Ethnicity Χ2 = 317.90** ─
Gender Χ2 = 160.80**
Χ2 = 78.54** ─
Highest Degree Attained Χ2 = 3,078.00**
Χ2 = 170.60**
Χ2 = 398.10** ─
NBPTS Certification Χ2 = 2,365.00**
Χ2 = 227.40**
Χ2 = 152.20**
Χ2 = 1,674.00** ─
Distributive leadership Function: Setting Direction
F = 51.12**
F = 62.67**
F = 64.27**
F = 24.19**
F = 0.05
Distributive Leadership Function: Managing Instructional Program
F = 13.64**
F = 26.00**
F = 72.43**
F = 5.04**
F = 149.26**

56
Table 11 Continued Distributive Leadership Function: Redesigning Organization
F = 49.06**
F = 77.08**
F = 2.21
F = 38.28**
F =
12.34**
Distributive Leadership Function: Developing People
F = 115.37**
F = 16.19**
F = 6.05*
F = 8.65**
F = 112.39**
*p < 0.05. **p < 0.01.
Bivariate Analyses: Principal Level Variables
Table 12 shows summarized bivariate analyses of the discrete demographic principal
level variable relationships. All demographic variables (total years employed as educator,
race/ethnicity, gender, and NBPTS) were each evaluated for there between effects and
differences in proportions between groups. All chi-square tests for these variables were
significant except for total years employed as educator by race, and NBPTS by race.
Significant chi-square test indicates that the sample proportions by their groups were not
similar to each other and means that there are significant differences in variations between
items. The non-significant test indicates that there may be minimal differences across
different groups of principals specifically between race/ethnicity by total years employed as
educator as well as race/ethnicity by NBPTS.
Table 12 Bivariate Analyses - Independent Variables (Principal Level)
Total Years Employed as
Educator
Race / Ethnicity Gender NBPTS
Certification
Total Years Employed as Educator ─
Race/Ethnicity Χ2 = 22.88 ─
Gender Χ2 = 25.06** Χ2 = 15.47* ─
NBPTS Certification Χ2 = 24.95** Χ2 = 1.93 Χ2 = 13.28** —
*p < 0.05. **p < 0.01.

57
Multiple Regressions: Distributive Leadership and Principal Characteristics
Regression models were used to examine the third research question, measuring the
relationship between characteristics of principals and the use of distributive leadership in
schools. The independent variables were demographic characteristics of principals and the
dependent variable was an aggregated (at school level) measured variable of distributive
leadership in schools. The variables were aggregated in that they were a combination of
related categories within a common branch of a hierarchy (i.e. schools) to provide
information at a broader level across North Carolina to that which the individual school
detailed observations were observed.
The means for the four distributive leadership functions and the distributive
leadership index are noted in Table 9 and they all have a range of 1 - 5. Due to the fact that
there were multicollinearity issues with level education of the principal and years of
education, level of education is not included in the regression models. In North Carolina an
advanced degree, master’s, is required to be a practicing administrator causing advanced
levels of degree to be problematic as a variable in the regression equations. Furthermore, the
race/ethnicity variables, except for Black or African American and White, were removed due
to limited sizes of sub-populations that were too small to be used as predictors (see Table 7).
The results of the multiple regression analysis as related to distributive leadership
index and principal characteristics are shown in Table 13. The multiple regression model
with principal characteristics as predictors was significantly related to the distributive
leadership index, R2 = .03, adjusted R2 = .02, F (5, 1806) = 9.35, p < .01. Although
significant, the low R2 value indicates that this model only explains 3% of the variance of

58
distributive leadership. These results suggest that to be a robust model that accurately
predicts distributive leadership, more variables are necessary. Principals who identified as
Black or African American were viewed by teachers as less likely (negative value) to use
distributive leadership than their White colleagues. All other variables were not significant.
The results of the multiple regression analysis as related to distributive leadership
function setting direction and principal characteristics are shown in Table 13. The multiple
regression model with principal characteristics as predictors was significantly related to the
distributive leadership function setting direction, R2 = .03, adjusted R2 = .02, F (5, 1806) =
9.57, p < .01. Although significant, the low R2 value indicates that this model only explains
3% of the variance of distributive leadership suggesting that to be a robust model that
accurately predicts distributive leadership setting direction, more variables are necessary.
Black or African American principals were viewed by teachers as less likely (negative value)
to use the distributive leadership function setting direction than their White colleagues. All
other variables were not significant for the setting direction regression model.
The results of the multiple regression analysis as related to distributive leadership
function managing the instructional program and principal characteristics are shown in Table
13. The multiple regression equation with principal characteristics as predictors is
significantly related to the distributive leadership function managing the instructional
program, R2 = .04, adjusted R2 = .04, F (5, 1806) = 15.42, p < .01. Although significant, the
low R2 value indicates that this model only explains 4 % of the variance of distributive
leadership function managing instructional program. These results suggest that to be a robust
model that accurately predicts distributive leadership function managing instructional

59
program, more variables are necessary. Principals who are Black or African American were
viewed by teachers as less likely (negative value) to use the distributive leadership function
managing instructional program than their White colleagues. Female principals were less
likely to use distributive leadership function managing the instructional program than male
counterparts. All other variables were not significant for managing instructional program.
The results of the multiple regression analysis as related to distributive leadership
function redesigning the organization and principal characteristics are shown in Table 13.
The multiple regression equation with principal characteristics as predictors is not
significantly related to the distributive leadership function redesigning the organization, R2 =
.01, adjusted R2 = .00, F (5, 1806) = 2.01, p > .05.
The results of the multiple regression analysis as related to distributive leadership
function developing people and principal characteristics are shown in Table 13. The multiple
regression equation with principal characteristics as predictors is significantly related to the
distributive leadership function developing people, R2 = .03, adjusted R2 = .03, F (5, 1806) =
10.45, p < .01. Although significant, the low R2 value indicates that this model only explains
3% of the variance of distributive leadership function developing people suggesting that to be
a robust model that accurately predicts distributive leadership function developing people,
more variables are necessary. Principals who identified as Black or African American as well
were viewed by teachers as less likely (negative value) to use the distributive leadership
function developing people than their White colleagues. Female principals were viewed by
teachers as more likely to use the distributive leadership function developing people than
male colleagues. All other variables were not significant in the developing people model.

60
Table 13
Summary of Regression Analysis for Demographic Variables Predicting Distributive Leadership (DLI), Setting Direction
(SD), Managing Instructional Program (MIP), Redesigning the Organization (RO),and Developing People (DP)
DL: Index DLF: SD DLF: MIP DLF: RO DLF: DP
B SE B SE B SE B SE B SE
(Constant) 3.45** .04 3.82** .05 3.66** .04 3.39** .04 2.24** .04
Female .00 .02 .01 .02 -.11** .02 .05* .02 .04* .02
Total Years Employed as Educator: 11 - 20 -.03 .04 -.05 .05 .00 .04 -.01 .04 -.02 .04
Total Years Employed as Educator: 20 + -.02 .04 -.04 .05 .02 .04 -.01 .04 -.03 .04
Black or African American -.15** .02 -.19** .03 -.12** .02 -.06* .03 -.16** .02
NBPTS Certification .00 .04 -.02 .05 .02 .04 -.02 .05 .05 .04
R2 .03 .03 .04 .01 .03
Adjusted R2 .02 .02 .04 .00 .03
F (5,1806) 9.35** 9.57** 15.42** 2.01 10.45**
*p < 0.05. **p < 0.01.
In brief, of the principal characteristics, race is the primary predictor of a principals’
use of different components of distributive leadership functions. Female principals had
predictable effects for use of distributive leadership functions for managing the instructional
program and developing people. Lastly, it is noted that years of experience for principals had
no significant predictive effects for distributive leadership applications.
Hierarchical Linear Model Building
There are three specific steps in developing a two-level hierarchical linear model.
Step one involves specifying the null model or what is commonly called the ‘no predictors
model.’ In the first step, the variance of the within- and between-groups components is
evaluated. This first step determines the amount of variance in leadership effectiveness that
occurs between the schools in the sample. Step two is the specification of the Level 1
components of the multilevel model. For this study, the level 1 components include the

61
teacher level variables. Lastly, the Level 2 model is specified. Level 2 predictors include
principal level variables (Heck, Thomas & Tabata, 2010).
Examination of the Null: Model 1
The null model therefore provides an estimated mean leadership effectiveness score
for all schools and provides variance between Level 1 and Level 2 components. Table 14
displays the model dimensions for the null model related to leadership effectiveness. For this
analysis, the estimation method is restricted maximum likelihood (REML) whereby variance
components were included in estimating the likelihood function (Heck, Thomas & Tabata,
2010). REML estimation has better bias characteristics (Diggle, 1988), handles high
correlations more effectively, and is less sensitive to outliers (Garson, 2009b).
Three hierarchical models were used to examine leadership effectiveness. Table 14
presents the results of the regression models that predict leadership effectiveness. Model 1,
the fully unconditional model or null model (i.e., no teacher and principal variables),
indicates that the grand mean in leadership effectiveness for all schools was 3.75, and that is
represented by an intra-class correlation (ICC) of 13% indicating that the variance in
leadership effectiveness was associated with differences between schools. The ICC described
the proportion of variance common to each school unit. This does not evaluate the variation
associated with the individual teachers within the schools. The ICC explained the amount of
variance in the leadership effectiveness explained by the schools (Hox, 2002).
This intra-class correlation provides a sense of the degree to which differences in the
outcome (leadership effectiveness) exist between Level 2 units (schools). That is, it helps
answer the question of the existence of meaningful differences in outcomes between Level 2

62
units (schools). The results of the null model suggest that the development of a multilevel
model was warranted (not .05 or 5% or lower as a ‘cutoff’). A value higher than 5%
indicated that the school units were more homogeneous in their groupings and responses and
there existed substantial variability between schools (Heck, Thomas & Tabata, 2010).
In the null model, the school variance component was 13% of the total of both
variance components. We would say that the school effect accounted for 13% of the variance
in leadership effectiveness scores between schools, and 87% of variance involved teachers
within schools. We can also say that scores clustered by school, meaning that two teachers
randomly selected from the same school were more likely to have similar scores than a pair
of randomly selected teachers representing different schools (Garson, 2009b).
Examination of the Teacher-Level: Model 2
In this multilevel analysis beginning with model 2 (level 1), an evaluation was made
as to the effects of the independent variables, distributive leadership functions and teacher
demographic information and their effects on the dependent variable, leadership
effectiveness. At this level, the teachers were clustered within schools. School effects (level
2) were analyzed in the next section where the principal factors were also considered.
Model 2 indicates that once we added the variables of interest, teacher level responses
and perceptions of their influence on leadership effectiveness and distributive leadership,
without controlling for other difference between and within schools that teachers are in
schools with principals who have influence. The estimate of the intercept, adjusted for all
parameters is 1.14 (.02). This represents the average school mean adjusted for the teacher

63
parameters. The addition of the teacher variables explained 84% of the between-school
variance and 28% of the within-school variance.
Of the four distributive leadership functions, setting direction was significant (p <
.01) and had the greatest ‘weight’ of impact on leadership effectiveness with a slope intercept
of B = .71 (.01). The distributive leadership function, managing the instructional program,
was significantly related (p < .01) with a slope intercept of B = .01 (.00). The function,
redesigning the organization, as a predictor of leadership effectiveness was not significantly
related (p > .05) as a predictor of leadership effectiveness. The distributive leadership
function, developing people, was significantly related (p < .01) with a calculated slope
intercept of B = -.04 (.01). The negative slope intercept indicates that this function had a
slightly negative effect on predicting leadership effectiveness measures.
Teacher demographic attributes related to leadership effectiveness lend insight into
teachers perception based on their characteristics regarding principals being effective leaders
in schools. Teacher attributes and there predictive ability for leadership effectiveness was
analyzed individually at level 1 of the hierarchical linear model. Teachers’ level of degree,
except for Master’s, and whether they have NBPTS certification are not significant (p > .05)
and do not affect perceptions of leadership effectiveness. In comparison to a teacher with a
bachelor’s degree, Master degree teachers were significantly related (p < .05) with a slope
intercept of B = .02 (.01) to having effects on leadership effectiveness ratings.
Teacher’s years in education compared to first year teachers were significantly related
to leadership effectiveness ratings specifically for those teachers with two to three years of
experience and four to six years of experience. Teachers with 2 - 3 years had a slope intercept

64
of B = .03 (.02) and teachers with 4 - 6 years experience with a slope intercept of B = .04
(.01).
All categories of teachers ethnicity as compared to White teachers were statistically
significant (p < .01) in their effects of leadership effectiveness perception measures albeit
each had a negative slope intercept impact ranging from B = -.10 to -.26. Specifically, Asian /
Pacific Islander had the greatest weight of impact with a slope intercept of B = -.26 (.05).
With all minorities the perceived leadership effectiveness had a downward (negative) impact
on leadership effectiveness measures. It may be concluded that minority teachers generally
view their principal as less effective compared to White teachers.
Female teachers, compared to male teachers were statistically significant (p < .05) in
their perception of effects on leadership effectiveness measures. Specifically, female teachers
tend to perceive leadership effectiveness more positively than male teachers having a slope
intercept of B = 0.02 (0.01) compared to males.
The addition of the within-group predictors, reduces the residual (within-group)
variability (i.e., from 1.12 in the null model to .80 in model 2). This reduction in variance
between the one-way ANOVA (or null) model and the current model can be used to calculate
a reduction in variance estimate (or R2) for the within-school and between-school portions of
the model. For the within-groups portion, this is calculated as .28. This suggests that the
teacher parameters accounted for 28% of the within-school variability in leadership
effectiveness measures. The within-school predictor also affects the residual variability in
intercepts at the school level. In particular, the initial variance component for schools, from
the null model, was 0.17. After the teacher parameters were added, the between-school

65
variance in leadership effectiveness shrinks to .03. The reduction in variance between schools
was .84. This suggests that within-group teacher parameters accounted for 84% of the
between-groups variability in leadership effectiveness in that the variation in means across
schools was attributed to differences in the teacher parameters in those schools. Another way
of looking at this is that the initial variability in leadership effectiveness observed between
schools (i.e., the ICC) was reduced considerable after controlling for teacher parameters. The
ICC was calculated as 3%, which is a reduction from null model of 13% and indicated that
97% of variance involved teachers within schools in model 2. Even after controlling for
teacher parameters within schools, a statistically significant amount of variation in outcomes
still remains both within and between schools (Heck, Thomas & Tabata, 2010). The rejection
of the null hypothesis that there was no significant variation in school means after adjustment
for teacher parameters is still acceptable (Norušis, 2005).
Examination of the Principal-Level: Model 3
In Model 3 principal-level demographic variables were added to analyze and to
explain the variability in intercepts across schools. In this case, the thesis was that principal
demographics would impact the remaining variability in leadership effectiveness measures
between schools. Table 14 suggests that the variance was negligibly affected by adding the
principal characteristics. The estimate of the intercept was unchanged at 1.14 (.02) after the
principal level variables were added to the model. As shown in Model 3, none of the
principal demographic variables were significantly related to leadership effectiveness
measures. Distributive leadership functions and teacher demographic components that were
significant in Model 2 remained significant in model 3 with little, if any, change in estimates.

66
Furthermore, variance in leadership effectiveness between and within-schools was also
unchanged with the addition of the principal demographic variables. The intra-class
correlation coefficient was unchanged at 3%.
Overall, as it relates to the focus of this study, three of the four distributive leadership
functions predict the likelihood that a principal will be perceived as an effective leader. Some
teacher characteristics were related to their perceptions regarding their principals being rated
as effective, specifically as it relates to gender, race and some years of experience.
Table 14 Distributive Leadership, Teacher and Principal Demographic Variables Predicting Leadership Effectiveness
Model 1: Null Model
Model 2: Teacher
Variables
Model 3: Teacher + Principal Variables
Estimate Estimate Estimate
Intercept: Leadership Effectiveness 3.75 (.01)** 1.14 (.02)** 1.14 (.02)**
Teacher Variables Distributive Leadership: Setting Direction .71 (.01)** .71 (.01)** Distributive Leadership: Managing Instructional Program .01 (.00)** .01 (.00)** Distributive Leadership: Redesigning Organization .00 (.00) .00 (.00) Distributive Leadership: Developing People -.04 (.01)** -.04 (.01)** Female .02 (.01)** .02 (.01)* Total Years Employed as Educator: 2 - 3 .03 (.02)* .04 (.02)* Total Years Employed as Educator: 4 - 6 .04 (.01)** .04 (.02)** Total Years Employed as Educator: 7 - 10 .01 (.01) .02 (.02) Total Years Employed as Educator: 11 - 20 .01 (.01) .01 (.02) Total Years Employed as Educator: 20 + -.01 (.01) -.01 (.02) American Indian or Alaska Native -.17 (.04)** -.18 (.04)** Asian or Pacific Islander -.26 (.05)** -.26 (.05)** Black or African American -.14 (.01)** -.14 (.01)** Hispanic -.16 (.03)** -.16 (.03)** Mixed or Multiple -.10 (.03)** -.10 (.03)** Other Race -.10 (.04)** -.10 (.04)** Master’s Degree .02 (.01)* .02 (.01)* Doctorate Degree -.05 (.05) -.05 (.05) Other Degree .01 (.02) .01 (.02) NBPTS Certification .02 (.01) .02 (.01)
Principal Variables Female
-.00 (.04) Total Years Employed as Educator: 11 - 20
.03 (.04)
Total Years Employed as Educator: 20 +
.01 (.04) Black or African American
-.08 (.05)
NBPTS Certification
-.03 (.10)

67
Table 14 Continued
Random Effects Intercept (Variance Between Schools) .17 .03 .03 Random Effects Level 1 (Variance Within Schools) 1.12 .80 .80 Interclass Correlation (Proportion of Variance between Schools .13 .03 .03
Variance in Leadership Effectiveness Between Schools Explained (%) N/A 0.84 0.84
Variance in Leadership Effectiveness Within Schools Explained (%) N/A 0.28 0.28
*p < 0.05. **p < 0.01.
Summary of Results
Analyses of quantitative data collected from the 2008 North Carolina Teacher
Working Conditions Survey attempted to answer the following three research questions:
1. What components of distributive leadership exist in North Carolina schools?
2. What is the relationship between different components of distributive leadership?
3. What characteristics of principals are associated with the use of distributive
leadership in schools?
4. What is the relationship between the teachers' perception of the principal’s use of
distributed leadership and the principal's leadership effectiveness?
Research question one was the initial snapshot of distributive leadership across North
Carolina showing the various ways that distributive leadership components are perceived in
schools. The distributive leadership function setting direction had the highest mean, M = 3.7,
of the distributive leadership functions. Managing the instructional program and redesigning
organization were equal with a mean response of 3.6. Furthermore, it is interesting to note
that, on average, over 67% of the respondents either somewhat agreed or strongly agreed
with items related to distributive leadership and setting direction and on average, over 57%
had either a large role or it was their primary role in managing the instructional program

68
related to distributive leadership. On average, over 65% of respondents somewhat agreed or
strongly agreed with items related to redesigning organization. Lastly, over 63% of the
respondents had a small role or no role at all regarding components of developing people
within distributive leadership components.
Research question two evaluated the relationship between different components of
distributive leadership and the results suggest that teachers who believed that one of the
leadership components existed in their school tended to agree that the other leadership
components existed in their school as well. The results of the correlation analysis indicated
that the particular correlations between the distributive leadership functions were significant
and moderately correlated. The moderate correlations between distributive leadership
functions provide evidence to linkages in measuring specific components and overall
distributive leadership measures. Furthermore, the correlational analyses between the
demographic variables and distributive leadership functions indicate that there were mostly
measurable significant differences between the different groups of teachers and principals.
Research question three addresses the characteristics of principals that are associated
with the use of distributive leadership in schools. The results from Table 13 show that female
principals are less likely compared to male principals, to administer the management of the
instructional program for distributive leadership in schools. Furthermore, when it comes to
developing people in the distributive leadership model, female principals are more likely,
compared to male colleagues, to foster developing people in schools (Table 13).
Black or African American principals were less likely, compared to White principals,
to apply overall distributive leadership, distributive leadership functions setting direction,

69
managing the instructional program, and developing people (Table 13). Overall, Black or
African American compared to White principals were consistent predictors of distributive
leadership components and being Female, compared to male, is a slight predictor of
distributive leadership applications.
Research question four addressed the relationship between the teachers' perception of
the principal’s use of distributed leadership and the principal's leadership effectiveness. All
distributive leadership functions were positively related to leadership effectiveness except the
distributive leadership function redesigning the organization. Distributive leadership function
setting direction was the strongest predictor of leadership effectiveness.
Teachers with certain characteristics were more likely to view their principals as
effective leaders. Generally, teachers with master’s degrees compared to bachelor’s, teachers
with between two and six years of educational experience compared to first year teachers,
and female teachers compared to male teachers were likely to perceive the principal as an
effective leader. Conversely, all categories of teachers’ ethnicity compared to Whites were
less likely to perceive the principal as an effective leader. In regards to leadership
effectiveness and principal characteristics, the level 2 (school level) of the hierarchical linear
model evaluated those relationships and it was determined that those characteristics were not
significantly related to leadership effectiveness measures.

70
CHAPTER 5
Discussion and Conclusions
Introduction
This chapter summarizes the key findings of this study. The purpose of this study was
to understand the relationship between distributive leadership in a school and principal
leadership effectiveness. This chapter reviews the implications of these findings for school
and district leaders. Recommendations for future research on distributive leadership and
leadership effectiveness in North Carolina schools are described as well.
While there is extensive theory on distributive leadership, there are few empirical
studies regarding principals’ actual use of distributed leadership in schools. Furthermore, a
solid research foundation is helpful for assessing distributed leadership applications and
organizational dimensions that enhance positive educational outcomes, such as leadership
effectiveness (Harris, 2005; Woods, 2004). This study provides research information for
narrowing the gap between theory and application.
Key Findings and Theoretical Implications
The findings of the study indicated that some principal attributes are related to
distributive leadership in schools and some teacher attributes are related to perceived
leadership effectiveness. Results add to knowledge related to principals’ use of distributive
leadership and perceived leadership effectiveness. The next sections examine findings and
theoretical implications regarding the extent to which distributive leadership are practiced in
public schools, identify characteristics of principals that are likely to practice distributive

71
leadership, and discuss distributive leadership and its relationships to leadership
effectiveness.
Teacher and Principal Characteristics Regarding Leadership: Gender
Gender was discovered to have a significant relationship with distributive leadership
components and leadership effectiveness. Being female compared to male was a positive
predictor of principal leadership effectiveness. Results in the study suggest significant gender
effects but do not indicate how much of the total variation in teacher perceptions of
leadership effectiveness are explained by gender effects. This suggests that a greater range of
plausible variables must be considered. The gender of the principal as leader and the teacher
as follower are both important (Jantzi and Leithwood, 1996).
Some theorists contend that female leadership styles are assets in light of trends
toward team-based management (Oakley, 2000). Some researchers noted that female
principals attribute noted differences regarding leadership (Fowler, 1991; Kruger, 1996). The
findings indicate that female principals are less likely compared to male principals to
distribute the management of the instructional program. Female principals also are more
likely to develop personnel in schools than male principals. This may be due to female
principals being more affirming of school personnel regarding their personal and professional
development, leading to higher ratings as effective leaders in this area.
Teacher and Principal Characteristics Regarding Leadership: Ethnicity
The effects of ethnicity on leadership practice and effectiveness ratings contribute to
present knowledge. Asian, American Indian, African American, Hispanic, Mixed / Multiple,
and other races of teachers were less likely to perceive their principals as effective as their

72
White peers. Although the study demonstrates that there were differences between Whites
and non-White teachers in their perceptions of leadership effectiveness, it does not explain
why these differences exist. Increased diversity leads to increased problems with
communication and team cohesion. Literature has yet to produce definitive results of the
interaction between multiple factors in leadership identity regarding gender and race
(Richards and Loubier, 2008; Jackson et al., 2003). Some researchers found differences in
orientation toward tasks and various styles of leadership in organizations (Fowler, 1991;
Smith & Piele, 2006).
Different ethnicities teachers and principals provide other experiences and unique
perspectives that affect leadership behavior, such as taking certain types of risks in
performing leadership duties related to distributing leadership. Black or African American
principals were less likely compared to White principals to apply general distributive
leadership functions. Black or African American principals were less likely compared to
White principals to set direction, manage the instructional program, and develop people.
Teacher and Principal Characteristics Regarding Leadership: Experience
Teacher years of education between 2 - 3 and 4 - 6 years compared to first year
teachers were more likely to rate their principal as effective leaders. Also, teachers having a
master’s degree compared to those having a bachelor’s degree were more likely to rate their
principal as effective leaders. The results of this study indicate that there was no single all-
inclusive list of leadership traits for principals. Effective leadership results supported the
theory that leadership, specifically principal leadership, is a multifaceted process that escapes
multiple explanations (Smith & Piele, 2006).

73
Distributive Leadership and Leadership Effectiveness
Distributive leadership is conceptualized into the four functions of setting direction,
developing people, redesigning the organization and managing the instructional program
(Leithwood et al, 2006; Leithwood & Riehl, 2003). The results of this study indicated that
setting direction, developing people and managing the instructional program were related to
leadership effectiveness. Redesigning the organization, which include items related to
opportunities to learn from others and time to collaborate, was not significantly associated
with leadership effectiveness in contrast to the results of the other three functions.
The results provide empirical evidence from a large and representative sample of
schools that distributive leadership is indeed related to leadership effectiveness. The findings
vary from Anderson, et al. (2009), Leithwood, et al. (2006), and Leithwood & Riehl (2003)
in that they involved a sample size from 8 to 180 schools and were mostly qualitative in
nature with mixed use of quantitative data. None of the studies verified the distributive
leadership functions on a large scale across an entire state nor did they make direct,
quantitative connections between distributive leadership and leadership effectiveness.
Distributive Leadership for Setting Direction
The distributive leadership function of setting direction was analyzed and mirrored
Leithwood et al. (2006), indicating components such as having a identified shared vision,
effective group decisions, teachers centrally involved in decision making, and giving teachers
opportunities to contribute. Setting direction had the strongest relationship with leadership
effectiveness. Survey responses and resulting trends across North Carolina indicate that
teachers acknowledged that the faculty and staff members have a shared vision. Over 67% of

74
North Carolina teachers surveyed agreed with items related to setting direction in for sharing
school vision, empowering group decisions, and giving teachers opportunities to contribute
to a school’s success. Results for setting direction support research that fostering acceptance
of a shared and coherent set of group goals occur through strong collegial relationships and
distributive leadership (Leithwood et al., 2006; Neuman & Simmons, 2000; Little, 1990).
Distributive Leadership for Developing People
In regards to the distributive leadership function of developing people, Leithwood et
al. (2006) surmised that this function included the ideology of offering intellectual
stimulation, individual support, and models of appropriate values and practices. Distributive
leaders, in developing people, provide school atmospheres that allow teachers to determine
the content of in-service professional development programs for developing and influencing
the people in the school organization for improving professional group learning and attitudes
(De Dreu & West, 2001; Harris, 2005; Leithwood et al., 2006). The developing people
component had a small, negative relationship with leadership effectiveness.
This component of distributive leadership includes tenants for teachers being part of
deciding the school budget, hiring personnel, and determining the professional development
programs in schools as noted in Wahlstrom and Louis (2008). These components may not be
effectively occurring in schools across North Carolina in that over 63% of the respondents
had almost no role at all regarding components of developing people within distributive
leadership. Many principals may still independently manage the functions of monetary
allocations, the advertising and hiring of staff, and often times determine school professional
development programs.

75
Distributive Leadership for Managing Instructional Program
The distributive leadership function of managing the instructional program had a
weak association with leadership effectiveness. Across North Carolina, teachers
acknowledged having a large role in devising teaching techniques, setting teaching
techniques, assessment practices, and selecting instructional materials in support of the
norms tied to this distributive leadership function (Wahlstrom & Louis, 2008). In North
Carolina, over 57% of teachers noted a large role in managing the instructional program
related to distributive leadership.
The distributive leadership function, as it relates to managing the instructional
program, involves teacher professionalism and cooperation as a way of generating positive
change in schools for distributing expertise by sharing and exposing classroom practices as a
primary component contributing to success in schools (Harris, 2005; Ovando, 1994;
Rosenholtz, 1989). The weak association may be attributed to tenants of professional
learning communities that have yet to be realized or fully implemented across North
Carolina. Professional learning teams that contribute directly to teachers’ management of the
instructional program regarding instructional practices, material selection and assessment
practices (Wahlstrom & Louis, 2008).
Distributive Leadership for Redesigning the Organization
Components of the distributive leadership function of redesigning the organization,
which include teachers having opportunity to learn from another, adequate time for
professional development and time to collaborate, were not significant in its association with
leadership effectiveness. Interestingly, over 65% of teacher respondents agreed that

76
components of redesigning organization were happening across North Carolina. Teachers’
understanding of the components may vary with no degree of standardization and with
different interpretations. Teachers may have opportunities to learn from one another through
cooperative learning opportunities in discussions of assessments, sharing materials, and
analyzing student learning outcomes. Conversely, redesigning the organization might not be
a predictor of leadership effectiveness, since it is more related to the learning environment
teachers create with one another rather than what the principal fosters as a leader. Keeping in
mind that teachers who have specific opportunities to interact with their peers are likely to
influence other teachers and be a part in shared decision making (Harris & Muijs, 2005;
Neuman & Simmons, 2001; Wahlstrom & Louis, 2008).
Practical Implications
As shown in this study, distributive leadership is related to leadership effectiveness.
Increasing policies and activities that influence distributive leadership through professional
development and Master of School Administration (MSA) principal training programs at
colleges and universities would be advantageous developing school leaders. Understanding
teachers’ perceptions of leaders assist administrative decisions and policies that lead to
change within the current school leadership structure. Distributive leadership tenants lack full
implementation, potentially because many principals do not understand distributive
leadership, lack the capability to implement this type of leadership at their school, or think
they are distributing leadership when they really are not. Many principals may conclude that
by simply implementing professional learning teams or putting teachers on committees
constitutes distributive leadership.

77
Distributive leadership theory and its direct application is a relatively new concept in
school leadership, especially in North Carolina schools. However, in recent years there has
been policies implemented that foster similar leadership tenants. The North Carolina
Professional Teaching Standards Commission (NCPTSC) recommends that teachers work
collaboratively in creating professional learning communities for developing goals and
strategies for school improvement and enhancement of teacher working conditions. Within
this professional organization framework and in conjunction with the North Carolina Teacher
Working Condition surveys, distributive leadership strategies and concepts are being fostered
across North Carolina, yet data from this study shows little implementation. As teachers
demonstrate leadership in schools, they can provide input on the school budget, hiring of
staff and selection of professional development (North Carolina Professional Teaching
Standards, 2008). Observing the connections between policies, standards and practices, and
using survey data helps to realize the application of distributive leadership practices in North
Carolina schools.
Because the distributive leadership function of setting direction has such a strong
relationship with leadership effectiveness, it is important to continue to focus on teaching
principals how to craft a vision and align school decisions with vision. Investigating
purposeful activities and natural leadership behaviors are central to understanding leadership
proficiency. Principals across North Carolina who view the overall distribution of leadership
as merely supplemental to their leadership style may result in leadership distribution that is
weakly applied. Principals need to be purposeful in leading by planning distributive norms
and systems of alignment along distributive notions and processes (Mascall et al., 2008).

78
Purposeful planning has the potential to increase leader effectiveness ratings and optimism
among staff surrounding distributive leadership components (Mascall et al., 2008).
Purposeful planning in applying forms of distribution provides more transparency and less
suspicion about leaders, which results in teachers being more engaged with their colleagues
in efforts of school leadership. Being intentional with teachers would foster purposeful
planning for leadership distribution (Mascall et al., 2008). In contrast, when leadership
defines improvement needs mainly as a reaction or on a whim for implementing a new
program or fad, which so often happens in schools, there is less of a collective involvement
of all staff.
Ethnicity makes a difference regarding teachers’ perceptions of leadership
effectiveness. There is a need to determine if race is related to prejudices or school context.
Perhaps non-White principals are placed in situations where it is difficult to be an effective
leader. If research indicates that it is prejudice, then professional development of teachers is
necessary. If it is context, then there is a need to examine principal placement practices. This
area needs to be studied further, especially in North Carolina, because there are a large
number of African American principals. There appears to be no change in this trend for the
foreseeable future.
Understanding distributive leadership, leadership effectiveness and teacher
perceptions and their relationship to one another are critical to understanding and prescribing
distributive leadership in schools. The data analyzed helps guide decision makers and policy
developers regarding principals distributing leadership and how teachers can be leaders. The
theory and empirical results help to create dialogue surrounding leadership effectiveness

79
using distributive leadership. This study adds teachers’ perceptions to the information
educational stakeholders need in order to make appropriate decisions pertaining to advancing
and utilizing distributive leadership within schools and restructuring the administrative
hierarchy. Teacher perceptions are useful when designing and implementing future research
in distributive leadership, teacher leadership and professionalism, education and training,
administrative structuring, and staff development opportunities.
The potential of distributed leadership to contribute to leadership effectiveness is
somewhat intriguing and more research is needed focusing directly on this relationship.
Harris and Muijs (2005) conclude that (a) distributed leadership practices are beginning in
schools, yet are far from being the dominant school leadership configuration, (b) distributed
leadership translates to sharing the most important tasks of schools, and (c) distributed
leadership can synergistically work with more traditional leadership configurations.
Distributed leadership is not likely to prosper, unless those in traditional leadership positions
promote its practice (Harris, 2005).
Principals and other school leaders can benefit from knowing what elements of
distributed leadership impact school leadership effectiveness. School leadership affects the
school improvement processes and reforms. Successful distributive leadership models can
inform administrators on how they can direct financial and personnel resources toward
specific areas of distributive leadership related to setting direction, managing the
instructional program and developing people within a redesigned organization. Many
principals don’t necessarily understand distributive leadership or fear the results of
relinquishing ‘control’ of areas suggested for distribution. Distributive leadership requires

80
that the practice of distributing the four components of setting direction, managing the
instructional program, developing people and redesigning the organization. Understanding
and being philosophically oriented toward these four traits are what is necessary for
leadership distribution to be a reality in schools.
Limitations
An acknowledgement needs to be made regarding the limitations of the study,
specifically as they relate to the use of the survey instrument. The survey used is only an
approximate measure of distributive leadership functions and leadership effectiveness. Better
results may have been realized with the use of an instrument tailored specifically for
measuring distributive leadership and leadership effectiveness.
One difficulty in gaining an accurate measure of distributive leadership functions may
depend on the fact that the original survey instrument was not designed for this purpose.
Confirmatory factor analysis determined four factors similarly associated with the
distributive leadership functions in the 2008 North Carolina Teacher Working Conditions
Survey (NCTWCS). The survey questions ultimately chosen and used were more practical
and in alignment with distributive leadership theory. A stronger connection may have
occurred if a survey instrument was designed to measure distributive leadership functions
and leadership effectiveness to improve construct validity. Furthermore, it is assumed that
teachers’ perceptions are accurately measured in the survey instrument. However, as long as
the extent to which teachers truly believe that surveys are confidential or anonymous the
trustworthiness and hence the accuracy of the measures are seemingly valid.

81
The analyses do not account for other variables that may impact use of distributive
leadership and leadership effectiveness, such as school and community characteristics,
percent of students on free and reduced lunch, and other contextual variables. These
additional characteristics may explain more of the variance in the models. Cases were deleted
when no information on principal variables existed, which may have biased results.
Directions for Future Research
Including measures of contextual variables would provide a richer description of
distributive leadership and leadership effectiveness. Distributive leadership theory may also
benefit from analyzing conditions or school types and size, socioeconomic status, and so
forth that foster or inhibit leadership distribution. Including measures of contextual variable
that may facilitate or impede the implementation of distributive leadership components could
also be included as well as reform movements to see if the presences of certain reforms in
schools influence distributive leadership.
Harris (2003) makes the general claim that ignoring teacher leadership is knowingly
investing in leadership that makes little or no difference in school improvement.
Accomplished school reform and documented student learning, according to Glickman,
Gordon, and Ross-Gordon (2001), are greatly characterized through distributed leadership
within schools. Connecting distributive leadership to student achievement is an important
avenue of research for bringing greater value to distributive leadership and school
improvement. Distributive leadership results in present study and in previous research
harness and enhance talents and knowledge leaders need to create a school climate that
functions effectively (Harris, 2005). If distributive leadership theory is to provide more

82
influence in guiding leadership practices, then results in present study and previous research
help to provide a frame of reference that can inform future practice (Spillane et al, 2004).
Further research needs to move beyond simple leadership measures of effectiveness
to multiple measures of leadership effectiveness and diverse measures. In doing so, the
strength of one measure to assess a particular dimension will offset the weakness of another
measure and the need for multiple sources. The concept of leadership distribution patterns
discovered reflect theory and research, suggesting synchronized styles of leadership
distribution contribute to productive organizations beyond simply leadership effectiveness
measures (Mascall et al, 2008).
This study relies primarily on teacher perceptions. Information and data gathered on
peers of principals and their immediate supervisor would provide valuable insight to
leadership effectiveness measures and distributive leadership application in schools.
Gathering data on actual behaviors exhibited in distributive leadership would be beneficial to
improve the practice of leadership (Spillane et al, 2004). Without knowledge of the teachers’
perceptions, it is unlikely that positive change will occur to make distributive leadership
ideals possible. It is helpful to understand and collect data on what teachers are saying and
thinking about leadership. Evidence from this study contributes to the broader purpose of
defining distributive leadership for its appropriate application in schools, using teacher
perceptions. It is necessary to uncover teacher and principal perceptions of barriers that keep
distributive leadership components from occurring in the school.
Further research is needed to identify problems and issues that inhibit principals from
distributing leadership in schools to teachers in regards to internal politics, leader philosophy,

83
personality, and how these might be addressed. In the review of literature, very little
information was found addressing the history of distributive leadership and leadership
effectiveness. Understanding how teachers’ perceptions of leadership effectiveness are
formed and why certain characteristics such as race and gender are factors are important.
Most empirical research on leadership and many evaluations of leaders and schools rely on
the views of those who experience the leadership (i.e. teachers).
Overcoming the obstacles within the current hierarchical system must also be
examined for involving distributive leadership theory and other collaborative theories as
necessary to bring about the improvements that are not being addressed by traditional
education leadership theories. Follow up qualitative methods can be employed to close the
gap in the relationships and understandings that the methods used here failed to provide.
Case study examples of distributed leadership can provide more explicit details and help
categorize circumstances in which distributed leadership can thrive (Harris, 2005).
This is the first study of its kind to analyze connections between distributive
leadership functions proposed by Leithwood et al. (2006) and leadership effectiveness. Yet,
only three of the four functions of distributive leadership were associated with leadership
effectiveness. Hopefully, other studies and methods will help solidify these traits and their
connections to leadership effectiveness. Certain characteristics of principals were associated
with using certain distributive leadership functions. It would be beneficial to explore why
individuals with these traits favor particular elements of distributive leadership.
Expounding on the distributive leadership model in schools, its perspectivees, and
forms of practice are necessary in order to understand the relationship between distributed

84
leadership and improving organizations. Patterns of distributive leadership are paths to
organizational effectiveness (Leithwood et al, 2006). Interesting findings may be uncovered
by branching out into other areas of the country, specifically urban areas, union states, states
with different requirements for principals, and even international data. Considerations are
needed to replicate the study in different contexts such as urban areas and teacher union
states, due to the fact that there are a limited number of urban areas in North Carolina and it
is a right to work state regarding unions.
The principal and teacher attributes in regards to race, gender, years of education, and
highest degree in respect to distributive leadership are important factors to consider.
Principals and teachers in schools from diverse backgrounds and experience affect
distributive leadership employed in schools. Knowing how these components affect
leadership effectiveness and distributive leadership applications provide insight into the
complex and diverse natures of schools as organizations. The quantitative methods used here
provide insight regarding characteristics and associations with distributive leadership and
leadership effectiveness.
Barriers to distributive leadership related to teacher characteristics and school
dynamics need review. Principal trust in teachers and teachers trust in principals may be
considered as factors contributing to distributive leadership application. Teacher
characteristics may be as important as the principals’ for the implementation of distributive
leadership. As principals grow more comfortable with their roles of modeling and guiding
distributive leadership, teachers as leaders will become more accepting and/or trusting of the
distributive leadership functions in schools. The variables (attributes) used in this study help

85
researchers and practitioners to not only better understand leadership effectiveness but also
distributive leadership tendencies of principals in the school organization.
As with Leithwood and Riehl (2003), this study parallels their findings in that the
principals’ management style, in this case distributive leadership, is related to school
improvement, teamwork, and effectiveness. Exploring evidence of leadership behaviors and
influences associated with core leadership practices, rather than primarily teacher perceptions
and their leadership roles, will help to understand distribution of leadership.
Without continued empirical research, distributive leadership theory may fall away as
many valuable educational concepts do when they are not examined and put to use. Teachers
and administrators must be willing to be scrutinized and possibly be criticized in order to
identify and make the necessary changes needed regarding this structural rearrangement. The
influence of distributed leadership theory is a shift in thinking about leaders and leadership
development. Distributive leadership challenges traditional and individualistic leadership
styles but also reclaims leadership involvement for teachers and other staff in schools. As the
association between distributed leadership and organizational effectiveness becomes more
clear, the essential need for flexible and responsive styles of leadership increases (Fullan,
2001; Harris, 2005; Leithwood and Jantzi, 2000).
It is important to know more detail about what the patterns for leadership distribution
looks like in specific practice. At this time, the description of the practice patterns is
characterized as weakly applied in schools. Work by Spillane et al. (2007) examined ways in
which principals and teachers shared in leading activities, and how the basis of leadership
fluctuate between activities in schools. Principals and teachers need to determine approaches

86
to share leadership through the support of each other in a trusting, mutual environment
(Mascall et al., 2008). The distributive approach may lead to school improvement.
It is important to understand more about effective distributed leadership practice, how
it is fostered and developed. More empirical studies of distributed leadership that cross-
examine the relationships between distributed leadership and school effectiveness are
needed. Distributed leadership theory offers an exciting alternative understanding about
leadership practice with empirical foundations so that it does not become another leadership
theory that proves to be disingenuous or relinquished altogether. Insight gained from this
report can be used to help district and school administrators better understand how effective
school leadership and distributive leadership are perceived. Teacher leadership will not be
the answer to problems of leadership in schools; though further research and development
involving teachers and administrators will help to advance improvements regarding
leadership and redesigning the organization of schools.

87
REFERENCES
Aitkin, M. & Longford, N. (1986). Statistical modeling issues in school effectiveness
studies. Journal of Royal Statistical Society, A(149), 1-43.
Anderson, S. E., Moore, S., & Sun, J. (2009). Positioning the principals in patterns of school
leadership distribution. In K. Leithwood, B. Mascall & T. Strauss (ed.), Distributed
leadership according to the evidence (pp. 111-136). New York: Routledge
Barth, R. S. (2001). Teacher leader. Phi Delta Kappan, 82(6), 443-449.
Bell, L., & Rhodes, C. (1996). The skills of primary school management. London: Routledge.
Benne, K. D., & Sheats, P. (1948). Functional roles of group members. Journal of Social
Issues, 4(2), pp. 41-49.
Blase, J., & Anderson, G. (1995). The micropolitics of educational leadership: From control
to empowerment. London: Cassell.
Bottery, M. (1992). The ethics of educational management. London: Cassell.
Bryk, A. S., & Raudenbush, S. W. (1992). Hierarchical linear models. Newbury Park, CA:
Sage.
Bryk, A. S., & Schneider, B. (2003). Trust in schools: A core resource for school reform.
Educational Leadership, 60(6), 40-44.
Burns, J. M. (1978). Leadership. New York: Harper and Row.
Castro, S. L. (2002). Data analytic methods for the analysis of multilevel questions: A
comparison of interclass correlation coefficients, rwg(j), hierarchical linear modeling,
within- and between-analysis, and random group resampling. The Leadership
Quarterly, 13, 69-93.

88
Chaleff, I. (1995). The courageous follower: Standing up to and for our leaders. San
Francisco: Berrett-Koehler.
Clark, K. E., & Clark, M. B. (1990). Measures of leadership. West Orange, NJ: Leadership
Library of America.
Covey, S. R. (1993). Principle-centered leadership. New York: Simon and Schuster.
Creswell, J. W. (2007). Qualitative inquiry and research design. Thousand Oaks, CA:
Sage.
Csoka, L. S. (1997). Bridging the leadership gap. New York: The Conference Board.
De Dreu, C. K. W., & West, M. A. (2001). Minority dissent and team innovation: The
importance of participation in decision making. Journal of Applied Psychology, 68,
1191-1201.
DeMoss, K. (2002). Leadership styles and high-stakes testing: Principals make a difference.
Education and Urban Society, 35(1), 111-132.
Diggle, P. J. (1988). An approach to the analysis of repeated measurements. Biometrics, 44,
959-971.
Drath, W.H., & Palus, C.J. (1994). Making common sense: Leadership as meaning-making in
a community of practice. Greensboro, NC: Center for Creative Leadership.
Facts and Figures 2008-09. (2008). Retrieved, from
http://www.ncpublicschools.org/docs/fbs/resources/data/factsfigures/2008-
09figures.pdf
Fink, D., & Brayman, C. (2006). School leadership succession and the challenges of change.
Educational Administration Quarterly, 42(1), 62-89.

89
Firestone, W. A. (1989). Using reform: Conceptualizing district initiative. Educational
Evaluation and Policy Analysis, 11(2), 151-165.
Fishbein, M., & Azjen, I. (1975). Belief, attitude, intention, and behavior: An introduction to
theory and research. Reading, MA: Addison-Wesley.
Fowler, W. J., Jr. (1991, April). What are the characteristics of principals identified as
effective by teachers? Paper presented at the Annual Meeting of the American
Educational Research Association, Chicago, IL.
French, J.R.P. Jr., & Snyder, R. (1959). Leadership and interpersonal power. In D.
Cartwright (Ed.), Studies in social power, institute for social research (pp. 118-149).
Ann Arbor, MI: University of Michigan
Fullan, M. G. (2001). Leading in a Culture of Change. San Francisco, CA: Jossey-Bass.
Fullan, M. G. (1997). Change forces. London: Falmer.
Garson, G. D. (2009a). Factor Analysis. Retrieved February 1, 2010, from Statnotes, North
Carolina State University, Public Administration Program Web site:
http://faculty.chass.ncsu.edu/garson/PA765/factor.htm
Garson, G. D. (2009b). Linear Mixed Models. Retrieved February 1, 2010, from Statnotes,
North Carolina State University, Public Administration Program Web site:
http://faculty.chass.ncsu.edu/garson/PA765/multilevel.htm
Garson, G. D. (2010). Multiple Regression. Retrieved March 27, 2010, from Statnotes, North
Carolina State University, Public Administration Program Web site:
http://faculty.chass.ncsu.edu/garson/PA765/regress.htm

90
Gibb, C. A. (1954). Leadership. In G. Lindzey (Ed.), Handbook of social psychology: Vol.
2 (pp. 877-917). Reading, MA: Addison-Wesley.
Gibb, C. A. (1958). An interactional view of the emergence of leadership. Australian
Journal of Psychology, 10(1), 101-110.
Gibb, C. A. (1968). Leadership. In G. Lindzey & E. Aronson (Eds), The handbook of
Social Psychology, 2(4), (pp. 205-283). Reading, MA: Addison-Wesley.
Gilcrhist, V. J. (1992). Key informant interviews. In B. B. Crabtree & W. L. Miller (Eds.),
Doing qualitative research (pp. 70-89). Nebury Park, CA: Sage.
Glickman, C. D., Gordon, S. P., & Ross-Gordon, J. M. (2001). Supervision and
instructional leadership: A developmental approach. Boston, MA: Allyn and
Bacon.
Goleman, D. (2002). The New Leaders: Transforming the art of leadership into the science
of results. London: Little Brown.
Graham, P. (1995). Mary Parker Follett: Prophet of management. Boston, MA: Harvard
Business School.
Green, S., & Salkind, N. (2005). Using SPSS for Windows and Macintosh: Analyzing and
understanding data (4th ed.). Upper Saddle River, New Jersey: Pearson Education,
Inc.
Griffin, G. A. (1995). Influences of shared decision making on school and classroom
activity: conversations with five teachers. Elementary School Journal, 96(1), 29-45.
Gronn, P. (2000). Distributed properties: A new architecture for leadership. Educational
Management Administration Leadership, 28(3), 317-338.

91
Gronn, P. (2008). The future of distributed leadership. Journal of Educational
Administration, 46(2), 141-158.
Harris, A. (2003). Teacher leadership as distributed leadership: Heresy, fantasy or
possibility? School Leadership and Management, 23(3), 313-324.
Harris, A. (2005). Leading or misleading? Distributed leadership and school improvement.
Journal of Curriculum Studies, 37(3), 255-265.
Harris, A. (2008). Distributive leadership: According to the evidence. Journal of Education
Administration, 46(2), 172-188.
Harris, A., & Muijs, D. (2005). Improving schools through teacher leadership. UK: Open
University Press
Heck, R., Thomas, S., & Tabata, L. (2010). Multilevel and longitudinal modeling with IBM
SPSS. New York, NY: Routledge
Hirsch, E., & Church, K. (2009). North Carolina teacher working conditions research brief:
Summary of findings. Retrieved from
http://www.ncteachingconditions.org/sites/default/files/attachments/NC_summ_of_findin
gs.pdf
Hofmann, D. A. (1997). An overview of the logic and rationale of hierarchical linear models.
Journal of Management, 23, 723-744.
Hopkins, D. (2001). School improvement for real. London: Routledge Falmer.
Hox, J. (2002). Multilevel analysis: Techniques and applications. Mahwah, NJ: Lawrence
Erlbaum Associates.

92
Ingersoll, R. (2007). Short on power, long on responsibility. Educational Leadership, 65(1),
20-25.
Jackson, S. E., Joshi, A., & Erhardt, N. L. (2003). Recent research on team and
organizational diversity: SWOT analysis and implications. Journal of Management,
29(6), 801-830.
Jantzi, D., & Leithwood, K. (1996). Toward an explanation of variation in teachers’
perceptions of transformational school leadership. Educational Administration
Quarterly, 32(4), 512-538.
Kaiser, R. B., & DeVries, D. L. (2000) Leadership styles. In W. E. Craighead and C. B.
Nemeroff (Eds.), The corsini encyclopedia of psychology and behavioral science (3rd
ed.). New York: Wiley & Sons.
Katz, R.L., & Kahn, D. (1978). The social psychology of organizing (2nd ed.). New
York, NY: Wiley.
Katzenmeyer, M., & Moller, G. (2001). Awakening the sleeping giant: Helping teachers
develop as leaders. Thousand Oaks, CA: Corwin.
Kim, J., & Mueller, C.W. (1978). Factor Analysis: Statistical methods and practical issues. In
Quantitative Applications in the Social Sciences Series, No. 14. Thousand Oaks, CA:
Sage Publications.
Klein, K. J., & Kozlowski, S. W. (2000). From micro to meso: critical steps in
conceptualizing and conducting multilevel research. Organizational Research
Methods, 3, 211-236.

93
Kouzes, J. M., & Posner, B. Z. (1995). The leadership challenge: How to keep getting
extraordinary things done in organizations. San Francisco: Jossey-Bass.
Kruger, M. L. (1996). Gender issues in school headship: Quality versus power? European
Journal of Education, 31(4), 447-461.
Lambert, L. (1998). Building leadership capacity in schools. Alexandria, VA: Association
for Supervision and Curriculum Development.
Lashway, L. (2006). Distributed leadership. In School leadership: Handbook for excellence
in student learning (pp. 245-265). Thousand Oaks, CA: Corwin.
Lee, V.E. (2000). Using hierarchical linear modeling to study social contexts: The case of
school effects. Educational Psychologist, 35(2), 125-141.
Leithwood, K., Harris, A., & Hopkins, D. (2008, February). Seven strong claims about
successful school leadership. School Leadership and Management, 28(1), 27-42.
Leithwood, K., Leonard, L., & Sharratt, L. (1998). Conditions fostering organizational
learning in schools. Educational Administration Quarterly, 34(2), 243-276.
Leithwood, K., & Jantzi, D. (2000). The effects of different sources of leadership on student
engagement in school. In K. Riley & K. Louis (eds.), Leadership for change and
school reform (pp. 50-66). London, UK: Routledge.
Leithwood, K. & Riehl, C. (2003, April). What do we already know about successful school
leadership? Paper presented at the American Educational Research Association
Annual Conference, Chicago, IL.

94
Leithwood, K., Louis, K. S., Anderson, S., & Wahlstrom, K. (2004). How leadership
influences student learning. Retrieved from
http://www.wallacefoundation.org/WF/KnowledgeCenter/KnowledgeTopics/Edu
cationLeadership/HowLeadershipInfluencesStudentLearning.htm
Leithwood, K., Mascall, B., Strauss, T., Sacks, R., Memon, N., & Yashkina, A. (2006).
Distributing leadership to make schools smarter: Taking the ego out of the system.
Leadership and Policy in Schools, 6(1), 37-67.
Leithwood, K., & Mascall, B. (2008, October). Collective leadership effects on student
achievement. Educational Administration Quarterly, 44(4), 529-561.
Leithwood, K., Mascall, B., & Strauss, T. (2009). Distributed leadership according to the
evidence. New York: Routledge
Little, J. W. (1990). The persistence of privacy: autonomy and initiative in teachers’
professional relations. Teachers College Record, 91(2), 509-536.
Little J. W. (1995). Contested ground: The basis of teacher leadership in two restructuring
high schools. The Elementary School Journal, 96(1), 47-63.
Louis, K. S. (2007). Trust and improvement in schools. Journal of Educational Change,
8(1), 1-24.
Luke, D. A. (2004). Multilevel modeling. Thousand Oaks, CA: Sage Publications, Inc.
Macbeath, J. (1998). Effective school leadership: Responding to change. London: Paul
Chapman.
Macbeath, J. (2001). Many heads improve the broth. The Times Educational Supplement:
School Management (No. 4459), 26.

95
Marsick, V. & Watkins, K. (1990). Informal and incidental learning. London: Routledge.
Mascal, B., Leithwood, K., Straus, T., & Sacks, R. (2008). The relationship between
distributed leadership and teachers’ academic optimism. Journal of Educational
Administration, 46(2), 214-228.
Mayrowetz, D., Murphy, J., Louis, K. S., & Smylie, M. (2007). Distributed leadership as
work redesign: Retrofitting the job characteristics model. International Journal of
Leadership and Policy, 6(1), 69-103.
Miller, R. J., & Rowan, B. (2006). Effects of organic management on student achievement.
American Educational Research Journal, 43(2), 219-253.
Moir, E. (2009). Validity and reliability of the North Carolina teacher working conditions
survey. Retrieved from
http://www.ncteachingconditions.org/sites/default/files/ attachments/validityand
reliability.pdf
Mulford, B., & Moreno, J. M. (2006). Sinking ships, emerging leadership: A true story of
sustainability (or the lack thereof). The Educational Forum, 70, 204-214.
Murphy, J. (2005). Connecting teacher leadership and school improvement. Thousand
Oaks, CA: Corwin.
Neuman, M., & Simmons, W. (2000). Leadership for student learning. Phi Delta Kappan,
82(1), 9-12.
Nias, J., Southworth, G., & Yeomans, R. (1989). Staff relationships in the primary school: A
study of organisational cultures. London: Cassell.

96
North Carolina Professional Teaching Standards Commission. (2008). North Carolina
Professional Teaching Standards. Retrieved from
http://www.ncptsc.org/Final%20Standards%20Document.pdf
Norušis, M. (2005). SPSS 14.0 advanced statistical procedures companion. Upper Saddle
River, NJ: Prentice Hall.
Oakley, J. G. (2000). Gender-based barriers to senior management positions: Understanding
the scarcity of female CEOs. Journal of Business Ethics, 27(4), 3213-3234.
O’Connell, A. A., & McCoach, D. B. (2008). Multilevel modeling of educational data.
Charlotte, NC: Information Age.
Ovando, M. N. (1994). Effects of teacher leadership on their teaching practices. Paper
presented at the annual meeting of the University Council of Educational
Administration, Philadelphia, PA.
Peterson, G., & Beekley, C. X. (1997). School principals' understanding of mutual
Responsiveness in effective leadership. Paper Presented at the Annual Meeting of the
American Education Research Association, Chicago, IL.
Pounder, D. G. (1999). Teacher teams: Exploring job characteristics and work-related
outcomes of work group enhancement. Educational Administration Quarterly, 35(3),
317-348.
North Carolina Department of Public Instruction. (2008). North Carolina public schools:
Statistical profile 2008. Raleigh, NC: Author.
Richardson, A., & Loubier, C. (2008). Intersectionaly and leadership. International Journal
of Leadership Studies, 3(2), 142-161.

97
Ritchie, R., & Woods, P.A. (2007). Degrees of distribution: Towards an understanding of
variations in the nature of distributed leadership in schools. School Leadership and
Management, 27(4), 363-381.
Rosenholz, S. J. (1989). Teachers’ workplace: The social organization of schools. White
Plains, NY: Longman.
Raudenbush, S.W., & Bryk, A.S. (2002). Hierarchical linear models: Applications and data
analysis methods (2nd ed.). Thousand Oaks, CA: Sage.
Schein, E. H. (1988). Organizational psychology. Englewood Cliffs, NJ: Prentice-Hall.
Senge, P. M. (1990). The fifth discipline. New York: Doubleday.
Sergiovanni, T. J. (1990). Value-added leadership: How to get extraordinary performance in
schools. New York: Harcourt Brace Jankovich.
Sergiovanni, T. J. (1994). Building community in schools. San Francisco: Jossey-Bass.
Sergiovanni, T. J. (1996). Moral leadership: Getting to the heart of school improvement. San
Francisco: Jossey-Bass.
Sergiovanni, T. J. (2001). Leadership: What’s in it for schools? London: Routledge Falmer.
Shedd, J., & Bacharach, S. (1991). Tangled hierarchies: Teachers as professionals and the
management of schools. San Francisco: Jossey-Bass.
Sheppard, B. (1996). Exploring the transformational nature of instructional leadership.
Alberta Journal of Educational Research, 42(4), 325-344.
Short, P. M., Greer, J. T., & Melvin, W. M. (1994). Creating empowered schools: Lessons in
change. Journal of Educational Research, 32(4), 38-52.

98
Sickler, J. L. (1988). Teachers in charge: Empowering the professionals. Phi Delta Kappan,
69(5), 354–356, 375–376.
Smith, S. S., & Piele, P. K. (2006). School leadership: Handbook for excellence in student
learning (4th ed.). Thousand Oaks, CA: Corwin.
Smylie, M.A., & Denny, J. W. (1990). Teacher leadership: Tensions and ambiguities in
organizational perspective. Educational Administration Quarterly, 26(3), 235-259.
Somech, A. (2005). Directive versus participative Leadership: Two complementary
approaches to managing school effectiveness. Educational Administration Quarterly,
41(5), 777-800.
Spillane, J. P., Camburn, E. M. and Stitziel Pareja, A. (2007). Taking a distributed
perspective to the school principal’s work day. Leadership and Policy in Schools,
6(1), 103-125.
Spillane, J., Halverson, R., & Diamond, J. B. (2004). Towards a theory of leadership
practice: A distributed perspective. Journal of Curriculum Studies, 36(1), 3-34.
Starratt, R. (1995). Leaders with vision: The quest for school renewal. Thousand Oaks, CA:
Corwin.
Storey, A. (2004). The problem of distributed leadership in schools. School Leadership &
Management, 24(3), 249-265.
Tabachnick, B. G., & Fidell, L. S. (2007). Using Multivariate Statistics (5th ed.). Boston,
MA: Pearson.
Tannenbaum, A. S. (1961). Control and effectiveness in a voluntary organization. American
Journal of Sociology, 67(1), 33-46.

99
Tarter, C. J., Bliss, J. R., & Hoy, W. K. (1989). School characteristics and faculty trust in
secondary schools. Education Administration Quarterly, 25(3), 294-308.
Timperley, H. (2005). Instructional leadership challenge: The case of using student
achievement information for instructional improvement. Leadership and Policy in
Schools, 4(1), 3-22.
Torrington, D., & Weightman, J. (1989). The reality of school management. Oxford:
Blackwell.
Tschannen-Moran, M. (2004). Trust matters: Leadership for successful schools. San
Francisco: Jossey-Bass.
Wahlstrom, K. L., & Louis, K. S. (2008). How teachers experience principal leadership: The
roles of professional community, trust, efficacy, and shared responsibility.
Educational Administration Quarterly, 44(4), 458-495.
Wallace, M. (1991). School centered management training. London: Paul Chapman.
Wallace, M. (2001). Sharing leadership of schools through teamwork: A justifiable risk?
Educational Management & Administration, 29(2), 153-167.
Wech, B. A., & Heck, A. L. (2004). An introduction to hierarchical linear modeling for
marketing researchers. Marketing Bulletin, 15(1), 1-8.
Woods, P. A. (2004). Democratic leadership: Drawing distinctions with distributed
leadership. International Journal of Leadership in Education, 7(1), 3-26.
York-Barr, J., & Duke, K. (2004). What do we know about teacher leadership? Findings
from two decades of scholarship. Review of Educational Research, 74(3), 255-316.

100
Yukl, G. A. (1994). Leadership in organizations (3rd ed.). Englewood Cliffs, NJ: Prentice
Hall.
Yukl, G. (2008). How Leaders influence organizational effectiveness. The Leadership
Quarterly, 19, 708-722.