distributed query processing in sap iq on vmware … · distributed query processing in sap iq on...
TRANSCRIPT
Distributed Query Processing in SAP IQ on VMware vSphere and Virtual SAN Performance Study
T E C H N I C A L W H I T E P A P E R
Distributed Query Processing in SAP IQ
on VMware vSphere and Virtual SAN
Table of Contents
Executive Summary .................................................................................................................................................................................................. 3
Introduction................................................................................................................................................................................................................... 3
Technology Overview ............................................................................................................................................................................................... 3 VMware vSphere .................................................................................................................................................................................................. 3 VMware Virtual SAN ......................................................................................................................................................................................... 4 SAP IQ ...................................................................................................................................................................................................................... 4 Distributed Query Processing ........................................................................................................................................................................ 5
Test Environment ....................................................................................................................................................................................................... 6 Storage Configuration ....................................................................................................................................................................................... 7
Benchmark ................................................................................................................................................................................................................... 9 Workload ................................................................................................................................................................................................................ 9 Performance Metrics ......................................................................................................................................................................................... 9
Results ............................................................................................................................................................................................................................ 9 Power Test ............................................................................................................................................................................................................. 9 Throughput Test ................................................................................................................................................................................................ 10 Resource Utilization........................................................................................................................................................................................... 11
Network Traffic – shared-storage vs. network-transfer .............................................................................................................. 11 Aggregated Virtual Disk I/O ................................................................................................................................................................... 13 CPU Usage Charts ....................................................................................................................................................................................... 13
Deployment Best Practices .................................................................................................................................................................................. 14
Conclusion ................................................................................................................................................................................................................... 15
Appendix A ................................................................................................................................................................................................................. 15 Hardware ............................................................................................................................................................................................................... 16 Software................................................................................................................................................................................................................. 17
References ................................................................................................................................................................................................................... 17
T E C H N I C A L W H I T E P A P E R / 2
Distributed Query Processing in SAP IQ
on VMware vSphere and Virtual SAN
Executive Summary This performance study demonstrates that VMware vSphere® 5.5 with Virtual SAN as the storage backend provides an excellent platform for virtualized deployments of SAP IQ Multiplex Servers.
Each node in the multiplex maps to one virtual machine, making deployment from a common template a simple task. Once these virtual machines have been configured into a cluster, they must all be provided access to shared storage. Virtual SAN fulfills this requirement easily. Every virtual machine hosted in a Virtual SAN cluster has ready access to the Virtual SAN datastore; creating and attaching virtual disks to all virtual machines in the multiplex is easy.
Performance requirements of an analytics workload running an SAP IQ Multiplex Server are easily met by the Virtual SAN datastore. The workload has a read-heavy I/O profile. The read cache portion of the SSD in each disk group holds large portions of the working set; this results in low latency read accesses. Write requests, for intermediate results, are deemed to be complete once they have been written to the write buffer in the SSD. This results in low latency for write operations as well. Low latency provided by SSDs and the ability to serve both read and write requests from data cached in SSDs are the key to the observed outstanding performance.
In summary, VMware vSphere with Virtual SAN storage is an exceptional platform for distributed database applications running on SAP IQ Multiplex Servers.
Introduction VMware vSphere 5.5 is a proven platform on which to deploy distributed and multi-tier applications. Testing shows that SAP IQ [1]—a distributed database platform—virtualizes well by putting individual nodes of a multiplex server on vSphere virtual machines, which are supported by a virtual storage area network (Virtual SAN) that provides a robust backend to ensure all data is accessible from all nodes.
Distributed applications require distributed transaction processing, which speeds up the queries by breaking them into smaller units of work. The results of these units, called intermediate results, are shared among multiple nodes using two methods: shared storage or data transfer over a high bandwidth network connection between nodes. Shared storage is essential in order for all data to be accessible from all nodes. The intermediate results may be shared by placing them in the shared storage space. Data transfer over high bandwidth network connections between nodes is another way to share the intermediate results. In SAP IQ, these modes are achieved using distributed query processing (DQP) [2]. The performance of DQP on shared storage with Virtual SAN and inter-node network data transfer are examined in this paper.
Technology Overview VMware vSphere
VMware vSphere [3] is the industry-leading virtualization platform for building cloud infrastructures. It enables IT to meet service-level agreements (SLAs) for the most demanding business-critical applications, at the lowest total cost of ownership (TCO). Designed for organizations that want to virtualize entire data centers and deliver IT as a service, vSphere includes features for transforming data centers into dramatically simplified cloud computing environments that can deliver the next generation of flexible, reliable IT services. The VMware vSphere hypervisor (ESXi) architecture provides a robust, production-proven, high-performance virtualization layer. It enables multiple virtual machines to share hardware resources with performance that can match (and in some cases exceed) native throughput.
T E C H N I C A L W H I T E P A P E R / 3

Distributed Query Processing in SAP IQ
on VMware vSphere and Virtual SAN
VMware Virtual SAN
Virtual SAN [4][5] is a distributed layer of software that runs natively as a part of the ESXi hypervisor. Virtual SAN aggregates local or direct-attached storage disks of a host cluster and creates a single storage pool that is shared across all hosts of the cluster. Virtual SAN eliminates the need for an external shared storage and simplifies storage configuration and virtual machine provisioning activities. In addition, Virtual SAN supports VMware features that require shared storage, such as high availability (HA), vMotion, and distributed resource scheduling (DRS) for failover.
Disk groups are the basic storage building block in a Virtual SAN. Each disk group consists of an acceleration layer and a capacity layer. The capacity layer can have between 1 and 7 magnetic disks. An SSD makes up the acceleration layer, with 70% of its capacity used as a read cache and the remaining 30% as a write-buffer. Each host that contributes storage to a Virtual SAN cluster can have up to 5 such disk groups.
A Virtual SAN cluster may have between 3 and 32 hosts. The Virtual SAN cluster depicted in Figure 1 consists of 3 hosts. Each host contributes a single disk group consisting of four magnetic disks fronted by a single SSD. The magnetic disk capacity is configured into a single Virtual SAN datastore, which is used to store virtual machine files.
Figure 1. Virtual SAN architecture
For more information, see the VMware Virtual SAN Design and Sizing Guide [4].
SAP IQ
SAP IQ is an intuitive, cost-effective, and highly optimized RDBMS that is fast and efficient for extreme-scale data warehousing and big data analytics [6]. SAP IQ is a distributed application with multiplex nodes, which may have different roles with different capabilities. This is unlike other database cluster architectures, which usually follow either a shared-everything or shared-nothing architecture. The multiplex server configuration can be described as an "asymmetrical cluster." One node is designated as the coordinator; the remaining nodes are query nodes and may be either Readers or Writers. In addition to its role of handling transaction management, the coordinator can also serve as a Reader or Writer in the multiplex.
SAP IQ multiplexes have a hybrid cluster architecture that uses both shared and local storage. The shared IQ store and shared temporary store are common to all servers. The former is used for permanent IQ data and the latter holds shared temporary data for distributed query processing. Each server has its own temporary store and catalog store.
T E C H N I C A L W H I T E P A P E R / 4

Distributed Query Processing in SAP IQ
on VMware vSphere and Virtual SAN
Distributed Query Processing
DQP uses the available memory and CPU resources of all available nodes to process queries. Performance is therefore determined by the overall workload in the cluster as a whole at any given time. In a single run of a long-running query, the work distribution may change over the course of query execution as the load balance changes across worker nodes.
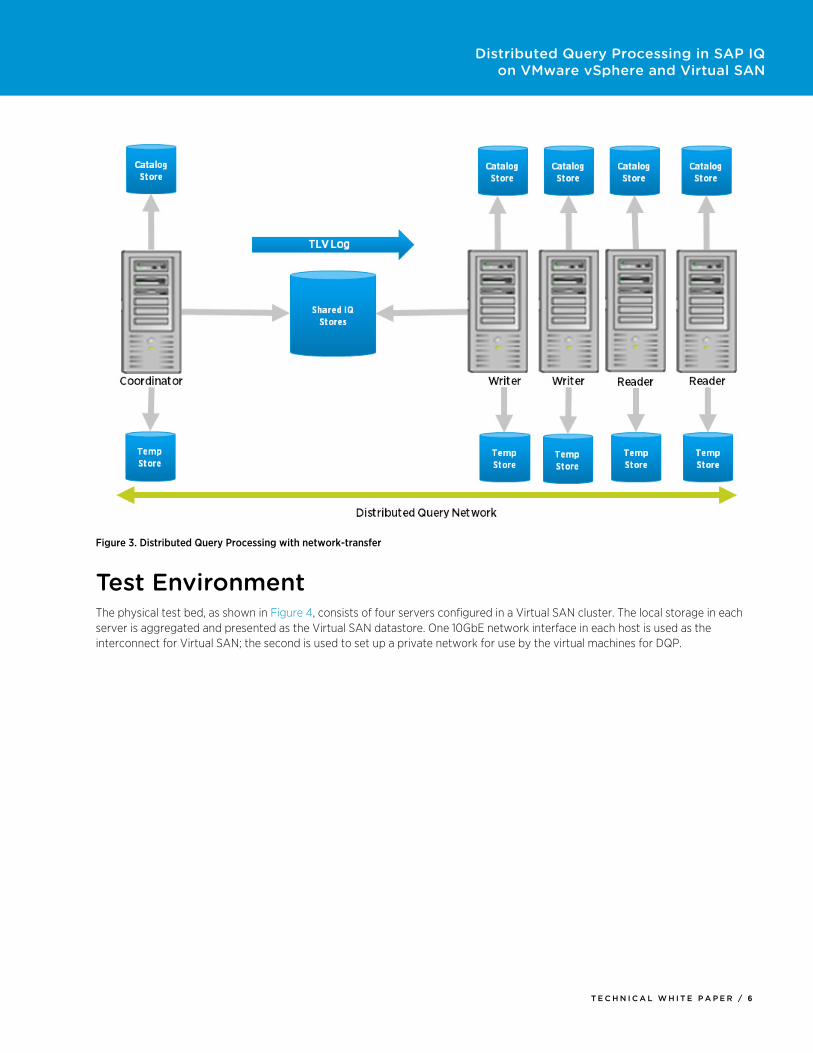
The node at which a query is submitted becomes the leader node for that query, and the remaining nodes assume the worker role. Any node in the cluster can be the leader node; similarly, a worker node is any node that is capable of accepting distributed query processing work. Work is performed by threads running on both the leader and worker nodes, and intermediate results are transmitted between nodes by one of two mechanisms: through a shared disk space, or over an inter-node network.
This paper refers to each mode of distributed query processing as “storage-transfer” and “network-transfer,” and the architectures are shown in Figure2 and Figure 3.
Figure 2. Distributed Query Processing with storage-transfer
T E C H N I C A L W H I T E P A P E R / 5
Distributed Query Processing in SAP IQ
on VMware vSphere and Virtual SAN
Figure 3. Distributed Query Processing with network-transfer
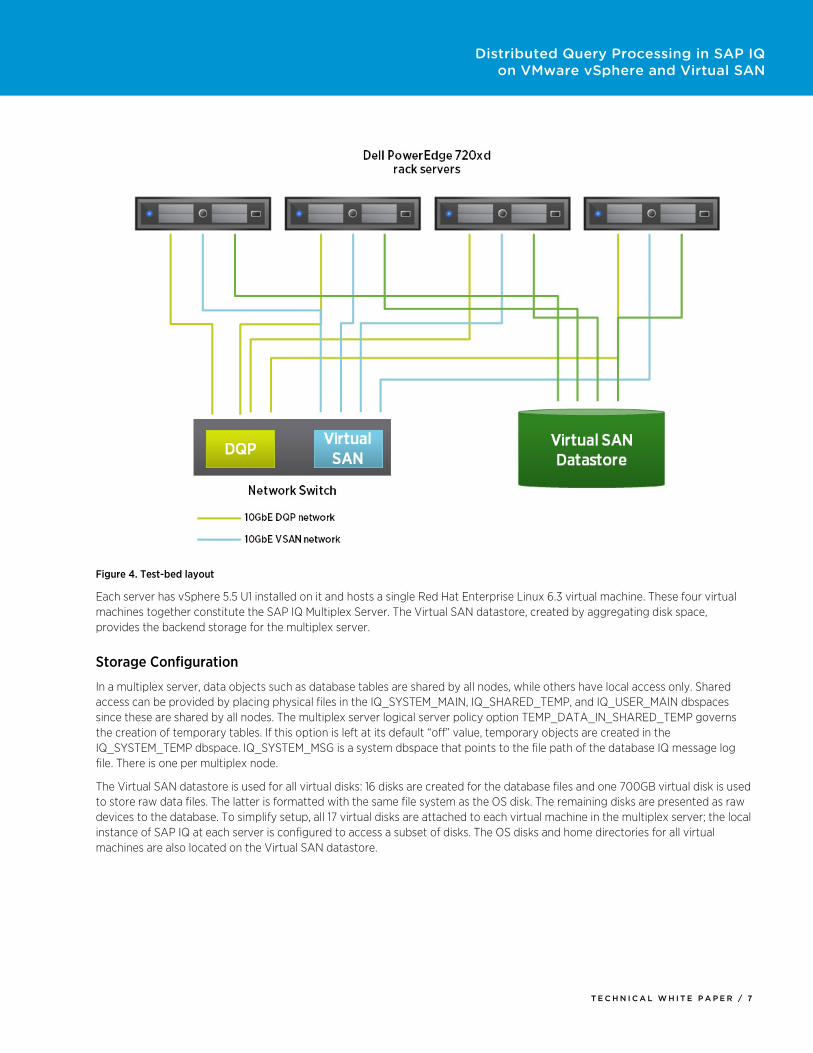
Test Environment The physical test bed, as shown in Figure 4, consists of four servers configured in a Virtual SAN cluster. The local storage in each server is aggregated and presented as the Virtual SAN datastore. One 10GbE network interface in each host is used as the interconnect for Virtual SAN; the second is used to set up a private network for use by the virtual machines for DQP.
T E C H N I C A L W H I T E P A P E R / 6
Distributed Query Processing in SAP IQ
on VMware vSphere and Virtual SAN
Figure 4. Test-bed layout
Each server has vSphere 5.5 U1 installed on it and hosts a single Red Hat Enterprise Linux 6.3 virtual machine. These four virtual machines together constitute the SAP IQ Multiplex Server. The Virtual SAN datastore, created by aggregating disk space, provides the backend storage for the multiplex server.
Storage Configuration
In a multiplex server, data objects such as database tables are shared by all nodes, while others have local access only. Shared access can be provided by placing physical files in the IQ_SYSTEM_MAIN, IQ_SHARED_TEMP, and IQ_USER_MAIN dbspaces since these are shared by all nodes. The multiplex server logical server policy option TEMP_DATA_IN_SHARED_TEMP governs the creation of temporary tables. If this option is left at its default “off” value, temporary objects are created in the IQ_SYSTEM_TEMP dbspace. IQ_SYSTEM_MSG is a system dbspace that points to the file path of the database IQ message log file. There is one per multiplex node.
The Virtual SAN datastore is used for all virtual disks: 16 disks are created for the database files and one 700GB virtual disk is used to store raw data files. The latter is formatted with the same file system as the OS disk. The remaining disks are presented as raw devices to the database. To simplify setup, all 17 virtual disks are attached to each virtual machine in the multiplex server; the local instance of SAP IQ at each server is configured to access a subset of disks. The OS disks and home directories for all virtual machines are also located on the Virtual SAN datastore.
T E C H N I C A L W H I T E P A P E R / 7
Distributed Query Processing in SAP IQ
on VMware vSphere and Virtual SAN
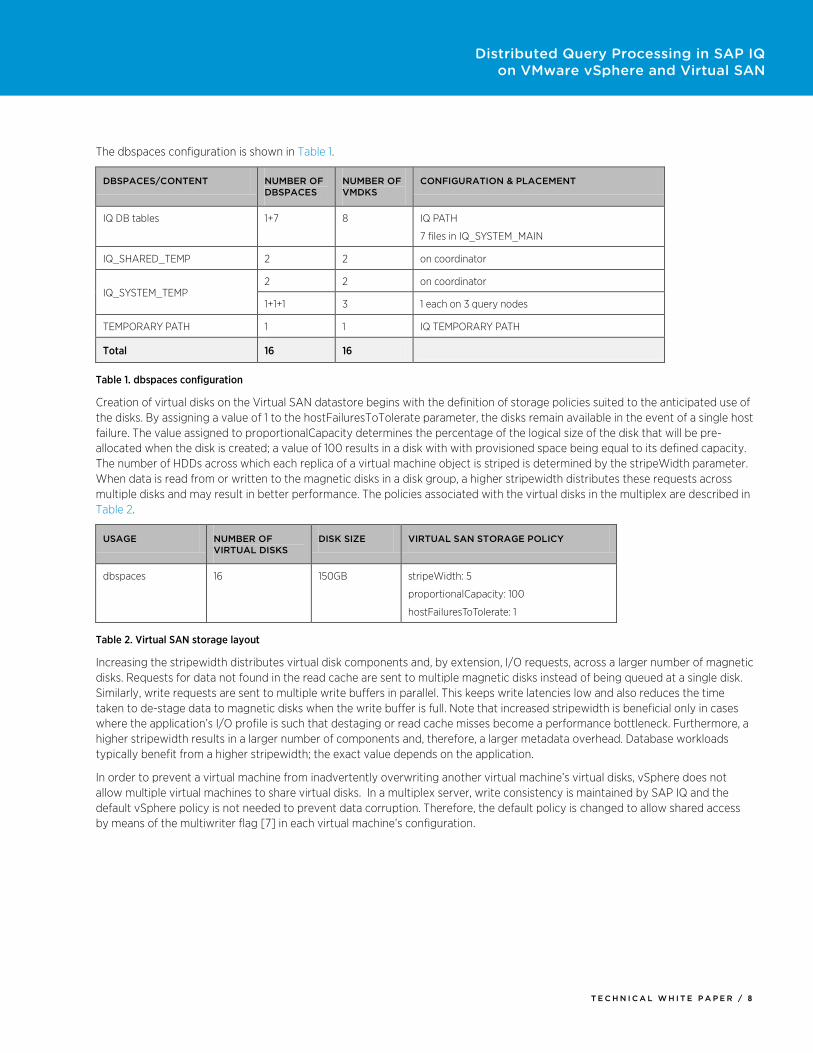
The dbspaces configuration is shown in Table 1.
DBSPACES/CONTENT NUMBER OF DBSPACES
NUMBER OF VMDKS
CONFIGURATION & PLACEMENT
IQ DB tables 1+7 8 IQ PATH
7 files in IQ_SYSTEM_MAIN
IQ_SHARED_TEMP 2 2 on coordinator
IQ_SYSTEM_TEMP 2 2 on coordinator
1+1+1 3 1 each on 3 query nodes
TEMPORARY PATH 1 1 IQ TEMPORARY PATH
Total 16 16
Table 1. dbspaces configuration
Creation of virtual disks on the Virtual SAN datastore begins with the definition of storage policies suited to the anticipated use of the disks. By assigning a value of 1 to the hostFailuresToTolerate parameter, the disks remain available in the event of a single host failure. The value assigned to proportionalCapacity determines the percentage of the logical size of the disk that will be pre-allocated when the disk is created; a value of 100 results in a disk with with provisioned space being equal to its defined capacity. The number of HDDs across which each replica of a virtual machine object is striped is determined by the stripeWidth parameter. When data is read from or written to the magnetic disks in a disk group, a higher stripewidth distributes these requests across multiple disks and may result in better performance. The policies associated with the virtual disks in the multiplex are described in Table 2.
USAGE NUMBER OF VIRTUAL DISKS
DISK SIZE VIRTUAL SAN STORAGE POLICY
dbspaces 16 150GB stripeWidth: 5
proportionalCapacity: 100
hostFailuresToTolerate: 1
Table 2. Virtual SAN storage layout
Increasing the stripewidth distributes virtual disk components and, by extension, I/O requests, across a larger number of magnetic disks. Requests for data not found in the read cache are sent to multiple magnetic disks instead of being queued at a single disk. Similarly, write requests are sent to multiple write buffers in parallel. This keeps write latencies low and also reduces the time taken to de-stage data to magnetic disks when the write buffer is full. Note that increased stripewidth is beneficial only in cases where the application’s I/O profile is such that destaging or read cache misses become a performance bottleneck. Furthermore, a higher stripewidth results in a larger number of components and, therefore, a larger metadata overhead. Database workloads typically benefit from a higher stripewidth; the exact value depends on the application.
In order to prevent a virtual machine from inadvertently overwriting another virtual machine’s virtual disks, vSphere does not allow multiple virtual machines to share virtual disks. In a multiplex server, write consistency is maintained by SAP IQ and the default vSphere policy is not needed to prevent data corruption. Therefore, the default policy is changed to allow shared access by means of the multiwriter flag [7] in each virtual machine’s configuration.
T E C H N I C A L W H I T E P A P E R / 8
Distributed Query Processing in SAP IQ
on VMware vSphere and Virtual SAN
Benchmark Workload
SAP IQ is designed to efficiently handle data warehousing and big data analytics. In order to effectively gather business-critical statistics for this platform, an industry-standard benchmark was chosen: the TPC-H Benchmark™ (TPC-H). This benchmark consists of a suite of business-oriented, ad-hoc queries and concurrent data modifications. The queries and the data populating the database have been chosen to have broad industry-wide relevance. This benchmark illustrates decision support systems that examine large volumes of data, execute queries with a high degree of complexity, and give answers to critical business questions [8].
Key parts of this benchmark were used in this performance investigation. Since the tests were not run in full compliance with the benchmark specifications and have not been audited, test data should not be compared with any published results.
Performance Metrics
Benchmark disclosure rules require publication of a number of metrics, each of which covers a different aspect of performance. The power and throughput metrics are the primary means of quantifying performance. Since this is a fixed-work benchmark, time taken to complete tests, supplemented with resource usage data, is an effective way to characterize performance and compare different configurations.
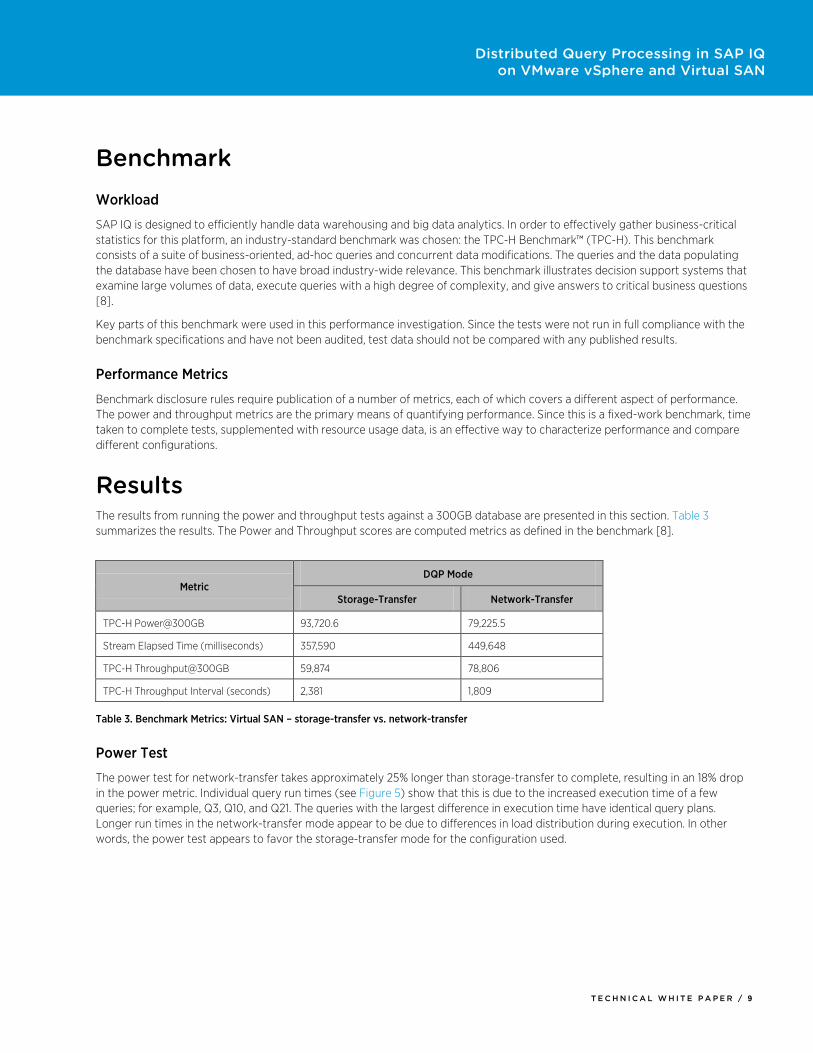
Results The results from running the power and throughput tests against a 300GB database are presented in this section. Table 3 summarizes the results. The Power and Throughput scores are computed metrics as defined in the benchmark [8].
Metric DQP Mode
Storage-Transfer Network-Transfer
TPC-H Power@300GB 93,720.6 79,225.5
Stream Elapsed Time (milliseconds) 357,590 449,648
TPC-H Throughput@300GB 59,874 78,806
TPC-H Throughput Interval (seconds) 2,381 1,809
Table 3. Benchmark Metrics: Virtual SAN – storage-transfer vs. network-transfer
Power Test
The power test for network-transfer takes approximately 25% longer than storage-transfer to complete, resulting in an 18% drop in the power metric. Individual query run times (see Figure 5) show that this is due to the increased execution time of a few queries; for example, Q3, Q10, and Q21. The queries with the largest difference in execution time have identical query plans. Longer run times in the network-transfer mode appear to be due to differences in load distribution during execution. In other words, the power test appears to favor the storage-transfer mode for the configuration used.
T E C H N I C A L W H I T E P A P E R / 9

Distributed Query Processing in SAP IQ
on VMware vSphere and Virtual SAN
Figure 5. Power Test: Comparison of query runtimes
Throughput Test
The workload in this test consists of concurrent streams of queries designed to emulate a multi-user scenario. Benchmark metrics show that network-transfer outperforms storage-transfer in this test. The throughput test takes 31.6% less time to complete in the case of network-transfer. There are several reasons why this is not surprising.
Consider the read-heavy I/O profile of this workload. When data is read from magnetic disks in each disk group, it is cached in the SSD in the disk group. Since 70% of SSD capacity is reserved for the read cache, a significant amount of data is quickly placed in very low latency storage. Once it is warmed up, I/O requests are served from the read cache.
Intermediate results are generated at each node as it processes query fragments assigned to it. These results are shared with other nodes in one of two ways, depending on the distributed query processing (DQP) mode. The I/O profile in this case is a mix of read and write. In the storage-transfer mode, data is written to a shared-access file on disk. Write operations are considered complete when data is written to the write buffer in the SSD layer of Virtual SAN – this is the remaining 30% of a disk group’s SSD. As a result, write latencies are low. The destination server reads them from this location. In the network-transfer mode, data is simply transferred to the destination node over the private 10GbE DQP interconnect between the nodes in the multiplex server. The I/O profile in this DQP mode is read-only at the worker nodes and a read-write mix at the leader node. In both cases, caching in the SSD layer is beneficial. The network-transfer mode has higher throughput because it uses network resources in the system to handle intermediate results transfer. In other words, it maintains the Virtual SAN read-cache advantage and does not have the overhead of writing intermediate, shared results to disk.
0
10
20
30
40
50
60
70
1 2 3 4 5 6 7 8 9 10 11 12 13 14 15 16 17 18 19 20 21 22
Tim
e (s
econ
ds)
Query #
storage-transfer
network-transfer
T E C H N I C A L W H I T E P A P E R / 1 0
Distributed Query Processing in SAP IQ
on VMware vSphere and Virtual SAN
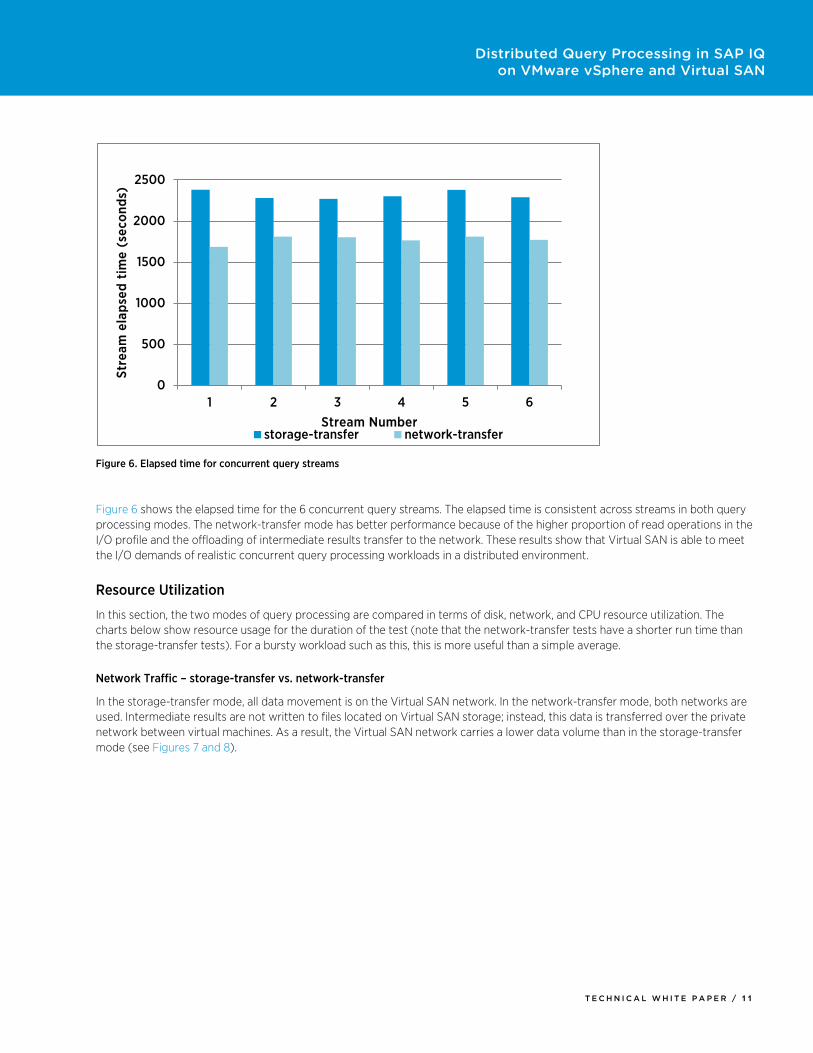
Figure 6. Elapsed time for concurrent query streams
Figure 6 shows the elapsed time for the 6 concurrent query streams. The elapsed time is consistent across streams in both query processing modes. The network-transfer mode has better performance because of the higher proportion of read operations in the I/O profile and the offloading of intermediate results transfer to the network. These results show that Virtual SAN is able to meet the I/O demands of realistic concurrent query processing workloads in a distributed environment.
Resource Utilization
In this section, the two modes of query processing are compared in terms of disk, network, and CPU resource utilization. The charts below show resource usage for the duration of the test (note that the network-transfer tests have a shorter run time than the storage-transfer tests). For a bursty workload such as this, this is more useful than a simple average.
Network Traffic – storage-transfer vs. network-transfer
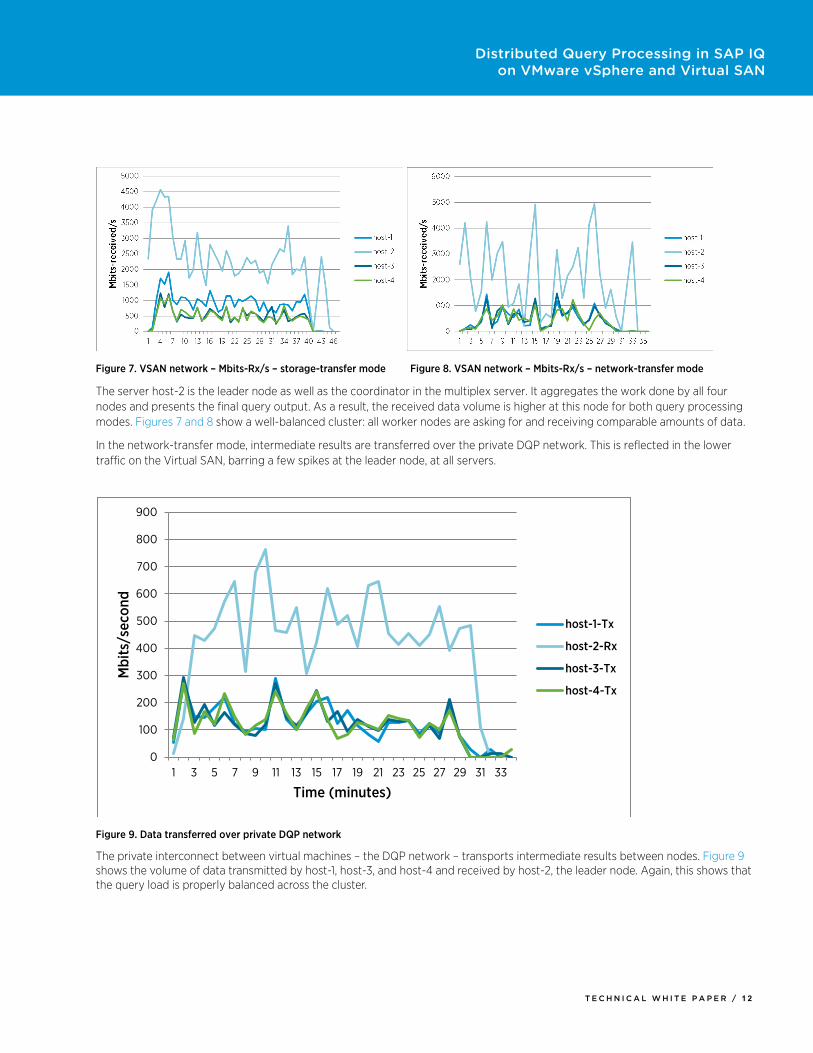
In the storage-transfer mode, all data movement is on the Virtual SAN network. In the network-transfer mode, both networks are used. Intermediate results are not written to files located on Virtual SAN storage; instead, this data is transferred over the private network between virtual machines. As a result, the Virtual SAN network carries a lower data volume than in the storage-transfer mode (see Figures 7 and 8).
0
500
1000
1500
2000
2500
1 2 3 4 5 6
Stre
am e
laps
ed t
ime
(sec
onds
)
Stream Number storage-transfer network-transfer
T E C H N I C A L W H I T E P A P E R / 1 1
Distributed Query Processing in SAP IQ
on VMware vSphere and Virtual SAN
Figure 7. VSAN network – Mbits-Rx/s – storage-transfer mode Figure 8. VSAN network – Mbits-Rx/s – network-transfer mode
The server host-2 is the leader node as well as the coordinator in the multiplex server. It aggregates the work done by all four nodes and presents the final query output. As a result, the received data volume is higher at this node for both query processing modes. Figures 7 and 8 show a well-balanced cluster: all worker nodes are asking for and receiving comparable amounts of data.
In the network-transfer mode, intermediate results are transferred over the private DQP network. This is reflected in the lower traffic on the Virtual SAN, barring a few spikes at the leader node, at all servers.
Figure 9. Data transferred over private DQP network
The private interconnect between virtual machines – the DQP network – transports intermediate results between nodes. Figure 9 shows the volume of data transmitted by host-1, host-3, and host-4 and received by host-2, the leader node. Again, this shows that the query load is properly balanced across the cluster.
0
100
200
300
400
500
600
700
800
900
1 3 5 7 9 11 13 15 17 19 21 23 25 27 29 31 33
Mbi
ts/s
econ
d
Time (minutes)
host-1-Tx
host-2-Rx
host-3-Tx
host-4-Tx
T E C H N I C A L W H I T E P A P E R / 1 2
Distributed Query Processing in SAP IQ
on VMware vSphere and Virtual SAN
Aggregated Virtual Disk I/O
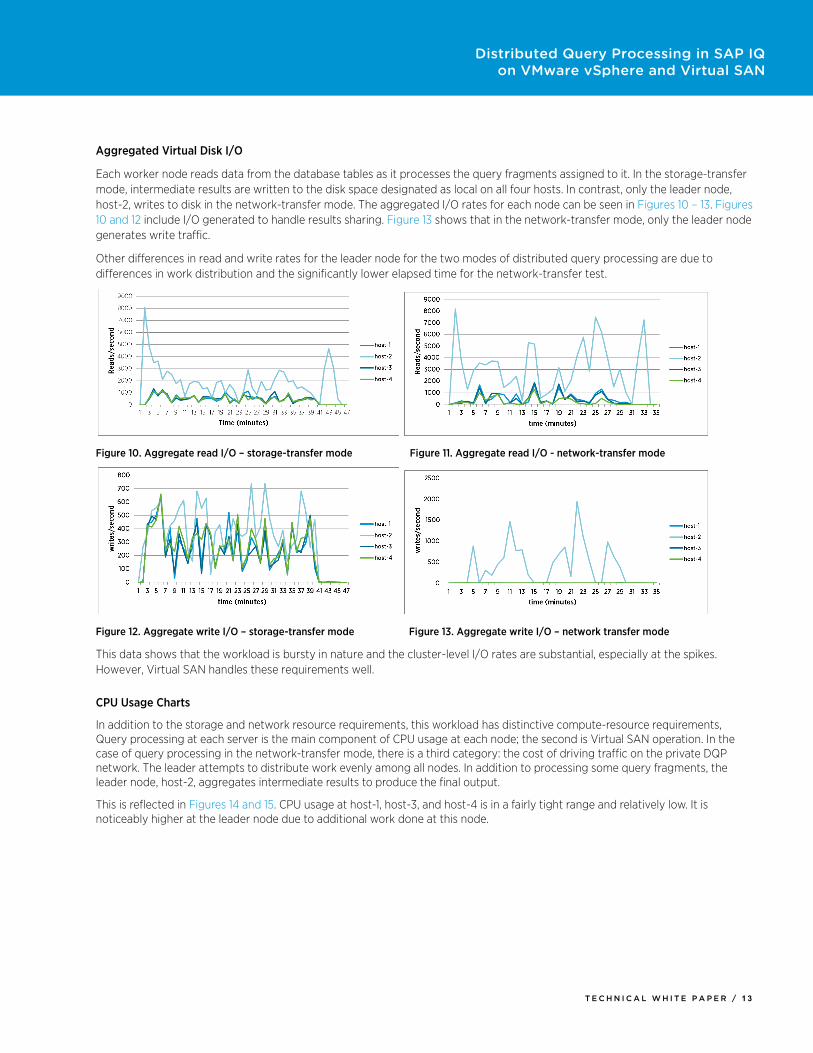
Each worker node reads data from the database tables as it processes the query fragments assigned to it. In the storage-transfer mode, intermediate results are written to the disk space designated as local on all four hosts. In contrast, only the leader node, host-2, writes to disk in the network-transfer mode. The aggregated I/O rates for each node can be seen in Figures 10 – 13. Figures 10 and 12 include I/O generated to handle results sharing. Figure 13 shows that in the network-transfer mode, only the leader node generates write traffic.
Other differences in read and write rates for the leader node for the two modes of distributed query processing are due to differences in work distribution and the significantly lower elapsed time for the network-transfer test.
Figure 10. Aggregate read I/O – storage-transfer mode Figure 11. Aggregate read I/O - network-transfer mode
Figure 12. Aggregate write I/O – storage-transfer mode Figure 13. Aggregate write I/O – network transfer mode
This data shows that the workload is bursty in nature and the cluster-level I/O rates are substantial, especially at the spikes. However, Virtual SAN handles these requirements well.
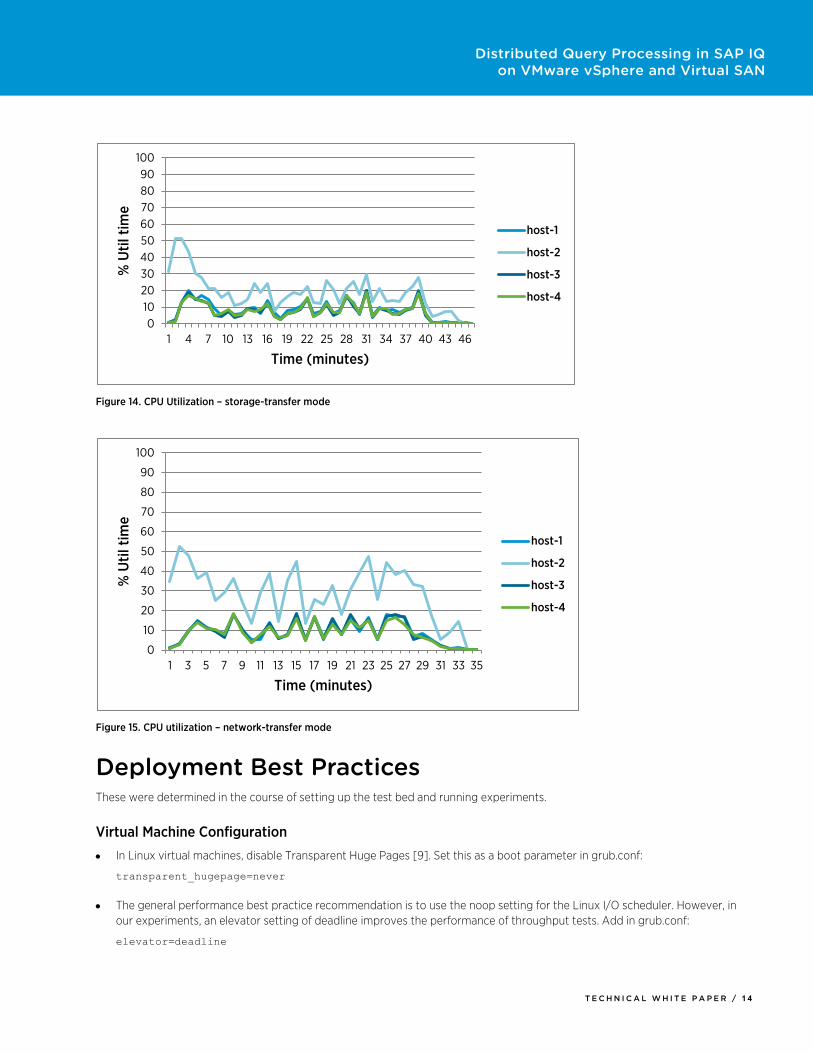
CPU Usage Charts
In addition to the storage and network resource requirements, this workload has distinctive compute-resource requirements, Query processing at each server is the main component of CPU usage at each node; the second is Virtual SAN operation. In the case of query processing in the network-transfer mode, there is a third category: the cost of driving traffic on the private DQP network. The leader attempts to distribute work evenly among all nodes. In addition to processing some query fragments, the leader node, host-2, aggregates intermediate results to produce the final output.
This is reflected in Figures 14 and 15. CPU usage at host-1, host-3, and host-4 is in a fairly tight range and relatively low. It is noticeably higher at the leader node due to additional work done at this node.
T E C H N I C A L W H I T E P A P E R / 1 3
Distributed Query Processing in SAP IQ
on VMware vSphere and Virtual SAN
Figure 14. CPU Utilization – storage-transfer mode
Figure 15. CPU utilization – network-transfer mode Deployment Best Practices These were determined in the course of setting up the test bed and running experiments.
Virtual Machine Configuration
• In Linux virtual machines, disable Transparent Huge Pages [9]. Set this as a boot parameter in grub.conf:
transparent_hugepage=never
• The general performance best practice recommendation is to use the noop setting for the Linux I/O scheduler. However, in
our experiments, an elevator setting of deadline improves the performance of throughput tests. Add in grub.conf:
elevator=deadline
0102030405060708090100
1 4 7 10 13 16 19 22 25 28 31 34 37 40 43 46
% U
til ti
me
Time (minutes)
host-1
host-2
host-3
host-4
0
10
20
30
40
50
60
70
80
90
100
1 3 5 7 9 11 13 15 17 19 21 23 25 27 29 31 33 35
% U
til ti
me
Time (minutes)
host-1
host-2
host-3
host-4
T E C H N I C A L W H I T E P A P E R / 1 4

Distributed Query Processing in SAP IQ
on VMware vSphere and Virtual SAN
• For VMware Tools installation, use the --clobber-kernel-modules flag to replace the kernel version of the VMXNET3 and PVSCSI drivers with the VMware versions of the modules:
./vmware-install.pl --clobber-kernel-modules=vmxnet3,pvscsi
• Increase queue depth for PVSCSI adapters in the virtual machine to reduce the impact on the latency of bursty I/O traffic [10].
SAP IQ Configuration
• Performance was better with hash-partitioning but required slightly higher cache settings. In particular, the setting for the startup switch iqlm should be increased for the database load phase.
• Increase the value of multiplex configuration parameters Mpx_Max_Connection_Pool_Size and Mpx_Work_Unit_Timeout for better performance.
Virtual SAN Configuration
• For optimum distribution of disk component objects, define policies to include the parameter proportionalCapacity and set it to the maximum value of 100.
• Set stripe sizes higher than the default of 1 in the policy associated with virtual disks.
• To minimize background reconfiguration activity, create larger disks first, followed by the disks of smaller size.
Conclusion The results of this investigation demonstrate the advantages of deploying analytics workloads with Virtual SAN as the backend storage. SAP IQ Multiplex Server was used as the database management system and key components of the TPC-H benchmark were used as the workload. The large volumes of data processed by analytics workloads often challenge the capabilities of storage backends. Virtual SAN is uniquely positioned to take advantage of these workloads because of the read-heavy I/O profile. This is because the read cache in the SSD fronting disk groups is able to retain large portions of an application's working-set, resulting in efficient query processing. Another challenge stems from the fact that the database tables are shared by all nodes in the SAP IQ cluster. This is especially important in the case of Virtual SAN where data objects may be located on disks at any of the nodes in the Virtual SAN cluster. Experiments show that the query load is evenly distributed across the nodes in the cluster. An additional determinant of performance is the handling of intermediate results. SAP IQ's network-transfer distributed query processing mode further increases the query-processing capability of the Virtual SAN cluster by shifting the shared data disk traffic from Virtual SAN to the network. In summary, the performance characteristics of Virtual SAN and its ease of deployment make it an excellent storage backend for deploying distributed database applications using SAP IQ Multiplex Server.
T E C H N I C A L W H I T E P A P E R / 1 5

Distributed Query Processing in SAP IQ
on VMware vSphere and Virtual SAN
Appendix A Hardware
The test bed consists of 4 identical servers, as shown in Table 4.
Table 4. Hardware specifications
The storage at all four servers is configured into a Virtual SAN cluster, as shown in Table 5.
Table 5. Storage specifications
The infrastructure components in the test bed are shown in Table 6.
Table 6. Switch specifications
SERVER KEY COMPONENTS
4 x
Dell PowerEdge R720xd 2 x Intel Xeon E5-2690 2.90GHz
384GB RAM
10GbE NIC: Broadcom NetXteme II 57810 10GbE Dual Port
One port each for SAP IQ traffic and Virtual SAN traffic
PERC H310 Integrated RAID Controller
Internal disk storage: See Storage specifications table below
STORAGE DESCRIPTION
Virtual SAN storage Internal storage per server
• 10 x 900GB 10K RPM SA SCSI 6Gbps 2.5in Hot-plug Hard Drive
• 2 x 200GB Solid State Drive SAS 6Gbps 2.5in Hot-plug Hard Drive
Virtual SAN configuration • Disk group: consists of 1 SSD backed by 5 magnetic disks
• Disk groups per server: 2
HARDWARE DESCRIPTION
Network Switch Arista 7124SX 10Gb switch; 24 ports
T E C H N I C A L W H I T E P A P E R / 1 6

Distributed Query Processing in SAP IQ
on VMware vSphere and Virtual SAN
Software
The software application component and description are shown in Table 7.
Table 7. Software specifications
References [1] SAP SE. (2013, November) Administration: Multiplex: SAP Sybase IQ 16.0 SP03.
http://infocenter.sybase.com/help/topic/com.sybase.infocenter.dc01839.1603/doc/pdf/iqmpx.pdf
[2] SAP SE. (2013, December) SAP IQ 16.0 SP03 documentation. http://infocenter.sybase.com/help/topic/com.sybase.infocenter.help.iq.16.0.3/doc/html/title.html
[3] VMware, Inc. (2014) VMware vSphere Documentation Release 5.5. http://www.vmware.com/support/pubs/vsphere-esxi-vcenter-server-pubs.html
[4] VMware, Inc. (2014, March) VMware Virtual SAN Design and Sizing Guide, V 1.0.
https://www.vmware.com/files/pdf/products/vsan/VSAN_Design_and_Sizing_Guide.pdf
[5] VMware, Inc. (2014) Virtual SAN Support Center. http://www.vmware.com/support/virtual-san.html
[6] SAP SE. (2014) SAP IQ. http://www.sap.com/pc/tech/database/software/sybase-iq-big-data-management/index.html
[7] VMware, Inc. (2014, Aug) Disabling simultaneous write protection provided by VMFS using the multi-writer flag (1034165). http://kb.vmware.com/kb/1034165
[8] Transaction Processing Performance Council. TPC-H. http://www.tpc.org/tpch/
[9] SAP Community Network. (2013, April) Does IQ support huge pages on Linux x86-64? http://scn.sap.com/thread/3338917
[10] VMware, Inc. (2014) Large-scale workloads with intensive I/O patterns might require queue depths significantly greater than Paravirtual SCSI default values (2053145). http://kb.vmware.com/kb/2053145
APPLICATION COMPONENT DESCRIPTION
Hypervisor - ESXi vSphere 5.5 U1
Virtual Machines Guest Operating System: RHEL 6.3
Virtual Hardware Version: 10
14 vCPU; 96GB RAM
DBMS SAP Sybase IQ 16, SP03
T E C H N I C A L W H I T E P A P E R / 1 7

Distributed Query Processing in SAP IQ on VMware vSphere and Virtual SAN
Authors Priti Mishra, VMware Inc.
Chris Baker, SAP Inc.
Acknowledgements This work was done with the help and support of:
Julie Brodeur, VMware Inc.
Courtney Claussen, SAP Inc.
Mark Mumy, SAP Inc.
Andrew Neugebaur, SAP Inc.
Aravind Pavaluri, VMware Inc.
Bing Tsai, VMware Inc.
VMware, Inc. 3401 Hillview Avenue Palo Alto CA 94304 USA Tel 877-486-9273 Fax 650-427-5001 www.vmware.com Copyright © 2014 VMware, Inc. All rights reserved. This product is protected by U.S. and international copyright and intellectual property laws. VMware products are covered by one or more patents listed at http://www.vmware.com/go/patents. VMware is a registered trademark or trademark of VMware, Inc. in the United States and/or other jurisdictions. All other marks and names mentioned herein may be trademarks of their respective companies. Item: EN-001567-00 Comments on this document: http://communities.vmware.com/docs/DOC-27533