distribution and abundance of wolves in minnesota, …files.dnr.state.mn.us › ... › wildlife ›...
TRANSCRIPT
DISTRIBUTION AND ABUNDANCE OF WOLVES IN MINNESOTA, 2012-13 John Erb and Barry Sampson, Minnesota Department of Natural Resources At the time wolves were federally protected in the mid-1970’s, Minnesota contained the only known reproducing wolf population in the lower 48 states, except for that on Isle Royale. Over the years, much attention has been focused on studying and monitoring Minnesota’s wolves. Research efforts began in the mid-1930’s (Olson 1938) and with few lapses continue to this day. Efforts to delineate wolf distribution and enumerate populations have also been made at various times over the last 50 years (Erb and DonCarlos 2009). Early estimates of Minnesota’s wolf population, often derived from bounty records and anecdotal information, were by necessity more subjective. With the advent of radio-telemetry, geographic information systems (GIS), and global positioning systems (GPS), more detailed monitoring and mapping of wolf populations has been possible. However, financial and logistical considerations often limit intensive monitoring to small study areas. Enumerating elusive carnivore populations over large areas remains a difficult task, particularly in forested landscapes (Kunkel et al. 2005). Complete territory mapping (Fuller and Snow 1988, Burch et al. 2005) is usually not possible over large areas, though various sampling designs can be considered (Potvin et al. 2005). Use of standard mark-recapture methods may not be practical given the difficulties of capturing and recapturing sufficient samples. However, genetic mark-recapture methods have recently been applied to wolves (Marucco et al. 2009) but may also be impractical over large areas. Population estimation approaches based on prey or habitat assessments (e.g., Fuller 1989, Boyce and Waller 2003, Cariappa et al. 2011) may be useful for estimating potential abundance of large carnivores but may not always match realized abundance due to other time-varying factors (e.g., disease, weather, lagged responses to changes in prey). Newer aerial sampling methods (Becker et al. 1998, Patterson et al. 2004) exist but may be logistically challenging when applied to broad expanses of dense forest. Initial evaluation of these aerial snow-tracking methods in Minnesota was not promising. Further evaluation may be needed, including a cost-benefit analysis, but many assumptions of the method appear difficult to meet in Minnesota’s forested landscape with moderate to high deer abundance. Since the late 1970’s, Minnesota has monitored its statewide wolf population using an approach that combines attributes of territory mapping with an ad hoc approach to determine the total area occupied by pack wolves. The methods employed have changed only slightly during this time. Previous surveys were conducted at 10-year intervals from 1978 - 1998 and at approximately 5-year intervals thereafter. Results indicated a geographically and numerically expanding population through the 1997-98 survey, with little geographic expansion from 1998 to 2007 (Erb and DonCarlos 2009). These results have been coarsely consistent with separate wolf population trend indicators (annual scent station survey, winter track survey, and number of verified depredations) in Minnesota. In 2012, wolves in the Great Lakes Distinct Population Segment were removed as a listed species under the federal Endangered Species Act. This happened to coincide with the normally scheduled (every 5 year) wolf survey and is also consistent with the survey timeline specified in the Minnesota Wolf Management Plan (first and fifth year after delisting; Minnesota Department of Natural Resources 2001). This report summarizes the results of the 2012-13 winter survey.
METHODS The approach we used to delineate wolf distribution and estimate population size was essentially identical to the previous 4 surveys (Fuller et al. 1992, Berg and Benson 1998, Erb and Benson 2004, Erb 2008), and conceptually similar to the 1978-79 survey (Berg and Kuehn 1982). Primary cooperators were similar to previous surveys and included natural resources staff within: 1) Minnesota Department of Natural Resources (DNR); 2) U.S. Forest Service; 3) U.S. Fish and Wildlife Service; 4) U.S. Department of Agriculture -Wildlife Services; 5) U.S. Geological Survey; 6) Tribal and Treaty resource authorities; 7) County Land Departments; 8) Camp Ripley Military Facility; 9) Voyageurs National Park; 10) University research projects; and 11) forest product companies. We mailed instructions and data-recording forms to participants in October 2012. We asked participants to record a location and group size estimate for all wolf sign (visual, track, scat) observed during the course of normal work duties from November 2012 until snowmelt the following spring (~ mid-May 2013). Although participants could record locations on forms or maps then provided to us for later data entry, for this survey we developed a web-based GIS survey application to allow participants to directly enter observations online. Although recorded wolf group size estimates are not used in any calculations, the assessment of township-specific wolf occupancy, as discussed below, treats observations of single wolves differently than pack (>1 wolf) detections. We conservatively assumed group size to be 1 in situations where sign was recorded but no group size data was noted. If group size was recorded as ‘numerous’, it was set to 2 (i.e., a pack). We then combined this database with wolf observations recorded on the DNR 2012 carnivore scent station survey and the DNR 2012-13 furbearer winter track survey. Locations of verified wolf depredations from 2012 as well as locations of wolves harvested during the regulated wolf season were also utilized for purposes of delineating total wolf range, but are not used in any calculations of townships currently occupied by wolf packs (i.e., they are treated the same as single wolves). The combined database is hereafter referred to as ‘WISUR 13’. As in previous surveys, we used the township (~ 93 km2, with some exceptions) as the spatial scale for classifying wolf observations. Delineation of both total range and occupied range includes, but is not limited to, consideration of whether townships meet human and road density criteria outlined by Fuller et al. (1992) (i.e., townships within wolf range are presumed to be occupied by wolves if road density is < 0.7 km/km2 and human density is < 4/km2, or if road density is < 0.5 km/km2 and human density is < 8/km2; hereafter termed ‘modeled’ townships). As in previous surveys, human density was calculated using the most recent (i.e., 2010) U.S. Census Data as incorporated into the 2010 Minor Civil Divisions GIS layer produced by the Minnesota Legislative Coordinating Commission. Road density calculations are based on the Minnesota Department of Transportation’s 1:24,000 GIS roads layer (excluding ‘forest roads’) and summarized within each township as the number of kilometers of road per km2. Delineation of total wolf range is intended to encompass those areas within the state where consistent or sufficient wolf detections occur (either singles or packs) more than might be expected from ‘random’ temporally-irregular dispersals. Total wolf range depicts the coarse distribution of wolves within the state and is useful for documenting larger-scale expansions or contractions of wolf range. Although Minnesota’s wolf range has expanded south and west since the 1970’s, it has remained essentially contiguous with the Canadian border to the north and Lake Superior and Wisconsin to the east. Because systematic searches for wolf sign are
not conducted and much of the southern and western periphery of wolf range in Minnesota is private land, there is some subjectivity in the approach used to delineate the south and west boundary. Using the previously delineated boundary as the reference point, we delineated the south and west border based on the following data: 1) all WISUR ‘13 observations; 2) modeled townships; 3) land use and cover; and 4) knowledge of wolf activities in the area since the last survey (e.g., wolf depredation sites). While maintaining a contiguous total wolf range, the overall approach is designed to maximize inclusion of areas with consistent (since last survey) or recently abundant wolf observations and modeled townships, while minimizing inclusion of areas that neither fit the model nor contained numerous or consistent wolf observations. We computed occupied range by subtracting from the total range all townships that neither contained observations of a pack (defined as >1 animal) nor fit the human/road density model criteria. We also fully excluded lakes larger than 200 km2 (n=5) from calculations of both total and occupied range. With 1 partial exception, we delineated territories of radio-collared packs using minimum convex polygons (MCP). For 1 pack, we excluded a large area within the MCP that GPS data clearly indicated was not used. Prior to delineating wolf pack territories, we removed ‘outlier’ radiolocations using the following guidelines, though subjective deviations were made in some cases as deemed appropriate: 1) for wolves with ~ weekly VHF radiolocations only, locations > 5 km from other locations were excluded as extraterritorial forays (Fuller 1989); 2) for GPS collared wolves with temporally fine-scale movement information, we removed obvious movement paths if the animal did not travel to that area on multiple occasions and if use of the path would have resulted in inclusion of obviously unused areas in the MCP. In past surveys where the majority of territories were delineated using VHF radiolocations, territory sizes were increased 37% to account for the average amount of interstitial space between wolf pack territories as estimated from several Minnesota studies (Fuller et al. 1992:50) where the number of radiolocations per pack typically averaged 30-60. Interstitial spaces are a combination of small voids created by landscape geometry and wolf behavior, but are much more likely to be an artifact of territory underestimation when there are comparatively sparse radiolocations. Hence, for packs with < 100 radiolocations (n=17; mean number of radiolocations = 40), we multiplied each estimated territory size by 1.37 as in the past. For packs with > 100 radiolocations (n = 19; mean number of radiolocations = 2,082), territories were assumed fully delineated and not re-scaled. To estimate the number of packs within occupied wolf range, the area of occupied range is divided by average scaled territory size. The estimated number of packs is then multiplied by average mid-winter pack size to produce an estimate of pack-associated wolves, which is then divided by 0.85 to account for an estimated 15% lone wolves in the population (Fuller et al. 1992:46, Fuller et al. 2003:170). Specifically, N = ((km2 of occupied range/mean scaled territory size)*mean pack size)/0.85. Using the accelerated bias-corrected percentile method (Manly 1997), the population size confidence interval (90%) was generated from 99,999 bootstrapped re-samples of the pack and territory size data, and does not incorporate uncertainty in estimates of occupied range or percent lone wolves. In addition to the survey outlined above, a questionnaire was mailed to wildlife managers at each DNR Division of Wildlife office within or near wolf range asking them to provide an informal
assessment of the status and trend (since 2007) in wolf numbers within their respective management areas. In past surveys, questionnaires were mailed to all survey participants, whereas in this survey DNR Area Wildlife Managers were asked to develop one collective response for their work area after consulting with other appropriate natural resources field staff with overlapping work areas. Where appropriate, a work area could be subdivided in to 2 -3 subunits with different wolf trend responses. Separate questionnaires were also provided to tribal biologists. Responses were geographically plotted using the centroid of the local area to which the response applied. While data from the questionnaires is not quantitatively incorporated into estimation of wolf abundance or distribution, it does provide an overview of the perceptions of field personnel regarding regional status of wolves within Minnesota’s wolf range. RESULTS A total of 2,898 opportunistic wolf sign observations were recorded during the 2012-13 winter survey (Figure 1, Table 1). Observations consisted of 61% tracks, 9% visuals, 4% scats, and 26% other (howls, deer kills, depredation sites, harvest locations, etc.). Distribution We evaluated potential shifts in total wolf range by examining available information near the southern and western edge of the previously-delineated wolf range boundary. Data we considered included WISUR ‘13 observations, revised human and road density estimates within townships, current land use and cover, wolf harvest locations and depredation sites, and other knowledge of wolf activity in peripheral areas since 2007. After considering the totality of information, we concluded that sufficient data existed to extend the previous wolf range line in several areas along the southern and western periphery, the first such extension since the 1997 survey. Revised total wolf range was estimated to be 95,098 km2, an increase of 7.6% from 2007. Twenty-six, or approximately 1% of the WISUR ’13 observations remained outside of the revised wolf range. After removing townships that neither met model criteria nor contained pack observations, estimated occupied range was 70,579 km2 (Fig. 1), 1% below results from the 2007 survey (Table 1). Of the total estimated occupied range, 70% was confirmed to be occupied based on pack detection in the township and 30% was presumed to contain packs because of low human and road density (i.e., modeled townships; Table 1). Thirty-one percent of the township area in which wolf packs were confirmed from field observations had higher human or road density than the thresholds in the road-human density model previously developed, the highest percent since surveys began (Table 1). Pack and Territory Size We obtained territory and winter pack size data from 34 radio-marked wolf packs (Figure 2). Two additional wolf packs had adequate radiolocation data to delineate territories, but we were unable to obtain mid-winter pack counts. Using scaled territory sizes for all packs combined, collared pack territories represented ~ 8% of occupied wolf range. A land cover comparison using the 2006 National Land Cover Database suggests that land cover within territories of radio-marked packs used in the survey was representative of land cover throughout the entirety of occupied wolf range in Minnesota (Table 2). Deer density estimates are not available at the scale of wolf pack territories. However, if we apply spring
deer density estimates from the larger deer permit areas within which the wolf territories were situated and weight by the number of radio-marked wolf packs within the permit area, average 2012 spring deer density in radio-marked wolf pack territories was ~ 4.2 deer/km2. In comparison, spring deer density for the entire forest zone of Minnesota, a close approximation of wolf range, was ~3.9 deer/km2 in spring 2012. Hence, we believe the location of radio-marked wolf packs provided a reasonable representation of overall wolf range with respect to deer density and land cover. After applying the ‘interstitial scaling factors’ discussed in the Methods, average territory size for radio-marked packs was 161.13 km2, ~ 13% larger than the average scaled territory size from the last 2 surveys (~ 140 km2; Table 1). Average pack size has slowly declined through time and was 12% smaller than in winter 2007-08, with an estimated average mid-winter pack size of 4.29 in winter 2012-13 (Table 1). Wolf Numbers Dividing estimated occupied range (70,579 km2) by average territory size (~161.13 km2) results in an estimate of 438 wolf packs in Minnesota (Table 1), 13% fewer packs than in winter 2007-08. Multiplying by average pack size (4.29) and accounting for an estimated 15% lone wolves yields a population point estimate of 2,211 wolves, or 3.1 wolves per 100 km2 of occupied range. The 90% confidence interval ranges from 1,652 wolves to 2,640 wolves. Questionnaire Responses A total of 32 responses were collected in the 2012-13 survey. For those who responded to the question of local population trend since the last survey, increasing, stable, and decreasing wolf numbers were perceived by 28, 56, and 16% of these respondents, respectively (Table 1, Figure 3). Although the majority of respondents indicated a stable local population, the percent of respondents that indicated increasing local populations was lower than in any of the previous 4 surveys, though more respondents perceived increasing numbers than decreasing numbers (Table 1). Compared to the previous survey (40, 58, and 2%, respectively), a higher proportion of respondents perceived the local population to be declining (16% versus 2%). Most offices that perceived increasing numbers of wolves were located along the southern and western periphery of wolf range, while 4 of the 5 offices that perceived declining numbers were in the north-central tier of Minnesota’s wolf range (Figure 3). DISCUSSION Although total wolf range had remained relatively stable for the past 15 years, available information since the 2007 survey indicates that wolf range has expanded in several areas along the southern and western periphery. In these areas, we repositioned the wolf range line after considering multiple data sources, resulting in an approximate 8% increase in wolf range to 95,098 km2. Although much of the area of expansion was not concluded to be occupied by packs, and hence not included as occupied range, abundant or consistent confirmations have occurred in these areas since the last survey. It is also likely that wolves remain under-detected by survey participants in these areas during winter due to private ownership of much of the land. For example, combining data from the last 3 surveys, one area of western Minnesota (previously considered outside wolf range) has recorded only 5 wolf observations (2 during the current survey), yet 10 wolves were harvested (on private land) during this year’s wolf season and an additional 4 farms had verified wolf depredations.
Although our re-assessment resulted in an increase of ~ 8% in total wolf range, the area estimated to be occupied by wolf packs remained similar to the 2007 survey. Occupied wolf range has fluctuated between ~ 68,000 and 74,000 km2 over the last 4 surveys. Because the survey relies on opportunistic wolf sign observations, effort across surveys likely varies as a result of fluctuations in the number of personnel able to contribute wolf sign observations or the number of hours spent afield by survey participants. Hence, we can’t rule out sampling variation as the cause of the slight changes in the estimate of occupied range, though changes in wolf demographics likely contribute to the fluctuations as well. Since 1998, there has been no consistent increasing or decreasing trend in the amount of occupied range. Because 30% of the townships were deemed occupied based on ‘low’ human/road density alone (i.e., not pack detections), it remains possible that occupied range could be overestimated. However, in a majority of cases a lack of pack detections likely reflects a lack of sampling effort rather than a lack of wolves. Some wolves occupy remote areas (e.g., the BWCAW) and are unlikely to be opportunistically detected, and notable amounts of private land, particularly in the southern and western portion of the range, are also unlikely to be opportunistically surveyed. Stated differently, pack detection probability is undoubtedly less than 1 in most areas. Finally, while prey- or habitat-based models have some potential to overestimate occupancy at any given time, the 1988-89 human/road density model (Fuller et al. 1992) utilized in our methodology has generally been a conservative descriptor of wolf ‘habitat’ in Minnesota. The percentage of township area containing pack observations but not conforming to the 1988-89 road-human density model has increased since the 1988-89 survey (17%), reaching 31% in the 2012-13 survey. From 1988 to 2003, wolf pack territory sizes declined in Minnesota, then showed little change when territory size was again estimated during the 2007 wolf survey. While numerous factors can influence territory size, we believe 2 largely explain this pattern. First, expanding wolf populations (or portions thereof) that compose a significant number of colonizing packs have been shown to exhibit declines in average pack territory size as the population becomes more established or saturated (Fritts and Mech 1981, Hayes and Harestad 2000), a characterization that applies to the Minnesota wolf population from early recovery up to approximately 2003. Second, territory size is negatively correlated with prey density (Mech and Boitani 2003, Fuller et al. 2003), and Minnesota’s deer population exhibited an increasing trend during much of wolf recovery in Minnesota. However, since 2007 Minnesota’s forest zone deer population is estimated to have declined by 25% (Grund and Walberg 2012) and moose, albeit present only in a portion of wolf range, have declined by 65% (DelGiudice 2013). We believe that reduced prey density largely explains the 13% increase in wolf pack territory size we observed during the 2012-13 wolf survey, the first such increase in territory size since surveys began. Average mid-winter pack size as estimated from radio-marked packs was ~ 4.3, down 12% from 4.9 in 2007 and the lowest since surveys began. Fuller et al. (2003) estimated the average reported pack size for wolf populations preying primarily on deer to be 5.66, though many of the populations analyzed were from protected or expanding wolf populations. Pack size may decline for a variety of biological or anthropogenic factors that modify survival, recruitment, or immigration/emigration rates. Although the correlation between winter pack size and prey density is not as strong as the prey density – wolf territory size correlation, prey density certainly has an influence on pack size particularly via changes in pup survival (Fuller et al. 2003) and the observed decline in prey biomass may have contributed to the decline in average pack size. Furthermore, the 2011-12 winter preceding the current wolf survey was one of the mildest on record, with average winter temperatures the warmest in the last 100 years and weekly snow
depths typically ranking near or often well below the lower 20th percentile of historic conditions (MN DNR State Climatology Office). This in turn likely reduced vulnerability of deer to wolf predation (Nelson and Mech 1986, Fuller 1991, DelGiudice et al. 2002), and may have caused nutritional stress for wolves that ultimately affected wolf pup condition and survival in summer 2012. Evidence from wolf depredation control activities in summer and fall 2012 suggests that wolves may have been nutritionally stressed and pup recruitment may have been lower than average. Finally, a record number of wolves were removed during wolf depredation control activities in 2012 and an additional 413 wolves were harvested in Minnesota’s first regulated wolf season. Given the timing (i.e., early winter) and very limited period of time between wolf harvest and mid-winter pack counts (i.e., ~ 1.5 months), no recruitment from reproduction would have occurred, limited opportunity for compensatory mortality existed, and any emigration of wolves into Minnesota from other jurisdictions during this short interval is not likely to be significant. Hence, we believe that these anthropogenic mortality factors certainly contributed as well to the decline in average pack size this winter. Based on location data collected from harvested wolves, ~ 50% of radio-marked wolf packs had at least 1 wolf harvested from within their delineated territory. The current population estimate of 2,211 is ~ 700 wolves less than in 2007. Although the confidence interval for the current population estimate overlaps the confidence interval from 2007, and hence is not statistically different, we believe the totality of information (i.e., lower prey density, larger wolf pack territories, lower pack size, and limited opportunity for any population response following a harvest season) indicates the 2012-13 mid-winter population was lower than the estimated population during the 2007 survey. However, total wolf distribution appears to have increased and the area occupied by packs remains similar to 2007, with wolves remaining widely distributed throughout Minnesota’s forest zone. It is important to note that although the population estimate still represents a mid-winter estimate as before, in effect we are now estimating a ‘mid-winter post-hunt’ population size rather than what before would be considered a ‘mid-winter pre-hunt’ population size. With few, if any, exceptions, all harvested wildlife populations are temporarily reduced following harvest to a level below that which would otherwise have been realized. Although some natural mortality would have occurred during the period between the start of the wolf harvest season and our mid-winter population estimate, and some harvest mortality would likely be compensatory even in the very short term (e.g., 14% of the wolves harvested had some evidence of mange, severe in some cases), we project that the 2012 pre-hunt wolf population was likely around 2,600, or perhaps 300 fewer wolves than the 2007 population point estimate. We believe that a decline in prey abundance and vulnerability (mild winter preceding survey) explains, either directly or indirectly (increased depredation control), most of the remaining difference. Acknowledging ongoing debate regarding the shape of the numerical response of wolves to changes in prey density (Cariappa et al. 2011), use of the linear regression provided by Fuller et al. (2003) projects that the estimated decline in ungulate biomass alone from 2007 to 2012 might be expected to reduce wolf population size by as many as 500. Assuming a pre-hunt population of ~ 2,600, harvest of 413 wolves during the 2012 wolf season represents ~ 16% of the population. This matches closely with simple calculations of harvest rate based on radio-collared animals that were known to be alive at the start of the wolf season (~ 17% were harvested). Estimating population size at 5-year intervals as has been the case in Minnesota since 1998 likely provides adequate assessment of longer trends in the wolf population. However, wolf populations typically have high reproductive potential and can fluctuate notably from year to
year, often attributable to variations in recruitment of pups to the fall population (Fuller et al. 2003). Hence, periodic population estimates likely mask the shorter-term fluctuations that may commonly occur in an established wolf population. With an estimated 438 wolf packs in Minnesota, and average litter size recently estimated to be 6 (MN DNR, unpublished data), ~ 2,600 wolf pups were likely born in spring 2013. Management actions (e.g., depredation control, wolf harvest) and variable recruitment rates of pups attributable to prey, weather, and disease fluctuations will continue to influence the size of the pre- or post-hunt wolf population in Minnesota. Approximately 700 wolves were taken during depredation control and wolf harvest in 2012, and during a time when deer and moose densities were 25% and 65% lower, respectively, compared to the last wolf survey in 2007. Nevertheless, an estimated 2,211 wolves in 438 packs occupying 70,579 km2 were estimated in Minnesota during the 2012-13 mid-winter survey when the wolf population is near the low point of the annual cycle. Pimlott (1967) previously proposed that intrinsic factors such as density-dependent intraspecific competition may limit wolf density to an upper threshold of ~ 4 wolves per 100 km2. Minnesota’s wolf population is estimated to have reached or slightly exceeded this level from 2003-2007. It is not clear whether the leveling off of wolf density near that threshold during this time was a result of intrinsic regulation, prey density, or a combination of both. More recently, Cariappa et al. (2011) suggested an upper intrinsic threshold of 6.9 wolves per 100 km2. However, most published estimates of density (Fuller et al. 2003, Table 6.2) have been below the threshold proposed by Pimlott (1967), with exceptions usually representing wolf densities measured over smaller spatial scales or short durations (e.g., Van Ballenberghe et al. 1975, Peterson and Page 1988, Fuller 1989, Mech and Tracy 2004). Though the prey:wolf ratio may often be a more informative metric than just prey density for explaining natural changes in wolf demographic rates (e.g., Arditi and Ginzburg 2012), we suspect that in most areas where both wolves and their prey are managed the density of (vulnerable) prey at any point in time will be the primary determinant of the biological carrying capacity for wolves (Mech and Packard 1980), with observed wolf density at that time also influenced by anthropogenic mortality, factors such as disease which may be influenced by both density-dependent and density-independent conditions, and potentially lagged numerical responses of wolves to changes in prey density. The current mid-winter estimate of 3.13 wolves per 100 km2 is below that estimated from 2003 - 07 and likely a result of prey declines and wolf harvest that removed wolves just prior to the timing of the 2012-13 mid-winter population estimate. Nevertheless, current estimated density remains near the upper end of densities reported from other regions of North America where density of self-sustaining wolf populations has been estimated over a larger area. For reasons noted above, and assuming other variables remained constant, mid-winter wolf population estimates in the years following initiation of a regulated harvest would be expected to be lower than those in years pre-harvest. Hence, assessment of any effect of wolf harvest on population trend must await data to be collected in the future. ACKNOWLEDGEMENTS We thank Steve Benson for assistance with GIS analysis of human and road density, Craig Perrault for development of the web-based wolf observation application, Carolin Humpal for assistance with wolf trapping, and John Fieberg for statistical advice. We also acknowledge John Hart and Dave Kuehn (USDA Wildlife Services) and staff at Itasca State Park and the DNR Red Lake Wildlife Management Area for logistical assistance during radio-collaring efforts. We are grateful for the critical contributions of DNR pilots Al Buchert, Jason Jensen, John Heineman, Tom Buker, Bob Geving, Brad Mass, Luke Ettl, and Tom Pfingsten during wolf

telemetry and pack counts. We thank numerous collaborators for assistance or sharing of radio-telemetry data utilized in this survey, including Dave Mech and Shannon Barber-Meyer (USGS), Steve Windels (Voyageurs National Park), Jay Huseby and Dave Price (Red Lake Band of Chippewa), Mike Schrage and Tom Howes (Fond-du-Lac Band of Chippewa), Andy Edwards and Nick Bogyo (1854 Treaty Authority), Brian Dirks and Nancy Dietz (Camp Ripley Military Reservation), and Wayne Brininger (Tamarac National Wildlife Refuge). We thank Dan Stark, Dave Mech, and John Hart for numerous discussions regarding Minnesota’s current wolf population and interpretation of data collected as part of this survey. Finally, special thanks to all field personnel throughout Minnesota that contributed wolf observations as part of the 2012-13 winter wolf survey. LITERATURE CITED Arditi, R. and L. R. Ginzburg. 2012. How species interact: altering the standard view on trophic
ecology. Oxford university Press, New York, New York. Becker, E. F., M. A. Spindler, and T. O. Osborne. 1998. A population estimator based on
network sampling of tracks in the snow. Journal of Wildlife Management 62:968-977. Berg, W., and S. Benson. 1998. Updated wolf population estimate for Minnesota, 1997-98.
Pages 85 – 98 in B. Joselyn, editor, Summaries of wildlife research findings, 1998. Minnesota Department of Natural Resources, St. Paul.
Berg, W. E., and D. W. Kuehn. 1982. Ecology of wolves in north-central Minnesota. Pages 4-
11 in F. H. Harrington and P. D. Paquet, editors. Wolves: a worldwide perspective of their behavior, ecology, and conservation. Noyes Publishing, Park Ridge, New Jersey.
Boyce, M. S. and J. S. Waller. 2003. Grizzly bears for the Bitterroot: predicting potential
distribution and abundance. Wildlife Society Bulletin 31:670-683. Burch, J. W., L. G. Adams, E. H. Follmann, and E. A. Rexstad. 2005. Evaluation of wolf density
estimation from radiotelemetry data. Wildlife Society Bulletin 33: 1225-1236. Cariappa, C. A., J. K. Oakleaf, W. B. Ballard, and S. W. Breck. 2011. A reappraisal of the
evidence for regulation of wolf populations. Journal of Wildlife Management 75:726-730. DelGiudice, G. D. 2013. 2013 Aerial Moose Survey Final Results. Minnesota Department of
Natural Resources, St. Paul. DelGiudice, G. D., M. R. Riggs, P. Joly, and W. Pan. 2002. Winter severity, survival, and
cause-specific mortality of white-tailed deer in north-central Minnesota. Journal of Wildlife Management 66:698-717.
Erb, J. 2008. Distribution and abundance of wolves in Minnesota, 20073-08. Minnesota
Department of Natural Resources, St. Paul. Erb, J., and S. Benson. 2004. Distribution and abundance of wolves in Minnesota, 2003-04.
Minnesota Department of Natural Resources, St. Paul.

Erb, J., and M. DonCarlos. 2009. An overview of the legal history and population status of wolves in Minnesota. Pages 49-64 in A. P. Wydeven, T. R. Van Deelen , and E. J. Heske, editors. Recovery of gray wolves in the Great Lakes Region of the United States: an endangered species success story. Springer. New York, New York.
Fritts, S. H. and L. D. Mech. Dynamics, movements, and feeding ecology of a newly protected
wolf population in northwestern Minnesota. Wildlife Monographs 80. Fuller, T. K. 1989. Population dynamics of wolves in north-central Minnesota. Wildlife
Monographs 105. Fuller, T. K. 1991. Effect of snow depth on wolf activity and prey selection in north central
Minnesota. Canadian Journal of Zoology 69:283-287. Fuller, T. K., and W. J. Snow. 1988. Estimating winter wolf densities using radiotelemetry data.
Wildlife Society Bulletin 16: 367-370. Fuller, T. K., W. E. Berg, G. L. Radde, M. S. Lenarz, and G. B. Joselyn. 1992. A history and
current estimate of wolf distribution and numbers in Minnesota. Wildlife Society Bulletin 20:42-55.
Fuller, T. K., L. D. Mech, and J. F. Cochrane. 2003. Wolf population dynamics. Pages 161-191
in L. D. Mech and L. Boitani, editors. Wolves: behavior, ecology, and conservation. University of Chicago Press, Chicago, Illinois.
Grund, M. and E. Walberg. 2012. Monitoring Population Trends of White-tailed Deer in
Minnesota - 2012. Minnesota Department of Natural Resources, St. Paul. Hayes, R. D., and A. S. Harestad. 2000. Demography of a recovering wolf population in the
Yukon. Canadian Journal of Zoology 78:36-48. Kunkel, K., C. M. Mack, and W. E. Melquist. 2005. An assessment of current methods for
surveying and monitoring wolves. Nez Perce Tribe, Lapwai, Idaho, USA. Manly, B. F. J. 1997. Randomization, bootstrap and Monte Carlo methods in biology.
Chapman and Hall, London. Marucco, F., D. H. Pletscher, L. Boitani, M. K. Schwartz, K. L. Pilgrim, and J. Lebreton. 2009.
Wolf survival and population trend using non-invasive capture–recapture techniques in the Western Alps. Journal of Applied Ecology 46: 1003-1010.
Mech, L. D. and L. Boitani. 2003. Wolf social ecology. Pages 1-34 in L. D. Mech and L.
Boitani, editors. Wolves: behavior, ecology, and conservation. University of Chicago Press, Chicago, Illinois.
Mech, L. D. and S. Tracy. 2004. Record high wolf, Canis lupus, pack density. Canadian Field
Naturalist 118:127-129 Minnesota Department of Natural Resources. 2001. Minnesota wolf management plan.
Minnesota Department of Natural Resources, St. Paul.

Nelson, M. E. and L. D. Mech. 1986. Relationship between snow depth and gray wolf predation on white-tailed deer. Journal of Wildlife Management 50:471-474.
Olson, S. F. 1938. A study in predatory relationship with particular reference to the wolf.
Scientific Monthly 46:323-336. Packard, J. M. and L. D. Mech. 1980. Population regulation in wolves. Pages 135-150 in M. N.
Cohen, R. S. Malpass, and H. G. Klein, editors. Biosocial mechanisms of population regulation. Yale University Press, New Haven, Connecticut, USA.
Patterson, B. R., N. W. S. Quinn, E. F. Becker, and D. B.Meier. 2004. Estimating wolf densities
in forested areas using network sampling of tracks in snow. Wildlife Society Bulletin 32:938-947.
Peterson, R.O., and R.E. Page. 1988. The rise and fall of the Isle Royale wolves. Journal of
Mammalogy 69:89-99. Pimlott, D. H. 1967. Wolf predation and ungulate populations. American Zoologist 7:267-278. Potvin, M. J., T. D. Drummer, J. A. Vucetich, D. E. Beyer, R. O. Peterson, and J. H. Hammill.
2005. Monitoring and habitat analysis for wolves in upper Michigan. Journal of Wildlife Management 69: 1660-1669
Van Ballenberghe, V., A.W. Erickson, and D. Byman. 1975. Ecology of the timber wolf in
northeastern Minnesota. Wildlife Monographs 43:1-43.
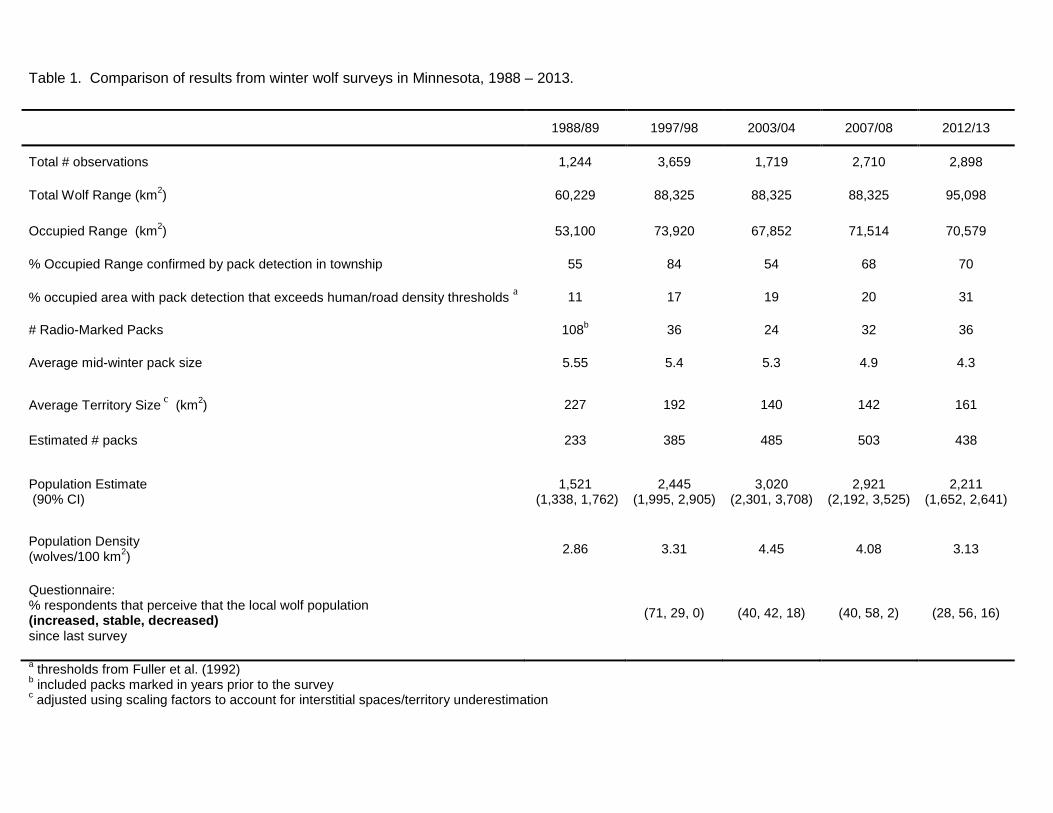
Table 1. Comparison of results from winter wolf surveys in Minnesota, 1988 – 2013.
1988/89 1997/98 2003/04 2007/08 2012/13
Total # observations 1,244 3,659 1,719 2,710 2,898
Total Wolf Range (km2) 60,229 88,325 88,325 88,325 95,098
Occupied Range (km2) 53,100 73,920 67,852 71,514 70,579
% Occupied Range confirmed by pack detection in township 55 84 54 68 70
% occupied area with pack detection that exceeds human/road density thresholds a 11 17 19 20 31
# Radio-Marked Packs 108b 36 24 32 36
Average mid-winter pack size 5.55 5.4 5.3 4.9 4.3
Average Territory Size c (km2) 227 192 140 142 161
Estimated # packs 233 385 485 503 438
Population Estimate (90% CI)
1,521 (1,338, 1,762)
2,445 (1,995, 2,905)
3,020 (2,301, 3,708)
2,921 (2,192, 3,525)
2,211 (1,652, 2,641)
Population Density (wolves/100 km2) 2.86 3.31 4.45 4.08 3.13
Questionnaire: % respondents that perceive that the local wolf population (increased, stable, decreased) since last survey
(71, 29, 0) (40, 42, 18) (40, 58, 2) (28, 56, 16)
a thresholds from Fuller et al. (1992) b included packs marked in years prior to the survey c adjusted using scaling factors to account for interstitial spaces/territory underestimation
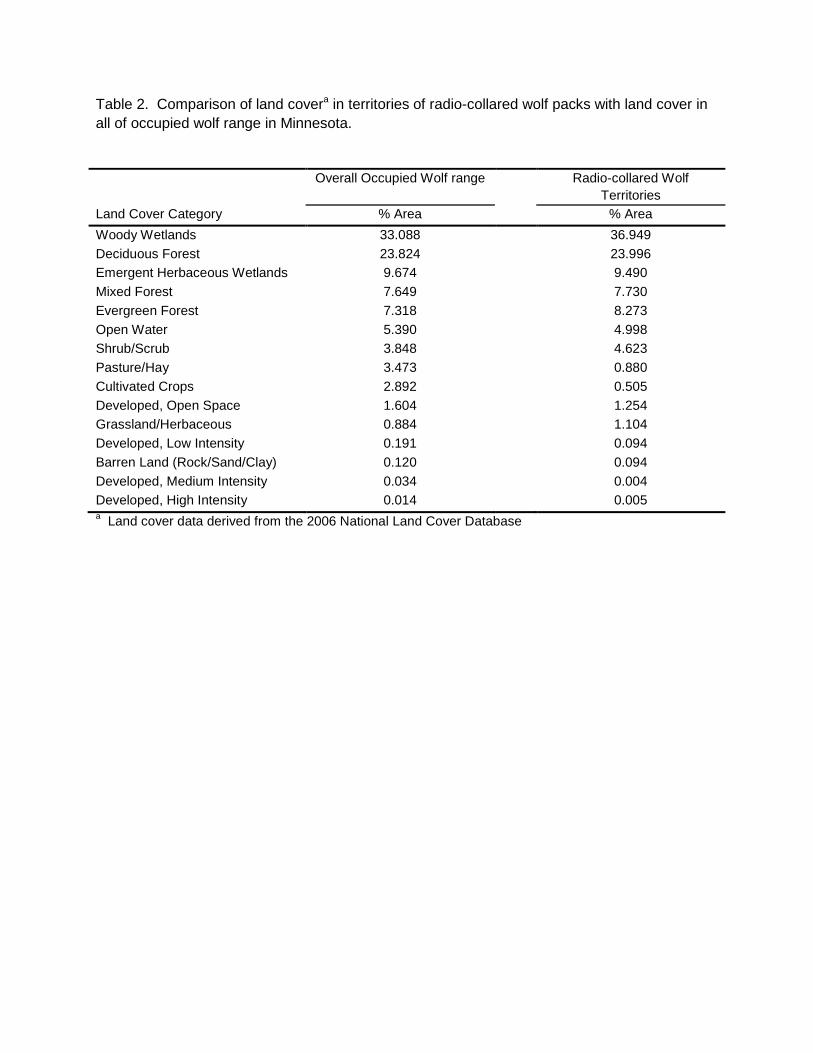
Table 2. Comparison of land covera in territories of radio-collared wolf packs with land cover in all of occupied wolf range in Minnesota. Overall Occupied Wolf range Radio-collared Wolf
Territories Land Cover Category % Area % Area Woody Wetlands 33.088 36.949 Deciduous Forest 23.824 23.996 Emergent Herbaceous Wetlands 9.674 9.490 Mixed Forest 7.649 7.730 Evergreen Forest 7.318 8.273 Open Water 5.390 4.998 Shrub/Scrub 3.848 4.623 Pasture/Hay 3.473 0.880 Cultivated Crops 2.892 0.505 Developed, Open Space 1.604 1.254 Grassland/Herbaceous 0.884 1.104 Developed, Low Intensity 0.191 0.094 Barren Land (Rock/Sand/Clay) 0.120 0.094 Developed, Medium Intensity 0.034 0.004 Developed, High Intensity 0.014 0.005 a Land cover data derived from the 2006 National Land Cover Database
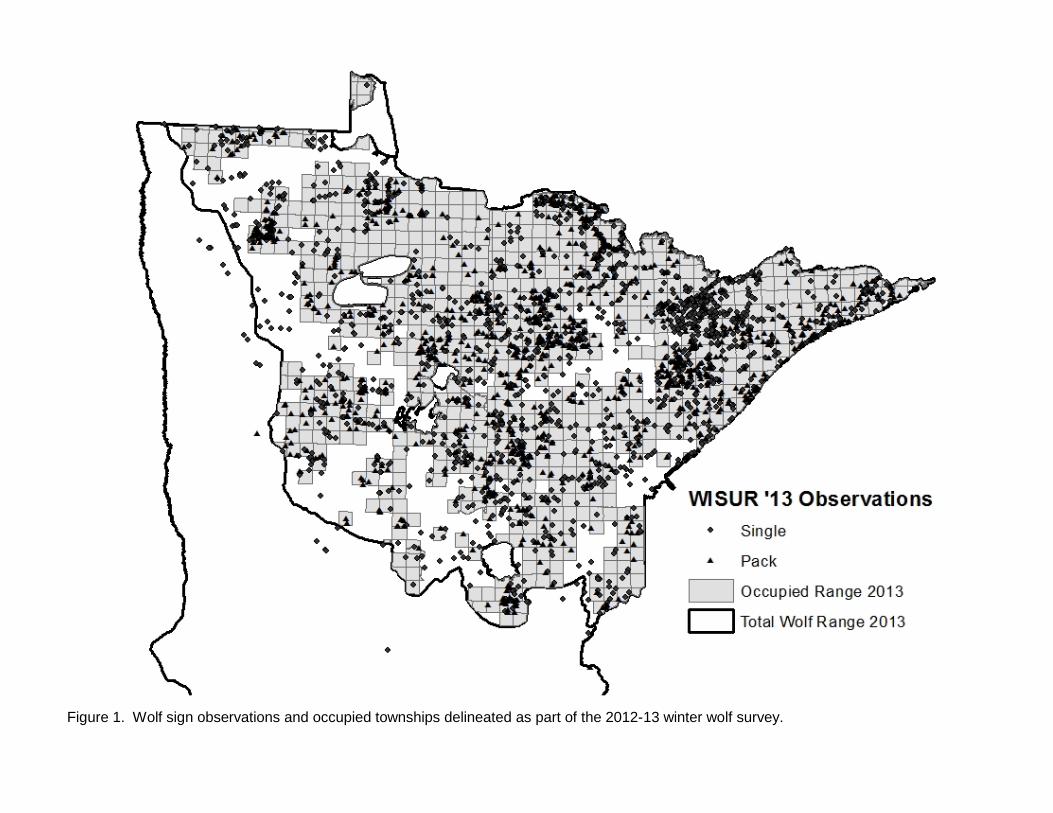
Figure 1. Wolf sign observations and occupied townships delineated as part of the 2012-13 winter wolf survey.
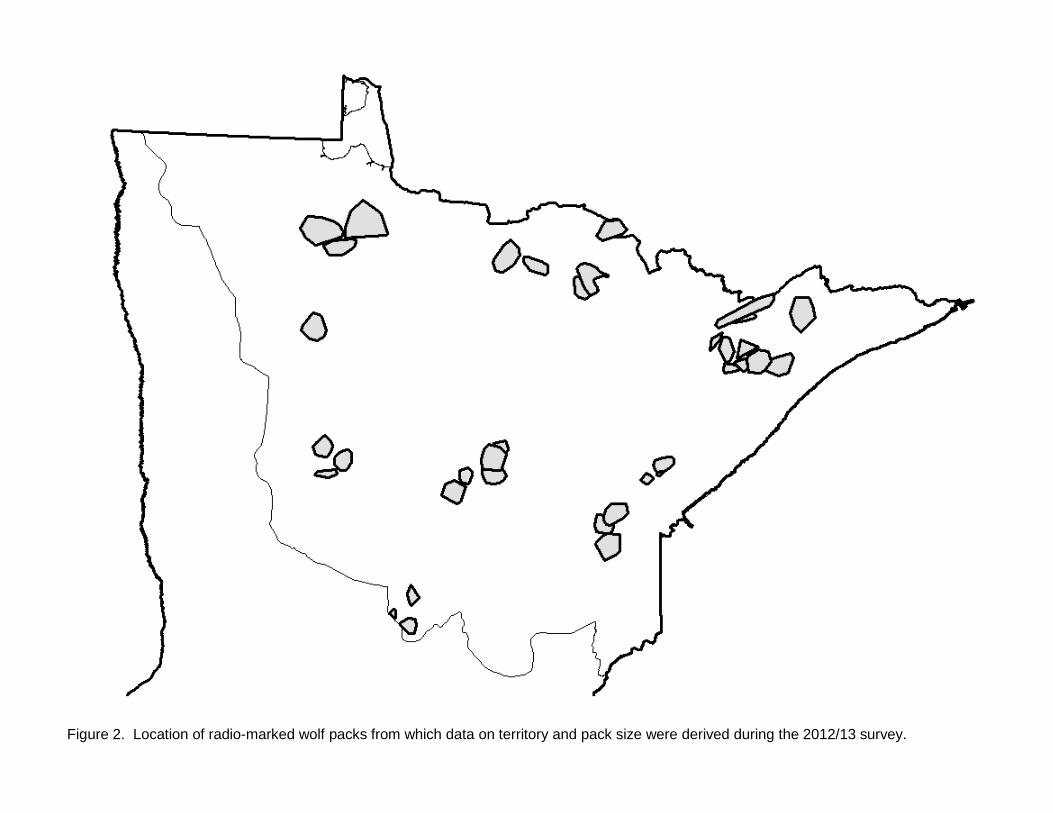
Figure 2. Location of radio-marked wolf packs from which data on territory and pack size were derived during the 2012/13 survey.
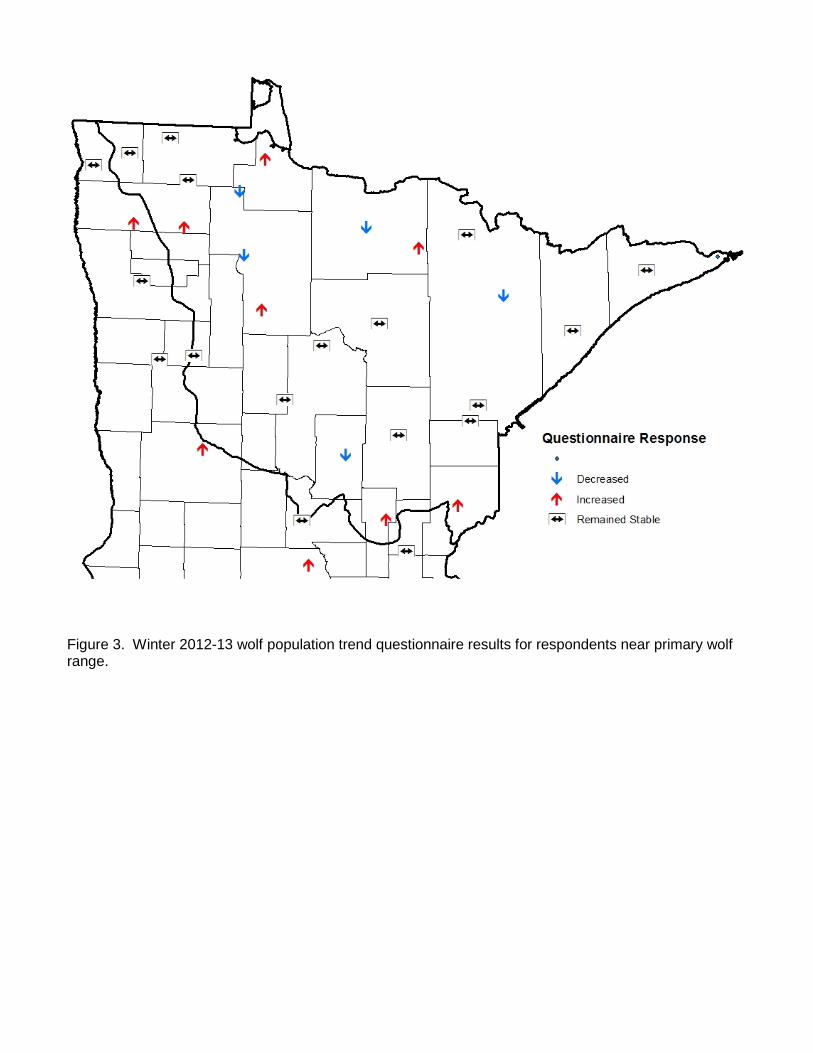
Figure 3. Winter 2012-13 wolf population trend questionnaire results for respondents near primary wolf range.