distribution statement a 19990511 041 · 2011-10-11 · dredging research technical note eedp-06-20...
TRANSCRIPT

Dredging Research Technical Note EEDP-06-20 January 1999
Documentation of the Hydrologie Evaluation of Leachate Production and Quality (HELPQ) Module
PURPOSE: This technical note documents the Hydrologie Evaluation of Leachate Production and Quality (HELPQ) computer program, which facilitates the design of confined disposal facilities (CDFs) for contaminated dredged material by estimating leachate production rates and leachate quality. HELPQ is part of the Automated Dredging and Disposal Alternatives Modeling System (ADDAMS).
BACKGROUND: When contaminated dredged material is placed in a CDF, contaminants may be mobilized and transported to the site boundaries by leachate generation and seepage. Subsurface drainage and seepage through foundation soils may then reach adjacent groundwaters and act as a source of contamination. Laboratory tests are being developed at the U.S. Army Engineer Waterways Experiment Station for predicting leachate quality in CDFs. No one laboratory test, however, can simulate the site-specific flow conditions that control leachate generation in the field. Therefore, models that couple laboratory leachate quality data and site- specific hydraulics and hydrology are needed to establish sound engineering and environmental knowledge for the design and management of CDFs.
This Technical Note describes a CDF simulation model, HELPQ, that couples water quality laboratory data from sequential batch leaching and column leaching tests for dredged material or literature data with site-specific hydraulics and hydrology. The purpose of the model is to provide sound environmental engineering data for evaluating and controlling leachate impacts on groundwater at dredged material CDFs.
INTRODUCTION: The physical processes that control the movement of contaminants in porous media are adsorption, advection, and dispersion. The adsorption process is modeled based on equilibrium partitioning. Contaminants are transported by the flow of water due to advection. A mass balance of the contaminants in the elements of the porous media will provide sufficient information on the movement of contaminants through and out of the CDF.
Leaching is defined as the inter-phase transfer of contaminants from dredged material solids to the pore water surrounding the solids and the subsequent transport of these contaminants by pore water seepage. Inter-phase transfer in a soil element is represented by
2 be. be. p, (bq.\ be.
D l--v l b l - l n e ld9i)
bt \ i
P dz2 bz ' 6 bt bt C1)
DISTRIBUTION STATEMENT A Approved for Public Release
Distribution Unlimited 19990511 041

Dredging Research Technical Note EEDP-06-20 January 1999
where
ct = pore water concentration of the i contaminant, mg/1
Dp = dispersion coefficient, m /sec
qt = solid phase concentration of the il contaminant, mg/kg
v = average pore water velocity, m/sec
z = space dimension, m
9b = bulk density, kg/1
0 = volumetric water content
The source term — represents transfer of contaminant from the solid phase to the aqueous
phase. Equation 1 is a one-dimensional partial differential equation that accounts for the conservation of mass in the aqueous and solid phases. The solids density of the volume element and the volumetric water content are used to express a decrease or an increase in solid phase concentration due to leaching by the percolating water.
Ogata and Banks (1961) presented a solution to Equation 1 by assuming a saturated soil profile that has an infinite extent without taking into consideration a source term. The application of such a solution to contaminant routing in CDFs is limited and may be valid only at the initial stage in the CDF. Routing contaminants in CDFs requires accommodation for saturated and unsaturated flow conditions and for flow in soil layers that are finite in length.
Water routing models in porous media based on mass balance are available. One such model is the Hydrologie Evaluation of Landfill Performance model, HELP (Schroeder and others 1994b), which is currently used to determine drainage rates from CDFs. On the other hand, the mathematical formulations of molecular dispersion are available only for simple cases, and the task of modeling the movement of contaminants in porous media by this method requires a substantial effort.
The hydrologic modeling of contaminant routing in the soil profile balances the water budget at the ground surface, then routes the infiltrated water and the available contaminants throughout the soil profile. For this model, the HELP model, version 3 was used for surface water hydrology, infiltration, and drainage in the soil. Since it was developed for evaluating landfill performance, the HELP model offers additional features that are useful in evaluating CDF performance. These features include the use of sand and gravel layers for lateral drainage and clay and synthetic materials as liners.
The contaminant routing model is developed based on the contaminant mass balance. The model utilizes the principle of conservation of mass as it applies to the sediment solids, the percolating fluid (leachate), and the contaminants dissolved in the fluid and associated with the sediment solids. The conservation of contaminant mass can be written as:

PLEASE CHECK THE APPROPRIATE BLOCK BELOW: -A0# L£j I copies are being forwarded. Indicate whether Statement A, B, C, D, E, F, or X applies.
LM^ DISTRIBUTION STATEMENT A: APPROVED FOR PUBLIC RELEASE: DISTRIBUTION IS UNLIMITED
ßu&i/^aZXJ
D
D
D
D
D
D
D
DISTRIBUTION STATEMENT B: DISTRIBUTION AUTHORIZED TO U.S. GOVERNMENT AGENCIES
ONLY; (Indicate Reason and Date). OTHER REQUESTS FOR THIS DOCUMENT SHALL BE REFERRED TO (Indicate Controlling DoD Office).
DISTRIBUTION STATEMENT C: DISTRIBUTION AUTHORIZED TO U.S. GOVERNMENT AGENCIES AND
THEIR CONTRACTORS; (Indicate Reason and Date). OTHER REQUESTS FOR THIS DOCUMENT SHALL BE REFERRED TO (Indicate Controlling DoD Office).
DISTRIBUTION STATEMENT D: DISTRIBUTION AUTHORIZED TO DoD AND U.S. DoD CONTRACTORS
ONLY; (Indicate Reason and Date). OTHER REQUESTS SHALL BE REFERRED TO (Indicate Controlling DoD Office).
DISTRIBUTION STATEMENT E: DISTRIBUTION AUTHORIZED TO DoD COMPONENTS ONLY; (Indicate
Reason and Date). OTHER REQUESTS SHALL BE REFERRED TO (Indicate Controlling DoD Office).
DISTRIBUTION STATEMENT F: FURTHER DISSEMINATION ONLY AS DIRECTED BY (Indicate Controlling DoD Office and Date) or HIGHER
DoD AUTHORITY.
DISTRIBUTION STATEMENT X: DISTRIBUTION AUTHORIZED TO U.S. GOVERNMENT AGENCIES
AND PRIVATE INDIVIDUALS OR ENTERPRISES ELIGIBLE TO OBTAIN EXPORT-CONTROLLED TECHNICAL DATA IN ACCORDANCE WITH DoD DIRECTIVE 5230.25, WITHHOLDING OF UNCLASSIFIED TECHNICAL DATA FROM PUBLIC DISCLOSURE, 6 Nov 1984 (Indicate date of determination). CONTROLLING DoD OFFICE IS (Indicate Controlling DoD Office).
I I This document was previously forwarded to DTIC on (date) and the AD number is .
L-J In accordance with provisions of DoD instructions, the document requested is not supplied because:
I I It will be published at a later date. (Enter approximate date, if known).
Other. (Give Reason)
DoD Directive 5230.24, "Distribution Statements on Technical Documents," 18 Mar 87, contains seven distribution statements, as described briefly above. Technical Documents must be assigned distribution statements.
Print or Type Name c7

Dredging Research Technical Note EEDP-06-20 January 1999
Net Rate of Change of Mass of
Contaminan t within the Element
Flux of Contaminan t
out of the Element
Flux of Contaminan t
into the Element
Change of Contaminan t Mass Due to Adsorption / Desorption
(2)
The soil layers in a CDF are divided into small segments; then the mass balance equation using Equation 2 is applied to each segment at every time step.
The components of Equation 2 can be computed based on the available contaminant mass and the change of contaminant mass in the control volume and across the control surface of each segment. Equation 2 can be written as
AMi,j=Mi,j-Mi,j+l-*MA/D (3)
where i andj represent the time step and segment number, respectively. The terms in Equation 3 correspond to the terms in Equation 2. The available mass of contaminant is the product of the available volume of fluid and the contaminant concentration. The available contaminant mass per unit area in the segment's leachate at any time step i, is
M. -=c- ■ vf- Mi,j ci,j vi,j (4)
where ctJ is the contaminant concentration of leachate in the segment, and V-fj is the fluid
volume in the segment. The change of contaminant mass per unit area in a segment at time step i can be written as
AJkf,,=c/(r -c 'j i,j
hj i -1, j i -1, j (5)
and the flux of contaminant mass across element boundary per unit area is
M. . -M . .,, =c. . , DR. . -c. . DR. ., . hj i,j+l i,j-l i,j i,j i.J + 1 (6)
where DRi:j is the amount of drainage into segment j at time i.
The change in contaminant mass inside the element due to adsorption or desorption is a function of the specific partitioning model for the contaminant in that soil. The models explained below cover both the sequential batch and the column leaching methods for determining the desorption isotherms. In what follows, the porosity and hydraulic conductivity of the dredged material do not change throughout the simulation duration.
Several partitioning models are considered in the HELPQ model. The first represents batch leaching test data for organics in freshwater sediment. This method indicates that the
Dredging Research Technical Note EEDP-06-20 January 1999
concentration of the contaminant in the solids and the liquid does not change with sequential leaching, and hence, a single point can represent the data. The change of contaminant mass due to adsorption/desorption by a point Kd model is
AM ^ = cuKdiJTj (l - Pj )SG j - CUJK^JTJ (l - Pj )sG j (7)
where 7} is the segment thickness, P, is the porosity, and SGj is the specific gravity of solids in the segment. The term j. U _ p.jSG ■ represents the volume of solids in the segment Vjs. In this
Kd model and in those that follow, it is assumed that the dredged material will not change porosity. Change of contaminant mass due to adsorption/ desorption by a constant Kd model is
where Kd here represents the slope of a straight-line desorption isotherm, and qriJ- is the y- intercept of the desorption isotherm, which is the residual concentration of the contaminant in the solids, i.e., the amount of contaminants that will stick to the solids regardless of the amount and duration of leaching.
Finally, change of contaminant mass per unit area due to adsorption/desorption for saline sediments is
^AJD =cijKdij{sij)^
i-p^GJ-ci-ijKdij{si,J)Typ^GJ
(9)
where KdUj(Sij) is the partitioning coefficient for non-constant Kd, and stJ is the salinity (or electrical conductivity) in the segment.
Setting up the contaminant mass balance for each segment and coupling the result with the fluid mass balance for a segment lead to the following equation for the contaminant mass in segment j at time i as
°i -u v/-i,j+cu -IDR u+ci-uKdi, j kj y./ (j - pj ^
vif-i,j+DRi,j+Kdi,J{si,jyAi-pj)sG Ci>] ' „r . _ ~Z r \„ L n \^ (io)
The results of the column leaching test provide information about the variation of contaminant concentration in the leachate and in the solid phase as a function of the water volume eluted. Hence, a relationship between the partitioning coefficient and the pore volumes eluted can be derived. Myers et al. (1996) recommended the following equation
'f\0-W Kd=K^(K°d-Ki)e-^ (11)

Dredging Research Technical Note EEDP-06-20 January 1999
where
K°d = initial distribution coefficient, i.e., before salt has been washed out, 1/kg
Kfd = final distribution coefficient, i.e., after salt has been washed out, 1/kg
ß = empirical constant, dimensionless
PV = number of pore volumes eluted, dimensionless
The parameters reported in the above equation can be determined from the results of the column leaching test by regression analysis. The change of contaminant mass due to adsorption/
desorption by an exponential Kd model is computed in HELPQ as
AM AID 'hj
, . n ,, -ßPVJ. f ^(l-Pj)sGj
c. i-lj 'i+M-'i^-1 r.ii-PjjsGj
(12)
and the contaminant mass in segment j at time i is
ci-i,jVj+ci,j-iDRi,j+ci-i,j
CU =
K
f 1
V/+DRi,j+l +
, . n , x - ßPVJ. Kf+K«d-Kf\e J
f Tj{l-Pj)sGj
(13)
The mass in a segment at any time can be computed if the segment properties (thickness, porosity, and specific gravity), drainage into and out of the segment (DR), and the partitioning coefficient behavior are known. These soil, flow, and chemical properties are all required for a complete solution of the contaminant routing problem.
Soil and flow properties are information that can be obtained from the HELP model; the chemical properties must be obtained from laboratory tests. In addition, for estuarine dredged sediment, the salinity of the leachate in each segment must be routed in the soil profile to properly model the adsorption/desorption behavior in these sediments.
The results of laboratory data analysis (Brannon et al. 1991) indicate that the desorption isotherms for estuarine sediments do not have a general trend similar to the traditional constant partitioning coefficients observed in freshwater sediments. However, the data indicate that adsorption and desorption in estuarine sediments are a function of leachate salinity.
Dredging Research Technical Note EEDP-06-20 January 1999
Salinity mass balance in the soil profile is modeled in HELPQ in a manner similar to contaminant mass balance. The salinity S JJ in segment j at time step i can be written as
W^H^ii (M)
Therefore, to route contaminants in estuarine sediments, the salinity is routed first.
Model Development: The contaminant routing model HELPQ uses the HELP model as the hydrologic model for routing water in the soil and takes advantage of the special features offered by the HELP model for landfill design alternatives. The overall flowchart of the model and its relationship to the HELP model are shown in Figure 1.
The contaminant routing model is a one-dimensional model that routes contaminants vertically. Water drainage and moisture content values are obtained from the HELP model. The HELP model is a quasi-two-dimensional model that divides the vertical soil profile into sub-profiles that are in turn subdivided into smaller segments. The HELP model computes drainage values for these segments. In version 3, the HELP model divides the layers of soil into a maximum of 67 segments and uses a variable simulation time step.
In order to determine the segment size and the time step size of the contaminant routing model, the semi-infinite solution of Ogata and Banks (1961) was used to compare the results of the model for special cases. For a given soil layer and contaminant partitioning coefficient, contaminants were routed using Ogata's model and the finite difference model explained above. The semi-infinite solution requires a dispersion coefficient, which this model did not. Therefore, the task was to determine the finite difference segment thickness and time step that will produce similar breakthrough curves as those produced by the analytical solution.
Several such tests were conducted for a variety of partitioning coefficient models, segment thicknesses, and time steps. The results indicated that the finite difference model produces acceptable results for segment sizes that are one-tenth the thickness of the soil layer and that the size of the time step did not affect the results for a wide range of time step sizes. As a result, the segment size was selected to be one-tenth of a soil layer and the time step to be one month.
Since the results of the HELP model are for segments of variable sizes, in which a segment may be equal to an entire layer thickness, the results of the HELP model must be interpolated to suit the segment sizes of contaminant routing. In addition, the HELP model was modified to produce moisture content for each segment at a monthly time increment to be consistent with the HELPQ time step. These values are also interpolated to give the moisture content in the segments of the contaminant routing model.
The HELP model provides means to drain water laterally via a lateral drainage layer which may be sand, gravel, or a geonet and computes the lateral drainage rates in these layers. To allow for flexibility in the design of confined disposal facilities, lateral drainage of leachate is also implemented in the model.

Dredging Research Technical Note EEDP-06-20 January 1999
Input Weather.Soil and Design Data
Produce HELP Output
O O
UJ z o Q.
O O
f Input
Contaminant Data
Q. O o _i
UJ
1 Input Moisture
Content and Drainage from HELP Output
Q. O O _i rr UJ >:
I Interpolate HELP Data
Q. O 3 t- z UJ
CD UJ CO
Estuarine Route
Salinity
Fresh
Route Contaminant in Soil Profile I
Plot and Output Leachate
Concentrations
I End
Figure 1. Flowchart of the contaminant routing model
In addition to the water routing results of the HELP model, the contaminant routing model requires the contaminant properties, such as initial concentrations and partitioning coefficient data. For cases of estuarine sediments, the model also requires salinity properties of the leachate.
Model Input: The input facility of HELPQ is described below followed by an explanation of the way in which the user can move from one input screen to another, how to obtain on-line help,

Dredging Research Technical Note EEDP-06-20 January 1999
possible user responses, and the implications of these responses. The term "screen" refers to the screen display that contains questions or information. The user's role is to enter information manually or select from a list of options. Most input screens are assigned a title and menu bar.
The HELPQ program is started by typing "HELPQ" from the DOS prompt. Once the program is started, the user can select any of nine options from the main menu. The program automatically solicits input from the user based on the selected option. In general, the HELPQ model requires the following data, some of which may be selected from built-in default values:
a. Soil and design data.
b. Weather data.
c. Contaminant name.
d. Equilibrium partitioning method.
e. Contaminant sequential batch leaching test data or column leaching data.
/ Initial contaminant concentration.
g. Initial salinity (for estuarine cases).
Some of this information is entered through the HELP model. Rules and regulations that apply to the use of HELPQ, and methods for entering data, executing HELPQ, and obtaining results are explained below.
THE MAIN MENU: When the program is started, the main menu is displayed. The schematic of the main menu in Figure 2 shows the available options. Selection from the main menu is made by either cursoring to the desired option or by pressing the number of that option. Once a selection is made, program control transfers into an environment specific to that option and cannot transfer to another main menu option except by exiting that environment to the main menu and then selecting another option.
• Run the Water Balance Component. The first three options of the HELPQ menu represent the steps required to run HELP3 for water balance. These are the options used for entering the weather, soil and design data of the CDF, and for running the HELP. A brief description of these options is presented below, and more details are given in Schroeder et al. (1994a).
The first option is to enter/edit weather data to create or read evapotranspiration, precipitation, temperature, and solar radiation data files, then review, edit, and save the data. There are four primary screens in this module: a file management screen, evapotranspiration data screen, a screen that controls the method used for generating precipitation, temperature, and solar radiation data, and a screen for saving weather data. Several options are available for generating precipitation, temperature and solar radiation data. These vary from using default data (for precipitation only) to synthetic and other user-defined data sources, such as NOAA, Climatedata, HELP version 2 data, Canadian climatic data, and ASCII data. Default precipitation data are read and synthetic weather data are generated by selecting the city of interest from a list of cities and then entering additional information such as the number of years of weather data to be generated.

Dredging Research Technical Note EEDP-06-20 January 1999
1 ^
Enter/Edit Weather Data
2
^
^~ I Enter/Edit Soil and ||
Design Data P
3 Execute Water Routing Model
4
^
M A I N
M E N U
™
Enter/Edit Contaminant Data 1
5 Execute Contaminan Routing Model
it
6
^
■^
View Results
7 Print Results
8
■>
Display Guidance
9 w/ ^*
*\ V"ll
Figure 2. A schematic of the main menu options

Dredging Research Technical Note EEDP-06-20 January 1999
The second option is to enter/edit soil and design data to create or read an already existing soil and design data file, then review, edit, and save the data. There are seven primary screens in the soil and design data module: a file management screen, a general information screen, three screens for entering layer, soil, and geosynthetic data, a screen for entering an SCS runoff curve number, and a screen for verifying and saving soil and design data.
Input screens associated with this option contain questions about project title, system of units, initial soil conditions, landfill area; layer information such as layer type, thickness, soil texture, drainage characteristics, flexible membrane liner information; and runoff curve number information. Runoff curve number information includes the facility to adjust the curve number to high surface slopes. At the end of this option, the model, if requested by user, will check the data for possible violations of the design rules and soil properties. After verification, the user should save the data.
The third option on the main menu is to execute the program. In this option, the user defines the data files to be used in running the computational component of the HELP model and selects the output frequency desired. The HELP model has been modified to produce an output file for use by the contaminant routing component of the HELPQ model. This output file has the extension "D14" and contains data regarding layer and segment characteristics, and layer arrangement, in addition to the results of the water balance for the simulation years. Information included in the "D14" file includes the number of soil segments used in the hydrologic simulation, the hydraulic conductivities of the various soil layers, the initial moisture contents, and the simulation results of moisture content, drainage into each segment, lateral drainage (if any), and percolation from each liner.
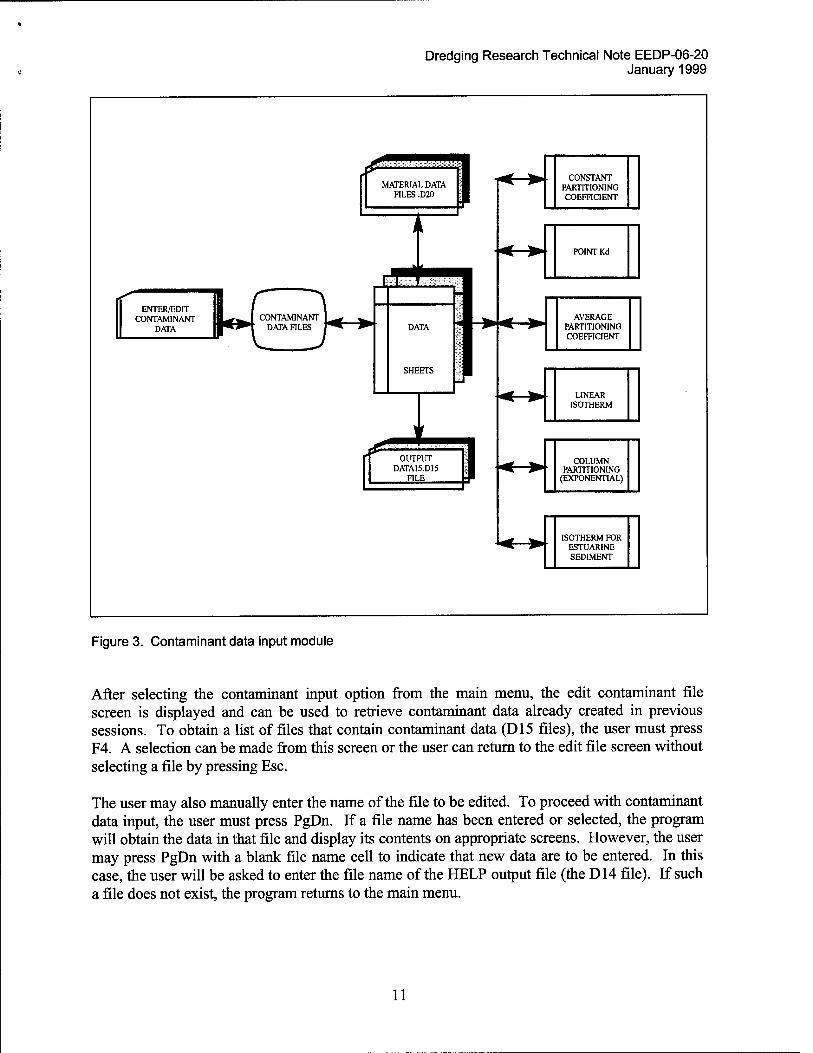
• Enter/Edit Contaminant Data. The fourth option on the main menu is to enter/edit contaminant data. In this option (Figure 3), the user defines the data to be used in running the contaminant routing module. If the user chooses to enter a completely new set of contaminant data, the program will request the file name of the HELP output (the .D14 file) to be entered. Information regarding the layer characteristics is extracted from the D14 file and used to instruct the user of the available layers and their function. On the other hand, if the user desires to edit an existing contaminant data file (.D15 file), the model does not request the HELP output file name since soil and design data are also available in the D15 file.
The contaminant data includes the names of the contaminants present in the soil layers (up to 100 contaminants), the partitioning coefficient methods for each contaminant in each CDF layer, and the initial contaminant and salinity conditions in each layer along with the specific gravity of the soil.
The contaminant data includes the names of the contaminants present in the soil layers (up to 100 contaminants), the partitioning coefficient methods for each contaminant in each CDF layer, and the initial contaminant and salinity conditions in each layer along with the specific gravity of the soil.
10
Dredging Research Technical Note EEDP-06-20 January 1999
ENTER/EDIT CONTAMINANT
DATA
i. OUTPUT
DATA15.D15 FILE
CONSTANT PARTITIONING COEFFICIENT
POINT Kd
AVERAGE PARTITIONING COEFFICIENT
LINEAR ISOTHERM
COLUMN PARTITIONING
(EXPONENTIAL)
ISOTHERM FOR ESTUARINE SEDIMENT
Figure 3. Contaminant data input module
After selecting the contaminant input option from the main menu, the edit contaminant file screen is displayed and can be used to retrieve contaminant data already created in previous sessions. To obtain a list of files that contain contaminant data (D15 files), the user must press F4. A selection can be made from this screen or the user can return to the edit file screen without selecting a file by pressing Esc.
The user may also manually enter the name of the file to be edited. To proceed with contaminant data input, the user must press PgDn. If a file name has been entered or selected, the program will obtain the data in that file and display its contents on appropriate screens. However, the user may press PgDn with a blank file name cell to indicate that new data are to be entered. In this case, the user will be asked to enter the file name of the HELP output file (the D14 file). If such a file does not exist, the program returns to the main menu.
11

Dredging Research Technical Note EEDP-06-20 January 1999
The next screen is the contaminant identification screen. If a file name has been selected for editing, the list of contaminants in this file will be displayed. The user may add more contaminants to the list or simply proceed by pressing PgDn or F10.
Contaminant names may be entered manually or may be selected from a list of commonly found contaminants (metals and organics). A contaminant name is selected from the default list by pressing F4 and selecting from the available list of names. The user may enter a maximum of 100 contaminant names. The screen will show 20 contaminant names at a time, and the rest can be seen by pressing PgDn or PgUp. If no contaminant names were entered, the program will assume that there is only one contaminant and will give it the name "Contaminant 1."
The next screen in the contaminant input module is for the partitioning coefficient methods used for each contaminant in each layer. This screen is designed in a spreadsheet format of rows and columns. Each row represents a layer in the CDF, while the columns represent the layer number, layer type, material file path, material file name, and a maximum of five columns of contaminants per screen. The user cannot access the first two columns. The third and fourth columns can be used to enter a material file path and file name from which the partitioning coefficient method is to be selected. The user may utilize material files previously built that contain sequential batch leaching test data for contaminants from a certain source. These material files have a "D20" file name extension.
To obtain a list of material data available on a certain directory, the user must input the path to the directory in the appropriate cell and then press F4. A list of material files with material descriptions is displayed, and the user may then select the desired material file. The program then returns to the partitioning coefficient method screen. To obtain a list of the contaminants that are available in the material file, the user should cursor to the contaminant column and press F4 to get the list of contaminants and the partitioning coefficient methods in the selected material. By selecting the partitioning coefficient method, the program displays the data of the selected contaminant on a separate screen consistent with the selected method. It is possible to use a different material file for each contaminant in a layer. Moreover, the user can enter a K d
method and then press Enter to input the appropriate data without using an existing material file. Regardless of how a Kd method is entered, the program displays a special screen for each method.
The partitioning coefficient is used to determine the equilibrium amount of contaminants that transfer from the solids surfaces to the liquid or vice versa. The adsorption and desorption process is soil- and contaminant-specific. Partitioning coefficient data are obtained from laboratory tests. These tests typically provide concentrations of contaminants in the leachate and in the solids at various levels of liquid-to-solid volumes. A plot of the concentration of contaminants in the leachate and the contaminants on the solids represents a sorption isotherm. The slope of this line is the partitioning coefficient Kd. Laboratory tests indicate that the partitioning coefficient of organics in freshwater sediments possess a "point" K d, implying that the contaminant concentration in the leachate and solids cluster around the same value. Partitioning coefficients for metals in freshwater sediments possess a straight-line relationship. Laboratory tests indicate that no trend exists for sediments from an estuarine source. Partitioning
12

Dredging Research Technical Note EEDP-06-20 January 1999
in these soils depends on the level of salinity in the leachate. On the other hand, column leaching tests provide data in the form of concentrations over time.
The code for a point Kd method is 1. For this method, the user is required to enter a partitioning coefficient value obtained from a sequential batch leaching test. For a linear Kd method, the method code is 2, and the user is expected to enter one value for contaminant concentration in the leachate (c) and one value for the concentration in the solids (q). Methods 3, 4, and 6 require a set of q and c values for various leach cycles. In addition, method 3 is for a list of laboratory data points to be averaged, and method 4 is for a list of data points to be used to obtain the best fit straight line for the data. Method 6 requires additionally the salinity values in each leach cycle. Partitioning coefficient method 5 is reserved for column leach test results. Column leaching produces results in the form of concentrations q and c, and pore volumes eluted. The partitioning coefficient data are stored when the user presses PgDn.
Additional screens for Kd methods for more than five contaminants can be obtained by pressing PgDn. Since only five contaminants are included on each of these screens, there is a maximum of 20 such screens. The equilibrium partitioning data are stored in one file per layer. These files have a default name of "XMAT7.D20" where the "?" is a number representing the layer number.
After the partitioning coefficient data are entered, the user must input the initial concentrations of the contaminants in the sediment solids. One value must be entered for each contaminant in each layer. This screen is made up of rows (indicating layers) and columns (indicating contaminants). A maximum of 10 contaminants can be listed on a screen, but additional contaminants are displayed by pressing PgDn or PgUp.
The next screen is used to input the specific gravity of the solids in each layer and the initial salinity of the leachate in each layer. This is the last screen in the cycle of input screens.
At any time during the contaminant data input session, the user may choose to proceed to the saving data option by pressing F10. Before the data are saved to a file, the program verifies the completeness of the data. In order to save the data, the user must first enter a file name in which the data are to be saved and then press PgDn. The program verifies the completeness of the data and saves them to the specified file. If the data are not complete, the program warns the user of the problem. At the end of this input session, the program returns to the HELPQ main menu.
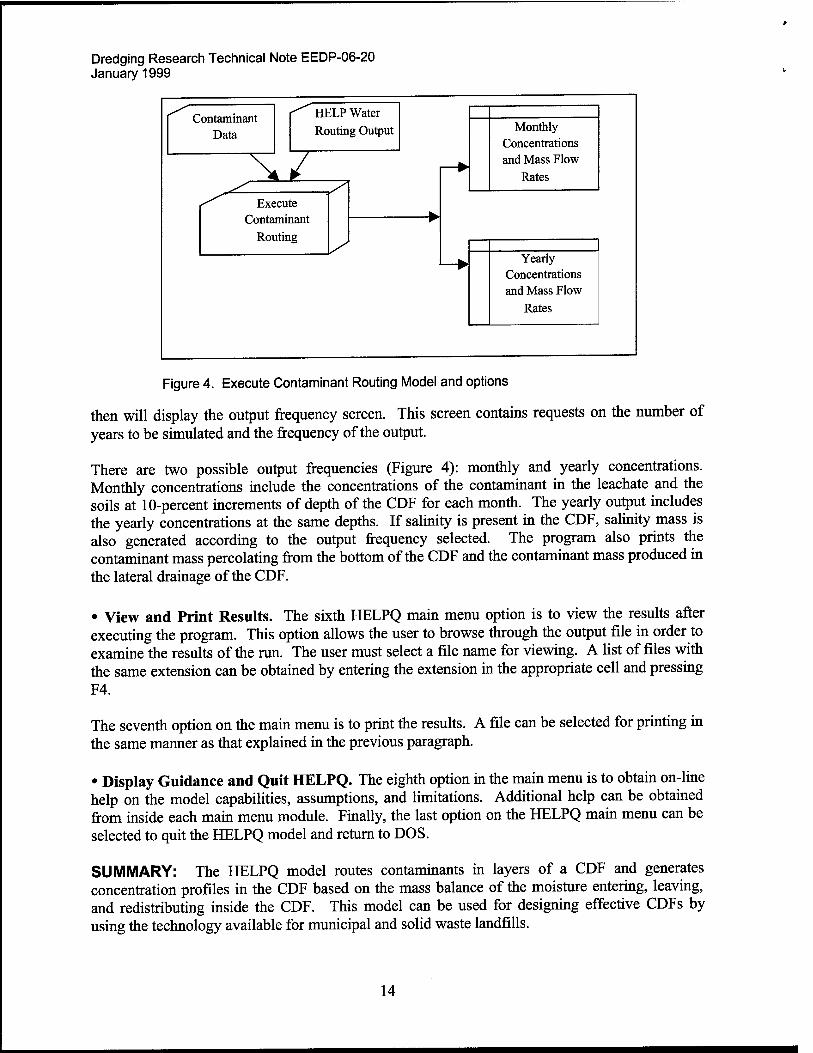
• Execute Contaminant Routing Model. The fifth option on the HELPQ main menu is to execute the contaminant routing program. This option requires the user to select data files and the output frequency to be used for running the model as shown in Figure 4.
Three files are required: the output of flow routing (*.D14), the contaminant data file (*.D15), and a file to which the results are to be printed. File selection can be made by pressing the F4 key to obtain a list of available files. After all these files are entered, the user may press PgDn to proceed. At this point, the program will verify whether the first two files exist. If not, the program will indicate so and will not proceed to the next screen. If files are available, the program will determine the number of years of flow routing that are available in the D14 file and
13
Dredging Research Technical Note EEDP-06-20 January 1999
^- r-""" HELP Water v^uiiuuiuuaiii
Data Routing Output Monthly Concentrations and Mass Flow
Rates N»/ I—► ^ /
^ s^ Execute
Contaminant Routing
w
y I—► Yearly
Concentrations and Mass Flow
Rates
Figure 4. Execute Contaminant Routing Model and options
then will display the output frequency screen. This screen contains requests on the number of years to be simulated and the frequency of the output.
There are two possible output frequencies (Figure 4): monthly and yearly concentrations. Monthly concentrations include the concentrations of the contaminant in the leachate and the soils at 10-percent increments of depth of the CDF for each month. The yearly output includes the yearly concentrations at the same depths. If salinity is present in the CDF, salinity mass is also generated according to the output frequency selected. The program also prints the contaminant mass percolating from the bottom of the CDF and the contaminant mass produced in the lateral drainage of the CDF.
• View and Print Results. The sixth HELPQ main menu option is to view the results after executing the program. This option allows the user to browse through the output file in order to examine the results of the run. The user must select a file name for viewing. A list of files with the same extension can be obtained by entering the extension in the appropriate cell and pressing F4.
The seventh option on the main menu is to print the results. A file can be selected for printing in the same manner as that explained in the previous paragraph.
• Display Guidance and Quit HELPQ. The eighth option in the main menu is to obtain on-line help on the model capabilities, assumptions, and limitations. Additional help can be obtained from inside each main menu module. Finally, the last option on the HELPQ main menu can be selected to quit the HELPQ model and return to DOS.
SUMMARY: The HELPQ model routes contaminants in layers of a CDF and generates concentration profiles in the CDF based on the mass balance of the moisture entering, leaving, and redistributing inside the CDF. This model can be used for designing effective CDFs by using the technology available for municipal and solid waste landfills.
14
Dredging Research Technical Note EEDP-06-20 January 1999
POINTS OF CONTACT: This technical note was written by Dr. Nadim M. Aziz, Clemson University, South Carolina, (864) 656-3321, [email protected], and Dr. Paul R. Schroeder, U.S. Army Engineer Waterways Experiment Station, (601) 634-3709, [email protected]. Questions regarding this technical note should be directed to Dr. Schroeder, (601) 634-3709, [email protected], or the manager of the Dredging Operations Technical Support Program (DOTS), Mr. Thomas R. Patin, (601) 634-3444, [email protected].
REFERENCES
Brannon, J. M., Myers, T. E., Gunnison, D., and Price, C. B. (1991). "Non constant polychlorinated biphenyl partitioning in New Bedford Harbor sediment during sequential batch leaching," Environmental Sciences & Technology, 1082-1087.
Myers, T. E., Brannon, J. M., Tardy, B. A., and Townsend, D. M. (1996). "Leachate testing and evaluation for estuarine sediments," Technical Report D-96-1, U.S. Army Engineer Waterways Experiment Station, Vicksburg, MS.
Ogata, A., and Banks, R. B. (1961). "A solution of the differential equation of longitudinal dispersion in porous media," USGS Professional Paper 411-A, U.S. Geological Survey, Washington, DC, A1-A7.
Schroeder, P. R., Aziz, N. M., Lloyd, C. M., and Zappi, P. A. (1994a). "The Hydrologie Evaluation of Landfill Performance (HELP) Model: User's guide for Version 3," EPA/600/R-94/168a, U.S. Environmental Protection Agency Risk Reduction Engineering Laboratory, Cincinnati, OH.
Schroeder, P. R, Dozier, T. S., Zappi, P. A., McEnroe, B. M., Sjostrom, J. W., and Peyton, R. L., (1994b). "The Hydrologie Evaluation of Landfill Performance (HELP) Model: Engineering documentation for Version 3," EPA/600/R-94/168b, U.S. Environmental Protection Agency Risk Reduction Engineering Laboratory, Cincinnati, OH.
15