distribution statement Ä · · 2013-04-04distribution statement ... discharge enhancement of...
TRANSCRIPT
CO
o
•:'
■
r
LiJj ---'
D
NORTHROP Research and Technology Center
DISTRIBUTION STATEMENT Ä
Approved for public le^easo; I/lstnbution Unlimited
güä^äsjäsiiiüüü
X NRTC-77-43R
P I
High Power Short Wavelength
Laser Development
November 1977
D. B. Cohn and W. B. Lacina
Contract N00014-76-C-1100
DISTP.irUTi Äpp' : f, 1
Sponsored By
ADVANCED RESEARCH PROJECTS AGENCY
ARPA Order No. 3125
Monitored By
OiTFICE OF NAVAL RESEARCH
NORTHROP CORPORATION ' Northrop Research and Technology Center
3401 West Broadway Hawthorne, California 90250
Telephone: (213) 970-5163
aca; -i.'^ 1 L
"Mil?
m
:,,.:, yj.,.:..!,.^-.-,- : --^"■"■l»

REPORT DOCUMÜNTÄTTOFTPAGE I. REPOHT NUMBER U. COVT ACCESSION NO
NRTC-77-43R, «. TITLE fana »uetjjitj
BEFORE COMPLETING FORM CIPIENT'S CATALOO NUMBER
KIGH.POWER SHORT WAVELENGTH LASER DEVELOPMENT,
7. AUTMOHf»;
D. B. /Cohn iBS0 W. B. /Lacina
Final technical XejAt. ^1 Jvlp 76^3g Sepj 77.
8. CONTRACT OR GRANT NUMBERC
r^0ei4-76-c-iii30 /'
9. PERFORMING ORGANIZATION NAME AND ADDRESS
Northrop Research and Technology Center 3401 West Broadway Hawthorne. CA 90250
i-*a»««K UNIT NUMMV
ARPA Order-3125
H. CONTROLLING OFFICE NAMi. ^NO ADDRESS
Advanced Research Projects Agency 1400 Wilson Blvd. Arlington. Virginia 22209
**. MONITORING AGENCY NAME A ADORESSf/f dllltnni Itom Conitalllni Ollic»)
Office of Naval Research Department of the Navy Arlington, Virginia 22217
IS. SECL
Unclassified IS«. OECL ASSlFICATION DOWNGRADING
SCHEDULE
16. DISTRIBUTION STATEMENT fo/fhij R»poro
Distribution of this document is unlimited
17. DISTRIBUTION STATEMENT (ol Hi» mbmtrmet tnfnd in Block 30, It dllltrtnl Itom Rtport)
IB. SUPPLEMENTARY NOTES
\
'9. KEY WORDS (Continu» on revtrt« «id» II ntceiamry mnd idtmlly ty block numbir)
Excimer Laser, KrF Laser, Electrical Excitation, High Power
cff
^f ABSTRACT fConKnu« on r«v«r(* sld* II n«c«»««ry »nd Idtnllly by block numbtr)
Results of a comprehensive experimental and theoretical investigation of a large volume, electron beam and discharge excited KrF laser are reported. For pulse lengths (^JIJJJ^ maximum specific energy extraction was 22 J/liter at 10% efficiency and maximum total energy was 90J for a 10 liter gain volume Discharge enhancement of output energy was limited by discharge instability as a result of beam deposition nonuniformity. Excellent agreement in terms of absolute values and waveforms was obtained with an extensive computer it&
DD i JAN 73 1473 EDITION OF I NOV 6S IS OBSOLETE
^0^ iV 4 UNCLASSIFIED
CoJ e.. SECURITY CLASSIFICATION OF THi/pAGE £ fWhtn Data Enterte

NRTC-77-43R
HIGH POWER SHORT WAVELENGTH LASER DEVELOPMENT
ARPA Order Number:
Program Code Number:
Contract Number:
Principal Investigators and Telephone Number:
Program Manager:
Name of Contractor:
Scientific Officer:
Effective Date of Contract:
Amount of Contract:
Sponsored By:
3125
TE20
N00014-76-C-1100
Dr. D. B. Cohn (213) 970-5163 Dr. W. B. Lacina (213) 970-4881
Dr. G. Hasserjian (213) 970-4861
Northrop Corporation Northrop Research and
Technology Center 3401 W. Broadway Hawthorne, CA 90250
Physical Sciences Division Physics Program Office of Naval Research 800 N. Quincy Street Arlington, VA 22217
01 July 76-30 September 77
$1,165,310.00
Advanced Research Projects Agency
ARPA Order 3125
Reproduction in whole or in pert i, permitted for any purpose
States Government.
of the United
retained in this document are ^ose of the authors _„ = i ,.ea00nfincr the official policies. The views and conclusions coni^u- r*;:; "e presenting the official polic
and should not be interpreted as ^^lirZZc^ Irojects Agency or the either expressed or implied, ol tne ^QV
United States Government.
ii
^...L^^
NRTC-77-43R
TABLE OF CONTENTS
1. INTRODUCTION & SUMMARY 1
2. DEVICE CHARACTERISTICS 5
2. 1 Electron Gun 5
2.2 Laser Plenum and Gas Handling 27
2.3 Discharge Circuit 38
2.4 Laser Diagnostics and Optics 53
3. LASER KINETIC ANALYSIS AND MODELING 60
3. 1 Molecular Kinetics 62
3.2 Radiative Extraction 68
3.3 Electron Kinetics 70
3.4 External Driving Circuit 80
3.5 Typical Analytical Results 82
4. EXPERIMENTAL RESULTS AND 125 THEORETICAL CORRELATION
4. 1 Experimental Results 126
4.2 Typical Theoretical Correlation 159
4.3 Scaling Considerations 166
4.4 Conclusions 167
111

1. INTRODUCTION & SUMMARY
The possibility of attaining high optical extraction efficiencies from lasers
operating on the bound-free transitions of rare gas halide excimers formed
in high pressure electrically excited mixtures is currently attracting much
interest " . So far, the most successful exploitation of this scheme has
been the development of the KrF laser , and extensive literature
on the kinetic processes and their rate constants is presently available. The
present program has been directed toward experimental and theoretical
investigation of the fundamental physical mechanisms of the KrF laser, with
the objective of demonstrating high volumetric extraction (~50 J/liter) at
high efficiency (~ 10%).
In order to demonstrate the potential of excimer laser systems for high
optical extraction at high efficiencies, a large volume laser device was
constructed. The operating characteristics of this device, which shall be
described in detail in Section 2 , were chosen in such a way as to provide
maximum flexibility for investigating, in addition to the Kr F system, other
promising molecules. It is shown how the basic geometry developed from
various constraints imposed by the requirements of electron beam and
discharge excitation of the low impedance medium. Under nominal conditions,
the electron gun operated at a beam voltage of 320 KeV for current densities
of 10-20 A/cm and 1000-2000 cm apertures. Pulse lengths, typically one
microsecond, required the development of discharge circuits capable of
driving significant energy through the inherent circuit inductance over these
times. In this regard, both fast capacitive discharge and pulse charged
discharges, designed to circumvent a portion of the circuit inductance, were
developed. The resulting circuitry was highly successful providing for a
repeatable and reliable source at full rated energy and charge voltages.
These references appear at the end of Section 1. (pages 2-4).

In order to optimize the performance of the KrF laser and to understand
its scaling to high power and high volume, it is necessary to understand the
kinetic and pumping processes which are responsible for the foimation and
quenching of the excited species. In Section 3 , the details of a comprehensive ,. , , 1(17)-(19), (30)
theoretical model will be described. This model, which consists of
an extensive computer analysis of the coupled set of equations for molecular
kinetics, electron kinetics, radiative extraction, and external driving circuit,
was constructed from a more general computer code which automatically
synthesizes the complete coupled analysis by translating symbolic reactions
into computer-coded equations. The general synthesis code, -vhich is applicable
to a broad class of electrically excited laser systems, makea i-. possible to
obtain a complete coupled analysis of the mor-t complicated kinetic scheme
containing an arbitrary number of reactions and interacting species with virtually
no effort. The cods synthesized for analysis of the KrF system, which involved
a reaction scheme of ~ 80 kinetic processes has been successful in experimental
comparisons over a wide range of operating parameters for the scale-up
and other experimental devices. Under optimum conditions, the code predicts a
specific optical output of ~ 35 J/liter with a ~ 6. 5% extraction efficiency.
Section 4 contains the experimental results and a comparison with the
theoretical analysis for a typical set of conditions. Due to nonuniform
electron beam energy deposition in the direction of propagation, both total
extracted energy and discharge enhancement were severely limited. As a
result, experiments were conducted with 3 and 10 liter extraction volumes in
order to optimize specific energy extraction and total output energy, respectively.
Under optimum conditions, total energy output was 90 J for a 10 liter volume,
and for the 3 liter volume, specific extraction was 22 J/liter for beam current 2
densities on the order of 20 A/cm . Efficiency in both cases was about 10%.
(1) S. K. Searles and G. A. Hart, Appl. Phys. Lett. 27_, 243 (1975); Appl. Phys. Lett. 25, 79(1974).

(2) S. K. Searles, Appl. Phys. Lett. 25, 735 (1974).
1 ' J. E. Velazco and D. W. Setzer, J. Chem. Phys. 62, 1990 (1975).
v ' E. R. Ault, R. S. Bradford, Jr., and M. L. Bhaumik, Appl. Phys. Lett. 27, 413 (1975).
(5) C. A. Brau and J. J. Ewing, Appl. Phys. Lett. 27, 435 (1975).
J. A. Mangano, J. H. Jacob, and J. B. Dodge, Appl. Phys. Lett. 29, 426 (1976).
M. Rokni, J. H. Jacob, J. A. Mangano, and R. Brochu, Appl. Phys. Lett. 30, 458 (1977).
(8) J. G. Eden and S. K. Searles, Appl. Phys. Lett. 29, 356 (1976).
(0) v' J. J. Ewing and C. A. Brau, Appl. Phys. Lett. 27, 350 (1975).
( 'R. Burnham, F. X. Powell, and N. Djeu, Appl. Phys. Lett. .29, 30 (1976).
(11)C. P. Wang. Appl. Phys. Lett. 29, 103 (1976).
(12)J. A. Mangano and J. H. Jacob, Appl. Phys. Lett. 27, 495 (1975).
'M. L. Bhaumik, R. S. Bradford, and E. R. Ault, Appl. Phys. Lett. 28, 23 (1976).
( 'J. H. Jacob and J. A. Mangano, Appl. Phys. Lett. 28, 724 (1976).
J. D. Daugherty, J. A. Mangano, and J. H. Jacob, Appl. Phys. Lett. 28, 581 (1976).
( 'W. B. Lacina, R. S. Bradford, Jr., E. R, Ault, and M. L. Bhaumik, "Kinetic Studies of the Krypton Fluoride Laser", presented at Ninth International Quant. Elect. Conf., Amsterdam, Netherlands, June 1976.
W. B, Lacina and R. S. Bradford, Jr., "Kinetic Modeling of Electrical Lasers: Results for KrF", presented at Twenty Ninth Gaseous Elect. Conf., Cleveland, Ohio, October 1976.
( 'W. B. Lacina, R. S. Bradford, Jr., D. B. Cohn, J. B. West, D. Richman, W. H. Long, and M. L. Bhaumik, "High Power Rare Gas Halide Laser Investigations", presented at Seventh Winter Colloquium on High Power Visible Lasers, Park City, Utah, February 1977.

(19) v 'W. B. Lacina, R. S. Bradford, Jr., and M. L. Bhaumik, "Kinetic Studies of the KrF Laser", Northrop Kept. NRTC-77-29R, March 1977.
W. B. Lacina and D. B. Cohn, to be published Appl. Phys, Lett., January 1978.
^21)H, H. Nakano, R. M, Hill, D. C. Lorents, D. L. Heustis, and M. V. McCusker, "New Electronic-Transition Laser Systems", SRI Report No. MP 76-99, December 1976.
' ' J. A. Mangano, J. H. Jacob, M. Rokni, and A. Hawryluk, Appl. Phys. Lett. 31^ 26 (1977); M. Rokni, J. H. Jacob, J. A. Mangano, and R. Brochu, Appl. Phys. Lett. %l, 79 (1977).
(23) v 'J. E. Velazco, J. Kolts, and D. W. Setser, J. Chem. Phys. 65^ 3469 (1976).
(24) D. K. Böhme, N. G. Adams, M. Mosesman, D. B. Dunkin, and E. E. Ferguson, J. Chem. Phys. 52_, 5094 (1970).
(25)F. J. Mehr and M. A. Biondi, Phys. Rev. .176, 322 (1976).
(26) A. Mandl, Phys. Rev. A3, 251 (1971).
(2 7) L. T. Kieffer, JILA Info. Center Rept. 13, September 1973,
(28) M. Scraper and H. Scheibner, Beitr. Aus der Plasma Phys. 9.» 45 (1969).
(29) M. J. Lerger and S. M. Seltzer, Studies in Penetration of Charged Particles in Macter. Nat'l Acad. Sei. Publ. No. 1133, Chapter 10 (1967). Due to multiple scattering effects, energy deposition in a high pressure gas is usually somewhat larger, and the effective.excitation cross sections used in the analysis are taken to be a factor of 2.0 times the Berger and Seltzer values.
The computer code was developed under an NRTC, IR&D program and was supported in part by the Advanced Research Projects Agency of the Department of Defense and monitored by the Office of Naval Research under contract N00014-76-C-1100.
.,,■.. .. ...■-.■—, --a^-Kat „Mi, |fll -„rn [i rn-aaii, ,i ■-...—!— ._,

2. DEVICE CHARACTERISTI S
Electron beam and discharge excitation of large volume, gaseous laser
media can be accomplished only through a limited set of geometries. In the
present case of high pressure, rar»? gas-halogen mixtures, it is advantageous
to have the electron beam colinear with the discharge current in order to
increase the beam range which would otherwise be severely limited. The
additional requirement of a moderately long gain medium dictates that the
optical axis be aligned at right angles to the electron beam direction. These
constraints haT e led in the present instance to a device which utilizes a large
aperture, 20 x 100 cm , e -beam propagating across about 10 cm of gas to
a discharge anode of similar cross sectional area. Various other system
design parameters were chosen to accomodate the use of high pressure and
corrosive gases and the need for a low inductance discharge circuit.
The ♦ .♦•?.l laser system is shown in a conceptual rendering in Figure 1.
The high pressure laser plenum is in the form of a half-cylinder situated
between two box like structures. The structure to the left of the plenum
houses the electron beam power supply with a 50 kJ storage capacity, capable 2 2
of sustaining 360 kV beams at current densities of 20 A/cm over a 1000 cm
aperture for 0. 5 n s. The structure to the right contains the discharge power
supply capable of 100 kV pulses for 1 |j. s into the 0.25 ohm plasma discharge.
Other peripheral equipment includes a gas handling system, seen at the lower
edge of the drawing, and a shielded electronics diagnostics room at the upper
edge. These components are described in detail in the following paragraphs.
2. 1 Electron Gun . In order to generate the large area, relatively high
electron beam current densities required of theKrF system, the cold-cathode,
field emission technology was adopted. Such devices make use of the electrons
produced in dense plasmas formed around sharp cathode edges under the
action of intense electric fields. The electrons, accelerated in the generating
MUAB

•i
NORTHROP
. ,>
Figure 1 - Experimental Arrangement
-^^mm ^^^^.— ä^i^T^:^..
elftctric field, pass through a thin mete 1 foil which serves as the anode
plane. The parent plasma, expanding from its place of origin at the cathode, 6 ,
approaches the anode at velocities on the order of 5 x 10 cm/sec and upon
contact terminates the pulse. Since the background pressure is on the order
of 10" mm Hg, the residual gas plays no role in these processes. It has
been shown that the diode behavior is space charge limited and therefore
follows the Child-Langmuir law ,
3/2
d*(t)
where J is current density, V is electrode voltage and d is the anode-cathode
separation. The major tradeoff in cold cathode devices is therefore between
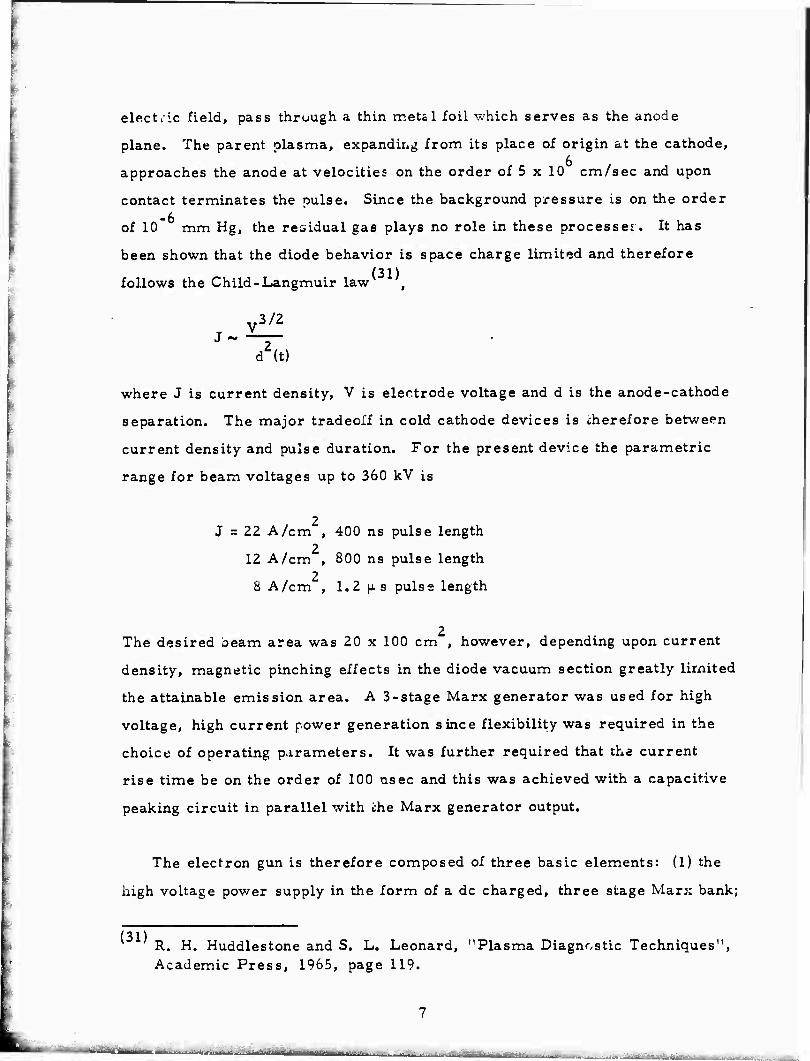
current density and pulse duration. For the present device the parametric
range for beam voltages up to 360 kV is
J = 22 A/cm , 400 ns pulse length
12 A/cm , 800 ns pulse length 2
8 A/cm , 1.2 |JLS pulse length
2 The desired beam area was 20 x 100 cm , however, depending upon current
density, magnetic pinching effects in the diode vacuum section greatly limited
the attainable emission area. A 3-stage Marx generator was used for high
voltage, high current power generation since flexibility was required in the
choice of operating parameters. It was further required that the current
rise time be on the order of 100 nsec and this was achieved with a capacitive
peaking circuit in parallel with ehe Marx generator output.
The electron gun is therefore composed of three basic elements: (1) the
high voltage power supply in the form of a dc charged, three stage Marx bank;
R. H, Huddlestone and S. L. Leonard, "Plasma Diagnostic Techniques", Academic Press, 1965, page 119.
Isiiiic^irimssmnuii
(2) the emitting cathode and its associated corona ring and; (3) the high
pressure foil support. These items are indicated pictorially in Figure 2 and
will be discussed below in detail followed by a presentation of typical perform- (32)
ance characteristics
Electrical Design, "he electrical system consisted basically of the Marx
bank And ics attendant higa voltage trigger generators and crowbar switch; the
output peaking capacitors and series peaking switch; and the delay trigger
generators and control circuitry located in a console external to the device.
AH of the high voltage components were immersed in insulating oil within
a completely sealed metal enclosure to prevent excessive rf radiation. Energy
was coupled from the Marx power suppl/ to the gun cathode through three
feedthroughs in order to minimize nonuniforrnities in the current supplied to
the cathode surface. Of critical importance was the design of the current
feedthroughs in vacuum, since high voltage breakdown was a major concern
at the intended gun voltages. As a result, a comprehensive analysis of the (32)
geometry dependent electrical characteristics was undertaken . Other
elements of the electrical design were not as sent ve since insulating oil
and simply excessive stand-off distance could be relied upon. Metallic walls
surrounding the cathode corona ring, for example, were maintained at a
distance at least twice that from the ring to the foil ground plane, and this
arrangement was highly satisfactory.
The crucial elements of the feedthrough design are shown in Figure 3
where the contours indicate equipoten^ial points obtained from a computer
calculation of .Laplace's equation. The areas of greatest concern are along
the insulator surface and at the insul" .or-conductor-vacuum triple point.
Calculation of the electric field along '.he insulator indicates a maximum field
(32) The electron gun was provided by Systems, Science and Software of Hayward, California who performed the critical design study as well.

03 cr> TO Im o
u. re CD C C «5 UJCJ
05
5 fw
(
\ i i
i
t ' r I
' i
o -*—» re E
o
"re U. o o
c =3 o c o 1_
"o a>
CD i_ =3
0 ■a re 0 C J= £ ro 0 O 0 >o
rrrriBitiir TTn"Ttf»iir

Conductor ^\/(V • 400 kV)
10 cm
Vacuum £»1
Conductor (V s 0)
Figure 3. Feedthrough Equlpotential ProfMes
10
mmstmm

intensity of 57 kV/cm for 400 kV applied to the cathode, and since the
predicted breakdown field intensity is 196 kV/cm, a safety factor of 3.4 is
realised. The triple point field is also comfortably low based on design
experience.
The gun circuit elements wert; specified after analysis of the equivalent
circuit shown in Figure 4. The Marx circuit inductance was estimated at
about 1,0 fiH, therefore it was expected that the beam voltage risetime would
exceed the 100 ns limitation, and indeed this was the case. In order to
achieve a shorter risetime, the peaking capacitor, C , and series switch, S ,
were added. In this latter case, switch S was set to actuate after C reached
the desired peak voltage. The circuit was analyzed for various values of C
and an initial charge voltage of 400 kV. A current density of 10 A/cm
(20 kA total) was assumed and the nonlinear dependence of current density
on voltage and the collapsing anode-cathode spacing were taken into account.
The results are shown in Figure 5 and indicate that the desired risetimes
are achieveable with slight overshoot in the voltage, dependent on the choice
of C . These data were reproduced experimentally in their essential details
as outlined below in the discussion of gun operation.
With regard to the actual circuit components, each stage of the Marx
bank was composed of four capacitors in a series/parallel configuration for
a per stage capacitance and voltage capability of 1.85 JJL F and 133 kV,
respectively. Therefore, total capacitance and maximum erected voltage
for the three identical stages was 0. 617 ji F at 400 kV, at a total energy
storage of 50 kJ. The peaking capacitor, C , was composed of 2 banks and
each capacitor bank was formed from five capacitors in series for a total
bank capacitance of 40 nF and a stand-off potential of 500 kV.
A mechanical crowbar was included at the output of the Marx bank which
disengaged at the point of full charge. This was found necessary to prevent
11

Li S 2 L 2
r-WM/VW^ T ^-WH
'2
R.
/-
Ci ■ Marx capacity - 6.2 x 10, F L^ • Marx inductance» 0.9 x 10'6, H R^ Marx series resistance» 0.15 O S^' Switch closes atta 0 C2" Peaking capacitor - 0: 3 x 10"8 F; 1.5 x 10"8 F S2a Switch closes when C2 charged to 400 kV L2r Peaking circuit inductance - 0.15 x 10'° H R2* Gun impedance
Figure 4. Electron Gun Equivalent Circuit
12

500
450
400
350
_ 300 -> -*: <m*
03 250 CO
o > 200 V
■a o x: 150 ns O
100
50
0.4 0,8 L2
Time (us)
L6 10
Figure 5. Equivalent Gun Circuit Response
13

application of voltage to the cathode under conditions of false triggering
which otherwise would cause erractic erection of the Marx voltage below its
intended level leading to arcing in the vacuum section and possible foil
rupture.
The gun voltage was measured with a capacitive divider attached directly
at the output of the Marx bank and provided a consistent and accurate monitor
of the gun condition. An attempt was made to monitor gun current at each of
the feedthroughs and at the Marx ground connection. In the former case,
three independent Pearson current probes were installed, one surrounding
each of the three current feedthroughs. However, due to the necessity of an
extreme high voltage stand-off distance between the feed connection and the
grounded probe case, extraneous signals were introduced and that method of
measurement was abandoned. The ground connection monitor was found to
provide an accurate measurement of total current but was not useful in
diagnosing various gun malfunctions and was also abandoned. The gun voltage
monitor, correlated with Faraday cup measurements, provided the only
reliable gun diagnostic tool.
The console housed all the controls necessary for operation of the gun.
This included gauges and setting valves for the switch SF. pressures, the
delay trigger generator for actuation of the start and stop circuitry, vacuum
gauges to determine the condition of the diode section, the Marx bank charging
voltage indicator and various interlock mechanisms.
Mechanical Design. Both the cathode and pressure window support were
central to the gun design since they directly determined the available current
densities and spatial uniformity.
-4 The cathode was composed of 7. 6 x 10 cm thick tantalum ribbon, spot-
welded to a stainless steel sheet base fixture which was then attached to the
14
face of the corona ring. The ribbons projected about 1 cm above the support
sheet and adjacent ribbons, running the 1 M length of the plate, were spaced
approximately 1 cm apart. The entire emitting surface, constructed in this
manner, was 25 x 100 cm in area. Two basic types of cathode were employed
one providing for high current densities on the order of 20 A/cm and the other 2
providing for current densities up to about 12 A/cm . Curvature away from
the anode at the center of the high current cathode was deemed neceesary in
order to increase the current density at the cathode edges and so minimize
the counter-effect of beam magnetic pinching. By the Child-Langmuir law
presented above, the central current density would necessarily drop below
that at the edges as a result of increased anode-cathode separation. This
was found to be the case and will be discussed below.
The diode corona ring and specially J' iped field grading rings at the
base of the plastic feedthroughs were made of polished aluminum and
swabbed with diffusion pump oil in actual operation. Apparently the thin
film of oil greatly reduced the tendency to arc and therefore increased
general machine reliability.
The cathode structure and corona ring were mounted on moveable,
vacuum tight shafts which projected through the plastic feedthroughs into
the Marx tank. This allowed variation of the anode-cathode distance through a
mechanism external to the vacuum vessel without destroying the diode vacuum
integrity.
The pressure window was composed of a complex sandwich of screens
and foils as shown in Figure 6. In their path from the cathode surface to the -3
high pressure cell, the electrons are seen to traverse a 1.8 x 10 cm
thick aluminum ground foil, a vacuum drift space between the support webs, -3
a support screen, a 5 x 10 cm thick pressure bearing foil and finally the
arc protection screen.
15

Vacuum
Pressure
Cathode Surface
^/Al Foil
Support Web
Support Screen
50 um Al Foil
\ Ground Plane Screen
Anode Surface
Figure 6. Foil Support Structure
16

The ground foil was necessary to provide a uniform ground plane for the
cathode since in its absence arcing would occur to the sharp support webs.
This effect was aggravated by the requirement of high current densities which
necessitated a small anode-cathode separation. The ground foil also served
to absorb low energy electrons generated during the voltage rise, thereby
preventing unnecessary heating of the second foil under stress by high pressure
gas.
The support web structure was developed to provide the greatest open
area consistent with operating pressures up to 5 atm and the expected beam
incidence angles due to magnetic deflection. As a result, the design called for
deep, widely spaced webs with a superimposed support screen. The support
webs were formed in a ladder configuration, machined from a solid plate of
aluminum. All the webs were 0. 8 cm thick and spaced so as to provide for
open squares of 49 -m area. Those webs running longitudinally down the
1 M extent of the ladder were 3 cm deep and those in the 20 cm transverse
direction were 2 cm deep.
The support screen was stamped from . 16 cm thick stainless steel in a 2 -2
pattern which allowed for 0. 6 cm open squares and 8x10 cm wide minor
ribs. The resulting configuration of support webs and support screen
resulted in a geometrical beam transmission /actor of 65%. Of course, the
actual beam transmission factors were reduced somewhat from this value due
to the angular trajectories of electrons striking the support ladder. This
effect is taken up below in consideration of beam uniformity.
.3 The 5 x 10 cm thick high pressure-vacuum interface foil was formed
from aluminum alloy #5056-H19, since this afforded the highest yield
strength for the foil temperature rise expected. The maximum pressure
called for in the experimental program was 4 atm absolute and under this condition
17
Mttdiiia i m Bga^^s i ^^OBA. lafe^.-^ =i>_-k-;^„:..;-
the foil and its support structures performed satisfactorily under electron
beam operation.
Finally, a screen was placed over the foil but separated from it by 1 cm,
and served the function of providing a uniform ground plane opposite the
discharge anode. Secondarily, arcs generated in the discharge process were
terminated on the screen thereby preventing foil rupture. The screen was
70% transmissive and was woven from 0. 16 cm diameter stainless steel wire.
Diagnostics. The most important aspects of gun performance were
current density and deposition uniformity. In order to determine these
properties as accurately as possible, several diagnostic techniques were
employed. With regard to current measurement, a 0. 635 cm diameter
Faraday cup was used to measure temporal behavior and a check on
absolute current was made with a Pearson current probe and found to
correlate within 10%^ , Overall spatial uniformity was measured with
electron dosimetry film (cinemoid) and calibrated with the Faraday cup
which provided excellent spatial resolution owing to its small diameter.
The Faraday cup consisted of the innermost, 0. 635 cm diameter aluminum
collector surrounded by a pyrex insulator and an outer stainless steel sleeve,
connected to the signal cable shield. Crucial to proper operation was the
application of insulating tape over the probe end which prevented charge
buildup on the collector from shorting either to the shield or to the foil
through the plasma generated in air by the electron beam. The signal was
transmitted directly to the proper attenuators and a 50 ohm termination at the
oscilloscope. With this technique, spurious signals generated by EMI were
kept to approximately an oscilloscope trace width.
(33) v Pearson Electronics, Inc., Palo Alto, California.
iü

A check on the Faraday cup accaracy was performed with the apparatus
shown in Figure 7. The entire output aperture of the beam, just beyond the
foil was blanked off with the exception of a 2 cm diameter hole in the center
which allowed access to a small portion of the beam. A plastic insulator
and aluminum collector were fitted into the hole and the collector was returned
to ground through the Pearson current probe. The Faraday cup was fitted
to the same blank off plate to provide simultaneous measurement. As
mentioned above, the absolute current correlated within lOfo, with the
Faraday cup reading slightly low, and no difference in the two temporal
waveforms was discernible.
Spatial plots of the beam output aperture were made with electron
dosimetry film and simultaneously with the Faraday cup over a limited
spatial extent. It was found that the spatial gradient determined from the
film with a transmission densitometer was within 25% of that measured with
the Faraday cup.
Electron Gun Performance. Typical oscilloscope traces are shown in Figure
8. Figure 8a indicates Marx voltage and beam current measured with the
Faraday cup at the foil pressure window, in the absence of the capacitive
peaking circuit. The voltage is shown to rise to roughly half its maximum
value before the output current starts, the delay being due to the requirement
for substantial cathode voltage for emission. Total voltage risetime is 200 ns,
whereas the current risetime is about 300 ns. Beyond the 300 ns point in the
current pulse, the slope is still positive, however, this further increase is
attributable to the decreasing effective anode-cathode distance as the
emitting plasma propagates from the cathode blades to the anode plane. The
current waveform, as indicated by the small diameter Faraday cup, shows
only slight modulation superimposed on the basic sinusoidal shape. Three
Faraday cups separated by 7 cm in the output window major direction and
19

Support Webs /
Foil /
Electron Beam
Aluminum Plate
Ground Shield /insulator
To Oscilloscope
Collector
Aluminum Beam Collector
o Oscilloscope
Pearson Current Monitor
Figure 7. Current Density Calibration Apparatus
20
Hüeafe *,*,"**,'-iJ11J*-^K'1^ " —-■ ■•-■—--^-"-—1 | .«:.---^-^^J

(a) Peaking Canscitance • 0
Voltage
70 kV/Div
Beam Current
3A/cm2/Div
200 ns
(b) Peaking Capacitance-40
nF
Voltage
70 kV/Div
BSSBBBSBSS&S BWBBSSS^I
llaSEi^Si BiSJESJIIDOSS^j EZSBBSHSSH^^
BSma
Beam Current
3A/cm2/Div
-200 ns
Figure 8. Typical Gun Performance Traces
21
T— ill " T^r^hrima,,^- ;v" '"" ^M mflfiliTriilillilir

operated simultaneously, showed the same basic temporal shape but no
correlation in the modulation. Therefore, the slight noise was not due to
common mode signals and was spatially randomized, at least over distances
of 7 cm.
Figure 8b shows both Marx voltage and resultant output current with
the peaking circuit connected. In this case, the voltage risetime is about
100 ns with a 20% overshoot beyond the average value. This is reflected
in the fast rising current pulse and leads to more severe modulation which
is further accentuated by the plasma propagation mechanism indicated above.
A series of Faraday probes, operated as outlined above, showed the same
relative oehaviors.
Overall uniformity measuremfints were made with electron dosimetry film
which was shown to be sensitive to electron current but insensitive to x-rays.
Bleaching of the film was therefore related directly to the electron current
density and measurement of this effect with an optical transmission
densitometer afforded a direct indication of beam current gradients. Typical
profiles obtained in this manner with the film in contact with the foil are
shown in Figures 9 and 10. Figure 9 indicates the beam current distribution
along the central major axis of the output window for the high density cathode.
The accentuated emission at each end is due to the slight cathode curvature
as mentioned above and enhances beam uniformity deposition in the high
pressure gas at these areas which would otherwise show severe end gradients
due to gas scattering. Similar results were obtained with the low density
cathode at central current densities -tf 10 A/cm
increase in end intensity was not as pronounced.
cathode at central current densities -tf 10 A/cm . In this latter case, the
Figure 10 indicates the transverse beam uniformity, scanned from the
center ci the foil to the top across the output aperture minor axis.
Z2

T 1——r T r
20 A/crn^
I L
20
j i
40
_l L
60 80 100
Distance (cm)
Figure 9. Longitudinal Beam Current Profile
23
tf ITT^PT 'i Ti t^

20 A/cm
Center
\ \
Web
Cathode II Top
10 cm
Figure 10. Transverse Beam Current Profile
24
:=-=-^ ■-... ■ ■ .-^-^^^^^fs'JHB^

Characteristic of the high density cathode I is a severe gradient in this
dimension, enhanced by the presence of the deep supporting webs. The
fall-off in current from 20 A/cm at the center to roughly half this value at
the left edge of the web is likely due to the interception of those electrons
approaching the right side of the web at large entrance angles due to vacuum
magnetic field pinching. Simple calculation of this angle assuming the electrons
move at relativistic velocity in the magnetic field established by the vacuum
beam current, indicates an entrance angle of about 42 to the normal. This
is close to the value indicated by the data of Figure 10, assuming major
obscuration over about 3 cm to the left of the web and a web depth of 3 cm.
With dosimetry film placed 5 cm away from the foil in air, these large
gradients in beam current measured at the foil were not detectable due to
randomized gas scattering. The actual experimental conditions called for
1. 7-3 atm of Argon, which further reduced the gradients.
Deposition uniformity in the beam direction into the high pressure gas
was perhaps the most important characteristic, due to considerations of
discharge stability to be discussed with the experimental results. In order
to determine the extent of this important effect, both theoretical calculations
and experimental estimates were undertaken.
The theoretical effort was based on an electron, Monte Carlo scattering
computer code which calculated the combined effects of foil scattering, gas (34)
scattering and secondary emission from the anode . Results for a 350
keV beam passing through a 50 [im thick foil and impinging on 3 atm of
Argon are shown in Figure 11. The view shown is made to simulate the end
view of the present apparatus which had a total beam aperture of 20 cm and a
maximum anode-cathode separation of 10 cm. The contour lines indicate
(34) J. A. Halbleib, Jr. and W. H. Vandevender, "Cyltran: A cylindrical- Geometry Multimaterial Electron/Photon Monte Carlo transport Code", Sandia Laboratories, Albuquerque, New Mexico 87115.
25

4 -
E u
o c IS 'to o S 12
16
I 20
1
350 keV Beam
I
/ h l
I I I \
I. \ N
7—7 ^
' \24 1 \ 18 V-
. v. '- Center Line
i i t i i i i t
16 12
Distance (cm)
Figure 11. Computed Energy Deposition Profiles
26

points of constant energy deposition in keV/cm which when multiplied 2 3
by the initial current density in A/cm, indicate power deposition in kW/cm .
The analysis shows that a peak in the deposition occurs at about 4 cm into the
gas after which it falls off by 25% over 10 cm. In the other direction, from
center to edge, the fall off is roughly 50%.
An approximate experimental measurement of beam current density
fall-off with distance from the aluminum foil was attempted by placing both
dosimetry film and a Faraday cup within the high pressure laser cell. The
two techniques correlated within about 20% and indicated a very pronounced
current density fall-off as shown in Figure 12. The beam energy was 320 keV,
and the cell was pressurized with argon. These measurements, of course,
indicate current density only, however, an independent measurement of total
energy deposition via spatially resolved fluorescence in a separate device at (35)
NRTC yielded substantially similar gradients
It will be shown in a subsequent section dealing with the experimental
results how nonuniformities in beam energy deposition were directly
reflected in the laser output energy profiles and how such nonuniformities
greatly limited ths attainable discharge energy input.
2.2 Laser Plenum and Gas Handling. Design of the laser plenum and the
associated gas handling apparatus was guided by the requirements for operation
with halogens mixed in high pressure diluents. Additionally, the plenum
geometry was constrained by the necessity for low discharge current return
path inductance. With regard to materials, it was considered crucial that
those appropriate to proper passivation and operational cleanliness be
chosen. Therefore, all metallic parts were constructed out of either
stainless steel or aluminum, and teflon was used for all Insulating areas. In
(35) J. West, Northrop Research and Technology Center, private communication.
27

Foil
Distance (cm)
10
Figure 12. Current Density vs Distance from Foil
28

order to minimize discharge circuit inductance, the basic plenum design
called for four parallel discharge current feedthroughs and a 300 liter high
pressure cell in roughly a semi-cylindrical geometry.
Operationally, the apparatus performed as designed. The important
limitation to the geometry was foreseen as arcing either from the discharge
electrode to the chamber walls or tracking along the teflon feedthrough
insulators. Neither occurred except under extreme tests, wholly
unrepresentative of actual experimental conditions.
Laser Plenum. The high pressure laser plenum was formed from a
stainless steel, half-cylinder attached to a massive flange which provided an
interface to the electron gun. Material sizes and methods of construction
were consistent with a 10 atm static pressure load, assuming fill pressures
up to 5 atm and 10 atm, pulsed over-pressures. Safety factors were
therefore judged to be a factor of five. The plenum and the pumping apparatus
attached to it were in turn secured to an oil filled, aluminum container
housing the discharge switching circuitry and capacitor bank. The two
attached structures were then allowed to roll on a track providing for
separation from the electron gun for servicing both the electron gun and the
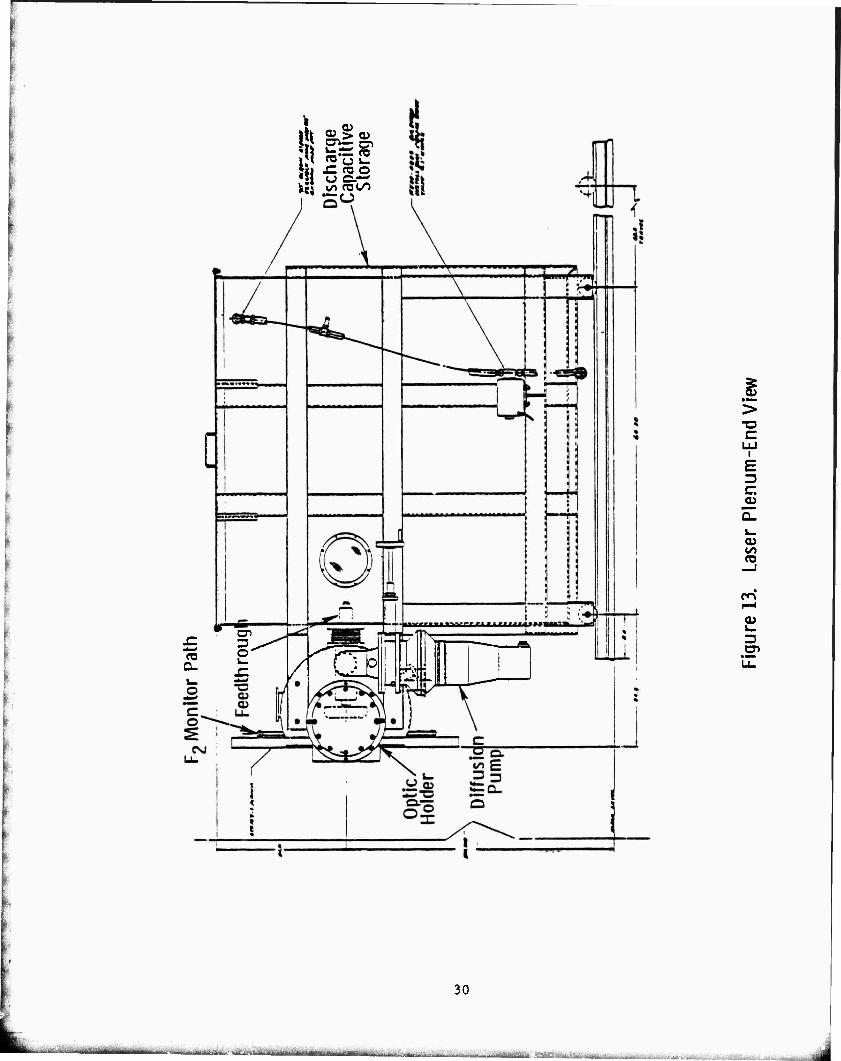
plenum interior. These components are shown in detail in Figures 13 and
14 which provide an end and front view, respectively. A picture of the
assembled apparatus is shown in Figure 15,
Figure 13 shows the method of attachment of the plenum to the discharge
capacitor bank housing as well as the placement of the pumping apparatus.
With regard to the pumping method, a 6" diameter diffusion pump with a liquid
nitrogen cold trap was used and found capable of pumping the entire system
down to 5 x 10 mmHg before e'.ch gas fill.
Figure 14 indicates the positions of the four discharge current feeds and a
fifth feed which allowed direct attachment of voltage sampling circuitry to the
29
»iK :lt.l -„ ., :
en
|tk « > cu
Jh £ re o ^1 ^ rocn
50
ro^
E r.
CD
re
crS
30
'n"- iinrlnTr"' ■ .^^■IK^U.-M^.,„U±^. ,

I c o l_ u.
I
E c a.
to CD
'a- r—I
03 i_
CD
31


discharge electrode. Also shown is the diagonal optical path for the He-Cd
laser used to monitor F partial pressu
These diagnostics are discussed below.
laser used to monitor F partial pressure through absorption at 3250 A.
Detailed schematics showing the relative positions of the important
elements are shown in Figures 16 and 17. Of special interest are the
feedthrough geometry, anode attachment and shape, and optical attachment
and method of adjustment.
Insulation of the high voltage feedthroughs inside the plenum w^s provided
by the teflon sleeving. Outside this volume, insulation was provided by the
transformer oil which was allowed to penetrate the bellows attachment area
from the discharge capacitor tank. Attachment to the discharge anode was
made via a slip collar, allowing for adjustment of the anode-cathode dimension
from a maximum of 10 cm to a minimum of 2 cm. The anode itself, of
overall dimension 20 x 100 cm , was formed from aluminum into a Rogowski
profile consistent with a 10 cm electrode spacing. The profile geometry
was considered successful in that traces of arcing at all anode-cathode
separations took the form of diffused blemishes along the central third of
the electrode, and no tracking was observed along its perimenter.
Contributing to this success was the presence of a uniform ground plane
presented to the electrode well beyond its edges, as indicated.
Placement of the optical extraction area in relation to the excitation
volume was crucial, owing to the nonuniformity of energy deposition in the
high pressure gases. As indicated in the accompanying figures, extraction
was obtained immediately beyond the ground plane screen, however, the
extent of the extraction area in the anode direction depended upon the optical
holder profile. In this regard, two types of holder were used providing for
optical path lengths of 1.2 and 2.0 M. The first, shown in heavy lines in the
33

co
o CO
J2 t, '
F c TO QJ
b U U1
E 3 3 "O 3 < O (U > C 3
CD
ife =:
CL o C o u.
CD U1
03 E re
c
LkJ O ^^ 0}
re Ci
re o. -J O
a> jr CL CT» re 3.
-C |s xr> £ re "a
a> "OS 03 «/> !U. Sc
H
OJ
E 3 C
a. ■o
o
a> \_ 3 CD
34

> •a
E C
■a
to
o
s- =3 CD
35
.....,- „.■_ „Mtltm,tril

2 figures, provided for extension of a 10 x 20 cm optic well inside the plenum
volume and in this case, the available distance in the anode-cathode direction
open for extraction was 8.4 cm. The second method used a large, 28 cm
diameter optic indicated by the dotted outline in Figure ID attached directly
to the exit port, thus providing for extra^cion over the full 10 cm anode-cathode
iis' nee. In both arrangements, adjustment of the optics was provided by
the rnal adjustment bolts attached to the flexible bellows assembly. The
provision for changing optical path length at the expense of total extraction
volume was important, since it was shown experimentally that the decrease
in path length indicated above enhanced the specific energy extraction by
about 50%.
Gas Handling. The gas handling system was designed to fulfill several
important criteria. The entire system was required to safely handle Fluorine
at high pressures in the storage and passivation procedures. This also
included the parallel accomodation of high pressure rare gases without con-
tamination ard with additional purification if indicated. Proper mixing of
the various gas constituents at high pressure was to be guaranteed before
each electron gun burse. A continuous monitor of the F partial pressure
was to be provided since this crucial constituent was present in small amounts
and subject to chemical reaction at the chamber surfaces. These various
topics are described below in detail including the operational experiences.
It was found, in general, that the entire system performed well above the
experimental requirements.
The gas storage system was by conventional meanf Täth an explosion-
proof casing for the Fluorine and standard high pressure bottles for the rare
gases. Commerically available gases were used and this included Argon
(99. 998%), Krypton (99.995%), Xenon (99.995%), Neon (99.99%) and
Fluorine (97%). No attempt was made to verify the analyses provided by
supplier and Fluorine was nut purified beyond its stated level. However,
36

an attempt was made to eliminate water vapor and hydrocarbon contaminants
through the use of alumina gel and molecular -neve filters. It was found that
the laser behavior did not change with the addition of these filter types. The
gasas were admitted thuugh well passivated stainless steel tubes to the laser
plenum where mixing took place. The partial pressures of Fluorine, un the
order of 2-4 Torr, and Krypton, on the order of 100 Torr, were measured
with a capacitance roinometer which used a stairlcbs steel diaphragm in
contact with the gas. The higher total pressures, on the order of 2-4 atm,
were measured with stainless s'^el Bourdon tube gauges.
A high capacity cryo-pump was used to reclaim the costly rare gases.
The pump was composed simply of an aluminum cylinder surroun'.'ec t y a
liquid nitrogen bath. Gas which was subjected to about twenty bursts with the
electron beam and reclaimed in this manner showed no degradation due to
contamination. Upon re-use, no change in laser performance was apparent.
Using a He-Cd laser source, absorption at 3250 A was used to monitor
F partial pressure in the presence of high pressure rare gases in the laser
plenum before each electron gun burst. The monitor also provided an
indication of the gas mixing time after high velocity injection of the rare gases
through the small inlet orifice. The absorption coefficient of 0. 1 atm cm
was checked for the 1.7 M absorption path length with the capacitance manometer (36) in pure Fluorine at low pressures , For these low concentrations, total
absorption was 5%/Torr cf F , well within t';e resolution of the apparatus.
It was estimated chat accuracies of 0.25 Torr were realised. It was also
determined that the absorption was dependent only upon the F level and
independent of the neutral rare gas pressure. Sines the technique provided an
"on-line" measurement of F partial pressure, disturbances in concentration
^36^J. S. Whittier, M. L. Lundguist, A. Ching, G. E. Thornton, R. Hofland, Jr., J. Appl. Phys. 4_7, 3542 (1976), and private communication.
37
VSn Jr"--.^—: ■._.^,- ,-T. ',,, .A

along the absorption path were discernible during the mixing process. Mixing
was considered complete when the absorption level measured before introduction
of the rare gases was attained. Mixing times were on the order of several
minutes and operation of the laser at times greatly in excess of this value
showed no change in performance.
The arrangement of the monitor is shown in Figure 18. A 2 mW, He-Cd
laser operating at 3250 A was used as the cw source with the output split into
two paths, one propagating in air as the reference and the other propagating
diagonally through the laser plenum adjacent to the discharge ground screen.
A chopping wheel was used to allow the receiving photodiode to sample each
beam alternately. The photodiode output was displayed on an oscilloscope and
the difference signal interpreted directly as a measure of absorption.
Absolute calibration of the system was easily accomplished with the plenum
evacuated, in which case the angle sensitive attenuator was adjusted to give
zero difference signal.
2. 3 Discharge Circuit. Discharges in the high pressure gas mixtures
typical of the KrF laser are characterized by very low resistance. For
devices of the size under discussion, the characteristic discharge impedance,
a function of time, is on the order of 0.25 ohm. In this application,
typical high voltage pulsed circuits are limited by their inherent inductance
which can be on the order of 100-200 nH. The immediate problem, then, is
one of adapting conventional pulsed discharge circuitry, which normally
requires high impedance loads for efficient energy transfer. Design of the
present discharge cir uit was therefore guided by the requirement for
minimization of total circuit inductance. The basic circuit itself was of a
simple capacitive discharge type with subsequent modification into a two stage,
pulse charged configuration in an attempt to circumvent a portion of the
circuit inductance.
38

c SU
E CD c ro i_
< o *E o
CM u_
CD V- 3 CD
39

An extensive circuit analysis was first undertaken with best guess
parameters. Based on design criteria obtained in this fashion, the actual
circuit was constructed and tested with a fixed dummy load. It was found
that the circuit behaved substantially as predicted and that the total circuit
inductance was about 225 nH as estimated.
Circuit Analysis. The discharge circuit model is shown in Figure 19
with a typical set of component values. Three parallel sets of capacitive
storage are indicated, each with a series inductance of 50 nH and
resistance of 0.001 ohm. The load is represented by the variable resistance,
R, and the balance of the circuit including the switches and feedthroughs
is approximated by the 150 nH inductance and 0.010 ohm resistance. The
circuit pictured is a Chebishev filter, modified to work into a low impedance (37) load . Basically, the various capacitive and fixed inductance legs can be
thought of as contributing different frequency components to the final
waveform observed at the load. The complication arises in the interaction
of the various legs among themselves. Calculation of the fairly complex
resultant waveform was undertaken with a computer code which correctly
modeled all aspects of the circuit. The component values were extensively
varied theoretically with the result that those indicated were optimum.
In order to determine the circuit sensitivity to inductance, the output was
calculated for various experimentally attainable values of inductance;
and a load resistance of 0.5 ohm. The result is shown in Figure 20. For
an initial charge voltage of 100 kV, a change in inductance from 50 to 200
nH results in a factor of two increase in risetime to maximum voltage, and
over this range, the maximum achievable voltage applied across the
discharge drops from 80 to 65% of the initial charge voltage. Considering
(37) Reference Data for Radio Engineers, Fifth Edition, Howard W. Sams & Co., Inc., p. 8-24 (1968).
40
O.Oln L-150nH
« VW-« HHRP—i
Figure 19. Discharge Circuit Model
41
J,„„,,„,„„:i.aU„„0- .,

Time (MS)
Figure 20. Circuit Response to Variable i nductance
42

a nominal 1 |JL s pulse length, tne total input energy likewise drops from 8. 6
to 5. 7 kJ. Inductance is therefore crucial to discharge performance. Figure
21 shows the circuit response to variable load impedance assuming a circuit
indacatnce of 150 nH in addition to the 50 nH in each circuit leg. Since the
electron beam current density determines the load impedance through primary
ionization, each load resistor is associated with a beam current density.
Additionally, each value of current density determines the pulse length
according to limitations of the cold cathode electron gun technology. For the
0. 5 ohm curve, the 2. 0 |J. F capacitor has been increased to 4. 0 fi F in order
to minimize voltage droop over a 2 ji s pulse. The combination of low load
impedance with a moderately high circuit inductance results in very poor
energy coupling into the discharge. The maximum applied voltage is seen
to drop from 70 to 45% oi the charge voltage and risetime is extended from
400 to 700 ns. The spans shown at the right border of the graph indicate
the extent of optimum E/N for 2 and 3 atm total pressures and a 10 cm anode-
cathode separation. The implication is that even in the presence of poor
discharge coupling, the experimental parameters are within a useful range.
An attempt was made to circumvent a portion of the circuit inductance by
placing additional capacitance and a series switch directly across the load,
as indicated in Figure 22. Here, C and the 200 nH series inductance
represent the initial circuit, C and its 50 nH series inductance represent
the circuit addition, the 50 nH inductor in series with the load represents
the remaining circuit inductance, and the additional switch is provided by
the electron beam which induces an instantaneous impedance collapse
from infinity to 0.2 ohms across the discharge. Physically, these modifications
were carried out by placing capacitors encased in Pyrex cylinders directly
within the laser plenum beyond the major current feedthroughs and switches.
The discharge was operated by charging the main bank, C , switching this
onto C and waiting approximately 1 p. s for voltage buildup, and then firing
the electron gun which allowed current to flow through the medium from the
43
^.-v - ,.. -U. —.^—^^i-.
CVJ
E
i
E 3 E
1
/ /|
/ / -|
/ —> —1 /
1 id *i / / <o o / / — <NJ f "I / 1 • / / -"- / wmt / »^ / -1 ^ / 3. f
■»* ^. / esj fN- •—
1 / .— O / UJ UJ
/ 2. LU U?
/ »^ «-* / a. _ / CSJ "E A
1 tM u E <
/ ^ o 1 <
1 l/> \ G • J ; c " \ eva E
m S \ 0 QJ
o S \ , s i
V " ? \ ce UJ .J Xflß LU
\ x
_i 1
__j
C\J
E
00 Ö
a c
a> OS
-Q CO
>
a» to c o o.
Z3
CVJ
a>
Cn
(A)|) a5ei|0A S3
44

y.
E-Beam
50 nH
■WH
200 nH % 50 nH R=0.2n
C,«2/iF
Figure 22. Pulse Charged Circuit Mode!
45
.■..■.■.■i-. ■..::.-. F-rf?--i^a^.-. ^

composite circuit. The circuit was analyzed simply by assuming both C j
and C charged to the same potential and switched across a fixed load
simultaneously. Figure 23 shows the results for various values of C . The
indication was that the addition of C greatly improved the circuit risetime
and that the value of C should be as large as possible. Physical constraints
imposed by the plenum geometry limited C to 0. 7 |JLF.
Electrical and Mechanical Arrangement. The discharge circuit design
was guided primarily by the need for low inductance and secondarily by the
requirement for reliability and versatility. Therefore, the basic layout
called for stripline capacitive storage, low inductance switching techniques
and multiple current feedthroughs. Additionally, the design required that the
circuit components be kept in close proximity, therefore, the entire circuit
was submerged in insulating oil. The relative arrangement of the circuit
components is shown in Figure 24.
The capacitor bank C was composed of twenty parallel capacitors in five
rows connected by metal sheets in a stripline configuration. The row closest
to the main switch contained four capacitors, two each of 0. 015 and 0. 15 ^xF
capacitance and the remaining pieces were each 0.25 fiF. The intent was to
minimize inductance between the smallest capacitances and the load and
possibly add an inductor to the remaining bank, to slow up that portion of the
circuit and thus keep the voltage from drooping, in the spirit of the Chebyshev
circuit described above. However, under operation it was found that significant
voltage droop was desirable in order to keep the discharge from arcing,
therefore this modification was not attempted.
The switching circuitry was required to meet several criteria: jitter
after application of the trigger pulse was to be under 20 ns, reliable switching
was to be provided for initial voltages from 20-100 kV and total currents of
46
iiiiiiiiitririiiiiMiiiiii

50
40 -
Ä 30 5
o > 20
10 -
0.4 0.6 Time l/is)
Figure 23. Pulse Charged Circuit Response
47
c o
as ■a o CD O
en <X)
00 Im ro
xs
u.
«to* c 0)
o E 0) en c ro k. k. <
1 -
3 «J u.
k. •MM
O CJ
*E en o k.
^ ro
Qi o CD W) ro
o > -rf
CM O 1» 3 cn
i i i
E re o
CO
c o
UJ
E D C E 3
48

100 kA, and switch inductance was limited to 20 nH. In order to meet these
specifications, the most reasonable approach was a rail gap composed of two
continuous electrodes. Identical geometries were used for both the main and
crowbar switches. The other alternative of Individ«, ul spark gaps in parallel with
transit time isolation was considered far less versatile and more difficult
to accomodate physically.
Commercially available trigger generators and rail gaps, supplied by the (38)
Maxwell Laboratories were usedv . The rail gaps were constructed in a 30 cm
long three electrode geometry with a sharp-edged continuous trigger electrode
placed at the 1/3-2/3 point between two cylindrical main electrodes. Two
electrode spacings were required corresponding to the voltage ranges
20-50 kV and 50-100 kV, and the gaps operated in a 1/5.7 mixture of SF,
in Argon at pressures from 20-60 psig. The trigger generators produced
a 60 kV peak voltage pulse at a differential risetime of 10 kV/ns and were
sufficient to cause the formation of multiple current channels ( > 6) over the
full electrode extent for the entire voltage range. The trigger pulses were
capacitively coupled into each of the resistively biased trigger electrodes.
In addition, a^ isolating jpark gap and capacitive bias in the crowbar trigger
input guaranteed isolation and reliable switch initiation after significant
voltage droop late in the pulse. It was found that with this arrangement, the
crowbar switch would reliably hold off 100 kV at the beginning of a pulse
and reliably '.rigger after the voltage had drooped to 30 kV, providing for a
wide margin of operation at other voltages as well. Jitter for both the main
and crowbar switches was measured at under 20 ns over the parameter ra.iges
indicated above.
As outlined in the section dealing with plenum design, energy from the
capacitive storage bank was transmitted to the discharge electrode via four
(38) Maxwell Laboratories, San Diego, California.
49

high voltage feedthroughs. Briefly, the feedthrough length was 60 cm and
coaxial over about 20 cm with the remainder open to either the high pressure
laser gases or insulating oil.
Various peripheral circuit elements were added for convenience. A 10 ohm
Ammonium Chloride liquid resistor was connected at the output of the main
switch to ground in order f:o provide periodic calibration of the voltage ^nd
current monit' is and voltage bleed-off in the event of false ♦riggering
without electron beam operation. A mechanical crowbar was also attached
at the same circuit point to prevent premature voltage application to the
discharge electrode.
Basic circuit parameters were measured with a voltage probe attached
directly to the discharge electrode and current monitor in the ground leg of the
capacitor bank. Both monitors were designed to provide high level signals
without direct contact, thereby eliminating sources for interference. The
voltage probe consisted of a 500 ohm fixed resistor immersed in insulating
oil within a teflon cylinder. The (.? linder was fit inside the plenum and the
resistor attached through a conducting cylinder end cap to the discharge
electrode. The opposite end of the resistor, likewise connected to an
external cylinder end cap, was connected to ground thiough a toroidal (33) Pearson current probe with a risetime of 20 ns. Since the Pearson probe
calibration was 1V/A, signal levels were on the order ox 50-100 V. Absolute
calibration and frequency response were verified by parallel measurement
with a Tektronix voltage probe and the system operating at reduced voltage.
The current monitor, provided by Physic; International , was basically
a Rogowski coil wound on a line 1/2 M long and placed within a notch in the
condu ting sheet from the capacitor terminal to ground, thus providing for
(•'9) Physics International, San Biego. California.
50

a low inductance connection. The linear current probe responded to the
derivative of magnetic field and required an integrator to display current versus
time. The system had a risetime of 10 ns with an integrator of time constant
20 ji s (time to droop 10%). Calibration of the system was checked with a
reduced capacitor bank and the output measured with a Pearson probe through
a fixed dummy load resistor.
Performance. The entire discharge supply was tested with a 1 ohm
NHCl liquid resistor as a dummy load. In order to determine the inductance
under actual operating conditions, the load was formed from four parallel legs
7. 5 cm in diameter by 30 cm long, and returned to ground with IM wide
sheets to simulate the plenum walls. Typical voltage and :urrent waveforms
are shown in Figure 25. In Figure 25a, the trace starting at the upper left and
going negative is total current measured by the linear probe, and the bottom,
positive going trace is voltage applied to the dummy load as measured by
the voltage monitor. In this case, bank capacitance was 2.33 |iF with an
initial charge voltage of 50 kV, and the crowbar was set to actuate 3 |i s after
pulse initiation. The crowbar action is clearly apparent at the point where
the total current begins to rise steeply and load voltage begins to fall abruptly.
With the traces extended in time as in Figure 25b, an indication of the
ringing frequency through the crowbar circuit was obtained. The crowbar
inductance, calculated from the usual expression, was about 174 nH. In
similar fashion, the total discharge circuit inductance was measured to be about
225 nH. Therefore, it was expected that the actual discharge with impedance
less than 0.2 rj would compete favoribly with the crowbar for capacitor bank
energy and indeed this was the case. Discharge arcing was found to take
place via a number cf low inductance diffuse glows along the discharge
electrode, and did not enhance possible diversion of energy through the
crowbar. Therefore, although applicable to some situations, the crowbar
circuit was generally not useful.
51
a)
b)
200 ns
Current 9kA/dlv.
Voltage IOkV/div.
Current 18 kA/div.
Figure 25. Capacitive Discharge Circuit Waveforms
52

Typical traces for the pulse charged circuit operating into a plasma
generated by the electron beam are shown in Figure 26. In this case,
C = 2. 33 |a. F, C=0. 7fiF and the initial charge voltage was 30 kV.
figure 26a shows the electron gun voltage which approximates beam current
also, and Figure b shows the corresponding voltage (upper trace) and current
(lower trace). The discharge electrode voltage is characterized by a
steeply rising leading edge as capacitor C , initially at ground potential,
begins to charge. Likewise, the current waveform indicates this charging
cycle over the first 600 ns. Abruptly at 600 ns into the pulse charge, the
electron beam current is sufficient to cause a drastic drop in the discharge
impedance from inf'nity to about 0.5 ohm at which point the discharge voltage
drops to its operating point, at 10 kV. After this point, the current probe,
which measures total current in the ground leg of the main capacitive storage,
does not sense true discharge current supplied by both C and C . Discharge
voltage, on the other hand, rises then falls as the main bank is depleted.
Finally, at termination of the electron gun pulse, the discharge impedance
rises and this is indicated in the voltage trace as a slight peak at 1.4 ^ s.
2.4 Laser Diagnostics and Optics. The laser output beam was diagnosed
in its important aspects through a variety of techniques. Total beam energy
was measured calorimetrically, and two types of calorimeter were tested in
order to provide a consistency check. The beam temporal behavior was
monitored by a fast response photodiode with ultraviolet filters at the input to
shield against extraneous flourescence. Finally, approximate but effective
beam profile measurements were obtained through beam burn patterns on
unexposed and developed polaroid film. These techniques proved highly
consistent and reliable.
The laser optics involved state of the art technology to produce high
damage threshold, low absorptance reflectors. Since periodic optical damage
was caused by the combined effects of intense laser radiation, F attack and
53

a)
b)
70 kV/div.
Voltage a 5kV7div.
M Current ?25 9kA/div.
MiwaBtwa
200 ns
Figure 26. Pulse Charged Circuit Waveforms
54

x-ray radiation, optical quality was continually monitored by a simple,
2500 A reflectometer. In order to reduce costs incurred as a result of
large area optic damage, a set of small area optics was used in the initial
parameterization studies. As a result of these precautions and careful
evaluation of various vendors, performance of the optics was entirely
satisfactory.
Electronics. Design of the electronics arrangement was guided primarily
by the need to eliminate emi from both the triggering circuits and diagnostic
electronics. Primary shielding of the diagnostic electronics was provided
by a solid wall shielded room with 100 db attenuation at 100 MHz. All of the
oscilloscopes, photodiode bias supplies and low level delay trigger
circuitry were placed in this enclosure. The various diagnostic elements
themselves were located at the appropriate positions external to the shielded
room and connected to it through grounded, solid conduit and shielded
cable. The generation of false trigger signals due to emi in the various
trigger generators was a major concern. Therefore, an effort was made to
maintain high level signals at the components in the emi environment and to
maintain electrical isolation of the trigger systems. These efforts
proved highly successful, since false triggering was not experienced and
noise levels in the shielded room were kept to approximately two
oscilloscope trace widths.
Signals were recorded on 100 MHs bandwidth Tektronix oscilloscopes,
and common external triggering was provided by a synchronizing pulse
from the electron gun trigger generator. Coincidence of the various
oscilloscope traces was within 20 ns and this was considered adequate
at the 200 ns/div writing speeds used.
55

Diagnostics. AU the laser diagnostics were arranged on a massive
optical table as shown in Figure 27. The laser beam at full power was
transported first to a large uncoated beam splitter which diverted 10% of the
power into the diagnostic setup and allowed the balance to impinge on the burn
pattern polaroid film. The low level beam was then partially focused by an
uncoated, IM focal length lens onto the calorimeter, either a Scientech #364
or Gentec #ED 500. Again, 10% of the beam entering the calorimeter was
diverted into a photodiode, ITT #4000(35). The 10 cm diameter aperture of
the Scientech calorimeter provided for complete capture of the partially
focused beam; and surface absorptance at 2500 A was 94%. The diode was
operated at a bias of 2.5 kV and sufficient attenuation was used to keep the
current well below saturation. In the absence of lasing or with the laser
beam blocked from entering the photodiode, no signal was detected,
indicating that neither fluorescence nor extraneous signals contributed to
the observations. All of the beam diagnostic optics were made of high purity
quartz with absorption less than 0. 1% in the ultraviolet region for wavelengths
greater than 2300 A.
The beam splitting and focusing arrangement was calibrated by operating
the laser at greatly reduced power and allowing the full energy to enter the
calorimeters directly. Additionally, the calorimeters were found to give
identical results per their stated calibrations under the same output
conditions as indicated by the photodiode.
Optics. The laser optical system was formed from three geometrically
distinct sets of optics. (1) Small diameter optics for the initial laser
parameterization studies. These were 7.6 cm in diameter allowing for a
clear aperture of 25 cm ; (2) Large area rectangular optics for full scale
extraction with the shortest possible optical cavity length of 1,2 M. These 2
provided for a clear aperture of 9 x 14 cm although partially obscured by
the gun foil support as described in that section; (3) Large area circular
56

Polaroid Rim Photodiode
Beam splitter
Beam splitter
Laser Output
Figure 27. Laser Diagnostic Arrangement
57

optics for full scale extraction at the largest aperture possible but with an
excessive optical cavity length of 1.5 M. Total optic diameter was 28 cm
and the extraction area was sufficient to sample the full 20 liter gain volume.
In all cases, the optical components were formed from high purity quartz with
multi-layer dielectric coatings of MgF and ThF. In some cases, anti- 4 reflection coated windows of 4ie same materials were used, but the usual
arrangement was with reflectors only at normal incidence. The mirror
surfaces were either flat or possessed a 10 M radius of curvature to provide
for slightly stable optical resonators. It was found that output energy and
temporal behavior did not change with either flat/flat or flat/radius
resonators and since beam divergence was not an important issue, both types
of reuonator were used interchangeably. The outward force of the high pressure
gas induced added curvature to the larger area optics producing radii of
curvature estimated at 20 M, and this effect may have contributed to the
insensitivity of the output on resonator design.
The mirror surfaces were susceptible to attack by F and changed character
through extended use. As a result it was considered imperative that
reflectivities be checked periodically, approximately every 100 shots. Since
the large size of the mirrors precluded the use of commercially available
instruments, a simple spot-check (2500 + 50 A) reflectometer was set up as
shown in Figure 28. The intensities of the sample and reference beams were
obtained by alternately blocking them. The reflectivity of the test piece was
then given by (1-R)r/R, where R is reflectivity of the partial reflector and r
is the ratio of sample beam to reference beam intensities. The use of an
aperture over the ultraviolet source allowed spatial scan of the optic under
test. Calibration tests with small diameter optics, which were checked in
commercial instruments, indicated accuracies of + 5% in reflectivity.
Alignment of the laser resonator under operating conditions was performed
with a spatially filtered and collimated He-Ne laser beam. The reflections from
58

CD Ln V-
£
03 «*— CD
CM
03 v_
cn
59
^^^.^^..i.Kä^&is^ ;,,.■;■ -.■.. . .-.:..

uie laser mirror interior surfaces were propagated over approximately
60 M with resultant spot diameters of about 0. 5 cm. Alignment accuracy was
estimated at about half a spot diameter, or 8 sec of arc. This accuracy was
considered to be well within acceptable limits since degradation of the laser
output required resonator misalignment of at least 30 sec of arc,
3. LASER KINETIC ANALYSIS AND MODELING
In order to optimize the performance of theKrF laser and to understand
its scalirg to high power and high volume, it is necessary to understand the
kinetic and pumping processes which are responsible for the formation and
quenching of the excited species. In addition, it is necessary to analyze
discharge stability and effects of nonuniformity. The details of an extensive
analytical model and comparisons of its predictions with experimental data
from the large scale-up device discussed above will be described.
The theoretical model for an electrically excited laser requires a
coupled analysis wnich includes electron kinetics, molecular kinetics,
external driving circuit, and optical radiative extraction. The components of
such an analysis, labelled with brief descriptive remarks, are summarized
in Figure 29. A comprehensive computer code, which has been developed
to implement this coupled analysis for a broad class of electrically excited
laser systems, will be described below. The molecular kinetics are
described by the master equation for the population densities of all the atomic
and molecular species present in the electrically excited gas mixture, in-
cluding electrons, ions, neutrals, excited states, molecules, excimers, etc.
The electron kinetics are described by the Boltzmann transport equation for
the electron energy distribution function f(u), from which all plasma parameters,
secondary electron excitation rates, power partitioning, and discharge
efficiency can be obtained. The formulation of the Bcltzroann equation
includes elastic and inelastic electron-neutral collisions, momentum
'This analysis is formulated for a spatially homogeneous medium, with a simplified model of the optical resonator, which is assumed to be formed by two plane parallel mirrors.
60

MOLECULAR KINETICS
Masler Equation for population densities of all atomic and molecular
species (electrons, ions, neutrals, excited states, excimers, etc.).
ELECTRON KINETICS
Boltzmann transport equation for the electron energy distribution
to determine plasma parameters, electrical excitation rates, power
partitioning, and discharge efficiancy.
CIRCUIT ANALYSIS
External circuit equations to describe the alectncal power loading in
a low impedance gas discharge, whose conductivity is function of t.
OPTICAL EXTRACTION
Oscillator analysis, formulated in terms of intracavity photon density,
with transient build-up of laser mode from spontaneous emission and
subsequent relaxation to quasi-steady condition with gain at threshold.
Figure 29. Coupled Laser Kinetics Analysis
61
Ü^J^üi^im^^us^M^

transfer with recoil, electron-electron scattering, and properly incorporates
superelastic collisions from excited species. External circuit equations are
required to correctly describe the electrical power loading from an RLC
driving circuit into a low impedance gas discharge whos.'s conductivity is a
function of time. Finally, radiative extraction is formulated in terms of the
photon density in th-j cavity, and includes a source term from spontaneous
emission, amplification from stimulated emission, and losses from output
coupling and/or intracavity absorption. Details of each component of the
coupled analysis will be discussed in more detail below.
3. 1 Molecular Kinetics. For a given set of reactions, the master
equation for the population densities of all interacting species can be
constructed as shown in Figure 30. For any reaction involving species
1* 2' * * * ' n'
kf
H.X, +JA,X, + . . . n X — >-v,X, + v..X, + . . . v X , (1) 11 £. Z n n -•—; lice n n k
r
where k, d,nd k are forward and reverse rate constants, and V-., v. are f r ii
(nonnegative integer) coefficients, the net rate is given by
R=kf[X1] ^J 2. . . [XJ n-kr[X1] '[X^ 2. . . [XJ n (2)
where [X|] is the population density (cm ) of the i species X.. The ^ th
contribution that such a reaction makes to the production (or loss) of the i
species is given by
d/dt [X.] = (v. -n.) R (3) iJ i i
Thus, for an arbitrary reaction scheme containing several collision processes
(labeled by»), the complete master equation becomes
62

Species h X^ X2. X3 X, Xn
Reactions a:
Hl(a)Xl + |J2(a)X2 + ••• + H!<a)Xi + •••
—£— v^a) X! + V2(Q)X2 + ... +Vj(a)Xj +
Rate: LUC) Uo(a) uj
R(Q) • ^(aXXjj IAJ. .»,
v,(a) v2(a) k^QXXjl 1 (X2 X,)
a)
v,(a)
Molecular Kinetics Master Eauation:
dlXj
dt 2 R(a)[Vj(a) - p.(a) a
Figure 30. Molecular Kinetics
63
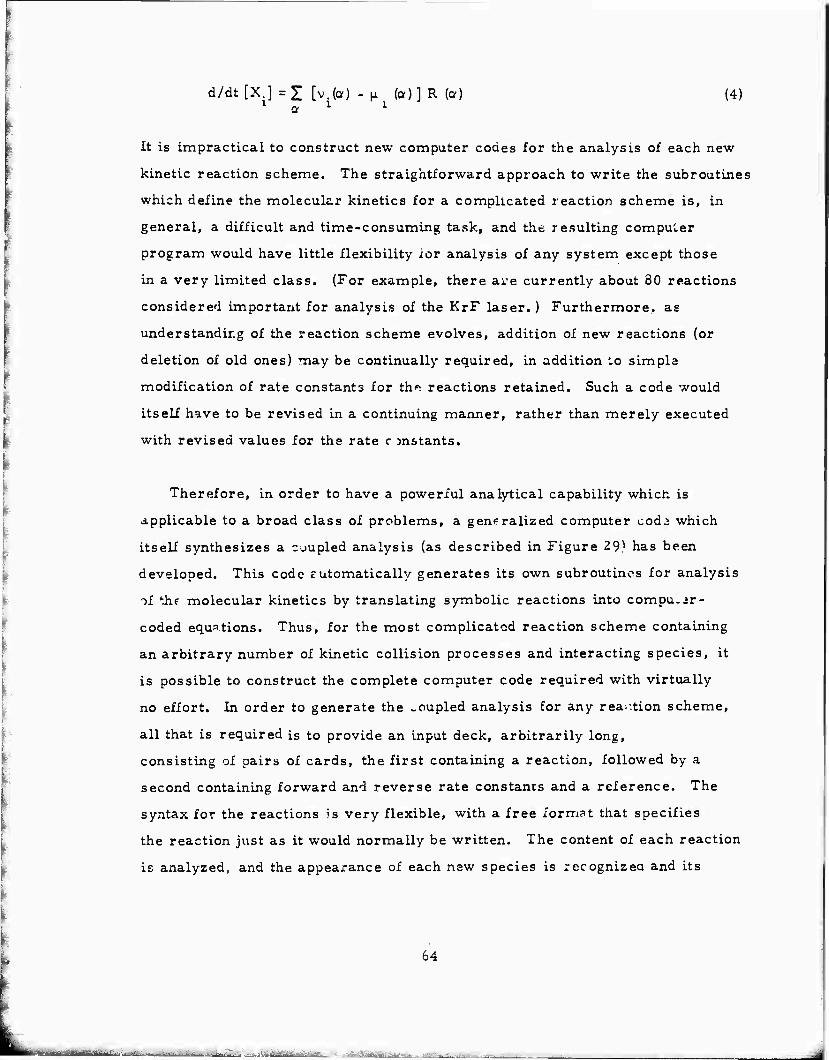
d/dt[X ] =£ [v.(a) - |i (o)] R (a) (4) a 1 1
It is impractical to construct new computer codes for the analysis of each new
kinetic reaction scheme. The straightforward approach to write the subroutines
which define the molecular kinetics for a complicated reaction scheme is, in
general, a difficult and time-consuming task, and the resulting computer
program would have little flexibility xor analysis of any system except those
in a very limited class. (For example, there are currently about 80 reactions
considered important for analysis of the KrF laser. ) Furthermore, as
understanding of the reaction scheme evolves, addition of new reactions (or
deletion of old ones) may be continually required, in addition to simple
modification of rate constants for th^ reactions retained. Such a code would
itself have to be revised in a continuing manner, rather than merely executed
with revised values for the rate r jn&tants.
Therefore, in order to have a powerful analytical capability whicn is
applicable to a broad class of problems, a generalized computer cod,; which
itself synthesizes a cuupled analysis (as described in Figure 29) has been
developed. This code c utomatically generates its own subroutines for analysis
of the molecular kinetics by translating symbolic reactions into compu.-jr-
coded equations. Thus, for the most complicated reaction scheme containing
an arbitrary number of kinetic collision processes and interacting species, it
is possible to construct the complete computer code required with virtually
no effort. In order to generate the _oupled analysis for any reaction scheme,
all that is required is to provide an input deck, arbitrarily long,
consisting of pairs of cards, the first containing a reaction, followed by a
second containing forward and reverse rate constants and a reference. The
syntax for the reactions is very flexible, with a free format that specifies
the reaction just as it would normally be written. The content of each reaction
is analyzed, and the appearance of each new species is recognized and its
64

name stored. The syntax of each reaction is subjected to numerous tests to
detect errors. If the reaction is determined to be acceptable, it is translated
into appropriate expressions in the generation of synthesized subroutines.
Otherwise, diagnostic comments are produced. Program generation and
execution are protected by automatic exit (by input request) if specified error
conditions are encountered.
Figure 31 presents a schematic flow diagram of the present approach.
The rate constants initially assumed in the generation of the program can be
ch'.nged in the subsequent execution, if desired. The main purpose of the
rate constants in the initial input deck is to define whether the forward
and/or reverse process is to be included in the rate expressions, for if a
zero rate constant is encountered for any process (other than secondary
electron collisions), no translation of the forward (or backward) term occurs
in the generated subroutines. If the correct values of rate constants are
known, they may be entered for once and for all in the original reaction
input deck. As Figure 31 indicates, the synthesized molecular kinetics
subroutines are automatically combined with the master executive program
and all other required subroutines to form a completely self-contained
coupled analysis based upon the specified reaction scheme. The section
enclosed in the upper box in Figure 31 is thus required only when a new reaction
scheme is introduced. For all subsequent calculations based on the given
reaction scheme, the initial conditions, experimental parameters, rate
modifications (if any), and I/O and control parameters are entered, and the
complete code constructed in the upper box is executed. That is, only the
lower section of Figure 31 is involved thereafter.
There are several obvious advantages to this approach. First of all, there
is the simplicity of automation and the minimization of the possibility of error.
For example, approximately 80 reactions are currently believed to contribute
65
= --——_-■ ---—Hi ^i!"" "' •'-'--

Synthesis
READ: Symbolic reactions (initial) rate constants
EDIT reaction syntax to detect errors.
TRANSLATE syiTibolic reactions into com outer-coded equations.!
COMPILE synthesized kinetics subroi.'tines: ccmdine witfi ether subroutines required for coupled analysis.
CATALOG resulting uinary file for suosequem calculations based on the input roaction scneme.
Analysis :
READ: Experimental parameters, Initial conditions, Rate modifications
I EXECUTE the complete analysis, with output as specified.
Figure 31. Generalized Synthesis Laser Kinetics Code
66
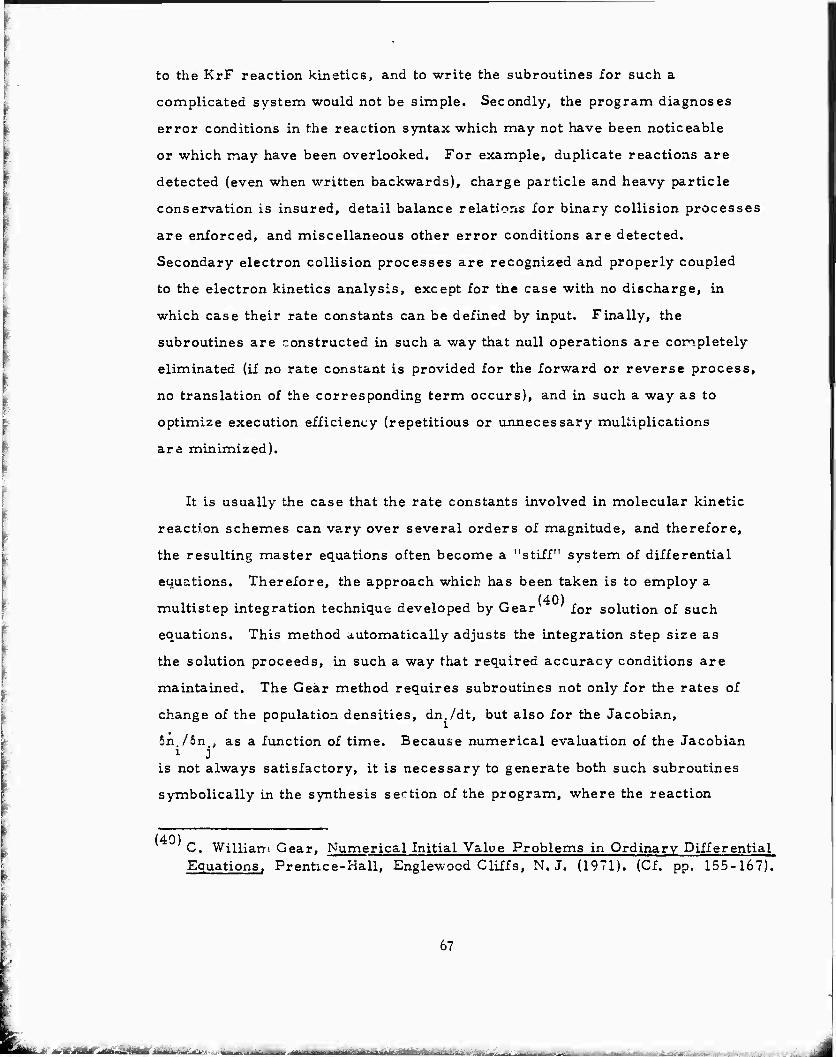
to the KrF reaction kinetics, and to write the subroutines for such a
complicated system would not be simple. Secondly, the program diagnoses
error conditions in the reaction syntax which may not have been noticeable
or which may have been overlooked. For example, duplicate reactions are
detected (even when written backwards), charge particle and heavy particle
conservation is insured, detail balance relations for binary collision processes
are enforced, and miscellaneous other error conditions are detected.
Secondary electron collision processes are recognized and properly coupled
to the electron kinetics analysis, except for the case with no discharge, in
which case their rate constants can be defined by input. Finally, the
subroutines are constructed in such a way that null operations are completely
eliminated (if no rate constant is provided for the forward or reverse process,
no translation of the corresponding term occurs), and in such a way as to
optimize execution efficiency (repetitious or unnecessary multiplications
are minimized).
It is usually the case that the rate constants involved in molecular kinetic
reaction schemes can vary over several orders of magnitude, and therefore,
the resulting master equations often become a "stiff" system of differential
equations. Therefore, the approach which has been taken is to employ a
multistep integration technique developed by Gear for solution of such
equations. This method automatically adjusts the integration step size as
the solution proceeds, in such a way that required accuracy conditions are
maintained. The Gear method requires subroutines not only for the rates of
change of the population densities, dn./dt, but also for the Jacobian,
5n /6n , as a function of time. Because numerical evaluation of the Jacobian i J
is not always satisfactory, it is necessary to generate both such subroutines
symbolically in the synthesis section of the program, where the reaction
(40) C. William Gear, Numerical Initial Value Problems in Ordinary Differential Equations, Prentice-Hall, Englewocd Cliffs, N.J. (1971). (Cf. pp. 155-167).
67
^.^i^: ^-v -.- y

scheme is translated into computer-coded equations.
The entry of control parameters, experimental parameters, revised rate
constants, initial conditions, output requests, etc., is quite flexible,
and permits the code to be executed for a variety of situations of interest.
In the case of pure e-beam excitation, rate constants for secondary electron
processes (which are normally coupled to the Boltzmann anai/sis) default
automatically to zero, but can be specified by input, if desired. (This is
useful for electron recombination or attachment processes, for example.)
This makes it possible to use the same general code for both discharge and
e-beam excitation conditions. The integration of the coupled set of equations
over the total specified pulse length is carried out with the Gear technique
which automatically adjusts its step size. However, the total pulse length
is divided into 50 subintervals, at which times the electron kinetics are
updated, and a variety of output options can be specified.
3.2 Radiative Extraction. Basic features of the radiation analysis are
summarized in Figure 32. It is convenient to be able to treat stimulated
emission processes as well as absorption of the laser radiation by species in
the active medium, in a manner parallel to that for kinetic collision reactions.
Therefore, the equation for radiative extraction is formulated in terms of
the photon density in the cavity (n , = I/chv), and includes a source term
from spontaneous emission, amplification from stimulated emission, and
losses from output coupling and/or intracavity absorption:
L and L are the lengths of the gain medium and optical cavity. Of, =
[y + 1/2 ln(l/R)]/L is the threshold loss coefficient expressed in terms of
the intracavity loss per pass y and the output coupling reflectivity R, (n/4TT)
68
"itiTinili i;"-"-;-":- • •
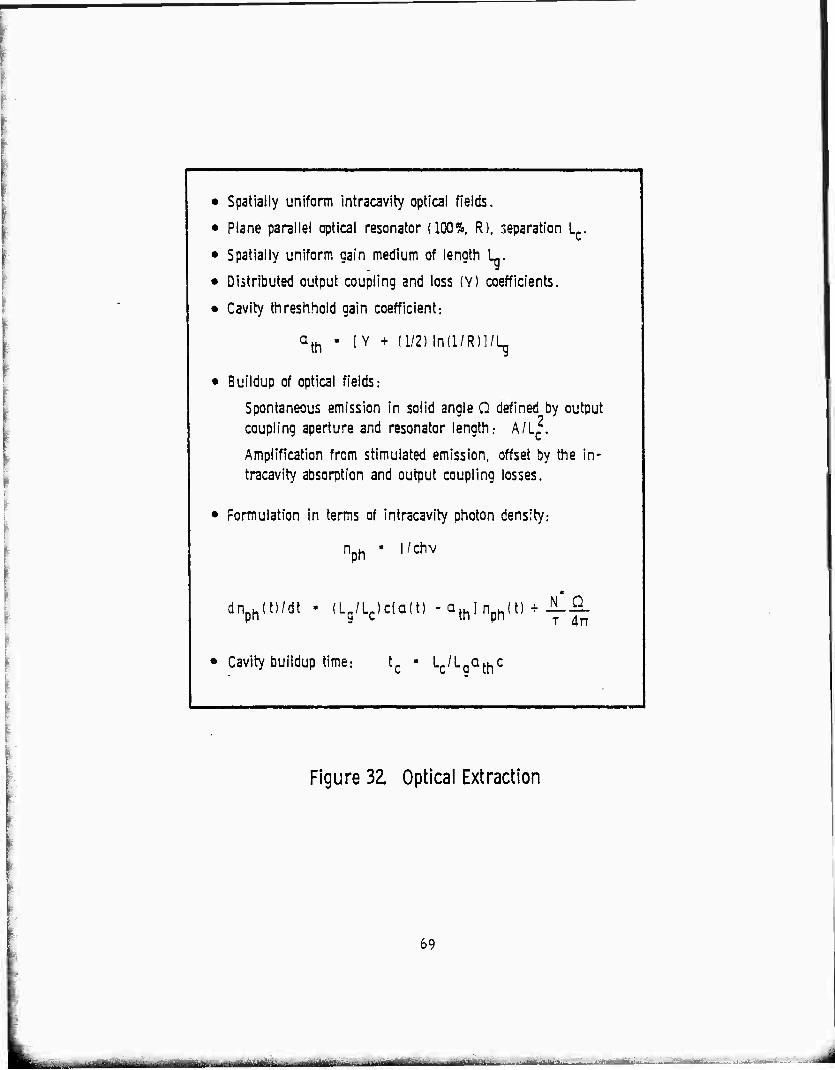
• Spatially uniform intracavity optical fields.
• Plane parallel optical resonator (100%, R), reparation Lc.
• Spatially uniform gain medium of length L.
• Distributed output coupling and loss (Y) coefficients.
• Cavity threshhoid gain coefficient:
ath - [Y + (l/2)ln(l/R)]/Lg
• Buildup of optical fields:
Spontaneous emission in solid angle 0 defined by output coupling aperture and resonator length: A/Lc
2.
Amplification from stimulated emission, offset by the in- tracavity absorption and output coupling losses.
• Formulation in terms of intracavity photon density:
> /chv
dnph(t)/dt - (Lg/Lc)cta(t) - athI nph(t) + JLiL
Cavity buildup time: Lc/LgQthc
Figure 32. Optical Extraction
69

is the fractional part of the total spontaneous emission which builds up the
laser mode (taken to be the solid angle 0 subtended by the output coupling
mirror viewed from the opposite end of the cavity), and Of(t) is the instantaneous
net gain coefficient in the medium (i. e., gain offset by absorption).
a(t)=nKrF(t)ast.m-I„A(t)aabs(A). A
(6)
where the sum is over all absorbing species A in the medium. This approach
allows the radiation intensity to be described for situations where pumping
and kinetic times are comparable to the cavity decay time, t = (L /L Of. c), c c g th
For such situations, gain relaxation effects can be observed in which the net
ga^i initially overshoots the cavity threshold and subsequently decays to the
steady state gain condition a(t) = a., • Under conditions cf strong pumping
the overshoot can be significant, resulting in an initially enhanced super-
radiative extraction, since the stimulated emission from the medium occurs
under conditions of high gain. This results in a sharpening of the leading
edge of the optical output power, and is observed experimentally.
3. 3 Electron Kinetics. The present analysis of an electrically excited
laser mixture features a completely coupled description of the molecular and
electron kinetics. Plasma calculations consist of numerical solution of the
Boltzmann transport equation for the electron energy distribution function,
from which the electron transport coefficients, elastic and inelastic collision
rates, and electrical power partitioning can be obtained as a function of gas
mixture, E/N, and degree of vibrational excitation. Superelastic electron
collisions (i.e., reverse processes in which electrons gain energy from
collisions with excited molecular species) are included in both the molecular
and plasma kinetic equations. Basic features of the electron kinetics analysis
are summarized in Figure 33.
70
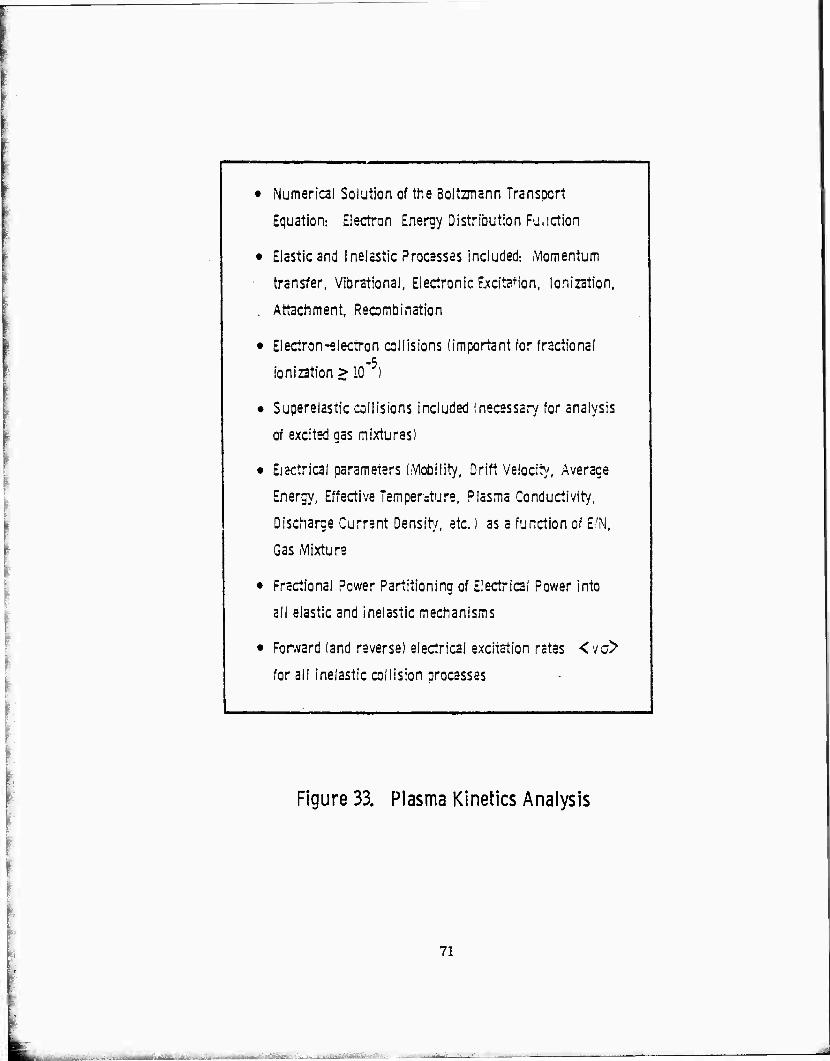
• Numerical Solution of the Boltzmann Transport
Equation: Electron Energy Distribution Fujction
• Elastic and inelastic Processes included: iVlomentum
transfer, Vibrational, Electronic E.xcit3+ion, lonizstion,
. Attachment, Recombination
• Electron-electron collisions (important for fractional
ionization > 10 )
• Superelastic collisions included (necessary for analysis
of excited gas mixtures)
• Electrical parameters (Mobility, Drift Velocity, Average
Energy, Effective Tempersture, Plasma Conductivity,
uiiuiarije uurrsm ueiiiiu, sit.; aa a rui icijgn ö( C'IN,
Gas Mixture
• Fractional Power Partitioning of Electrical Power Into
all elastic and inelastic mechanisms
• Forward (and reverse) electrical excitation rates <vc>
for all inelastic collision processes -
Figure 33. Plasma Kinetics Analysis
71
In general, the electron energy distribution function for the gas mixtures
and relatively low E/N values typical of e -beam sustained electric discharge
lasers is highly non-Maxwellian. The availability of extensive experimental
data for elastic and inelastic electron cross sections as a function of energy
for many gases of interest often makes it possible to implement the electron
kinetics analysis by solution of the Boltzmann equation. The electron velocity
distribution function f(v) for a multicomponent gas at temperature T in an -4
external electrical field E satisfies the Boltzmann transport equation,
tir+y'\-t E(r.t).Vv]f(v,r,t)=- (7) coll.
where the right-hand side collision term includes the effects of elastic and
inelastic scattering processes. Discussion of the Boltzmann transport (41) (42) (43)
equation can be found in work by Holstein ,Allis ,Shkarofsky et al ,
Frost and Phelps(44),Carleton and Megiir45), and Englehardt et al(46)' (47).
(41) T. Holstein, "Energy Distribution of Electrons in High Frequency Gas Discharges", Phys. Rev. 70, 367 (1946).
(42) W. P. Allis, "Motions of Ions and Electrons", in Handbuch der Physik, Vol. XXI (Springer-Verlag, Berlin, 1956).
(43) I. P. Shkarofsky, T. W. Johnston, and M, P. Bachynski, The Particle Kinetics of Plasmas, Addison-Wesley (1966).
-{44) ^ L. S. Frost and A. V. Phelps, "Rotational Excitation and Momentum Transfer Cross Sections for Electrons in H2 and N2 from Transport . Coefficients", Phys. Rev. UJ_, 1621 (1962).
(45) ' N, P. Carleton and L. R. Megill, "Electron Energy Distribution in Slightly Ionized Air under the Influence of Electric and Magnetic Fields", Phys. Rev. .126, 2089 (1962).
* ^ A. G. Englehardt and A. V. Phelps, "Elastic and Inelastic Collision Cross Sections in Hydrogen and Deuterium from Transport Coeffjcients", Phys. Rev. L31, 2115 (1963).
^ ^A. G. Englehardt, A. V. Phelps, and C. G. Risk, "Determination of Momentum Transfer and Inelastic Cross Sections for Electrons in Nitrogen Using Tran sport Coefficients", Phys. Rev. A135, 1566 (1)64).
72

Various approximations and techniques for numerical solution of the equation
and its application to electric discharge gas lasers have been reported by
Nighan et_al ,Rockwood .Hancock et al .Elliott et al ..Morgan and
Fisher .Lowkeetal ,and others.
At the gas densities of interest for laser operation, elastic and inelastic
electron-molecule collision frequencies are so high, relative to molecular
kinetic processes, that the electron distribution is usually adjusted
instantaneously on the time scales over which the molecular levels are
evolving. Furthermore, since elastic collision frequencies are typically
greater than inelastic, the electron distribution can be assumed to have attained
a quasi-steady state even on the time scales of inelastic collision processes.
It follows, therefore, t:.at the first term of (7) containing the time derivative
can be discarded if the electric field is assumed to be dc or slowly varying.
I or a spatially uniform field, it is similarly possible to neglect the second
term, since the mean free path (which is related to the elastic collision cross
(48) W. L. Nighan, "Electron Energy Distributions and Collision Rates in Electrically Excited N-, CO, and CO ", Phys. Rev, 2A_, 1989 (1970).
(49) S, D. Rockwood, "Elastic and Inelastic Cross Sections for Eleclron-Hg Scattering from Hg Transport Data", Phys. Rev. A8, 2348 (1973).
(50) J. H. Hancock, R, C. Jones, and C. B, Mills, "Numerical Solution of the Boltzmann Equation for Energy Distributions of Electrons with Inelastic Scattering on Molecules", Los Alamos Rept. LA-4832, May 1972.
(51) C. J. Elliott, O. P. Judd, A. M. Lockett, and S. D. Rockwood, "Electron Transport Coefficients and Vlbrational Excitation Rates for Electrically Excited CO2 Gas Lasers", Los Alamos Informal Rept. LA-5562.MS, April 1974.
(52) W. L. Morgan and E, R. Fisher, "Calculations on the Electron Energy Distribution in a Molecular Laser Plasma", Research Institute for Eng. Sciences, Wayne State University, Report RIES 74-56, August 1974.
(53) J. J. Lowke, A. V. Phelps, and B. W. Irwin, "Predicted Electron Transport Coefficients and Operating Characteristics of CO--N -He Laser Mixtures", J. Appl. Phys. 44, 4664 (1973).
73
iU=fe^.i w^. ■- i.v-^1--:

section and molecular density) is typically small compared to the discharge
dimensions. The Boltzmann equation (7) then becomes
(e/m) E • 7 f(v) = 6f/6t v
(8) coll
and the usual approach for solving this equation begins with an expansion of
f(v) in'ro Legendre polynomials,
f(v) = f (v) + (v/v) • f. (v) + (3w /v2 - T): f, (v) + ... (9) o 1 £.
(1 and f represent dyadic quantities). Usually, f can be approximated using
only the first two terms. Physically, the justification of a two-term
approximation is related to assumptions about the degree of anisotropy to be
expected for the velocity distribution. If the electric field is small enough
that the directed speed of the electrons, as measured by their drift velocity,
is much less than their random thermal velocities, the small first-order
perturbation v • f from an isotropic distribution f should be a good
approximation. For high values of E/N characteristic of self-sustaining (54)
discharges and for certain gases, it has been speculated that the f. term
may be comparable to the f, term, although no analysis has included Lhese ■4
higher order terms. Retertion of more than the first two terms requires
knowledge of angular (differential pcattering) cross pection data, whicn is
not generally available. Typical experimental data gives only integrated
cross sections as a function of the electron energy. Some of the available
data in the literature has been determined indirectly by fitting measured
transport coefficients to synthetic cross sections using a numerical Boltzmann
analysis based on the two-term expansion of f(v). Thus, consistent use of
such data requires that the electron kinetics calculations should be based on
(54) W. F. Bailey, Paper DD5 presented at the Twenty-Fifth Gaseous Electronics Con.1;. , London, Ontario, Canada, October 1972,
74
■^asiiii-^ ■..==■.:-.;

the two-term approximation. For values of E/N typical of e -beam sustained
discharges, this approach is justified, and is numerically much simpler than
would be the case if angular calculations were required.
-• -♦
In the expansion (9), ^(v), f^v), f2, ... are functions only of the magnitude
v, since the angular dependence occurs in the spherical harmonic coefficients.
It can easily be shown that
Vf=-i- V 3v2 dv
df
(v fj) + v + 3'd7 (vfi) ' (3w - 1) + ... dv
(10)
where 7 f has '.-»ftn separated explicitly into terms which have -4 = 0, 1, and 2
symmetry, respectively. If (10) is substituted into (8), and separated into
scalar aiid vector parts (which corresponds to multiplying by 1 or v and
integrating over the spherical solid angles Ü ), the following equations -esult:
eE
3mv
eE m
(v f ) = _o_ dv 6t
df o_ dv
til 6t
coll
(U)
(12) coll
The most important physical mechanism for reducing the asymmetry in the
distribution function is electron-molecule momentum transfer collisions. The "• (43) collisional rate of change of f can be approximated by
.6fi 5t
coll -2> x m (v) L1. (13)
X X where v = N vQ (v) is the momentum transfer collision frequency for
molecules X in terms of the population density N and momentum transfer
75

X 2 cross section Q . In terms of the electron energy u = mv /?e (in units of
m eV), the equation for f becomes, after manipulation of (11), (12), and
substitution of (13),
6f - (E2/3) d/du rT
U x df /da]\ß^^n 0
LIN O A (u) o JV m XX-xn (U) 0 JVm 6t
(14) coll
Expressions for the collision term on the right hand side have been developed (42) (43) (44)
by Allisv ', Shkarofsky et alv ', Frost and Phelps and others for elastic
momentum transfer and inelastic electron-neutral scattering processes. In
addition, whenever the fractional ionization is > 10 , it is often necessary
(4°) to include the effects of electron-electron Coulomb scattering. Rockwood
has shown how the Boltzmann equation may be expressed in terms of a "flux
divergent" description of the electron distribution in energy space, viz.,
-dJr/du - dJ ,/du - dJ /du + I[(u + u ) f (u + u ) N Q (u + u ) - f el ee a a o a a a a
uf (u)N Q (a) + (u - u ) f (u - u ) N Q- (u - u ) -
ufo(u)No*Q-a(u)] = 0 (15)
where
¥"' =-'E2/3'UNQ (a)>dVdui (16)
m
Jel(u)= -[u <(2m/M)NQm> (f + kT/e df /du)] (17)
4 J^tu) = .(2TT/3) ^ ne In A [P(u) dfo/du + Q(u) f (u) ] (18)
U s
P(u) - 2 j" dw w3/2 fo(w) + 2u3/?' jdw f (w) (19)
u
W, H. Long, "Electron KLnetics in the KrF Laser", Appl. Phys. Lett 31, 391 (1977).
76
i.«-fB.i»>....J^.-jlh,«ii-...ifeflj,«MMrim^na m in =. _;:]n|—~- t. -■ _
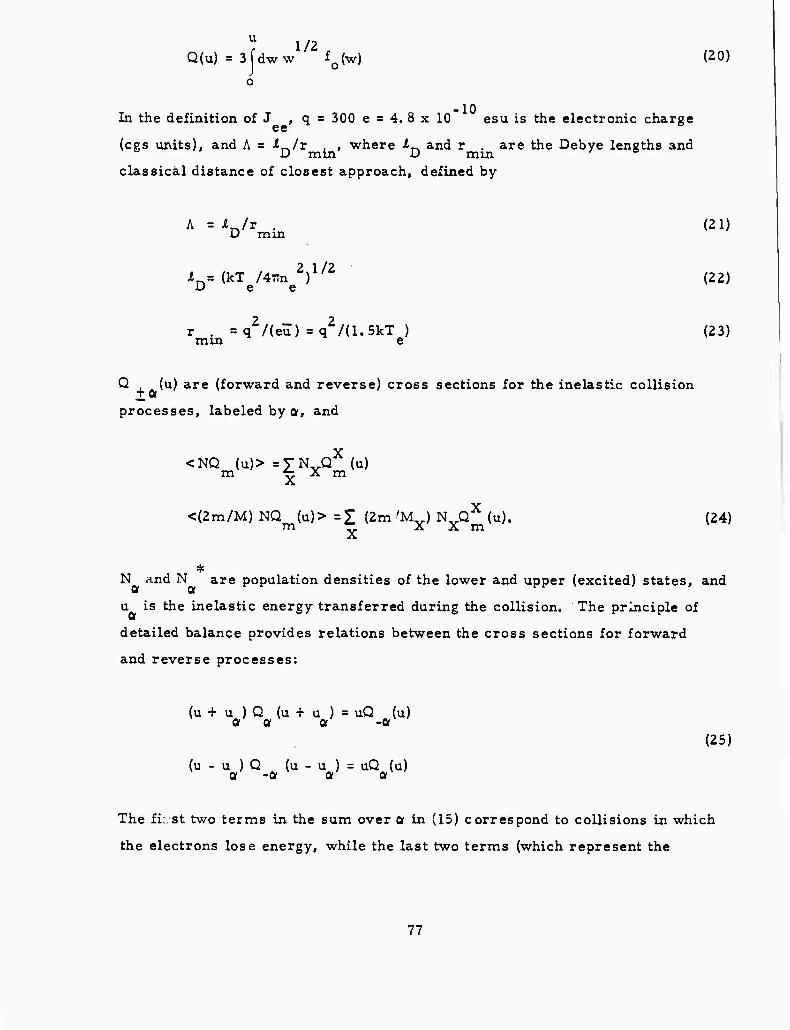
1/2 Q(u) = 3fdww f (w) (20)
6
10 In the definition of J , q = 300 e = 4. 8 x 10 ' esu is the electronic charge
ee e
(cgs units), and A = ^/r . , where X and r . are the Debye lengths and " D mm D mm / 0
classical distance of closest approach, defined by
D mm
in= (kT Mrrn 2)1/2
Dee
r =q2/(eü) = q2/(1.5kT ) min e
(21)
(22)
(23)
Q (u) are (forward and reverse) cross sections for the inelastic collision
processes, labeled by a, and
<NQ (u)> =yNvQ (u) m *t X m
<(2m/M) NQ (u)> =1 (2m/Mv) NVQ (u). rn .. A A m (24)
N and N are population densities of the lower and upper (excited) states, and
u is the inelastic energy transferred during the collision. The principle of
detailed balance provides relations between the cross sections for forward
and reverse processes:
(u + u ) Q (u + u ) = uQ (u) a a a -a
(u - u ) Q (u - u ) = uQ (u) a -a a a
(25)
The fi:.st two terms in the sum over Or in (15) correspond to collisions in which
the electrons lose energy, while the last two terms (which represent the
77

superelastic processes) correspond to collisions in which excited molecular
species transfer energy to the electrons. Only binary electron-molecvxle
collisions, including, fur example, vibrational excitation, electronic
excitation, attachment, recombination, ionization, etc. will be considered.
It should also be noted, therefore, that the collision term for process a
does not always contain ail four of the terms indicated in the general expression
given in (15). For t> "nple, only the second term occurs for recombination
or attachment, and fov ionization or dissociation, only the first two terms
occur. Effects of recoil in elastic energy transfer processes are included in -
the second term of (17), where the molecular distribution is assumed to be
Maxwellian at temperature T. Effects of rotational excitation can be included
in the same way as momentum transfer by making a suitable continuum
approximation.
The normalization condition for f (u) is taken to be o
du u f (u) = 1 o (26)
1/2 2 where the factor u originates from the density of states v dv/du. From
the solution for f (u), all of the forward and reverse excitation rates, o
electrical power partitioning, and plasma parameters (drift velocity, mobility,
average and characteristic energies, effective temperature, etc.) can be
obtaLied. The important quantities required for the coupled laser analysis
are the secondary electron excitation rates, given by
.1/2 v = n (2e/m) f du u f (u) Q (u) a e J o a (27)
and the electrical power balance (W/cm ), obtained by multiplying (15) by 1/2
e(2c/n0 u and integrating:
78
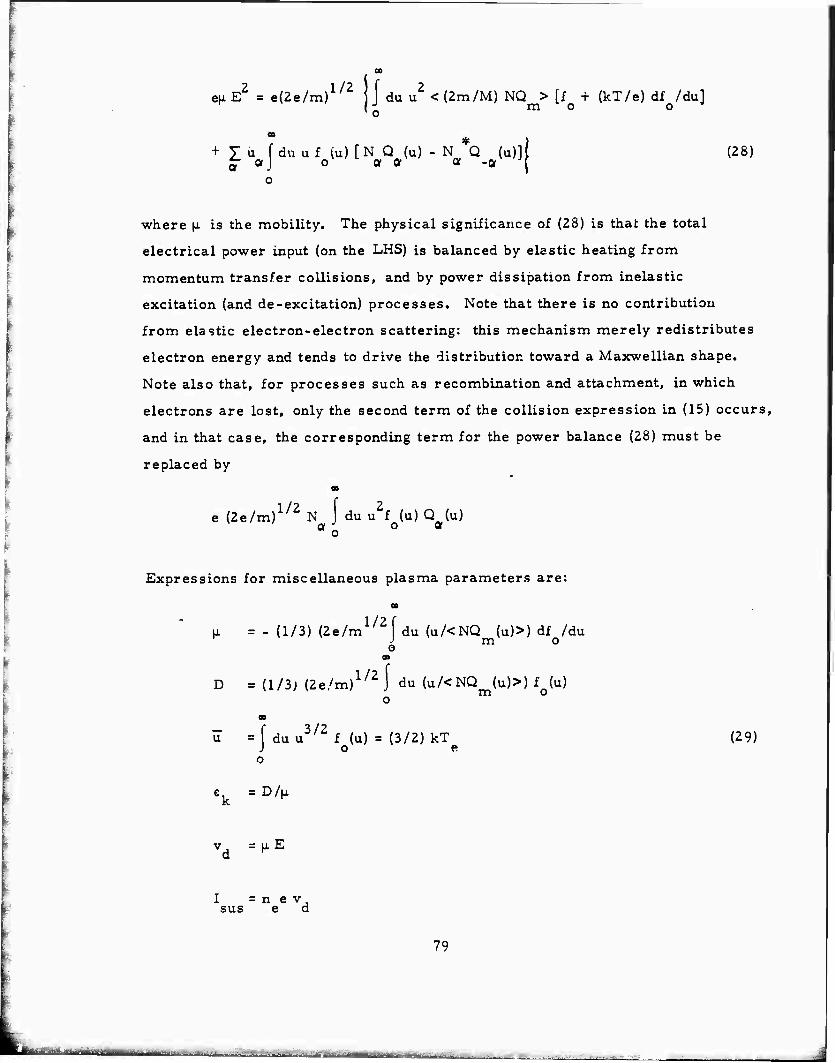
m o eixE2 = e(2e/m)l/2 j J du u2 <(2m/M) NQ > [f^ + (kT/e) dijdu]
" * 1 + T u f du u f (u) [ N Q (u) - N Q (u)] (28)
where |Ji is the mobility. The physical significance of (28) is that the total
electrical power input (on the LHS) is balanced by elastic heating from
momentum transfer collisions, and by power dissipation from inelastic
excitation (and de-excitation) processes. Note that there is no contribution
from elastic electron-electron scattering: this mechanism merely redistributes
electron energy and tends to drive the distribution toward a Maxwellian shape.
Note also that, for processes such as recombination and attachment, in which
electrons are lost, only the second term of the collision expression in (15) occurs,
and in that case, the corresponding term for the power balance (28) must be
replaced by
e (2e/m)l/2 N J du u2f (u) Q (u)
Expressions for miscellaneous plasma parameters are:
OS
li = - (1/3) (2e/m1/2[du (u/<NQ (u)>) df /du J mo 9
CD
D = (l/3M2e/m)l/2J du (u/<NQ (u)>) f (u)
u = f du u ' f (u) = (3/2) kT Jo e
(29)
ek =D/^
vd =RE
I = n e v, sus e d
79

Numerical solution of the Boltzmann equation is carried out by reducing
the differential equation (15) to a finite difference equation, defined over a
uniform grid of equally spaced energy values. This results in a large set
(typically, > 500) of coupled algebraic equations, which is solved by an
iterative approach that reduces the system to a tridiagonal set of equations.
The algorithm which has been implemented is extremely fast, and has
been constructed in such a way that execution speed is optimized when a good
initial guess is available. Thus, the present approach is quite suitable to a
coupled analysis in which the excited state population densities and discharge
voltage change as a function of time, since the previous electron distribution
always provides a good initial guess for obtaining an updated distribution.
For example, with an electron grid of 500 points, 15 inelastic collision processes
and electron-electron scattering, the electron distribution converges to an -3
accuracy < 2 x 10 after ~8 iterations in ~0. TCP sec. (Sample output is
present in Figure 41, 42 and 43 in the following section.)
3.4 External Driving Circuit. Basic features of the equations which
describe the external driving circuit are illustrated in Figure 34. A plane
parallel discharge of area A, with anode and cathode separated by a distance
d, is driven by an external RLC circuit with a capacitor initially charged
to high voltage. The discharge is sustained by an external e -beam with
an arbitrary temporal current density. Initially, there is no vcltace across
the discharge because of the external circuit inductance. As the secondary
electron density in the gas changes, the plasma conductivity (and hence
the discharge impedance) will change. Thus, the plasma kinetics analysis is
directly coupled to the circuit equations which define the instantaneous
voltage (and thus, the value of E/N) across the discharge:
W. B. Lacina, "Supersonic Continuous Wave Carbon Monoxide Laser Development, Volume I: CO Laser Kinetics Code", Northrop Report NRTC-75-25R, July 1975.
80

-WT^
y.
Plasma conductivity: a • ne(t)8jj(t)
Plasma imoedanca: R^lt) - d/Ao(t)
A\ d c u
dt
Figure 34. External Drivinc Circuit
81

L di/dt + (r + KJt)) i + q/C = 0, (33) a
where L = inductance, r = external resistance, C = capacitance, and i = current.
The discharge impedance Rj(t) is a function of time, and is given by
rd(t) = d/AcC-), (34)
where
a(t) =n (t) eji(t) (35) e
and \i. (t) is the electron mobility. The electron kinetics analysis requires
(E/N)(t) = i(t) Rd(t)/(d/N).
3. 5 Typical Analytical Results. Sample output from a typical computer
run, taken from a simulation of experimental conditions to be discussed in a
subsequent section, will be presented here to illustrate the features of the
analysis.
The molecular kinetic processes presently included for the KrF system
are summarized in Figure 35, which is a reproduction of the input data deck
which defines the reaction scheme. Figure 38 is a reproduction of output
summarizing details and comments about the reaction scheme; this table is
generated during the synthesis of the rate subroutines as the input reaction
scheme is processed, scanned for errors, and translated into computer coded
equations. Figure 37 presents the results of an edit of the reaction scheme:
the occurence of each species encountered in each reaction is summarized.
As Figure "^5 and 36 indicate, the kLietic processes for KrF include excitation
of excited states and ions of Ar and Kr by secondary and high energy beam
electrons, fluorine attachment, formation and quenching of several excimers,
charge transfer, electron and negative ion (F ) recombination with positive
ions, miscellaneous replacement reactions, a variety of energy transfer
82
d

SUMMARY OF CARD IMAGES FOR INPUT DATA DECK tOAl£: 10/21/77)
CARQ NO.
12 3 4 5 6 7 8 123<>S«>7a90123<>S67a90123^5678901234567090 t2a<>567a90123^567890123<>S67B40123«S6Te90
1 2 3
5 6 7 a 9
10 u 12 13 14 15 16 17 la 1* 20 21 ?2 23 24 25 26 27 28 29 30 31 32 3? 34 35 36 37 38 39 40
NORTHROP KRF LASER KINETICS AR » t ,. AR* • t
KR ♦ £ •• KR» ♦ E
AR • E ,. AR»» ♦ E
KR ♦ E .• KR»» ♦ E
AR» * E •• AR»» * E
KR» »Ei» KR»» ♦ E
AR*Ef*AR<*l ♦ 6 « E
KR*£i*KR (•)*£•£
AR» »Ei» AR (♦)•£♦£
KR» «Ei*KR(*t*E*E
AR»» * E ■• *R(*I ♦£♦£
KR»» ♦ E ^ KR<.) • E ♦ E
AH2 i»! • E >• AR» • AR
KR2(»I • E •• KR» • KR
F2 ♦ E .. F ♦ F-
SCMAPERi SCHEIBNER« BEITR. AUS PLASMA PHYS. 9« 45
SCHAPERt SCHEIBNER, BEITR. AUS PLASMA PHYS. *. 45
0.1 X AR» CROSS SECTION. 13.4 EV THRESH
0.1 X AR» CROSS SECTION. U.S EV THRESH
60.E-16 CM2 AT 2 EV THRESHHOLD ASSUMED-.
60.E-16 CH2 AT 1.6 EV THRESHHOLD ASSUMED.
RAPP. ENOLANDER-OOLOEN JCP 43. 146* (65)
RAPP. ENGLANDER-GOLDEN JCP 43. 1464 (65)
7.E-16 CH2 AT 4.2 EV THRESHHOLD ASSUMED.
10.E-16 CM2 AT 4.0 EV THRESHHOLD ASSUMED.
30 E-16 CM2 AT 2.4 EV THRESHOLD.
30 E-16-CM2 AT 3.1 EV THRESHOLD.
MCHR. BIONDI (SYNTHETIC! TE»»(-3/2) LA«)
OSKAM. MITTELSTADT (SYNTHETIC« TE»»(-3/2) LAW)
HOFLAND. AEROSPACE CORP. A«2» ♦ C <• AR ♦ AR ♦ E 1.00 E-07
KR2» ♦ E # KR v KR ♦ E I.00 E-07
AR • HE- i« ARU) ♦ HE- ♦ E 4.34 E-la BERGER-SELTZEH: STOP « 1.7 MEVCM2/GM (300 KEV)
AR ♦ HE- ,. AH» ♦ HE- 1.24 E-ia 1.24 E-ia (1/3.5) X AR . HE -• AR(.) • E ♦ HE
KR ♦ HE- ,. KR(») ♦ HE- • E
12345678901234567890123456789012345678901234567890123456789012345678901234567890 12 3 4 5 6 7 8
Figure 35. Summary of Card Images for Input Data Deck
S3

SUMMARY OF CARD IMAGES FOR INPUT DATA DECK (OATE: I0/21/T7>
CAHO NO.
41 ^ *3 4<, ^S *6 *7 48 49 50 51 52 S3 5<. 55 56 57 58 59 60 61 W . 63 b* , 65 , 66 . <»7 . 68 , 69 , ^0 , 71 . 72 . 73 . T* , 75 . 76 . 77 . 78 , 79 . 80 .
12 3*5678 123*567890123*567890 l23<»567890123'»56789oi23*567890123<.567e90123*567B90123<»567890
BERGER-SELTZERt STOP ■ 1.5 MEVCM2/GM (300 KEVI 8.0* E-18 KR • HE- >• KR» ♦ HE-
2.30 E-18 2.30 E-ie (1/3.51 X KR ♦ HE - KRci ♦ E • HE AR(0 ♦ AR • M !• AR2I»» • M 2.00 t-3l W. F. Lit', D. C. CONMAV JCP 62. 3070 (1975)
AR(»1 ♦ KR • M .. *RKR(.| . M 2.5E-3I
KR(M ♦ KR ♦ M *KR2(»> • M 2.*0 E-31 C. J. TRACY. H. J. OSSAM JCP 65. 3387 (1976)
KR(') • AR * H i* ARKRU) * M 1.0E-31
AR(.» ♦ KR >» AR . KR(*) 3.00 E-ll
AR2(»1 ♦ KR <• KR<*1 ♦ AR • AR T.5E-10 BÖHME ET AL. J, CHEM. PMYS. 52. 509* (1970)
ARKflC) ♦ KR i» KR2(») ♦ AR 3.2E-10 PnHME ET AL. J. CHEH. PHYS. 52. 509* (1970)
AR» . AR * H •* AR2» » M 1.00 E-32 HILL. GUTCHECK. HUESTIS. ET AL. SRI REPORT, 197*.
AR« * KR . M f> ARKR« ♦ M 1.0E-32
KR* . KR . M ^ KR2» ♦ M 5.5E-32 HUGHES LASL ASPEN 9/76
KR* » AR * H i* ARKR« » M i.oe-32
ARKR» • KR ^ KR2» ♦ AR 1.00 E-10
AR2(.) . F- o ARF» ♦ AR 5.00 E-07
AR2(») ♦ F- f AR2F* 5.00 E-07
AR(*> ♦ F- ^ ARF* 1.0E-06
KR2(») ♦ F- ^ KRF» • KR 5.00 E-07
KR2(*) ♦ F- t» KR2F» 5.00 E-or
KR(») • F- ■» KRF» 1.0E-06
AflKR(») ♦ V " KRF* ♦ AR
SRI REPORT NO. MP 76-99. DEC. 1976
123*567890123*567890123*567890123*567890123*567e90123*567890123*567890123*567890 12 3*5678
Figure 35 uontinued)
84

SUMMARY OF CARD IMAGES FOR INPUT DATA DECK (OATt« J0/ZI/T7)
CARD NO.
12 3*5678 123456 78901??456789012^56789012J4S67B90123<>567890ia3<iS6769012 V>5678901234567890
81 .. 5.00 E-07 82 . .ARKR(«1 • F - (• ARKRF» 83 . - 5.00 t-07 Bo ..KR» ♦ F2 * KRF» • F 85 .. 7.20 E-lo VELAZCO. KOLTSt SETSERt JCP 65 . 3469 (1976) 86 ..AR« ♦ F2 ,. ARF» . F 87 .. 7.50 E-10 VELA2CO. KOITSt SETSER. JCP 65 . 3469 (1976) 88 ..AR» • KR ,. AR • KR» 89 .. '-.Zu E-12 PIPERt SETSERt CLYNEt JCP 63t i>01B (1975) 90 . .KRF» ♦ AR . H * ARKRF* • M 91 .. 6.00 E-32 AVCO 92 ..KRF» • KR . M .. KR2F« ♦ H 93 .. 5.00 E-31 AVCO 94 ,.ARF» • AR • M ,. AR2F» ♦ M 95 .. 4.00 E-31 AVCO 96 . ..ARF# * KR » M .• ARKRF» • M 97 .. 1.00 E-31 . 98 ..AR2» ♦ KR ,. AR ♦ AR ♦ KR» 99 .. 8.00 E-U ZAMIR <PRIV. COMMUN. TO SRI)
100 ..AR2» • AR2» .. AR2<0 ♦ AR . AR ♦ E 101 3.0E-10 102 ..ARF* • KR ^ KRF» ♦ AR 103 .. 1.50 E-10 SRI REPORT NO. MP 76-99. DEC. 1976 104 ,.AR2• ♦ F - ARF» . AR 105 .. 3.0E-10 106 ..KR?« • F i» KRF» ♦ KR 107 .. 3.0E-10 108 .^2» ♦ F2 * AR2F» . F 109 .. 2.!>0 E-10 SRI REPORT NO. MP 76-99, DEC. 1976 110 ..ARKR» • F2 i» KRF» ♦ AR • F 111 .. 6.00 E-10 SRI REPORT NO. MP 7b-99. DEC. 1976 112 .ARKR» • F2 * ARKRF» ♦ F H3 . .. 3.0E-10 114 ..KR2» ♦ F2 - KR2F» ♦ F 115 .. 3.00 E-10 SRI REPORT NO. MP 76-99. DEC. 1976 116 ..AR2F» • F2 >• AR > AR • F * F2 117 .. 1.00 E-09 SRI REPORT NO. MP 76-99. DEC. 1976 11» , ..ARKRF» ♦ F2 r» AR ♦ KR • F . F2 119 .. 1.00 £-09 SRI REPORT NO* MP 76-99. DEC. 1976 •20 , ..KR2F« ♦ F2 .• KR ♦ KR ♦ F ♦ F2
12345678901234567890123456789012345678901234567890123456789012345678901234567890 I 2 3 4 5 6 7 8
Figure 35 (continued)
85

SUMMARY OF CARD IMAGES FOR INPUT DATA DECK (DATE« 10/21/77)
CARD NO.
121 122 123 12* 125 126 127 128 129 130 131 132 133 13* 135 136 137 138 IS1» , 1*0 , 1*1 1*2 . 1*3 . 1** . 1*5 1*6 1*7 , 1*8 (
1*9 , 150 151 . 152 . 153 . 15* . 155 . 156 . 157 . 158 . 159 . 160 ,
12 3*5678 123*567890123*S67B90123*567890123*567890123*567tt90123*567890123*56 ^890123*567890
. 1.00 E-09 SRI REPOHT NO. MP 76-99. DtC. 1976
.ARKRF« • KR >• KH2F« ♦ Aß
. 1.00 E-10 SRI «EPORT NO. MP 76-99. DEC., 1976
.KRF» ♦ r2 t« KR ♦ F . F2
. J.00 E-09 SRI REPORT NO. MP 76-99. DEC, 1976
.ARF» • F2 ,» AR ♦ F ♦ F2
. 1.00 E-09 SRI REPORT NO. MP 76-99. DEC. 1976
.AR2F» • KR .• KRF» * AR * AR l.OE-10
.AR»» • H * AR» • M
. 1.00 E-10
.KR»» • M ,. KR» • M
. 1.00 E-10
.ARF» <• AR . F
. 3.30 E 0/ ,AR2» i» AR • AR . 3.80 E 06 .ARKR» >• AR ♦ KR
3.0E.06 .KR2» »• KR • KR . 3.30 E 06 .AR2F» (• AH ♦ AH • F . 2.00 E 08 .ARKRF» ^ AR * KR • F . 5.00 E 07 .KR2F» i» KR ♦ KR » F . 6.70 E 07 .KRF» <• KR • F * HNU . 1.10 t 08 .KRF» • RAO ^ KR ♦ F • RAO . 2.00 E-16 LASER TRANSITIONS STIMULATED EMISSION X-SECTION .F2 ♦ RAO f F • F . 1.50 E-20 .F- ♦ RAO * F ♦ E . 5.*0 £-18 A. MANDL. PHYS REV A3. 251 (1971) .KR2F» ♦ RAD -• A"» ♦ KR * F . 1.00 E-99 CROSS SECTION UNKNOWN .AR2(»» • RAD i» AR ♦ AR(») . 1.50 E-17 STEVENS (PARK CITY CONFERENCE» .KR2(.I ♦ RAD t* KR • KR(«I
SRI REPORT NO. MP 76-99. DEC. 1976
SRI REPORT NO. MP 76-99. DEC. 1976
SRI REPORT NO. MP 76-99. DEC. 1976
SRI REPORT NO. MP 76-99. DEC, 1976
SRI REPORT NO. MP 76-99. DEC. 1976
SRI REPORT NO. MP 76-99. DEC 1976
R. BURNHAM. S. 5. SEARLES (SUBMITTED TO JCP)
123*567890123*567890123*567890123*567890123*567890123*567890123*567890123*567890 12 3*5678
Figure 35 (continued)
86

k. -
u tn IT *- in
i/i ^ 1/1 O > z w b _i u u ^- < X z w a
3Z
1" u o z
u o s u o a U 1-
c u s X w z —- J -1 <
u w s in
a o w w u
IW I- _l z s -i a
• o w
g ou u. M u — < a * tb • ~I w • u o
■ ma < au. a m
u in w >■ u VI -J — N •- ^ < X u in u -X
-1 ^ a. o
u S w W J m bj V «- > n o w «i - z z 3 - a u z X
m c « • — w *• in i z - z u O u o w — X u »1 inw w
it ^ — IA < —
K — r u k. « K i- Z 2 m oo Z a- o ^ m u u —
UJ in u -1 O
< «| a £8 a « z Zin « — <
o o
s < • _ o z O
a N. W m o w a u u. UJ < w a u a o s K
Z 2 e o o — »• >• e
3 b.U z
ft £ Z 3 kj
*-w a Z A ^
fe <« ■■ >■ ■- in m m z z > z < o o
a o < u > ^ »• x -i u u X w»- < < 3 *> z u kJ in « u
S k- K a
W o « — m
k.Z Q -o — u c
in in in —— ♦ mm
> >■
» « « z z • « «
m > m m X u u a — -
in — — < ^ v •I a. i i m 3 Z Z « o o
a a ♦ k. W
a <- O D
B — — < < B S B woe z a m m
a o ki w ac m a. < a < 3 U IK > U O kJ m k. K
m - — «mm > >- • j j
» « « zz • « <
m > mm x u o a —— < u w X zz m ——
k. -J m 3 ZZ « OO
KB
:$$
3S m m u u
X mm m ^ » W Ik' LU
» K K
> I I
• O O
4 4 ZZ 4 4
mm uu
I —-
> i i W ktki
mzz • oo
— a a
»oo 12*
if in
Z Z < 4
m ie x m < i ■
IMW
1!! m u oo
mas W k. k
OC SB woe
z ww m « <
aa K O W warn a. <a « s w x a > u ou m wa
a.
3 a. T o
3 a
» « < W B S moo in m m in —— o e ww u» «- « < • a a B _ « O kJ
a m MISE
> w -• a > • e w • wa
o w 3 a. x o u
W BB moo m mm in*-*- o a ww
* « • SB 8 <OW
a m >« «a s w — a >
• ow O k.B
3 a z o
« « W BCD
f\i k- ^ X < « U B B « ew — am
i < a W X w
• z > e ow « WB
« BB • oo
ww z «« U BB <o O W — B m I <B wsw • a >
e o w « WB
iir i s Brno u— _ o •■ z w u «•- « _t< w 19 S B WOW
B m • «a
& x w a.8 > < O lU aw a
B —
.ez B mo o » z wu < k- « -J « kJ O BOS
WOW B m
• «B a. x w 0. s> < o w a wa
> < w t- m
s — «i e _
M « W r a B u
o w «am — « a i :* w w a > • o w
•> I» B
w« ~- m
• o -r 2
m o « »
w u N» < z « w ua a
<e o w — am
i < a W X w • a >
O O kl — k. e
w « »- m -r » -
• o ■"mi
u a B
«■aw — am
i <a W X w
B > e o w <i k. a
3 a. x o u
3 a. z o
3 a. z
3 a x o u
3 a. z o
3 a. o u
3 a. z o u
3 a. x o u
a. x o u
3 a. s
a
a a
co
f? re 0 i« i c u o k- o = <u ^
ro U C£ B < ■o
c S to a. to o C
O f u
fü « OJ z on u ■«
-j *u • 3
a. z c -J -1 X—
X O • >•
s
o
E E
(A ZJ m C^l ■^
z vÖ m rr. in 0)
i- •- 3 Z CD
B kJ 2
87

U ") w — m
m »* m O >- z w UJ _J u >- < z 3 Z x
6. « u
u U
u 5 s 5 UJ * N
X as u s ^ -J ^ < -i w > in » o u
w u <w *- ^J 2 X w u 5 a
* o w a o u w 3 u Id — « K
lb • -z Ui u o *- • U X « a. w a • VI
•J in W » Ul v\ -i — X ^ N» « z U Ul u -z • a o u n UI u _J m w V ►- > n euj in - X >- a u Z K
vie < • — Ul ^ in
u §5 1 w — x u « MU
Ui JO
VI ^5 « — ^ « - z u u. « • K ^ zz 1/1 oo z B — o t— *•
u u — U VI
w JO ^• W i < I a
a u o < z Z v> < — <
a o U1 z < * o z a
a N w ^ o w a u tb UJ « u. u s o x z Kz g „ gl h- tm I* o
| 3 z u
*• Ik z z - «
fch. < « O kfc - in
Jl V) z z ^ z « o o z o < o >- z J U (J X u t- ■« < 3 i" 2 Ul ul in < u a s
VI o « — ui VI a
u.z o -o z - u 3
z
we — ■
in s o w u. w I a o "«I > "• —
•C « z
wo
J UlO z
in
in > Sal « z
— in niu v -«
- r • • • i
i UI — I • X ■ • 0 » ul tt O
• oc u ui: - z 1
(\1 ^ < Cl •- « X « ul Z « Ul uBS o ax « O Ul B OUl «•B in B m
I « 8 • <B W Sul B Xul
S > 1 B> O O Ui Ul O Ui n u. s x u,s
US' »so »so
». H««i m MM w< -< X »- t/i H-irt *. OJ —
50z I/» vi O
— we;
S0z >-ino in —
• Bin X «B •< aui X B> in oui O U.B
VI >■ -i
ut e
*- H K
B I X
I' 8 O
O —— — u«
»wi m UJ « — « u o « z z a. m o o o >- •- a um u u<>- ■«- « < < Ul Ul
B 8 8
a o
. 5 S M X Z
g - z c •
8 S
I I Ui
o • Ul B -
2 O • l — B • »~ Ul ■ U IM I < •- • Ul J V a uii
O OUI Z 8 m < «8 J X Ui
. 8 r
Ui IT
n
• « IM « I
bo nui 8 O
51 — I« U —
J Ui in
t 8 u. ui
• B IT K ■e
i a. i u -> e
< z K O in •■ o
o • o - r - » *- u • u < V « Ul u w 8 «8
B
m
4 8 «- K Ul
O
l I Ui u. B to
« V. » » a z 0
o in
8
SOI U.I
3 a x o u X o
3 a. z o u
s 8
ul ui v B w S _ 1 v * ♦ ■ z i I i IM K fu X 8 * 8 8 * ¥ • S 5 8 8 a < X
< X 1C • * t 1 I ». * • • * B o ■» • w • z z z z 3 ui
8 B 8 a a K ist < It « < X K • • • • t
^ t t I i I 1 s S S 8 8 < X X < K 8 Ul
* ul
• 1
* ¥ ♦ • • • • 131
m m w _ w v w B B a a s B 8 8 s S B < X « X X « « X X <
« p* CO c o — (Vi n IT <e — — IM N IM M IM (M M
o o i 5
z u 3
5 a> » a g c z •MIM
« C 2 O u u « J
a & z a» « i_ J 3 •- CD a • «^
LL.
s
in
88

• * , • • • • t [ w V w UJ UJ hJ Ul UJ I ü i^ u y W u U 1
- 2 z z z Z r Z 1 O 41 • •€ « « < — « ~ < 1
e ^ -J -J u ^ -J •C j «w 1 9« < a a S 4 4 K < ^ < 1
w — fr M Ul 9 a o n \M ty. a CT S 1 _j • Q,
W i/> '— • o UJ • • • • o a • 0 • • O • - o - O 1 pu
1/) — m e UJ z e s a # UJ UJ e I*I o o UJ e UJ UJ 1 p*
VI # ■» J •J ^ •J •J > -I c -J 1 V
IA O > z » N Ch - M N « < • « - ■ N « N « - «- 1 k*' W >J UJ e o < z »• 4 « < < < 1 4 < 1 ru U - < IT z u-> — UiZ a K s & t- »- z z z »- a n *- rt »• I V
z a
3 Z (j
s rw i ^ •
-J i
K l
-a UJ 8 i
i 1
i UJ 5 X
i ^ I o
u ^ U O a IT 1 IT X
o •* I i i 1
<J o s t X a
1 i i i * z *i ! . u o tC • a. N> O 0 e a UJ ct a c a B o 0 a e a. a a a i UJ
3 UJ 1» s MS 1* u. UJ UJ u Ul O u u. UJ w u. UJ UJ u. UJ u u. UU. 1 »• c u f >■ a ^ K z 1 "i i «
r Uf X o X o • o a 1 a a a a i Q ^ < a. 2 .1 ^ s g •e o 5 ?^ 1 s « 5 1 S s zS ;* ; » i/i • ^ p. •- K •- ( »- UJ •• UJ "■" 1 31 O u z x* ifi V « < < «I « in « in < i >
W u UJ tfl £• uj in tf! o> tn \n ^ ^ ^ Ifi w >• m w Kl IM «■ ♦- ^ t 19
nj •- ^ z I- ■ m s Si we wa t 5 x UJ c uo z " a. o o 5 O m e «n o i u
* o a z z z UZ z z z z z z 2 UJ • o . tfl • o o a o o VI IT o 5 IT o o l/i O . i/. » «A i | a o u w -)- -) — K — in — i/i •■ m — i
Q IfeJ UJ U •- « «- tm a »- i u « < s •■ u • w UU u u U Z UJ UJ u u y u u UJ u „; ui is 1 UJ • w -j *: —J ^ I « < ~i * « 1» m < »- < < « 0 rz »> • ■■ X W 4 UJ < < u w w m w w »- « < UJ w « w UJ « UJ X « X « 1 u o a s >- a: a « a ot S « ■ z a a z Z z B a B 1 s u a < *• 3 -i o * 1
a. u. z W UJ w u o w UJ w UJ a. uJ UJ UJ UJ w UJ UJ Ul UJ O UJ e u i « • M ifi 1/1 in irt i/i ui \n UJ in w VI ift in tn i/i U1 m u in w in i u 1ft UJ Z wx • a B w a a a a s z z K z Z K s xi a IM a i Z U > ki iS IS _l uJ UJ Z w UJ w UJ w UJ U w UJ Ul w « UJ f Ul I u K -J ■■ _i > > a > > — > > > > > > > > > -J 5 -J > ■ z x *" h- e ui O uJ -in UJ 5 UJ
I a UJ E U. UJ UJ UJ UJ UJ UJ UJ UJ UJ U W W 1 *
4 o a ma Iff s IT ma a z a at z z a a > B > e i UJ
X O Ul 4ft
u — Z UJ
* -* UJ
M ä _ _ _ . . \ ft. ■a w W _J 1» N- *• i O
c U1 u x X K K X x X z N, •• > N s S "v s N. v i n O UJ lA UJ UJ UJ uJ Ul UJ W 1 k*
X Z _J *- a 1 ( 1 • 1 1 1 1 K u Z K 1
in Q « w UJ UJ UJ UJ UJ w z -JU-/
^ n U »- W K K K K K ■c K • c
1 Z - o u
z o z o
w — K o l/l Jl W e O N <\f <M (\J o r*- K. •c fu *■> •o f» *• o e t-
w m n n •1 C' e» o O o o o • < Ifl if *" « * , t
uJ t
UJ i
UJ i
w i
UJ 1
Itl 1
UJ i
:*J 1
UJ 1
tfcl 1
UJ 1
UJ 1
Ul i
ul UJ i
UJ .J 5 5 < a o o o • 5 o e o O ■ o e o a O e
2 u u. e © o a a o O o O o o o e o e o a a < • )C o e o e o o o O o o o o e o © o G> ■■ Z 2 tn ^j e O K> e o o O o o o e ffl o nj in Z l_ -ft o o • • • • • • • ■ • < 2 a •- f*- n ■■ ■■ m ■■ M ifi in p» in in •* m m N fM «i ^*, C *- *■ -J
U UJ I/)
-i ^O" y -JO s u_
U Q. * Z
BE J-O £ a o p < 2 Z i/l M
< — < to o t
ift O z « • ^ u 5 z c
K N UJ in
b- o w z u u. UJ in < u. 0) S! bJ a o Z u i ag
Z H o- ^- i • z M fr> *» o <
k, U z K z z a in
K Z I < • X z z < 1 u s UJ • a « ie — z" Ä < • * • > • • ' « * «' « •
u. 5 tfe < « a a a * ft • • B w u. 1 z o k> ifi l • M K M K • u. • k. u. X
U1 (rt z z -<■ z s Z e »« u. r\j • u. fM • - z z « * X >■ Z < o o Z K < K < •\j z Z z Z w X 4 a 3 1 X. z < < z X K z • • o < W > ^ H t I \ K < X t t u. Ui 1 UJ i MJ u u 1 1 t I I I z s 1 f* i UJ»- < « a z Z X t I I i 1 X « "• D "«" Z UJ UJ 1 z S£ 1 t i u. u. 1 <J Ä < w a a 1 * • * • a u. u. 1 u. u. 1 t t 1 <
a •- • if u. # * i a tft o 1 • X BE a * ♦ ♦ • rw IM 1 ul
f m UJ JC >r 3 • u. lu 1 z i/ X * • ♦ 1 UJ
u. z o 1 * — * * 9 • * • *» ♦ ♦ -» *• ■* • * 1 19 — o 2 z a • « a s •r »j o I ru ^ • • • X rg m rvr r\j X X • •
i a. z s tt z a z z z z z z a K z B
"■ 1 < «2 X X < < « m as K K < 3 K <
1 »^ OD c a _ «J
_ ■r m «A p. c o> o ^p nj n
1 M ftj fu n n n n Pl m n ^ n n * * ■r *
89
_J
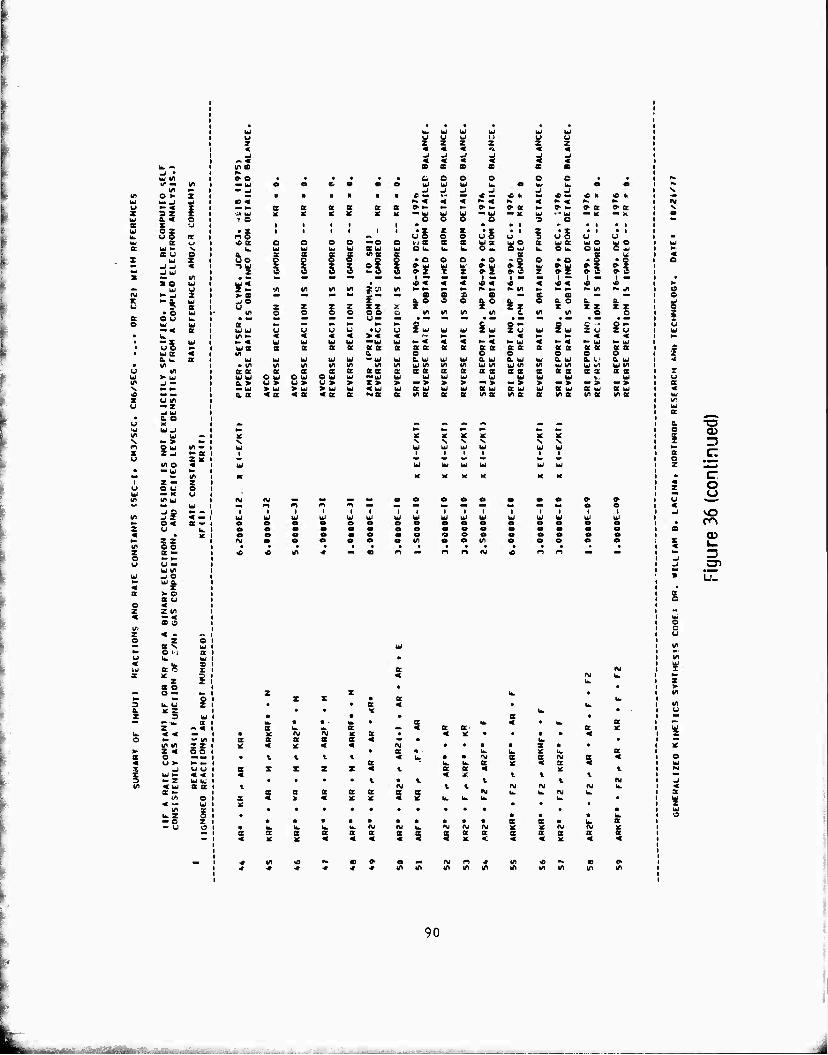
U IT w •> in
m m a *■ z u M ^ kJ u »• « s JT s z z tM a « a s u
Si i* w a o K UJ ^ V
Z c u
-J J
a IT > a kj
w ^ fu t» J
u -1 ki E
• o a o u kk o u U — « B » u • -z W
u o • U E < 0. k. a • in
u iff UJ >■ w U1 N ■c z U IT u - z • Q. a
u at 'W ki «J (/I w A
X »- > PI m - z 2 -i >• B u z x
w o « * ^ m
1 Z " z u o u o yj — m u 4/) in u ^» w
if »- •* m < - ^ o« B •» z u 1» < z z Vl o c z B- o ^ ^ u u —
w m w J o
u a < z a v e c m z z m « (Ti ? < • n o z o
a v ki k* o u B U ik * «ts X z
"z a o
i o — »-
3 u. u ! ^ x z
kJ 8
z - < k. < < O M — ifl
in in 55 ^ Z <
a o < u >• h- h» ^ -1 O O Ui H> < « ^ "• z Wk.
m s^ B B
1.^1 O « — kj
k. z - o - u O
UI UJ UJ W W W Ui U U U U I.J u u 7 Z Z Z Z Z Z
-) ^ _l ^ ^ ^ ^ —« «««««« IPS SS9BSB
»a • • •• ••ceoo oe • • -* kj a o ce mo WUUJ u. oui u. e • — -i ^^^^w^ ■- « ■ a« ■ a ii» k. «• « <B 4n ■■ «•• <e « « II
MI» B B BB ac£^*-*-*-a»-^B^-^»-^a*G: 1> W IC K ICIC X».— UJUikJ— UI— KW'"UJ^K— >■ TO O O O O -3 Q
I I II I • ••! f»l»| • Z I I I I I I • Z I Z • I • I I •X • I • I no •« uoooueusuouu «a o o o o — o o i- a. (t a WB uo a uta mo wo
k. Ui kJ w. k; a W kJ O k. k. U. O k. C ^' k. C U O kJ C ^ a S B B B MB B B B U wo o o oe OQ • o o o • o *oo • o - o • o -> UI 2 Z ZZOXZff'kJWk^wCfZkj^kJ^Z^I
z 3 o 3 c »a o 0-2 % z »2 P u z »z »3 P3
w< • «« < 4 <e« * < «« * <o Z^ m in MinZ'jiinK^^»*^^Kin^»»y^in^-^ ^. a M — MM ^— M (DS2 S MC B M M _, o z a. o o o a o o. o a o a. a. u z z ZZSZ^Z I xz z zzzz
M o o cc oo & mmm m cm m o o • M M M MM UM M «M M M .M .— M .M .M .M
ft •- I» MM MMQ C OM C C-OM UI U U U U U •UWZUIUIUIZWZUUIZUZklZU in M « < < « >« < p-MM M <M M « < M < UJ W UI UI MUJ UJ M« « < M« t- Ui < M < MUJ *- W UIB B B BKftBBBSBBBBftftSBBBBBa in 0. O OOOOO
kj U kJ WWMWkja.UJkiUJEW&UJUlBUJ&lr'Q.bJ • in in in min inmumininuiinuJMinuiinuiinujin Bft ft B BBftBKBBBBSEBSBBBBSBK MJUieUiOkJOUJWMUIW kJ W ki W UI kJ UJ kJ UJ i> U> U> 0> > Z> > M> > > — > M> > M> M> M> MW > UJ > UI >UI UJ <UI UI B UI UJ UJ ftkj BUI UJ BkJ BUI BUJ a. at <s < B <s B NO: ft mft ft ft ma ma a in a mft ma
r\j o «0
k. a it
IM a B
a. ■a 1 a>
3 a c:
|M«B ^^^ • r z o u < -j vO , CO m
(D < v_
-i
c u m m
M Z > m m
2
a
z UJ 2 UJ 3
90
■.:.„j_., iü. ..;:^;.;

'*. — -I • u in K"
in o » w -J •- « 3 Z 0. < X fi!
tfc US s a hj — V
X SI u i
►- -J -J -J w
■» in > D u
M i * »- _J
£ :i a
g OU w w — < s • k
— r M • U 9 ■ US <
a b. ct
4 M _
x u m u - z • ao u u m W
i- > n e w m z Z -l a u Z K
m o « * ^• •- t- in 1 Z — Z u OU o w — K u m m w
u •j fl
m iil z z u u.
zz 1C
m o o z 11- o u o — w _lO
ua
a u o « z Z in <
o a in 2 < • O z a
a x UJ ^ O w X U w UJ
s a J s
:§ ^ o — N
►• ^■ P 5 u. o 1
^ "I U a
z « < < o
gl tfl r r >- 2 o o a O « U >■ ►- — z ^ u u z « < 5 1" z U WJ in < w a a
m o « - w in
U.Z — o - o o
o >- z u « s a o ix u w in a a y "• > X u in a
z w zu zu Zu u Zu zu i- «« a s s 6. U w in a ac
w — > a u ma
as a a o o a. u a. w uj in um a a a a
w UJ — > — > aw aw ma ma
a a e a. w w m a a
w »- > a w m a
a a a o aw w w m m a a a — > a w m a
a w w in a. a
w — > a w m a
e> w z u
— w »- w a a s a o o aw aw w m w m a a a a
w w — > —> aw aw ma ma
a a o a w
— > a w m a
m ** w u a • <
Z w w «am r a Z w w a m > Saw B w a
> • wo a a z
o I
M
a
t
u. 5 I • •
a • 1
a a K a ♦ • a S a 3 x a w < x * k. < « * • ♦ • a * t a a < a
a a < a < K a Z « « » 2
i t
i K
• i 1 • t * • w • t
• • • a • u. a u. • • w nj X M M ic rg L. a a a a a a a a a a
o
o z
X
.E o
is
91

ui m 1« •■ in
in N» IK Q > Z W u _l w u r z
i5 z w 9 K u w sf s w X o X w 1- s X ? to -1 J <
-1 Ul > Ifl a o UJ
«i u (V •- J z
K O U u. O UJ UJ •• « a • w • - z UJ • u o • Ul s <
a. h. X * m u m u » UJ in -j — N C Z u in U - z
r\ 8u, m w Z to z U K
in o < * to u to in
l z - 2 u O J a u to K u in i;i uJ
UJ J o
m 8* < M
>- Z Z u u. < • x * z z in o o Z a - o to to u u -
uj m w -J o
UJ & < z 3 < Z z m <
o o >n z < • o z a
ae v Ul to a UJ 2 U it. Ui < w s UJ s o X z K 3
2 Z a o o - to to
3 to
U. U ? 1 *i UJ
IZ z < < 4 3 to m
^ z < 1 i Z 3 < u t- to Z -i u U
1 U to « < to Z UJ UJ
m « U a X m o « — m z
u. Z o - o 7 - o o
« O « * (M o
«J MJ w w o a e o a o a o e o o o 9 m >j a • • • P« •■ in -«
•a =5 C
o
cn (V j—
<
3 IA* UJ X < < If
it * ♦ \ «. t
lb a a o < <
a t t < X X < X Z a o * ♦ < S • * X z • • 4 • * • u. w nj rvj IV a flj i X X X K UP u. » < X
92
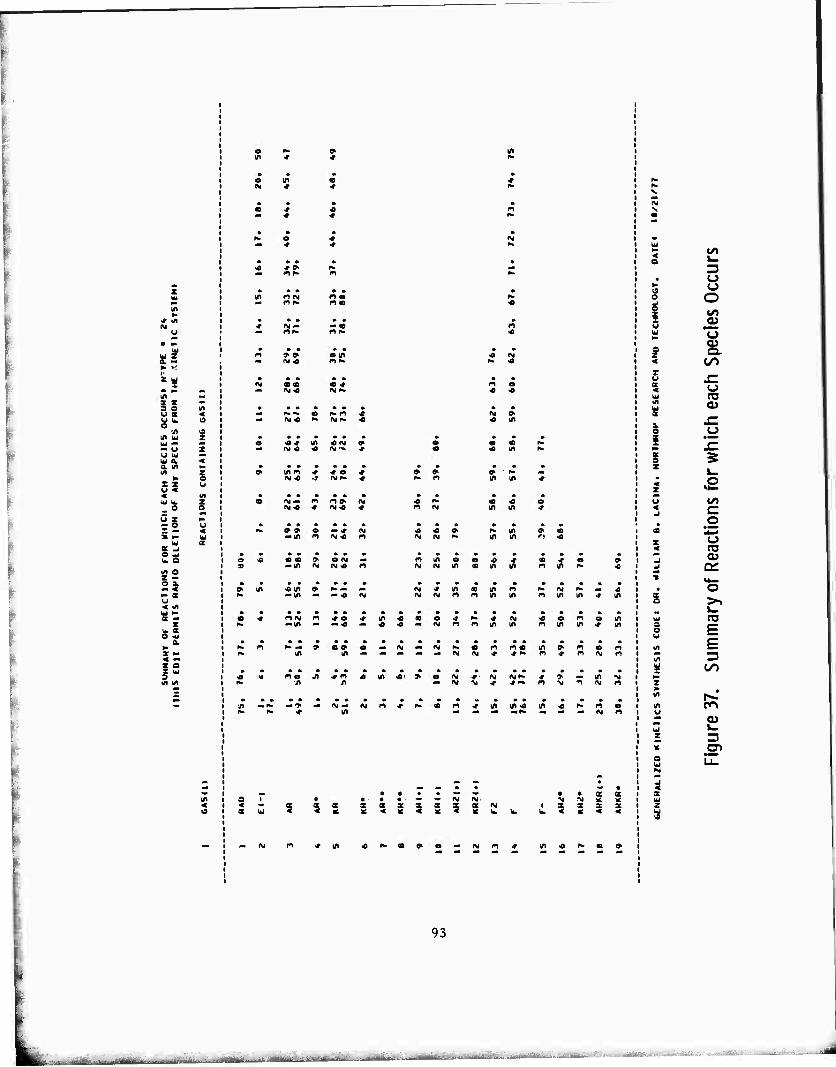
s*
«t m IS m u z « «^ a
■/I o VI UJ z — u z (J uj W 0, < a. in m
to s Z Z U u < < m w u. z 9 o z U Z - o u z - < 5 - w
UJ a K _1
£S
if i» ac u « vn w - s -•
z S2 s » a » < — z a z w i/> in
o r- 0" in
• • ■ • o tn « *
• • • •
• • • • — * 4- **
• • • P •
• • • • • • tn n IM ft o ^
• ■ • • • *
• • • • * • • tu a • a * no
»***••» • • — M 'ö ^ ry ?-. « -« tn
• •••••• * **• e «<r un «m » o o o p>* — nj o 4 cw"» <r 40 •« in r»
• »*•••• •* • • * ni 4 •? fw ^ 4* K n min *
(M-o >f nj« ^ o AJ in tn «
• ••*••* *•* •• •* — tn n M < n mnip» mm r i ^
n • »*•••• •■•*«• *** • o «a a) « ? o (\j — mmoe^^ « j o 9 a -»m (M M <A n niNmomm nm^* -c
^ m «m 9 r* — — (M^mvmo ^ (M p* — ^ r- .4 m — —■o f\i nifMnmmm cimm^rm
a •» i-i M n «o ^in-oAo^N-j-fti «onom P* —m — «« — JO — njmnjitn r)mm<#m
N. r» ^•M»«9te«aAjMM^>annam»o<Dn ^ m m — «*-* — -*fMrN*ir *^ n * n ftj n
« rt» nem *« « m «•>« <M *•»>« mr* -r > — m -u
■n -•*•—T^Ai—ftin-friNan^m m^m-o^o« ^ p» *r m •■«■■# Mf* — — — nj n
— - (M a « x < ä <
x
o o
I
X u
5 LÜ Iff ÜJ Z
l_
o O to as O ä
CO
o CD
5
u V» « c o 1 '
X o < ro OJ
j üi ■» M— ■ o
5 >> h.
UJ (U 1 E «i E irt =3 « 00
Z > h-
m rn o
CD u u. z 3 K Ol
u LL.
93

« in «v
W
M to
K X w 3 O m u a « U k, o e
M o in w z w — — u z u w i» a < a. m to in z > o 55 u
m W Ik z _ o o z U Z ^ r 8 u s — < » - u
u s B -I
£S m o
5: - < 1- B u « in W to a —
z k. S O UJ
a >• a to « — z o I UJ
in m
m IT
g
I u a. <
* • 3
• m -r
* « • •
a- in
• • m
• • o *
• g
• n •9 IT
• e
• t-
• n
*
* •
• * •
in ■*
•
at
C
c o
03
CJ>
o o
o
W iv u. nj X a a a n: s < < K K «
o — M n * M M UJ IM M
94
........._...._.

SUMMART Or CARD IMAGES FOR INPUT DATA DECK
(OAIE! 10/21/77)
CARD MC
1 2 3 4.5 6 7 B |23'i5t7S901234S6789al23<<S67a90123*567lt90|23<>S678'«Ot23*S67a<»01234S67a90123*567890
1 i 3 <• S b 7
a 9
10
11 12 13
14 IS lb 17 1» 19
20 21 22 23 2» 25 2b 27 2U 29 30 31 32 33 34 35 3b 37 38 J9 40
»CONTHOL SPARAM
»OPTICAL
SEBEAM
»CIRCUIT
»RATES AR KR f2 AR* KR» Aft2<0 KH2(«) APKRCI AR«» AR(*I KR»» KRCI F- ARF*
10111 - lOtO .OtlO. 10.S.Ü •Ui25i 1t TPULSE ■ 1.0E-06. ATM ■ 1.7» REFLECT ■ 70 1 • LOSS « 0.. AREA • 25.« CAVlTT • 130 • LENGTH « 75. )I JBEAM . 12.0 » ENERGY • 320 t»
TAXISUI ■ O.f SO.i lOO.i ISO.i 200.1 2S0.i 300.. 3S0.i 400.. 450.1 500.i SSO.i bOO.i 650.. 700.1 750.1 800.. asa.i 900.. 950.1 1000..
JSMAPEIU " O.OOi 0.82. l.OOi 0.99. 0.90. 0.85. 0.77. 0.73. 0.69. 0.67,
0.69. 0.72. 0.75. 0.75. 0.72. 0.65, 0.42. 0.20. li,05i 0.02. O.OOi
DEPOSIT • 2.! 1 CAPAC « 1.33E-06. INOuCT « 200 .£-09.
RESIST ■ 0.. KVOLT ■ 40.0 1 AREA « 2000. OIST ■ 10.»
1191. 40. 100. 84. 1.5 38. PLOT
U.S 9.9 PLOT 13.0 11.8 PLOT
12.<• 13.5 15.a 11.5
1*.* .01 PLOT 6.5
1234567890 123'.S67890 123456789012345678901234567890123456789012345678901234567890 12 3 4 5 6 7 8
Figure 38. Summary of Card Images for Input Data Deck
95
i=^i-.Ul^^---

SUHNART Or CARD lM*&tS FOB INPUT DATA DECK (OATC 10/21/771
0**0 I 2 3 <• S 6 7 • NO. l23<>567690123'>567e«OI23'iS67B90123<>5fe7890123<>S67a90123<>S67«40123*Sfr-890123<>567a90
Hi ....HRf« S.O PUOT
42 ....AR2» 9.5 «•3 ....KR2« «.2 ** .•..AR2r« 5.0 *8 ....ARKRf« 4..0 *6 ....KRzr« 3.0 '•7 ....ARKR* 8.B *• ....Et-t PLOT
HZl'.Sbl, .ai23O567a901Z3<>5b7B90123<iS67B90123'>567a90123<>S67S90 "■ t 1 B 123*5'>7B90123*5678901
J 2
Figure 38 (continued)
96

collisions and quenching processes, spontaneous radiative decay, stimulated
emission, and absorption from F and various excited transient species in the
active medium. Figure 38 illustrates the input data deck for execution of the
analysis for conditions typical of the scale-up device experiments. Figure 39
summarizes the input reaction scheme after rate constants (if any) have been
modified (none for the present example).
Figures 40-57 illustrate typical output generated during execution of the
analysis. The formating is explicit enough that the material presented in
these figures should be self-explanatory. In order to provide some quantitative
assessment of the sensitivity of the various reactions included in the kinetic
scheme, the computer code generates, according to output request, tables
such as those presented in Figure 45. These tables summarize the numerical
value of the contribution each reaction makes (at any given time) to each
species in the system, expressed for each species as a percentage of the
maximum '•ate occuring for that species. Those reactions which never
contribute more than a specified percentage are flagged with an asterisk, and
are summarized at the conclusion of the analysis. Thus, after a variety of
calculations have been made for different experimental conditions and parameters,
it is possible to determine whether any given reaction may be considered to
be relatively unimportant and deleted from the kinetic scheme.
Figures 46-57 represent a portion of the computer plots generated at the
termination of the analysis. Included are temporal plots of e -beam current
density, radiation intensity, intracavity gain and absorption coefficients,
electrical inp it and optical extraction power densities, discharge current
density and voltage, plasma conductivity and impedance, output energy and
efficiency, and (requested) population densities of excited species.
Due to multiple scattering effects, energy deposition in a high pressure gas is somewhat greater than that given by the Berger-Seltzer cross sections. The effective cross sections used in the analysis are taken to be a factor of 2.0 higher (cf. DEPOSIT = 2.0 in Figure 39).
97

WO
« — zu i.
El u« -S Ui • ZI _u *^
z
t a *5 y
u zz o« — w »-^ u w <2
15 -o z IX o •
2 Kl"" UJU ►•«
in ui
51 M U U ►* O
z ^
' X I w u S
m Z ui » S z
X - >• X
o < x o
5 I 3 S ■• u (A 4 > M - a
z a.
35 i
a
u o a s s s
* «
z
e
r - u •
> >
X u ■o
- «i a v < ei
ü z "■ ^
z e >- < m » - in
s S l = - z a • i
W 1/1 3C O
o
UI >
UI
O O 12 Ö O O O O O O — -__••» — _oa Ull/lUll/lUll/li/lUl • • >>> >>>>> — —
3 3 • * «i *
X X * u * Q • m > > 4
s Ui £ w & f*
• Ul
• S * — ♦ >
i 5 • 2 § t s i 1 ^ "- u UI * UI S
u a • a • M Ui • Nl 5 1* a o ^ *■ » -i J • u X U « 3 UI u* t t
X LA a IT UJ • § • • 9 n n w a S a v
z s
a «
— — • • Z St I •
. . — — a: B ac
qc ■ « x <X t l UJ u u. t 5 5
I
5 - K
X X
i r i z
x IC
X X
CO e 0»
CO
c
"u «s a>
CLO»
£"§ O (/) <*- o
^ a>
"5 u
=3
a>
er
98

f- » 3 9 O
a. m
•t * 9 » O a s IT in in
„ • • (M ni •i m in «
• • »■ * (n Iw
I r • 0. a. m
• • M. X z « 1 * u u , • k -> -^ 5 •
4
Si
" •- 3 IW w o
lid o o - sax
9
z a, <
I 0.
« « » »■ in
p» • • » » » ^ « ■e « # ■
n B • * *
in in •e •o
n a a. ■o ■■
^ * a. s • * H o s ac "• Ui ui •• in *
•
» » > 1 m vn • ^J H- N- a
i ^ > K K »■
* • Ui in £
9 O — U u • N tw z X * < Ui o o e -J J a. u u u z > > > > > a. < « « h*
CD =3 C
«I 2 N M (V N rt — I I I I I * f 6
o»ooc»ooo oeoooooa oooooooo ounrgoojioo
— m tfi **
c o _o
rr\ a> v. =3
s IZ S a:
x
< r« a a u. a <i U. X < < X K * X
1 if < * t t t i
z X * t
* X u. u. 1 u.
U. UP 1 U.
or * • • 9 * • • • « • ■ • « * • « rg iv IV l\i M ■•
s a s X X a. X K < < « < K K 5C
X Ite «fc 2 a ♦ ♦
x X X K * <
5 - • K
S
(Ni 2
99

II 5 U = s
a a.
*5 5
o -
za. x —o w s >
3 »J o • a z S i/f«* o
wu *-< — ■«J — a » • x 39 -
* ̂ »
i
i a. a
a
» 9 ■0 « « K »«• t* » 9> »
« « « 4 f» p» ^ >* a> » » s>
s s a s » » » » » »
& a.
$ k k • • • SSI •» ta c
s s s & & &
S i
a, a. UJ Ui
a o a.
a. 8
o K •- a i
■6 « « * « « w f N r* N- m 9- » » » » » ta>
z • • • • • • ■ • U o u u u u VI a t ä Ä t « S
71
w 4 * • • • • ^ » * » 9 » » i » 9 9 P If »
■0 « « * ■o < UJ to r» F» r. f» F* in t*
1 k 1 1 1 a. s in R • • • ■ • ! •
i § s i s § ~ to to to »-. to t ?
1 J ? s o * < r
< * B. c a. c a. a. ^ l-J y w u w UI % (X 8 a s a oc a
uj m
5 5 5 a 5 • < -i
l I I i I I l I I l I i i I * * • * * « •• I
ooooooooeooooooooeooaoo
eooo aao eo «eeoeooaoooeoo
a« =3
"c o
CD
D CD
»^ o u. • I ♦
IVI
IV
S Z X K « \ t t
Qg IM n< te u.. w
I t
X X
• T ■x • IM * X IM a a a 2 < * < X
-r IT ■c ^ m Ul w m
z X K z x X « * x ♦ • •
a •
X X < a < < t
* X
t t • t
« • w 2 • w z K ^j IM * IM S K X a X X
X
100
■iJ!.AEra^%ä .*&.^dr«*. ^u^Ü . .- ...,

i J V 1 | ni X ul • U
» 8 & * vi
X w SS K ^ •-**, 1 w «w toJ 3
g * W
s. 3
I
a t/1
<rt» u u« 3 -I X w« C ^ U MtM »»- »■
2 * uw < —o -1 1» B
s z z
^ X
3
feü !)j M r-
a «/»z Ifl
u yj
12 < U,
—^ 3 t-wi LÄ4J «a. (M
*% K
3? Ui g t/1 3
-? > 3 U O • 3 u,« z X
l/W> 3 UJU "-« ■«-J M oc M
X 33 y •-i Q ^* » o— < tt g 8* M.
I = z £ 0
Ö » "" u (A « > ta — 3
U
i
* 9 \ft ■ • •
un - -
8 i
W w
\ t. a o « < 3 X
3 3 3 K < )C
< Ä
s o < < X X
• •)*.•• — AJ (\j (M
Oi I 3 8 3 w w it < >c
101

11« T • *.0O0E-O7 SEC
POPULATION DENSITIES AND HATES OF CHANGE ELECTRICAL AND OPTICAL PARANtTERS
SPECIES em Nil) DNdl/OT NAME • EV» (CM-31 ICM-3/SEC) PARAMETER VALUE UNITS
I RAb 0.00 1.192EM* 3.218EM9 JBEAM 8.28 AMP/CH2 0.00 2.'.13E«U 4.930E«20 DEPOSITION < 2.00
) AA 0.00 3.a30E*19 -2.697E.20 ENERGT 320. KEV AR* 11.50 9.9«'tE>l3 1.7e4£.20 DVD» • il.22 KV/CM
i KR 0.00 3.214EMe -1.326E>21 PIBEAMI • 92.94 KH/CM3 » KR« 9.90 1.819E.1* 4.560E«20 r AR*« 13.50 2.700E«12 9.595EM9 RIEXTI • • 0.00 OHM
t 1 RR*» 11.50 5.375EM2 l.b55E>20 LIEXTI i • 2.000E-07 HENRY < > AH 1• 1 IS.to 3.550EM3 -1.179E.19 CIEXTI • • I.330E-06 FARAD
1 » KH(•1 14.0 8.096EM3 2.la3E>|9 I AH2IO 13.00 <..*53E«12 -3.089E>ie AREA i • 2000.00 CM2 u ! KR21.| 11.SO 1.707EM* 1.22SE>20 OIST > 10.00 CM 1 > F2 0.00 3.S66EM6 -3.05aE.22 CONDUCT > 2.225E.02 /ÜHM/CM u F 0.00 2.49<.E»I6 i.l49E.22 R(OISCH) • 2.247E-01 OHM v. > F- .01 6.321EM3 -3.651E.20 u > AR2* 9.SO 5.238E«12 3.302EM8 Q • ■ 3.990E-02 COULOMB 1 r KR2* 0.20 8.S02EM3 1.726E«20 KDISCHI < • S.892E.04 AMP 11 t ARKR 1 • 1 12.40 1.289E'13 -I.57BEMB JIOISCHI • > 2.946E.01 AMP/CM2 I' » ARKH« 8.80 8.40EM2 1.<08E.19 ESUS 1.324 KVOLT/CM 2( » ARF» 6.50 4.237EM2 -3.195E.18 ESOS'JSUS ■ ■ 39.01 KW/CM3 2 AR2F* 5.00 5.ie*EM2 •3.418E*18 2i ! KHf* 5.00 1.967E'13 -1.038E.18 Q/C • 29.997 KVOLT 2. 1 RH2f» 3.00 9.25SE«13 3.841E.19 VIOISCH) • • 13.242 «VOLT 2' > AHRRF» <t.00 S,975eM2 2.947E.17 L«01/DT i
REFLECT
■ 16.754
• 70.00
KVOLT
LOSS > 0.00 »/PASS T(CAVITY) • 24.3 NS LICAVlTTI > • 130.00 CM LENGTH 75.00 CM 0HEGA/4/P1 . ■ 1.177E-04 THRES:: • 2.378E-03 CM-1 NET GAIN > 2.393E-03 CM-1 LASER GAIN < ■ 3.934E-03 CM-l ABSORPTION • ■ 1.541E-03 CM-l
INTENSITY • < 2.862E-06 HATT/CM2 OPTICAL • EFFICIENCY t
STEP SIZE • TIEXTRAPI < ORDER
6.BS 5.19
. 3.643E-09 > 3.9e6E-07 > 2
KM/CH3 %
SEC SEC
OR. WILLIAM B. LACINA. 10/21/77 NORTHROP RESEARCH AND TECHNOLOGY
Figure 40. Population Densities and Rates of Change Electrical and Optical Parameters
102
«MkaiiüMSüii ii,v-.^_„^„..,„, ■

TI«E 1 • «.OOOE-OT S£C GAS MUTu«E —
*H /«R ffl » 92.15 / 7.7* / .12
PL*f>M* PARAMETERS
E/N • 3.1302C-I7 i.ei .77
VOLT W2 V/Crt/TORR ÄV/CN/ATM
PTOT 1292.« 1.70
TORR ATM
TMOL 300. OCG K
NTOT i • <..1SS9EM9 CM-3
E • 1.3009e*03 VOLT/CM
UAVG • 3.*92 EV
TE < 27022. OEG K
0 • • 2.306SE«03 CN2/SEC
MU • • S.75*aE*02 CM2/VOLT/S
NU<NTOT < • 2.3916E«22 /S/VOLT/CM
CONO/NE • • 9.2191E-17 CM2/OHM
ER • O/MU • > 4.008 EV
VO « MU»E ■ 7.<>a(AE*05 CM/SEC
MU«£««2 • 1.5602E-10 KATT/ELECT
P/NE l.tSSIE-10 MATT/ELECT
P/NE/NMOL • 3.9a24E-30 HCM3/EL/MOL
J/NE I 1.1993E-13 AMPCM/ELECT
VS|G(MOM) i 6.9536E-08 CH3/SEC
NU(MOH) 2.8899EM2 SEC-1
NE/NMOL > S.806SE-06
CALCULATION PARAMETERS USED) MESH ■ 500, EMA* » 15.00 EV. DE ■ .030 EV.
Figure 41. Plasma Parameters
103
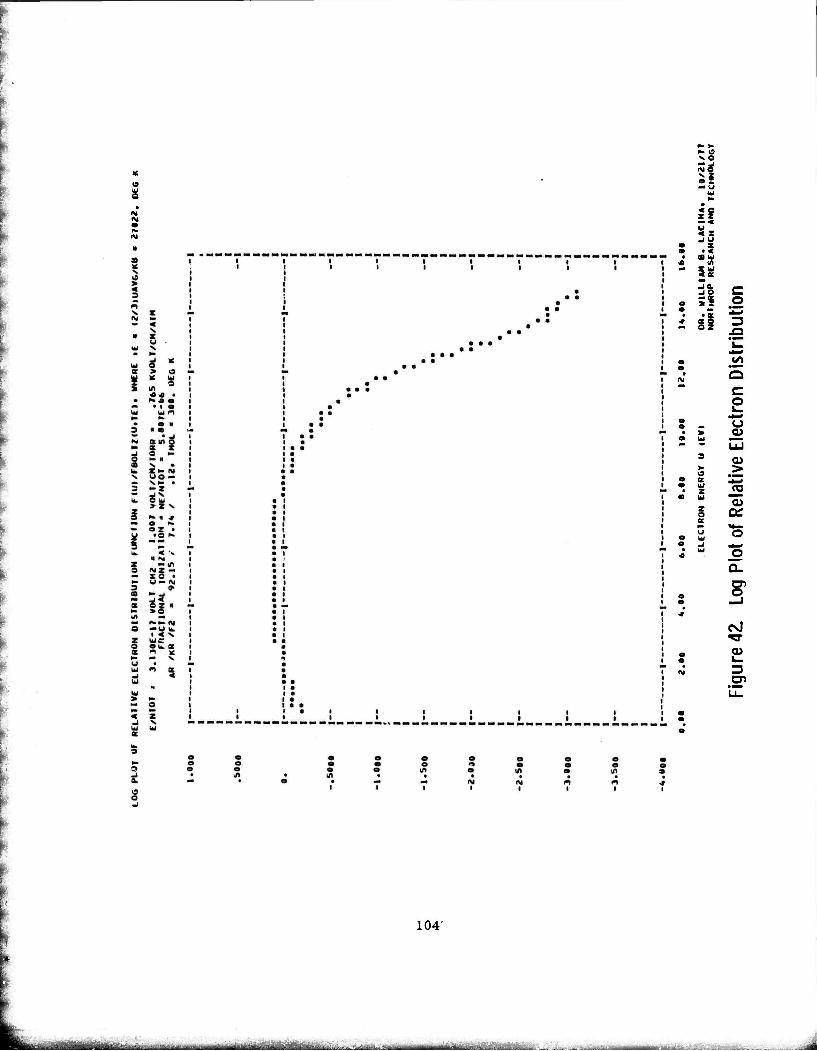
IC
e
i
o •« ** "IK - 5S
5% c s =1 I
5 c S
LU
S2 5
CD Di
'S
I Oi i- 3
104-
-"■■"-—"-—*■'
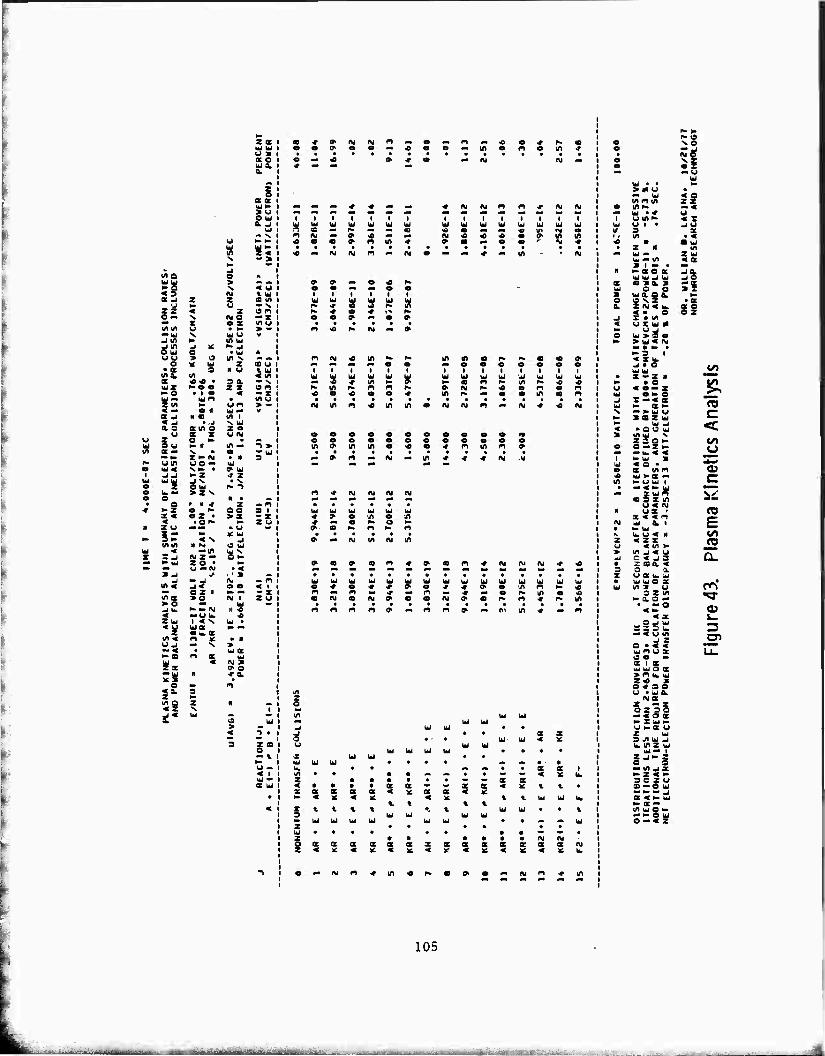
«5 IM ac_i X X
u b* u n V M O X e z
in ifl U • •* M W s Ui u J «1 Ni in w
O Ui al * S» -i • Ui
uo > o in s o X Ui X
• a 9 N U «a. in ■ « 4 • i| Sä r- o o
• 1 a ^ w — un m z * p- un «- e a Ui«
*-" a 9 m i < J • -J X Ui a. o 01 in o z a
u a x U(\i u z o •- • w 9 U »- a in~ m tr - N • a
*-1- Z >- m • H ^ UU1 uo- Ui o u < N ^ • (J. ui i -1 -1 >-Z * Z u Ud tai -J V • X o Z O Ui <~ s o u. — >»•% o s H *
* ^i si z < OZ • > z a .O" I»
■ z u - u S ^
1m ic w la
mm M IM m -m Ui N
r r _i «iZ - O >- •- w z o • «■
(J —M > J <A I ' »
:i «• (rt < a o o z u ^ —
ma >o Mi 1 > o Ui J k. t»». «J 11 *J « — <J I». ■o ZU 1 « N Ui • < u US ►• —
z o u. Z m < m K • a o J - V > — < • w z >• a n x 3 M > z z » o — w N •ra. X 3 •
O tm ri «a. 3 z mg Z
N N
u X z o ui a. S
a z
& -1
Ui i- z <
< u 1 Ui a ui — x on — x m u
a u t Ui < m — x on
m u > ■>
1 > *• i 3
• n a i
ii
-0 ••
Ui Ui s — IM — ■ a
— in « •
Ui U Ui U ^ w -• — IM d « d O" • — O
in ■»
N —
Ui Ui IV a in in
» — o ~ i i
Ui Ui
I Ui
— ■« ^ in ^ in >■ n «■da in
« e a a
«i IM
in » mo«
— IV —
-• o a r~ • ■
"" (M
(M ru m
♦ ui ui Ui
• ÜJ
* Ui
• UJ
• ui
♦ Ui
* UJ
* ui
« Ui
• ui
• Ui Ui Ui
o -t o 4- * » o J- -r 0» o in m K. ■Ö !•» * r> o ^. \ft « « • • ft* •
n <> • a • •
n • 9 • •
0' m
* * -9
• in *
B:*
• a z < 8
t.
K -
z z Ui' Ui < * • * * • Ä iM • ■ • * * z a »* w < 3 z z < IC t V
> * u _ Ui m n m m i» ui •« u inr> o i • 3 m
w — m a i «- . »SOS Ui Ui «J Ui a « o. »
o_ o uio. Q a. a NZ Z IM« u. < • e z • l/l W X Ui M
U _l ui > a a > Ui < IM — • h» •
* 2 ' < Z u. _i • o Ui Ui s -z a
• e « o - z
o ^ o r-< z » tCf "- ^ Ui u x az w
Ui _l * o C Ui
m ui v zs a » o — z » — u. < < *- UJ X < o - s m n Ui > z — fr- U Ui I « < »- UJ
zui n c S z in
U < IM US '
z « « n ui a. I »» Ui u. o < » « z X
< m > m _J < u c < _i z z a a. < o a, U Z W UI Ui Ui o z m x u
3 z m ^ a. a «•
• -o < ^ < z O -J Ui
Z Z 3 u M « u m
J z o • « « ui n u z JO to Z I z Ui Ui o z >n w ui z -o x o * s o W «-JO.
IMS
!|H k- Z Ui f u »z w Z ui 3 yl Ui _| w in x ui
ui — I
3 C Z <J a »o ui — « — _j Z < to Ui to z — m ui Q to to to a ui a- < z
Jf < r J u x
si Si
1 to c <
'S
E CO
=2 CD
z s « x m (M Z S >M < IC u.
105

TIHE T m 5.000E-07 SEC
PCULAHW UENSITIE5 ANO RATES OF CHANGE ELECTRICAL AND OPTICAL PARAMETERS
1 SPtClES E(|» Ndl DNII)/DT NAHE IEVI ICH-3) (CM-3/SEC) PARAMETER VALUE UNITS
RAO 0.00 1.271EM4 1.229E.20 JBEAM • 8.28 AHP/CM2 Eft 0.00 2.683EM4 -T.292£«19 DEPOSITION • < 2.00 AR 0.00 3.830EM9 -1.274E.20 ENERGY 320. REV AR* 11.SO 1.138EM4 l.ti'*t«20 OVOX • 11.22 KW/CN KR' 0.00 3.214fl8 -9.052E-20 P(BEAM) • i 92.94 KX/CM3 KR» 9.90 2.235EM4 4.>5SE>20 AR»» 13.50 3.437EM2 -1.M1E.20 R(EXTI > 0.00 OHM KR" tl.SO 7.334E«I2 -i.aeiE.2o LtEXTl • • 2.OO0E-07 HENRY AR!*) 15.80 3.617E«13 1.622E.19 C(exT) i • 1.330E-06 FARAD KRI«! 14.«,0 a.699E«l3 7.USE.19 AR2IO 13.00 4.533EM2 3.583E.18 AREA i > 2000.00 CMZ KR2t.) 11.80 1.858EM4 1.4*1E.20 OIST . • 10.00 CM f2 0.00 3.2$6EM6 -3.206E.22 CONDUCT • • 2.538E-02 /OHM/CM f 0.00 3.U5E.16 6.37SE.22 R(OISCHI < • 1.970E-01 OHM f- .01 5.900EM3 3.25U.20 AR2* 9.50 S.918EM2 5.249E.18 0 • • 3.362E-02 COULOMB KHi» 8.20 9.961EM3 9.313E.19 I'OISCMl • > 6.602E>04 AMP ARKR(0 12.40 1.3a2E<13 1.720E.19 J(OISCHI ■ 3.301E.01 AMP/CN2 ARKR* 8.80 1.044E«13 l.SlOEMQ E. 'S i .301 KVQLT/CM ARf« 6.50 4.260EM2 8.7BiE.17 ESUS'JSUS 42.94 KH/CM3
21 AR2F. 5.i0 5.222EM2 1.320E.18 22 KRF» 5.00 1.9eOEM3 -3.363E.18 O/C . • 25.282 KVOLT 23 KR2f. 3.00 9.724E«13 S.1S9E.19 VIOISCHI 13.007 KVOLT 2<> ARKSf» 4.00 6.082EM2 1.606E.17 L»DI/OT •
REFLECT LOSS i
12.274
70.00 < 0.00
KVOLT
t »/PASS
nCAVITYl 24.3 NS L(CAVITr) > 130.00 CM LENGTH 75.00 CM 0MEGA/4/P1 « 1.177E-04 THRESH • 2.378E-03 CM-1 NET GAIN • 2.434E-03 CM-1 LASER GAIN . 3.9S9E-03 CM-1 ABSORPTION • 1.S25E-C3 CM-1
INTENSITY - > 3.054E.06 WATT/CM2 OPTICAL 7.43 KM/CM3 EFFICIENCY • S.47 »
STEP SIZE . 1.072E-09 SEC T(EXTftAP) « 4,997E-07 SEC ORDER 1
OR. WILLIAM B. LACIHA. 10/21/77 NORTHROP RESEARCH AND TECHNOLOGY
Figure 44. Population Densities and Rates of Change Electrical and Optical Parameters
106

o O
id u z « "" w
in
Si u
o «
00 m —
K <
UiU — I« X —Ui « «-a X
I« 3 U CO o - ■" « 1 a: ►. - >- z w
u a: Ui
u & O < <
ui a.
a « a
ac
» - • _ < .- am«
■o « en • « •» iw — o —» • • • • oom a IM« Mf»
M I
IM a — n ■ e
IM
-a
in» ntn • • in — i -•
i
o — em f^ ^- -c oh. o f* h- o h>
4 tn a
i
00
in
i
o»*oin»- ^eiM <rtne«ooi ^ ^ — nireoAi AIPI^ • •■a» * • ■
nm am c «in •O -m O -C I — •"
film « a • *
■ i
■ 9> a I * •• IM O
7 e
iMP>(M«««Kine ci9e*raiMr>e • • • • •
— ajooooooa3>o^comöo«^o^n«oin — oAjoooni^o MM a» o o inn ru r e« » e^ > ji e « eein e e e ^ a e< (Mn 9> e — m o p>en*« e (MOfMeeo •# e i
am&<o*oni~<T'&t~o&**no3*oa
«rtMe«IMIM «o-«l>o»—IMO — IM —— OIM — —IM—(MM — O-t — — OO — — "«.OO-«—— — — — » — vO IM IM — — ry ftj —IMIMmM—NIMIMnilMIMIMfMIMIMCMrMIMIMIMIMIMIMIMiMIMIMftjni.'MIMIMIMIMIMIMIMIMM—IM — Ui Ui UJ UJ Ui UJ i.i t.i n n i.i i.i i.i i.i i.i i.i ixj iu Lxi ui i.i t.i i.i i.i ui ni 1.1 i.i ■■! ;.i i.i i^i i.^ i.i i.i i.i i.i 1.1 i.i 1.1 i.i -.i ^i ..i i.i i.i i^ i^ m — T o ^ »> 33 9>IM^#* — o^inans»—IM — «»^aniMiM — iMP-^h*h»4fMrMnaaeo9eiMiM — fM — njin^eiM-o 0(M^rMe<o — OCD^ — e^<rtnoccDe9iM — iM<fin(nnnnsen*»-^«9ic»iM — 9iMin oo ^ -D j> o iniMSh'^in^oini«^^««—rv^n^e^ainiAinnnm-«« — eeiM^iM^nr^^ine
n^^tn— noiM«-»ntnniM — IM — ^IM^^ — IM — n— — — — — nn——cMinmin-r^iniMiM — — iMin — —
— iMn«tnio^09o — o-^ftin^un-Äi^s^o — iMin^in*^«»o—iMrt-fino^coffio-iMn^i/i'Ch-oD^o —— — — — — — — — — —<MiMiMiMiM(MiM(M(MiMnnnnnnnnnn*<**<**«**in
I s i —
« C o
Jj
9 CD ^ 03
| QC
"o in w C o o E _t_r
13 -i U= < l_ o
C * o ■ o
in CD
z cr < to ''* c
a> Ui o -i i_ m a> Ui — a. 3 a K irC 5 'a- u 03
f =3 1» Oi
Ui u. oc m X
107
^iiyvi"''!'"'!"""7""

e
11
s I
u
o
55 u
a < u u
t
5 u - w
■r <s « —
• Of- » 4 in** —
* « — o •- »ftl o e IM* a =3
C
l- 3 OO u a o
^5 UJO — ** 5 -a Z
z
3 W a o — <
IS w
u X w 0.
•c a
9 r» * « « m vn w n *n ^. — i> in ri ma ■» n m * o* m » n nj (? in O" » « n < M — tn n
>^0 (D O *» 9» »n -» o —(M >n o o f* jr
^ ry M — ■*« o o» n — o — o— —
UiWUJUJUlWUJUJUJaJUJUJUUJUiUiWUJWWUJLiJUWUJLÜwJUJUJUJ ^—o^'OOooo<oin^p*floa3»oo*'^^^ — tf)^o(*ii/t«fn —
0J^m90et^^>9-Mt> ^^^^o^fNJ — rgoo^ — U^JDfMP»^* (Mino> ^IM».^^ — n — ^ö-»—-«fn—rjrtn — rt^N-*—-"flcgfg
• • • • •• ••
o
5 z
z 3
a
x
C o ^>
3
108
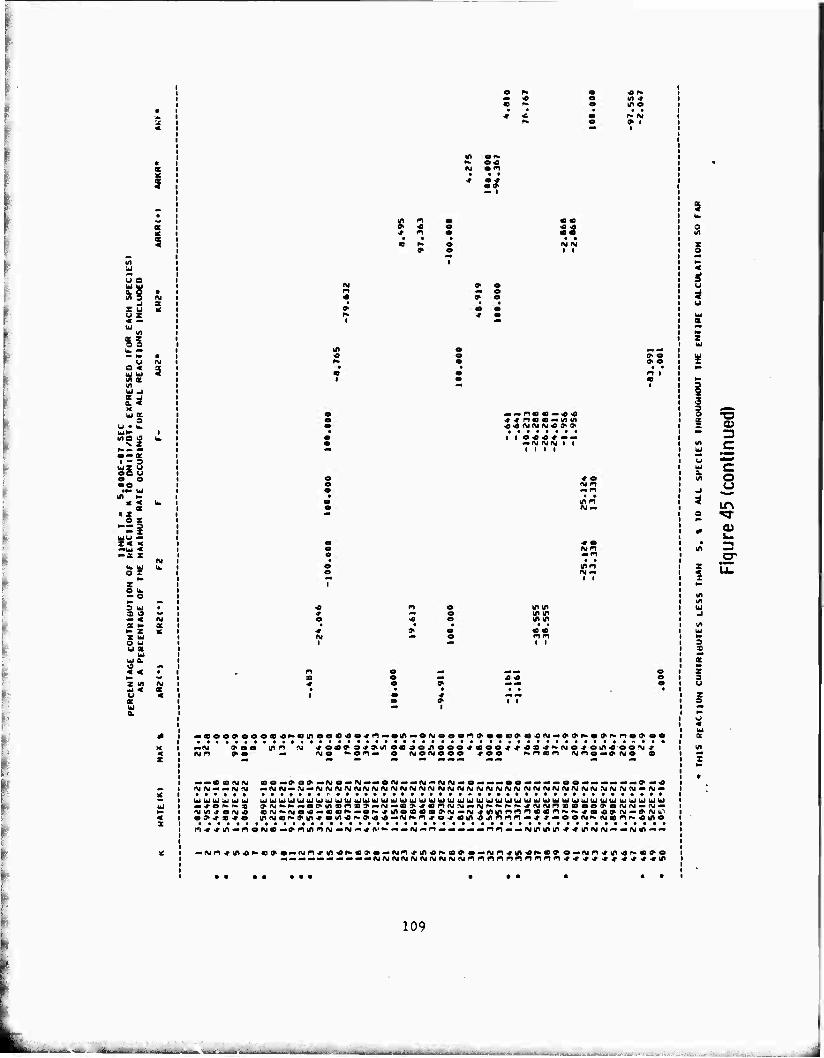
<
S
<
*§
a -i a. < x U K
o u • w u» uio a
>. z o— a l - 3 wz u oo u o o OO III »
X < a
:ti •• z
UiU w z« x —w < »z z
o z z
IM
3 O
o u u z
w a < < z «
a w a.
3
«A a • • ^ IM » I
I/) Of« ^ o« <M on • • • •• •* a»
— i
$ 3
» e — o » a
•a» ns » — « ^
mn
i
4
3>
mm m m m m
i i
I
-•4)eo9«ooa<0p*otfioe«)'ee<*n«*ein**oMo«en» o o e c «i^>f^ — »»P»OOI»» n O C* O O
» 9 i o * a o a ^ 4" J ao ^^ojoj'OJisüoo'M J- IO -r e o p*n«m ry n o — (? ry o o
— * o ». ~ » p« m * o m« o > -r s « o
UJUJUJUiUJUIUUiUiWUIUlUJWWUJUiUJUUUJUiUiUJMUJUUJUU'UiWUJbiUiUJWUJWUibJUJbi ■ «jfiMoo — ««'»—o'»*mo«««»(\( — ni*mmnn'p'««i«-'»-»a«»iM — »Min m(Ma>»*m*om«i»9i««—iMM-i*o*Bm-omnn(n —** — oo(\i»-iM«n^.«mo
rt^^t/j—moftjai—^riirmpy—fvi —^rn,*i^—— «j —r-i — — — — — nn—— ftjtnjikA^^^Nf^— — fMi/!— —
5 w o m
| < u
u Ui X
z
3 -—^ O ■o 1 Q> ^ Z3 in C u Mfc>^
w c m o -J u < ir» o "g-
Qi u- • kfl 3
cr 5 u. X
3 a
z 3 u
a. ■SI
I
109
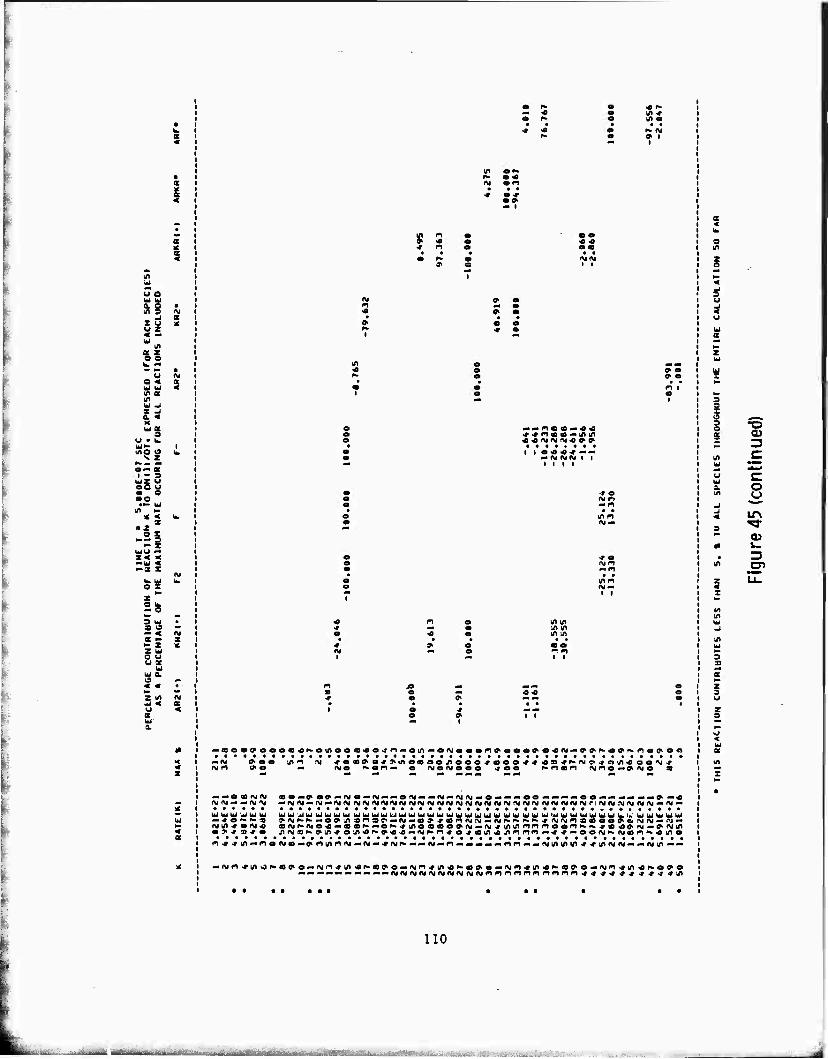
£§ 5S
a « m a
s
<
UIZ u aS u a O OO •** \jj
in »- « < s • z -si
>- X uu — Z« x — UJ < ~a z ru 5S u.
z o u. - o
3^ • - < IM B «- i •- z It Z u o u U X
u u & »3 « « • Z IA M «J < OC w < a Br a.
— « • •
■r ■o
a*
I
— — i-iaj so — « *
1 1 s« «* —— — nj MIVJ i i
1 l 1 1
-JS
aa
— m
(M — i I
m in m in mm
i
— «oo»ooo<o>of^(oinooeooo^n — oin—oraooort^oo«o^«^(M — o^^-o^^not^oes
»o««oo^««9-f^nio^e»m<0oeM'r fee «00 p* m s m rv n o-• <?> na o a
— — a « «MM ftj i\i — — ru ^
— ^ o «^ -^ ^ m (r> -r e IM « o ?» * « ^ o
n e — o O9^I\J o —rvi —-^of^ — — AJ^-^MM — o — — — oo-* — — — oo-»———— — » —-e
UJUJ'^JUJUJUJUiUJ UiUJUiUJLJUUiUJUJUJUiUJUJUJWWWUiUJWUJWUiLJ UihÜWUWIi*' Ui Ui Ui UW
«ni^Ato« — «os^>—o^«^o««0»M-*M-f(ninnnna«n^f^^tD40»fM—9i%iun
I^TUI—nofueo—t^nLnrtry—ry—^f\jr^——oj—n«— — -- — nri-.— rjin^u'i-r^iflnjAj——ojifi—--
«■njn ^i/io^fl09io»Ai<^^u>i<0P-
o
u
z
3 O
3 ^»
in
5 Z
"O (U
C
"c o ^ü
lf\
as v. 3
z 3
in
x
110

TIME T ■ ^ACTION
S100OE-07 SEC ll/OT. PERCENTAGE CONTRIBUTION OF REACTION K fo DNIIt/OTi EXPRESSED (FQA EACH SPECIES)
AS A PERCENTAGE OF THE HAAIHUM RATE OCCuRING FOR ALL REACTIONS INCLUDED
RATE<K) MAX « AR2F« KRF» KH2F« ARKRF'
1 3.021E-21 21.1 2 4.9S4E.21 32.a 3 4.440E.18 .0 A 5.S8TE*S« = 0 5 I.42TE.22 »9.« 6 3.068E.22 100.0 T 0. 0.0 a 2.5H9E.18 .0 « B.222E.20 s.a
10 1.877E.21 13.6 ii 9.727E.19 • T 12 3.901E.20 2.8 11 5.560E.19 .S IA 3.419E.21 24.0 IS 2.085E.22 100.0 16 I.Sa8£«20 a.a 17 2.673E.21 79.6 16 1.718E.22 100.0 19 4.909E.21 34.4 20 2.671E.21 19.3 21 7-642E.20 5.1 22 1.1SIE.22 100.0 23 1.2C »21 a.s 2*. 2.78Vc.*2I 20.1 25 1.384E<22 100.0 26 3.4aaE>21 25.2 27 1.093E.22 100.0 28 1.4Z2E.22 100.0 29 1.812E.21 100.0 30 l.S21E«20 4.3 31 U642E.21 48.9 32 3.557E.21 100.0 33 3.357E.21 100.0 3«. S.337E.20 4.8 35 1.337E.20 4.9 34 2.t34E>2l 7b.a 37 5.482E.21 39.6 38 S.4a2E>21 84.2 39 5.U3E.21 37.1 40 4.078E.20 2.9 M 4.07d£«20 20.9 42 5.240E.21 34.7 A3 2.T8ÜE.21 100.0 44 2.269E.21 15.9 45 l.a90E.2l 96.7 46 1.32ZE.21 20.3 47 2.712E.21 100.0 48 5.691E.14 2.9 49 1.S22E-21 84.0 SO 1.051E.16 .0
4.931
100.000
36.310
33.993 2.701
34.703
•12.519 -8.757
84.152
20.295
20.864
96.700
2.911
• THIS REACTION CONTRIBUTES LESS THAN 5. » TU ALL SPECIES THROUGHOUT THE ENTIRE CALCULATION SO FAR
Figure 45 (continued)
in

TIH£ T ■ S.006E-07 SEC PERCENTAGE CONIHIBUTION OF REACTI-U* K 10 ON<It/OTi EXPRESSED tFOH tACM SPECIES»
AS A PERCENTAGE OF THE HAXlNUH NATE OCCuRINC FOR ACL REACTIONS INCLUDED
«AIEIKI MAX « *R2r» !<BF« KR2F* ARKRK'
51 2.054E>21 T3.9 52 S.S31EM9 3.1 53 9.310E»20 2'.7 54 4.at7E«19 2.7 55 2.040E»2< 5.7 56 1.020E.20 5.2 57 9.730E»20 29.0 58 1.700E.20 6.3 59 1.980E.20 10.1 60 3.166E.21 48.6 61 1.955E.21 100.0 62 6.44SE«20 4.3 63 1.3B7E.20 5.0 64 1.678E.21 61.9 65 1.428£»22 100.0 66 3.048E.22 99.4 67 1.406r.20 5.1 68 2.249E*19 1.2 69 3.133EM9 .9 70 3.287E.20 9.8 71 1.044E.21 38.5 72 3.041E.20 15.6 73 6.515E.21 100.0 74 2.177£«21 14.4 75 1.510E.22 100.0 76 1.863E*21 17.9 77 1.21SE.21 8.0 78 3.708E-61 .0 79 2.S93E.20 2.3 80 2.481E*21 17.9
1.776
-6.269
-61.884
-38.506
13.604
6.166
I.351
-4.269
11.116
14.936 5.218
•10.130 -48.596 30.005 -100.000
-i4.42l -100.000
■100.000
-.000
•15.556
• THIS REACTION CONTRIBUTES LESS TMAK 5. » TÜ ALL SPECIES THROUGHOUT THE ENTIRE CALCULATION SO FAR
Figure 45 (continued)
112

X VJ
Z z
u
5 u a
«•'•■«■
• • • « »
Si — < us jo .3
.1 I o c
"o c 3
TO in TO u
IS) C OJ
C a> u.
O E ro CD
CQ I
LU
^
£ 3 Ü)
o
113

.«»-■«■■« — -«-*•-*« ~^~mm*m^*m* »■^■»»«^■■•i ■■•*■■•••••••• • H
x
il
I« c
u V
u C • Ä g o IT • • o > CD ••— M •o o o ro e Q: o •
e • o
f* ^ •*•* o U •■^
tfl z > ^ 5 o o ^ "
o o C •♦ M^
I < a
a 2
• *
Is I t
SI
£ &
o
IT
-» IV
114
_^

^g
e —u
a ■'S •«
IS 5|
z ui
u
o o
ra O ^—»
CD
O
c "c
C
« z O U1
00
a> 3 CD
3 • • • • • • -• • ■
• ••••••
e i i
u o
1
115

?8
21 u « X J u
K • « S w
tn x u « X
c 0)
o o c o
o en
<
a a o wi s < z 3 Q ig X o z
<U
-o « — a.
xa UJ a i/i in «a j«
i ■
T3 9 C o ro
c •—— o 03 O • o o k. n o
to ro
a -J a e s a*
<«■
O) u.
• 3 s cn
• ««•«•«•«•
I
8 a
116
:•..-- .„■■;,■-,; MlTifrii"' =. ■- ■- ■ 1^

z
o 0.
• • KM • • «c
K K
K
H
x
<scx Ul- < — U Ul - Wffl A-1 ' O udliJ I I I I I I I I I • ♦ K
X X X X X X X
X X X X X K X X X X
I X X X X X X I I I I xxxxxxxx
II u I*
if •- « u « z -I u .3 "A
si
c
i—
CD
CD
w o e o a • ■a
117
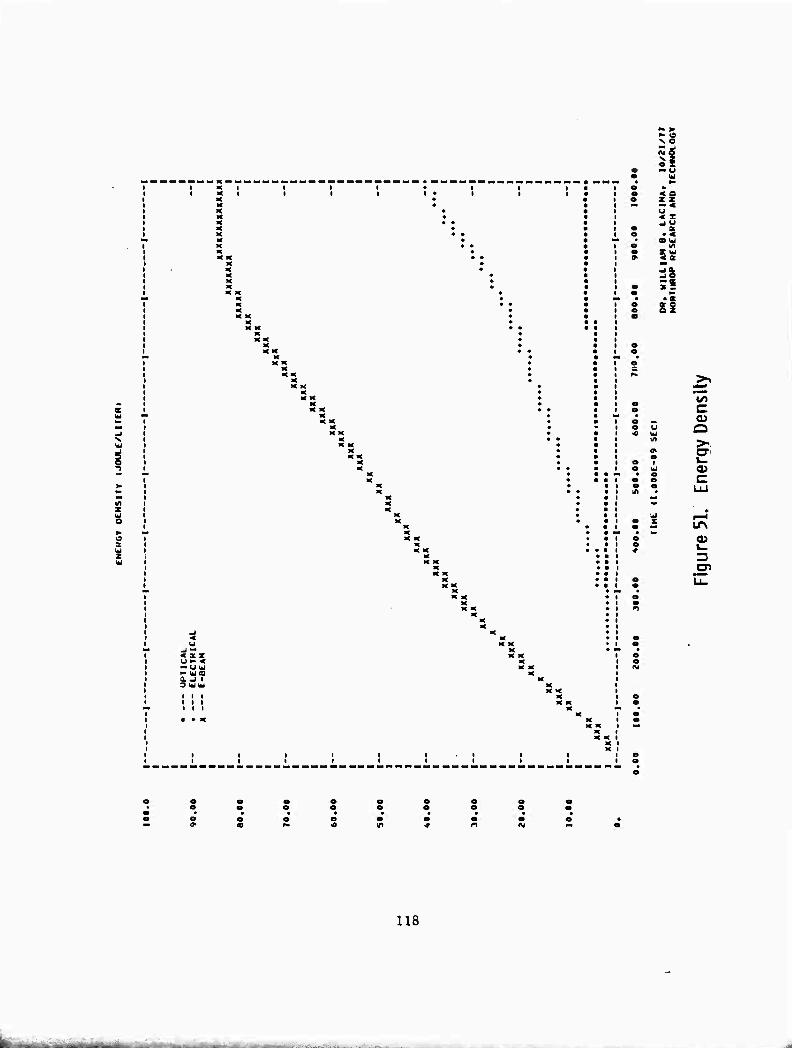
K K M
K K K c
o >■.
03 c
in
CD
M X «c
« KZ u •> < ^ wo a. j i 3 UIU
I I
118

o o
<0
II
'ix
I w «8
=i i si -2
z • > •
* • c
m
z
S a.
>u
Ou.« a. UJ •
«
u O) o
o t y e o Q o a. - -o UI a> I
"o ro Im,
X UJ
^ ro o Q. o
esl ITS
03 km 3 D"
119

N O
a a in
o e ■
o 5
3 O
u * z
a o
si
■"i • *
-'S:
SI ig Ä
>. U c a>
■o C ro 3^
•— to
^ C u u 1/1
a» Q
» >-» 1 en « \- o OJ
• c; •" LU
MJ •a z <D ^ O
CD
a> =3 cn
120

5 7
o s
9 o w X
a I u
o z u
3 Z
! < J5
3: -J u .5 ■ u x UJ < z
a. E
re si u
re
o 3
"O c o o re E «/> re
121

1^ ^ f- o v o — J
if i
■ •
M X
U1 3
i i X u
s in
H J u
et • ■*
a ui i/i
z u < at
ü
a) en C re .c o 'S .2 "re
•O c re
C CD O
IM
5 V a i
z
C a> V. i_
O QJ
V. re
o
at k- «
3 f" o . •/I •
1 ma 3i/l
K U1 — < — a X • o • i i
« « U1 1*1
z z CD
o o
122

if if
a •« a u In
a> en CD
>
o >
3
3 u a
CD
i i
i i
a w u u oo z z •- a < < — « »^ U X UIU <u-5 a, ui in a < »w z us x — i i i i i i i i i i i i
« • K I
I I I • •
123

tr m
M
si — «
in
s o u.
J5 = a Oi en c
z u 'S
"ro
S 7 m » c
CO
z
I
C a> O c
1o
§
4S -IOC
• • • •••••a ♦ ♦
• ••• ♦••♦• • ■ • • • • « i
♦ • ♦ • • i ♦ • ••••••
i * « • « i
124
^r H—^"t-rtrr imlllil illllil

4. EXPERIMENTAL RESULTS AND THEORETICAL CORRELATION
This section contains a detailed presentation of experimental results and
a discussion of device characteristics which limited the accessible range of
experimental parameters. Comparisons of these results with the theoretical
model has been undertaken and the correlation has been generally good in all
essential details. Results of a sample comparison are presented. In
addition, an analysis is presented which attempts to explain limitations in
the experimental results based on nonuniformity in electron beam energy
deposition. Finally, a theoretical extrapolation is presented assuming
optimistic device characteristics.
The experimental results fall basically into two classes dictated by the
electron beam deposition uniformity. The first class deals with laser
extraction over small volumes with the discharge anode placed 3-5 cm from
the ground plane screen. In this case, total energy output was sacrificed in
an attempt to determine discharge stability limits and enhancement with
reasonable beam deposition uniformity over short distances. In the second
case, the discharge anode-cathode separation was set at its extreme value of
10 cm with the intent of extracting maximum energy at the expense of discharge
enhancement. In both instances of small and large anode-cathode separations,
for e -beam pumping alone, the total energy output was found to be propor-
tional to electron beam current density, whereas energy enhancement with
the addition of a discharge was found to be roughly inversely proportional to
this parameter. Here, enhancement is defined as the ratio of laser energy
output with electron beam plus discharge excitation to laser energy output
with electron beam excitation only. Under optimum operating conditions
with a 900 ns electron gun pulse length, the maximum extracted specific
energy was 22 J/liter for a 3 liter volume with an enhancement of 1.22 and 2
beam current of 18 A/cm . Total extracted energy at this current level was 2
90 J over 10 liters. For a reduced beam current density of 10 A/cm ,
125
„ JH
specific extraction was likewise reduced to 8 J/liter with, however, a
corresponding increase in enhancement to 1.8. The relatively low enhance-
ment factors are shown below to be a direct result of discharge instability
induced by nonuniform beam deposition in the direction of propagation.
4. 1 Experimental Results. The experimental results are presented
sequentially in four basic groups: a qualitative description of beam
uniformity, resulting laser output patterns and discharge profiles; an
analysis of typical waveforms for the KrF and XeF systems; a detailed
outline of parametric studies to determine nominal operating conditions;
and a summary of results under optimum conditions.
The question of electron beam deposition was fundamental to the
experimental results and has been detailed in Section 2. 1. However, a
graphic representation would be helpful here and is shown in Figure 58.
The photograph is an end view of the device looking down the optical axis
and shows simply total fluorescence generated by the electron beam
propagating from left to right into 2 atm of Argon, The anode was drawn
back 15 cm and can be distinguished by the slight line reflection at the
right side of the photograph. The gun cathode in this case was of the high
current density variety with a 20 cm width. The extent of maximum
beam fluorescence is about 17 cm in the transverse direction and about
10 cm in the direction of propagation.
A typical laser output burn pattern on polaroid film is shown in Figure
59 for electron beam excitation only, and correspondence with the previous
measurement of energy deposition uniformity is apparent. Energy density
decreases from the center outward with the dark, oval center section containing
the highest density and the surrounding light halo about 1/3 as much. At the
border of this second area is a third, faintly discernible in the photograph.
126

Figure 58. Electron Beam Fluorescence-End View
I-...,.....:...,,......,.,..,, ,.,.., ^a..

Burn Patlern Anode Screen Cathode
Figure 59. Laser Output Pattern
--•^ ,.:..,.:UH:>,..:,.:

which contributes very little to total energy. The rectangular border
indicates the position of the optic holder which extends into the laser plenum
providing for an optical cavity length of 1.5 M. A support web, shown at the
center of the optic holder and burn pattern, obscures about 0.2 liters of gain
volume. The burn pattern corresponds approximately to a 10 liter gain
volume, and the 12 and 14 liter designations below their respective lineal
dimensions indicate the available extraction volume.
A5 mentioned in Section 2. 1 wherein the foil support geometry was
detailed, major support web obscuration was appreciable. Under discharge
current avalanche conditions, the discharge was found to collapse into
multiple, fairly diffuse channels coincident with the inter-web open spaces
with little or no current drawn at the web areas themselves. This phenomenon
is shown in the photographs of Figure 60. As indicated in Figure 60a, the
camera was tilted to observe the discharge down the full extent of the anode.
Figure 60b shows the discharge collapse for applied fields just below full
breakdown values. The central image is the one of interest; the images to
either side of this are reflections from the optic extension. The discharge
anode is to the left and gun foil to the right. For much higher applied fields,
the discharge breaks down fully as shown in Figure 60c, and the most intense
luminosity is associated with the region of initially highest beam deposition.
Since no sign of discharge activity larger than these dimensions was observed
on the anode surface, it was difficult to estimate the distribution of discharge
current in the more expanded, stable regime. Most likely, discharge current
followed the electron beam deposition profile in which case it would closely
match the beam fluorescence or output burn patterns.
The areas of current concentration caused blemishes on the anode as
shown in Figure 61. The dark spots, roughly 2. 5 cm wide by 6 cm long,
coincided exactly with the inter-web open areas and the luminous channels
of Figure 60.
129
JlTOiU™,™^:»™^,,,, ,

Plenum Front View
Camera
a)
Optic Anode
L 7^
b)
c)
Figure 60. Discharge Collapse-End View
IM Mal ■"-'"— r i"iiiiiiiTriiii ^i.-a:: :k.m
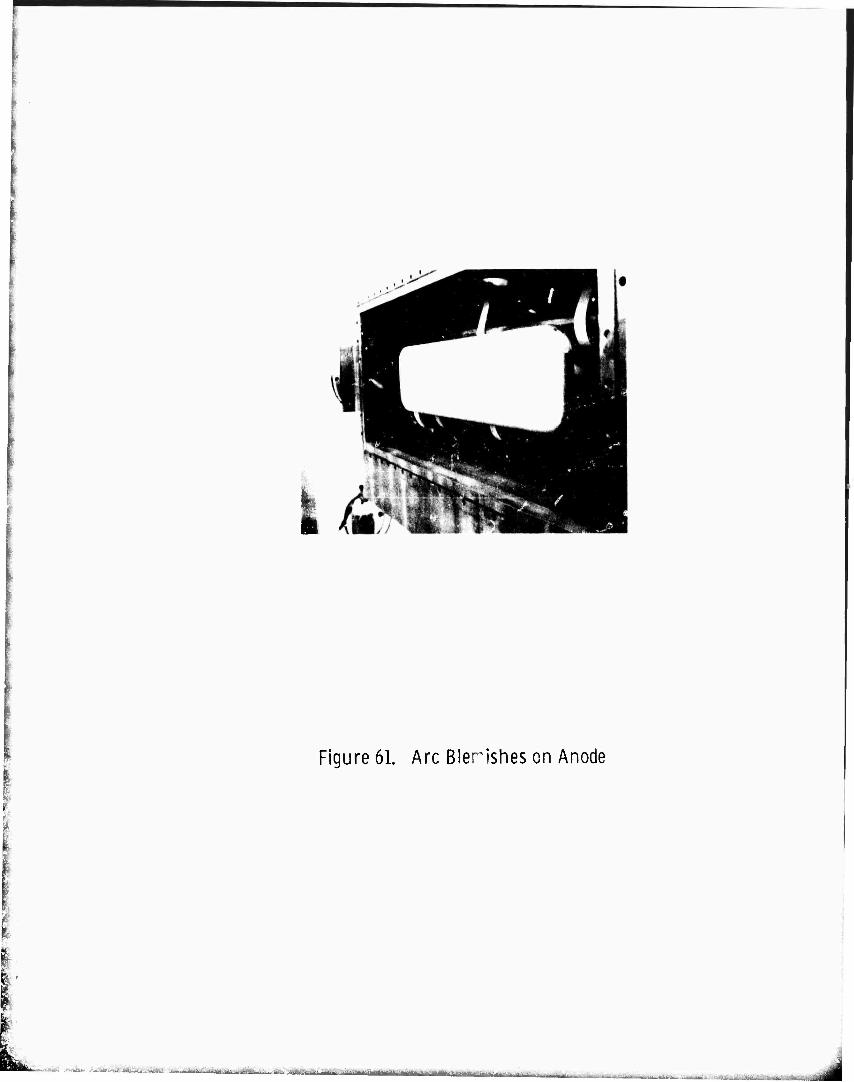
Figure 61. Arc Blerishes on Anode
„■•raB&L :^-iis^ y^-X^.^^. ■L-?t:-^;T- ... :-.r. ^ €^^ _.. ^

The action of the discharge channels on the anode surface and the bright
arcs in the photographs were a result of long term oscillatory currents, since
after electron beam turn^iff the discharge was found to ring for times on the
order of 20 fx s as shown in Figure 62. The period of interest was in the first
microsecond, a small fraction of the total waveform. Therefore, the effects
of discharge collapse pr ented above correlate strongly with the period after
termination of the electron gun pulse when discharge collapse would be
expected in any case without the stabilizing influence of the electron beam.
These arc effects were not observable during the gun pulse owing to their
small contribution to the temporal averaging measurements employed here.
However, the long term current spatial behavior is useful since it is most
likely indicative oi that occurring during the gun pulse if discharge collapse
occurs. It is reasonable to assume that the avalanche distribution resulting
from discharge collapse during the gun pulse would carry over to later times
as well. At no time was a distribution other than that outlined above observed,
suggesting that the arc geometry during electron beam operation was as
indicated by the long term measurements.
Figure 62 also gives an indication of the inherent circuit inductance in the
case of discharge collapse. From the usual relationship relating capacitance
and inductance to ringing frequency, the inductance is determined to be about
225 nH. When compared to the crowbar inductance of 175 nH it is clear that
the arc channels are capable of competing favorably with the crowbar circuit
for energy. Ind-ed, it was found that the crowbar did not alter the waveforms
obtained without it.
Typical Waveforms . The discharge and laser output were characterized
with the two basic circuit types reviewed previously. These consisted of a
simple capacitive discharge and a pulse charged, two stage capacitive discharge.
In the former case, it was found that significant energy v/as delivered only in
the latter half of the excitation pulse, limited by discharge -ing. With the
132
*—.

A-K«3cm C|-l.33/iF F2/Kr/Ar= 2/100/2280
9 KA/Div
0 KV/Div
Figure 6Z Long Term Discharge Voltage and Current
133
H^jggll .■^_^.J...

pulse charged discharge, it was observed that energy was delivered
significantly earlier in time, but that discharge arcing also occurred earlier,
with the net result that the two circuits were equivalent as far as total energy
loading was concerned. By varying storage capacitance, attempts were made
to reduce discharge voltage late in the excitation pulse in order to prevent
arcing at these times. It was observed that total energy input did not vary
significantly for capacitive storage in the range 1.33-2.33 H-I'. Above these
values, arcing was not observed to occur sooner, but the excess stored
energy, channeled into several columns, would often lead to gun foil rupture.
The relevant discharge and laser output waveforms are presented in the
following eight figures for both the KrF and XeF systems.
Figure 63 shows typical traces for the capacitive discharge with an
anode-cathode separation of 10 cm and central beam current density of 10 A/cm .
A nominal gas mixture of 2 Torr F , 100 Torr Kr and 1. 7 atm Ar was used.
Voltage values along the top of each column indicate initial capacitor bank
voltage and are included for labeling purposes. Relative energy output is
indicated along the bottom of each column. Laser output with beam only
excitation is shown in the far left column and relative output in this case is
67% of the ma-dmum obtained with discharge excitation. The upper trace
displays gun voltage, which closely approximates the current waveform, and
the lower trace indicates laser intensity measured with a photodiode. The
second column, indicated by an initial charge voltage of 30 KV, shows
discharge voltage in the fairly erratic upper trace and discharge current in
the smooth, monotonically increasing lower trace. The discharge was
triggered on at the same time as the electron gun; therefore, the initial
discharge voltage greatly exceeds the nominal trace values since the discharge
impedance is high at early times before appreciable gun current is established.
The possibility that high discharge field strengths prior to gun turn on could
set up incipient arc channels which would lead to arcing during the pulse was
134

R inacMiiiiiii
o L. <r O t— r—
S^S 2RS «esJC ^.^
< k. ü > -NJ .* LL. o
m
■IIHtSKtSIIIBMM ai
BBBBBBga BBBB^^iB BBBB9BB BBBB^BBH BaBSBBf« BEaHBBBii
«B BB Bi BB
o
E
BBBftUBEBB BBBIL^^BBSMI ■BBEks^ei B
BB BBBBfSiBBB BBBDI2BBB BBBBP^Bi iBHBBBBBI ■BBBBBBfl BaBsmu
00
x: o
>
o CD Q.
O
NO
CD
135

tested by delaying the discharge with respect to gun turn on. Identical results
were obtained for all discharge delays indicating that this possibility was not
realised. After full beam current is established the discharge impedance
drops and the applied discharge voltage is likewise lowered at which point
discharge current begins to flow. As the rate of rise of discharge current
decreases, the inductive voltage drop lessens and discharge voltage begins to
rise. However, voltage begins to fall off roughly 500 ns into the pulse as the
capacitor bank is depleted until finally at about 900 ns the electron gun turns
off and the discharge impedance rises once more. This results in a second
sharp peak in discharge voltage due to residual energy in the capacitor bank.
After this point, voltage drops drastically and current continues to rise
indicating the onset of arcing. As the discharge waveforms show, discharge
energy is pumped in primarily late in the pulse and this is reflected in the
late enhancement of laser output. These trends are apparent in the other
traces for 40 and 50 KV initial charge voltages as well. At higher charge
voltages, however, discharge voltage drop is experienced earlier in the pulse,
whereas current continues to rise indicating that arcing occurs earlier also.
The fact that the laser pulse is also terminated at earlier times supports
this observation. Unfortunately, the onset of arcing cannot be more firmly
established. The usual sign in higher impedance discharges of an inflection
in discharge current is lacking here due to the low discharge impedance which
does not change appreciably under discharge collapse. Attempts at observation
of increases in discharge fluorescence with a photodiode at the time of arcing
failed, since fluorescence levels were not noticeably different before and
after the indicated time of discharge collapse during the pulse.
Typical traces obtained with the pulse charged, two stage discharge are
shown in Figure 64; and the various parametric values were identical to the
previous case. With reference to the 20 KV initial charge case, the
discontinuous upper trace indicates discharge voltage and the lower, almost
flat curve, indicates capacitor bank current. The initial steep rise in discharge
136

>
at r«- o
2 J " -1 CM
CNJ <
> o
B <
e to <D
CD
EslsH^I BIS»-»
:ssl »ss| ll!"ll«BI
> Hfa MR
liil
155
00 o
o in
•MM o en CD
o on »—» o
> ^ o 1/1 ■o c a>
re 0] JC E O
a>
3 o Q_ mmt
S k.
C71
3
«=»00
|o
S Q£
137

voltage results from charging of C , originally at ground potential. Coincident
with this is a slight rise and fall in current from C , more easily discerned
in the higher voltage traces. At 600 ns into the charge cycle, the electron
beam is switched on and the discharge impedance collapses resulting in a
corresponding drop in discharge voltage. After this point, the current traces
do not reflect true discharge current and should ba ignored. Subsequent
to beam turn on, the discharge voltage behavior is identical to the previous
case. It is observed that laser intensity is enhanced at earlier times compared
to the simple capacitive case, but that termination of the pulse occurs earlier
at the higher voltages. This effect is most likely due to the fact that arcing
field strengths are approached more quickly.
As shown in Figures 63 and 64, the enhancement ratio for the simple
capacitive discharge was about 1.5 whereas that for the pulse charged, two
stage discharge was 1.25. The difference is within the experimental
variability over a period of time for a number of such experimental runs.
These previous results were obtained for a non-optimized system and are
meant to represent typical discharge behavior. In both cases cited above,
maximum extracted energy density was 7 J/liter at about 10% efficiency.
One of the more important experimental parameters was F partial
pressure, and results of variation in this quantity over the range 1.5-3,0
Torr T.re shown in Figures 65, 66 and 67. In this series, anode-cathode
spacing was reduced to 5 cm, capacitive storage reduced to 1.33 |JLF, and
beam current density increased to 15 A/cm . For the 1.5 Torr case of
Figure 65, almost no enhancement was obtained, whereas at the higher
partial pressures, enhancement was about 1.23. Also for increasing partial
pressure, discharge impedance is observed to increase as a result of
increasing F attachment. Highest energy extraction was obtained for 2 Torr
F which was considered the nominal value, and output for the 1. 5 Torr and 3 Torr cases was down by 10 and 20% respectively from this maximum.
138

v> C > 0) >
O c o > < ^ %m ^ 03 \r\ 1^ eo
pj 5
>
^ 8 ■ >
u m <
> o ^3-
Ö
>
E <
E
co
■«nan mmsmmu BBSB9B mammmm
o > —' S
C
03 E
U-
u. o h-
• i—i
i
E
03
o
in vO
laaDBHar aaaaess ■a^aaaa üsiäss aaaaaan
o
01.»
S Cu 2-3
139

1 >
A1
s ssu:» s ssi^ss IflBBBir
asaiiB*^
BBBSBrtBl SUBBBBBB
5
CM
i i -• 1 > s E a. i- ir\ <o -r-
< CJ U.
o
>
BBB^BB
BBBBBM
lUUffi ■nil|Hi| BMKBKIKB
SiSSiiSl
JEBBBBBJ BBBBBBail
oo ^
i/i c
(U E
iiiiiii lassaaa
e
§2 CD
o
140

A-K-Scm, V-l.6IUer C|-l.33pF F^Kr/Ar-3/100/1267 Torr
2, Beam Only (15 A/cnr,
suisBEi Brians ISHBBBIiaQE
30 KV
Mttf^StillflilBf« fi*5*URi
40 KV
iBMisaauBi
IUI
sfsssi usuuilH
18 KA/D'V
ISKV/Div
Relative-0.81 Output
mwim IBulNhiill
IBIiliriiHRiH IBI1ÜAWIIB IBUDBBHH inBiDBearA
1.0
Time 200 ns/DIv
IBIIaBlllBflH: IBUBBlllHBBi
Laser Intensity
Figure 67. Typical Waveforms-3.0 Torr F-
141

Experiments were performed for 3 atm total pressure and reduced
anode-cathode spacing in order to ensure beam deposition uniformity. Typical
results are shown in Figure b8. Characteristic of this regime is the spiked
irser output waveform which was exhibited for a range of gas mixtures.
XeF Extraction Results. Lasing with the XeF system was attempted for (57)
gas mixtures of current interest involving NF /Xe/Ne in the ratios
1.67/5.0/1267 Torr and 2.5/7.5/2280 Torr and the results are shown in
Figures 69 and 70, respectively. Electron beam current density was 15 A/cm
for about a 600 ns pulse. For the data of Figure 69, a capacitive discharge
was used resulting in a specific extraction of 1.85 J/liter at about 1.0%
efficiency and an enhancement of 2.2.
Operation at higher pressure, as indicated in Figure 70, resulted in an
increase of specific extraction to Z.i, J/liter at an enhancement of 1.5. In
this latter case, the pulse charged, two stage discharge was used at an anode-
cathode separation of 3 cm. These results compare favorably with those c*!
others, where maximum extraction energies of 2.8 J/liter at 1.8% efficiency (57)
have been obtained for 1 |JL s pulse lengths
Parametric Curves. Device parameterization for gas mixture, total
pressure i^nd discharge voltage are presented in the following series of
curves. In order to guarantee reliable electron gun operation for the complete 2
set of data, current density was reduced to 10-12 A/cm for an 800 ns pulse
length. Since comparison of results at high and low pressure was of interest,
the discharge anode-cathode separation was reduced to 6 cm in order to
provide for uniform deposition over the pressures of interest. Discharge
energy was supplied by the simple capacitive circuit with C = 2. 33 ixF; and
2
(57) v ' L, F. Champagne and N. W. Harris, Appl. Phys. Lett. 31_, 513 (1977).
142
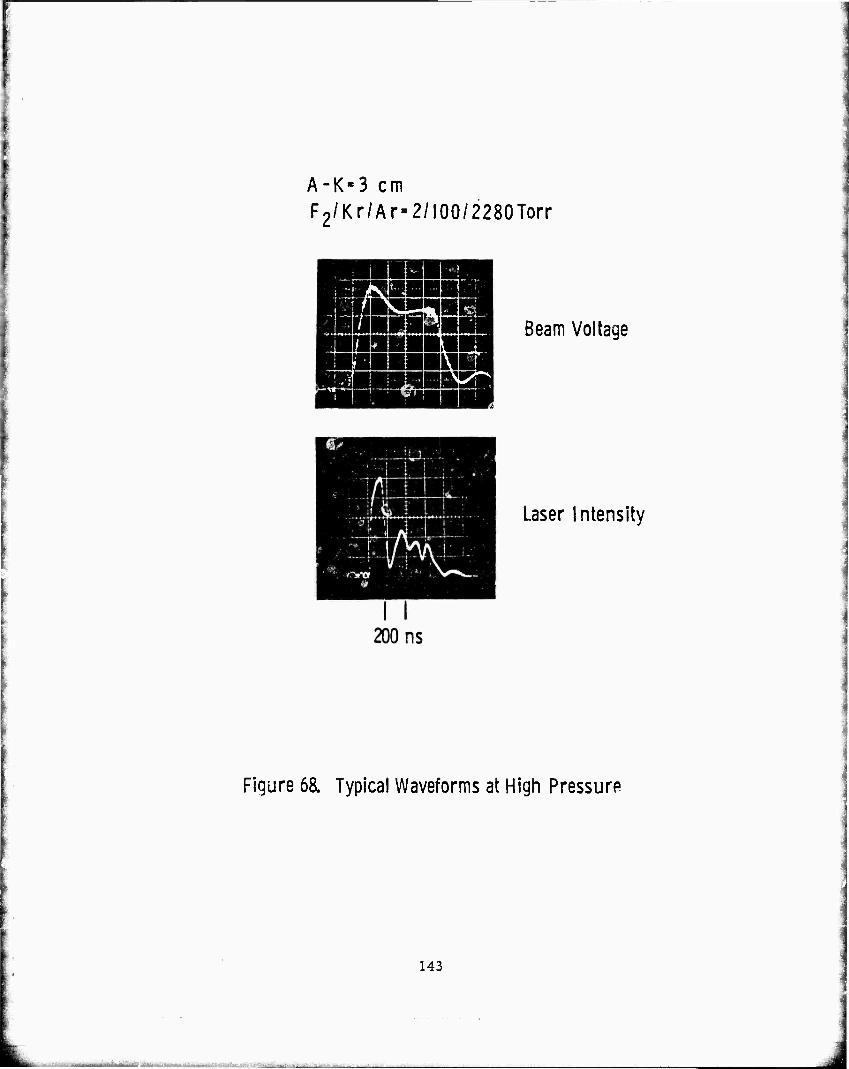
A-K-3 cm F2/Kr/Ar-2/IOO/2280Torr
[1-1 j ■«
' i 4'> Tiamma '."•!.■'
i ;' 1 ' ■if ™ jgL
i 1^ # 1 ■■ I -4- 1 j
■ i ¥ ■ 1 l ■il H
.' V! ; ' j^ ' IK >r: t ' T1 i , i
Beam Voltage
Laser Intensity
Figure 68. Typical Waveforms at High Pressure
143

A-K=IOcm. V-2 liter C,-l.33|/F NF3.'Xa/Ne-!.67'5.0/1267 Torr
I i 200 ns
Gun Voltage (J -15 A/cm2)
9 KA/Div
2 KV/DIv
mm H mmwz*m H inuniri MM ivjii
^w.^^ Sggg HHBHBBHH
Laser Intensity 1.85 J/liter
Enhancement0 2.2
Figure 69. Typical Waveforms-XeF at Low Pressure
144

A-K-Scm. V-I.O liter C|«l.33/iF( C2'0.7AfF NFg/Xe/Ne-k. 5/7.5/2280 Torr
Gun Voltage (J -15 A/cm2)
2 KV/DIv
4.5 KA/Div
Laser Intensity a5J/liter
Enhancement»!. 5
Figure 70. Typical Waveforms-XeF at High Pressure
145
^ i

an optical cavity composed of 100% and 70% reflectors, separated by 1.5 M
was used over the entire parametric range.
Variation of output energy with F partial pressure is summarized in m
Figures 71 and 72 for total pressures of 1. 7 and 2.3 atm., respectively.
The variatior In output energy was 20-30% due to shot-to-shot repeatability.
The abscissa in each pi ">t is in terms of capacitor bank charge voltage in
order to provide a consistent means of comparison. The relationship of
this parameter to actual discharge conditicas is presented in a subsequent
graph. For both sets of data, the Kr partial pressure was 100 Torr, considered
to be optimum. Variation of the Kr content from 50-200 Torr for all F
partial pressures and the tota. pressures indicated, resulted in only small
variations of the output energy on the order of the experimental variability.
The data of Figures 71 and 72 indicate a general trend to higher output
energies with ncreasing charge voltage for all F partial pressures.
Singular inconsistencies, for example the datum at 40 KV for 1.5 Torr F
in Figure 71, were not representative of average values and should be
ignored. It was found that the consistently highsst outputs were obtained at
2 Torr F (indicated by the solid lines) and a total pressure of 1. 7 atm. As
indicated earlier, laser output waveforms at higher pressures sMwed
erratic, spiking behavior therefore experimentation in this regime was not
extensive.
To indicate general discharge behavior for the 1.7 atm case, peak
discharge voltage and currArü at laser output termination are shown as a
function of charge voltage in F jure 73. The lower, solid 1;nes indicate
discharge voltage related to the left Ordinate, and the dotted lines reoresent
terminal current related to the right Ordinate. For increasing F partial
pressure, discharge voltage is seen to increase whereas current decreases,
indicating higher impedancs as expected.
146

AH. 7atm. Kr-100 Torr JB-IO-l2A/cni2
A-K-6 cm C|-a33/iF
1.0
5^.
c
3
3 o .1 IS
0.2* Beam Only
10 20 30 40 50
Charge Voltage (KV)
60
Figure 71. Relative Output Energy as Function of F2 Partial Pressure
147

Ar • 2.3 atm Kr-100 Torr JB-10-12 A/cm A-K ■ 6 cm
2
1.0 1 r
F2" 2.0 Torr
0.4 - if
0.2 [
Beam Only
10 20 30 40 50 60
Charge Voltage (kV)
Figure 72. Relative Output as Function of F2 Partial Pressure
148
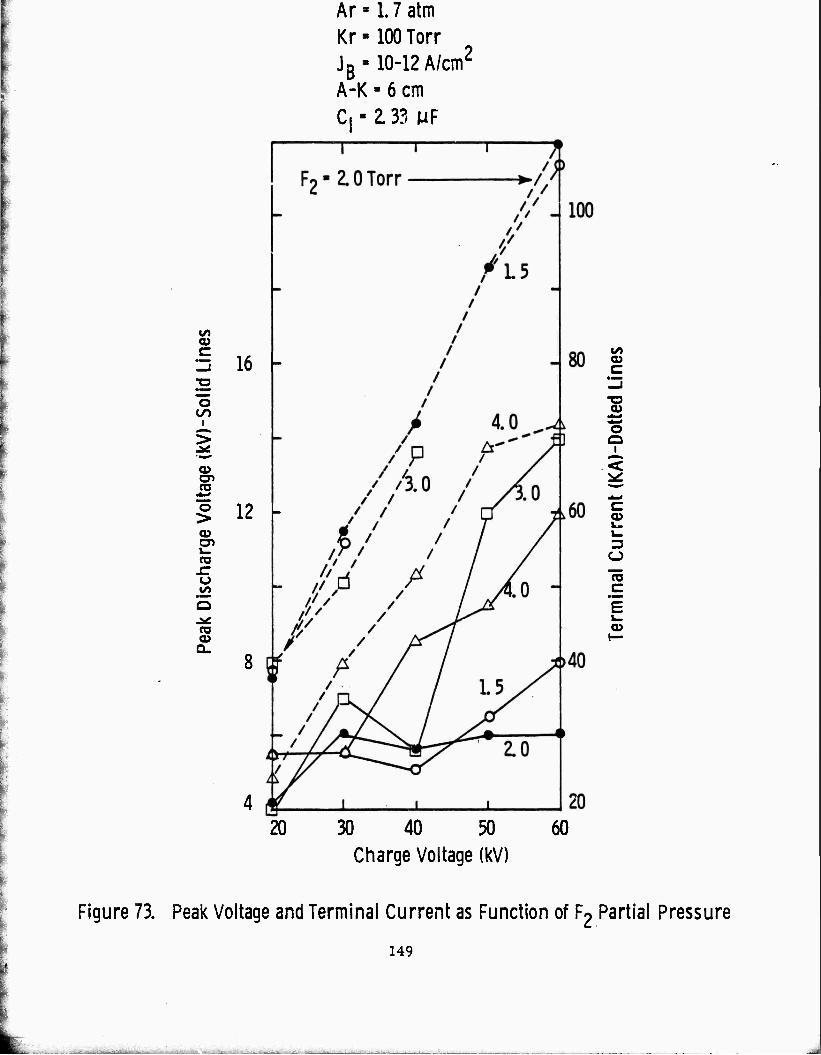
0)
5 16 - o I
>
a> en iS "o > 03 cn i_ to
u IS)
ra a> Q.
12 -
Ar» 1.7atm Kr -100 Torr JB-10-12 A/cm;
A-K»6 cm C,-i33 MF
8
to Qi C
03
o i
<
O)
l_
"ro C
E
20 30 40 50 60 Charge Voltage (kV)
Figure 73. Peak Voltage and Terminal Current as Function of F2 Partial Pressure
149
As previously suggested, a general criterion for premature discharge
collapse during the electron gun pulse was early termination of the laser
output. It was indicated that, above a certain critical field, higher voltages
would lead to earlier termination. This effect is shown graphically in Figure
74. The nominal pulse length, with electron beam excitation only was 800 ns
as indicated at the abscissa zero point. For all F partial pressures,
pulse length is not seriously degraded up to a charge voltage of 30 KV. Above
this value, however, shortening occurs which becomes serious for higher F
partial pressures. For 2.0 Torr of F this corresponds to a peak E/N of -17 2
2.2 x 10 V-cm . Of course, this is the peak experienced during the
discharge and does not necessarily correspond to the undetermined arcing
value which occurs later in the pulse.
Optimum Results. Laser energy extraction was optimized for both small
and large anode-cathode separations. In the first case, spacings of 3-5 cm
were considered in the hope of establishing the beam deposition uniformity
required for high enhancements. As will be shown below, discharge
stability is crucially dependent on deposition uniformity in the direction of
propagation. Unfortunately, the results in this instance were limited by
constraints related to electrode geometry. In the second case, an anode-
cathode sparl % of 10 cm was used in the interest of increased energy output.
In order to maximize laser output, it was considered important to
maximize electron beam current density. In this regard, the 70% transmissive
ground plane screen, adjacent to the gun pressure foil was removed. At
large anode-cathode spacings, this had no effect on discharge stability, but
did enhance output by roughly 60%, slightly greater than would be expected
by the simple removal of a 30% obscuration. For small anode-cathode
spacings, however, discharge stability was greatly impaired as a result of
arcing to the raised foil edges coincident with the support webs which become
prominent under gas pressure loading. In order to provide a smooth ground
150

Ar • L 7 atm Kr -100 Torr JB-10-12 A/cni;
A-K- 6 cm Ci-2.33 MF
900
800 ct.
700
600
500
400
300
F2- a 0 Torr
200
Beam Only
10
•vl.5
\ ^4.0 ^>
\
3.0 -\ <1D
v \ \
20 30 40 50
Charge Voltage (KV)
60
Figure 74. Laser Pulse Width as Function of ?2 Part'al Pressure
151

plane without reintroduction of the 70% transmissive screen, a second -3
unloaded 5 x 10 cm aluminum foil was placed directly over the pressure
foil. Measurements with a Faraday cup indicated that current densities
immediately beyond the second foil were identical to those without it. Results
with this configuration, however, were not significantly different from
those in the previous arrangement with the ground plane screen. Possibly
increased beam scattering from the second foil was responsible for
reducing the laser output below expected levels. Alternatively, attempts
at maximizing enhancement were made with short pulse operation at an
anode-cathode separation of 10 cm. In this instance, although discharge
collapse was experienced, harder discharge pumping could be achieved over
a brief initial period. Therefore, optimum results were obtained for large
volume, short and long pulse excitation as outlined below.
Table 1 summarizes the results for long pulse operation with central 2
beam current densities on the order of 15-18 A/cm . As suggested by
previous remarks concerning deposition uniformity, maximum specific
energy was deposited roughly in the central three liters. Therefore, in
order to obtain an indication of maximum specific extraction, the laser
output was masked off allowing for transmission of only the central three
liters of gain volume. The three liter volume was calculated assuming an
effective gain length of 75 cm as indicated by the longitudinal deposition
profiles. These results are tabulated in the first column in Table 1. Specific
extraction in this case was relatively high at 18-22 J/liter. The span
indicates extraction with beam only for the lower value and beam plus
discharge excitation at the maximum. Enhancement was therefore 1.2.
For the full, unmasked 10 liter extraction volume where the current
gradient
J/liter.
gradient was estimated at 10-18 A/cm , specific extraction was 7.5-9.0
152

TABLE 1. LARGE SCALE EXTRACTION RESULTS - LONG PULSE
3 liters 10 liters
• Beam Current 15-18 A/cm2 10—18 A/cm
• Output Energy 54-65J 75-90 J
t Specific Output 18-22 J/« 7.5-9.0J/ß
• Specific input 167-200 m 100-120 m
• Efficiency 11% 7.5%
• Theoretical 15J/C
(TI-9%) Enhancement ■1.2
• Conditions Beam Voltage:
Pulse Length:
320 kV
900 ns
Optics.- R " 50%. 100%
Gas: Ar/kr/F? - 1290/100/2, 1.7 atm
153

Enhancement in the long pulse case was clearly limited by premature
discharge collapse. Therefore, in an effort to increase enhancement,
harder discharge pumping over shorter time was attempted. The relevant
waveforms are shown in Figure 75 and the results are summarized in Table
2. For the nominal 400 ns pulse length, enhancement was increased to 1. 8
with a specific energy output of 7.2 J/liter. As indicated in the second
column of Table 2, theoretical predictions, based on the extensive code
described earlier, correlate quite well.
Discharge Power Loading Analysis. As indicated above, electron beam
deposition uniformity in the direction of propagation was the limiting factor
In achieving high discharge enhancements. A summary of a comprehensive
analysis is presented below which attempts to explain these limitations in (58)
terms of detailed system parameters . In essence, maximum
discharge energy loading is limited by a local stability criterion and the
requirement for current continuity from anode to cathode.
The stability criterion is derived assuming that electron production and
loss are a result of electron beam and metastable ionization and F
attachment, respectively. An upper bound on discharge energy loading is
developed from a limitation on discharge E/N, which if beyond certain critical
values leads to runaway metastable ionization and arcing. The criterion
reflects the requirement that ionization from the electron beam must dominate
that from the discharge to maintain a stable discharge for times on the order
of a microsecond. Or, in more definite terms, for the parametric range of
interest.
(58) ' W. H. Long, Jr. "Discharge Stability and Scaling of the KrF Laser",
Presented at 30th Gaseous Electronics Conference, Palo Alto, Calif., l8-21 October 77, (To be submitted to J. Appl. Phys. (1977)).
154

Large Scale Extraction - Short Pulse
6 I-
400 SCO
Time (ns)
1200
Figure 75. Waveforms for Short Pulse Case
155

TABLE a LARGE SCALE EXTRACTION RESULTS - SHORT PULSE
E-Beam Only E(ln)-83J/ß
EM ■ 4 J/fi
n -5%
83 J/C
5.0 J/C
6%
E-Beam and Discharqe E(ln)-103J/?
E(Out) - 7.2 iR
n -7%
167 J/ß
10 J/C
6%
Enhancement• 7.2/4- 1.8 2
Conditions E-Beam: J ■ 18 A/cm2, V ■ 300 keV. T ■ 400 ns
Discharge: E/n • 6 x 10"17 V-cm2
Optics: R ■ 50%, 100%
Gas: Ar/kr/F2-1290/100/2. Uatm
156

F <YP1/2
, (36) d e
where, P. and P are discharge and electron beam power density,
respectively and the quantity Y depends on only the fluorine partial pressure
(F ) and total pressure (P) according to
y%0.ZHT2)U1 (P)0*2. (37)
where F is in Torr and P in atm.
It is required that the current be continuous across the discharge. That
is,
J = e n v = Const. (38) d e
Within the range ITd < E/N < 10 Td and 10" < n/N < 10" , v can be
approximated by
v ^(n/N)0,2 (E/N)0,4 . (39) e
The current density is therefore,
J =enb (n/N)0,2 (E/N)0,4 (40) d
_3 The requirement (38) therefore dictates that E/N vary as (n/N) ; and since
P, is directly proportional to E/N, d
PJ <= (n/N)"3 . (41) d
The principal loss of electrons is by F attachment. If metostable ionization
is neglected, the electron density can be expressed as.
157

n = P /ß F,W. (42) e 2 i
where ß is the attachment rate and W. is the energy required to form an
electron-ion pair.
Combining (41) and (42),
-3 P « P (43)
d e
For the purposes of calculation, it is assumed that the electron energy-
deposition fall-off is linear from the foil to some distance, d, from the foil.
If r is the ratio of power density at d to that at the foil, then
P (x) = P (1 + (r-1) x/d) e eo
Therefore, from (43),
PJ(x) = c (1 + (r-1) x/d)"3 (44) d
By invoking the stability criterion (36) and choosing the constant c to
satisfy this at the point d, which guarantees it for x < d, the average
discharge power loading can be calculated by integrating over 0 s x s d.
Additionally, if a discharge circuit is chosen which approximated that used
experimentally, then the resulting power loading must be divided by 2, due
to the approximately sinusoidal waveform.
Finally,
and
P = P (l + r)/2 (45) e eo
R =Y P1/2r3/2 (l+r)/2 (46) d eo
158

The enhancement, e, defined by
P, + P d e e =
P e
is therelore given by,
€ --• 1 +Yr3/2/Pl/2. (47) eo
This relationship is graphed in Figure 76 for a beam power density of 0.4 3 2
MW/cm , corresponding to a current density of 15 A/cm , and a nominal
mixture of F /Kr/Ar = 2/100/1267 Torr. For the range of enhancements
obtained experimentally, (1.2-1.4), the indicated value of r is about 1/3
and this is well within the values of beam deposition determined experimentally
as outlined in Section 2. Also, by (47), enhancement decreases as beam
current is raised, and this was observed experimentally. In this case, the
theoretical maximum enhancement is only 1.9. Of course, for fixed r,
enhancement can be increased by increasing F partial pressure anc1 total
pressure or by reducing electron beam power density. However, these
procedures are limited due to kinetic processes. As beam cunent density
is reduced, total power drops and absorption begins to become important. I*
For an increase in F , quenching of KrF and absorption by F increases;
and an increase in total pressure accentuates beam nonuniformity and leads
to the formation of timers which provide additional energy loss channels.
Determination of the optimum set of parameters is very complex and cannot
be obtained simply from the above formulation.
4. 2 Typical Theoretical Correlation. The details of an extensive
theoretical kinetic model for description of the physics of an electrically
excited laser, as well as its numerical implementation by a comprehensive
159

PgQ -0.4IVM//cm3
F^Kr/Ar-2/100/1207 Torr
e
ZO
L8 -
L6
1.4
L2
LO
T 1 1 1 1 r T r
Figure 76. Enhancement versus Beam Gradient
160

and general computer code, have been described in Section 3. In Section
3.4, results of a typical analysis were presented in order to illustrate '.he
flexibility aiid generality of this code; in addition, the figures presented in
that Section have been selected to summarize the physics of the molecular
kinetic reaction scheme currently assumed for the KrF laser system, as well
as to correspond to parameters for which a comparison with experimental
data from the scale-up device can be made. Correlations of the theory with
experimental data have been made for a variety of conditions, and reasonably
good agreement has been obtained.
The nominal operating parameters for the calculations presented in
Section 3.4 correspond to conditions typical of the scale-up device described
earlier. This device consists of an electron-beam-stabilized, low inductance,
capacitive discharge, defined by a 20 x 100 cm anode, separated by (its
maximum value) of 10 cm from a grounded cathode screen through which a
(~ 320 keV) e -beam is passed. The maximum g...i.n volume is nominally
20 liter, with optical extraction along the major axis. However, for the
present experiment, the optical resonator used a 6 cri diameter (R = 70%,
not optimized) extraction area located just adjacent to the screen cathode
with L (cavity spacing) = 130 cm, and Y (the intracavity loss/pass) = 0. c
The e -beann-excited gain length was estimated (by cinemoid) to be L ~ 75 cm, Q
giving an extraction volume ~ 2 liter. The laser plenum can be operated up
to 10 atm, although the typical conditions for the presr.it results consisted of
Ar/Kr/F = 1190/100/1.5 at a total pressure of 1.7 atm. Electrical pumping
was provided by direct e -beam exr tion, or enhance'.* by an electrical
discharge with energy supplied by a 1. 33 |xF capacitor bank, initially charged
to 40 kV. Measured circuit inductance was 200 nH. Electron beam current density / 2 was ~ 10-12 A/cm for a pulse duration of < 1.0 fis. Available circuit
diagnostics included discharge voltage, measured directly at the anode, and
total discharge current, measured at the capacitor bank ground connection.
Optical output was diagnosed with a photodiode for temporal behavior, and a
161

calorimeter for measurement of total output energy. Predictions of the
analytical model have been compared with experimental results from this
device. Figure 77a shows an oscilloscope trace of the e -beam voltage V ,
and Figure 77b displays the temporal output power obtained with e -beam
excitation only. Figur«, 78a shows traces for the discharge voltage and
current, and Figure 78b the laser output enhanced with discharge pumping.
These data are to be compared with theoretical predictions shown in Figure 3/2
79. The e -beam current density J. (t), which approximately follows a V b . 2
law, had a maximum value of ~ 12 A/cm , and is shown in Figure 79.
Experimentally, the maximum extracted output was ~8 J with e -beam
excitation only, and 14 J with an electric discharge, corresponding to
specific outputs of 4.0 J/liter and 7.0 J/liter, respectively. Beam uniformity
was estimated to be approximately constant, with less than 157c reduction in
intensity at the edges of the optical aperture. These values are to be compared
with predictea values (integration of power in Figure 79) ox 4.7 and 7.0 J/liter,
at 5,6% and 5.5% efficiency, respectively.
Note the steep leading edge and the sharp decay at early times on the
optical extraction. The origin of this effect is the theoretically predicted
.strong overshoot of the net gain -.oefficient (about a factor of 5) over the
threshold loss, resulting in superfluorescent extraction for about 100 ns
(cavity photon lifetime is t ~ 25 ns), pfter which the gain relaxes to
threshold, .uater in the pulse, for e -beam excitation only, the output
approximately follows the temporal e -beam current density, sinc^ the *
dominant mechanism is the formation of KrF by F ion recombination.
(The F population density follows the secondary electron density n , whose e
source term is e -beam ionization, J, (t)a „ N/e). For the case of electric b eff
discharge, the rate of change of sustainer voltage and current is limited by
the inductance, and the maximum voltage (~ 12. 5 kV) is limited by the low
circuit impedance (~ 0.2 ß). Thus, the e.fects of enhanced pumping do not
162

a) 80 kV/div
b) 4 J/liter
200 ns
Figure 77. Electron Beam Voltage and Ootlcal Output Power
163
^

HBBHBWBBi BBBBBBBBi
BKllPäl£3IBI9IBBM iBBBBScBaK^iai IS kA/div 8BBBrJBaKBB^a
PB^BBSBK^Bi
BflBBBBBBBS BBlBBBBBBa
b) SiSPJliii ^'^ BBBBBBBVBSa SSSflBBBMaa
1 ' 200 ns
Figure 78. Discharge Characteristics and Optical Output Power
164
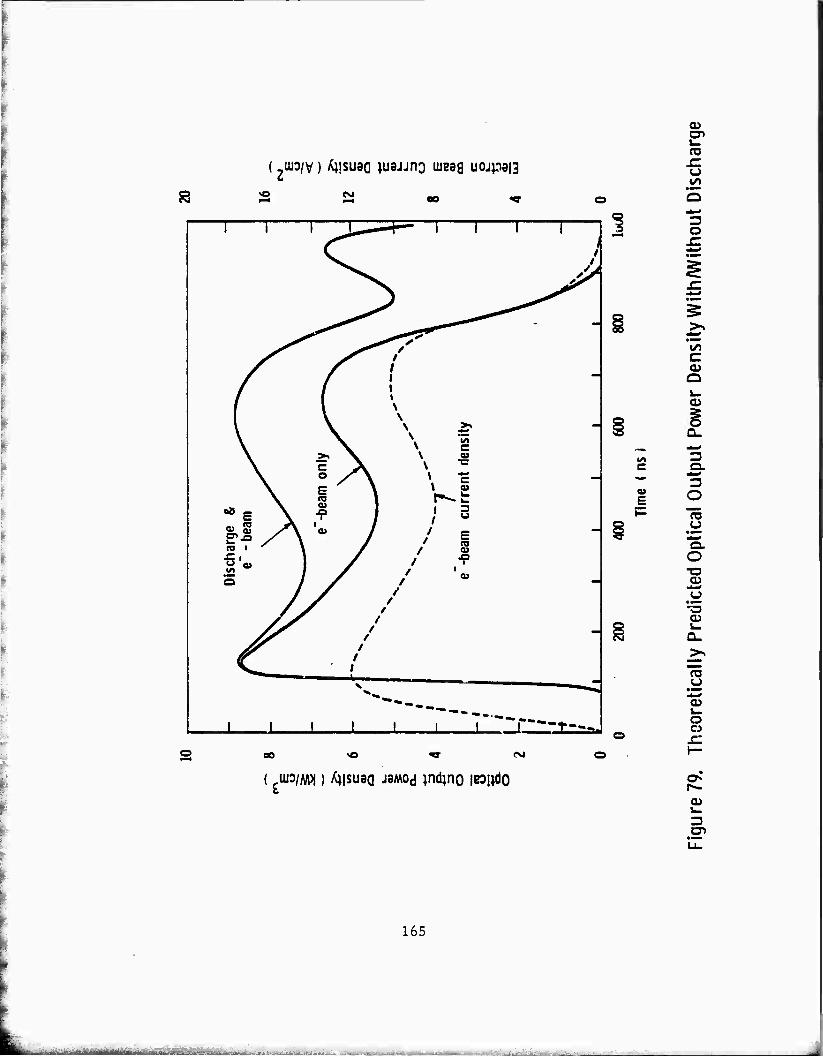
( ui3/v) /^isuaa ^uajjno lueeg uojpag
S evi
1 1 1
<
1 -4-
>
—^ / / /
« \ \
\ \
"I ' I 1 1
\ \ c \ ^ \ \ 09 1 \ C X v ■c
\ o / \ \ c —1
i \ E \
\ ** V Jp ) \
i i
3 U
%%/ Y« / * E CO
- «O 1 ' \ / / CD 0 at / / ^P «/> / s / v /
/
i
/ /
-
X
1 1 i 1
^^^ mm^ m
1 1 1 i r-—
O) en v-
o
3 O JZ
1/1 c
OJ
E
CO C CD Q k_
3
o u
•«a
"o. O ■a
•a OJ i_ Q.
>? "CD O
OJ v- o o
OJ
( ,UJ3/M)|) Aisuea J3M0d jndjno |B3Udo CD
3 cn
165

occur until much later in the pulse, ifter ~ 500 ns. Note the appearance in
Figure 78a of a sharp initial voltage spike across the discharge, caused by
the initially high impedance. Note also the increase in discharge voltage
at the end of the pulse, after the e -beam current falls off. This is also
reflected in Figure 78b and 79 in the small bump on the final edge of the
optical extraction for the discharge case (somewhat overpredicted by the
analysis). This perturbation occurs because the discharge impedance rises
faster than the current decays.
The good agreement which has been obtained in comparisons of
predictions of the present model with data from this and other KrF laser
devices suggests that the KrF kinetics are reasonably well understood.
Results of the present analysis- indicate that much higher optical extraction
should be possible with the nominal operating parameters of the present
device. The extrapolation to higher power will be discussed in the following
section.
4. 3 Scaling Considerations. Predictions of the present laser kinetic
model indicate that high optical extraction (> 35 J/lit3r) at — 6.5% efficiency
should be possible with the nominal operating parameters of the present
device. To achieve this extraction, enhancement by means of an electric
discharge is required. At present, the optimistic performance calculations
to be discussed here have not been realized experimentally, and the reason
for this can be explained ir. terms of discharge nonuniformity and stability.
If uniform e -beam energy deposition and uniform electrical excitation over
large volumes can be achieved, the realization of efficient high energy KrF
laser performance should be possible.
Consider the following experimental parameters (optimistic, but not
necessarily optimized) which shoulc be attainable from the present scale-up
166

device. Assume an Ar/Kr/F = 89.8/10.0/0.2 mixture at 3.0 atm, pumped
for 1. 0 (J. s with an external RLC circuit with L = 200 nH and C = 4. 0 |a.F 2
(initially charged to 100 kV) driving a discharge of area 2000 cm and A-K
separation of 10 cm, sustained by an external e -beam of (constant) current
density 15 A/cm . Let the optical resonator be formed by (100,30)% reflecting
mirrors with a gain length L = 100 cm. Results of the analysis are shown in
Figure 80, where optical output power density and electrical input power
densities from the e-beam and discharge are shown plotted as a function of
time. For a 1. 0 |i s pulse, integration of the curves gives an output energy
extraction of > 35 J/liter at ~ 6. 5% efficiency.
4.4 Conclusions. Results of the present investigation have indicated
that high optical energy extraction at high efficiencies is possible from the
KrF system. As a result of the present program, an extremely flexible
and versatile experimental device, as well as a comprehensive theoretical
analysis with a broad range of applicability were developed for the investigation
of electrically excited laser systems. Although certain experimental limitations
prevented the realization of initial program goals for the KrF laser system,
significant results were achieved and understanding of fundamental physical
mechanisms was obtained.
167

B. S
1- L,^
wo C
O
CO u
• HBI
k. -*-rf o a>
SI LU c •o
1 c CO
H— CD O
=5
o S R 2 .
168