distribution systems and dispersed generation c6.pdf · sc c6 - distribution systems and dispersed...
TRANSCRIPT
Distribution Systems and Dispersed Generation
Nikos Hatziargyriou
Chairman of CIGRE SC C6
9 January 2014
Bangalore, India

SC C6 - Distribution Systems
and Dispersed Generation
Chair: Nikos Hatziargyriou
Secretary: Christine Schwaegerl
Main Technical directions
To study the connection and the integration of distributed energy
resources (DER), including small size generators, storage and
relevant power electronic devices
To study the application of the DER concept as a part of the
medium-long term evolution of distribution systems (Microgrids
and Active Distribution Networks)
To study actions and processes for demand management and
customers integration
To study the subject of rural electrification
… to cover all aspects of Smart Distribution Grids
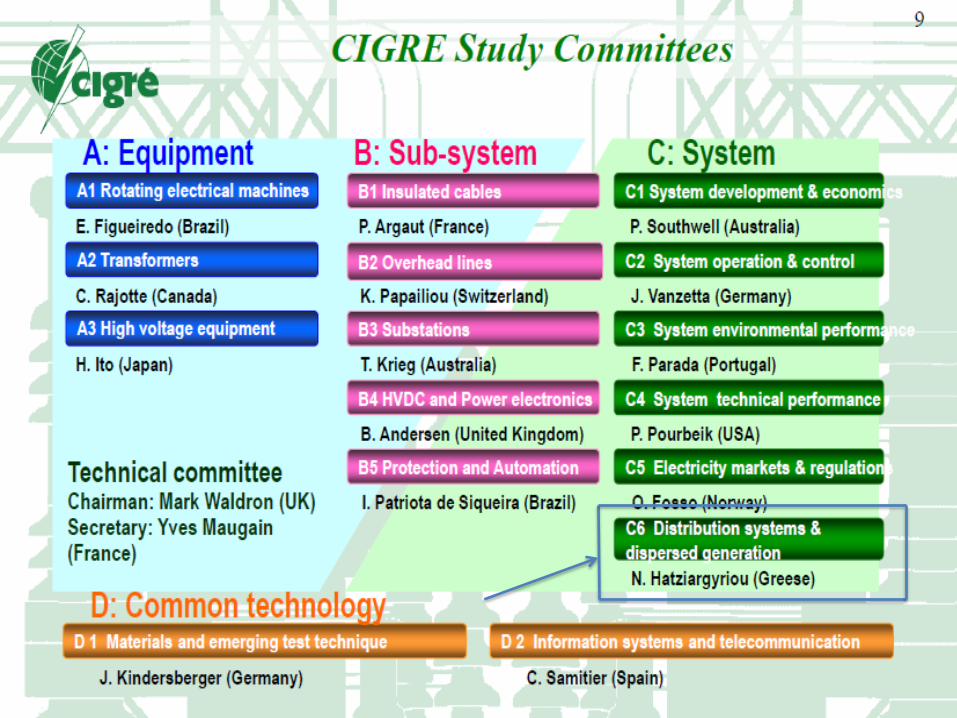
CIGRE’s technical activities are split into 16 fields, each under the responsibility of a Study Committee coordinating the activities in each field. Approximately 200 Working Groups are constantly operating, grouping together over 2000 experts within the electric energy sector from all over the world, who are ideally
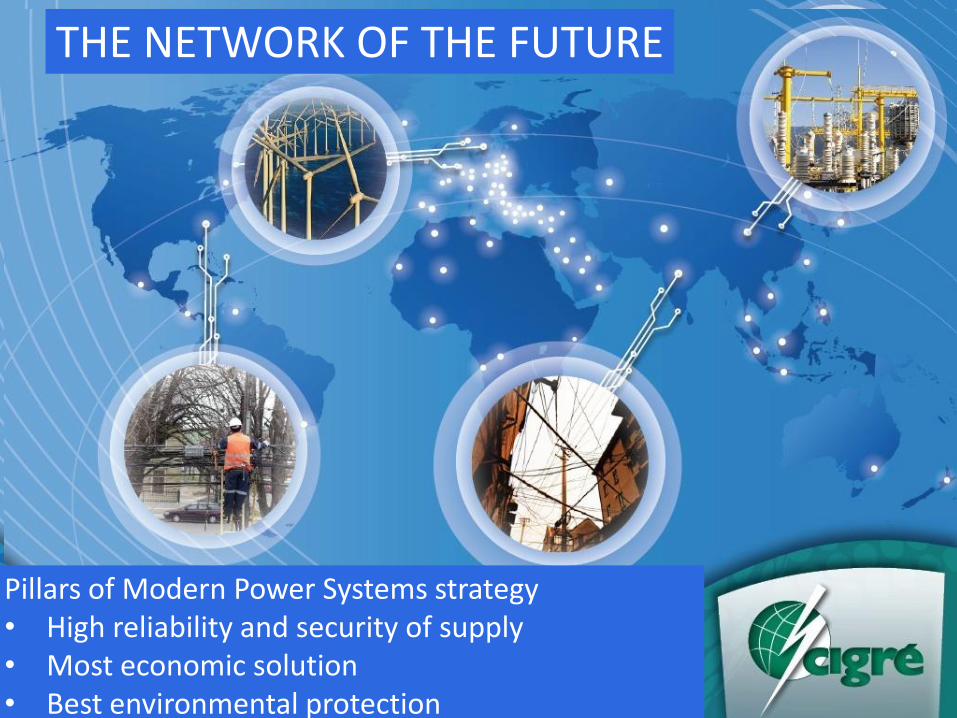
Pillars of Modern Power Systems strategy • High reliability and security of supply • Most economic solution • Best environmental protection
THE NETWORK OF THE FUTURE

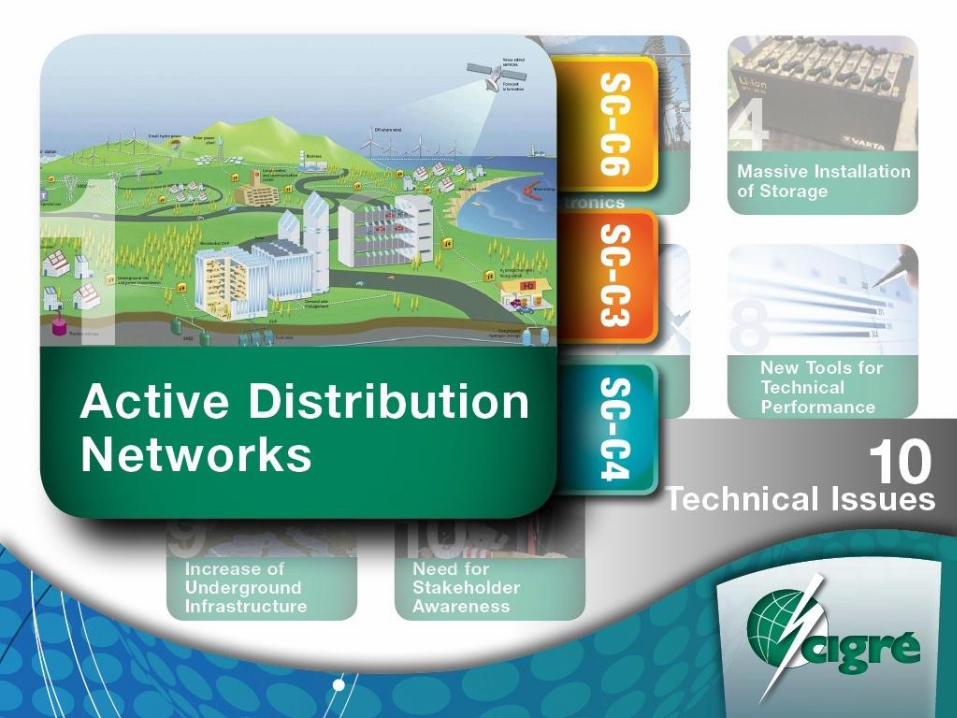

Key Challenges • Distribution level needs more
‘smartness’.
• Massive penetration of
smaller units imposes the
need for their control and
coordination.
• Coordination of millions of
small resources poses huge
technical challenge, requires
application of decentralized,
intelligent control techniques.
• Smart metering massive
implementation.
• Novel distribution network
architectures Microgrids and
Virtual Power Plants

Source: Peter Birkner, “Subgroup on Smart Grids”, www.ec.europa.eu/energy
Network of the future
Backbone – Information - Player
Areas currently covered by CIGRE SC C6

SC Chairman Nikos Hatziargyriou
Secretary Christine Schwaegerl
AG C6-01 Strategic Planning Nikos
Hatziargyriou
AG C6-12 Tutorials Trevor
Gaunt
AG C6-17 Rural Electrification Adriaan Zomers
AG C6-23 Terminology Alex
Baitch
WG C6.11 Develop. & operation of active distribution networks D’Adamo
WG C6.15 Electric Energy Storage Systems Zbigniew Styczynski
WG C6.16 Technologies employed in rural electrification Trevor Gaunt
JWG C1/C2/C6.18 Coping with limits for very high penetrations of RE Wil Kling
WG C6.19 Planning & optimization for active distribution systems Fabr. Pilo
WG C6.20 Integration of electric vehicles Joao Pecas Lopes
WG C6.21 Smart Metering Eduardo Navarro
WG C6.22 Microgrids Evolution Roadmap Chris Marnay
SC C6 Organisation
Nikos Hatziargyriou, 2010
JWG C3.05/C6.14 Environmental impact of DG, Liaison Erkki Lakervi
WG C6.09 Demand Side response Alex Baitch
DER Connection and Integration
WG C6.24 Capacity of Distribution Feeders for Hosting DER, St. Papathanassiou
WG C6.11
Active Distribution Networks
Completer in 2011
Convener: D’Adamo (Italy)
Scope:
Assessment of network requirements for the operation of DER
Identification of enabling technologies and review the most
relevant features of ADN
Definition of limits/barriers
Evolution in regulatory aspects
WG C6.11 - Active Distribution
Networks (ADN) Definitions
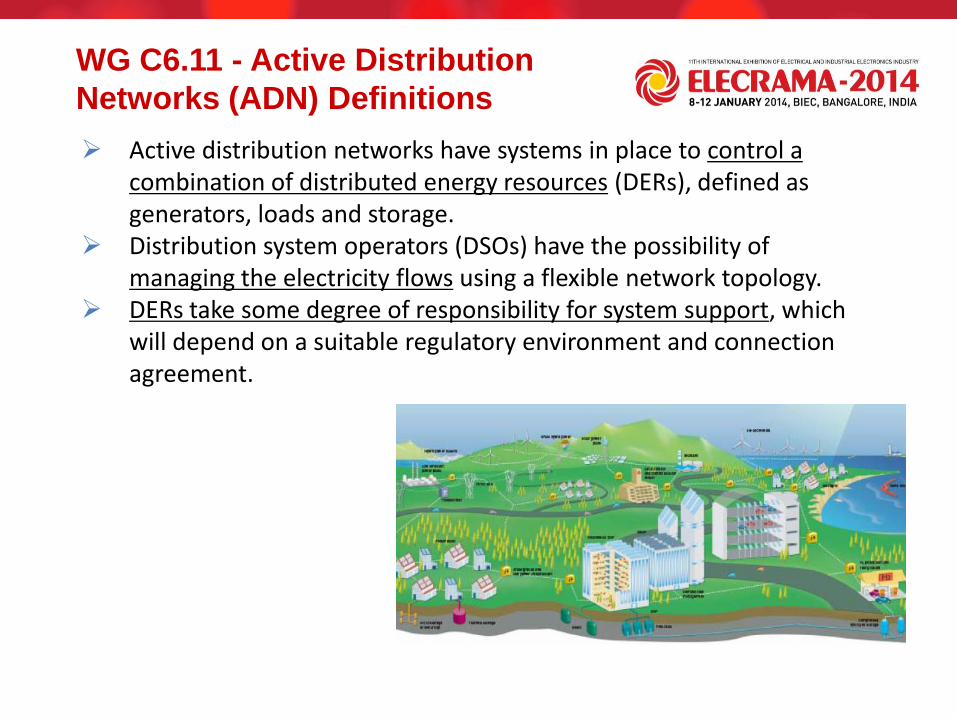
Active distribution networks have systems in place to control a combination of distributed energy resources (DERs), defined as generators, loads and storage.
Distribution system operators (DSOs) have the possibility of managing the electricity flows using a flexible network topology.
DERs take some degree of responsibility for system support, which will depend on a suitable regulatory environment and connection agreement.

WG C6.11- ADN Operation
Operation rules Different regulations
No islanding permitted in most cases
Automatic DG disconnection in case of main network faults
General rule: no worsening of Power Quality (voltage level, fault current, …) admitted
but not clear definition of what Power Quality means (!)
No rules for reactive power
Remote control Only 41% of the interviewed DNO have possibility to remote control the DG at MV
and LV
Limited capability to manage the “active grid”
No operational procedures in case of fault

Intentional islanding Very limited intentional islanding in performed
22% of DNO may perform DG intentional islanding, mainly in self-generation customers
14% of DNO may perform intentional islanding only in emergency cases
Concerns for safety of network operators
Voltage control Voltage variations admitted according to National or International Standards
No “active” voltage control performed
Adjustable setting of tap changer of MV/LV transformers
Fault clearing procedures 60% of DNO don’t have dedicated fault clearing procedures for feeders with DG
(same as without DG)
WG C6.11- ADN Operation
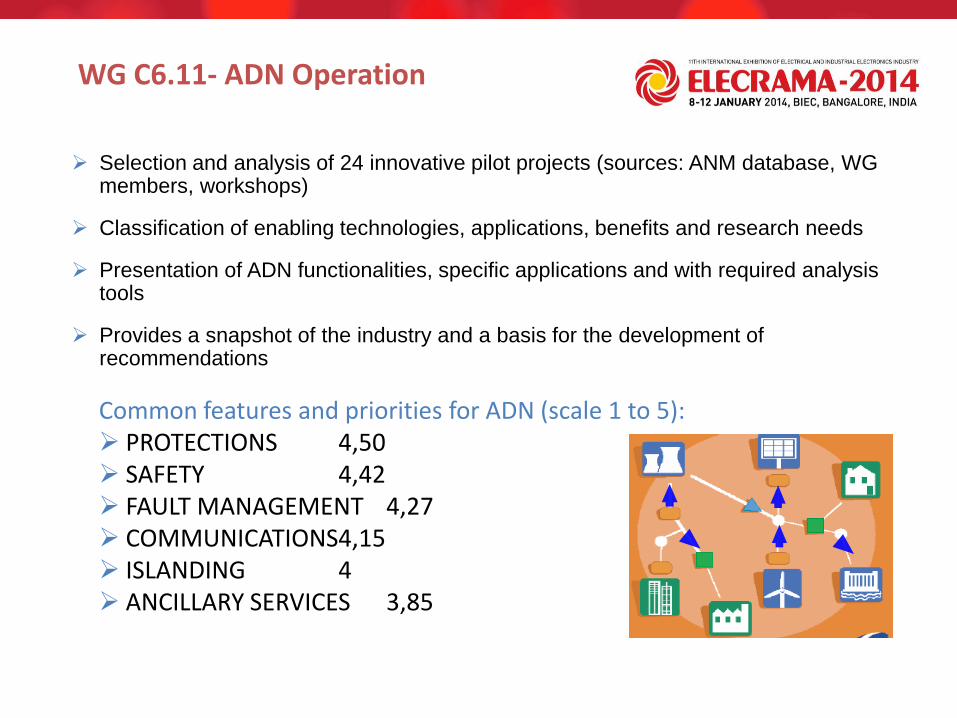
Selection and analysis of 24 innovative pilot projects (sources: ANM database, WG members, workshops)
Classification of enabling technologies, applications, benefits and research needs
Presentation of ADN functionalities, specific applications and with required analysis tools
Provides a snapshot of the industry and a basis for the development of recommendations
Common features and priorities for ADN (scale 1 to 5): PROTECTIONS 4,50 SAFETY 4,42 FAULT MANAGEMENT 4,27 COMMUNICATIONS4,15 ISLANDING 4 ANCILLARY SERVICES 3,85
WG C6.11- ADN Operation
WG C6.11 Key Recommendations
Grid operation Review protection systems and safety measured in the
context of ADNs
Grid codes should be updated to reflect the fact that DER owners need to share responsibility with DNOs for the application of ADN
Communication systems to support data exchange for ADNs should integrate industry standards
Put mechanisms in place for grid users to provide ancillary services and receive remuneration for this service
WG C6.15
Electric Energy Storage Systems
Completed in 2010
Convener: Zbigniew A. Styczynski (Germany)
Scope:
The aim of the WG was to evaluate different storage
technologies and their commercial backgrounds, therefore
great emphasis was given to the integration and support of
power networks which have a high penetration of dispersed
generation (DG) and renewable based generation (RES).
Membership N° of full members:26 N° of involved countries:16

17
European Scenario for Renewables
6 12 18 24
SET – Plan for Europe – 2020 – 635 GW in RG+CHP
h
100
25
50
75
P, % Pump storage Pump load
conventional generation
Medium generation from CHPs and renewable
generation 50 %
Maximal generation from CHPs and renewable generation
Pump storage Pump load
100
25
50
75
-25 conventional
generation
Generation CHPs and RG Load management Storage
P, %
6 12 18 24 h
The overflow of renewable & CHP generation power during
low load condition has to be managed in future!
2020 high load condition 2020 low load condition
GEN surplus
CIGRE Canada 2012
18
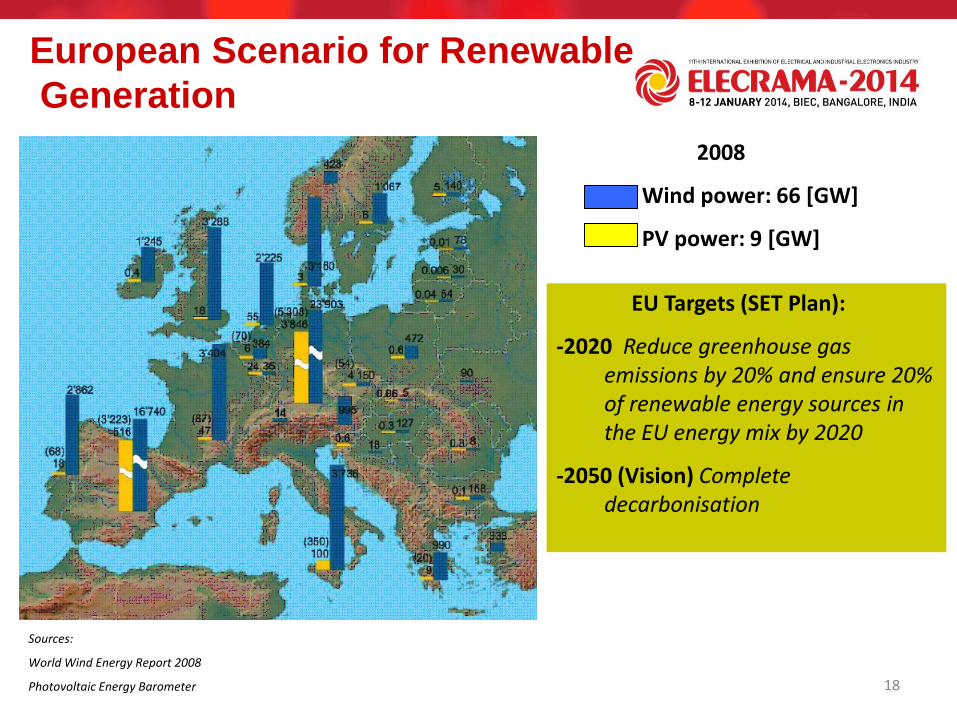
2008
Wind power: 66 [GW]
PV power: 9 [GW]
European Scenario for Renewable
Generation
Sources:
World Wind Energy Report 2008
Photovoltaic Energy Barometer
EU Targets (SET Plan):
-2020 Reduce greenhouse gas emissions by 20% and ensure 20% of renewable energy sources in the EU energy mix by 2020
-2050 (Vision) Complete decarbonisation
CIGRE Canada 2012

19
Overview of Storage Technologies
Source: Electricitystorage.org: “Technologies and applications”. 2003
CIGRE Canada 2012
20
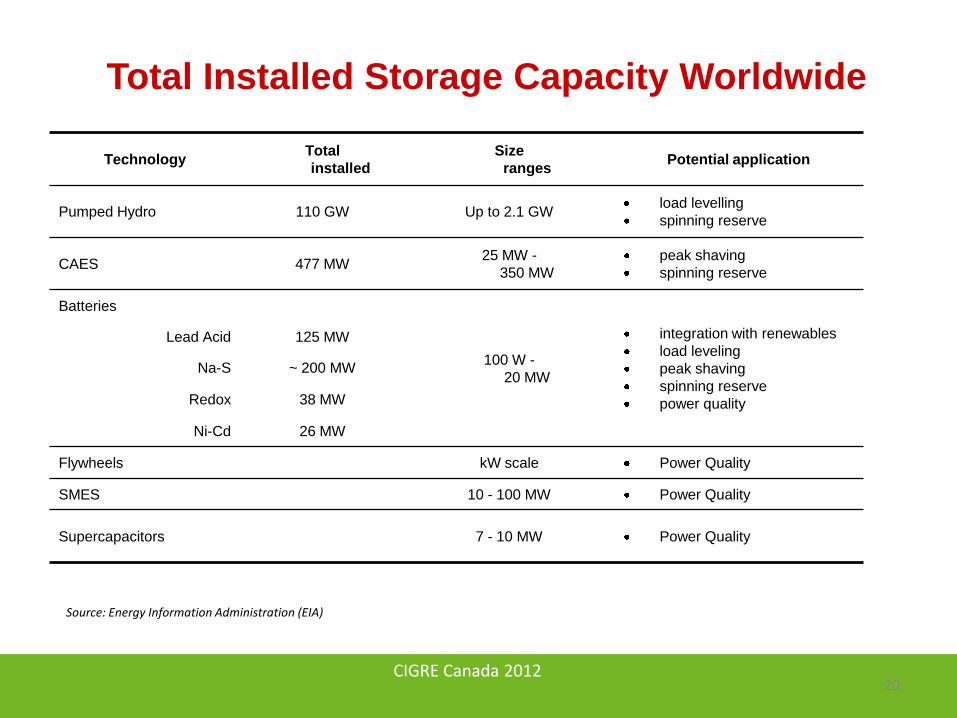
Total Installed Storage Capacity Worldwide
Technology Total
installed
Size
ranges Potential application
Pumped Hydro 110 GW Up to 2.1 GW load levelling
spinning reserve
CAES 477 MW 25 MW -
350 MW
peak shaving
spinning reserve
Batteries
100 W -
20 MW
integration with renewables
load leveling
peak shaving
spinning reserve
power quality
Lead Acid 125 MW
Na-S ~ 200 MW
Redox 38 MW
Ni-Cd 26 MW
Flywheels kW scale Power Quality
SMES 10 - 100 MW Power Quality
Supercapacitors 7 - 10 MW Power Quality
Source: Energy Information Administration (EIA)
CIGRE Canada 2012
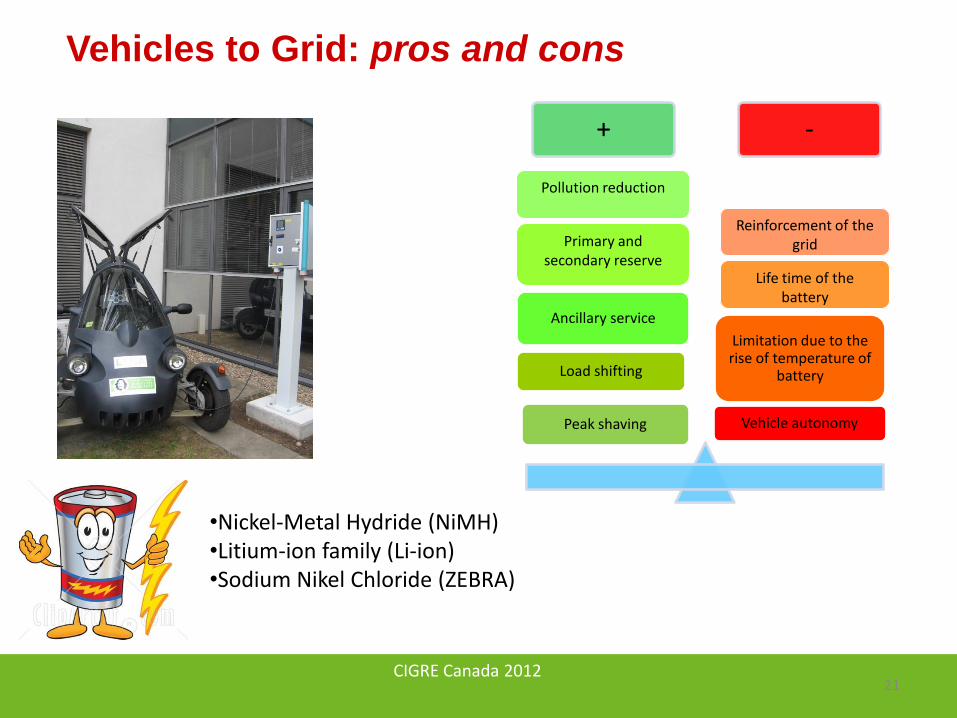
Vehicles to Grid: pros and cons
21
+ -
Vehicle autonomy
Limitation due to the rise of temperature of
battery
Ancillary service
Peak shaving
Load shifting
•Nickel-Metal Hydride (NiMH) •Litium-ion family (Li-ion) •Sodium Nikel Chloride (ZEBRA)
Primary and secondary reserve
Pollution reduction
Life time of the battery
Reinforcement of the grid
CIGRE Canada 2012
22
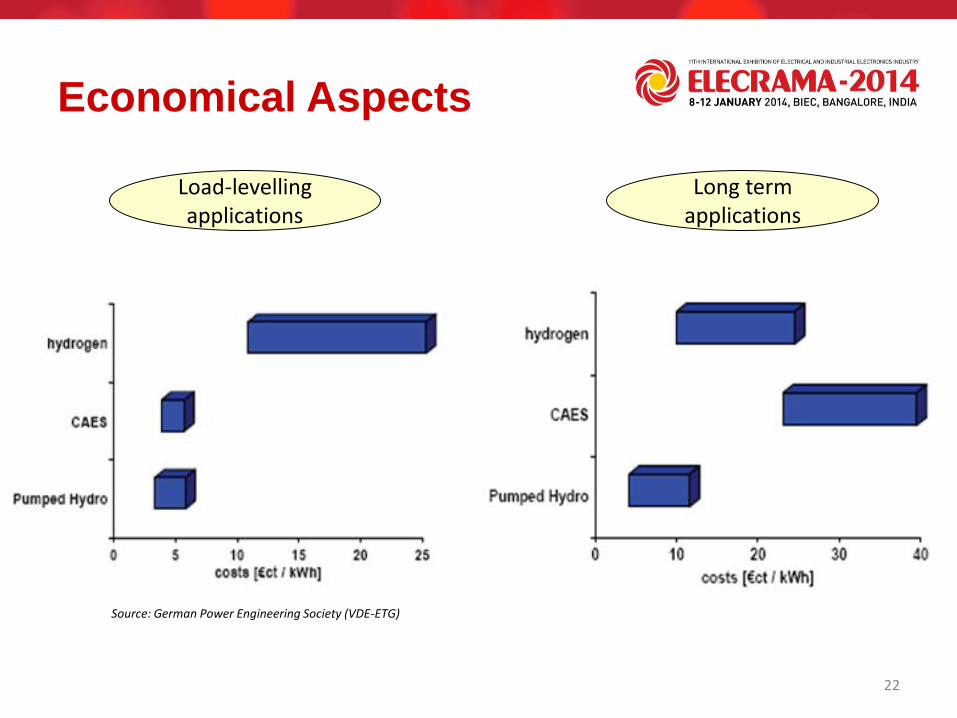
Economical Aspects
Load-levelling applications
Long term applications
Source: German Power Engineering Society (VDE-ETG)
CIGRE Canada 2012
23
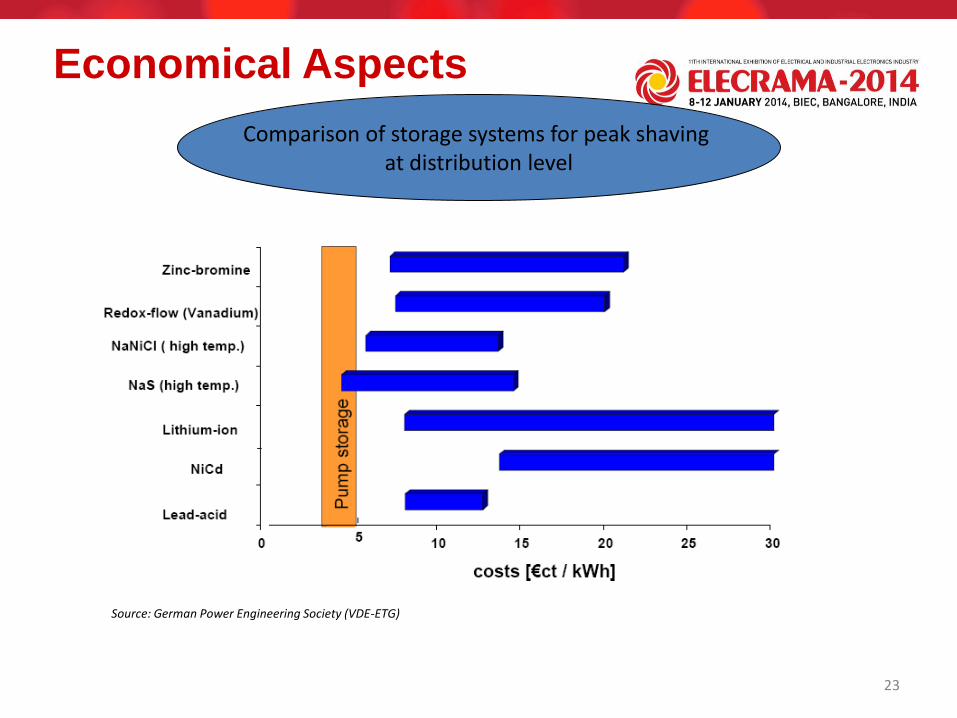
Economical Aspects
Comparison of storage systems for peak shaving at distribution level
Source: German Power Engineering Society (VDE-ETG)
CIGRE Canada 2012

24
Pilot installation: Rokkasho, Japan
Wind farm combined with NaS battery
-Wind farm: 51 [MW]
-NaS battery power: 34 [MW]
-NaS battery capacity 238 [MWh]
-Life time expected: up to 15 years, 300 cycles per year
Source: NGK
CIGRE Canada 2012

25
Pilot installation: Wakkanai, Japan
Photovoltaic plant combined with NaS battery -Photovoltaic plant: 5 [MW] -NaS battery power: 1.5 [MW] -Nas Capacity:13.5 [MWh]
Source: NEDO
CIGRE Canada 2012

WG C6.20: Integration of EVs in
Electric Power Systems
EV aggregator providing
with home connected EV
• Key Drivers: Social behavior of EV drivers, CO2 emissions, RES integration • EV deployment scenarios and business models • Identification of management and control solutions to accommodate large scale deployment
of EV taking into account drivers interaction • System impacts resulting from the presence of EV • Standardization of technologies and technical requirements • The effects of EV into electricity markets and the need for regulatory and support
mechanisms
CHAdeMO Connector
PLAYERSCONTROL HIERARCHY
DMS
CAMC
CVC
MGCC
Control
Level 3
VC
RAU
MGAU
TSO
GENCO
DSO
Control
Level 1
Control
Level 2
Suppplier/AggregatorDis
trib
uti
on
Sy
ste
m
Transmission System
Generation System
Ele
ctr
icity M
ark
et
Op
era
tors
Technical Operation Market Operation
Electric Energy
Electric Energy
Technical Validation of the Market Negotiation (for the transmission system)
Electric Energy
Reserves
Reserves
Parking Parking Battery
Replacement
Battery
Replacement
EV
Owner/Electricity
consumer
Parking
Facilities
Battery
Suppliers
Electricity
Supplier
Electricity
Consumer
Electric Energy
Controls (in normal system operation) At the level of
Communicates with
Sell offer
Buy offer
Technical validation of the market results
Controls (in abnormal system operation/emergency mode)
Reserves 0
20
40
60
80
100
120
140
160
Monday Tuesday Wednesday Thursday Friday Saturday Sunday
Po
we
r (M
W)
Dumb Charging (25% EV) Without EV
0
20
40
60
80
100
120
140
160
Monday Tuesday Wednesday Thursday Friday Saturday Sunday
Po
we
r (M
W)
Multiple Tariff (35% EV) Without EV
0
20
40
60
80
100
120
140
160
Monday Tuesday Wednesday Thursday Friday Saturday Sunday
Po
we
r (M
W)
Smart Charging (57% EV) Without EV
Load profiles with different EV
charging strategies
Technical management and market operation
framework for EV integration
Convener: Joao Abel Pecas Lopes (Portugal) Completed in 2013
• Sustainability and environmental awareness, • Economic and policy aspects, • Consumer/driver acceptance, • Evolution of technologies and concepts.
Key Drivers for Electric Mobility
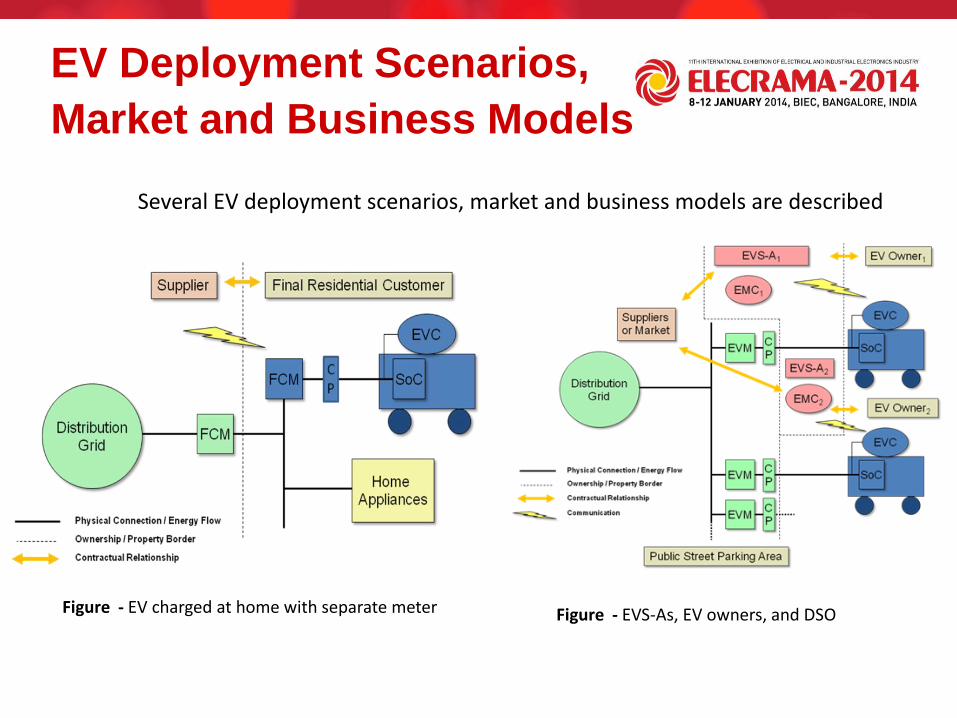
Figure - EV charged at home with separate meter Figure - EVS-As, EV owners, and DSO
Several EV deployment scenarios, market and business models are described
EV Deployment Scenarios,
Market and Business Models

Figure - EV home charge under EVS-A management Figure - CPM as commercial or office building with integrated energy management
EV Deployment Scenarios,
Market and Business Models
:
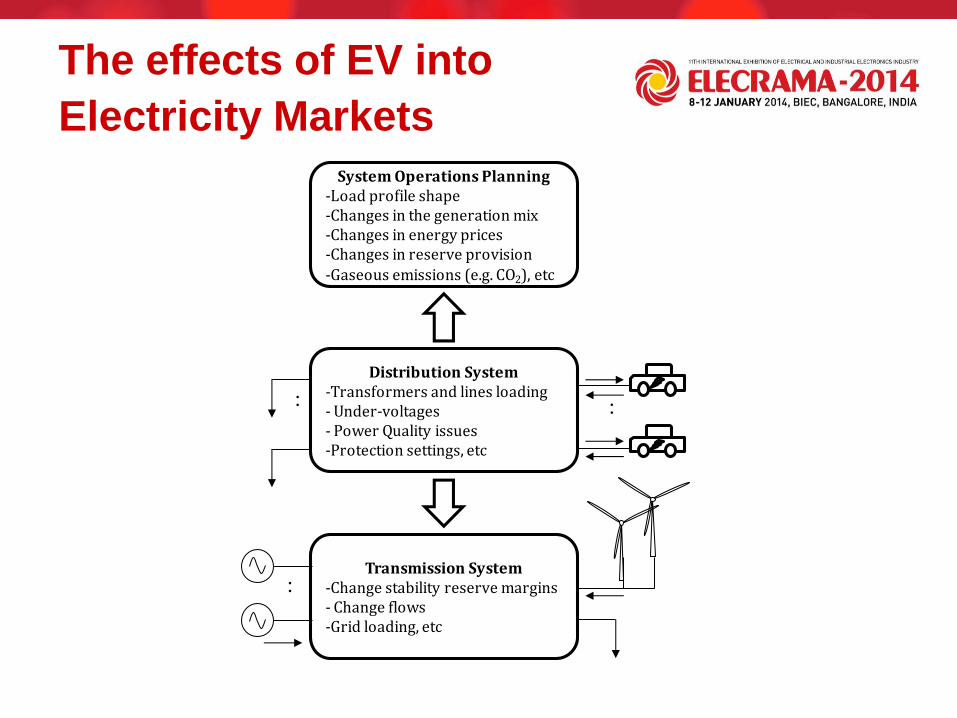
Distribution System-Transformers and lines loading- Under-voltages- Power Quality issues-Protection settings, etc
System Operations Planning-Load profile shape-Changes in the generation mix-Changes in energy prices-Changes in reserve provision-Gaseous emissions (e.g. CO2), etc
Transmission System-Change stability reserve margins- Change flows-Grid loading, etc
:
:
The effects of EV into
Electricity Markets
2 4 6 8 10 12 14 16 18 20 22 24
1
2
3
4
5
6
7
8x 10
4
time, hrs
MW
peaking units
nuclear generation
hydro and RES
thermal generation
system demand
system demand + EVs
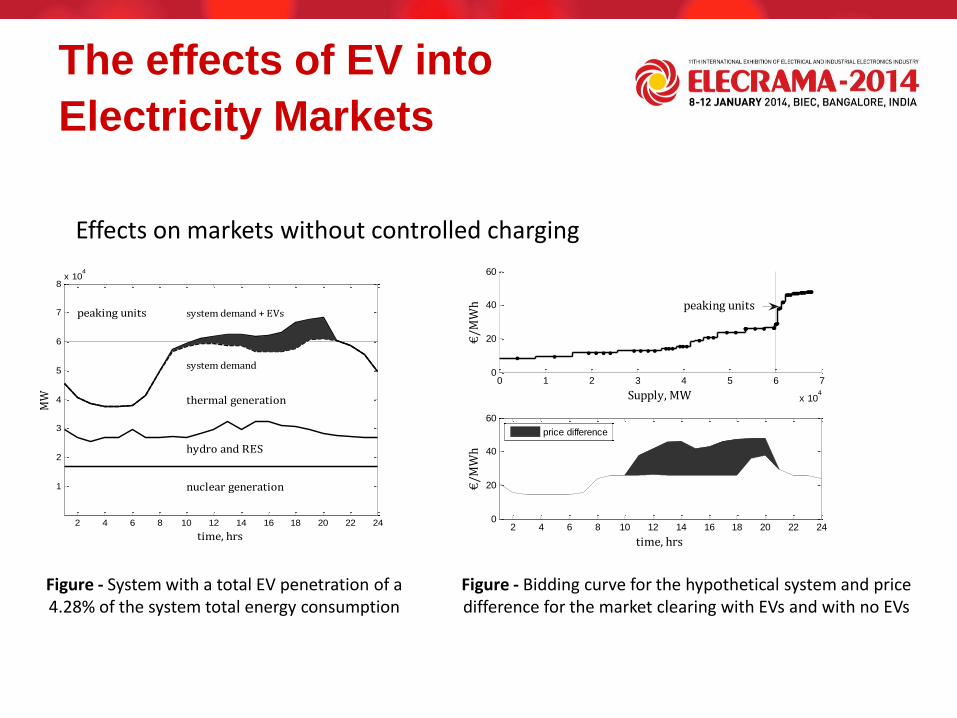
Figure - System with a total EV penetration of a 4.28% of the system total energy consumption
0 1 2 3 4 5 6 7
x 104
0
20
40
60
Supply, MW
€/M
Wh peaking units
2 4 6 8 10 12 14 16 18 20 22 240
20
40
60
time, hrs
€/M
Wh
price difference
Figure - Bidding curve for the hypothetical system and price difference for the market clearing with EVs and with no EVs
Effects on markets without controlled charging
The effects of EV into
Electricity Markets
User EV
Supplier/A
ggregator
‘I will want to drive 25 km starting at 09:00’
‘I want confirmation of the state of charge/range
in my car’ ‘I’ve changed my plans
and I want to drive 12km starting as soon as
possible’ ‘Which car is connected?’
‘What charge/discharge profile should I use?’
‘Who do I bill?’
‘How much should I add to their bill?’
‘What charge points are available?’
‘What is the charge demand?'
‘My maximum charge/discharge rate is
17kW’ ‘My battery energy is
currently 6kWh’
Distribution System Operator
'Is the grid operating properly?'
'Is the intended change in load decided by
supplier/aggregator safe for grid operation?'
Charging Point
1 2
3
4
5
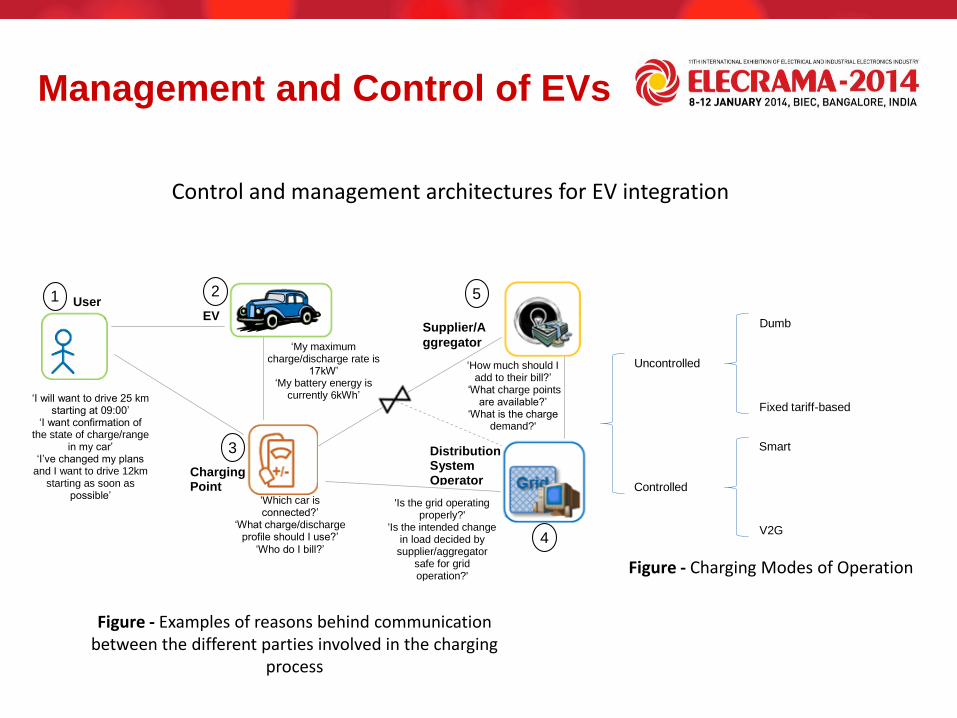
Figure - Examples of reasons behind communication between the different parties involved in the charging
process
Uncontrolled
Controlled
Dumb
Smart
V2G
Fixed tariff-based
Figure - Charging Modes of Operation
Control and management architectures for EV integration
Management and Control of EVs

Regional Aggregation Unit
Microgrid Aggregation Unit
Microgrid Aggregation Unit
CVC
CVC
CVC
Microgrid Aggregation Unit
MV Level
LV Level
Smart Meter
VC
Smart Meter
VC
Smart Meter
VC
Smart Meter
VC
Smart Meter
VC
Smart Meter
VC
EV Owner
EV Owner
EV Owner
EV Owner
EV Owner
EV Owner
SU
PP
LIE
R/A
GG
RE
GA
TO
R
Regional Aggregation Unit
Microgrid Aggregation Unit
Microgrid Aggregation Unit
CVC
CVC
CVC
Microgrid Aggregation Unit
MV Level
LV Level
Smart Meter
VC
Smart Meter
VC
Smart Meter
VC
Smart Meter
VC
Smart Meter
VC
Smart Meter
VC
EV Owner
EV Owner
EV Owner
EV Owner
EV Owner
EV Owner
Figure - EVS/A hierarchical management structure
Aggregating agents interfacingt EVs with the markets and DSOs
Management and Control of EVs
0
20
40
60
80
100
120
140
160
Monday Tuesday Wednesday Thursday Friday Saturday Sunday
Po
we
r (M
W)
Dumb Charging (25% EV) Without EV
0
20
40
60
80
100
120
140
160
Monday Tuesday Wednesday Thursday Friday Saturday Sunday
Po
we
r (M
W)
Multiple Tariff (35% EV) Without EV
0
20
40
60
80
100
120
140
160
Monday Tuesday Wednesday Thursday Friday Saturday Sunday
Po
we
r (M
W)
Smart Charging (57% EV) Without EV
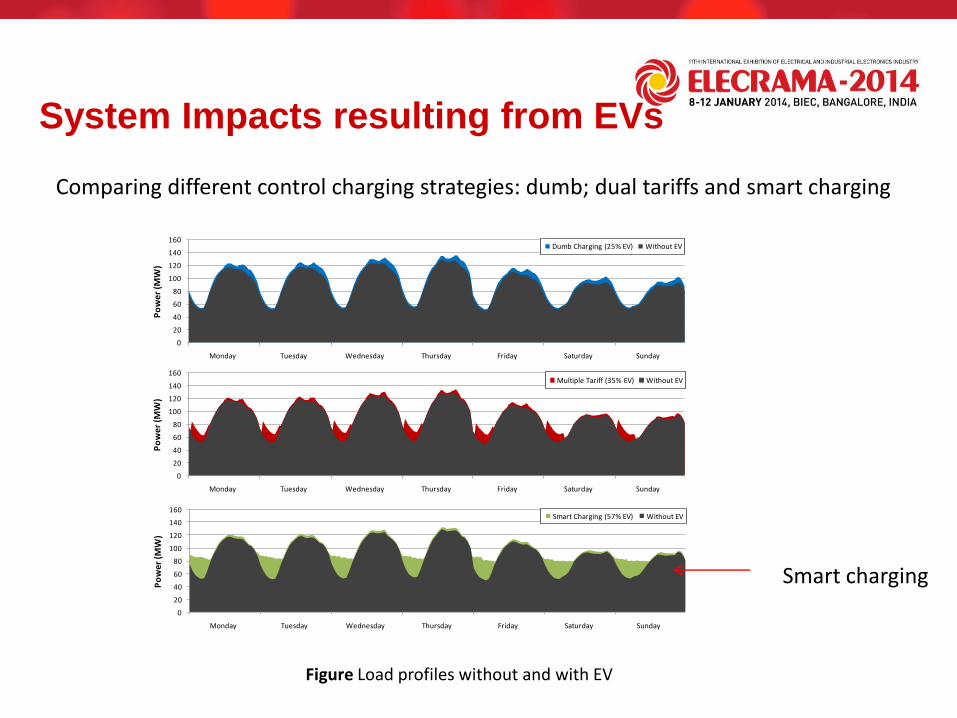
Figure Load profiles without and with EV
Comparing different control charging strategies: dumb; dual tariffs and smart charging
Smart charging
System Impacts resulting from EVs

Figure - Frequency in the Spanish control area for the scenario with extra wind power
Figure - Interconnection power from Spain to Portugal for the scenario with extra wind power
Participation of EVs of the AGC and on the Dynamic behaviour of the system
System Impacts resulting from EVs

Figure Samples of Installed Fast Charge Points
• Standards and technologies for slow and fast charging • Charging methods and communication protocols • Reference and description of on-going projects
Standardization of Technologies
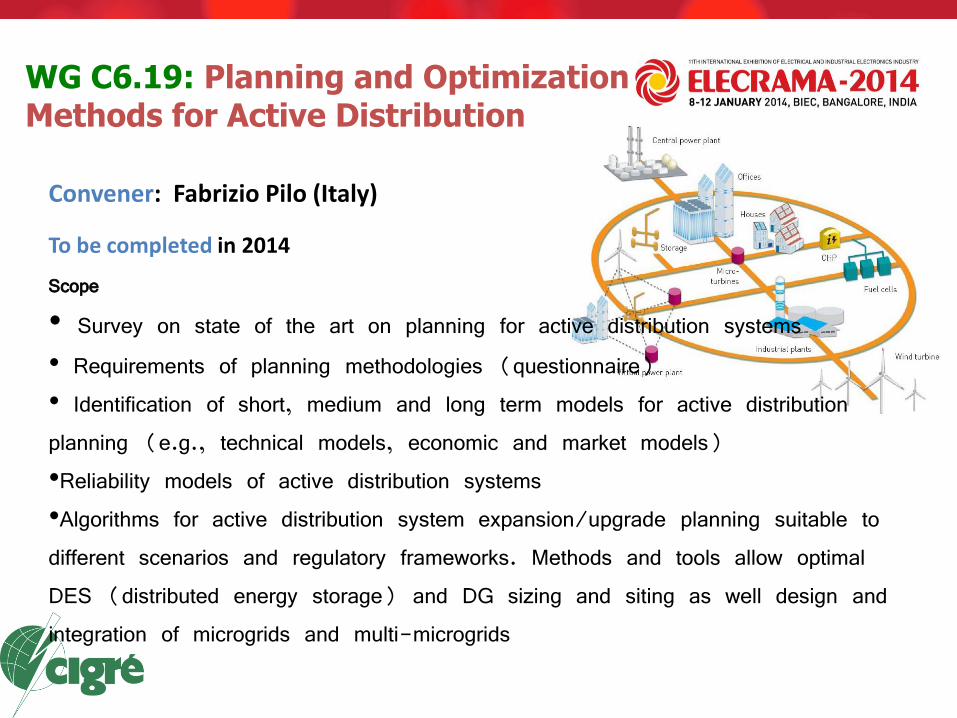
WG C6.19: Planning and Optimization Methods for Active Distribution
Convener: Fabrizio Pilo (Italy)
Scope
• Survey on state of the art on planning for active distribution systems • Requirements of planning methodologies (questionnaire) • Identification of short, medium and long term models for active distribution planning (e.g., technical models, economic and market models) •Reliability models of active distribution systems •Algorithms for active distribution system expansion/upgrade planning suitable to different scenarios and regulatory frameworks. Methods and tools allow optimal DES (distributed energy storage) and DG sizing and siting as well design and integration of microgrids and multi-microgrids
To be completed in 2014
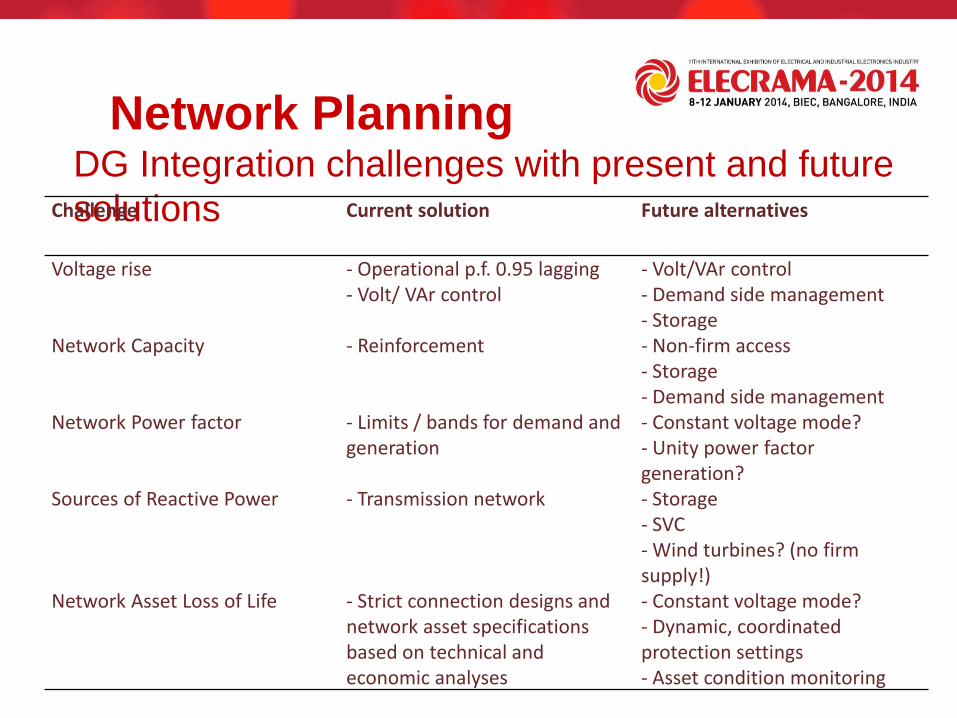
Network Planning DG Integration challenges with present and future
solutions
Challenge Current solution Future alternatives
Voltage rise - Operational p.f. 0.95 lagging - Volt/ VAr control
- Volt/VAr control - Demand side management - Storage
Network Capacity - Reinforcement - Non-firm access - Storage - Demand side management
Network Power factor - Limits / bands for demand and generation
- Constant voltage mode? - Unity power factor generation?
Sources of Reactive Power - Transmission network - Storage - SVC - Wind turbines? (no firm supply!)
Network Asset Loss of Life - Strict connection designs and network asset specifications based on technical and economic analyses
- Constant voltage mode? - Dynamic, coordinated protection settings - Asset condition monitoring
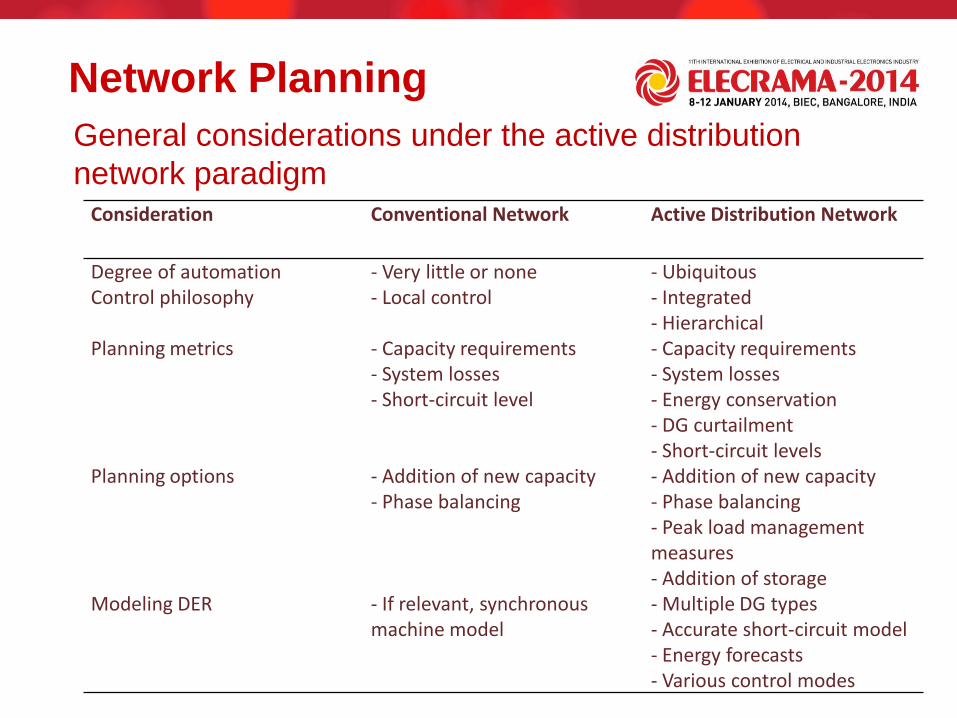
Network Planning
General considerations under the active distribution
network paradigm
Consideration Conventional Network Active Distribution Network
Degree of automation - Very little or none - Ubiquitous Control philosophy - Local control - Integrated
- Hierarchical Planning metrics - Capacity requirements
- System losses - Short-circuit level
- Capacity requirements - System losses - Energy conservation - DG curtailment - Short-circuit levels
Planning options - Addition of new capacity - Phase balancing
- Addition of new capacity - Phase balancing - Peak load management measures - Addition of storage
Modeling DER - If relevant, synchronous machine model
- Multiple DG types - Accurate short-circuit model - Energy forecasts - Various control modes
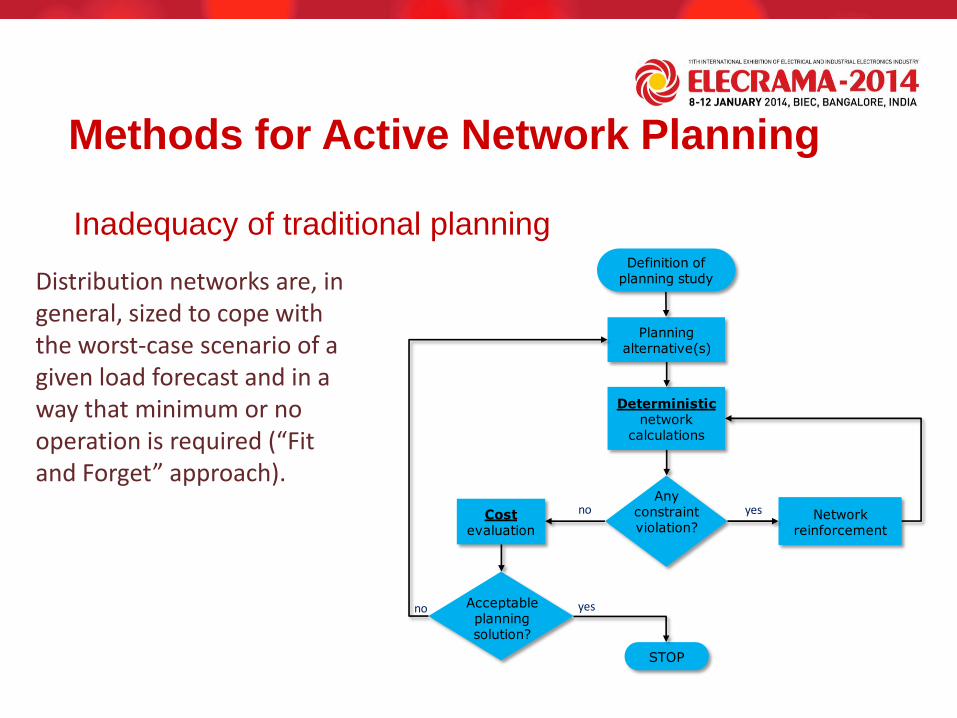
Methods for Active Network Planning Inadequacy of traditional planning
Planning alternative(s)
Deterministicnetwork
calculations
Costevaluation
Anyconstraint violation?
Network reinforcement
Acceptableplanningsolution?
STOP
yes
yes
no
no
Definition of planning studyDistribution networks are, in
general, sized to cope with the worst-case scenario of a given load forecast and in a way that minimum or no operation is required (“Fit and Forget” approach).

Methods for Active Network Planning Incorporating operational aspects into planning
Technical Issue BAU Distribution Network Active Distribution Network
Voltage rise/drop
Limits/bands for demand and generation connection/operation Generation tripping Capacitor banks
Coordinated volt-var control Static var compensators Coordinated dispatch of DER On-line reconfiguration
Hosting Capacity Network reinforcement (e.g., lines/transformers)
Coordinated dispatch of DER On-line reconfiguration
Reactive Power Support
Dependency on transmission network Capacitor banks Limits/bands for demand and generation connection/operation
Coordinated volt-var control Static var compensators Coordinated reactive power dispatch of DER
Protection
Adjustment of protection settings New protection elements Limits for generation connection Fault ride through specifications for generation
On-line reconfiguration Dynamic protection settings
Ageing Strict network designs specifications based on technical and economic analyses
Asset condition monitoring

Methods for Active Network Planning Challenges (incorporating operational aspects into
planning)
1. To what extent do operational aspects need to be modelled in planning?
2. To what extent are sophisticated tools needed?
3. How can uncertainties be dealt with?
4. How can ICT infrastructure be cost-effectively planned for the long term?
5. How should the huge amount of data in ADNs/Smart Grids be handled?
6. How can the business case for ADNs be correctly assessed?

Reliability of Active Networks
General
• While the evolution of distribution reliability tools has accelerated significantly in the recent years, most of the focus in these tools has been on peak loading capacity.
• While there are now many powerful reliability analysis tools presently being supplied to the utility industry, deficiencies and difficulties in perform reliability analyses remain.
• Further advancement in models, methods, and metrics will be required to assess reliability active distribution network implementations.

Reliability of Active Networks
Reliability Indices
• Standard reliability indices for sustained interruptions, e.g., SAIFI, SAIDI, CAIDI, CTAIDI, CAIFI.
• Other indices, e.g., ASAI, ASIFI, ASIDI,
• Indices for momentary interruptions, e.g., MAIFI, MAIFIE, CEMSMIn
• Power quality indices, e.g., SARFIx.
Reliability of Active Networks
Need for new Reliability Indices
• Active distribution networks will warrant the development of additional indices that reflect new assets and resources as well as changing system operations.
• One such example is distributed generation (DG). Since the reliability indices are average annual values and normalized by large numbers such as number of customers, they are frequently too coarse to quantify the benefit of DG that might improve the reliability for only a small segment of the system.
• Additionally, indicators of curtailment and demand response will have to be developed to account for inconvenience to the end user including extraneous factors such as ambient temperature.
• Identification of communication infrastructure reliability indices and measurable cyber security parameters will also another area to be
Reliability of Active Networks
Issues with Reliability Analysis Tools • Commercially-available reliability analysis tools are designed to
address the problems the customers of each software vendor are presently experiencing. This results in tools that are often too inflexible to be adapted to other problems.
• Many utilities are purchasing the reliability analysis modules available in distribution system analysis tools, but finding it difficult to put them into practice. It is not entirely clear why this is happening, but the likely reasons stem from insufficient time for distribution engineers to gather the data to use the tools.
Demand Side Integration Distribution planning methodologies in a
smart grid world :
• how different Demand Side Integration (DSI), Energy Efficiency (EE),
and Time-Of-Use (TOU) rate scenarios will affect system peaks
• DSI = deliberate alteration of electrical energy use
– Load response: the end user agrees to be disconnected (with or without notice, if necessary, upon discount in tariffs).
– Price response: the end user intentionally modify its demand according to its economical purposes

Demand Side Integration Load modeling
With the evolution of the MV distribution network management (Active networks, Smart grids) there is the need to include operational aspects into the planning process:
• Data from Smart Metering will allow a full load profile
• Daily load profiles can and should be used in modern planning
Necessity to describe the instant load value P(t*) with a normal probability density function

• Definitions • Benefits • Functionalities and technologies • Business cases • Roadmap • Annex 1: Demonstration projects • Annex 2: Microgrids use cases • Annex 3: Microgrids definitions and nomenclature
WG C6.22: Microgrid Evolution Roadmap
34 members, experts and correspondents: Europe (13), Americas (11), Australia (2), Asia (7), Africa (1)
Alameda County Santa Rita Jail
12 kV sub-cycle static switch
When a disturbance to the utility grid occurs, the automatic disconnect switch enables the facility to “island” itself from the main utility grid and independently generate and store its own energy.
The CERTS-enabled smart grid supports the seamless integration of additional distributed technologies, including generation, storage, controls and communications.
Energy Storage System:
Lithium Ion 4 MW-hr 2 MW power
The Distributed Energy Resources Management System (DERMS)
1 MW fuel cell
1.2 MW PV
12kV sub-cycle static disconnect switch
Chevron Energy Solutions © 2012 Chevron
Santa Rita Jail Microgrid, California University Zone
Energy CenterEnergy CenterFor this DemoFor this DemoFor this DemoFor this Demo
Jan 15/16 2013 © 2013 NTT FACILITIES, Inc. All rights reserved. 8
Source: Tohoku Fukushi Univ. Web Site
Sendai Microgrid, Japan Mannheim-Wallstad Microgrid, Germany
Labein
Micro
grid Lab
, Spain
Convener: Chris Marnay (USA) , on-going until 2014

Definition of Microgrids
Microgrids are electricity distribution systems containing loads and distributed energy resources, (such as distributed generators, storage devices, or controllable loads) that can be operated in a controlled, coordinated way, either while connected to the main power network and/or while islanded.
EU Microgrids (ENK5-CT-2002-00610) and MOREMICROGRIDS (PL019864)

Economic
Benefits
Environmental
Benefits
Technical
BenefitsPeak Load
Shaving
Local Market
Value
Voltage
Regulation
Energy
Loss
Reduction
Reliability
Enhacement
Aggregation
Platform Value
Network
Hedging Value
GHG Reduction
Consumer
Micro-
SourceDSO
Benefits by Criteria & Recipient
Identification of Microgrid benefits is a
multi-objective and multi-party coordination task
Who will develop a Microgrid?
Who will own or operate it? • Investments in a Microgrid can be done in multiple phases by
different interest groups: DSO, energy supplier, end consumer, IPP (individual power producer), etc.
• The operation of the Microgrid will be mainly determined by the ownership and roles of the various stakeholders. Three general models:
– DSO owns and operates the distribution grid and also fulfils the retailer function of selling electricity to end consumers. (DSO Monopoly)
– ESCO are the actors that maximize the value of the aggregated DG participation in local liberalized energy markets (Liberalized Market)

Technical Challenges
• Use of different generation technologies (prime movers) • Presence of power electronic interfaces • Small size (challenging management) • Relatively large imbalances between load and generation to be
managed (significant load participation required, need for new technologies, review of the boundaries of microgrids)
• Specific network characteristics (strong interaction between active and reactive power, control and market implications)
• Protection and Safety / static switch • Communication requirements
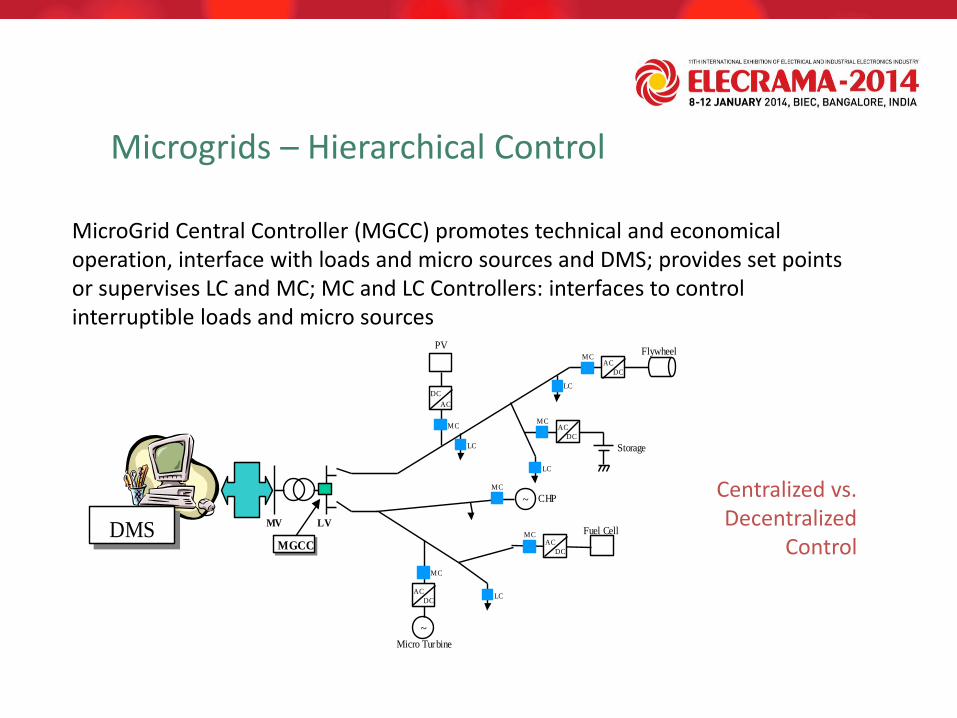
Microgrids – Hierarchical Control
MicroGrid Central Controller (MGCC) promotes technical and economical operation, interface with loads and micro sources and DMS; provides set points or supervises LC and MC; MC and LC Controllers: interfaces to control interruptible loads and micro sources
Centralized vs. Decentralized
Control MV LV
DMSDMSMGCCMGCC
DC
AC
PV
MC
LC
MCAC
DC
LC
Storage
LC
~ CHP
MC
Micro Turbine
MC
Fuel CellMCAC
DC
LCAC
DC
~
FlywheelMC
AC
DC

Centralized & Decentralized Control
The main distinction is where decisions are taken
Centralized Control implies that a Central Processing Unit collects all the measurement and decides next actions.
Decentralized Control implies that advanced controllers are installed at each node forming a distributed control system.
Choice of approach depends on DG ownership, scale, ‘plug and play’, etc.
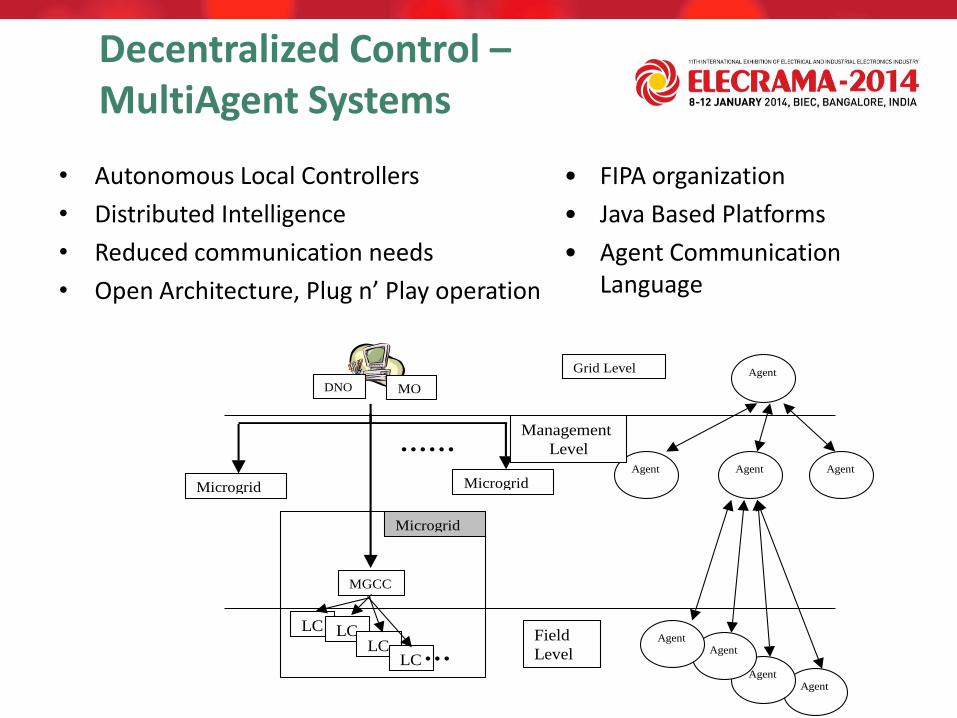
Decentralized Control – MultiAgent Systems
• Autonomous Local Controllers
• Distributed Intelligence
• Reduced communication needs
• Open Architecture, Plug n’ Play operation
Microgrid
A
Microgrid X
......
Microgrid
B
MO
MGCC
LC LC LC
LC ...
DNO
Agent
Agent Agent Agent
Agent Agent
Agent Agent
Grid Level
Management
Level
Field
Level
• FIPA organization
• Java Based Platforms
• Agent Communication Language
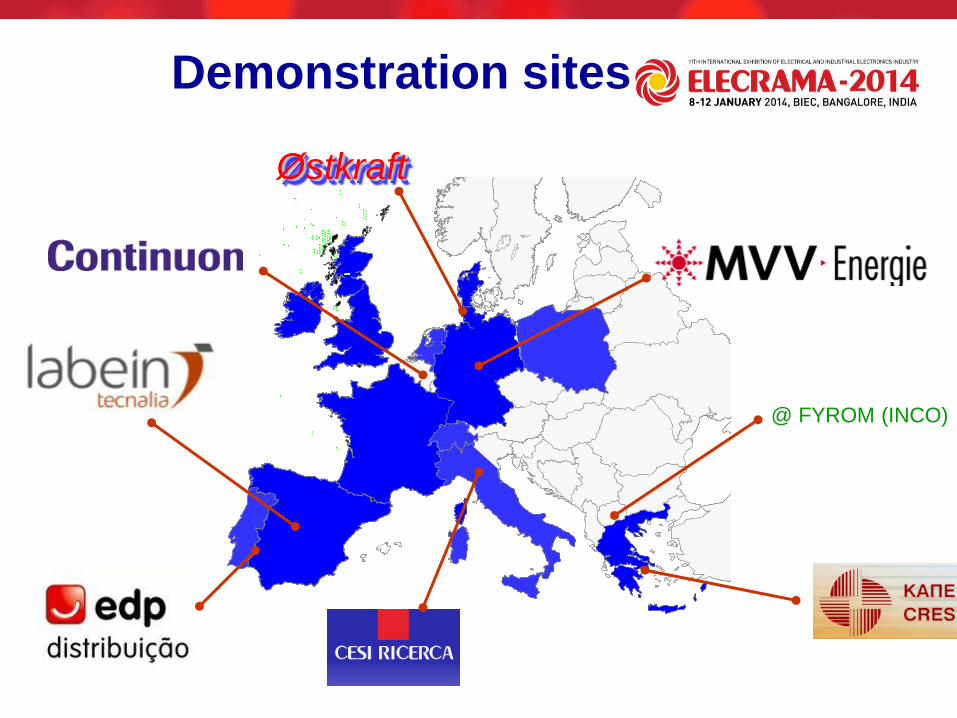
Demonstration sites
57
Østkraft
@ FYROM (INCO)
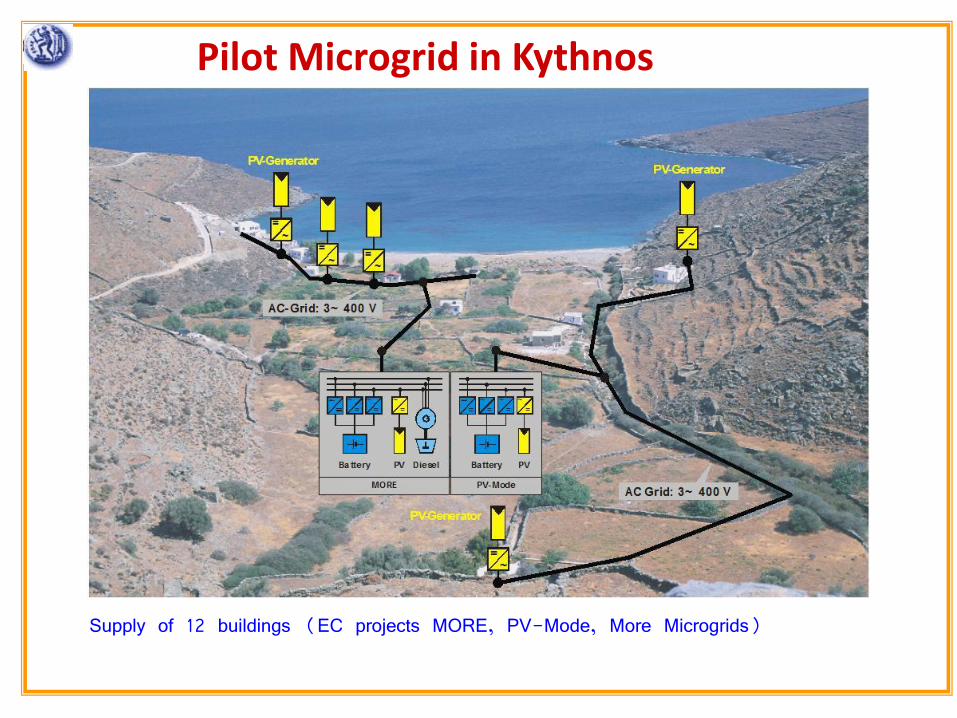
Pilot Microgrid in Kythnos
Supply of 12 buildings (EC projects MORE, PV-Mode, More Microgrids)

WG C6.24: Capacity of Distribution Feeders for Hosting DER
Objectives Study DER penetration potential and technical evaluation practices adopted by
DSOs all over the world
Membership: 32 experts from 19 countries/5 continents
Technical Brochure highlights
• Overview of technical issues limiting DER hosting capacity
• Outline of DSO evaluation
• practices (21 countries)
• Discussion on means
employed by DSOs to
increase hosting capacity
• Case studies
Convener: Stavros Papathanassiou (Greece), completed in 2013
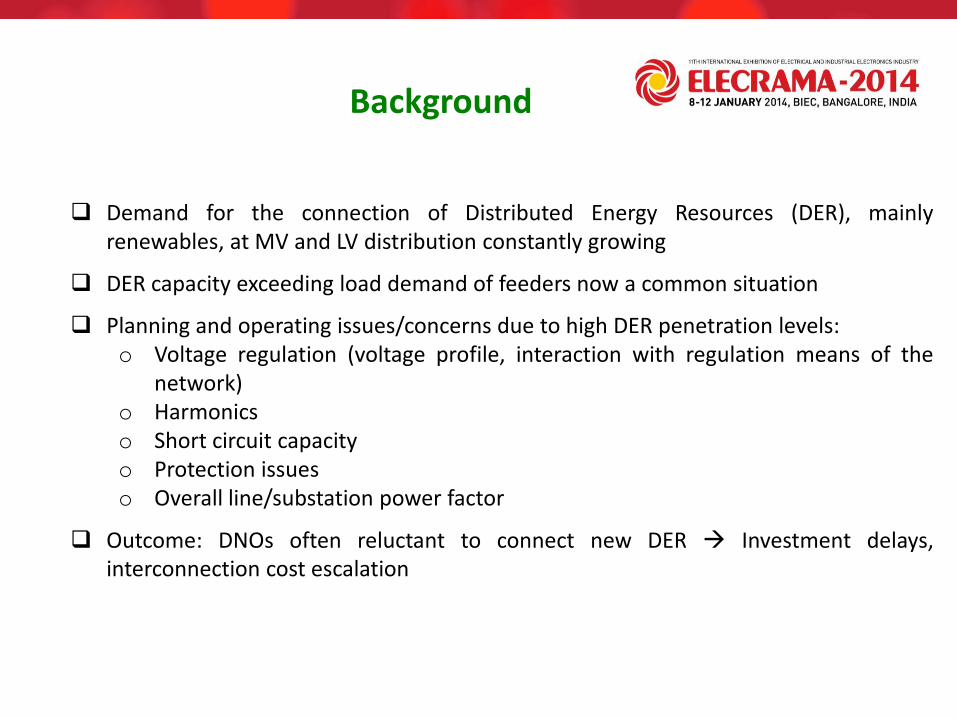
Background
Demand for the connection of Distributed Energy Resources (DER), mainly renewables, at MV and LV distribution constantly growing
DER capacity exceeding load demand of feeders now a common situation
Planning and operating issues/concerns due to high DER penetration levels: o Voltage regulation (voltage profile, interaction with regulation means of the
network) o Harmonics o Short circuit capacity o Protection issues o Overall line/substation power factor
Outcome: DNOs often reluctant to connect new DER Investment delays, interconnection cost escalation
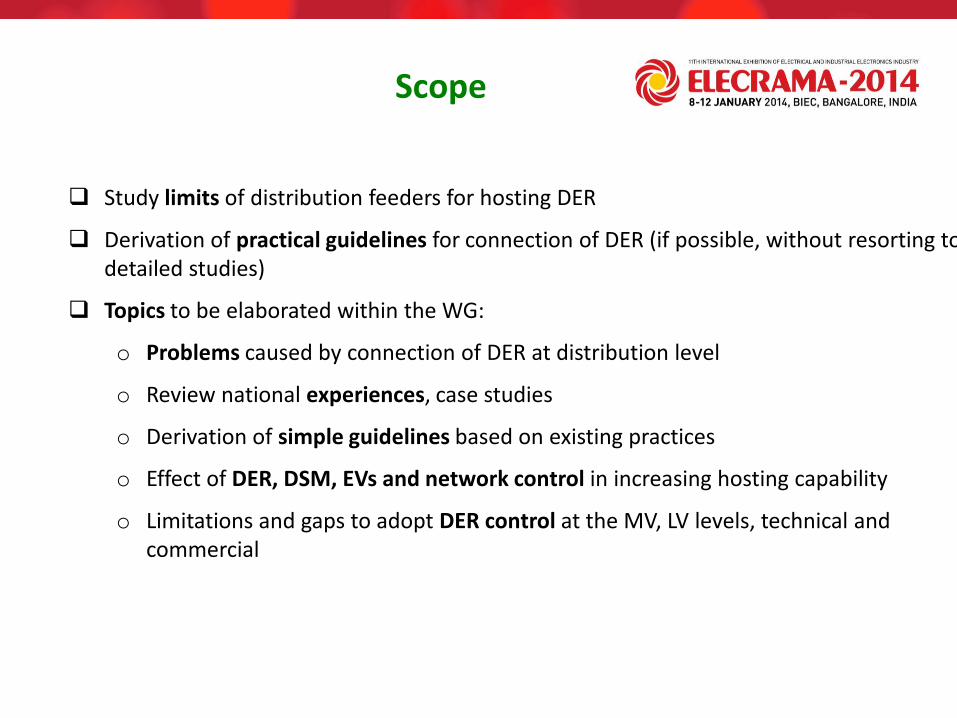
Scope
Study limits of distribution feeders for hosting DER
Derivation of practical guidelines for connection of DER (if possible, without resorting to detailed studies)
Topics to be elaborated within the WG:
o Problems caused by connection of DER at distribution level
o Review national experiences, case studies
o Derivation of simple guidelines based on existing practices
o Effect of DER, DSM, EVs and network control in increasing hosting capability
o Limitations and gaps to adopt DER control at the MV, LV levels, technical and commercial

Thermal ratings (transformers, feeders etc) especially on: Low load – max generation situations - unavailability of network elements (Ν-1
criterion)
Voltage regulation Overvoltage (e.g. minL – maxG situation or/combined with high penetration in LV
network) - Undervoltage (e.g. large DER after OLTC/VR) - increased switching operation of OLTC/VR
Short circuit DER contribution on fault level - compliance with design fault level etc
Reverse power flow – impact on: Capability of transformers, automatic voltage control systems (e.g. OLTC), voltage
regulation, voltage rise etc
Power quality Rapid voltage change, flicker, DC current injection etc
Islanding – Protection Issues relevant to personnel/consumers/facilities safety, mis-coordination among
protection equipment and reduced sensitivity operation zone
Technical Issues
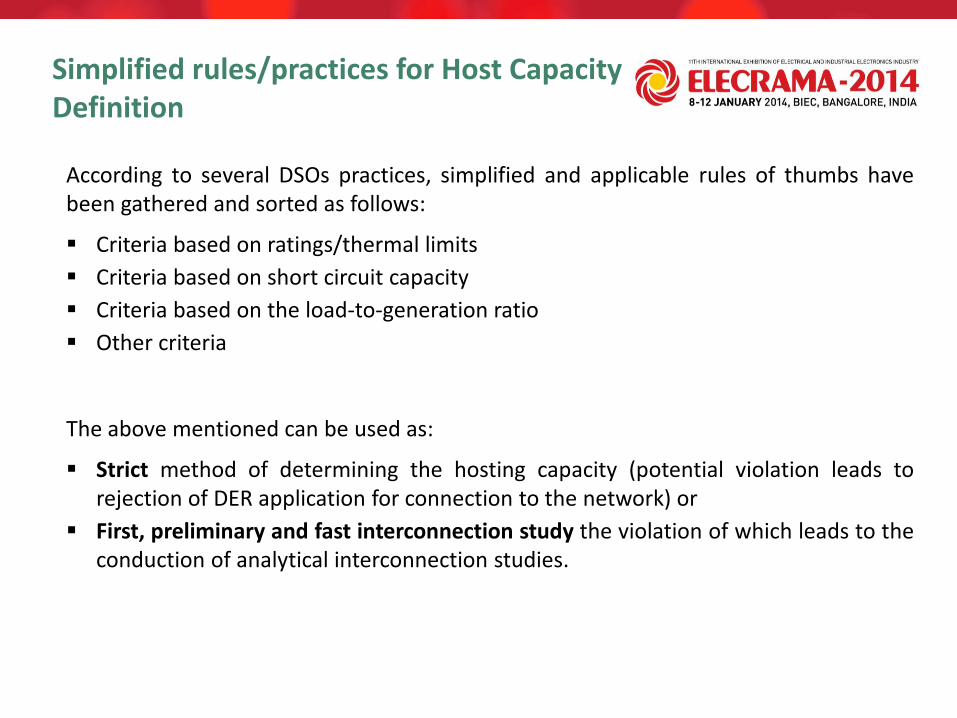
According to several DSOs practices, simplified and applicable rules of thumbs have been gathered and sorted as follows:
Criteria based on ratings/thermal limits
Criteria based on short circuit capacity
Criteria based on the load-to-generation ratio
Other criteria
The above mentioned can be used as:
Strict method of determining the hosting capacity (potential violation leads to rejection of DER application for connection to the network) or
First, preliminary and fast interconnection study the violation of which leads to the conduction of analytical interconnection studies.
Simplified rules/practices for Host Capacity Definition
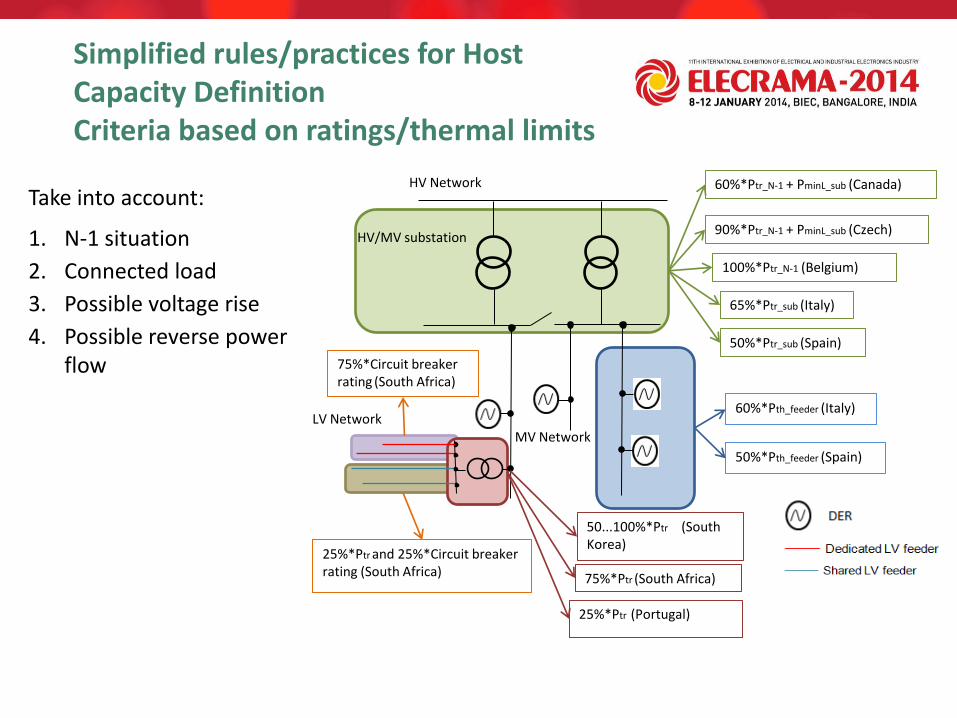
HV Network
MV Νetwork
HV/MV substation
LV Network
60%*Ptr_N-1 + PminL_sub (Canada)
90%*Ptr_N-1 + PminL_sub (Czech)
65%*Ptr_sub (Italy)
50%*Ptr_sub (Spain)
60%*Pth_feeder (Italy)
50%*Pth_feeder (Spain)
75%*Ptr (South Africa)
50...100%*Ptr (South Korea)
25%*Ptr and 25%*Circuit breaker rating (South Africa)
75%*Circuit breaker rating (South Africa)
25%*Ptr (Portugal)
100%*Ptr_N-1 (Belgium)
Take into account:
1. Ν-1 situation
2. Connected load
3. Possible voltage rise
4. Possible reverse power flow
Simplified rules/practices for Host Capacity Definition Criteria based on ratings/thermal limits
HV Network
MV Νetwork
HV/MV substation
LV network
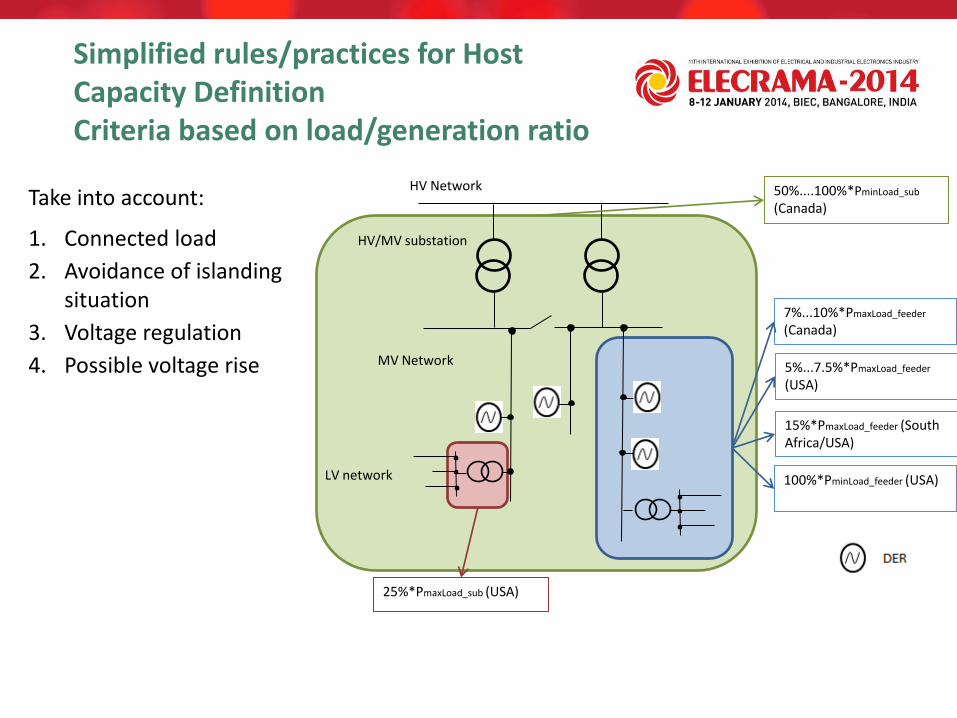
50%....100%*PminLoad_sub
(Canada)
7%...10%*PmaxLoad_feeder
(Canada)
25%*PmaxLoad_sub (USA)
15%*PmaxLoad_feeder (South Africa/USA)
100%*PminLoad_feeder (USA)
5%...7.5%*PmaxLoad_feeder
(USA)
Take into account:
1. Connected load
2. Avoidance of islanding situation
3. Voltage regulation
4. Possible voltage rise
Simplified rules/practices for Host Capacity Definition Criteria based on load/generation ratio

1. Criteria based on short circuit capacity
Compliance with design fault level (especially at the busbars of the HV/MV substations)
DER short circuit contribution to network short circuit ratio
DER nominal power to network short circuit ratio
2. Criteria based on limitations defined by TSOs
There is a well defined hosting capacity for each TS/110kV substaition (contract between TSO-DSO) (Czech)
There is a calculated hosting capacity for the local HV network (Canada)
For DER with nominal power greater than 1 MW, the TSO is informed by the DSO for evaluation of possible impacts on its network (France)
Simplified rules/practices for Host Capacity Definition Other Criteria
• The most DSOs have adopted the FERC (Federal Energy Regulatory Commission)
interconnection procedures or similar to them.
• The DSOs separate the whole interconnection evaluation procedure in the simplified (Fast Track Process) and the analytical one (Study-detailed Process)
• Flow charts (too complicated some times) are used to set criteria that are considered as a safe-side evaluation (screening criteria)
• The violation of the simplified procedure leads to the conduction of analytical interconnection studies.
Simplified rules/practices for Host Capacity Definition - USA Practices
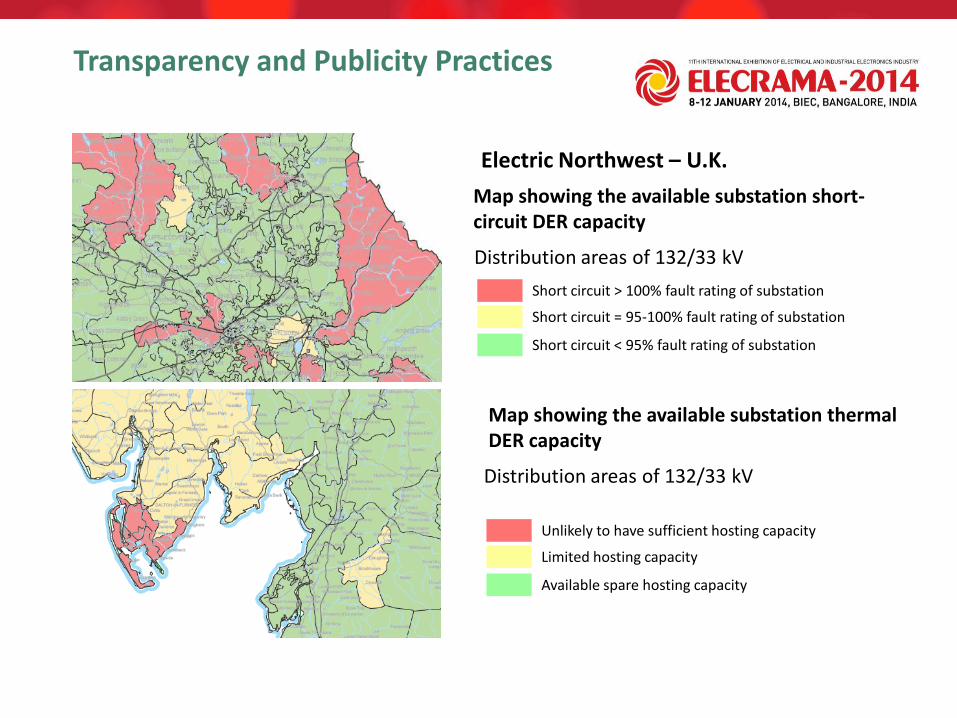
Map showing the available substation short-circuit DER capacity
Electric Northwest – U.K.
Short circuit > 100% fault rating of substation
Short circuit = 95-100% fault rating of substation
Short circuit < 95% fault rating of substation
Distribution areas of 132/33 kV
Map showing the available substation thermal DER capacity
Unlikely to have sufficient hosting capacity
Limited hosting capacity
Available spare hosting capacity
Distribution areas of 132/33 kV
Transparency and Publicity Practices
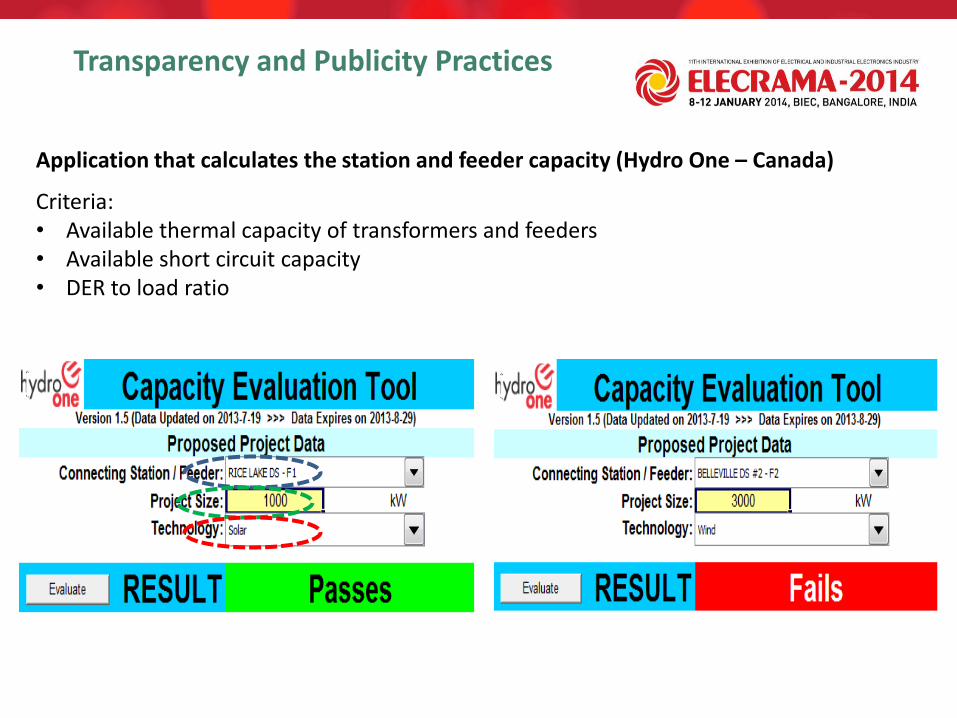
Application that calculates the station and feeder capacity (Hydro One – Canada)
Criteria: • Available thermal capacity of transformers and feeders • Available short circuit capacity • DER to load ratio
Transparency and Publicity Practices
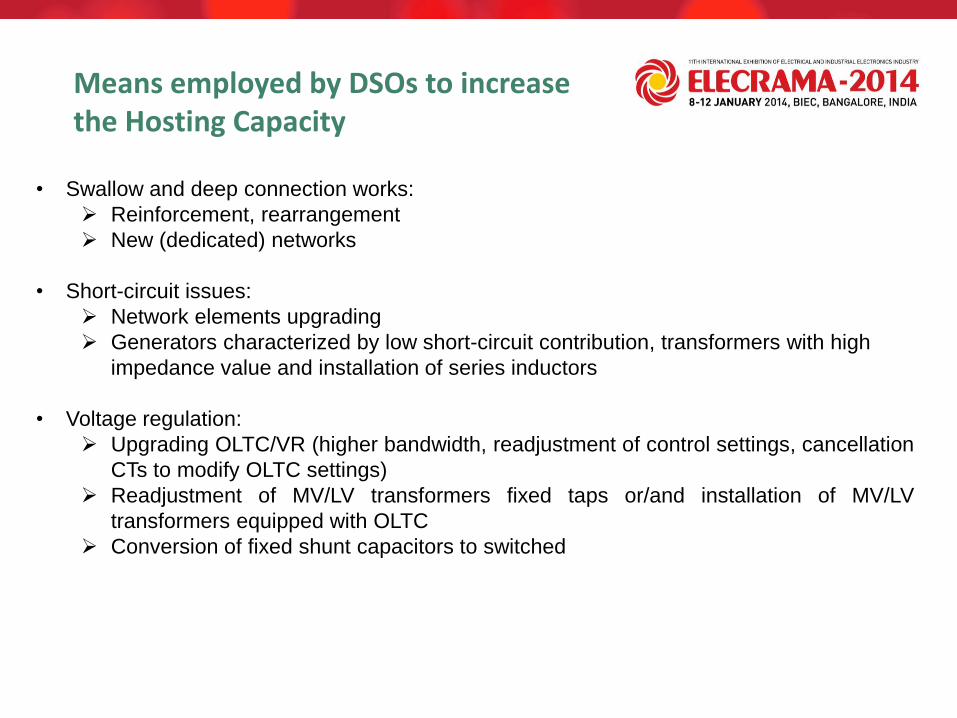
• Swallow and deep connection works:
Reinforcement, rearrangement
New (dedicated) networks
• Short-circuit issues:
Network elements upgrading
Generators characterized by low short-circuit contribution, transformers with high
impedance value and installation of series inductors
• Voltage regulation:
Upgrading OLTC/VR (higher bandwidth, readjustment of control settings, cancellation
CTs to modify OLTC settings)
Readjustment of MV/LV transformers fixed taps or/and installation of MV/LV
transformers equipped with OLTC
Conversion of fixed shunt capacitors to switched
Means employed by DSOs to increase the Hosting Capacity
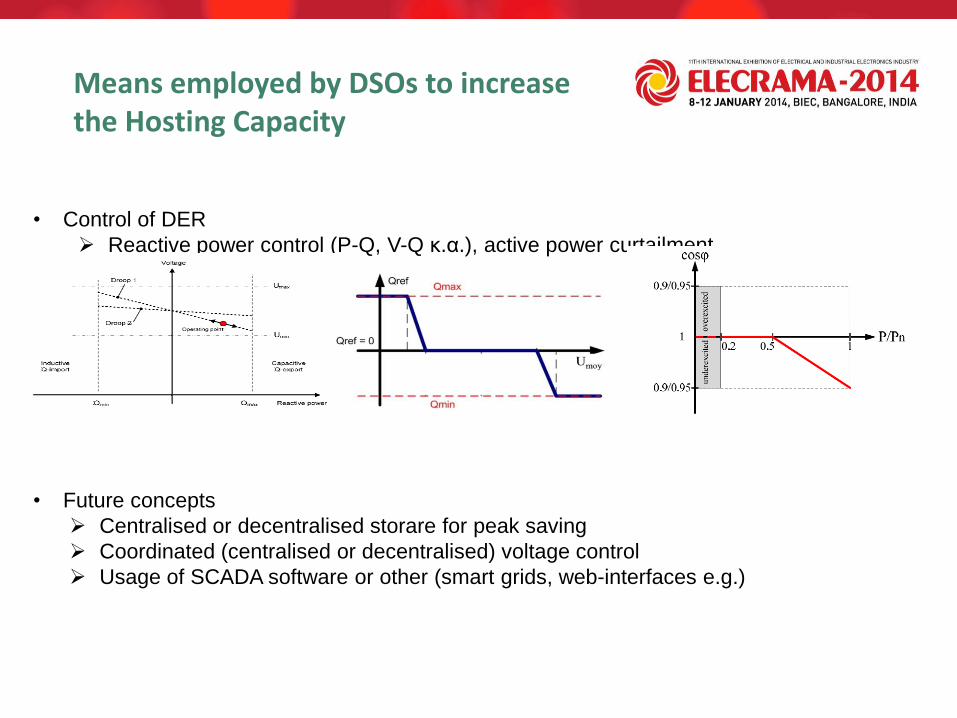
• Control of DER
Reactive power control (P-Q, V-Q κ.α.), active power curtailment
• Future concepts
Centralised or decentralised storare for peak saving
Coordinated (centralised or decentralised) voltage control
Usage of SCADA software or other (smart grids, web-interfaces e.g.)
Means employed by DSOs to increase the Hosting Capacity

Limiting factors for DER interconnection:
• Thermal ratings
• Voltage regulation
• Short circuit current
• Reverse power flow
• Power quality
Simplified rules/practices for defining Hosting Capacity:
• Criteria based on ratings/thermal limits
• Criteria based on short circuit capacity
• Criteria based on the load-to-generation ratio
• Other criteria
Transparency and publicity practices adopted by DSOs:
• Tables, geographical maps, applications (calculators)
Means available to increase DER hosting capacity:
• Reinforcement, rearrangement or even construction of new network
• Reactive and active DER power control
• Storage machines (centralised, decentralised)
• Coordinated voltage control, smart grids etc
Conclusions
New CIGRE C6 Working Groups
WG C6.27 “Asset management for distribution network with high penetration of DER”, convenor Britta Buchholz, 2012-2014 JWG C6.25/B5/CIRED “Control and Automation Systems for Electricity Distribution Networks of the Future” , convenor Giuseppe Mauri, 2012-2014 JWG B5/C6.26/CIRED “Protection of Distribution System with Distributed Energy Resources” , liaison member Birgitte Bak-Jensen, 2012-2014 JWG C4.C6.29 “Power quality and PVs” , liaison member Stavros Papathanassiou, 2013-2015 JWG C4/C6.35/CIRED “Modelling and dynamic performance of inverter based generation in power system transmission and distribution studies”, 2013-2016 WG C6.36 “The Impact of Battery Energy Storage Systems on Distribution Networks”, Convener Richard Rivas, under approval…