district 17 hunting prospects
TRANSCRIPT

2021
ANTHONY NOVACK, District Wildlife Biologist SCOTT HARRIS, Private Lands Biologist WARREN MICHAELIS, Assistant District Wildlife Biologist
DISTRICT 17 HUNTING PROSPECTS
Pacific and Grays Harbor counties

TABLE OF CONTENTS
DISTRICT 17 GENERAL OVERVIEW ................................................................................................................. 2
ELK ........................................................................................................................ Error! Bookmark not defined.
Summary ....................................................................................................................................................... 4
General Information, Management Goals, and Population Status .................................................................... 4
Which GMU Should Elk Hunters Hunt? ......................................................................................................... 5
What to Expect During the 2020 Season ......................................................................................................... 8
How To Find Elk ......................................................................................................................................... 10
Elk Areas ..................................................................................................................................................... 11
Notable Hunting Changes............................................................................................................................. 11
ELK HOOF DISEASE (Treponeme bacteria) ............................................................................................... 11
DEER .................................................................................................................................................................. 13
Summary ..................................................................................................................................................... 13
General Information, Management Goals, and Population Status .................................................................. 13
Which GMU Should Deer Hunters Hunt? ..................................................................................................... 14
What To Expect During The 2020 Season .................................................................................................... 17
How To Find and Hunt Black-Tails .............................................................................................................. 18
Notable Hunting Changes............................................................................................................................. 19
BEAR .................................................................................................................................................................. 20
General Information, Management Goals, and Population Status .................................................................. 20
What to Expect During the 2020 Season ....................................................................................................... 20
How To find Black Bear .............................................................................................................................. 21
Notable Changes .......................................................................................................................................... 22
COUGAR ............................................................................................................................................................ 23
General Information, Management Goals, and Population Status .................................................................. 23
what To Expect During The 2020 Season ..................................................................................................... 24
Notable Changes .......................................................................................................................................... 24

DUCKS ............................................................................................................................................................... 25
Common Species ......................................................................................................................................... 25
Migration Chronology .................................................................................................................................. 25
Concentration Areas ..................................................................................................................................... 25
Population Status ......................................................................................................................................... 26
Harvest Trends and 2020 Prospects .............................................................................................................. 26
Hunting Techniques ..................................................................................................................................... 26
Public Land Opportunities ............................................................................................................................ 26
GEESE ................................................................................................................................................................ 27
Common Species ......................................................................................................................................... 27
Migration Chronology and Concentration Areas ........................................................................................... 28
Population Status ......................................................................................................................................... 28
Harvest Trends and 2020 Prospects .............................................................................................................. 28
Hunting Techniques ..................................................................................................................................... 29
Special Regulations ...................................................................................................................................... 29
Public Land Opportunities ............................................................................................................................ 30
Notable Hunting Changes............................................................................................................................. 30
FOREST GROUSE .............................................................................................................................................. 30
Species and General Habitat Characteristics ................................................................................................. 30
Population Status ......................................................................................................................................... 31
Harvest Trends and 2020 Prospects .............................................................................................................. 31
Hunting Techniques and Where To Hunt ...................................................................................................... 31
PHEASANTS ...................................................................................................................................................... 32
QUAIL ................................................................................................................................................................ 32
TURKEYS ........................................................................................................................................................... 32
BAND-TAILED PIGEONS .................................................................................................................................. 33
General Description ..................................................................................................................................... 33
Population Status and Trend ......................................................................................................................... 33

Harvest Trends and 2020 Prospects .............................................................................................................. 33
Where and How To Hunt Band-Tailed Pigeons ............................................................................................. 34
Special Regulations ...................................................................................................................................... 34
Upcoming Research ..................................................................................................................................... 34
OTHER SMALL GAME SPECIES ...................................................................................................................... 35
MAJOR PUBLIC LANDS ................................................................................................................................... 35
PRIVATE INDUSTRIAL FORESTLANDS ......................................................................................................... 37
General Information ..................................................................................................................................... 37
important Notes About Access for the 2020 season ....................................................................................... 37
Basic Access Rules ...................................................................................................................................... 52
General Overview of Access Allowed by Major Timber Companies and Non-Profit organizations ................ 52
Heads Up For Archery and Muzzleloader Hunters ........................................................................................ 53
General Description of the “Dot” System...................................................................................................... 53
Contact information For Major Timber Companies ....................................................................................... 54
GENERAL OVERVIEW OF HUNTER ACCESS IN EACH GMU ...................................................................... 54
PRIVATE LANDS ACCESS PROGRAM ............................................................................................................ 58
ONLINE TOOLS AND MAPS ............................................................................................................................. 58

2 | P a g e
DISTRICT 17 GENERAL OVERVIEW
Administratively, District 17 includes all of Pacific and Grays Harbor counties and is one of four management districts (11, 15, 16, and 17) that collectively comprise the Washington Department of Fish and Wildlife’s (WDFW) Region 6 (see map). The northern portion of District 17 (north of Highway 12) includes the southwestern portion of the Olympic Mountains while the southern part of the district is situated in the Willapa Hills.
District 17 is located in southwest Washington and consists of 12 Game Management Units (GMUs): 638 (Quinault Ridge), 648 (Wynoochee), 660 (Minot Peak), 672 (Fall River), 681 (Bear River), 699 (Long Island), 618 (Matheny), 642 (Copalis), 658 (North River), 663 (Capital Peak), 673 (Williams Creek), 684 (Long Beach).
Four administrative districts and their associated GMUs within WDFW Region 6
3 | P a g e
The landscape in District 17 is dominated by intensely managed industrial forest land characterized by second and third growth forests. These lands are primarily dedicated to producing conifers such as Douglas fir, western hemlock, and occasionally cedar. A small number of stands focus production on red alder. Other habitats in the district range from sub-alpine habitat in areas adjacent to Olympic National Park to coastal wetlands along the outer coast.
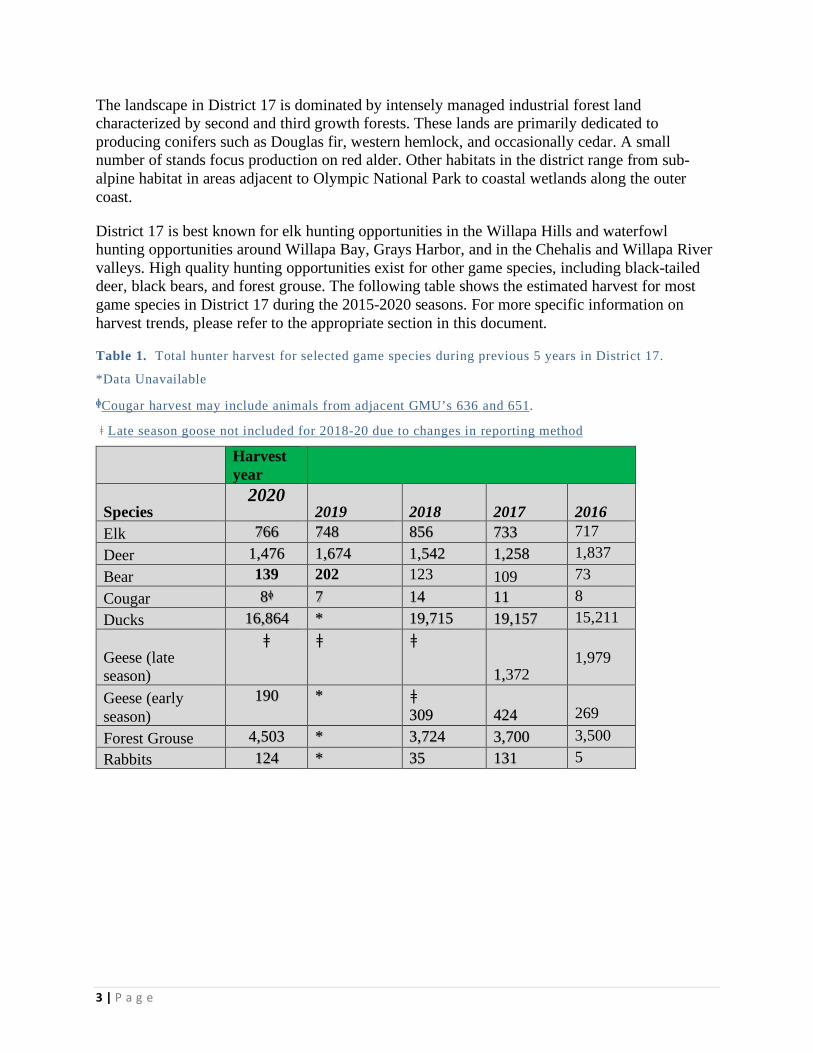
District 17 is best known for elk hunting opportunities in the Willapa Hills and waterfowl hunting opportunities around Willapa Bay, Grays Harbor, and in the Chehalis and Willapa River valleys. High quality hunting opportunities exist for other game species, including black-tailed deer, black bears, and forest grouse. The following table shows the estimated harvest for most game species in District 17 during the 2015-2020 seasons. For more specific information on harvest trends, please refer to the appropriate section in this document.
Table 1. Total hunter harvest for selected game species during previous 5 years in District 17.
*Data Unavailable
ᶲCougar harvest may include animals from adjacent GMU’s 636 and 651.
ǂ Late season goose not included for 2018-20 due to changes in reporting method
Harvest year
Species 2020
2019
2018 2017 2016 Elk 766 748 856 733 717 Deer 1,476 1,674 1,542 1,258 1,837 Bear 139 202 123 109 73 Cougar 8ᶲ 7 14 11 8 Ducks 16,864 * 19,715 19,157 15,211 Geese (late season)
ǂ ǂ ǂ
1,372
1,979
Geese (early season)
190 * ǂ 309 424
269
Forest Grouse 4,503 * 3,724 3,700 3,500 Rabbits 124 * 35 131 5

4 | P a g e
ELK
SUMMARY
Success rates: Ranges widely depending on weapon type, GMU, and land access. Recent trends: Stable harvest and hunter effort. Protracted decline in modern firearm elk hunters. GMUs with highest elk harvest in rank order: GMU 673 then 658. Followed by 660 and 681
GENERAL INFORMATION, MANAGEMENT GOALS, AND POPULATION STATUS
The subspecies of elk in District 17 are Roosevelt elk. Unlike other areas in western Washington, Rocky Mountain elk were never introduced into the area and Roosevelt-Rocky Mountain elk hybrids do not occur. The state of Washington contains 10 distinct elk herds. A portion of two elk herds occur in District 17:
• Olympic elk herd (GMUs 618, 638, 642, and 648)
• Willapa Hills elk herd (GMUs 658, 660, 663, 672, 673, 681, 684, and 699).
The quality of elk hunting in District 17 varies from marginal to excellent depending on the GMU. The greatest harvest opportunities occur in GMUs associated with the Willapa Hills elk herd area, specifically GMUs 658, 672, 673, and 681.
In Washington, elk are managed at the herd level, while harvest regulations are set at the GMU level. In general, each herd occupies several GMUs that collectively define the range of a population that minimizes interchange with adjacent elk populations.
Overall, District 17 is managed with the primary goal of promoting stable or increasing elk herds. To meet that goal, our specific objective is to maintain herds at a minimum ratio of 15 bulls to 100 cows in the pre-hunting season population and a minimum of 12 bulls to 100 cows in the post-season population. Portions of the district (such as GMU 684) must balance overall herd objectives with the equally important mission to minimize conflicts with people. Elk can cause severe impacts to crops, such as hay or cranberries.
Currently, WDFW does not use formal estimates or indices of population size to monitor elk populations across the entire district. Trends in harvest, hunter success, and harvest per unit effort are used as surrogates to formal indices or estimates. These surrogates have limitations when applied to monitoring trends in population size. Consequently, the agency developed a more detailed monitoring strategy specifically for the Willapa Hills elk herd to:
• Determine elk population trends
• Quantify cow to calf ratios
• Quantify bull to cow ratios

5 | P a g e
Due to limitations imposed by the COVID-19 epidemic, no surveys occurred in the Willapa Hills in 2021. WDFW previously conducted surveys during March of 2020 in the southern half of the Willapa Hills Elk herd area in portions of GMUs 506, 530, 673, and 681. WDFW observed 1,524 elk during the survey and the bull to cow ratios averaged 17 bulls per 100 cows. This 17:100 statistic is well above the 12 bulls per 100 cow minimum that WDFW uses to benchmark breeding success. Calf to cow ratios measured 33 calves per 100 cows. This calf ratio indicates fair elk production. Mature bulls, carrying antlers with five points or more, were uncommon.
WDFW conducted surveys during March of 2019 in the northern half of the Willapa Hills Elk herd area, specifically portions of GMUs 658, 660, 672 and 501. WDFW observed 889 elk during the 2019 survey and the bull to cow ratios averaged 23 bulls per 100 cows. This 23:100 statistic is well above the 12 bulls per 100 cow minimum that WDFW uses to benchmark breeding success. Calf to cow ratios measured 45 calves per 100 cows. This calf ratio indicates good elk production. Mature bulls, carrying antlers with five points or more, were uncommon (<10% of total). Hunters with a primary goal of finding a trophy bull are more likely to find success looking outside the Willapa Hills area and into the neighboring Olympic or St. Helens elk herds.
Both calf to cow and bull to cow ratios for the Willapa Hills herd area are robust, indicating a productive herd with decent harvest opportunities. Yearly surveys of the Willapa Hills elk herd will be conducted to sample different segments of the landscape.
All harvest data indicates that elk populations are stable or increasing in District 17. For more detailed information related to the status of Washington’s elk herds, hunters should read through the most recent version of the Game Status and Trend Report, which is available for download on the department’s website or by clicking here.
WHICH GMU SHOULD ELK HUNTERS HUNT?
Probably the most frequent question the Department gets from hunters is, “which GMU should I hunt?” . The answer depends on the hunting method and the target hunting experience. For example, GMU 699 is a small unit closed to both modern and muzzleloader hunters. Another example is that archery hunters are not allowed to harvest antlerless elk in every GMU.
Some hunters are looking for an opportunity to harvest a mature bull. Large mature bulls are found in District 17, but they are not very abundant. WDFW directs hunters seeking mature bulls to spend their efforts in either the Quinault Ridge (638) Matheny (618) or adjacent Clearwater (615) GMUs. All three GMUs are adjacent to Olympic National Park (ONP) and have the reputation of producing some very nice bulls. The best success for five-point or better bulls is garnered by the September rifle permit hunters in either the Quinault Ridge (638) or Matheny (618) GMUs.
The ideal GMU for most hunters would have high densities of elk, low hunter densities, and high hunter success rates. Unfortunately, this scenario does not readily exist in any GMU open during the general modern firearm, archery, or muzzleloader seasons in District 17. Those GMUs with the highest elk densities tend to have the highest hunter densities as well. For many hunters, high hunter densities are not enough to persuade them not to hunt in a GMU where they see lots of elk. For other hunters, they might prefer to hunt in areas with moderate to low numbers of elk if

6 | P a g e
that means there are also very few hunters. Note that many industrial timber companies have begun limiting access or charging a fee to access their land. This change has effectively, and sometimes dramatically, reduced the density of hunters on those lands.
The information provided in Tables 2, 3, and 4 provides a general assessment of how District 17 GMUs compare with regard to harvest, hunter numbers, and hunter success during general modern firearm, archery, and muzzleloader seasons. The values presented are the five-year averages for each statistic. Total harvest and hunter numbers were further summarized by the number of elk harvested and hunters per square mile.
Comparing total harvest or hunter numbers is not always a fair comparison since GMUs vary in size. For example, the average number of elk harvested in a five-year period from 2009-2013 during the general modern firearm season in GMUs 681 and 673 was 36 and 116 elk, respectively. That total harvest may seem to indicate much higher density of elk in GMU 673 compared to GMU 681. However, examining the number of elk harvested per square mile (harvested/mi²) provides an estimate of 0.436 harvested/mi2 in GMU 673 and 0.330 harvested/mi2 in GMU 681. Expressed as the number of elk harvested per mile, elk numbers are probably more similar between the two GMUs than total harvest indicates.
Each GMU was ranked from 1 to 11 for elk harvested/mi2 (bulls and cows), hunters/mi2, and hunter success rates for the 2009-2013 season. Three ranking values were summed to produce a final rank sum. GMUs are listed in order of least rank sum to largest. The modern firearm comparisons are the most straightforward because bag limits and seasons are the same in each GMU.
Archers should consider that antlerless elk seasons are not uniform across all GMUs. Antlerless elk may be harvested during the general season in six GMUs, and three GMUs are open during early and late archery seasons. These differences are important when comparing total harvest or hunter numbers among GMUs. Muzzleloader seasons are not uniform either. Some muzzleloader seasons are open during the early muzzleloader season, while others are only available during the late muzzleloader season. Hunters should keep these differences in mind when interpreting the information provided in Tables 2 through 4.

7 | P a g e
Table 2. Comparison of historic modern firearm general elk season total harvest, hunter numbers, and hunter success rates using rank sum analysis. Data presented are based on a historic five year running average (2009-2013).
MODERN FIREARM Harvest Hunter Density Hunter Success
GMU Size (mi2) Total
Harvest per mi2 Rank Hunters
Hunters per mi2 Rank Success Rank
Rank Sum
684 51 4 0.078 6 30 0.59 3 13% 2 11 681 109 36 0.330 2 240 2.20 9 15% 1 12 673 266 116 0.436 1 1011 3.80 10 11% 3 14 658 257 62 0.241 3 557 2.17 8 11% 4 15 672 257 34 0.132 4 337 1.31 7 10% 5 16 660 302 27 0.089 5 290 0.96 5 9% 7 17 638 153 10 0.065 7 111 0.73 4 10% 6 17 642 278 6 0.022 9 73 0.26 1 8% 8 18 663 210 2 0.010 10 64 0.30 2 3% 10 22 648 431 17 0.039 8 416 0.97 6 4% 9 23
Table 3. Comparison of historic muzzleloader general elk season total harvest, hunter numbers, and hunter success rates using rank sum analysis. Data presented are based on a historic five-year running average (2009-2013). GMU 684 is in bold and open during both early and late season for any elk.
* Note: Muzzleloader seasons were recently opened for the 2014 seasons in units 648, 673, 681.
MUZZLELOADER
Harvest Hunter Density Hunter Success
GMU Size (mi2) Total
Harvest per mi2 Rank Hunters
Hunters per mi2 Rank Success Rank
Rank Sum
684 51 14 0.275 1 51 1.00 7 28% 1 9 642 278 3 0.011 6 20 0.07 2 14% 2 10 672 257 9 0.035 3 97 0.38 5 9% 3 11 660 302 10 0.033 4 98 0.32 4 9% 4 12 658 257 11 0.043 2 184 0.72 6 6% 5 13 638 153 2 0.013 5 41 0.27 3 6% 6 14 663 210 1 0.005 7 13 0.06 1 2% 7 15

8 | P a g e
Table 4. Comparison of historic archery general elk season total harvest, hunter numbers, and hunter success rates using rank sum analysis. Data presented are based on an historic five year running average (2009-2013). GMU 684 is in bold and open during both early and late archery
*GMUs with 3-point minimum or antlerless harvest restrictions
ARCHERY
Harvest Hunter Density Hunter Success
GMU Size (mi2)
Total
Harvest per mi2 Rank Hunters
Hunters per mi2 Rank Success Rank
Rank Sum
658 257 16 0.062 5 111 0.43 5 15% 2 12 673* 266 79 0.297 3 488 1.83 8 16% 1 12 699* 8 11 1.375 1 78 9.75 11 14% 3 15 681* 109 53 0.486 2 377 3.46 10 14% 4 16 638 153 5 0.033 9 53 0.35 3 10% 6 18 672* 257 52 0.202 4 483 1.88 9 11% 5 18 684* 51 2 0.039 7 19 0.37 4 9% 8 19 660* 302 12 0.040 6 135 0.45 6 9% 7 19 642 278 2 0.007 10 20 0.07 1 9% 9 20 663 210 1 0.005 11 27 0.13 2 4% 11 24 648 431 16 0.037 8 283 0.66 7 6% 10 25
WHAT TO EXPECT DURING THE 2021 SEASON
Elk populations do not vary much from year to year, especially in District 17, which lacks the severe winter weather conditions that might result in a winter die-off. Consequently, the number of elk available for harvest is expected to be similar in size to the 2021 season. Elk harvest appeared to be higher in 2018 compared to prior years so, a slight decline in elk harvest for 2019 was not unexpected. Hunter numbers do not typically change much from one year to the next, but recent actions by private timber companies to charge for access have reduced hunter numbers in those areas affected.
Weather can be dramatically different from year to year and has the potential to influence harvest rates. As an example, 2012 was a hot and dry summer by western Washington standards, which produced extreme fire danger warnings and caused many timber companies to close their lands to public access during the latter part of the general early archery season and the entire early muzzleloader season. We’ve witnessed record high temperatures in early summer this year so, conditions could result in extreme fire dangers in Fall of 2021. Since WDFW is not able to predict long-term weather events, the best predictor of future harvest during general seasons is recent trends in harvest, hunter numbers, and hunter success.
Below (Figures 1-6) are detailed charts on historic elk harvest for District 17. These figures are intended to provide hunters with the following information to make an informed decision on where to hunt.
A. Historic harvest data for the Willapa Hills and Olympic Elk Herd Areas. B. Hunter participation and success rates for the Willapa Hills and Olympic elk herds.
C. Hunter success rates for Willapa Hills and Olympic elk herds.

9 | P a g e
Figure 1. District 17 Willapa Hills Herd area (GMUs 658-699) elk harvest totals. Total bull (blue) and antlerless (green) elk harvested during general modern firearm, archery, and muzzleloader elk seasons combined, 2001–2020. Harvest totals do not include tribal harvest.
Figure 2. Olympic herd area (GMUs 618, 638, 642, 648), 2001-2020 total elk harvest. *Note: Only includes elk harvest totals for GMUs inside District 17. Total bull (blue) and antlerless (green) elk harvested during general modern firearm, archery, and muzzleloader elk seasons combined, 2001–2020. Totals do not include tribal harvest.
0
100
200
300
400
500
600
700
800
# of
elk
har
vest
ed
Year
Antlerless Bull Total
0
20
40
60
80
100
120
140
# of
elk
har
vest
ed
Year
Antlerless Bull Total
GMU 684

10 | P a g e
HOW TO FIND ELK Like most places, when hunting elk in District 17, hunters need to do homework and spend time scouting before the season opens. Predicting where elk are located is especially difficult after hunting pressure increases. The majority of hunters spend their time focused on clear cuts. Elk often forage in clear cuts and are highly visible when they do. Those highly visible elk often attract other hunters. Consequently, clear cuts can get crowded in a hurry. Many elk (especially bulls) will infrequently visit clear cuts during daylight hours. Instead, they may spend most of their day in closed canopy forests, swamps, or regeneration stands.
Corey Bronckhorst with elk taken from GMU 673 during the 2016 archery season.
Some generalities can be made about the landscape that will increase the odds of locating elk. When going to a new area, hunters are encouraged to cover as much ground as possible. Note areas where you see signs along roads and landings. Landings are often ungraveled, making it easy to see fresh tracks. Scouting will reveal which areas hold elk and where to focus more intensive efforts.
After identifying areas with abundant signs of elk, hunters should focus on areas that provide cover and are adjacent to clear cuts. During early seasons, when it is warm, these cover areas often include swamps, creek bottoms, river bottoms, or any place near water. Once the season progresses and temperatures cool, elk are less attracted to water, and locating them becomes more difficult. Hunting pressure also can force elk to use areas that provide thicker cover or are more inaccessible to hunters because of topography.
Later in the season, consult a topographic map and find benches located in steep terrain with thick cover. Elk often use these benches to bed down during the day. Finally, don’t let a locked gate (provided that non-motorized access is allowed) keep you from going into an area to search for elk. Frequently, these areas hold elk that have not received much hunting pressure, making them less skittish and easier to hunt. A popular approach to hunting behind gates is to use mountain bikes with trailers. Biking on timber company lands is facilitated by high densities of maintained gravel roads.

11 | P a g e
ELK AREAS There are two Elk Areas in District 17: Elk Area 6010 (Mallis or Raymond) and Elk Area 6064 (Quinault Valley). Nearly all permit opportunities in District 17 are antlerless elk hunts and are associated with these Elk Areas. Elk Area 6010 was established in a location with chronic elk damage problems, and its primary purpose is to provide antlerless harvest opportunities that help control the growth rate of herds in localized agricultural areas.
Elk Area 6064 was established to resolve problems landowners had with elk hunters. Special restrictions apply in each Elk Area. In Elk Area 6064, only Master Hunters are allowed to hunt elk during general modern firearm, archery, and muzzleloader seasons.
The purpose of Elk Area 6010 is to alleviate elk damage on private agricultural lands. Elk Area 6010 also contains tracts of public or private timber company lands where elk are not problematic. Hunters that draw a permit in either Elk Area are encouraged to call the Private Lands Biologist (Scott Harris) in the Region 6 Office (360-249-4628 ext.234). Mr. Harris may be able to put you in contact with a landowner currently having problems with elk.
NOTABLE HUNTING CHANGES Several private timber companies in District 17 charge a fee to access areas previously open to the public. Property ownership changes irregularly. Hunters should contact landowners in areas they intend to hunt and determine the company’s current policy. See private lands access section for more information.
ELK HOOF DISEASE (TREPONEME BACTERIA)
Since 2008, reports of elk with deformed, broken, or missing hooves have increased dramatically in southwest Washington, with sporadic observations in other areas west of the Cascade Range, including within the Olympic and Willapa Elk herd areas. While elk are susceptible to many conditions which result in limping or hoof deformities, the prevalence and severity of this new affliction suggested something altogether different. WDFW diagnostic research (2009 – 2014), in conjunction with a panel of scientific advisors, found that these hoof abnormalities were strongly associated with treponeme bacteria, known to cause a hoof disease of cattle, sheep, and goats called digital dermatitis. Although digital dermatitis has affected the livestock industry for decades, Treponeme-Associated Hoof Disease (TAHD) is the first known instance of digital dermatitis in a wild ungulate. The disease is currently concentrated in southwestern Washington where prevalence is highest in Cowlitz, Wahkiakum, and western Lewis County. The disease is also present at lower prevalence in elk herds that are distant and discrete from the core affected area.
Hoof disease is found throughout District 17 in both the Olympic and Willapa Hills elk herd areas. TAHD appears to be more prevalent among elk in the Willapa Herd area and southern end of the Olympic Peninsula.

12 | P a g e
While many questions remain about the disease, several aspects of TAHD in elk are clear:
• Vulnerability: The disease appears to be highly infectious among elk, but there is no evidence that it affects humans. TAHD can affect any hoof in any elk, young or old, male or female.
• Hooves only: Tests show the disease is limited to animals’ hooves and does not affect their meat or organs. If the meat looks normal and if hunters harvest, process and cook it practicing good hygiene, it is probably safe to eat.
• No treatment: There is no vaccine to prevent the disease, nor are there any proven options for treating it in the field. Similar diseases in livestock are treated by cleaning and bandaging their hooves and giving them foot baths, but that is not a realistic option for free-ranging elk.
How hunters can help:
In 2021, WDFW is implementing an incentive-based pilot program to encourage west-side (400, 500, 600 series GMUs) hunters to harvest limping elk, potentially reducing prevalence of the disease over time. The objective of this program is to increase the proportion of limping elk in the total harvest, rather than increase elk harvest overall. General season or permit hunters can choose to participate in the program by submitting elk hooves at one of the many collection sites in western Washington. Hunters that submit hooves with signs of TAHD (for example, abnormal hooves) will be automatically entered into a drawing for a special incentive permit for the following license year. Multiple bull permits in western Washington with season dates of Sep. 1 – Dec 31 will be awarded. Additionally, all participants will receive a custom, waterproof license holder.
• Harvest a limping elk from any 400, 500, 600 series GMUs
• Turn in your elk hooves along with complete registration forms at one of several collection sites in western Washington
• Report elk: Hunters can help WDFW track TAHD by reporting observations of both affected and unaffected elk on the department’s online reporting form.
• Clean shoes and tires: Anyone who hikes or drives off-road in a known affected area can help minimize the risk of spreading the disease to new areas by removing all mud from their shoes and tires before leaving the area.
WDFW is working with scientists, veterinarians, outdoor organizations, tribal governments and others to better understand and manage TAHD. For more information about TAHD, see WDFW’s website at https://wdfw.wa.gov/conservation/health/hoof_disease/. Additional information on TAHD and this incentive program can also be found on page 65 of the Big Game Hunting Pamphlet.

13 | P a g e
DEER
SUMMARY
Success rates: Depends on weapon type and GMU hunted. For the entire district, hunter success generally ranges from 15-20%. Recent trends: Observable increase in harvest last year compared to the year prior.
GMUs with highest harvest: 660, 663, 672, 648
GENERAL INFORMATION, MANAGEMENT GOALS, AND POPULATION STATUS Columbian black-tailed deer (black-tails or black-tailed deer) are the only species of deer in District 17. Deer hunting opportunities in District 17 range from marginal to very good. The best opportunities to harvest a black-tailed deer in District 17 occur in GMUs 663, 648, 672, and 660.
In Washington, black-tail harvest regulations are set at the GMU level. All areas of District 17 are managed with the primary goal of promoting stable or increasing deer populations while minimizing conflicts with people. Management objectives include maintaining deer populations to have a minimum of 15 bucks per 100 does in the post-hunting season population.
WDFW does not attempt to survey deer populations to estimate their total numbers in District 17. Trends in harvest, hunter success, and harvest per unit effort are used as surrogates to a formal estimate of population size. WDFW recognizes the limitations of using harvest data to monitor trends in population size, and the agency is currently evaluating new approaches to monitor black-tailed deer populations.
Finding an effective way to monitor black-tailed deer populations has been an ongoing management challenge. Black-tailed deer are secretive and use densely vegetated habitats. Their ability to remain unseen substantially lowers the probability of detection through aerial surveys. Aerial surveys have been attempted, but very few deer were seen during those surveys. The small number of deer observed results in insufficient sample sizes to monitor population trends or demographics (buck:doe and fawn:doe ratios).
Overall deer harvest declined from an estimated 1,837 deer in 2016 to 1,258 in 2017 then, rose again to 1542 in 2018 and 1,674 in 2019. Last year’s harvest was 1,476 deer. Long-term trends in harvest data seemed to indicate stable deer populations. The seemingly steep decline from 2016 to 2017 is surprising and without an obvious biological cause. For more detailed information on the status of black-tailed deer in Washington, hunters should read through the most recent version of the Game Status and Trends Report. This report is available for download on the Department’s website or by clicking here.
Clint Bryson with black-tailed deer taken during modern firearm season of 2016 in GMU 648

14 | P a g e
ANTLER POINTS AND AGE
Prior to mandatory reporting in 2001, WDFW conducted field checks stations to gather information of age structure. Hunters have frequently asked if there is a correlation between age and antler points. During the fall of 1979, tooth samples were collected from bucks harvested in western Washington and sent in for cementum annuli aging. Of the total of 36 buck deer tooth samples collected 25 (69%) were spikes and two points. The remaining bucks sampled were at least three points or better (31%), with four of the three points being 2.5 years old at time of harvest.
A more accurate assessment of the age of buck deer harvested in Western Washington has occurred recently. WDFW collected hundreds of tooth samples from successful black-tailed deer hunters during the 2019 and 2020 season. Reported number of antler points was submitted with each tooth and samples were sent to a laboratory for analysis of cementum annuli to determine age. A table of the results is plotted below. Generally, the number of antler points increases with age. However, a 3-year-old buck may still be a spike and, an 11-year-old buck could be a 2 pt. while, conversely, a yearling could have 4 points.
Max Antler Points (1 side)
Average Age – Rounded to nearest ½ year
Total # of Submissions
1 (Spike) 1 Year 65 2 3 Years 120 3 4 Years 97 4 4 ½ Years 65 5 5 Years 30 6 6 Years 4
Figure #3 – Average age of black-tailed bucks harvested in Washington state in comparison to the highest number of reported antler points
WHICH GMU SHOULD DEER HUNTERS HUNT?
“What GMU should I hunt?” is one of the most frequent questions asked of WDFW. Answering that question is not always easy. The best answer depends on the hunting method and the target hunting experience. Some hunters are looking for the best chance to harvest a large, mature buck, while others want to harvest any legal deer or simply be in an area with few hunters.
The ideal GMU for most hunters would have:
• High numbers of deer
• Low numbers of hunters
• High hunter success rates
15 | P a g e
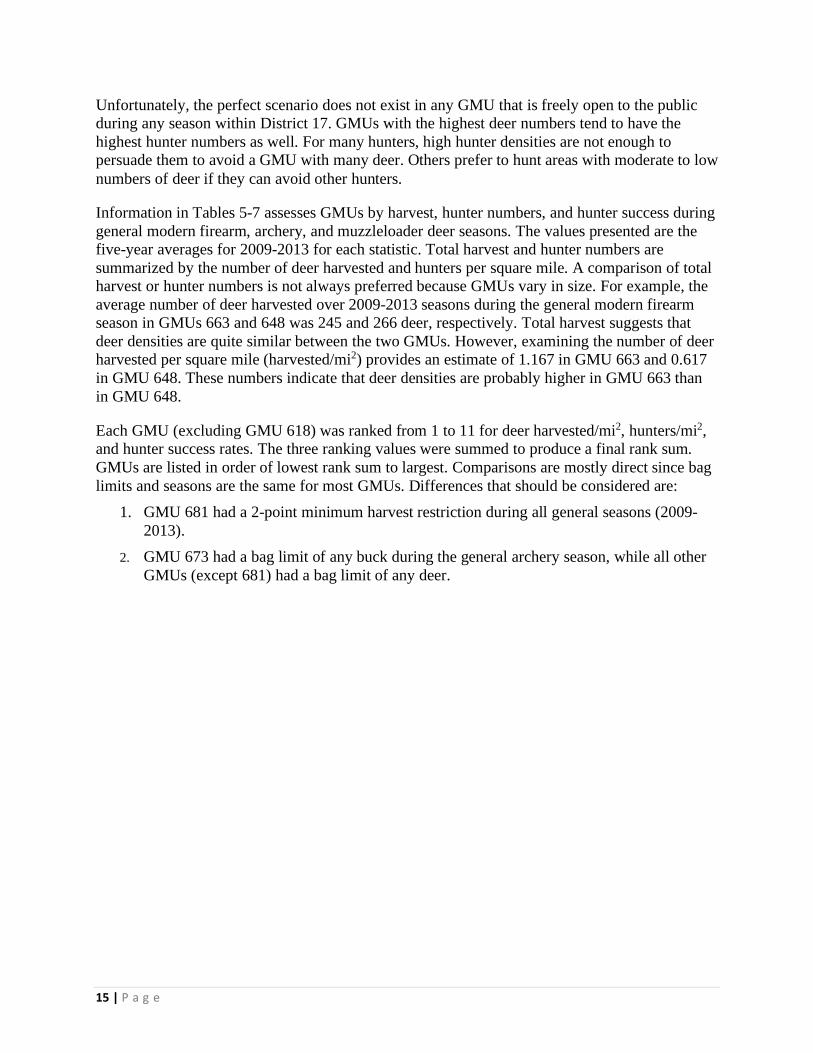
Unfortunately, the perfect scenario does not exist in any GMU that is freely open to the public during any season within District 17. GMUs with the highest deer numbers tend to have the highest hunter numbers as well. For many hunters, high hunter densities are not enough to persuade them to avoid a GMU with many deer. Others prefer to hunt areas with moderate to low numbers of deer if they can avoid other hunters.
Information in Tables 5-7 assesses GMUs by harvest, hunter numbers, and hunter success during general modern firearm, archery, and muzzleloader deer seasons. The values presented are the five-year averages for 2009-2013 for each statistic. Total harvest and hunter numbers are summarized by the number of deer harvested and hunters per square mile. A comparison of total harvest or hunter numbers is not always preferred because GMUs vary in size. For example, the average number of deer harvested over 2009-2013 seasons during the general modern firearm season in GMUs 663 and 648 was 245 and 266 deer, respectively. Total harvest suggests that deer densities are quite similar between the two GMUs. However, examining the number of deer harvested per square mile (harvested/mi2) provides an estimate of 1.167 in GMU 663 and 0.617 in GMU 648. These numbers indicate that deer densities are probably higher in GMU 663 than in GMU 648.
Each GMU (excluding GMU 618) was ranked from 1 to 11 for deer harvested/mi2, hunters/mi2, and hunter success rates. The three ranking values were summed to produce a final rank sum. GMUs are listed in order of lowest rank sum to largest. Comparisons are mostly direct since bag limits and seasons are the same for most GMUs. Differences that should be considered are:
1. GMU 681 had a 2-point minimum harvest restriction during all general seasons (2009-2013).
2. GMU 673 had a bag limit of any buck during the general archery season, while all other GMUs (except 681) had a bag limit of any deer.

16 | P a g e
Table 5. Comparison of historic modern firearm general deer season total harvest, hunter numbers, and hunter success rates using rank sum analysis. Data presented are based on a five-year running average (2009-2013).
MODERN FIREARM Harvest Hunter Density Hunter Success
GMU Size (mi2) Total
Harvest per mi2 Rank Hunters
Hunters per mi2 Rank Success Rank
Rank Sum
684 51 19 0.373 7 56 1.10 3 34% 1 11 642 278 68 0.245 8 276 0.99 2 25% 2 12 660 302 158 0.523 4 746 2.47 6 21% 4 14 672 257 155 0.603 3 715 2.78 8 22% 3 14 673 266 123 0.462 5 579 2.18 5 21% 5 15 663 210 245 1.167 1 1321 6.29 10 19% 6 17 648 431 266 0.617 2 1426 3.31 9 19% 7 18 638 153 13 0.085 10 97 0.63 1 14% 10 21 658 257 116 0.451 6 710 2.76 7 16% 8 21 681 109 25 0.229 9 168 1.54 4 15% 9 22
Table 6. Comparison of historic muzzleloader general deer season total harvest, hunter numbers, and hunter success rates using rank sum analysis. Data presented are based on a five-year running average (2009-2013).
MUZZLELOADER Harvest Hunter Density Hunter Success
GMU Size (mi2) Total
Harvest per mi2 Rank Hunters
Hunters per mi2 Rank Success Rank
Rank Sum
673 266 41 0.154 1 123 0.46 8 34% 1 10 648 431 4 0.009 6 20 0.05 3 23% 2 11 663 210 8 0.038 3 48 0.23 7 15% 3 13 672 257 3 0.012 5 40 0.16 5 7% 5 15 684 51 3 0.059 2 26 0.51 9 12% 4 15 642 278 1 0.004 8 7 0.03 1 6% 7 16 658 257 4 0.016 4 58 0.23 6 6% 6 16 660 302 2 0.007 7 29 0.10 4 5% 8 19 638 153 0 0.000 9 6 0.04 2 0% 9 20
17 | P a g e
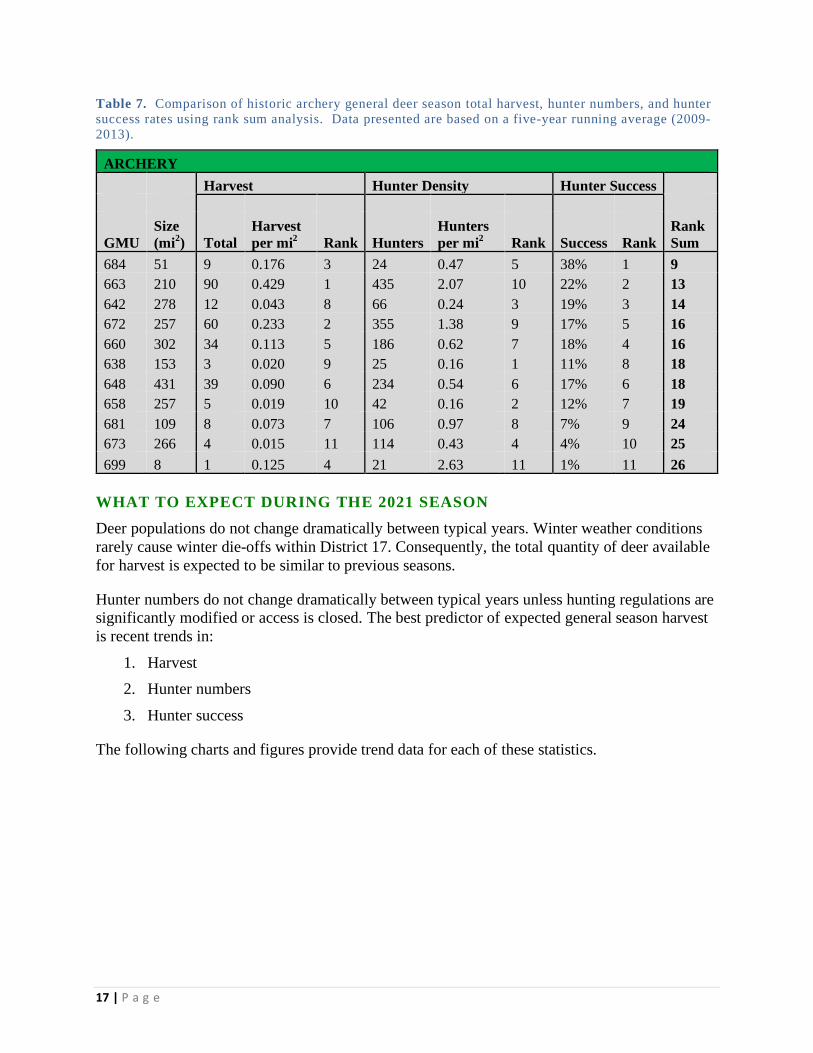
Table 7. Comparison of historic archery general deer season total harvest, hunter numbers, and hunter success rates using rank sum analysis. Data presented are based on a five-year running average (2009-2013).
ARCHERY Harvest Hunter Density Hunter Success
GMU Size (mi2) Total
Harvest per mi2 Rank Hunters
Hunters per mi2 Rank Success Rank
Rank Sum
684 51 9 0.176 3 24 0.47 5 38% 1 9 663 210 90 0.429 1 435 2.07 10 22% 2 13 642 278 12 0.043 8 66 0.24 3 19% 3 14 672 257 60 0.233 2 355 1.38 9 17% 5 16 660 302 34 0.113 5 186 0.62 7 18% 4 16 638 153 3 0.020 9 25 0.16 1 11% 8 18 648 431 39 0.090 6 234 0.54 6 17% 6 18 658 257 5 0.019 10 42 0.16 2 12% 7 19 681 109 8 0.073 7 106 0.97 8 7% 9 24 673 266 4 0.015 11 114 0.43 4 4% 10 25 699 8 1 0.125 4 21 2.63 11 1% 11 26
WHAT TO EXPECT DURING THE 2021 SEASON Deer populations do not change dramatically between typical years. Winter weather conditions rarely cause winter die-offs within District 17. Consequently, the total quantity of deer available for harvest is expected to be similar to previous seasons.
Hunter numbers do not change dramatically between typical years unless hunting regulations are significantly modified or access is closed. The best predictor of expected general season harvest is recent trends in:
1. Harvest 2. Hunter numbers
3. Hunter success
The following charts and figures provide trend data for each of these statistics.

18 | P a g e
Figure 4. District 17 deer harvest totals. Total buck (blue) and antlerless (green) deer harvested during general modern firearm, archery, and muzzleloader elk seasons combined, 2001–2020. Harvest totals does not include tribal harvest.
HOW TO FIND AND HUNT BLACK TAILS The key to harvesting a black-tailed deer in District 17 is scouting. Black tails are present throughout the district and in nearly every habitat type. Deer numbers differ among habitat types and the highest deer densities are associated with 3- to 9-year-old clear cuts. These young tree stands provide large amounts of both cover and food.
Many hunters will focus efforts on new clear cuts. Deer in a clear cut are much more visible than most other habitats. However, deer know they are exposed and typically visit the clear cuts at night, early dawn, and dusk. Hunters should also explore areas adjacent to these openings.
0
500
1000
1500
2000
2500
3000#
of d
eer h
arve
sted
Year
Antlerless Buck Total

19 | P a g e
Those areas with cover are more likely to contain deer for the majority of the day. Large amounts of deer sign in an area indicate deer are in close vicinity. Consider that over the past several years, deer in Capitol Forest (GMU 663) were fitted with GPS collars as part of a larger study throughout western Washington conducted by WDFW. The goal of this study was to better understand the effects timber management practices have on deer survival and productivity. These GPS collars automatically upload the deer’s location via satellite several times a day. The data gives biologists a detailed look at black-tailed deer movements and habitat use.
None of the deer monitored in WDFW’s doe study used an area larger than 0.38 mi2 (243 acres). The average home range size was 0.14 mi2 (86 acres). Some deer used an area no bigger than 45 acres in size during an entire year. If a hunter sees signs of deer in an area, but no deer, they need to be patient or change their approach.
The traditional approaches to hunting black-tailed deer include still-hunting or sitting patiently in high use areas (clear cuts, highly traveled trails, or funnels) until the deer appears. A less well-known, or less-utilized, technique is rattling and grunting to simulate two bucks fighting over a doe. The rattling technique is more common with mid-west and eastern white-tailed deer hunters but can be effective on black-tailed deer as well. A quick internet search on the technique yields plenty of evidence to illustrate its effectiveness when conditions are right.
Buck movements tend to increase during the rut and, they are less wary than during other parts of the year. The last week of October and first week of November seem to be those periods of time when male deer are most susceptible to harvest. Starting in 2017, WDFW initiated a buck mortality study which will pinpoint the activity periods and survival rates for male black-tail deer in Western Washington. If you harvest a buck with a collar attached to its neck, please call WDFW or return the collar to one of our regional offices.
NOTABLE HUNTING CHANGES Several private timber companies in District 17 are going to fee access programs in areas where they historically offered free access. Typically, these companies will post signs at primary roadways but, hunters should be aware of changes. Everyone is advised to contact landowners in areas where they hunt to determine the individual company’s current policy regarding land access. See the private lands access section for more information.
Dana Morgan with spike deer taken during the late firearm season in GMU 663
20 | P a g e
BEAR
GENERAL INFORMATION, MANAGEMENT GOALS, AND POPULATION STATUS Black bears are present throughout District 17. Bear numbers vary among GMUs and the harvest can change noticeably from year to year. The best places to harvest bears usually occurs in GMUs 648, 660 and 663. Other GMUs worth mentioning are 618, 638, 658, 660, 672, and 681.
Bear seasons are primarily designed to maintain stable black bear populations. Spring seasons are directed to areas where black bear cause measurable damage to young commercial timber stands or other sites of human-bear conflict. The existing bear populations are not expected to have much impact on big game herds. Three statistics used to assess black bear harvest are:
• Proportion of females harvested
• Median age of harvested females
• Median age of harvested males
WDFW initiated surveys in 2019 to estimate bear density in portions of Region 6. The initial study area was located in the Fall River GMU (672). The resulting estimates are expected to help the agency formulate management objectives and understand the relationship between the number of bears in the area with the habitat characteristics and annual harvest rates. For Fall River, the bear density was estimated at just under 8 bears per 100 square kilometers of bear habitat in the summer of 2019.
WHAT TO EXPECT DURING THE 2021 SEASON Most bears are probably harvested opportunistically during general deer and elk seasons. Overall hunter success is low, but annual harvest can vary widely from year to year and 2019 and 2020 had some of the highest harvest rates for the past 10 years. Depending on the GMU hunted, between 4 and 15 percent of bear hunters in District 17 were successful in 2019. Since 2001, overall hunter success for this district has typically ranged from 4 percent to 8 percent. District-wide, bear hunter success in 2019 was 11%. Hunter success rates are likely higher for those that specifically hunt bears compared to hunters that take bear incidentally during deer or elk season.
Annual bear harvest in District 17 increased from 2002 to 2008. Harvest declined sharply during the 2009 season but rebounded in 2010. Bear harvest has since remained generally stable to increasing, although 2014 was a low year and 2019 was a high year.

21 | P a g e
Figure 5. Trends in the number of male and female black bears and total number of bears harvested during the general bear season in District 17, 2001–2020. Harvest estimates include bears harvested during spring permit seasons. Totals do not include bears removed because of conflicts with people or timber damage. The sex of harvested bears was not available for 2011.
More bears are typically harvested during the general season in GMUs 648 than any other GMU. GMU’s 642, 658, 660, 663, 673, and 681 are also regular producers of bears during the general and spring permit hunting seasons. Overall bear harvest in 2019 and 2020 were above the five-year average.
HOW TO FIND BLACK BEAR Black bears are common and occur at high densities in some locales. However, bears in District 17 are seen infrequently because of thick vegetation dominating the landscape. Consequently, scouting is extremely important when hunting for black bears.
Black bears occupy a variety of habitat types, and it can be difficult to narrow down where to find them. Because bears have an incredible sense of smell, hunters should focus on open terrain. When out in the open, a bear can be seen from a distance without alerting it. In dense cover, a bear is likely to smell a hunter before being seen and move to avoid an encounter. Bears are often located in clear cuts containing a large number of berry-producing shrubs. Examples include:
• Elderberries
• Salmonberries
• Huckleberries
• Blackberries
• Salal berries
020406080
100120140160180200
2001 2002 2003 2004 2005 2006 2007 2008 2009 2010 2011 2012 2013 2014 2015 2016 2017 2018 2019 2020
Males Females Total

22 | P a g e
During the fall, hunters should seek clear cuts with these types of shrubs and search for bear sign. Fresh signs indicate a bear is visiting that stand. Patient hunters who watch these areas for extended periods of time can increase their chances of harvesting a bear.
NOTABLE CHANGES
Bear Season starts August 1st across all parts of the state
Bear Photo from GMU 672 survey site

23 | P a g e
COUGAR
GENERAL INFORMATION, MANAGEMENT GOALS, AND POPULATION STATUS
Cougars occur throughout District 17, but densities vary among GMUs. Cougar populations in District 17 are managed primarily to maintain a stable cougar population. Beginning in 2012, WDFW changed the system for managing cougar harvest in Washington. WDFW shifted away from using season length or permit seasons to manage the number of cougars harvested, and implemented a standard season coupled with harvest guidelines. The intended goal was to allow a longer season without weapon restrictions. Cougar seasons will close for a specific area once harvest reached or exceeded a harvest guideline.
To accomplish harvest goals, WDFW established a series of hunt areas with standard season dates of September 1 through April 30. Harvest numbers are examined starting January 1. Any hunt area that meets or exceeds the harvest guideline may be closed. Anyone planning to hunt cougar after January 1 should take a moment to confirm the cougar season is still open. Harvest guidelines for each hunt area located in District 17 are provided in Table 8.
Starting in 2019, WDFW convened an internal group to assess the results of implementing the harvest guideline hunting structure.
Table 8. Harvest guidelines and 2016-21 cougar harvest for hunt areas located in District 17.
Hunt Area Harvest Guideline
2020-21 Harvest
2019-20 Harvest
2018-19 Harvest
2017-18 Harvest
2016-17 Harvest
618, 636, 638 4-5 adults 1 0 1 4 1
642, 648, 651 6-8 adults 5 4 10 8 5
658, 660, 663, 672, 673, 681, 684, 699
8-11 adults
3
3
3
7
3

24 | P a g e
WHAT TO EXPECT DURING THE 2021 SEASON
Cougar harvest in District 17 is highly variable. The variability may be due to the prohibition on hound hunting and trapping. Most cougars are taken opportunistically by deer and elk hunters. Since 2001, the average number of cougars harvested in District 17 is six animals. Young animals are overrepresented in the harvest. Most cougar harvest in District 17 has occurred in GMU 642, 648, and 651
NOTABLE CHANGES
Subadults will no longer count towards the cougar harvest guideline. Please remember that the season ends April 30, unless closed early. A 2022 tag and license are required after March 31, 2022.

25 | P a g e
DUCKS
COMMON SPECIES
A wide variety of ducks occur in District 17. Common dabbling ducks include northern pintail, American wigeon, mallard, green-wing teal, and northern shoveler. Species of divers, including bufflehead, scaup, and common goldeneye are present, but occur in low numbers. Nesting wood ducks can be located in the Chehalis River Valley early in the season and provide a unique hunting opportunity. Sea ducks, including scoters and long-tailed ducks, are seen occasionally in Willapa Bay and Grays Harbor.
Mallards are the most abundant species of duck in Washington. Consequently, mallards constitute the majority of ducks harvested statewide (typically ≥ 50 percent). In contrast, American wigeon are the most abundant species of duck in District 17. During recent aerial survey flights of Willapa Bay, American wigeon typically comprised 50 percent to 60 percent of the ducks observed. Hunters should expect to primarily harvest American wigeon, northern pintail, and mallard. Green-winged teal are abundant early in the season but decrease in numbers as the season progresses.
MIGRATION CHRONOLOGY Very few ducks are found during late spring and early summer. Beginning in mid to late September, birds within the Pacific Flyway will migrate south from Alaska. (Note - Banded ducks marked from the Central Flyway have been harvested along coastal Washington, indicating that some movement between flyways does exist). Duck numbers will continue to increase until peaking in late October and early November. The migrating ducks are believed to concentrate in District 17 as resting areas. They do not appear to remain in the district for long periods of time. Consequently, the number of ducks located inside District 17 likely varies on a daily basis. Total duck numbers decline precipitously once the flow of migrants from Alaska has stopped. By Christmas, duck numbers are typically 5% of what they were at the end of October. Unlike eastern Washington, major weather events do not alter migration chronology in coastal Washington. Regardless of weather events, duck numbers decline at about the same point in time each year.
CONCENTRATION AREAS
In general, waterfowl concentrations occur in Willapa Bay, Grays Harbor, and the Chehalis and Willapa River valleys. The exact locations where duck concentrations occur depends on many factors (hunting pressure, weather, food, etc.) that can change daily.

26 | P a g e
Waterfowl concentrations shift around the bay each winter. Small, forested wetlands also provide areas where migratory ducks may congregate. In the river valleys after large soaking precipitation events, dabbling ducks can be found in areas where sheet water has accumulated. The number of ducks that can use these small bodies of water can be surprisingly high. Hunters should scout a few days before hunting to locate where concentrations of ducks are currently located and/or where sheet water is likely to occur.
POPULATION STATUS Pacific Flyway waterfowl populations have remained strong for several years, allowing liberal seasons for many species. Breeding duck populations in western Washington were not monitored until 2010, when WDFW developed and began flying established transects in five select areas of western Washington. Surveys are flown during April and early May. One of the selected areas occurs in District 17 and is associated with the Chehalis River Valley.
Surveys did not occur in 2020-21 due to impacts of the coronavirus. In 2019, the breeding population in the Chehalis River Valley was estimated at 4,130 ducks which, is lower than the 6,841 estimated in 2018. Mallard numbers during the spring breeding flights remained the same and American wigeon numbers decreased for the second year.
HARVEST TRENDS AND 2021 PROSPECTS Breeding duck numbers in Alaska are the biggest factor affecting duck hunters in Washington. Unfortunately, surveys were canceled due to impacts from the coronavirus. Historic harvest can provide insight into probable hunting opportunity. Overall, harvest trends since 2016 have been rising slightly and are more similar to the average total number of ducks harvested since 2010. For instance, the 2016 season was noteworthy for having low numbers of ducks in October. Harvest, especially for Grays Harbor, again ticked up in 2018 compared to the 2016 season. Last year, 2020, was an average year for duck hunter harvest.
HUNTING TECHNIQUES Duck hunting techniques should vary depending on where you choose to hunt. Traditional setups work best when hunting inland waters around ponds, rivers, or feeding areas. Birds are most active in early morning and late afternoon, as they move between resting sites and feeding areas.
The tides influence hunting the coastline of Willapa Bay or Grays Harbor. Regardless of the time of day, ducks along the coastline tend to move very little at either low or high tide. Hunters can expect very little movement during tidal extremes. However, bird activity and opportunities increase when the tide is going out or coming in. A perfectly timed tide can provide success to coastline hunters at 3 p.m., unlike traditional waterfowl hunting areas that are typically limited to early morning and late afternoon. For more information, see Let’s Go Waterfowl Hunting.
PUBLIC LAND OPPORTUNITIES
There are a number of WDFW Wildlife Areas in District 17 that offer good waterfowl hunting opportunities. The following map is intended to provide hunters with the general location of these wildlife areas, but hunters should visit the WDFW waterfowl hunting page (click here) or the Go Hunt application for more detailed information.

27 | P a g e
The website includes waterfowl information related to location, current waterfowl management activities, and common species. Other public land opportunities occur on the Willapa National Wildlife Refuge. For more information about hunting on the Willapa National Wildlife Refuge, please visit their website or click here.
Figure 7: WDFW lands and waterfowl hunting areas within western portion of District 17.
GEESE
COMMON SPECIES
The sub-species of Canada geese found in District 17 include western, dusky, lesser, taverner, Aleutian, Vancouver, and cackler. Large numbers of black brant can be found in Willapa Bay beginning in late January and early February. Occasional flocks of snow geese and white-fronted geese occur infrequently.

28 | P a g e
MIGRATION CHRONOLOGY AND CONCENTRATION AREAS The timing of migration for geese in District 17 is nearly identical to that described for ducks. Few geese reside locally in the district. Starting in September, waves of migrant geese begin showing up from Alaska. One distinct difference between ducks and geese is that goose numbers do not decline in late November as sharply as duck numbers. Many geese choose to stay the winter in the agricultural areas of District 17 where they find food. Brant is distinct from the other species of geese and, are mostly found in Willapa Bay starting in the latter half of December or early January.
Most geese aggregate in areas of agricultural lands around the Willapa and Chehalis River Valleys. Some properties routinely have geese on them. Generally, the specific fields where geese concentrate changes on a weekly basis. The Chehalis and Willapa River Valleys are not expansive, so relocating geese is not difficult. In contrast to other geese, Brant will be almost exclusively located in close vicinity to areas where eel grass is found.
POPULATION STATUS
Very few geese breed in District 17. Consequently, WDFW does not survey for breeding geese within the district. Long term goose nest surveys have occurred elsewhere in Washington. Portions of the lower Columbia River have small but relatively stable breeding populations.
Wintering populations of geese are hard to survey effectively because geese forage widely in agricultural areas that make them difficult to locate. The number of geese observed in Washington during the midwinter-waterfowl surveys has been relatively stable since the early 2000s.
HARVEST TRENDS AND 2021 PROSPECTS
Historically, most goose harvest has occurred in Grays Harbor County during the regular season. A decline in the goose harvest for Grays Harbor County may partially be attributed to its inclusion into Goose Area 2 (see charts) in 2015. Pacific County goose hunters have long been required to obtain southwest goose authorizations, and the number of Pacific County hunters has not changed significantly. The Department expects that the number of Grays Harbor County goose hunters will gradually increase as hunters obtain their southwest goose authorization.
Given the current trends in goose populations farther north, the goose hunting opportunities in District 17 are expected to remain consistent. Pacific populations of large geese appear to be greater than last year. Hunters can expect to harvest an average of one or two geese per day.
WDFW former district biologist Hoenes with a resident dusky goose fitted with VHF transmitter on Willapa National Wildlife Refuge

29 | P a g e
.
HUNTING TECHNIQUES
Goose hunting is almost standardized. Goose hunters find agricultural areas where geese feed and set up well before daylight in portions of the field where geese are known to concentrate. In District 17, feeding geese tend to congregate in pastures containing cattle operations. Most goose hunting opportunities occur on private property. Hunters must obtain permission before hunting private lands.
During the early September goose hunting season, noticeable concentrations of western Canada geese have been observed in and around Grays Harbor and Willapa Bay. These areas tend to congregate molting geese earlier in the season and those recently molted birds seem to continue to use those areas throughout the early season. Recent goose surveys conducted in August 2019 around Baker Bay, near the town of Chinook, documented a large numbers of geese. Many of the areas where geese are found require boat access but, favorable goose hunting can occur near shore using traditional methods.
Inclement weather may force local and migratory geese further upland and into river valleys than during more mild weather. This tends to occur more frequently during the regular goose season that starts in October. High easterly winds may force the birds to land in fields where they become less exposed to the wind but are more vulnerable to hunters.
SPECIAL REGULATIONS Both Pacific and Grays Harbor counties are contained within Goose Management Area (GMA) 2. Special regulations apply in GMA 2 to prevent harvest of dusky Canada geese. These special regulations include:
1. Hunters must possess a valid migratory bird hunting authorization for Goose Management Area 2 to hunt geese, except during the September goose season.
0
1000
2000
3000
4000
5000
6000
7000
2006 2007 2008 2009 2010 2011 2012 2013 2014 2015 2016 2017 2018
Regular Season Goose Harvest
Pacific Grays Harbor Total
*

30 | P a g e
2. February and March seasons are closed on WDFW Wildlife Areas and USFWS Wildlife Refuges.
3. Hours are 30 minutes after the start of official waterfowl hunting hours to 30 minutes before the end of official waterfowl hunting hours. If a hunter takes a dusky Canada goose, the authorization will be invalidated and the hunter will not be able to hunt geese in Goose Management Area 2 for the rest of the season, including the special late goose season.
4. Beginning in 2018, a Mandatory Harvest Report Card was issued for hunters to record the number and species composition of their daily bag. Hunters are required to report their harvest onto this report card as soon as practical, after harvesting a goose.
WDFW strongly recommends that hunters review the most recent Washington State Migratory Waterfowl and Upland Game Season pamphlet to ensure they are in compliance with current regulations. Pamphlets are available at any retailer that sells hunting licenses or online on WDFW’s website (click here).
PUBLIC LAND OPPORTUNITIES Many wildlife areas in District 17 provide a chance to hunt geese. Check the earlier map or visit http://wdfw.wa.gov/hunting/waterfowl/waterfowl_hunting_on_wdfw_wildlife_areas.pdf for more details. Additionally, some landowners have enrolled in WDFW’s Private Lands Access Program. Those lands provide additional hunting opportunities for the public. See the private lands section for more details or visit the Hunt Planner Webmap at https://geodataservices.wdfw.wa.gov/huntregs/
NOTABLE HUNTING CHANGES
None for 2021.
FOREST GROUSE
SPECIES AND GENERAL HABITAT CHARACTERISTICS
There are two species of grouse in District 17, ruffed grouse and blue grouse (sooty). Ruffed grouse are the most abundant and occur at lower elevations and valley bottoms. Throughout the west, ruffed grouse typically prefer habitats that support abundant deciduous shrubs or small trees, particularly along stream corridors and other riparian areas. These thick, somewhat impenetrable habitats provide protective cover for ruffed grouse. West of the Cascade Range stands of red alder can provide suitable habitat conditions for ruffed grouse. Blue grouse can be found in higher elevation habitats, but overlap does occur. Blue grouse are usually found in the uplands at elevations above 2,500 feet and may exceed 6,000 feet. Across Oregon and Washington, blue grouse prefer coniferous forests dominated by Douglas fir and true fir. At higher elevations, birds are primarily found in western and mountain hemlock, lodgepole pine, and white bark pine. The Ruffed Grouse Society has developed an interactive map for blue and ruffed grouse habitat on national forest land. Note – the map only assesses a small portion of land in District 17 that belongs to the US Forest Service. State and private lands are not portrayed. The map is only a guide to habitat and may not accurately predict where grouse can be found.

31 | P a g e
POPULATION STATUS WDFW no longer conducts surveys to monitor grouse populations in District 17. Currently, the agency uses harvest data trends as surrogates to formal population estimates or indices of population size. Total harvest numbers tend to vary with hunter numbers (see Figure 17), so catch per unit effort, or “grouse per hunter day,” is the best indicator of population trend. In District 17, grouse harvest per hunter day has ranged from 0.12 to .0.38 birds per hunter day. The 2018 rate was 0.20 birds per hunter day, slightly higher than the 0.12 birds per hunter day in 2017.
To obtain better information on grouse population status and demographics, WDFW conducted a pilot effort in 2016 to collect grouse wings and tails from harvested birds in portions of Grays Harbor County. Results from the 2018 season are listed below (Table #9 ). This collection effort is expected to continue in 2021 with collection barrels located at strategic locations in the district.
Table 9. The number, sex, age, and species type of forest grouse harvested in Grays Harbor County during the 2018 hunting season, September 1 – December 1.
Species Female Male Unknown Sex
Juvenile Yearling Adult Breeding Age* Total collected
Ruffed 1 3 8 8 0 0 4 24
Blue 25 19 0 31 2 9 2 88
Totals 26 22 8 39 2 9 6 112
*Breeding Age denotes birds with molt patterns that showed they were of breeding age but that could not be distinguished as yearling vs adult.
The goal of collecting grouse wing and tails is to monitor species, sex and age ratios in the harvested population as indices of production and composition. If possible, please contribute to these collections. Location of wing collection barrels is located on the WDFW webpage.
HARVEST TRENDS AND 2021 PROSPECTS
The total number of grouse harvested in District 17 has gradually been declining since 2008 Most grouse are taken from Grays Harbor County and the number of blue grouse harvested in 2018 is generally higher. This higher take of blue grouse may be related to the amount of higher accessible terrain in Grays Harbor County which tends to be more characteristic of blue grouse habitat and has a significant amount of USFS lands.
HUNTING TECHNIQUES AND WHERE TO HUNT
A generally effective way to hunt grouse is by walking roads and shooting birds as they flush, or after they roost in a nearby tree. Grouse are present in higher densities along roads with little traffic. Consequently, hunters should target roads behind locked gates or that have been

32 | P a g e
decommissioned. To learn more about hunting grouse, please visit WDFW’s upland bird hunting webpage or click here.
NOTABLE HUNTING CHANGES
Forest grouse season starts two weeks later than previous years. The season runs from Sept. 15, 2021 - Jan. 15, 2022 to protect brood hens with chicks.
PHEASANTS
All pheasant hunting opportunities in District 17 are provided by the Western Washington Pheasant Release Program. District 17 does not have self-sustaining populations of pheasant. The primary intent of the release program is to provide an upland bird hunting opportunity and to encourage participation from young and older-aged hunters. Each year, 30,000 to 40,000 pheasants are released at 25 sites. Two of those release sites (Chehalis River and Chinook) are in District 17. The Chinook Release Site is located in Pacific County and the Chehalis River Release Site is located in Grays Harbor County. To locate maps for the Chehalis River and Chinook release sites and learn more about the Western Washington Pheasant Release Program, click here.
In a typical year, around 1,000 pheasants were released from the Chinook site and at Brady. A special youth hunt will occur in September as well as a distinct senior hunt (age 65 and older). Pheasant releases end on December 15th. Hunters should be aware that special regulations apply on western Washington pheasant release sites. Notably:
• Hunters must purchase a western Washington pheasant license
• Non-toxic shot is required
• Hunting hours are between 8 a.m. and 4 p.m.
For further information about Pheasant hunting in Washington, please visit our website at: Pheasant hunting | Washington Department of Fish & Wildlife.
QUAIL
Mountain quail rarely occur in District 17. This district does not contain any sizable population, and sightings are rare. The few sightings that occur are usually located in five to 10-year-old clear cuts with abundant shrub cover and pine saplings. Some sightings occur in brushy cover located adjacent to agricultural land. In 2020, very few quail were reportedly harvested from in Grays Harbor County, and none came out of Pacific County.
TURKEYS
There are no sizable turkey populations in District 17. Generally, less than 30 turkeys will reportedly be harvested for all of southwest Washington during any given year. The only area previously known to hold any number of birds in District 17 was in the Willapa River Valley on Department of Natural Resources land in the southern part of GMU 672. All other flocks that have been reported to occur in District 17 are small (<15 birds), occur on private agricultural

33 | P a g e
lands, and are thought to be pen-raised birds released by adjacent landowners who no longer wanted to take care of them.
Most turkeys that had been found in District 17 were eastern wild turkeys. Approximately 400 eastern wild turkeys were introduced into southwest Washington from 1987-2000. Introduction was discontinued because turkey populations did not grow or expand, and habitat suitability models indicated southwest Washington habitats were not likely to support viable turkey populations.
BAND-TAILED PIGEONS
GENERAL DESCRIPTION Band-tailed pigeons are the largest species of pigeon in North America. They inhabit mountainous forests in the western United States, with large coastal populations occurring from British Columbia south to northern California. During the breeding season (April to September), band-tailed pigeons are primarily found below 1,000 feet elevation. In autumn, they feed mainly on berries, nuts, grains, acorns, and fruits.
POPULATION STATUS AND TREND WDFW monitors band-tailed pigeon populations using a standardized population index survey. These surveys occur at 16 mineral sites where band-tails are known to congregate. Since WDFW initiated the standardized mineral site survey, the population index indicates band-tail populations have fluctuated through the years but have never declined to levels that would warrant more limited harvest opportunities.
HARVEST TRENDS AND 2021 PROSPECTS Band-tailed pigeon harvest in District 17 once measured thousands of birds. Bag limits were 10 birds per day until 1950, when statewide harvest was estimated at 90,000 birds. However, overharvest and habitat changes caused significant decline in overall numbers. Harvest in District 17 has previously accounted for 30 percent of the statewide harvest. Annual harvest in Grays Harbor County had averaged 80 birds for the decade following 2002, which was the highest average annual harvest among the 19 counties where band-tails are harvested. The maximum total harvest for District 17 since hunting resumed in 2002 was 265 birds. The total statewide harvest has never exceeded 2,100 birds.

34 | P a g e
WHERE AND HOW TO HUNT BAND-TAILED PIGEONS Band-tailed pigeons frequently congregate in areas with red elderberry and cascara. These small trees are most abundant in five to 10-year-old clear cuts where hunting can be exceptionally good. The key to harvesting band-tails is scouting. Identifying specific clear cuts used by band-tails is hard to predict. Hunters need to locate feeding, roosting, and watering sites. Upon finding a good site, sit patiently and wait for pass shooting opportunities to occur.
Band-tails often congregate at seeps and mineral sites. They show strong site fidelity to these locations and often return to the same seeps year after year. WDFW conducts annual surveys at such mineral sites to assess changes to the band-tailed population. These mineral sites are not abundant and are hard to find. If a hunter is lucky enough to locate a mineral site where band-tails congregate, it is likely to be a successful season.
Only one mineral site was known to exist within District 17 prior to 2021. Please contact WDFW if you know the location of any sites where band-tailed pigeons obtain minerals in Pacific or Grays Harbor counties.
SPECIAL REGULATIONS Since band-tail seasons were re-opened in 2002, hunters are required to purchase a migratory bird authorization. Harvest must be submitted using harvest cards submitted to WDFW after the season has closed. These regulations will apply in 2021 as well. Hunters should review the 2021 Migratory Waterfowl & Upland Game Seasons pamphlet to confirm season dates and any other regulation changes.
RESEARCH Starting in May 2021, WDFW initiated a project to capture and fit band-tailed pigeons with satellite telemetry devices in portions of District 16 and 17. A total of eleven birds were fitted with transmitters that are programmed to obtain multiple locations throughout the day and periodically upload those locations via the cell tower network.
The goal of this project is to conduct research on Band-Tailed Pigeons in areas without identified mineral sites that could allow WDFW to fulfill the following objectives: 1) Identify new mineral sites to allow the agency to more accurately index our statewide population via Mineral site surveys 2) more expertly manage our BTP harvest seasons to potentially allow an expanded hunting opportunity, 3) provide detailed information on resource selection to inform how to manage habitat that would increase the statewide population.
Already in 2021, this research project has led to the discovery of a new mineral site location in Grays Harbor county. Hunters and members of the general public are funding this research via the migratory bird stamp and artwork program. The existing project is expected to continue through the year 2025 across various districts within Region 6.

35 | P a g e
OTHER SMALL GAME SPECIES
Other small game species and furbearers that occur in District 17, but were not covered in detail include cottontail rabbits, snowshoe hares, coyotes, beaver, raccoons, river otter, marten, mink, muskrat, and weasels. Additional migratory birds include snipe and coot.
Photo of coyote taken by Bob Ehlers during the 2015 season in GMU 648.
MAJOR PUBLIC LANDS
District 17 is not well known for its large amount of public land opportunities. However, public land opportunities do exist on lands administered by the U.S. Fish and Wildlife Service (USFWS), Department of Natural Resources (DNR), U.S. Forest Service (USFS), WDFW, and Grays Harbor County.
GMUs with the greatest amount of public land include 618, 638 and 663. Large tracts of DNR lands also occur in GMUs 660, 672, and 673. The USFWS Willapa National Wildlife Refuge occurs in portions of GMUs 681 and 684. GMU 699 is what its name implies, an island, and the entire GMU is part of the Willapa National Wildlife Refuge.
The majority of all other public land opportunities in District 17 occur primarily on WDFW wildlife areas or on lands managed by Pacific and Grays Harbor counties. For more information related to the location of WDFW wildlife areas, visit WDFW’s hunting access website. For more information on resources available to locate public lands please see the Online Tools and Maps section below.

36 | P a g e
Figure 12: Location of public lands open to public access within each GMU of District 17.

37 | P a g e
PRIVATE INDUSTRIAL FORESTLANDS
GENERAL INFORMATION
The vast majority of hunting opportunities, especially for big game and upland birds, occur on private industrial forestlands. Timber companies that own large tracts of land and are the most well-known include Rayonier, Weyerhaeuser, Hancock, Green Diamond, and Campbell Global. However, hunters should be aware that there are many other smaller timber companies with operations in District 17.
WDFW recognizes that some great hunting opportunities occur on private industrial forestlands and works cooperatively with private timber companies to maintain reasonable public access during established hunting seasons. Private industrial forestlands have always been open for public access, but hunters should always remember they are being granted access to private property and access to that property is a privilege.
There has been an increasing trend of timber companies restricting public access and shifting towards a permit system to limit the number of hunters that hunt on their lands. One of the primary reasons for access restrictions and the loss of access is hunter disrespect of the landowner rules. When hunting on private industrial forest lands, WDFW reminds hunters to remember the following:
HUNTING ON PRIVATE LANDS IS A PRIVILEGE, SO TREAT THEM WITH RESPECT Obey Posted Signs
Leave Gates As You Found Them Pack Out Your Trash
Be Courteous
IMPORTANT NOTES ABOUT ACCESS FOR THE 2021 SEASON
There are a variety of fee access programs in place, and they vary by area and by company. However, all current programs at the time of this writing fall into three general categories, which include Permit-Unlimited, Permit-Limited, and Leases. These fees will also apply to all other outdoor recreational activities, including hiking, camping, mountain biking, and fishing. General descriptions of these three programs are as follows:
Permit-Unlimited: Hunters will be required to purchase an access permit, but there will be an unlimited number of permits available. Only holders of a valid permit will be allowed to recreate in areas associated with the permit.
Permit-Limited: There will be a set number of permits available on a first come, first served basis. Only people who have secured one of the limited permits will be allowed to recreate in areas associated with that permit. Permit cost is anticipated to be several hundred dollars. This type of system was implemented by Weyerhaeuser in their Pe Ell Unit (GMUs 672 and 506) during the 2013 season.

50 | P a g e
Leases: Designated tracts of land are leased to an individual, or groups of individuals, and only the lessee and their families are allowed to access that particular track of land. The cost of a lease can be several thousand dollars.
Hunters need to be aware that many timber companies are charging these access fees in areas where they have historically offered free access. Consequently, it is very important that hunters take the time to contact landowners in areas where they plan to hunt so they know whether or not the company’s access policy for that area has changed.
The following map represents areas in District 17 where WDFW knows timber companies will be requiring a fee to recreate on their property. However, the broad implementation of access programs by several timber companies since the 2013 season has been a very dynamic process that always seems to be changing. It is important to highlight that the map represents what has been presented to WDFW as of Aug. 4, 2017. It is very possible that some of the areas presented as free access (green) could become fee access (red) areas by the time hunting seasons begin on Sept. 1. Thus, hunters should use this map as a general reference and should understand it is ultimately their responsibility to contact the appropriate timber company to determine how hunter access will be managed in the areas they plan to hunt.

50 | P a g e
Private timber company ownership in District 17, including free access (dark green) and permit and fee required (red) lands. The map represents data available on Aug. 4, 2017, and may change at any time.

50 | P a g e
BASIC ACCESS RULES Specific rules related to hunter access on private industrial forestlands vary by company. WDFW encourages hunters to make sure they are aware of the rules in areas they plan to hunt. Most timber companies provide these rules on signs at access points (gates) or their website, if they use for public communication, or will provide them to hunters who call to inquire about access (see below for contact information). However, hunters are encouraged to follow these basic rules if they find themselves in an area, they are not familiar with and are in doubt about specific landowner criteria. The following are intended to be general guidelines of the basic access rules that are commonplace on many private industrial forestlands. Timber companies may have more or less restrictive rules in place and it is ultimately the responsibility of hunters to make sure they are familiar with those rules. Respect the landowner and other users.
Read and obey all posted signs. A logging road without a sign does not mean it is open for public access.
Drive slow with headlights turned on when driving on roads opened to public access. Avoid areas of active logging. No camping, littering, ORVs, off-road driving, target shooting, or forest product
removals.
An open gate does not mean the road is open to public motorized access. Gate closures apply to all motorized vehicles including motorcycles and quads. This
includes vehicles with electric motors that propel or assist the rider. Private forest lands are usually closed to public access during hours of darkness.
All users of private forest lands need to be aware that failure to obey landowner rules can result in prosecution for trespassing and or even a persona nongrata from the landowner.
GENERAL OVERVIEW OF ACCESS ALLOWED BY MAJOR TIMBER COMPANIES AND NON-PROFIT ORGANIZATIONS
Hancock: Hancock industrial forestlands have different levels of access based on management areas. All Hancock industrial forestlands in GMUs 658, 673, and 681 are only open to non-motorized access. During modern firearm seasons they will open some key main lines to disperse hunters and allow access to interior areas.
Rayonier: Rayonier currently has three levels of access: seasonal permit, recreational lease, and general permit access. For seasonal permit and recreational lease areas, access is only allowed for the permit and/or lease holder and is subject to access rules established by Rayonier. Areas under general permit access require the purchase of a permit from the company. District 17 GMUs with Rayonier lands include 638, 642, 648, 658, 673, and 681. Maps and other information are available on their web site.
Forest Investment Associates (FIA): FIA recently purchased large blocks (more than 30,000 acres) of Rayonier land primarily in Pacific County (GMUs 673 and 658), with some parcels in

50 | P a g e
Grays Harbor County. FIA will respect leases and permits associated with those Rayonier lands. Other FIA lands are open for hunting. AFM manages the permit system for much of the FIA holdings
Green Diamond: Green Diamond manages hunter access using the dot system and posts access rules at their gates. All of their lands in District 17 are currently open to non-motorized public access. As hunting seasons approach, they will usually begin opening additional roads to public access if fire danger is low. District 17 GMUs with Green Diamond ownership are 642, 648, 658, and 660.
Campbell Global: Campbell Global uses the dot system to manage hunter access and posts access rules at their gates. As hunting season approaches, they will normally open some roads to motorized access for the hunting seasons if fire danger is low. District 17 GMUs with Campbell Global-managed timberlands are 648, 658, 672, 673, and 681.
Weyerhaeuser: Weyerhaeuser currently has three levels of access in District 17: general access permit areas, enhanced permit areas, and lease areas. For permit and lease areas, access is only allowed for the permit and/or lease holder and is subject to rules established by Weyerhaeuser. District 17 GMUs with Weyerhaeuser ownership are 648, 658, 660, and 672.
The Nature Conservancy: The Nature Conservancy owns more than 6,000 acres in Pacific County, GMU 681. There is open walk-in access during most of season. Vehicles are not allowed.
HEADS UP FOR ARCHERY AND MUZZLELOADER HUNTERS
Private timber companies have traditionally opened their lands to modern firearm hunters during established seasons. Archery and muzzleloader hunters should be aware they may not have full access, particularly vehicle access. Access levels change and can vary by season, year, or landowner. Most often, access is influenced by industrial fire classification issued by DNR. Hunters are urged to respect the landowners and adhere to any access restrictions the landowners have implemented.
GENERAL DESCRIPTION OF THE “DOT” SYSTEM The dot system is used by several timber companies in District 17. Rayonier, Weyerhaeuser, Green Diamond, and Campbell Global all use this system. The dot system is a system of colored dots posted at the start of a road to indicate what level of access is allowed beyond that point. It is intended to give the public a clear understanding of what roads are open to public motorized access.
Normally under the dot system, access is granted for daylight hours only. Landowners usually understand that some hunters will go in an hour or so early to get to their hunting areas and sometimes they may come out a little late. Hunters should always stop and read signs. While several landowners use the dot system, they all have their own minor differences. In some cases, landowners will close gates in the evenings to prevent unauthorized access.
• Red Dot – no motorized access
• Yellow Dot – Motorized access on weekends only

50 | P a g e
• Green Dot – Motorized access for licensed vehicles on maintained roads
• No Dot – Some landowners use this, and it means the same as a Red Dot
CONTACT INFORMATION FOR MAJOR TIMBER COMPANIES
Some landowners have hotlines and/or websites where hunters can find information about public access. However, many of these landowners do not have staff members dedicated to answering hunter questions. Hunters are encouraged to call the WDFW Region 6 office in Montesano (360-249-4628) if they have questions related to public access on private industrial forest lands.
Timber Company GMUs
Phone Number Website
Hancock 658, 673, 681
1-360-795-3653 No website
Hancock
Various other GMUs
1-800-782-1493 https://hancockrecreationnw.com/
Rayonier Various 1-360-533-7000 http://www.rayonierhunting.com/
Green Diamond Various 1-360-426-3381 http://www.greendiamond.com/recreation/
Weyerhaeuser Various 1-800-636-6531 http://www.wyrecreationnw.com/
Forest Investment Associates 658, 673
(404) 261-9575
http://www.forestinvest.com/ or check Hunting Property for Lease | American Forest Management
Grays Harbor County
642, 648, 658
http://www.co.grays-harbor.wa.us/departments/Forestry/grays_harbor_county_-_public_vehicle_access.php
Olympic Resource Management
642, 648, 658, 673 https://www.orm.com/Timberlands/PublicUse.aspx
Lewis and Clark Timberlands 684 https://permits.greenwoodresources.com/PermitHome.aspx
GENERAL OVERVIEW OF HUNTER ACCESS IN EACH GMU
One of the most common questions we get from hunters is, “what is hunter access like in the GMU I want to hunt?”. Generally, this question is referring to the amount of motorized access and not access in general. It is important to differentiate the two because hunters enjoy a high level of access in all District 17 GMUs. However, the type of access varies between motorized and non-motorized access.
The following rating system was developed for District 17 GMUs to give hunters a general idea of what type of access is available in the GMU they are thinking of hunting. For the purposes of this exercise, access ratings are specific to the level of motorized access allowed and does not refer to the level of access in general. Several GMUs have some type of fee access areas that

50 | P a g e
grant the permit or lease holders a higher level of access. The following ratings are based on a hunter not having a lease or permit. Each GMU was given a rating of excellent, good, and poor, with the level of access associated with each rating as follows:
• Excellent – Most, if not all, of the main logging roads are open, as well as most of the spur roads.
• Good – There is a mix of open and closed roads, with some main logging roads open, but many of the spur roads are closed to motorized access.
• Poor – Most of the GMU is closed to motorized access but may be open to non-motorized access.
Information provided is a brief description of major landowners and the level of motorized access a hunter can expect. Access rules change through the seasons and vary by year. Information is updated when available. Hunters are encouraged to contact the WDFW Region 6 office in Montesano (360-249-4628) if they have questions related to hunter access that have not been answered. GMU 618 (Matheney) – Access Rating: Excellent
GMU 618 is dominated by federal lands included in the Olympic National Forest. The minority of land not managed by the USFS is under state management via the Washington Department of Natural Resources.
GMU 638 (Quinault Ridge) – Access Rating: Good
The majority of GMU 638 is associated with the Olympic National Forest and managed by USFS. There are numerous small landowners in areas outside of the national forest. Much of the more productive areas of this GMU are private lands not considered industrial forest lands. The Quinault valley is not recommended for hunters who are not familiar with landownership boundaries. Rayonier also has some signed recreational lease areas.
GMU 642 (Copalis) – Access Rating: Poor
The primary landowner in this GMU is Rayonier. They have recreational lease, seasonal permit, and general access areas in this GMU.
GMU 648 (Wynoochee) – Access Rating: Poor Overall, GMU 648 consists mostly of private industrial forestlands, but there are also several smaller landowners. Primary landowners in GMU 648 include Weyerhaeuser, Rayonier, Green Diamond, Fruit Growers, Grays Harbor County, and Campbell Global. A portion of the GMU comprises the Hoquiam and Aberdeen watersheds, which are closed to all public access. In addition, several landowners have a cooperative road management agreement with WDFW. Hunters should be advised to read and follow all posted signs. Rayonier has a few leased access areas in this GMU signed. The majority of Rayonier lands in this GMU are managed under their general access program.

50 | P a g e
GMU 658 (North River) – Access Rating: Good Primary landowners in GMU 658 are Hancock, Rayonier, Weyerhaeuser, Grays Harbor County, Campbell Global, Green Diamond, and the Department of Natural Resources (DNR). Overall, access is good, but will vary among landowners. The majority of Hancock property will be gated, but some main logging roads will be open during the general modern firearm season. DNR lands in this GMU are surrounded by private forest lands but are accessible by non-motorized access across private timberlands. Many of the landowners surrounding the public lands will open gates for reasonable access to public lands for hunting seasons once fire seasons are over. Rayonier has some recreation leases and general access areas in this GMU. Access to Weyerhaeuser lands in this GMU is restricted to permit and lease holders.
Note – WDFW recently added 1100 acres to the Elk River Unit just south of Westport and east of Twin Harbors state park. These lands are not yet included in the following map.
GMU 660 (Minot Peak) – Access Rating: Poor
The primary landowner in GMU 660 is Weyerhaeuser. All of their lands in this GMU are managed under their general access permit program. A small portion of this GMU is owned by DNR. To prevent elk from being pressured onto farms in the Chehalis Valley, motorized access is limited on DNR lands.
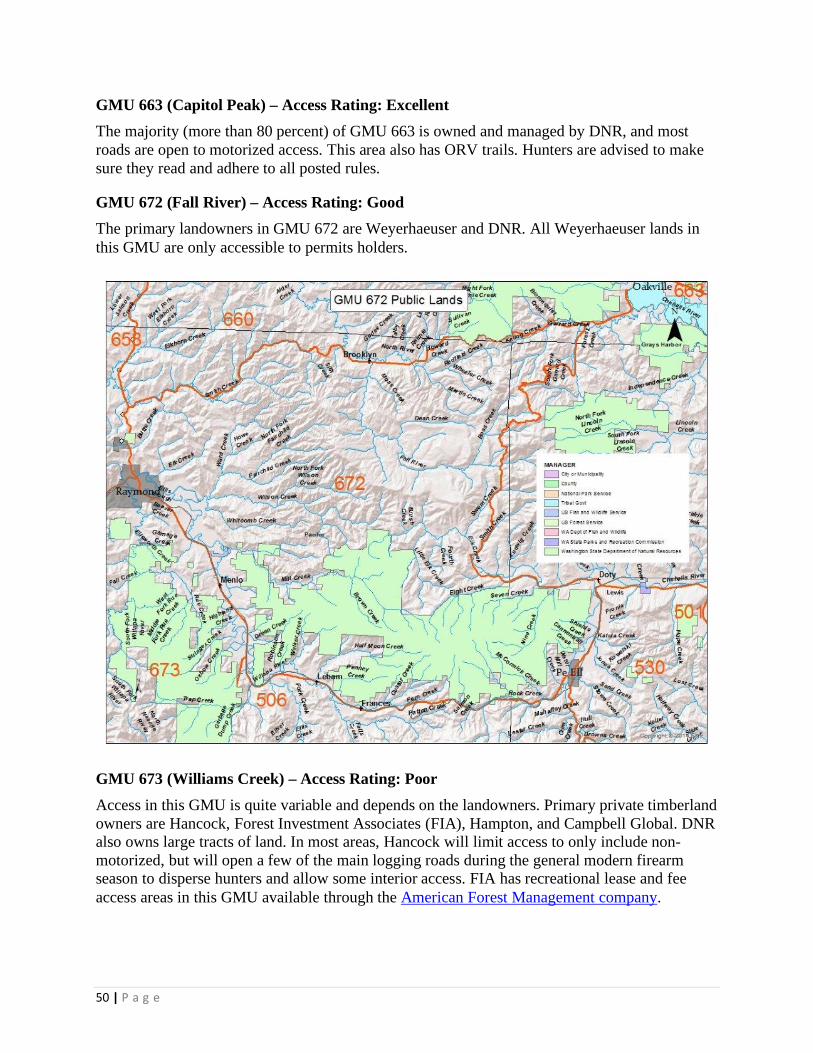
50 | P a g e
GMU 663 (Capitol Peak) – Access Rating: Excellent The majority (more than 80 percent) of GMU 663 is owned and managed by DNR, and most roads are open to motorized access. This area also has ORV trails. Hunters are advised to make sure they read and adhere to all posted rules.
GMU 672 (Fall River) – Access Rating: Good The primary landowners in GMU 672 are Weyerhaeuser and DNR. All Weyerhaeuser lands in this GMU are only accessible to permits holders.
GMU 673 (Williams Creek) – Access Rating: Poor Access in this GMU is quite variable and depends on the landowners. Primary private timberland owners are Hancock, Forest Investment Associates (FIA), Hampton, and Campbell Global. DNR also owns large tracts of land. In most areas, Hancock will limit access to only include non-motorized, but will open a few of the main logging roads during the general modern firearm season to disperse hunters and allow some interior access. FIA has recreational lease and fee access areas in this GMU available through the American Forest Management company.

50 | P a g e
GMU 681 (Bear River) – Access Rating: Good Hunters can expect a lower level of access than in the past. The dot system is used by some owners, but it is not consistent because of the checkerboard ownership. Primary private landowners are Hancock, Rayonier, Weyerhaeuser, and The Nature Conservancy. Rayonier has some leased lands in this GMU and some general permit access areas. Portions of the Willapa National Wildlife Refuge occur in GMU 681, and hunters planning to hunt on Refuge lands should contact the Refuge before doing so, as special regulations do apply in some areas. For details, click here for the website or call 360-484-3482. Nature Conservancy lands are open to hunting, but motorized access is restricted. Weyerhaeuser has recreational lease and permit access areas in this GMU.
GMU 684 (Long Beach) – Access Rating: Poor With the exception of Leadbetter Point, the majority of this GMU consists of private property. Hunters are advised to make sure they have permission to access private property before they actively hunt in GMU 684. Portions of the Willapa National Wildlife Refuge occur in GMU 684, and hunters planning to hunt on Refuge lands should contact the Refuge beforehand, as special hunting regulations apply. Click here for the website or call 360-484-3482.
Lewis and Clark Timberlands owns some property in the unit. Access is allowed via a no-cost permit. Go to https://permits.greenwoodresources.com/PermitHome.aspx for more information.
GMU 699 (Long Island) – Access Rating: Poor The entire GMU is owned and managed by the USFWS. Access is by boat only, but camping is allowed in designated areas. Hunters should contact the Willapa National Wildlife Refuge for more details. Click here for the website or call 360-484-3482.
PRIVATE LANDS ACCESS PROGRAM
There are several private landowners in District 17 enrolled in WDFW’s Private Lands Access Program. However, at the time of this writing, Cooperative Agreements with these landowners have not been finalized. The majority of landowners are expected to renew their Cooperative Agreements for the 2021 hunting season but, the department is hesitant to provide that information in this document. Hunters are encouraged to check WDFW’s Hunter Access website or call the Region 6 office in Montesano (360-249-4628), to periodically check for updated information.
ONLINE TOOLS AND MAPS
Most GMUs in District 17 are a checkerboard of ownerships which can be extremely difficult to determine who owns the land where a hunter wishes to hunt. Fortunately, there are several online tools and resources that many hunters do not know about, which provide valuable information that helps solve the landowner puzzle. The following is a list and general description of tools and resources available to the general public.

50 | P a g e
Department of Natural Resources Public Lands Quadrangle (PLQ) Maps The best source for identifying the specific location of public lands is DNR PLQ maps, which can be purchased for less than $10 on DNR’s website (click here).
Online Parcel Databases
Technology has come a long way and has made it much easier for the general public to identify tax parcel boundaries and the associated landowner. However, because this technology has not been readily available in the past, there are several hunters who are not aware it exists.
Pacific County tax parcels can be searched using Mapsifter, which is a user-friendly mapping program that allows users to zoom in to their area of interest, click on a parcel, and identify who owns that parcel. The Pacific County Mapsifter tool can be located at http://pacificwa.mapsifter.com.
Grays Harbor tax parcels can be searched on the Grays Harbor County website.
Downloadable Phone Applications are available from private industry which are very user friendly and highly functional when afield.
WDFWs “Places to go hunting” WDFW’s updated web page includes additional information on “places to go hunting. This page provides additional information on various hunting opportunities including large format printable GMU maps. https://wdfw.wa.gov/hunting/locations